Fi~al. re - COnnecting REpositories · 2012-06-25 · Janne Christensen, Nils Marstrand, F....
237
' • .._ ./ ( I .... , ..., I i ' ' ! I \ \ \ I re.port
Transcript of Fi~al. re - COnnecting REpositories · 2012-06-25 · Janne Christensen, Nils Marstrand, F....
' •
.._ XVI/2~~
./ ( I ....,
..., I i
' ' ! I \ \ \
I Fi~al. re.port

'
PROJEKTGRUPPEN ALTERNATIV LOKALISERING AF STORBYERHVERV
LARS KOLIND, PETER H. MATTHIESEN
FINAL REPORT ~[ElcQJCC~U~cQJ~ (Q)f
· [E(C(Q)~(Q)~~CC ~CCU~W~U~[E~ U~~[O)~U~(Q)~~llW l(Q)CC~U[E[O) ~~ U~[E (C(Q)[p)[E~~~(GJ[E~ ~~[E~

COMMISSION OF THE EUROPEAN COMMUNITIES
DIRECTORATE-GENERAL FOR REGIONAL POLICY
Directorate Coordination, programmes, studies and analyses- Studies Division
•
...

•
This study was undertaken at the request of the Danish Government and was carried out by the Project Group on Alternative Location of Metropolitan Trades (Projektgruppen Alternativ lokalisering af Storbyerhverv). Copenhagen. It was jointly financed by the Danish Social Research Council (Statens Samfundsvidenskabelige Forskningsrad) and the Commission of the European Communities, within the framework of Article 266 of the general budget of the Commission ("Regional studies at the request of the Member States"). Work on the study was completed in September 1978.
* * *
The present study does not necessarily reflect the views of the Commission of the European Communities on the subject matter of the study nor does it necessarily anticipate the future attitude of the Commission on the topic.


-V-
TABLE OF CONTENT
PREFACE.
Page
' 1 . INTRODUCTION 1
1 . 1 Background and problem formulation . . . . . . . . . . . . . . . . . . 1 1 . 2 Summary of the preliminary study . . . . . . . . . . . . . . . . . . . 2
1. 2.1 Purpose of the preliminary study . . . . . . . . . . . . 2 1.2.2 Empirical and methodological basis
of the preliminary study . . . . . . . . . . . . . . . . . . . . . 3 1 . 2 . 3 Res u 1 t s . . . . . . . . . . . . . . . . . . . . . . . . . . . . . . . . . . . . . . . . . 4
1.3 The regional and urban development in the 70's ··· 8 1.4 Some statistical results on the relocation
behaviour of Danish firms 1960-75 . · .. ·. · .. · · · ... · ·. 11 1. 5 Problem formulation . . . . . . . . . . . . . . . . . . . . . . . . . . . . . . . . . . . 13 1. 6 Some items not treated in this study · · · · · · · · · · · · · · · 14 1. 7 Key definitions ........... · ... · · · · · •• · ·. · ·. · .... · .... ·. 15
2 . METHOD 17
2. 1 General remarks . . . . . . . . . . . . . . . . . . . . . . . . . . . . . . . . . . . . . . . . 17 2.2 Methodological remarks for each substage
of the project ................... · .... · .. · · ·........... 18
2.2.1 Substage 1: Critical examination and summary of various measures . . . . . . . . . . . . . . . . . . . 18
2.2.2 Substage 2: investigation by questi-onnaire into the relocation of firms in Denmark, 1960-75 ............................ 18
2.2.3 Substage 3: Intensive investigations of firms, type 1 ........ ...................... .. 18
2.2.4 Substage 4: Intensive investigations of firms, type 2 ............. ·................. 19
2.2.5 Substage 5: Interim Report ................... 19 2.2.6 Substage 6: Initial investigation of
the importance of some selected fac-tors in the locational choice of the firm .. · .... · ......... · .... · · ... · ·...............• 19
2. 2. 7 Substage 7: Simulated test of measures and assessment • • • • • • • • • • • • • • • • • • • • • • • • • • • • • • • • • • • • 19
2. 2. 8 Substage 8: Final report . . . . . . . . . . . . . . . . . . . . . 20
2.3 Time schedule. 20
3 . CASE STUDIES-METHODOLOGY ........... · ·................ 21 •
3 . 1 General remarks . . . . . . . . . . . . . . . . . . . . . . . . . . • . . . . . . . . . . . . 21 3.2 Objective of the case studies ........... · .. · ..... · ·. 22 3.3 Framework for data collection ...........•.... ·...... 22 .,.

-VI-
Page
3. 3. 1 Characteristics of the firm . . . . . . . . . . . . . . . . . . . 23 3. 3. 2 Consequence analyses . . . . .. . • . .. . . . . . . . . . . . . . . . • . . 25 3. 3. 3 Relocation analysis/conclusions . . . . . . . . . . . . . . . 36
3.4 Final remarks. . ......................................... . 37
4. CASE STUDIES - DESCRIPTION OF THE DATA MATERIAL 39
4. 1 Introduction ........... · ......... · · · · · .. · · · · · · · · • · · · · · · · · • 39 40 44
4. 2 Characteristics of firms .............................. . 4. 3 Consequence analyses ................................... .
4. 3. 1 Purchasing costs ................................ . 4.3.2 Wages and salaries .............................. . 4. 3. 3 Transportation costs for goods ............... . 4.3.4 Communication pattern .......................... . 4.3.5 Communication costs and travel expenses .... . 4.3.6 Rent ............................................... . 4. 3. 7 Regional development aid .......•................ 4. 3. 8 Other operating costs .......................... . 4.3.9 Differences in total operating costs ....... . 4.3 .10 Non-quantitative consequences ............... .
45 45 48 48 53 54 55 57 57 63
4.4 Relocation barriers 67
67 68
4.4.1 Positive relocation effects 4.4.2 Negative relocation barriers .................
4. 5 The decision making process . . . . . . . . . . . . . . . . . . . . • . • . . . 73 4. 6 Final remarks. . . . . . . . . . . . . . . . • • . . . . • . . . . . . . • . . . . . . . . . . . . 74
5. MOBILITY OF METROPOLITAN FIRMS AND E'UNCTIONS 77
5. 1 General remarks . . . . . . . . . . . . . . . . . . . . . . . . . . . . . . . . . • . . . . • . 77 5.2 Long term mobile firms ....•... .....•.•....•....••••... 78
5. 2. 1 General conclusions . . . . . . . • . . • • . • . . . . • . . . . . . • . . 78 5. 2. 2 Technology and organization .•... • · .... · ... · · •. 81 5.2.3 Future trends in factors influencing
the operating conditions . . . • . • . . . . . • • . . • . . . . • . 83
5. 3 Potentially relocatable firms . . . . . . . . • . . . . . . . . . . . . . . . 84
5. 3.1 General conclusions . . . . . . . . . . . . . . . . . . . . . . . . . . . . 84 5. 3. 2 Financial institutions ..................... ·... 86 5. 3. 3 Organizations . . . . . . . . • . . . . . . . . • . . • . . • . • . . . . . . • • • 86
5. 4 The decision making process . . . . . . . . . . . . . . . . . . . . . . . . . . 8? 5. 5 Final remarks. . . . . . . . . . . . . . . . . . . . . . . . . . . . . . . . . . . . . . . . . • . • 89
,.
•
6.
6.1 6.2 6.3 6.4
7.
7.1 7.2 7.3
-VII-
LOCATION POLICY MEASURES · · · · · · · · • · · · · · · · · · · · · · · · ·
Introduction Incentive measures ......•.....•.......•.•......... Restrictive measures ...••..•..•..••.•••.........• Information measures ...........................•.
INFLUENCING LOCATION BEHAVIOUR
Page
91
91 92
101 102
105
Introduction • . . . . . • • . • • . . • . . . . . • . . . . • . . . . . • . . . . . . • . 105 Description of methods . . • . • • . . • • . . • . . . • • . . . . . . . . . 107 Location policy incentives . . . • . • . • . . • . . • . . . . . . . . 109
7.3.1 Direct incentives .......•......••......... 109 7.3.2 Indirect incentives ....•...•..•.....•.•.. 109 7.3.3 Local government activity .........•...... 109
7. 4 Possibilities of relocation . . . . . • . . . . • • . . . . . . . . 115 7. 5 Relocation measure strength . . . . • . . . • . • • . . . . . . . . 119 7. 6 Relocation measure form . . . . • • . . . . . • . . . . . • . . . . . . 122 7. 7 Indirect relocation measures . . . . . • . . . . . . . . . . • . . 128
8. SUMMARY OF CONCLUSIONS 129
8.1 Introduction .........•.....•••. ...•.....•...•••.•• 129 8. 2 Mobility of metropolitan firms and functions . 132 8. 3 Location policy m.=asures . . • . . • . • . . . . . . . . . . • • . . . . 138 8. 4 Areas for further research . . . . . • . . . • . • • • . . . . • . . . 142
8.4.1 Location of service firms and service
8.4.2
8.4.3
8.4.4 8.4.5 8.4.6
REFERENCES
functions .................................. . Establishment and expansion of firms in the provinces ....••..•..•..•..•....•..•.... The impact of technological and social developments on the locational behaviour •••••• Location policy measures ....•.•.....•.••. Local labour markets ...•.............••... Which firms are desirable to relocate? .
142
143
143 143 144 144
146
List of ANNEXES B a e a • • • • • • • • • • • • • • • • • • • • • • • • • • • • • • • • • • • • • • • 151

-VIII-
PREFACE =======
The research project "Relocation of Economic Activities Traditionally Located in the Copenhagen Area" was initiated with the goal of contributing to the possibilities of the public to influence a differentiated development of various: regions in Denmark. The project was financed by the EEC Commission and the Danish Social Scienc,e Research Council.
The project has been carried through by the following project group:
Joachim Jensen, Lars Kolind,
Erik H. Matthiesen, Peter H. Matthiesen, Peter Mark Pruzan,
Management Consultant Operations Analysis Corporation A/S Management Consultant Peter Matthiesen a-s Institute of Economics, University of Copenhagen
The data collection has been carried through in cooperation with a number of management consultants. In this connection we would like to mention O.K. Andersen, C.H. Braskov, Janne Christensen, Nils Marstrand, F. Nalbandian and Susana Udengaard.
Furthermore, we would like to express our thanks to the many Danish firms and their managements which have offered considerable time and energy in responding to our interviews, studies, questionnaires and provocations. These case studies have formed the basis of all phases in the project. Their confidential content has made it necessary to exclude all direct references to each individual case from the final report.
An advisory group has been established in order to follow the project. The group has consisted of
Torben Agersnap,
Kate w. Andreasen
Ulf Christiansen,
Sv.Aa. Clausen,
J. Chr. Hauge/Bent Greve,
The Copenhagen School of Economics and Business Administration
Minist-v of Trade
The Danish Building Research Institute
The Federation of Danish Industries
The Association of County Councils

-IX-
Sven Illeris (Secretary) , The National Agency for Physical Planning
Arne Petersen (Co-Chairman) , EEC Commission, Directorate General for Regional Policy
Anders Svarre (Co-Chairman), The National Agency for Physical Planning
Morten 0stergard, The Directorate of Regional Development
The advisory group has participated very actively in the research project. It has given significant help in many stages of the work, an inspiration for which we are very thankful.
We would also like to express our appreciation to Mrs. Ilse Rasmussen and Mrs. Jytte Tidmand for their conscientious efforts in typing the reports.
Lars Kolind, Peter H. Matthiesen
-I-
l. INTRODUCTION
This report is the final report of the research project "Relocation of Economic Activities Traditionally Located in the Copenhagen Area". It covers the project activities from October 1976 to September 1978.
In 1974 the Directorate General XVI for Regional Policy of the Commission of the European Communities expressed its interest to carry through a research project with the aim to analyse the factors which influence the location of economical activities which are typically concentrated in the Copenhagen region. The basic thinking behind the project was expressed by the Commission as follows:
"The purpose of this study is to analyse the factors which influence the location of economical activities which are typically concentrated in the Copenhagen region.
Although there has been a substantial growth in manufacturing employment in the underdeveloped regions, this development has almost exclusively taken place in labour-intensive low-wage branches, which mainly employ unskilled workers. It is also characteristic that the management and the research and development departments of the firms often remain located in the metropolitan area.

-- 2-
In order to reduce this unbalanced development in the peripheral regions, a substantial part of the economic activities that today are concentrated in the major cities must be moved to the peripheral regions in order to shift the balance. A regional policy must be developed to induce this development. However, such a policy could not be allowed in cases where the economic viability of the activities in question would be endangered, because a metropolitan location is a sine qua non condition for their existence. Classical location theory does not enable the policy-maker to distinguish with sufficient accuracy between policies that can safely be carried out and policies that may seriously hamper the activities in question. It is therefore extremely important to obtain research information that can improve the basis for policy-making in this field".
This quotation has formed the basis of 1:he preliminary study carried through in 1975 and the present study. While the preliminary study has aimed primarily at the location decision-making process, the present study has concentrated upon an analysis of the mobility of firms and the location policy measures that could affect the locational behaviour of the firms.
A summary of the results of the preliminary study is given in section 1.2 of this report. A more comprehensive presentation of the preliminary study can be found in (Kolind & Matthiesen, 1975).
The working plan of the present study can be found in annex 1.1 of this report. Annexes have been put under separate cover.
The preliminary study has formed a statistical and methodological basis of the present study.
The purpose of the preliminary study was to go through existing literature and statistics to form a sound basis for further research work. Moreover, the study aimed at trying whether it was feasible to use management consultants as sources of information on the considerations and decision-making process of firms concerning their location choice.

-3-
Last but not least it was the purpose of the preliminary study to generate a number of hypotheses concerning the location decision making process in order to obtain a basis for deeper future study.
The preliminary study has dealt with the location of ~rivate firms in Denmark. Public institutions or concession ed firms were not included in the study.
Geographically the preliminary study did not cover Greenland and the Faroe Islands. Emphasis was put upon relocation of firms that were presently located in the Copenhagen metropolitan region.
1~~~~-~E~~!~~b-~~~-~~~h2~212~!~~!_2~§!§_2~-~h~-E~~b!~!~~~y
§~~~y
The preliminary study was carried through by a number of management consultants from the Danish Association of ~1anagement Consultants. A total of 13 management consultant firms participated in the data collection.
22 firms were investigated deeply. The firms were selected among clients of the consultants who took part in the study.* Most of the firms had considered or carried through relocations from the Copenhagen area to other parts of the country. A minor number of firms were selected without having being involved in a relocation process.
The 22 case firms selected were not chosen to be representative of all industries. Rather it was tried to ensure the greatest possible diversity concerning industry and size of the firms.
Almost all of the firms analysed in the preliminary study had used management consultants for a period of time. A detailed working plan was given to each consultant as a basis of his analysis of each individual firm. However, individual and less structured contributions were encouraged. The working plan included background information, information about the basic factors leading to start the relocation process, information about the process itself and the experience gained by each firm concerning its relocation process.
The case descriptions were analysed deeply and formed the basis of the conclusions mentioned in the next section.
* Please note that the case firms of the present study include firms that do not use management consultants.

·- 4-
1.2.3 Results
22 firms are not enough to ensure statistically significant results. The project group has thus emphasized that its results should be seen as hypotheses which should be compared with other research project.s and which should be verified through further studies.
The results of the preliminary study can be structuralized in the following two points:
1. The concept of metropolitan industries
2. The location decision making process
Before reading the results of the investigation it should be noted that the empirical basis of the preliminary study originates from a period of general prosperity in the community, i.e. 1960-1973.
The preliminary study includes some elements of a statisti-· cal and functional delimitation of metropolitan industries. A statistical delimitation of the two basic concepts have been suggested: totally metropolitan oriented industries and partly metropolitan oriented industries.*The definitions are purely operational and not based upon or related to thE! functional definition of metropolitan activities discussed later in this section.
The totally metropolitan oriented industries are characterized by the fact that all categories of employees (salaried staff/skilled workers/unskilled workers) are over-represented within the metropolitan region, whereas those partly metropolitan oriented industries are characterized by the fact that only the salaried staff group is over-represented in the metropolitan region. These statistical delimitations do not, however, describe sufficiently the operational con-· ditions of metropolitan industries in Copenhagen and the provinces.
In the preliminary study a number of elements forming part of a more function oriented concept of metropolitan industries were suggested. The most important points are:
1. Metropolitan industries are characterized by a high: contact frequency externally and in this connection a large number of domestic and foreign journeys for the firm's own staff, customers, suppliers, etc. The main argument for remaining in the metropolis seems to be the concent.ration of:
a. Firms and population b. Public institutions c. Traffic connections to/from abroad
(especially by air) .
*) Please note that this delimitation is not exhaustive.
•

-5-
2. A number of metropolitan industries appear to be characterized by the fact that the technology employed makes it impossible to separate the planning (management) and manufacturing departments. These firms appear to be unable to carry through partial relocations and tend to become totally metropolitan oriented.
3. Geographically decentralized firms seem to locate their head offices with administrative, sales and development functions in the metropolis and production departments in the provinces. This fact seems to emerge from the lack of sufficient unskilled labour in the metropolis. Consequently, management and production functions are separated.
4. Most of the totally metropolitan oriented firms appear to employ a relatively large proportion of salaried staff and also to some extent employees with special qualifications (higher education, commercial training, edp training etc.). Ample supply of this personnel has been an argument for staying in the metropolis.
5. The high percentage of salaried staff means that the metropolitan oriented firms appear to feel the lack of stable labour (specially unskilled) in the metropolis less than other firms. Lack of stable labour has made a number of non-metropolitan oriented firms decide to relocate.
The decision-making process itself has been investigated in depth in the preliminary study. The most important observations have been:
1. Relocation considerations appear not to form part of the long term planning of the firm with the consequence that more or less "acute" circumstances initiate considerations of relocation. The factors that initiate the relocation considerations are mainly physical circumstances (buildings/site) and the stability and availability of labour.
2. The main choice between relocation/no relocation, total relocation/partial relocation takes place very early in the decision-making process. This means that a relocation e.g. to a development area is rarely investigated systematically as a possible alternative although this might be the appropriate solution. Consequently the factors affecting the final choice of location in fact play no part during the early stages of the decision-making process.

- 6 --
3. It can therefore be seen that most firms probably do not choose to stay in the metropolis as a result of traditional weighing of financial consequences. On the other hand some firms move out to development areas without sufficient evaluation of the financial consequences.
4. A tendency has been observed for firms with a "transparent" *) market and firms with a geographically decentralized structure to be more systematic in their considerations than firms to ~hich -this does not apply.
5. The outcome of the location decision process appears to be associated with the technology of the firm (separation of planning and manufacturing departments or not) , the contact frequency and the market transparency.
Moreover, firms in stagnation appears to be less inclined to carry out total relocations.
6. Factors which are felt to be "metropolis adherent~ may either be relocation barriers (building investments, workforce training, key employee immobility) or long term metropolis advantages (large and qualified workforce, easy communication, etc.).
Factors which are "province attractive" are substantially: lower wages, lower rents and greater availability of stable labour (primarily unskilled) . However, the "natural beauty/cultural environment" of the provinces seems to become increasingly important.
7. The factors of the final location choice seem to be of less importance in the consideration whether or not to relocate from Copenhagen to the provinces. The final location choice seems to be decided on the basis of a fairly systematic investigation of a few possibilities, the choice of which, however, also appears to be of an accidental nature. Local government support and development grants seem to be of significant importance in this final choice. The main location factors have been:
- Available building/site - Available workforce (skilled/unskilled) - Centralization/Contact to other departments - Proximity to market - Traffic connections - Regional development aid - Public service institutions - Local activity - Natural/cultural environment - Personal preferences
*) A transparent market is defined to be a market with a clear relation between production costs and selling price.
..
'

..
-7-
A general 5-step phase model has been set te the location decision making process. phase model is shown in figure 1.1 below .
up to illustraThe 5-step
Occasions and reasons
Relocation barriers
For and against relocation
Location factors
0
0
Recognition of a potential relocation problem
Selection of possible main alternatives
Investigation of main alternative
Selection of possible detailed alternative
Investigation of alternatives and final location choice
Figure 1.1 The 5-step phase model of the location decision process which was formulated in the preliminary study. Source: Kolind & Matthiesen 1975).
The central point in this r.odel is the fact that the min alternative choice takes place at a very early stage in the proce!:::s wi-:::h very little informtion available. P.ationality see.rns to increase through the process.

- 8 -·
Based upon (Matthiesen et.al., 1977) and (Matthiesen & Hoffmann, 1978) we shall give a short summary of the recent regional development to document further the relevance of the study:
The general tendency of the population development in the 60's was a net migration towards thE~ agrglomeration areas. This has shifted and since 1973 there has been an actual decrease of population in the Copenhagen metropolitan region. Also the other big agglomerations (Arhus, Odense and Aalborg) have experienced a decrease of population growth although the growth rate for these agglomerations of the second level has not become negative yet.
As far as the spatial distribution or the economic activities is concerned, the tremendous decentralization of manufacturing activities in the sixties has continued in the seventies. Furthermore, the population development has been followed by a decentraliza1:ion of private and public local services.
However, the decentralization has qualitatively been unbalanced. All kinds of "superior tertiary activities" have to some extent remained in the ag~rlomerations not following the general decentralization of the working population.
By "superior tertiary activities" we mean:
Headquarter functions of manufacturing firms
Headquarters of finance and banking
Insurance firms
Wholesale trade
Business service
Public service on the national level
The maintained concentration of these activities in the agglomerations is illustrated in table 1.2 on the following page.

-9-
The Copenh. Arhus Year Metropol. Odense Rest of
Region Alborg the country
Number of headquarters of 200 largest manufacturing 1974 56% 14% 30% firms (excl.agriculture/ food industry)
Number of headquarters of 100 firms with highest ab-solute exports (excl. agri- 1974 62% 12% 26% culture/food)
Amount of R&D expenses spent by manufacturing 1975 72% 28% industry
·,vr..i tP- c0V a.r emplcyme~t within manufacturing in- 1975 44% 16% 40% dustry
Amount of assets for head-quarters of commercial 1974 74% 26% banks
Number of headofficies for business service £irms (ad-vertising agencies, mana-gement consultants, edp- 1970 57% 18% 25% service bureaus, consul-ting engineers)
Employment within busi-ness sarvice 1970 60% 40%
Employment within finan-cial institutions and 1970 54% 46% insurance
Total population 1975 35% 11% 54%
Table 1.2: Spatial distribution of different economic activities. Source: (Matthiesen & Hoffmann, 1978)

- 10-
In table 1.3 is shown the development of the white-collar and blue-collar employment within t:he manufacturing industry. Only here, detailed statistics are available.
These figures show some decentralization of white-collar employment away from Copenhagen in the seventies. However, the development of blue-collar employment has been even stronger. This means in fact that the ratio of whitecollar employment to blue-collar employment has increased in the agglomerations.
Blue-collar White-collar
1971 1973 1971 1973 1975
Copenhagen M. Region 35.9 33.2 47.9 45.7 44.1
Arhus,Aalborg,Odense 17.3 16.8 15.4 15.7 15.9
jRest of the country 46.8 50.0
j
1975
31.9
17.1
51.0 36.7 38.6 40.0
Table 1.3 Relative distribution of employment in the manufacturing industry (in per cent) .
Source: (Matthiesen & Hoffmann, 1978)
Whether the decentralization of white-collar employment will continue and even be followed by a decentralization of the ''superior tertiary activities" like business service, insurance, public service on the national level etc. can not be determined ye·t.
Still, however, the functional mix of jobs and educations seems to be very uneven and up to now it even seems as if these disparities between the agglomerations and the peripheral areas have increased. (See e.g. Matthiesen & Hoffmann 1978).
Conclusively it could be argued that the quantitative regional problem of the fifties (general lack of jobs in the peripheral areas) has developed into a "new qualitative regional problem" with a lack of "superior tertiary jobs" for specialized and highly educated people in the peripheral areas.
How this regional development has E~merged can to some extent be seen from (Christiansen & Kolind, 1976) from which it can be concluded that actual relocations of firms play a very little role. More important probably is branch locations but most of the redistribution of employment has been due to:
Expansion/contraction of existing firms Birth and death of firms Mergers and take overs.
A brief summary of some results from (Christiansen & Kolind 1976) are given in the next section.

-ll-
1.4 Some statistical results concerning the relocation behaviour of Danish firms 1960-75 ----------------------------------------------------------
During the spring of 1976 the Danish Building Research Institute began investigating the location behaviour of a sample of Danish firms. 1926 firms which were active May 1st 1976 were drawn in a stratified random sample from the register of business firms kept by the Danish Central Bureau of Statistics. From this survey which is described in (Christiansen & Kolind, 1977) a few conclusions will be presented in the following.
A total of 1540 firms within the manufacturing, construction, wholesale trade and selected service sectors answered the questionnaire. Around 43 per cent of the firms had their main office in the Copenhagen region and around 73 per cent had main offices located in the Copenhagen region or regions dominated by the three largest provincial cities: Aarhus, Odense and Aalborg.
Measured by county between 55 per cent and 84 per cent of the firms had only one address. Copenhagen county had the lowest number of firms with only one address, Ribe county in South-West Jutland had the highest number. Totally one third of the firms had more than one address.
Looking at the main activities performed at each establishment it was found that at 52 per cent of the addresses production was one of the main activities, while sales was a main activity at 48 per cent. In some cases these may of course overlap. At 30 per cent of the addresses, administration was performect on some significant scale. This percentage is high ir. the Copenhagen region (39 per cent in Copenhagen and in Copenhagen county) . It was lowest in Frederiksborg and Ribe counties (19 per cent). The percentages calculated for administration are however not completely well defined.
The industrial establishments in the sample are by far the oldest, while the establishment in the service sector included are quite young. These also move more frequently.
26.5 per cent of all addresses were opened in development areas. This percentage fluctuates considerably (from 19 per cent in 1961/62 to 32 per cent in 1973/74).
Copenhagen county (the suburbs of Copenhagen), Aarhus, Funen and North Jutland counties experienced the largest net increases in the number of addresses, while Roskilde and Viborg counties have the smallest increases.

·- 12 --
Four different forms of relocations were investigated in the study. These are:
Complete transfer
Closure of old address. Establishment of new address and transfer of all activities from old to new address.
Partial transfer
Old address is maintained. Est:ablishment of new address and transfer of part of the activities at the old address to the new address.
Branch location
Old address is maintained. Est:ablishment of a new branch after 1961 with little or no transfer of activities from old to new address.
New establishments
Either 1) address established before 1960 or
2) address established after 1961 and no other addresses existed at the establishment time.
Around 35 per cent of the existing addresses were established by complete transfer, 19 per cent as branch establishments, 31 per cent as start:s of new firms and 15 per cent as take overs of existing firms. Only one per cent of the addresses were established by secretion from existing firms.
A total of 68 per cent of the transfers occured within the county. An extra of 20 per cent occured within the Copenhagen area, leaving a total of 88 per cent of all transfers within county or area. 54 per cent of all transfers took place within the same local municipality.
Only 5 per cent of all transfers took place from the Copenhagen region to the rest of the country, while Funen and Storstr¢m counties received the largest number of transfers from the Copenhagen area. Transfers from the Copenhagen area are dominant compared to transfers from the rest of the country to Copenhagen.
32 per cent of the branch locations occured within county. An extra 8 per cent took place within the Copenhagen area, which means that a total of 40 per cent of all branch locations took place within county or Copenhagen area. The number of branch locations from the rest of

- 13-
the country to the Copenhagen area was much smaller (5 per cent) than the number of branch locations from the Copenhagen area to the rest of the country (25 per cent).
The Copenhagen area as a whole has a large deficit in branch locations in relation to the rest of the country. No counties outside the Copenhagen area had a deficit in relation to branch locations to and from the Copenhagen area.
The industries (sectors) show important differences with respect to relocation patterns. Miscellaneous service seems to be attracted by the Copenhagen area and Arhus and Funen counties (more than 75 per cent of the transfers and branch locations are covered by these areas; it must, however, be borne in mind that miscellaneous service only covers a total of 54 relocations between counties) . Manufacturing and wholesale trade have approximately 59 per cent of the relocations to these areas. For all three sectors Copenhagen county seems to be the most attractive.
Counties covering development areas receive 27 per cent of the manufacturing relocations, 33 per cent of wholesale relocations and 15 per cent of relocations within miscellaneous service.
1.5 Problem formulation -----------------------The present study has ~een a continuation of the preliminary study described above. While the preliminary study aimed at a clarification of the location decision making process and the methodological problems when studying this process, the present study has gone further in two directions. First, to investigate which firms could possibly be moved from Copenhagen to the provinces without suffering, and second, to point at measures that could possibly affect the location behaviour of some of these firms.
More precisely, the aim of the present study can be expressed by the following 3 questions:
Which types of firms presently located in the Copenhagen area find equal or better operating conditions in the provinces. (Long term mobile firms).
Which long term mobile firms face relocation barriers not higher than they can be overcome fairly easily if necessary with limited public support? (potentially relocateable firms) .
-· 14-
Which location policy measures are adequate in order to:
affect the long term operating conditions in the provinces and consequently make more firms long term mobile,
affect the relocation barriers of long term mobile firms and consequently make these firms potentially relocateable,
attract potentially relocateable firms to the provinces.
In the points above the expression "firm" is used to cover either a firm as a whole or a department of a firm.
The delimitation of long term mobile firms and potentially relocateable firms is explained in chapters 3-5 of this report. Location policy measures are treated in chapters 6-7 of this report.
The present study has aimed at investigating the location behaviour of private firms. Public and concessioned enterprises have not been treated.
The effect of the size of the local employment market on the operating conditions of the firm has not been analysed deeply. Only possible locations where the market is estimated to be of sufficient size have been chosen for consequence analyses.
No attempt has been made to point at an optimal policy instrument mix since this optimization requires operational objectives for the regional policy to be formulated. Such operational formulations do not at present exist in the Danish regional policy.
The present study does not cover the establishment of new firms in development areas, neither does it cover the possible attraction of foreign firms to Denmark. The main conclusions, however, are valid also for firms presently located outside the Copenhagen region. This is due to the fact that we have evaluated the operating conditions of a number of firms both in the provinces and in Copenhagen. The Faroe Islands and Greenland is not covered.

- 15-
Throughout this report the development area (DA) is used to designate areas where the national development act is applicable. The delimitation of the development areas is shown in annex 1.2 of this report. The maps of annex 1.2 show both the so called general development areas and the special development areas (SDA) which differ from the fact that the special development areas are allowed to receive special investment grants, which are not applicable in general development areas. A survey of the present Danish development aid can be found in the yearly reports of the National Development Agency (Egnsudviklingsdirektoratets Arsberetninger) .
The expression "provinces" is used to cover Denmark excluding the Copenhagen area and the areas closer than 30 km from one of the larger cities, Aarhus and Odense.
The Copenhagen region or area is used to designate the Copenhagen and Frederiksberg municipalities together with the Copenhagen, Fredensborg and Roskilde counties. A map of Denmark is enclosed in annex 1.3.
Relocation is used as a term covering both total relocation (all activities of the firm are moved from one address to another) and partial relocation (relocation of one or more departments of the firm) •
Centralization is used in this report as a term expressing relocations which result in a reduction of the number of geographically separated departments of the firm (opposite decentralization) .
Reasons for relocation is used as an expression covering those factors that influence the decision by the firm of whether to move or not. Location factors are factors, which influence final location choice.
Regional policy is defined to be all those activities that the society carries through to influence differently various regions of the country. Part of the regional policy is the location policy which especially aims at influencing the location of physical works.
Firm is used to designate a legal unit, establishment covers a geographical unit and department is used to express a functional unit.

- 17-
2. METHOD
A main result of the preliminary study was the recommendation to use management consultants as a basic source of information concerning the considerations and the decision making process of the firms concerning location behaviour. The recommendation has been followed in the present study. Emphasis has been put upon fairly deep investigations of a limited number of firms rather than extensive forms of surveys.
The results of the investigations have been tested against a wide circle of managers to evaluate the general value of the conclusions as far as possible.
The method used in the present study is described in the working plan (annex 1.1). The study has followed the working plan closely but a few changes were necessary. These changes and some additions and clarifications are reported in the following section.

- 18-
~.:.~.:.1_§~!?~!:~9:~_!.:_ __ ~!:~!:~£~!-~~~~~:Q~E~:2:Q_.~:Qs!_~~~!:Y_2!: various measures ----------------
The investigation has been based upon the following material:
1. Regional Incentives in the European CommunityA comparative gtudy. Berlin 1977.
2. Deglomeration Policies in Europe - A comparative study, Berlin 1977.
3. Nordrefo: Alfa - Survey 1975 and "Effects of regional aid 1977"
4. OECD: Re-appraisal of Regional Policies in OECD Countries, Paris 1974.
Material from the European Regional Policy study was made available to the project group in the fourth quarter of 1977. The material mentioned under the Nordrefo heading has only been available partly to the project group due to late finishing of the final report. The project group has been in contact with the Danish Regional Development Agency concerning Danish regional policy instruments.
The results of substage 2 are shown in chapter 6 of this report.
~.:.~.:.~-§~!?~!:~9:~-~.:.._!:QY~~!:~9:~!:~2:Q_!?y_g~~~~~2:Q:Q~~E~-~:QE2_!:b~
E~!2S:~!:~2:Q_2!:_!:~E~~-~:Q_g~:QIE~E~J.~-!~~~Q:!~12
The project group has devoted time to the analysis of the above mentioned questionnaire investigation by the Danish Building Research Institute 1976. An Interim report has been prepared jointly by the project group and the Danish Building Research Institute (Christiansen & Kolind 1977).
The results of the questionnaire investigation has formed a general basis for the activities of the present project. A summary is given in section 1.4 of this report.
2.2.3 Substage 3: Intensive investigations of firms type 1 ----------------------------------------------------------A total of 4 firms have been chosen subject to an intensive investigation at the time when an act:ual relocation process took place. The selection of firms was done jointly for substage 3 and 4 and will be treated further in paragraph 2.2.4.

•
- 19-
The five stage decision making model formulated in the preliminary study and described briefly in section 1.2 of this report has been under observation in the present study as well. Results are to be found in chapter 4 and 5 of this report •
The method of identifying the possible operating conditions in Copenhagen as opposed to the provinces is described in chapter 3 of this report.
A total of 15 firms participated in the investigations in this substage. The selection and evaluation procedures are presented in chapter 3 of this report.
The detailed reports are confidential and cannot be made accessible for further study. General results are presented in chapters 3 - 5 of this report.
An Interim Report was prepared in August 1977.
~~~~§_§~Q§~~g~_§l_!~!~!~!_!~~~§~!g~~!2~-2~-~b~-!~E2~~~~~~ of some selected factors in the locational choice -------------------------------------------------of the firm
It has only been possible to allocate very few resources to this substage. The main source of information has been the case studies themselves and only limited results have come through from the contacts which the project group has had with various institutions etc.
A minor survey of personal relocation barriers has been included in this substage although not foreseen in the working plan. The results of the activities in this substage are given in chapters 4, 5 and 7.
The planning of this substage was not done until the middle of the project. The working plan does not contain specifi-

- 20-
cations for this phase and consequently a detailed description of the method has been included in section 7.2 of this report. Results are presented in chapter 7 as well.
The present final report has been prepared during June -September 1978.
2.3 Time schedule -----------------Figure 2.1 shows the extent of each substage in the study as it actually took place:
Substage Year 76 77 78
Quarter 4 1 rl ~. 3 4 1 2 3
0. Preparatory period
1. Regional policy measures -2. Relocation questionnaire
survey
3. Case studies, type 1 - ··-4. Case studies, type 2 t----
5. Interim report --6. Selected factors -- ---
I 7. Simulated test
8. Final report
Figure 2.1 Actual time schedule of the present study
The time schedule follows closely the original schedule shown in the working plan, annex l_ 1 of this report. However, the case studies in substage 3 and 4 took longer than was originally expected. The simulated test, substage 7, was started later than expected due to difficulties in arranging the group discussions which are described in section 7.2. of this report.
•

..
- 21-
3. CASE STUDIES -METHODOLOGY.
3.1 General remarks. --------------------In the following three chapters we shall discuss the results of the case studies, performed to cover substage 3 and 4: Intensive investigations of firms.
As mentioned in chapter 2, 19 firms have been investigated and for each firm a full case description has been prepared. Because of the confidential nature of these case studies, not allowing the case descriptions to be published, we shall in this chapter give a summary of the methodology used and in the following chapter an overall description of the case material.

·- 22 --
First of all it is important to note that the small number of 19 firms by no means can be said to be statistically representative. However, we shall endeavour to state only such findings and conclusions which are believed to be of general validity, when supported by the case studies of the preliminary study (an additional 22 firms) and the experiences from our general work as management consultants.
To identify each of the 19 f:Lrms these have been "named" in such a way that the subsector of the firm is contained in the name. In annex 3.1 is a list of each case description, its number, "name" and subsector. In some cases we shall use a H, P or M in brackets after the name, indicating that it is only the head office (H) , production department (P), or marketing and sales department (M), which is considered.
It should be noted that only few of the firms selected belong to the clients of the consultants, who have participated in the study.
According to the working plan the objective of the intensive investigation of firms has been:
To analyse the operating conditions for firms and for departments located in the Copenhagen Metropol1tan Region compared with a "potential location in the provinces".
These analyses should then lead to a classification of types of firms/departments presently located in the Copenhaqen Metropolitan Region with equal or better operating conditions in the provinces as opposed to the Metropolitan Region (long-term mobile f~rms). Furthermore the relocation barriers of the firms are investigated in order to determine which of the long term mobile firms are furthermore potentially relocatable, i.e. are facing relocation barriers of reasonable size compared to the advantages in the operating conditions of a provincial location.
3.3. Framework for data collection. -----------------------------------Of the 19 firms investigated 18 are wholly or in part located in the Copenhagen Metropolitan Region and 1 in a development area.
•
..
- 23-
For 15 of the Copenhagen located firms the consequence analyses have considered a relocation of the whole firm or one or two departments from Copenhagen to a place in the provinces (for some cases in a development area). The remaining 3 Copenhagen located firms and the one province located firm have all relocated (one or more departments) within the last few years. For these firms (departments) the consequence analyses have considered the consequences of this relocation, i.e. a comparison of the operating ~onditions before and after the relocation. This has been done in order to add a practical experience to the "theoretical" consequence analyses. Annex 3.1 contains a list of the present locations of the 19 firms and a description of which kind of consequence analyses have been done.
It has been necessary to collect a broad range of data to form a basis for the consequence analyses and the possible generalization from the single firm/department level to ~ of firm/department· level. Therefore a fairly standardized guide of data collection and consequence analysis was prepared. This is enclosed in annex 3.2. Below we shall shortly go through the framework for the data collection.
The general case description is subdivided into three main parts:
1. Characteristics of the firm.
2. Consequence analyses.
3. Relocation analyses/conclusions.
3.3.1 Characteristics of the firm. ----------------------------------These characteristics of the firm have been included for three reasons:
1) To give a general picture of the firm.
2) To serve as a data base for the following consequence analyses.
3) To make it possible to generalize the results of the consequence analyses from the firm/department level to the type-of-firm level.

·- 24 --
The data can be subdivided into 10 groups:
1) The firm.
Subsector, function, products, degree of specialization and automatization, ownership, organizational relations to other firms and turnover subdivided by market and production/trade.
2) The departmental structure.
Description of each department, its location, function and number of employees (in some cases supplemented by a description of the historical development) .
3) The employees.
For each department the number of employees by function and sex.
4) Research and development (R&D).
The number of employees within R&D and the expenditure spent on R&D activities. Distribution of R&D expenditure (including salaries) on product and process developm9nt, and for each of these two groups: whether the activities concern new or existing products/processes.
5) Variability.
The development for the last 6-8 years in number of employees, sum of wages and salaries, turnover, value added*), number of product groups, technology employed, organization etc.
6) Market situation.
Distribution of turnover on main product groups and for each product group a description of the market situation:
1) Is there a small or large margin when fixing the prices?
2) The number of competitors.
3) For service products: How well defined are they?
*) Value added is defined as the turnover minus purchases of raw materials and semi manufactured articles.

•
- 25-
7) Suppliers of semi manufactured articles.
Total costs of purchasing semi manufactured articles. For each significant supplier a description of location and yearly quantity (tons and D.kr.) .
8) Suppliers of raw materials.
As in 7) .
9) Customers.
Description of major sales channels and location and quantity for main customers/markets.
10) Communication.
Description and quantification of the external communication pattern. The main emphasis is on face-to-face contacts and these are specified according to origin (department/function) and destination, external target group: customers in Copenhagen, outside Copenhagen and abroad, suppliers, local authorities, business services etc.
The face-to-face contacts are specified according to place of contact: Inside or outside the company. In the cases where centralization or decentralization is considered, also internal faceto-face contacts between the involved departments are specified.
For each communication type the yearly number of face-to-face contacts is estimated on the base of travel expenditures, diaries and interviews.
The tables of annex 3.2 contains a general outline of the way of specifiyng the communication pattern.
The points 7-9 are only described to the extent, which has been needed for the following consequence analyses.
These analyses involve drawing up alternative profit and loss accounts for a location in the Copenahgen Metropolitan Region and one or more alternative locations in the provinces. As far as possible the differences in the operating conditions between alternative locations are

·- 26 --
quantified and included in these alternative profit and loss accounts. However, still some non-quantifiable (noneconomic) factors influence the operating conditions and these too are included verbally.
It is essential that the different costs are calculated as alternative costs, i.e. for example rent for the existing location in estimated as the "market costs", not taking into account that the firm maybe owns the buildings and therefore pays a different (lower) rent.
The provincial locations are selected in co-operation with the management of the individual firm as "realistic" locations. This has lead to locations which in some cases have been inside development areas and in other cases outside the development areas.
To be sure that the size of the local labour market area will not affect the operating conditions, the provincial locations selected are in general within cities with more than 5.000 inhabitants. On the other hand to avoid ''large city environments'',locations within the large cities of the provinces have not been considered. The only exceptions from these two criteria are two firms which already have relocated - one to Alborg and one to a small city with less than 5.000 inhabitants. It has not been the objective of this study to investigate the necessary size of the labour market in small cities, and consequently a city of at least 5.000 inhabitants is not to be considered as a precondition for the location of thE~ firms investigated.
Whether to consider the relocation of the whole firm to a provincial location or one or more departments is also determined in co-operation with the management of the firm and in some cases both a total and a partial relocation has been considered. In annex 3.1 we have listed which departments and which locations have been considered for each case.
Finally the consequence analyses involve quantification -if possible - of relocation barriers, which can be negative (relocation expenses, investments etc.) as well as positive (rationalization/automatization of the production machinery in connection with the relocation) .
Besides the quantifiable operating costs and relocation barriers, the non-quantifiable factors are discussed.
In the following we shall briefly discuss the principles for calculating the different types of operating costs.

- 27-
The operating costs which could ~- expected to vary according to location are:
1) Purchasing costs.
2) Wages and salaries.
3) Transportation costs.
4) Travel- and communication expenses.
5) Rent.
6) Costs of external services.
7) Energy, water etc.
8) Others.
Prices of raw materials, semi manufactured articles etc. might vary form location to location. However, for the firms investigated it has been assessed that possible variations are so small that a proper computation has been left out. It should be noted that transportation costs for raw materials etc. are treated under paragraph 3.3.2.3 below.
The costs of wages anc salaries are influenced in many ways - directly and i' 1directly - by the location. Directly there are differences in the level of wages and salaries form location to location and more indirectly there might be differences in productivity.
Differences in productivity can be due to differences in:
1) Labour turnover (stability).
2) Illness and absence.
3) Manning standard for the same machine.
4) Communication time.
5) Speed of work.
6) Degree of automatization.
The analyses are made under the condition of the same degree of automatization at different locations, although there in fact might be geographical differences. Furthermore it has not been possible to document or even identify any differences in speed of work.
- 28-
Finally differences in time needed for face-to-face contacts at different locations is treated in a later paragraph 3.3.2.4.
In fact differences in wage level and productivity is a crucial point in the evaluation of operating costs. Therfore below we shall refer more detailed the main principles in the assessment of the different factors influencing the total costs of wages and salaries.
Level of wages and salaries.
There are only limited statistics available, illustrating spatial variations in the level of wages and salaries.
The most comprehensive statistics are those of the Danish Employers Association, DEA (Dansk Arbejdsgiverforening) -however these only deal with a geographic division of Denmark into two parts: (i) The Copenhagen Metropolitan Region and (ii) The rest of the country (the provinces) .
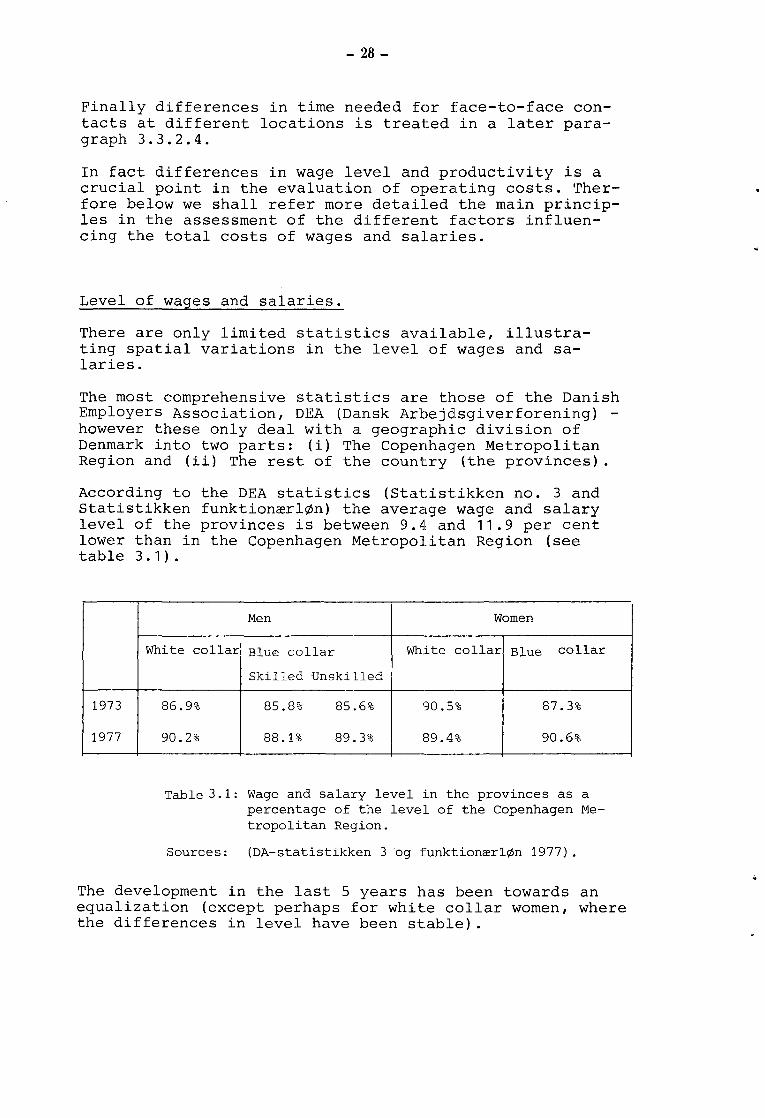
According to the DEA statistics (Statistikken no. 3 and Statistikken funktion~rl¢n) the average wage and salary level of the provinces is between 9.4 and 11.9 per cent lower than in the Copenhagen Metropolitan Region (see table 3. 1) .
1973
1977
Men
~Vhi te collar: Blue collar ~ite Women
collar Blue collar
Skilled Unski. lled I
t-------
86.9% 85.8% 85 6 9., • 0 90.5% 87.3%
90.2% 88.1% 89 39-• 0 89.4% 90.6%
Table 3. 1: Wage and salary level in the provinces as a percentage of the level of the Copenhagen Metropolitan Reqion.
Sources: (DA-statistikken 3 og funktionrer1¢n 1977).
The development in the last 5 years has been towards an equalization (except perhaps for white collar women, where the differences in level have been stable).

•
- 29-
This is in agreement with the geographical development of income from 1970-75. The growth of income in this five year period has been largest (93 percent) in some of the most rural regions (Bornholm, Southern Jutland and Viborg counties) and smallest (78 per cent) in the Copenhagen Metropolitan Region (see: "Kommunerne og egnsudviklingen, 1977").
However the statistics in table 3.1 are influenced by differences in the composition of the workforce, i.e. the fact that many high wage subsectors are overrepresented in the Copenhagen Metropolitan Region.
It is therefore necessary to consider the wage and salary level for the same occupations in the two areas. In table 3.2 below are some examples of wage/level for the largest occupational groups shown.
Men Women
White Clerks 95.1% Typists/clerks 95.8% collar Warehouse assist. 95.1% Shop assistants 97.9%
Skilled: Typographers 86.0% Iron & metal workers 97.0% Smiths and mecanics 87.8% Warehouse workers 102.2%
Blue Electricians 84.7% Cleaners 91.9% collar Unskilled: Paper workers 103.3%
Iron & metal work~rs 95.7% Warehouse men 94.7% Drivers 95.5%
Table 3.2: Wage level for selected occupational groups in the provinces as a percentage of the Copenhagen Region, 1977.
Sources: (DA-statistikken 3 and funktion~rl¢n 1977).
From this it can be seen that for most occupations the differences in wage level is much smaller than was the case for the total labour force, and in general except for some skilled male groups the wage level of the provinces is from 8 per cent lower to 3 per cent higher than that of Copenhagen, but for most groups the wage level is from 3 to 5 per cent lower in the provinces. However these figures count for the provinces as a whole and of course there are differences between different areas in the provinces. It could be expected that the big cities are more like Copenhagen while the rural areas are lower than the average of the provinces. It is very

- 30-
difficult to illustrate this statistically because of the lack of data. Other more detailed geographical statistics (Industristatistikken 1976) can not be corrected for the abo-ve mentioned differences in the working force composition. However based upon an assessment of (Industristatistikken, 1976) and some unpublished and more detailed data from The Danish Employers Associai:ion, concerning Zealand, it is our conclusion that in general savings in wages by relocation from Copenhagen to a medium sized town in the provinces can be expected to be 8 per cent for blue collar workers and 6 per cent for white collar staff at a maximum.
These are the average figures and due to local conditions (other local firms and their type of jobs and wage level) there are great dif~erences from this in actual case.
The wage level development up to now has shown an equalization, which we believe will continue. It can be noted that for unskilled men and women the increase in wages in the provinces in 1977 has been even bigger than seen before compared to Copenhagen. This might be due to the increased "minimum wage" introduced in 1976/77 and equal wages for men and women.
Illness and other absence.
Differences in illness and unspecified absence between different locations can be transformed to differences in wages and salaries. According to the Danish Employers Association the 1977 figures were:
White collar
Blue collar
Men
Copenh. The
2.2
6.8
1.5
5.0
Women
The provinces
3.5
7.5
Table 3.3: Percentage absence, due to illness, accidents and other, 1977.
Sources: DA-statistikken 3, 1977.
Most of the difference in level of absence between Copenhagen and the provinces is due to difference in illness. For white collar staff the differences are so small that in general it is not necessary to consider these.

..
- 31-
Illness for blue collar workers are within the first three weeks paid by the firm and after that by the public. In general 70 per cent of all illness days for workers are of less than 3 weeks duration, which means that illness in general will cost firms in Copenhagen more than firms in ~he provinces about 1.2 per cent for men and 2.:, per cent for women of the total wages. However many firms are insured against it, and from the statistics of the Danish Employers Association 1977 it can be seen that for firms not insured against illness the total costs for illness as a percentage of total wages was 5.2 per cent (4.2) in Copenhagen versus 4.4per cent (3.0) in the pro-vinces for women and (unskilled men), 1977.
However for the individual firm there might be much greater differences due to for example the working environment. Consequently when estimating the extra costs of absence one has to assess the individual firm. For some of the case firms having decentralized departments in different locations it has been possible to use the experienced data.
Labour turnover.
Differences in labour turnover involve differences in the costs of recruiting and training new people. For the individual firm and some individual occupational groups it is assessed for how many weeks or months a new person as an average is non-productive. However, there are no statistics at all illustrating differences in labour turnover. Therefore it is only possible for those firms which already have establishments in the provinces and have or have had establishments in Copenhagen to assess differences in labour turnover.
It has to be noted that labour stability (i.e. absence and turnover) in general is very difficult fully to transform into economic data.
A non-stable workforce might f.ex. make it impossible to complete customer orders in time. These consequences will be discussed in the context of non-economic factors.
Efficiency .
Only in one case has it been possible economically to estimate differences in efficiency. For that firm there were differences in the norms for manning the same machines in the provinces versus Copenhagen.
In other cases the efficiency subject is treated under non-quantifiable data.

- 32-
For those cases where the transportation costs will vary significant with the location these are estimated by roughly determining the amount of goods for each significant customer/market/area and in some cases suppliers. The transportation costs are then calculated on the basis of transportation quantities and transportation rates of The Danish State Railways (DSB) and/or carriers. It should be noted that although rates might not express the actual costs, from the firms point of view, the rates are the relevant figures.
For firms having their own vans it is estimated whether different locations will involve different fleet size and consequently different costs.
Together with wages and salaries and the following evaluation of the cost of rent this point is a crucial point in the consequence analyses.
Spatial differences in travel- and communication costs is primarily a question of differences in expenses and time spent by face-to-face contacts. Apart from these, there might for some firms be differences in other communication costs like telephone, telex, postage etc. -and when relevant these are estimated roughly. However the main costs are generated by face-to-face contacts.
In paragraph 10 of the characteristics of the firm the face-to-face contact pattern has been estimated in such a way, that the number of face-to-face contacts per year with external persons is estimated (including in house meetings). Furthermore internal contacts between departments has been calculated when relevant. On the bases of this contact pattern the effects of a relocation can be calculated in the following way:
1) For each contact type outside the house the present travelling time and -expenses involved are estimated.
Correspondingly these figures are estimated for the new (provincial) location, taking into account that the communication pattern might change and that a trip might involve several contacts.
•
..

•
- 33-
2) Travel time is transformed into costs by multiplying travel hours with a cost factor of 100 D.kr. per hour. This is an estimate or salary and social costs per effective hour for middle management.
The crucial point in this calculation is the assessment of the change of the communication pattern by relocation. Both English (Goddard el.al, 1976) and Swedish (Thorngren,1973) studies have indicated a change of the contact pattern by relocation. This functional change of the contact pattern is due to:
(i) transformations and (ii) substitutions.
Some Copenhagen contacts might be transformed to contacts with the local community by a relocation to the provinces. Furthermore some face-to-face contacts might be substituted by f.ex. telephone or letter by a relocation due to the increased travelling time.
Both kinds of communication change might of course hamper the company in the long run. A comprehensive discussion of this whole communication pattern will be dealt with later in this report - however for the purpose of the economic quantification of face-toface contacts the estimates have been quite conservative, i.e. only a transformation of those contact types which quite obviously will change (f.ex. contacts with local authorities) by a relocation is included. In this way the costs of maintaining the existing contact pattern is calculated.
3.3.2.5 Rents.
The last point of crucial interest for the economic consequence analyses is the spatial differences in rents. There are very big variations in costs of land making differences of a factor 4-6 between Copenhagen (not central) and the provinces possible.
Building costs too are to some extent dependent on the relation between supply and demand and at least in some peripheral areas local constructors might be cheaper than average of the country. However it is very difficult to get any statistics about the spatial variation in building costs.

- 34-
To get around this and to avoid differences due to the individual financing of buildings (or ownership) in general the differences in rent is estimated as differences in renting the existing or corresponding buildings at the two different locations (Copenhagen and the provinces) .
When a location in a regional development area is considered, the calculation of rent is supplemented by a calculation of the effects on the operating costs of regional development aid.
This calculation include regional development aid for buildings as well as machinery.
The general principle of estimating the effects on the operating costs is:
First is calculated the corresponding capital-supply of the investment grants (if a special development area is considered) and loans. With an interest rate of say 12 per cent the effects of the regional incentives concerning the operating costs is computed as 12 per cent of this capital-supply.
It should be noted that an interest rate of 12 per cent is just an example. In the consequence analyses interest rates of 1 5 per cent have been usE~d too.
The capital supply for each of the two main regional incentives is calculated as follows:
Investment grants.
This grant is a subsidy to the operation of the firm. Consequently the grant is taxable, although the payment of tax can be postponed up to 10 years.
With a tax rate of 37 per cent the present value of this tax payment in 10 years will be:
0.37
and with i = 12 per cent
0.37x100
(1+0.12) 10 = 12 per cent.
•
•
•
•
- 35-
i.e. the investment grant can be regarded as a capital supply of 88 per cent of its nominal value.
Loans.
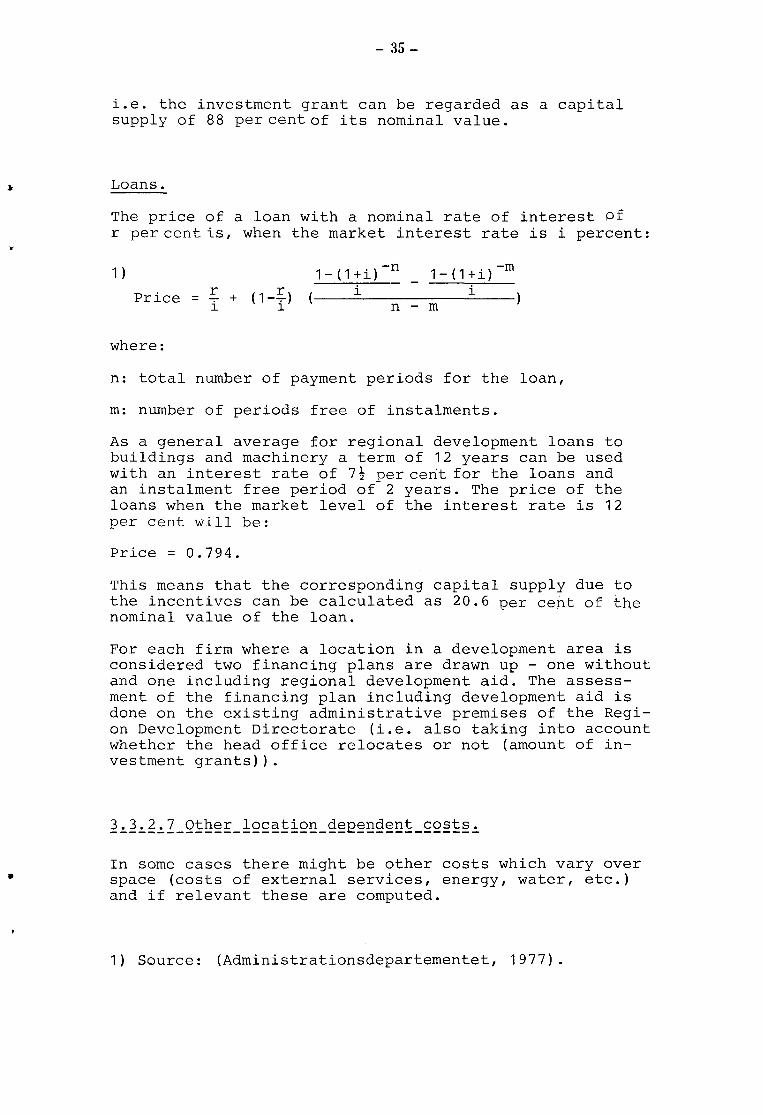
The price of a loan with a nominal rate of interest of r percentts, when the market interest rate is i percent:
1 )
Price
where:
= r + (1-~) i l
1-(1+i)-n i
1-(1+i)-m i
n - m
n: total number of payment periods for the loan,
m: number of periods free of instalments.
As a general average for regional development loans to buildings and machinery a term of 12 years can be used with an interest rate of 7 t per cerit for the loans and an instalment free period of-2 years. The price of the loans when the market level of the interest rate is 12 per cent will be:
Price= 0.794.
This means that the corresponding capital supply due to the incentives can be calculated as 20.6 per cent of the nominal value of the loan.
For each firm where a location in a development area is considered two financing plans are drawn up - one without and one including regional development aid. The assessment of the financing plan including development aid is done on the existing administrative premises of the Region Development Directorate (i.e. also taking into account whether the head office relocates or not (amount of investment grants)).
In some cases there might be other costs which vary over space (costs of external services, energy, water, etc.) and if relevant these are computed.
1) Source: (Administrationsdepartementet, 1977).

·- 36 --
The economic operating consequences as calculated up to now are finally supplemented by:
1) Non-economic operating factors.
2) Relocation barriers.
Discussing the non-economic operating factors involve an assessment of:
The nature of the communication network.
Availability of skilled labour and highly educated people.
Non-quantifiable effects of improved labour stability, environment etc.
It can now be evaluated whether the firm/department is long term mobile or not.
In order to assess whether the firm actually can relocate it is important to consider the relocation barriers in relation to the reduction in operating costs.
Here the relocation costs are import:ant:. Furthermore for many firms there might be positive relocation effects like:
More efficient plant layout/technology.
Change of organization.
etc.
These factors, which have only to do with the relocation itself, are independent of the "new" location and consequently they have nothing to do with the differences in operating costs of a Copenhagen location compared to a provincial location. Consequently they are regarded as positive relocation effects.
Relocation barriers which are much more: difficult to evaluate could be f.ex.:
The mobility of key-personnel(and the value of this mobility).
According to the preliminary study in fact one of the most common heard arguments against a relocation is that the key-employees do not want to move.
•
•
- 37-
As most firms are dependent on a certain continuity in the staff, it has been considered to be important to investigate this statement further.
There are great differences in the dependence between firms and their employees. In a smaller production firm the manager might be the only contribution to the necessary continuity, where a consultant firm selling the know-how of the employees would be almost fully dependent on the willingness of the employees to relocate.
This shows that the amount of key employees varies with the type of firm. The concept "key employees" is used to cover an employee, whose resignment will have a significant negative influence on the work on the firm.
The establishments traditionally relocating - production units - usually have a relatively small number of key employees and furthermore the management might wish only few employees to move. The purpose of the relocation could be cheaper labour and/or a change of organization.
Further analyses of the relocation barriers of employees have been carried out in 5 of the 19 case firms. Four of the firms have relocated from Copenhagen to the provinces and those employees who moved, have been interviewed based upon a standardized scheme (see annex 3.3). The fifth firm considered to centralize its departments and wanted to know the opinion of the employees. All employees had the opportunity to fill ln the questionnaire (see annex 3.4) about essential barriers and wishes about localization.
Finally for those firms which actually have been in a decision making process concerning a relocation this process has been studied and compared to the results of the preliminary study.
3.4 Final remarks.
The description of the methodology has been quite detailed fully to document the very in depth nature of the case studies and the consequense analyses. It has been the objective as far as possible to quantify factors of locational relevance and it is our opinion that further quantification will be very difficult and might not even be relevant .
After this discussion of methodology we shall in the next chapter turn to present the results of the case studies.

•

- 39-
4. CASE STUDIES - DESCRIPTION OF THE DATA MATERIAL.
4.1 Introduction.
The case studies cover 19 firms characterized by the following present localizational pattern.
Location of Headquarter/I•Jhole firm
Copenhagen The provinces
Only one establishment 7 1
Several geographical dividided establishments 10 1
Table 4.1: No of case firms, characterized by locational ;:>attern.
- 40 ·-
For the 19 firms the consequences of alternative locations for a total of 21 establishments have been investigated i.e. for two firms (ELECTRIC1 and TEXTILE1) the consequences of a relocation of both a production plant and a head office have been investigated. These consequence analyses have all dealt with a comparison of at least one location in the provinces with a location in Copenhagen. For provincially located firms (establishments) this involves an analysis of a relocation back to Copenhagen.
17 of the 21 consequence analysPs performed have included the headquarters (or whole firm)· while 4 have involved only production plants. This means that, in general, the conclusions should be valid for headquarter functions. 5 out of the 21 firms/departments analyzed are at the moment located in the provinces, but have recently moved out.
In chapter 3 the data material has been divided into three groups:
(i) Characteristics of the firm.
(ii) Consequence analyses.
(iii) Relocation analyses/conclusions.
and we shall in the following discuss the case studies under these headings.
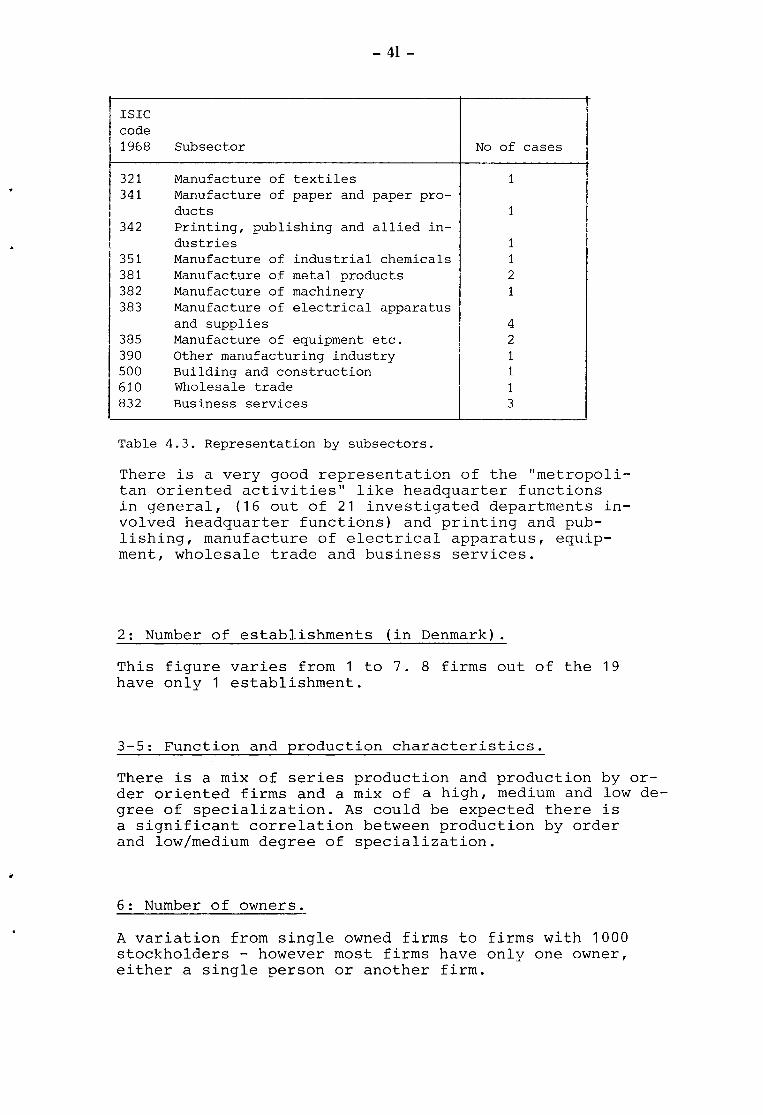
Table 4.2 in the end of this chapter is a summary of 26 key characteristics of the individual firms/departments.
In the following we shall briefly go through these characteristics with reference to the column numbers of table 4.2.
1. Subsectors.
The following subsectors are represented:
I
I i
il
- 41-
!SIC code 1968 Sub sector No of cases
321 Manufacture of textiles 1 341 Manufacture of paper and paper pro-
ducts 1 342 Printing, publishing and allied in-
dustries 1 351 Manufacture of industrial chemicals 1 381 Manufacture of metal products 2 382 Manufacture of machinery 1 383 Manufacture of electrical apparatus
and supplies 4 385 Manufacture of equipment etc. 2 390 Other manufacturing industry 1 500 Building and construction 1 610 Wholesale trade 1 832 Business services 3
Table 4.3. Representation by subsectors.
There is a very good representation of the "metropolitan oriented activities" like headquarter functions in general, (16 out of 21 investigated departments involved headquarter functions) and printing and publishing, manufacture of electrical apparatus, equipment, wholesale trade and business services.
2: Number of establishments (in Denmark).
This figure varies from 1 to 7. 8 firms out of the 19 have only 1 establishment.
3-5: Function and production characteristics.
There is a mix of series production and production by order oriented firms and a mix of a high, medium and low degree of specialization. As could be expected there is a significant correlation between production by order and low/medium degree of specialization.
6: Number of owners.
A variation from single owned firms to firms with 1000 stockholders - however most firms have only one owner, either a single person or another firm.

·- 42 --
7-10: Turnover, value added and exports.
The total turnover varies from 2 mill. Dkr. per year up to 440 mill. D.kr. Value added defined as turnover minus purchase of raw materials and semi manufactured articles varies from 9 per cent (~mADE1) to 100 per cent (service firms) of the turnover, whilE~ P.xports varies from 0 to 98 per cent of the total turnover. This means a broad representation of different types of firms regarding the above mentioned factors.
11-14: Employees.
The total number of employees varies from 11 to 3000. In the table 4.4 below is shown the distribution of the 19 firms regarding the total number of employees and the number of employees in the establishments investigated.
Less than 20-49 50-99 100-199 200-499 More than 19 500
employees employees employees employees employees employees
Firms 1 2 3 8 3 2
Estab-lish-ments 1 5 4 7 4 0 inve-stiga-ted.
Table 4.4: Size distribution by employment of the firms and the establishments investigated.
In a Danish context both small and medium sized firms and a few big firms are represented. However, from a European point of view, the study can only be said to include small and medium sized firms. The establishments investigated are in general smaller than the firms as a whole,and no establishment with more than 500 employees has been studied. Looking at the composition of the employees, it should be noted that the percentage of white collar workers varies from 5 to 100 per cent with the lowest percentages for pure production plants and the biggest for service companies and headquarter functions.
..

•
-~-
15-17: Research and development.
The R&D activity level characterized by number of R&D employees and the total R&D expenses as a percentage of value added shows a broad variation from very R&D intensive firms (ELECTRIC3, EQUIPMENT1) to firms having no significant R&D activities (for example TRADE1, SERVICE1, PRINTING1). The average R&D activity level for the whole manufacturing industry in 1976 was R&D costs of 0.7 percent of the total turnover, in average corresponding to around 1.2 oercent of value added (Forskningsstatistikken, 1975)~ Approximately 75 percent of the manufacturing firms for which R&D data are available in the present study has a higher activity level than this average, indicating that,in general,the firms are quite R&D intensive. The service and trade firms have almost no R&D activity, which is in agreement with more general statistics (Forskningsstatistikken, 1975).
18-19: Variability.
Changes in turnover, new products, new technology, new organizational structure within the last 6-8 years.
20-22: Market relations.
The market relations are characterized by three factors:
1) Brands or "taiiored products".
2) Opaque or transparent market.
3) Need for physical market proximity.
In general most of the firms in this study have no great need of physical proximity to a local market, i.e. most have national or international markets.
This of course is due to the procedure of selecting firms (only those having a chance of being mobile have been selected (regional export activities)). However there are some firms (mainly service firms) which because of a close personal contact to the customers to some extent are dependent on a certain proximity to the market. Most of these already have local branches.

- 44-
The general market conditions are expressed by a characteristic of the products being brands or more "tailored" (individually designed and/or manufactured).
Furthermore the market is defined as being transparent if there are many competitors and the margin when fixing prices is small (for service firms when the services are well defined) . In the case studies most markets are characterized to be transparent, including the markets of two of the service firms.
As expected there is a correlation between firms mainly producing brands and the production being characterized as series production.
23-25: External face-to-face contacts.
These three figures express the contact intensity of the firm computed as follows: The total yearly number of face-to-face contacts with external people (from other firms, public institutions etc~>, It includes contacts inside the firm as well as outside.
A great variation is noticed. The less contact intensive firms/departments having around 1-3 contacts per year per employee and the most contact intensive having around 50 contacts per year per employee.
In paragraph 4.3.4 below we shall further discuss the contact pattern.
26: Possibilities of decentralization.
A general assessment of the possibilities of a decentralization of the firm (or the department) into several geographically divided establishments.
After this brief discussion of the general characteristics of the firms investigated we shall now turn to a more detailed discussion of the resulting consequence analyses.
We have in chapter 3 of this report discussed the main principles of the consequence analyses.
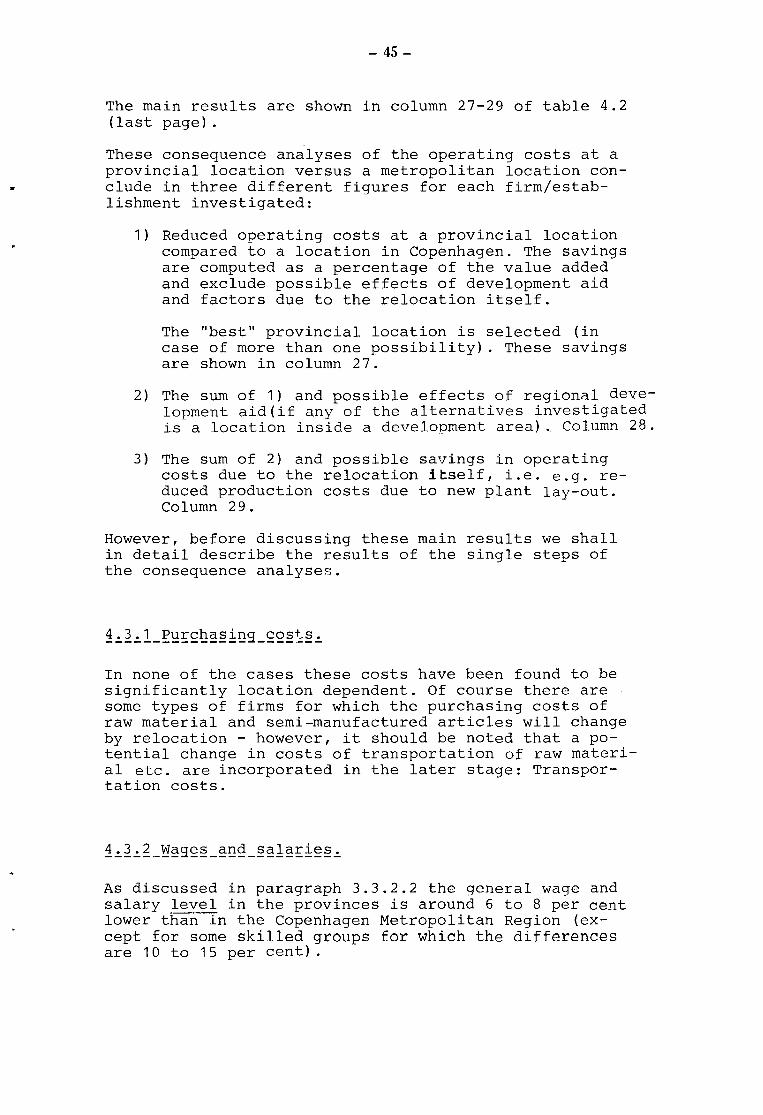
- 45-
The main results are shown in column 27-29 of table 4.2 (last page) .
These consequence analyses of the operating costs at a provincial location versus a metropolitan location conclude in three different figures for each firm/establishment investigated:
1) Reduced operating costs at a provincial location compared to a location in Copenhagen. The savings are computed as a percentage of the value added and exclude possible effects of development aid and factors due to the relocation itself.
The "best" provincial location is selected (in case of more than one possibility). These savings are shown in column 27.
2) The sum of 1) and possible effects of regional development aid(if any of the alternatives investigated is a location inside a development area). Column 28.
3) The sum of 2) and possible savings in operating costs due to the relocation itself, i.e. e.g. reduced production costs due to new plant lay-out. Column 29.
However, before discussing these main results we shall in detail describe the results of the single steps of the consequence analyses.
In none of the cases these costs have been found to be significantly location dependent. Of course there are some types of firms for which the purchasing costs of raw material and semi-manufactured articles will change by relocation - however, it should be noted that a potential change in costs of transportation of raw material etc. are incorporated in the later stage: Transportation costs.
As discussed in paragraph 3.3.2.2 the general wage and salary level in the provinces is around 6 to 8 per cent lower than in the Copenhagen Metropolitan Region (except for some skilled groups for which the differences are 10 to 15 per cent).

-· 46-
For the firms investigated the corresponding figure is assessed in the range from 0 to 10 percent. The variations from the average is due to the following factors:
1) For some firms there might be experiences from establishments already located in the provinces. However, only in those cases where the firm has comparable establishments in the provinces and Copenhagen experienced differences in wage level are reliable. To compare the actual wage level in a provincial establishment with the statistical average in Copenhagen is not relevant. This is due to the very big local differences in wage level, meaning that the actual wage level in a Copenhagen located establishment could not be assumed equal to the statistical average.
However, for some firms it is possible to compare wage levels:
For TEXTILE1 the wage level in the provinces is assumed equal to that in Copenhagen (low wage unskilled workers) . The firm experienced after the increase of the minimum wage to 29 D.kr. per hour that the wage level became equal.
- For METAL1 the wage level in a SDA is 5 to 12 per cent lower than in Copenhagen.
- ELECTRIC2 has experienced a wage difference between the provinces and Copenhagen of 6 per cent for unskilled women.
2) Many firms do not want to incorporate differences in salaries for white collar employees. The general reason for this is that most firms want to keep as many key-employees as possible by a relocation. Most of these are within the white collar group and it is unrealistic to believe in a salary reduction for people who are going to move together with the firm.
Of course in the long run it might be possible to get closer to the local salary level - on the other hand the development up to now has meant decreasing differences between Copenhagen and the rest of the country and this trend is in general believed to continue.

- 47-
This means that for many of the firms salary differences for the white collar groups are not incorporated,and even if incorporated,it is not believed to be relevant in the long run.
For the blue collar group wage differences are incorporated in almost all cases - however, for this group too, the management of the firms do in general not believe in these differences in the long run.
Individual differences in stability of the labour force are even more difficult to incorporate. As discussed the average costs due to illness measured in relation to total wages are 0.5 per cent higher in Copenhagen than in the provinces and this in fact is negligible. Whereever possible the individually experienced differences have been incorporated.
However, in general the firms which have relocated production plants during the recent years (METAL1, EQUIPMENT1, EQUIPMENT2, ELECTRIC4) do not seem to have experienced a significant quantifiable increase of labour stability, or at least the general conclusion seems to be that a possible increase in stability seems to have been corresponded by a decrease of productivity due to a less industry minded labour force. One exception from this is TEXTILE1 for which the following figures of individual est~blishments are available:
Absence Average employment period
Copenhagen 9.2% 5 months
The provinces 2.6% ?
SDA 2.4% 5 years
Table 4.5. Labour stability for individual establishments of TEXTILEl.
This actually involves differences in wages between Copenhagen and SDA of 14 per cent due to instability of workforce (illness and labour turnover).
Finally possible differences in efficiency have only been incorporated by PRINTING1 - the reason being actual differences in the manning standards for the same machine in the provinces and in Copenhagen. In fact for this firm more than half the savings of the provincial location are due to this factor.
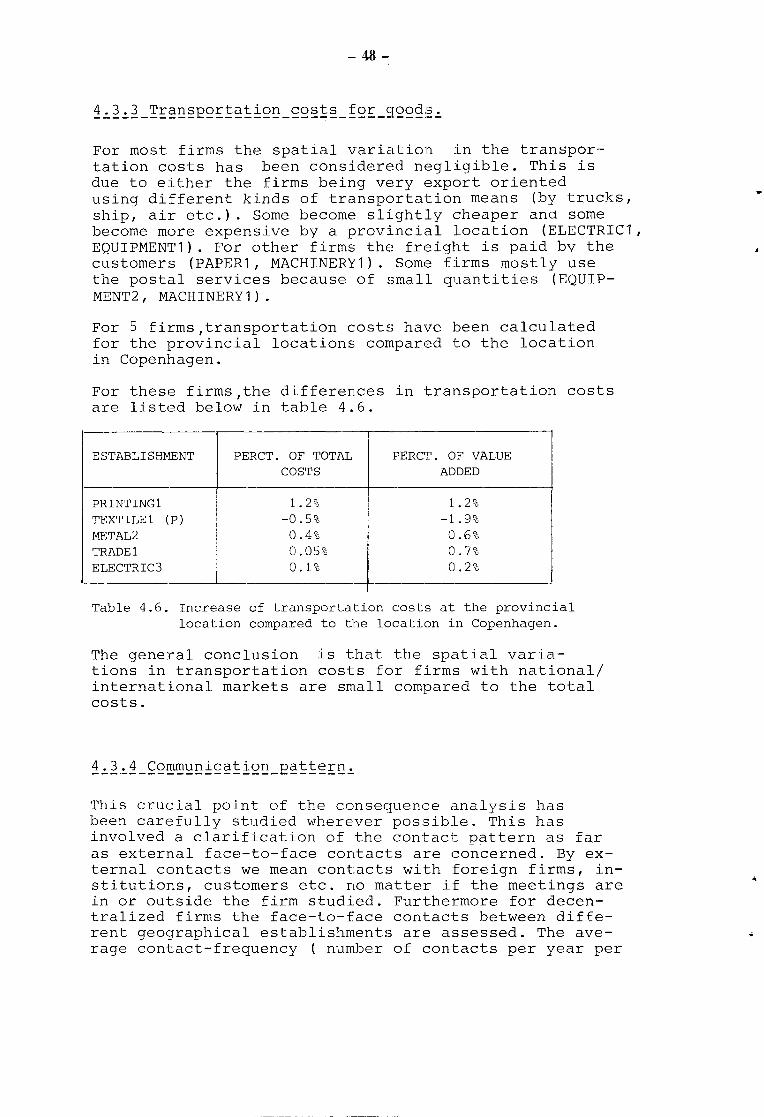
- 48-
For most firms the spatial variation in the transportation costs has been considered negligible. This is due to either the firms being very export oriented using different kinds of transportation means (by trucks, ship, air etc.). Some become slightly cheaper and some become more expensive by a provincial location (ELECTRIC1, EQUIPMENT1). For other firms the freight is paid bv the customers (PAPER1, MACHINERY1). Some firms mostly use the postal services because of small quantities (EQUIPMENT2, MACHINERY1).
For 5 firms,transportation costs have been calculated for the provincial locations compared to the location in Copenhagen.
For these firms,the differences in transportation costs are listed below in table 4.6.
ESTABLISHMENT PERCT.
PRINTING1 TEXTILE1 (P) METAL2 TRADE1 ELECTRIC3
OF TOTAL COSTS
1. 2% -0.5%
0.4% 0.05% 0.1%
PERC'I'. OF VALUE ADDED
1. 2% -1.9%
0.6% 0.7% 0.2%
Table 4.6. Increase of transportation costs at the provincial location compared to the location in Copenhagen.
The general conclusion is that the spatial variations in transportation costs for firms with national/ international markets are small compared to the total costs.
This crucial point of the consequence analysis has been carefully studied wherever possible. This has involved a clarification of the contact pattern as far as external face-to-face contacts are concerned. By external contacts we mean contacts with foreign firms, institutions, customers etc. no matter if the meetings are in or outside the firm studied. Furthermore for decentralized firms the face-to-face contac-ts between different geographical establishments are assessed. The average contact-frequency ( number of contacts per year per

- 49-
employee) varies from 1 to approximately 50 in the different establishments. As could be expected the decentralized production plants (ELECTRIC1 (P) , TEXTILE1 (P) , ELECTRIC2 (P), EQUIPMENT1 (P)) have very small face-toface contact frequencies. The average contact frequency of these ~roduction plants is 1.5 contacts per employee per year. Furthermore most of these face-to-face contacts are with the head office.
This furthermore shows that even the contact frequency between the head cffice and the production plants is quite small (at least for these four firms). This implicates that, in general, the communication aspect should be no barrier for decentralization (at least as far as the consequences can be expressed quantitatively).
Significantly high contact frequences are found for head quarter functions and service firms. In table 4.7 below we have listed those headquarter functions of manufacturing firms and the service and trade firms for which a detailed assessment of the communication pattern has been made.
For some of the manufacturing firms the headquarter functions are located together with production functions. For these the headquarter functions have been isolated and the contact pattern for these has been estimated. The contacts per employee are consequently measured only by employees of headquarter activities, i.e. administration, economic, R&D, sales/marketing, edp, purchase etc.
For the service and trading firms the contact pattern has been aseessed for the whole firm/establishment.
Although from a locational point of view the face-to-face contacts outside the firm are of greatest interest, the contacts inside (with externals) have been assessed as well. This is due to the fact, that a relocation from Copenhagen to the provinces might cause a transformation of meetings in the firm to outside firm meetings (e.g. face-to-face contacts with customers).
However, face-to-face contacts outside the firm are of the greatest interest. As can be seen, these vary from 8 to 22 face-to-face contacts per man per year for head-· quarter functions of manufacturing firms (not including internal contacts with other establishments). It is quite difficult to identify any correlation between the differences in contact frequenciesfor these headquarter functions and the firm characteristics.

Table 4.7: External contacts for headquarters of manufacturing firms and service and trading firms. (Number of contacts per man per year) .
MEETINGS OUTSIDE THE COMPANY !MEETINGS INSIDE THE COMPANY LOCA-~~---------------;----------------~-----.----~----+-----------------T-----------------T-----r---~----~
CASE TION l J COPENHAGEN THE PROVINCES FROM COPENHAGEN FROM THE PROVINC. A- OTH. TO- I OTH. TO-
CUST. SUPPL. OTH. CUST.I SUPPL.IOTH. BROAD EST. TAL CUST.I,'suPPL.I OTH. CUST SUPPL.I OTH. ~OAD EST. TAL
ELECTRIC1 COPENH 0.5 1.5 6.5 ----- 0.2 --- 8.1 3.2 20.0 9.0 -- 10.2 4.8 --- 10.8 0.6 35.4 '
SERVICE1 COPENH 5.5 - 0.5 5.1' - ! - 0 1.9 13.0 ? ? 0 - ? I i
TEXTILE COPENH 4.6 1.1 8.0 0.6 i 1.1 0 4.6 8.0 28.0 ? 1.1 0 5.1 (6.2)
I METAL2 COPENH' ( 2. 0) 4. 4 ( 1. 0) 0. 5 0. 2 I 0 1. 2 0 8. 3 ( 0. 2) 0 ; 0 ( 0. 3) I 0 ! 0 0 0 0. 5
I
SERVICE2 COPENH 24.4 0 1.8 1.6 i 0 (' 0.4 2.6 30.8 11.7 I 0 (3.2 0.6 I 0 l 0.5 0 16.0
I i ,.,, I '
I T-Rl\I)E1 ___ . COPENH 0.2 1.6 0.6 1.0 I 0.3 I 0 1.0 "'~.4 12.1 1.2 I 15.4 0 ---- 7.7 --- 5.5 0 29.9
I~~~~:=~~ : SDA 1. 7 0 0 . 5 1. 2 I 0. 1 I 0 6. 7 0 10 . 1 1. 3 0 . 1. 7 2 . 0 ' 18. 3 ' I 0 113 . 3 I !;':,2Ul.Jo-'!VJ..t:,!~l. L COPENHI 7. 1 1. 1 1. 5 4. 4 0 0 2. 1 3. 3 19.5 4. 8 0 2 ---- --- - 0. 3 1. 6 0. 8 9. 5
ELECTRIC3 COPENH 1.6 7.6 2.8 0 7.6 0 2.4 13.2 35.2 0.4 ----- 3.2- ------- 0.4 ---- 1.2 4.4 9.6
ELECTRIC4 SDA 5.1 o.s 1.6 o.8 j o o .. 5 3.3 3.3 15 .. 5 2.4 o.9 jo.8 o.5 I 0.4 Jo.9 2.7 2.7 11.3
~----~~RAGE'~- 5.2 1.8 _L_~· 5 ~~5 l ~· 9
0 3.0 4.3 [19.3 i 3.9j-4.7 -~-- 2.1 -- j3,0 j 1.4\14,6 i
1) CUST.: Customers 2) Arrangement of exhibitions in shops. SUPPL.: Suppliers OTH.: Other ( ) :Uncertain figures.
OTH.EST.: Other establishments in DK .
..
~ 0
I

•
-51-
However, there might be a tendency for real concerns (TEXTILE1) to have relatively higher contact frequences. Furthermore there might be some evidence in province located headquarter functions having lower contact frequencies than Copenhagen located firms. This would be in agreement with English and Swedish studies indicating that firms change contact pattern by relocation from metropolitan areas to more rural areas. One aspect of this is a reduced frequency of face-to-face contacts. SERVICE1 has 11 face-to-face contacts outside the firm per man per year and SERVICE2 has 24 external contacts. In general, contact frequency exceeds for many service firms that of the headquarter functions of manufacturing firms. The reasons for this being that face-to-face contacts for service firms to some extent substitute transportation of goods for manufacturing firms. Furthermore many corresponding contacts of manufacturing headquarters will be internal.
For the trading firm (TRADE1) the external contact frequency outside the firms is quite low, namely, around 5 per man per year. The reason for this is probably that this kind of firm (wholesale trade) carries out most external contacts as meetings inside the firm. TRADE1 has the largest external contact frequency inside the firm. In average, for both manufacturing headquarters and service and trading firms the external face-to-face contact frequency is 15.0 contacts per man per year. 3.0 contacts or 20 per cent are contacts abroad (in average more than 50 per cent of the turnover of these firms are export) .
The domestic contacts outside the firm add up to 12.0 per man per year. 6. 7 contacts (, 56 per cent) are contacts with customers and 2.7 (·~ 23 per cent) with suppliers, leaving only 22 per cent to other types. For the firms involved the contact frequency with customers is much higher for Copenhagen customers than provincial customers. This is to some extent due to the great contact frequency of SERVICE2 with Copenhagen located customers. This firm (a consulting engineering firm) has several branches in the provinces. Therefore the Copenhagen headoffice only need to visit few provincial clients.
Turning to external contacts inside the firm it seems as if these in average are just a bit smaller than contacts outside the firm (13.2 per man per year). If we exclude ELECTRIC1 for which the external contact frequency inside is believed estimated too high, the external contact frequency for manufacturing firms varies from 0.5 to 13 per man per year, i.e. in general smaller than contacts outside the firm.
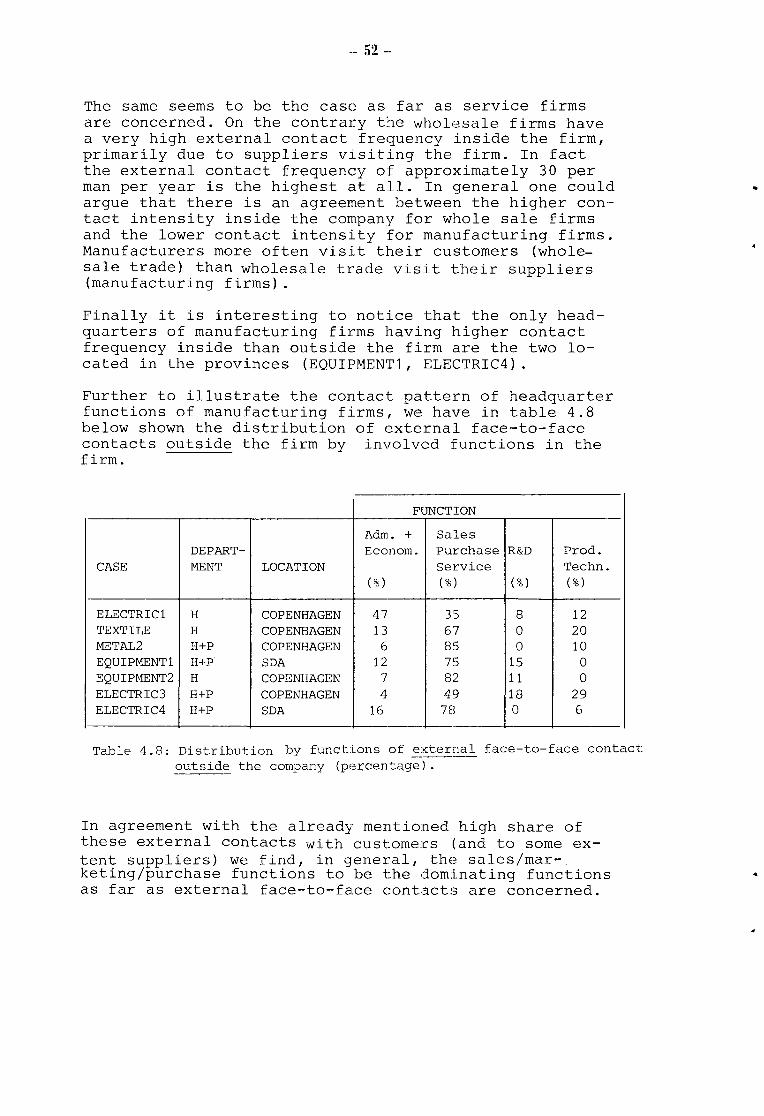
-- 52 --
The same seems to be the case as far as service firms are concerned. On the contrary the wholesale firms have a very high external contact frequency inside the firm, primarily due to suppliers visiting the firm. In fact the external contact frequency of approximately 30 per man per year is the highest at all. In general one could argue that there is an agreement between the higher contact intensity inside the company for whole sale firms and the lower contact intensity for manufacturing firms. Manufacturers more often visit their customers (wholesale trade) than wholesale trade visit their suppliers (manufacturing firms).
Finally it is interesting to notice that the only headquarters of manufacturing firms having higher contact frequency inside than outside the firm are the two located in the provinces (EQUIPMENT1, ELECTRIC4).
Further to illustrate the contact pattern of headquarter functions of manufacturing firms, we have in table 4.8 below shown the distribution of external face-to-face contacts outside the firm by involved functions in the firm.
DEPART-CASE MENT
ELECTRIC! H TEXTILE H METAL2 H+P EQUIPMENT! H+P EQUIPMENT2 H ELECTRIC3 H+P ELECTRIC4 H+P
LOCATION
COPENHAGEN COPENHAGEN COPENHAGEN SDA COPENHAGEN COPENHAGEN SDA
Adm Eco
(%)
47 13
6 12
7 4
16
Fl
+ nom_
JNCTION
Sales Purchase R&D Prod. Service Techn. (%) (%) (%)
35 8 12 67 0 20 85 0 10 75 15 0 82 11 0 49 18 29
7El 0 6
Table 4 _ 8: Distribution by functions of external face-to-face contact: outside the company (percentage).
In agreement with the already mentioned high share of these external contacts with customers (and to some extent suppliers) we find, in general, the sales/marketing/purchase functions to be the dominating functions as far as external face-to-face contacts are concerned.
..
•
-53-
In fact for ELECTRIC1 with a high share on the administration etc. the general manager has many customer contacts.
It is striking how relatively few external contacts are left then for the administration and the R&D functions.
Generally R&D functions are believed to be very contact intensive. The results of this study indicate that as far as external face-to-face contacts are concerned the R&D functions are not very contact intensive. However, many of these contacts might be by phone and male. Anyway - as might be expected - there seems to be a correlation between the share of contacts made by R&D function and the R&D level of the firm (expressed by R&D costs as a share of value added - (see column 16 of table 4. 2) ) .
We have up to now been dealing only with the quantitative aspects of the communication pattern, which is of main interest for the consequence analyses. However, seen from a location point of view, the qualitative aspects of the communication pattern seem to be of even greater importance and is, in fact, as discussed in paragraph 4.3.9.1 a crucial aspect of the operating conditions in the provinces compared to the Copenhagen Metropolitan Region.
As previously discussed the difference in communication costs due to face-to-face contacts between two locations is estimated by estimating travel time needed and travel expenses at each location. Travel time is transformed to costs by multiplication by a cost factor of 100 D.kr. per hour of travel time.
An important point to evaluate is to which extent the communication network changes by relocation. As mentioned, English and Swedish studies indicate a reduction of the face-to-face contact frequency (substitution by other communication media and a transformation of local type contacts to the new local community). In this study we have only transformed such local contacts which obviously will be transformed to.the new local community. This might involve an overestimation of the external contact frequency outside the firm in the provinces - on the other hand many firms have mentioned that some contacts which take place inside the firm at a Copenhagen location could possibly be transformed to outside contacts at a provincial location (contacts with customers living in Copenhagen (or abroad)).

-- 54-·
For some service firms external contacts outside the firm may be paid either by themselves or by their clients (business service) . For SERVICE2 only half of the contacts outside the firm are paid by the firm itself.
In general communication costs for face-to-face contacts calculated in this way seem to involve the following maximum extra costs at a provincial location compared to a Copenhagen location (for the firms investigated) :
Headquarter of a manufacturing firm
Service firm
PCT. OF VALUE ADDED
1.8%
5.9%
Table 4. 9: Maximum extra communication cosi:s at a provincial location compared to a location in Copenhagen.
It seems as if there are no significant scatial variations in communication costs for non face-·to-·face contacts of the firms involved.
4.3.6 Rent.
Two different procedures of calculatin<J rents at alternative locations have been employed:
1) Building rents at the alternative location can be found by contacting real estate agents etc.
2) Prices of land can be found by contactinq local municipalities and building costs by building companies. On this basis the rent can finally be calculated as the interest rate multiplied by the total investments and adding taxes etc.
In general the procedure 1) will result in higher costs and biaaer absolute differences between different location than procedure 2) ~ If we look at 6 cases for which 1) has been employed we find the following rent figures (excluding possible effects of regional development aid)
..
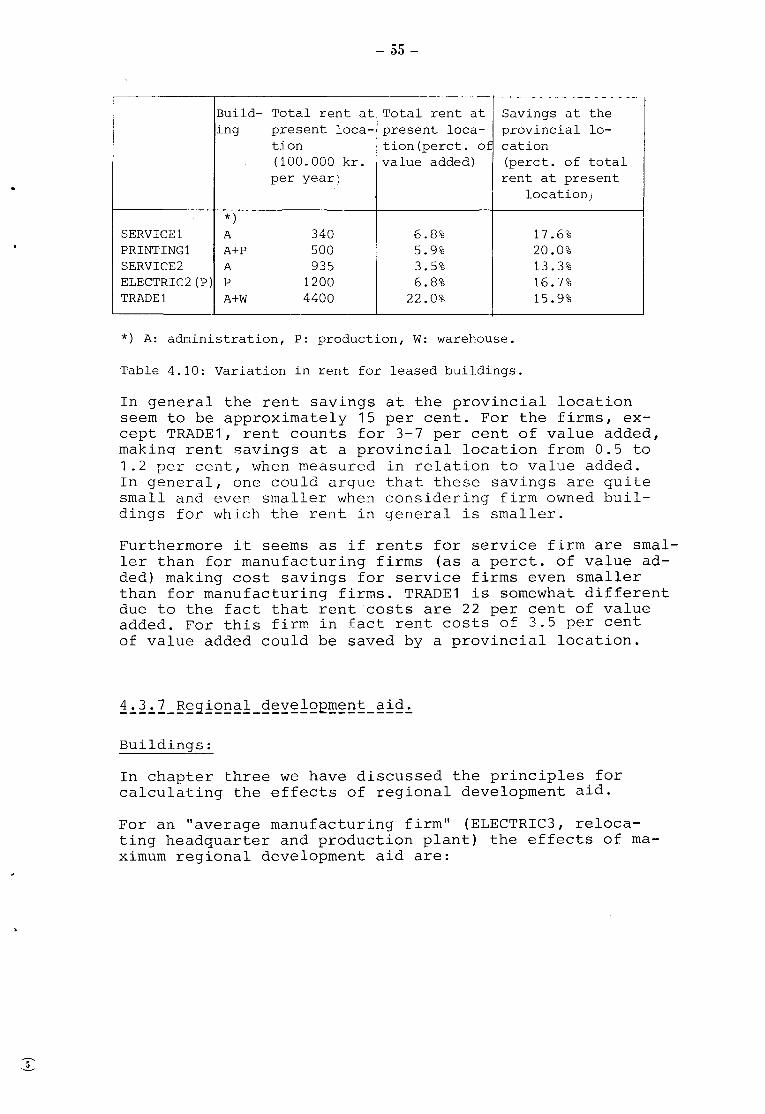
-55-
Build- Total rent at Total rent at Savings at the ing present loca- present loca- provincial lo-
tion tion(perct. of cation (100. 000 kr. value added) (perct. of total per year) rent at present
location;
*) SERVICE1 A 340 6.8% 17.6% PRINTING1 A+P 500 5.9% 20.0% SERVICE2 A 935 3.5% 13.3% ELECTRIC2(P) p 1200 6.8% 16.7% TRADE1 A+W 4400 22.0% 15.9%
*) A: administration, P: production, W: warehouse.
Table 4.10: Variation in rent for leased buildings.
In general the rent savings at the provincial location seem to be approximately 15 per cent. For the firms, except TRADE1, rent counts for 3-7 per cent of value added, makinq rent savings at a provincial location from 0.5 to 1.2 per cent, when measured in relation to value added. In general, one could argue that these savings are quite small and even smaller when considering firm owned buildings for which the rent in general is smaller.
Furthermore it seems as if rents for service firm are smaller than for manufacturing firms (as a perct. of value added) making cost savings for service firms even smaller than for manufacturing firms. TRADE1 is somewhat different due to the fact that rent costs are 22 per cent of value added. For this firm in fact rent costs of 3.5 per cent of value added could be saved by a provincial location.
Buildings:
In chapter three we have discussed the principles for calculating the effects of regional development aid.
For an "average manufacturing firm" (ELECTRIC3, relocating headquarter and production plant) the effects of maximum regional development aid are:

Ordinary development area (7!% loans)
Special development area (20% investment grants and 7!% loans)
·- 56 --
Savings as a pet. of to1tal rents
13.8%
20.9%
Table 4.11: Effects of regional development aid for buildings. ELECTRIC3.
This means that with rents generally accounting for 6 per cent of value added the effects of regional development aid to buildings amounts to 0.8 per cent (ordinary development area) and 1.25 per cent (special development area) of value added.
Machinery:
The effect of regional development aid for machinery dependent on the capital intensity of the firm.
The firms for which these effects have been calculated (ELECTRIC1, TEXTILE1, METAL2 and ELECTRIC3) show that the effects of regional development aid for machinery amounts to 10-50 per cent of tthe effects of regional development aid for buildings, making the average effects of total regional development aid for the firms investigated:
Ordinary development area
Special development area
Savings as a perct. of value added
1.1%
1. 7%
Table 4.12: Average effects of regional development aid for buildings and machinery for the firms investigated.
To this it can be added that some less quantifiable effects of the regional development aid such as improved liquidity of the firm may be of importance (see paragraph 4. 3. 9) .
-57-
Only for one firm (TEXTILE1) other quantitative operating costs have been considered of significance when comparing different locations. This firm uses a lot of water for cleaning purposes and has included differences in costs of water in the consequence analysis.
Adding up all operating costs which are different at the provincial location from those of the Copenhagen location result in the figures of column 27 (excluding regional development aid) and column 28 (including regional development aid) of table 4.2.
It should be noted that savings which might be due to the relocation itself are not included - these will be discussed in paragraph 4.3.10.
The figures of column 27 and 28 consequently illustrate differences in "operating conditions" (where these can be quantified) between a provincial and a Copenhagen location (with and without regional development aid).
~~~~2~l_Q!~~~E~~£~§-~~-2E~E~~!~~-£2§~§L-~~£1~9~~~-E~~!:
2~~1_9~Y~12E~~~~-~!9~
The difference in operating costs between the location in the provinces and the one in Copenhagen is shown in column 27 of table 4.2.
In general operating costs at the provincial location seem to be from 6 per cent smaller to 5 per cent bigger than those of the Copenhagen location when calculated as a percentage of value added. If cost differences are calculated as a percentage of total costs the variation seems to be from 3.6 per cent smaller to 3 per cent bigger operating costs in the provinces compared to Copenhagen.
One exception from this is PRINTING1, for which the savings at a provincial location amount to 10.7 per cent of value added - however more than half of these savings
-58·-
are due to differences in the manning standards which are not of a general nature. Differences which, anyway, are not believed to remain in the long run.
In general the service firms and the headquarters are the ones for which the costs of the provincial location are equal to or bigger than those of the Copenhagen location.
It should be noticed that due to different calculation methods from case to case one should not place too great emphasis on the very exact figures of each case.
The overall conclusion for these firms with a national/international market is that:
Total operating costs do not in general vary considerably over space.
Of course savings up to 5 per cent of value added ( N 2-3 per cent of total costs) might for the individual firm improve the profit considerably and consequently be of great importance. However taking into account:
- The large uncertainties in estimating the operating costs of the new location.
All kinds of uncertainties involved in a relocation.
all the firms involved in the study have expressed that savings have to be higher by themselves to ~otivate a relocation.
So a more elaborated conclusion would be:
Taking into consideration the uncertainties of the computing method, the many non-quantifiable factors, and, in general,the uncertainties involved in a relocation the possible savings of a provincial location, in general, are not by themselves of sufficiant magnitude to totivate a relocation.
This is due to rather limited differences in spatial variations of wages and salaries, rents, transportation costs and communication cost.s. Furthermore these costs do only account for a certain share of the total costs of a firm. (Other costs like fixed costs, purchasing costs etc. in general do not vary over space). Final-

-59-
ly a reason for the limited variations is the fact that, in general, wages and costs are smaller in the provinces while communication and transportation costs in many cases are higher - the net result being differences in these types of costs outbalancing eachother.
In fact these conclusions about small spatial variations of total costs seem to be of general validity, also for other firms than the metropolitan oriented firms. However, exeptions from this might be firms with local markets, very raw material dependent firms or firms with extreme high share of total costs being wages for unskilled low paid workers.
However, still there are spatial differences and we shall in the following try to describe some correlations between cost variations and some characteristics of the firms.
In figure 4.13 below we have plotted net savings at the provincial location as a function of the number of faceto-face contacts per man per year. (Contact frequency). The net savings for PRINTING1 have been adjusted for the special savings due to differences in manning standards.
Net savings in the province~
% of ~.Gr1uipment 2 (P) value rOth.Man.l added 1 [Electric 3
e Machi .1ery 1 +6 .
e Text_.ile (P)
• 4 Equipment l
+ 2 ~-. i-'l.etal 2 Printlng l Electric 2 (P)
0 ElGctric 4 (H+P) e Service 1
-2
-4
• Building 1
Electric .J (M)
• • Electric 1
• Service 2 -s~--------~----------~----------~----------~--------~~--30 l.o so-10
No o .C cor.·:.:act~.:;
t-'e.r '!Eln per year
Fig. 4.13 Net savings as a function of contact intensity.
-60-
For the manufacturing firms there seem to be a negative correlation between contact frequency and cost savings at a provincial location. MACHINERY1 has a somewhat bigger net saving than it's contact frequency allows for. This is primarily due to the fact that almost all blue collar workers of this firm are skilled, this group having the largest differences in wages between the provinces and Copenhagen.
Furthermore there seems to be a corresponding correlation as far as the service firms are concerned~ How-ever the service firms have smaller net savings than the corresponding manufacturing firms. This is due to the fact that in general there are not as big wage savings for service firms and the increase of communication costs at the provincial location are bigger.
Finally it should be noticed that the wholesale trade firm {TRADE1) has larger net-savings than manufacturing firms of similar contact frequency.
The reason for this is primarily that the rents acount for 22 per cent of the total value added making savings in rents very important. Furthermore most of the external contacts for TRADE1 are carried out in the house.
Due to the fact that most external face-to-face contacts are taken by white-collar employees it should be expected that there is some interdependence between percentage white-collar employees and savings.
In figure 4.14 below this interdependence is shown for all manufacturing firms. For the service firms and the trading firms, it has in general no meaning to discuss this, because the white-collar share usually is close to 100 per cent.
The interdependence between white-collar share and savings does not seem to be quite as strong as in the case of contact intensity.
However, it looks as if a description of cost savings as a function of both external face-to-face contact frequency and white collar percentage is quite good.
In figure 4.15 is furthermore a plot of the savings versus the output per employee measured by anual value added per employee.

-61 -
Fig. 4.L4 ll'et savings as a function of white collar employment
Net savings in tl-re Provinceseo Ofvalueadded
+6
Textile I (P)
r Eguirrment 2 (P)I o -t";a-clrinerv I| ,- Oth. man . I'lt o Erectric 3
- Equipment I
+1
+/
Pri-n-tincr I O
oEl.ectric2 (P)
jElectric 4 (!I+P)O l'letal 2
O Paper I
O ElectricO Electric 1(H)
4 (rq)
90 o0Per cent white-collaremployment
Net savinqs in the Provinces1'', Ci:va Lueadded
+6
+L
+2
Oth.l,lan l.Electric 3 I
I
Equipment I O a
O l'{ac}r'inerlz
.O Textile f (P)
j Trade IElectric 4 a
?I
D'letal 2 J
O Service 2
l Printing :l-
Paper IBuilCing
O Service 2
200
Value aclded Per emPloyeeper year ('000 Kr. )
150
tr-i.g. 4.L,.s iriet sevings as a frrnct-i.on of output per employee '
- 62-
Again there seems to be a correlation which means that higher output per man corresponds to smaller savings. This of course is due to the fact that in general for manufacturing firms higher output per man means higher degree of capital intensity (lower labour intensity) and consequently smaller advantages from lower wage level. Again the service firms seem to follow a corresponding interrelation, but at a smaller savings level.
For service firms higher output per man could be explained by higher educational level and therefore higher contact intensity and consequently smaller savings.
Of almost the same interest as these interdependencies identified is that there seems to be no correlation between size of savings and:
1) R&D level (expenses and share of value added).
2) Varia0ility of the firm.
3) Market characteristics (number of brands and market transparency) .
In a Swedish study (R. Back et.al., 1970) the conclusions are:
1) High R&D level is positively correlated with high probability of a Metropolitan location.
2) High vairability is positively correlated with high probability of a Metropolitan location.
The present study seems to indicate that the above mentioned findings are not due to exceptional advantages seen from a direct cost point of view of the Metropolitan Region for these types of firms/establishments.
Finally it should be noted that there seem to be a positive correlation between:
High R&D level, high exports and high variability
but no correlation between these factors and the market characteristics.

- 63-
When considering the figures of column 28 (table 4.2) taking regional development aid into consideration the maximum net savings of a provincial location seem to be improved from around 7 to around 9.5 per cent of value added.
The effects of regional development aid vary from 0.2 to 4.3 per cent of value added and as could be expected there seems to be a correlation between high effect and high value added per employee (i.e. high capital intensity).
Effects of more than 2.3 per cent of value added seem only to be met if the firm replaces the whole machinery by new machinery (TEXTILE1 (P)) or if the production is very space consuming (METAL2 and to some extent ELECTRIC4).
However it should be noted that in some special cases, like TEXTILE1, the effects of regional development aid increases the savings of a provincial location to a level which really becomes interesting to the firm (10 per cent of value added}.
Before turning to a discussion of relocation barriers (not affecting the fundamental question of long term mobility) we shall complete the consequence analyses of the operating conditions in the provinces compared to Copenhagen, by referring the non-quantitative differences in living conditions as they are described in the case studies.
First of all it is important to underline that the concept "non-quantitative factors" does not mean that these factors have no effect on costs or turnover. The below discussed factors are called non-quantitative because it is impossible (or at least very difficult} to quantify their effects, in fact it is argued that some of them might have considerable effects as far as the turnover is concerned. Many non-quantitative factors (including the later discussed relocation barriers} primarily might have an effect on the turnover, i.e. the market opportunities, while the discussed quantitative factors mostly influence the operating costs of the firm.

- 64-
The main non-quantitative differences in operating conditions are:
1) The nature of the external contact network.
2) Availability of highly skilled and educated labour.
3) Non-quantifiable effects of a stable labour force, local environment etc.
4.3.10.1 The nature of the contact network. -------------------------------------------Two studies (Goddard et.al., 1976) and (Thorngren, 1973) suggest the following model of the contact pattern between an organization and its environment:
The most significant information flows in a qualitative sense are those connected with long term scanning of the knowledge and values in the environment so as to identify future possibilities and alternatives. These socalled "orientation processes" involve t:ypically the highest level decision makers, in wide ranging discussions. It is at those occasions that individuals are likely to widen their contact network. The advantage of a Metropolitan centre is that it offers a variety of contact opportunities.
Since these types of contacts do not always involve deliberate search they depend heavily on the individual just happening to be in the right place at the right time.
Other processes and related information flows are concerned with the investigation of specific alternatives which have been identified through the long term orientation processes. Such activities as research directed towards the development of specific products or projects for the intermediate future can be classified as belonging to the "planning processes". F'inally the so.,._ called "programming processes" involve a. large volume of routine communication concerned with day to day control of on-going processes, i.e. the matters to be dealt with occur in a regular basis and standardized decision procedures can be applied. According to this the external contacts can be divided into three types: (i) orientation, (ii) planning and (iii) programmed type of contacts.
- 65-
Orientation type of contacts are primarily taken by higher decision makers and will deal with sales activities as well as long term planning etc., planned contacts are typical for R&D functions (and some sales functions) and programmed contacts are typical for production, purchasing, control and similar functions.
Goddard concludes that while programmed and to some extent planned contacts are suitable for other contact media than meetings (telephone, mail etc.) orientation type contacts ar~ always face-to-face contacts. Furthermore it is confirmed that for offices having relocated from London, orientation type contacts play less of a role than for the offices located in London.
These findings are confirmed by this study in the way that we have shown that the external face-to-face contact frequency is low for production functions and fairly low for R&D functions, while most external face-toface contacts are taken by administration and especially sales/marketing functions.
The same studies as referred to above have furthermore shown that the contact pattern changes by a relocation (the contact medium is transformed and some contacts are substituted by others).
Therefore there seems to be a risk of especially orientation type contacts being transformed or substituted or not taking place at all. These contacts not being planned means a risk of "not being in the right place at the right time". The result might be loss of contacts which might influence the turnover of the firm in the long run (loss of sales/new markets and products). The other contact types tend to be planned/controlled and often with the firm as the active part and the economic consequences of maintaining these have been calculated.
The kind of orientation contacts which seem of greatest interest in this context are the market oriented contacts (sales or ideas of new sales possibilities, new markets, new products). In most cases these contacts will involve general managers, some sales/marketing people and in some cases the head of the R&D department. However, R&D people get most of their informations about the market by contacts to own sales/marketing people.
In order to go deeper into the discussion of market oriented contacts we shall make the following destinction of products into:
Brands/well defined products or Tailored/poorly defined products.
- 66-
For a firm producing and selling brands/well defined products/services the sales and marketing activities take place within well defined channels and often planned by the firm itself. The sales activities might be very person oriented (face-to-face contacts) - however, commonly the sales situation w:ill be well planned (with the firm as the active part) . The sales process for those types of firms could be classified as planned or even programmed. Consequently these types of sales contacts may easyly be maintained after a relocation (although it might be more expensive).
For firms producing/selling tailored/poorly defined products it is different. For these firms informal contacts, not planned as proper sales contacts, will often be of great importance for sales and product development (ideas of new products, customers etc.).
The turnover of a firm of this type might be seriously affected by a complete change of contact pattern by a relocation.
This is at least true for SERVICE1 and SERVICE2 (and in general for many business service firms), PRINTING1 PAPER1 and MACHINERY1.
PAPER1 and MACHINERY1 (and to some extent PRINTING1) have a high degree of physical binding to the market (i.e. to some extent a local market), probably partly due to their product type. These are difficult to move for physical reasons.
Wholesale firms (f.ex. TRADE1) are very dependent on selling the "best" products and are to some extent dependent on the "right" supplier contacting the firm (most external contacts take place inside a wholesale firm) . Foreign suppliers coming to Denmark most often start in Copenhagen.
In general one could then argue that a wholesale firm is more dependent on a Copenhagen location the greater imports and the greater share of contacts with suppliers.
Finally it should be noted that there does not seem to be any correlation between the quantitative contact frequency and this qualitative definition, i.e. the contact frequency of a firm does not tellwhether or not the firm is Metropolitan depentent from a cont~act point of view.

- 67-
~~~~lQ~~-~Y~!1~~!1!~y_Q~-~!g~1Y_§~!11~~-~~~LQ~-~~~~~~~~ labour.
More than half of the firms investigated have at least one department located in the provinces. At least two of these firms (ELECTRIC1 and EQUIPMENT2) have experienced some difficulties in attracting highly educated people in a SDA. Apart from these it looks as if certain small and specialized skilled occupational groups might be difficult to attract outside a few cities (including Copenhagen) . It has not been possible in this study in any statistically representative way to investigate this subject further. However, it seems as if lack of highly skilled or educated labour might be a non-quantifiable disadvantage for some firms at some provincial locations.
~~~~1Q~~-~Q~:g~~~~!!!~~1~-~!~~~~§_Q~-~-§~~~1~-1~~Q~~ ~Q~~~L-1Q~~1-~~Y!~Q~~~~~-~~~~
The general non-quantifiable advantages of a stable labour force has been mentioned in many cases - however, it has not been specified further (for a more detailed discussion, see the preliminary studyl.
4.4 Relocation barriers.
Under this heading we shall include two main concepts:
1) Positive relocation effects.
2) Negative relocation barriers.
4.4.1 Positive relocation effects. ----------------------------------In the consequence analyses we have considered differences in operating costs between a location in the provinces and one in Copenhagen.
However, for some firms there might be further significant reductions of the operating costs by a relocation. These effects which are due to the very act of relocating and not to the location itself are called positive relocation effects.

-- 6n-
These might be:
1) Improvement of production lay-out and technology which is not possible at the existing location because of the buildings. These improvements could involve savings in labour etc.
2) Changing of organization (norms, structure, personnel etc.).
For many firms actually needing a new organizational structure (including new norms/new people) this might be difficult (almost impossible) to carry through at the existing location. When relocating (at least over some distance) it often becomes more "legal" to implement changes.
For three of the investigated firms significant positive relocation effects have been incorporated. In fact the net savings due to these positive relocation effects increase from 3.5 to 10 per cent of value added. For the three firms these positive relocation effects are of significant size and makes a relocation attractive. In fact one of them has relocated (ELECTRIC2(P)) and one is considering a relocation as a result of our investigations (BUILDING1).
The positive relocation effects for the three firms are:
TEXTILE1 (P)
BUILDING1
ELECTRIC2(P)
Complete new machinery and new plant lay-out involving cost savings of 5 per cent of value added.
Organizational changes by centralizing and by reduction of employees not possible at the present location. Net costs savings of 3.5 per cent of value added.
New technology and new norms of manning. Net cost savings of 10 per cent of value added.
The two main negative relocation barriers are:
1) Investments/uncertainty by relocation.
2) Mobility of key-personnel.

-~-
The investment involved in a relocation in general keeps the management away from considering relocation unless the firm is facing more or less acute problems like lack of space, inadequate building lay-out or labour problems (for further discussion see (Kolind & Matthiesen, 1975)).
Taking into account the relatively small spatial differences in operating costs this attitude is from a rational point of view in fact understandable, however as has been proved in the preliminary study most firms do not carry through such consequense analyses.
We shall in the next chapter further discuss this whole matter.
However, seen from a geographical, locational point of view these relocation barriers are only of limited interest, although they are of course very determinent for the actual number of relocations taking place.
This point is of crucial interest for relocations over longer distances. In most of the case studies it has been mentioned as an important non-quantifiable relocation barrier.
In order further to illustrate the attitudes concerning this point, separate investigations have been carried out for 5 of the involved case firms.
The methodology has been described in chapter 3 and before giving the results, it should be stressed that the investigations by no means could be considered as statistically representative. Furthermore the results concerning employees, who have moved together with the firm, of course, are biased because only employees who actually decided to move have been interviewed.
4 of the 5 firms have relocated from Copenhagen to the provinces within recent years (ELECTRIC2(P), EQUIPMENT1, EQUIPMENT2(P) and ELECTRIC4(H)) and for these a total of 16 employees have been interviewed.
The main conclusions are:
In general, most of the key personnel, who have been asked to move are white-collar employees and many are managers. It is remarkable that almost all employees, who have been asked to move in fact did so, and only one has returned to Copenhagen afterwards.

- 70-
The following seem to be the general characteristics of these key employees:
11 out of 16 maintained their function in the firm after the relocation while 5 advanced in connection with the relocation. The people interviewed held a very high seniority. Average seniority the day of relocation was 17 years. About half the persons .interviewed had been trained in the firm. When moving all the int:erviewed were married and most of them had children.
Everybody, who agreed on movin<J, were relatively satisfied with their job. Apart from this, the main reasons for moving together with the firm could be classified into three main groups:
1) The most interesting work.
2) The only interesting work.
3) Other.
The first group consists of employees, who want future pro-· motion in the firm and employees who find it challenging to establish the firm at a new place.
The second group is often elderly employees, employees who have served their apprenticeship in the firm, very speci~lized employees and finally employees, who find it very difficult to find a new job.
The third mixed group expresses a variety of reasons for moving: Realization of the wish of living in the country, possibility of getting a cheap residence, the wish of trying something else, get away from Copenhagen because of divorce etc.
The most important relocation barrier is the employment possibilities at the new place for the partner and the career structure in general. As it becomes more and more common for both partners to have a job, the importance of this barrier is still increasing. For three persons this problem was solved by offering the partner a job within the firm. In one of the cases the partner had to accept a 50 per cent reduction of wages.
Half the interviewed have had housing problems in connection with the relocation or shortly afterwards. It was either difficult to find a new acceptable residence or there were economical problems in connection with the relocation.
Before moving 1/3 lived in their own houses and 2/3 in flats. After the relocation most of them were established in their own houses.
•
- 71-
When questionning whether the persons interviewed had settled satisfactorily, fairly well or not satisfactorily - everyone answered satisfactorily. Except from one, everybody answered that also their family had settled satisfactorily. This positive impression of the possibilities for people to settle down on a new place might be due to the fact that the interviews took place some time after the relocation. Employees, who did not settle down, probably would return, which happened in some cases.
The two main disadvantages of the provinces compared to Copenhagen were found to be:
1) The job possibilities for the partner.
2) The bigger dependence on the firm.
However concerning 2) it was at the same time expressed that the relationship to the firm was equal to or better than in Copenhagen which somewhat weakens this disadvantage. At the same time the management of the firms expressed the feeling of great responsibility to employees who had moved together with the firm.
Finally few were dissatisfied with the fact that the wages gradually were adjusted to the smaller local level.
Beside these interviews of key employees who had moved together with the firm, a questionnaire investigation was carried out. All employees of BUILDING1 were asked to answer the questionnaire of annex 3.4 to illustrate their prior attitudes towards a relocation 6f their firm.
BUILDING1 has two main establishments - one in Jutland and one on Zealand - and the management was actually considering a relocation (a centralization) .
80% of the 39 employees answered the questionnaire, which seems enough to reflect the opinion of the employees.
Employees in Jutland and on Zealand make up two groups of al~ost equal size. However, their characteristics are quite different, which does make the answers not comparable.
The distribution in age for employees in Copenhagen is quite even and the average age is quite high, whereas 15 out of 16 employees in Jutland are under 40 years old. The seniority of the employees in Jutland is smaller than in Copenhagen. Nearly everybody in Jutland has children living at home, which is only the case for half the employees in Copenhagen.

-- n-
The employees were asked to point out which of 14 factors would have non, little or gTeat influence on a possible decision of relocating together with the firm.
The five most important factors influencing this decision seem to be:
•rotal Copenhagen Jutland
39 employee:: ?.3 employees 16 employees
NO % NO % NO %
Continuous occupation in the firm 21 54 12 52 9 56
The natural/cultural envi-ronment 19 49 8 35 11 69
Job possibilities for the partner 19 49 10 43 9 56
Education possibilities for the children 19 49 8 35 11 69
Difficulties in maintaining private circle 113 46 10 43 8 50
Table 4.16: Most important factors influencing the personal decision of relocating togethE~r with the firm.
Most people put emphasize to continuous occupation in the firm. In general, these results support the results of the interview investigation. Analogously we find only very few regarding metropolitan facilities as an important relocation barrier.
There are very interesting answers to the question on where one - if it became actual - would like to move to. Nobody in Jutland state that they would prefer Copenhagen. Some state that they would accept a relocation to a large city in Jutland. Only a few of the Copenhagen employees agreed on moving to Jutland. Some answered perhaps they would. However, it seems as if more people from Copenhagen agree to move to Jutland than opposite.
The small number of people wanting to move long distance together with the firm is not in accordance with the results of the interview investigation of people who have moved. The reason might be that all employees and not only key employees have been asked. It might also be because the employees change their mind when a relocation becomes real.

•
-~-
For some of the case firms investigated the management actually considered a relocation. For these it was possible to study the decision making process while it was
, progressing.
In general the five stage decision making model formulated in the preliminary study (see section 1 .2) was supported and elaborated by the following observations:
ELECTRIC1 .
This firm - having two establishments - had just started considerations of centralizing the firm when the project group got in touch with the management. The cause for investigating this was a wish/demand from the president of the American parrent Company. Although the management already (in agreement with the general decision making model) had chased the main alternative: To stay in the neigbourhood of Copenhagen, the project group succeeded in persuading the management to extend the geographical area for investigations and include locations in SDA's. However in the last stage of the investigations of centralizing,the pressure from the parrent company was lapsed and taking the small geographical differences in operating costs into consideration the management decided to drop the considerations for the time being.
PRINTING1.
This firm considered a relocation because a member of the project group who was making a general analysis of the serious economic problems of the firm suggested also to analyse the effects of a relocation. Together with the location analyses other alternatives like rationalization, new machinery, new planning/control procedures etc. were analyzed and the management decided first to carry these other arrangements through.
METAL1.
This firm also facing economic problems was contacted by the project group who persuaded the management to investigate the act of a relocation as a rescue arrangement. Just before the completion of the analyses the

-U-
firm was taken over by another similar firm and shortly after the two productions were put together.
BUILDING1.
A member of the project group in an earlier analysis of this firm suggested the management to investigate the locational pattern.
The management accepted to participate in this study and after the report was prepared the board decided to relocate the Copenhagen establishment to Jutland and centralize the firm. New offices have just been rented.
A few other firms seem to consider a relocation as a result of this study - however no final decisions have been made.
Conclusively it could be said that in general the firms try to find other solutions to their problems than that of a relocation. This in fact supports the findings of the preliminary study. New findings are however the possibilities of influencing the decision making process, when getting in contact with the firm at an early stage of this process. At least it seems as if the investigated alternatives can be supplemented to include locations in DA's and SDA's (or at least the provinces). Furthermore there are some indications that it under certain circumstances even might be possible to provoke a relocation.
4.6 Final remarks. ------------------After these detailed discussions of the data from the cases we shall in the following chapter turn to elaborate the two main subjects of the study:
Long term mobile firms
Potentially relocatable firms.
•

TABLE 4. 2:
L ;M
H
Low Medium H1gh Data are rdurolly rrissing Data l-os not bl>en collected See above
ELECTRIC 1 (f.!'
ELECTRIC 1 (P) 1)
2. SERVICE 1
3 PRINTING 1
4 TEXTILE (H)
~
0
u Ql VI .D
" U1
2
ihi v;o QJ,t;
ol!! ~:i; d ::J VI z.=
ISIC INO
383 II 2 l
t I 1
832 I 2
31.2 I 1
321 I 1
3 I. 5
~ .. ~
~~e:::F ru > c ·;: _ c
&~ £~' op ~cigL~~ §"8~1! ~Q u..H a..o1 o u T 0/S L/MM
P I S I H
P I 5 I H
5 M
·p 0 M
p 5
TEXTILE ( P) t 1 P S M
5 METAL 1 381 2 P/T S H
•
CHARACTERISTICS OF FIRMS. 6 7 8 9 tl111213
"'~..... z ~ 0:: > ::J -
0 t- 1il '?5 :::- ~ ~ ~ c
5 ~ ~ z 1- g
;; z 0:: ::J ,_
NO Miokr Mio.krl %
• .2
fa i o. oE '0 ~
.. ~"' w i ~;_~g ~ i.g_ ~ 3
Ql
" . :Ca. 0~
i~ zu ".4 NO. I-ll. I NO
1 148131. 17019814013515
+ ' ' t I t I 204 I 13 1191
11. '516 f7 181920
~ ~~c ~ [ '
Jj .Q "E ~ ·- ~~~~- . ~ Elloc~ AI '"QIO E v £ ~ ~o >- ~ .>.. > a.c Ql~~g. <~-6 ;=.§~;go~ ~-~a;Al>A\e .o..,..o~Qia. 0 l a; ~ o E. on .Q § 2 o ~ Ul
ru- a: 1:1 o6 w ot~Q 0 :J 0 :J o~ Cf of 00. ex: ._ a::- > o >a :E ... % Errv% % % L!M.ti H 0/T
88 113 13 186 I H (LIM liD)
6 t I t t t t t
5 5 ltJO I o I 53 5310 110010 0 L L (0)
8 85 i 106 I 21 I 48 913911910 0 L L T
• I • I - I 35 3510110015 • L L
21 22 23 21. 25 26 27 28 29 30 31
s ~ ~r~~ ~0 ~<l_~ ii; ~ ~ , ~ c c: b c "' 0> uo~ u c; .g ! £. ~ 8 8 ~ 8 "' l() <; o ~ G Cl' g E >- ·"'; 'e o 'e ~ o Y t; R ~ ~ c.,g&' ~ 2i E '6 -g
VI - .._Q.I'-EiJ~Ootll- - hJ z ...... E ~ E' ~ ~ ~ ~ "' v; t ~~ c; ~ ~ u ~ ~ § ~ ~ ' ~Qj(;uo tJ:::::Qm~ 0 o-
CD 10 ] z: ~ z a. a.. ~ > c; "'IN 0 N 'iii --' a.. ~ NO. tl() NO NO NO l...IMiH % % % LM/0 PRiO
M I L Po54 ISS I 52 I H l-0.6 ·l-ot. l-0.4 IILMl I (PRJ
t t f 24 f 2 f I • LM IPR
H -1 11-1) I -1 KLMi k 0) 0 --I I I I I I I I I I I
L 1508110 10
0 M I 50 I 5 L 10 7 litO 7 l I 10 7 II o l I I o I
- •1226 i 35 35 L • L 330 I 28 6 L l52l95lti.6ILMIIPRl
L o I • • L I • I • I • I LM I PR , I ~ I ~ !'~~ I ~ I I I I I I I H
6 SUI LDING 1 500 6 s 0 H I 1 t 31. I 7 ~ 20 I g 139 139 I 0 I ~0 12 I I I I 1----- I I I I I I I I I I I I ~ 7 METAL 2 381 1 p OS L I 5 2s 2h 2trol 15 116 53 63 46 I 5
7 LIM I T
L liT I I 20 I L I 360 I 7 I 3
100
• ()() L
0 H 11500138 I 38 I L 119 111911 51. I LM I PR
M I 23 I 6 1 I fij I LM I PR . 8 CHEMICAL 1 1351 I 1 I p I s I H I 1 I 214 I • I • I • I 4751212 I 263 I 4J. I • I ' . . L M I I I L I Few I Few I M • I I I I L~1 I 0
9 SERVICE 2 1832 I 1. I s I o I L I I 27 I 27 I ()() I 18 1175 I 175 I 0 I 100 I 2 I 1 I 100 I L L I T I 0 H 182001 46 I 1.6 I M l-1.6 1{-4'b)i-46 I 0 I 0
SERVICE 3 (HI 1832 I. S 0 I. 1 23 23 100 0 147 11.7 0 100 • ~~ • 1 •
SERVICE 3 ( P) t 1 f t t t t f t t 28 28 0 lXl F~~~ M_~~J ~~!;;; 11 ELECTRIC 2 I H) 383 7 p 5 M lOCO 440 J2 160)21 25 500 • • 33 I • I • I • I L L I T I M L H •
ELECTRIC 2 IP l . f I 1 I P I s I H I 1 I - I - I - I - I 200 I 10 1190 I 5 I o I 0 I - I L L I T M L I 270 I 27 I \ L 125 1125) 11251 LM I PR
12. TRADE 1 610 1 T - M 267 273 20 9 0 182 1/.5 37 80 0 0 - L l 1101 I M L 17600J531i.2~391(3911391 0
111. EQUIPMENT 2(H) 385 (2) - - - 7 12 8 66 37 12 9 3 75 7 7 80 M L T 0 L 309 31.
113 EOUIPMENT 1 3~5 1 p OS H 3 21 13 62 95 155 1.1 114 26 12 15 90 H M 1~01~=- 700 17 5 L 5 6 -~ . ·~
6 I LM
0
PR
r EQUIPMENT 2 IPJ t 1 P 0 H t t t t 4 69 15 54 22 t ... t t t t --.. t 155_,_~0 15 PAPER 1 31.1 1 p 0 HIM 6 18 ·· 61 C 61 18 43 3J • • • L ~ T 0 H • I •
2 EST ~ ... ~J2~j_L_!:: • I L 118 li18ll1.8 IIOi
PR
101
, 16 orH w.N 1 390 1 p o H 1 21. 1e 75 96 159 1.0 119 25 6 6 w MIH M/~ ~ ,.., L zso 6 _!_i -~_j__:_:__~+-~:J LM I PR
f18ELE~~RIC _3__ 383 '2 P S H 1 41 18 1.4 9~ 183 57 126 31 17 13 100 M M ITI - l _ ~75_~.2:_~_1 L ! 5.1 74 7.4 j_LM ~ I19ELEcrRIC 4 IH•P) !383 S~ p 510 H 1 90 36 I[) 50 261. 71 i93 27 2 OS 0 M l T M M -xl64 25 _ 4 rt~ 2 5 5.2 5,2 j~M PR
- ELECTRIC t. 1M 1 + 1 T - - 1 + ., ., t 11. 11. o 100 + ., -t ., t ., t ., 732 s2 s21 t o o o 1~~M 1 PR -- -·- f-·- -- ----- -
20 MACHINERY 1 382 1 p 0 L 1 2 1 9 95 10 11 8 3 27 0 0 - L L T 0 H 100 33 9 l 6 B 16 8) j 6.8 10) 0
---- I i - I '
1) H HEAD 0""CE. P PRODUCTION PLANT, M. MARKETING DEPARTMENT
2) ESTIMATED
I ) . IN COLUMNS 20. 30 AND 31. TO SOME EXTENT. WHILE IN COLUMN 28
REGIONAL DEVELOPMENT AID IS NOT INCLUDED IN THE CALCULATION$
5' CD ~ 1-' !JJ l'i
<.Q CD 0.
rt !JJ tJ 1-' CD
1-'· Ul
(D
~ () 1-' 0 Ul CD 0.
1-'· ~
rt ::r CD
tJ !JJ ()
~
0 HJ
rt ::r CD
l'i (D
'0 0 l'i rt
......:t <:.11
I


- 77-
5. MOBILITY OF METROPOLITAN FIRMS AND FUNCTIONS.
5.1 General remarks. --------------------In this chapter we shail summarize the results of the consequence analyses as to which firms investigated could be regarded as long term mobile and which of these could further be regarded as potentially relocatable. Futhermore we shall try to generalize these findings so as to make conclusions about firm/department types. Finally we shall discuss the decision making process and the influence of some more indirect location factors and the effects of possible future trends.
-· 78-
The two concepts have been defined as follows:
1) A metropolitan located establishment is regarded as long term mobile if the operating conditi-ons for the establishment are equal or better in the provinces as opposed to the metropolitan area.
By operational conditions we mean both the long term (5-10 years) operating costs as far as these can be quantified and the non-quantifiable factors which might influence operating costs as well as turnover.
2) A long term mobile es·tablishment is furthermore regarded as potentially relocatable (regarding a relocation to the provinces) if the relocation barriers (e.g. investmen·ts, ::nobi.li ty of key-employees) are reasonable compared to ·the improvement of operating
In the following we shall discuss each of these two concepts.
According to the definition an assessment of the long term mobility of a firm/department should involve estimation of:
1) Operating costs in the provinces opposed to Copenhagen, as far as these can be calculated.
2) Non quantifiable changes in operating conditions by a relocation to the provinces.
As far as point 1) is concerned 15 out of the 18 tir~s/ establishments investigated will experience operating costs in the provinces smaller than or equ2l to Copenhagen, i.e. they are long term mobile taking only quantifiable factors into consideration.
The only 3 firms/establishment:s which would face bigger operating costs in the provinces are:
- ELECTRIC1 (H)
- SERVICE1
- SERVICE2
..

- 79-
For a fourth establishment (ELECTRIC4(M)) there will be balance in operating costs. Regarding the relatively small increases of operating costs of a provincial location for ELECTRIC1 (H) and SERVICE1 in fact only SERVICE2 will be seriously affected by a relocation to the provinces from a direct cost point of view.
As far as the non-quantifiable operating conditions are concerned it is much more difficult to determine the influence on long term mobility. However, it looks as if the qualitative aspect of the contact pattern (especially as far as market contacts are concerned) is a crucial point.
Firms/departments, which sales opportunities (and consequently the turnover) are very dependent on "orientation type" contacts in general are less long term mobi-le from a qualitative point of view than those which are not.
As far as the firms investigated are concerned, it seems as if the qualitative contact pattern of:
- PRINTING1
- (SERVICE2)
- TRADE1
- PAPER1
- MACHINERY1
to some extent make these firms non-long term mobile.
In fact the firms:
- PRINTING1
- PAPER1
- MACHINERY1
.are firms producing "tailored" products. These firms serve almost only a regional market (Zealand) probably due to the specialized products primarily sold by non-formal contacts with these local firms (high/medium degree of physical binding to the market, column 22 of table 4.2).
If we strictly concentrate on firms with a national/international market these 3 firms therefore should be omitted.
If we do so we can now determine 14 out of the remaining 18 firms/establishments to be long term mobile (see column 30 of table 4.2). The only firms/establishments not being long term mobile are: a pure headquarter function

- 80-
of a manufacturing firm (ELECTRIC1 (H)), two business service firms (SERVICE1 and 2) and a wholesale trade firm (TRADE1), and of these only SER.VICE1 and TRADE1 seem to be seriously affected with respect to operating conditions (quantitatively as well as yualitatively) by a relocation to the provinces.
However, the delimitation of long term mobility should not be regarded as an either/or for a firm/department, but rather we should conclude that the probability of a firm to be long term mobile will gradually decrease by the following firm characteristics:
1) High external face-to-face contact frequency.
2) High share of white collar employment.
3) Strong headquarter functions.
4) Many "tailored" products/services.
5) High dependency on "orientation type" market contacts.
6) High share of total market in Copenhagen, especially for service firms.
7) Low exports.
8) High value added per employee.
Consequently the lowest probability of long term mobility will be found within the following types of firms/departments:
1) Headquarter functions of manufacturing firms, especially firms producing ''tailored" products and not having much exports.
2) Business service firms, especially those with ''poorly defined products" like management consultants, etc.
3) Whole sale trade firms vlith big imports and/or low share of "own" brands.
4) All kinds of firms (but especially service firms) with a high share of total~market in Copenhagen.
The reason for firms with low export being less dependent on a metropolitan location is that the contact frequency for foreign customers is very low compared to customers in Denmark. Having a high export rate means that the local market is correspondingly smaller and thus the proximity to Copenhagen is of less importance.

- 81-
The main findings above could be further allaborated by the influence of the technology employed and the organizational structure.
As concluded in the preliminary study the technology employed is determinent for the possibilities of decentralizing.Some firms find it, because of the technology employed, difficult to separate managerial and production functions. If furthermore the managerial functions, because of the above mentioned factors, are non-long term mobile, the production functions will too be non-long term mobile. Furthermore the technology employed might be more or less apt for non-mass production making the possibilities of a decentralization into smaller units more or less profitable (and possible).
Finally the technology employed might demand more or less qualified/skilled labour making the possibilities of a location in peripheral areas more or less possible due to labour market size.
In some of the cases (ELECTRIC1 and EQUIPMENT1) there are some indications of the increasing automization demanding an increasing amount of highly skilled labour for maintenance and repairing. These two firms have found it difficult to attract such kind of labour in the peripheral areas.
Increasing automization will furthermore tend to reduce wages in relation to total costs, which involve that possible savings by a location in the provinces will be reduced.
However, increasing automization - on the other hand -means that existing buildings become less suited for new machines which might initiate a locational search.
In the last 25 years there has been a tendency towards a new concept of employer/employee relationship. A tendency has taken place from bureaucratic/mechanistic organisational models to an organic type of organisational model. Furthermore increased attention has been paid to the behaviouristic aspects of the organisational decision process.
Up to the Second World War the relationship between the employer and the employee had been considered to be basically rational. This implied roughly speaking that each human being in the working situation was seen to aim -e-o
- 82-
obtain the highest possible economic reward for his or her contribution. The aims of the worker and those of the firm were seen to be opposite. The management task could be described as analysis, planning and control. (Agersnap 1978).
Through the experiments of Mayo (described in Schein 1971) and the motivation theory·by A.H. Maslow (Maslow 1970) a new concept of employer/employee relationship has emerged. Emphasis has been placed upon the in·ter·-human relationships, and the behaviour of the worker is seen as a consequence of social needs and relations to other workers and the foreman. The content, variation, development possibilities, accept etc. of the work has replaced the traditional economic motivation (Agersnap 1978).
The revised behaviour-oodel described above has caused a change in the organisational concept which forms a basis of modern management. An organic, flexible organisational model has replaced traditional bureaucratic/mechanistic models. Employees take increased responsibility in the management of the firms.
Through the firms analyzed in this survey it is clear that relocation has been an opportunity which is used by management to carry through organisational changes. This takes place due to either merely the fact that the physical surroundings change or the fact that a high proportion of employees often leaves the firm if the distance moved is long. Theoretically, the relocation can be used as a tool either to "modernize" an old-fashioned organisation or to re-establish a mechanistic organisation in an area where workers are less conscious of ·their possibilities to obtain a higher degree of responsibility in the management of the firm.
The case studies of this survey show no clear example of relocations used to carry through a change from a mechanistic to an organic type of organisation. One firm went through a relocation process mostly to get away from unsatisfactory piece-work agreements maintained by organisations who had developed a high degree of influence on the management and wagesetting decisions. Only a slight change towards a more organic type organisation occured. The main change was a drastic drop in piecework wages.
The organisation model development from a mechanistic to an organic structure increases the demand for inter-departmental contacts within the firm. Task forces and working-groups with representatives form all departments of the firm are estblished. This leads to a demand for physical centralization of the activities of the firm. Technological economies of scale tend to draw the firm in the same direction.
..
-~-
An opposite trend can be seen in fact that the motivation and co-responsibility can be put in to practice easier when geographical units are smaller and selfcontrolling (profit centers). Smaller units moreover do not require including the employees in the formal decision structure since co-responsibility and a consultative type of management can take place in a more informal way in the small units.
~~~~~-E~t~E~_tE~~9~-~~-f~~t2E~-~~f1~~~~~~g_22~~~~~~g conditions.
It is to be expected that the differences in wage level will decrease in the future (like in the past) making direct cost savings by a provincial location smaller. On the other hand an expected development of the data transmission network should reduce communication disadvantages of a provincial location. However, it should be noted that the contacts which seem to be of greatest qualitative importance (orientation types of sales/marketing/R&D contacts) are the ones less suited for telecommunication.
Concerning organizational devleopment the recent trends of smaller units with smaller communication links might involve more decentralized firms and consequently greater opportunities for relocation to peripheral areas.
The technological development seems to increase possibilities of decentralization in some ways. Take f.ex. the development of electronic data processing: By automatic typesetting this might for a newspaper firm increase possibilities of separating the printing unit from the editorial functions. For an insurance firm the possibilities for a vertical decentralization are increased, all departments having the possibilities of using the same data base, also long distance.
However, on the other hand, advantages of technologies of scale will contribute to an opposite development. It is in this connection of importance to encourage the development of non-mass production oriented technologies.
We shall now turn to a delimitation of the other important aspect: potentially relocatable (to the provinces) types of firms.

·- 84-
5.3.1 General conclusions.
According to our definitions long term mobility of a firm is a necessary but not sufficient prerequisite of being potentially relocatable.
A further prerequisite will be that the relocation barriers are reasonable compared to the advantages in the operating conditions.
Because of big investments (and uncertainties) usually involved in a relocation in general, it could be argued that due to the relatively small differences in operating costs (exclusive development aid and relocation effects) very few firms, not "forced to relocate", could be regarded as potentially relocatable.
This in fact is in agreement with some fundamental results of the preliminary study (Kolind & Matthiesen, 1975):
"The main causes for firms to consider a relocation are:
- shortage of space
- poor plant layout
- inadequate labour force.
and consequently more or less acute problems forcing the firm to relocate".
On the basis of the relatively small savings these findings seem reasonable. The only long term mobile firms for which significant savings will be obtainable at a provincial location are firms for which significant positive relocation effects can be obtained (TEXTILE1 (P) , ELECTRIC2(P) and PRINTING1).
On the basis of this it could be argued that unless firms more or less are forced to relocate (due to space problems, labour problems etc.) only firms obtaining significant relocation effects because of improved plant layout, technology or organization, are potentially relocatable.
•

•
- 85-
However, on the other hand, if the management of a firm believe in non-quantifiable operating advantages of a provincial location, in most cases the firms must be considered potentially relocatable because operating costs usually are not higher in the provinces .
Some concrete relocation barriers might reduce the probability of being potentially relocatable for the individual company:
-Heavy machinery difficult to move (CHEMICAL1).
- Problems of selling buildings (TEXTILE1 and PRINTING1).
- High dependence on a special group of skilled or highly educated employees not available in most cities (MACHINERY1).
- High dependence on immobile key-employees.
However, like was the case for the definition of long term mobility, potential relocatability is in general not a very precise ter~, but rather it should be concluded that the probability of being potentially relocatable gradually increases by:
1) Increasing net savings in the provinces (see paragraph 5.2 for hypothesis about this).
2) Decreasing relocation barriers (see above).
3) Increasing positive relocation effects. *)
4) Acute problems like shortage of space, inadequate labour force etc.
It should be noted that due to point 3) and 4), which are not connected with any firm characteristics, it is not possible to the same extent as for long term mobi-· lity to identify interdependences between potential relocatability and firm type.
Some other factors might more indirectly influence the potentially relocatability of firms:
Financial institutions.
Organizations.
*) e.g. new plant lay-out or new organizational structure.
- 86 ·-
In general, the bank is consulted at an early stage of the location decision process. Also chartered accountants seem to be involved to a certain degree. Other sorts of advisers, e.g. management consultants, seem to be involved in only very few location decision processes. A survey made by the Danish Association of Management Consultants in 1977 showed that out of 19 consulting firms only 5 had been involved (in a total of 16 relocation projects) over the last 5 years.
At a later stage in the location decision process more specific negotiations take place between the bank and the firm. Big projects usually involve the main office of the bank.
The relocation project is often evaluated on the basis of 3 years profit and loss accounts, budgets, and general trade cycle data. In some cases the bank requests an outside consultant to evaluate the project.
It is a general observation that banks do not recommend total relocations, when these are motivated by survival of the firm because of cheaper wages and/or regional development aid. The reason is that the experience tells that such projects are quite risky and furthermore buildings in peripheral areas are difficult to sell. A partial or step by step relocation is felt to be more safe. Changes in production technology and other factors associated with a total relocation often cause liquidity scarcity that was not foreseen by the firm (larger series, larger volume, larger credit demand).
No direct and clear influence on the location decision process has been observed from employer and employees organisations. In some cases the rate of employees organized in labour unions etc. has been higher than in the development areas. In other cases the opposite has taken place. In some cases, however, the manning rules are stronger in the Copenhagen area in relation to the development areas, i.e. more persons are requir~d to operate similar machines in Copenhagen than in the development areas.
"
•
t

- 87-
This fact more or less has affected some of the location decisions in this survey. In some cases, however, the relocation itself has been enough to change manning rules and old fashioned organisational procedures despite the fact that the relocation took place within the Copenhagen region.
As a preliminary conclusion it can be said that the strength of the employees organisations in Copenhagen has contributed to the initiation of a number of relocation projects and in some cases it has forced the firms to move especially production departments out of the Copenhagen area to the development areas.
In the preliminary study we formulated a decision making model for relocation decisions, mainly describing the very unsystematic and ''non-rational" decision making process which most firms seem to follow. In fact most Copenhagen located firms when considering a relocation do not even consider a relocation to the provinces.
Furthermore actual consequence analyses for alternative locations like the ones of this study only rarely are carried through in reality.
So decisions of relocation are generally not taken with the same knowledqe as this study as to spatial differences in operating conditions. However, taking into consideration the relatively small differences (in general) between the provinces and Copenhagen it seems as if many other (non-economical) factors become relevant. This , to some extent, justifies the "non-rational" decision making process as generally observed. Still, of course, the decision makers do not know the rational consequences and therefore it is not because of knowledge of the consequences that decision makers decide not to investigate provincial locations.
Whether or not consequence analyses of many alternatives (i.e. a rational decision making process) would cause different locational behaviour and more or less Copenhagen - province relocations is very hard to tell.
However, as referred in section 4.4 it seems as if this study has led to at least one province relocation and a few more serious considerations about a relocation.

- 88-
A prerequisite for a consideration of a relocation is however,that a cause has s1:arted the decision making process. As observed in the preliminary study and further supported by this study the main reasons for starting a decision making process (lack of space, inadequate labour force etc.) seems to be connected with a high and expanding activity level in the society in general and in the firm in particular.
The Regional Development Directorate (Direktoratet for Egnsudvikling) has observed that in low activity periods, only very few applications for grants are received covering total relocations. We have investigated whether this tendency is reflected in the retrospective sample survey by the Danish Building Research Institute 1976. (Christiansen og Kolind, 1977). In order to qet an estimate of the establishment frequency variation in the period 1961-74 the number of firms active in each 2-year period since 1961 has been calculated. The number of firms active 1961, 1965, 1970 and 1976 is known in the DBRI-survey. Linear interpolation has been used to obtain similar numbers of firms each 2-year period since 1961. By relating the number of establishments in each 2-year period to the calculated number of firms an estimated establishment frequency for each 2-year period can be calculated. Results are shown in table 5.1.
I
y E '
61 62 63 64 65
Gross Dome-st~c Prod. 37.6 39.7 39.9 43,4 455 ' GD
66 -~~68 69 70 71 72 73 74 ·-t-·
4 Of; 54B 56,3 58.5 61,2 635
No of firms 1134 1216 12'
in sample 1366 1433 1469 1504 ~8
No of estab 219 248 2· lishments
27:3 342 351 348 i6
·---Establish-
.193 .204 . 1 ( ment frequ-
.204 .238 .239 .231 ~0
ency
GDP growth >J 2 . 1! o . 2!3 . 51 2 . 1 !1 ~~2\ 4.2J1.5!2.2J2. 712.3 ~?c-
Table 5.1: Gross Domestic Produc·t 1961-74 (bill D.kr. 1955 prices) and absolute growth. ~rwo year establishment frequencies (existing and closed addresses) 1961-73.
Source: Statistical Yearbook 1975. Danish Building Research Insti·tute retrospective sample survey 1976.
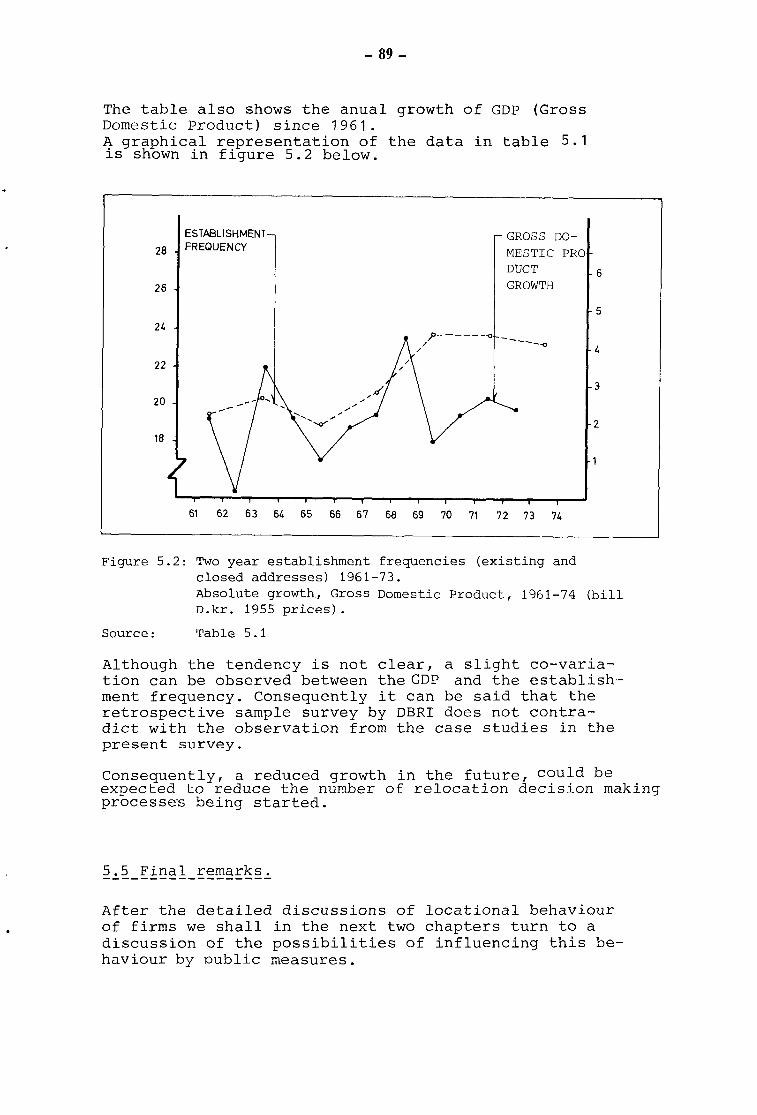
- 89-
The table also shows the anual growth of GDP (Gross Domestic Product) since 1961. A graphical representation of the data in table 5.1 is shown in figure 5.2 below.
28
26
22
20
18
ESTABLISHMENT FREQUENCY
GROSS DOMESTIC PRO DUCT GROWTH
--...,
61 62 63 64 65 66 67 68 69 70 71 72 73 74
Figure 5.2: Two year establishment frequencies (existing and closed addresses) 1961-73.
6
5
3
2
Absolute growth, Gross Domestic Product, 1961-74 (bill D.kr. 1955 prices).
Source: Table 5.1
Although the tendency is not clear, a slight co-variation can be observed between the GDP and the establishment frequency. Consequently it can be said that the retrospective sample survey by DBRI does not contradict with the observation from the case studies in the present survey.
Consequently, a reduced growth in the future, could be expected to reduce the number of relocation decision making processe-s being started.
5.5 Final remarks. ------------------After the detailed discussions of locational behaviour of firms we shall in the next two chapters turn to a discussion of the possibilities of influencing this behaviour by public measures.

j j j j j j J
j
• j j j j
·i j j
j j j
j j j j j j j j j j j j j j
j j j j j j j j j j j j j j j
j j
1j j j j
'j j j
j j j
j j j j
j j j
j I
- 91-
6. LOCATION POLICY MEASURES
6.1 Introduction ----------------It is not the aim of this section to give an exhaustive account of the existing locational policy measures, but rather to discuss the main features of the measures in relation to the hypothesis of the preliminary study and the findings of the present study.
The empirical basis of this discussion is described in chapter 2 of this report.
The existing location policy measures with a direct effect on the location of private firms may be divided into three groups:
Incentive measures
Restrictive measures
Information measures
However, the rest of the regional policy and large sectors of the overall public policy also exert an indirect influence on the location of firms, e.g.:
Infrastructural development (airports, roads, universities, data transmission networks, etc.)

- 92-
Employment policy
Location of public institutions, technological service centers, etc.
Geographical distribution of public orders
Environmental legislation
Most countries use a combination of these measures, but a thorough examination of them would be so wide-ranging that only the direct locational policy measures will be discussed here.
Apart from the classification of these measures in the three above-mentioned groups, a further distinction may be made between:
General measures
Selective measures
The general measures are used for all projects of a certain type and within a given geographical area, while the selective measures cannot be employed for an individual project without previous individual evaluation. Furthermcre, the selective measures may be selective as regards the project and company for which they are employed or with respect to the type of subsidies or restrictions (selective case, selective aid). While general measures are found in almost all European countries, the use of selective location measures is limited.
6.2 Incentive measures ----------------------In most countries incentive measures are one of the most important instruments of the locati.on policy.
These may be broadly classified into the following groups:
1. Investment grants for machines, equipment and buildings
2. Investment loans on favourab 1 e conditions
3. Low cost rental of factory buildings
4. Tax concessions (reduced tax, write-offs, etc.)

- 93-
5. Reduction of certain costs where these are under state control (e.g. transport, social security contributions, etc.)
6. Employment grants
Most forms: of subsidy apply to well defined geographical areas both to existing firms and to firms that P.love to that particular area.
The measures rarely have a particularly selective effect and are not usually intended to have any special effect within the development areas (DA), but are only planned to influence the development of development areas as a whole as opposed to other areas.
The firms for which subsidies have been primarily intended have been within the manufacturing industry, presumably on the assumption that manufacturing is a basic sector with a multiplier effect on other types of employment. However, there appears to have been a trend away from this view in recent years.
The following tables show the types of subsidy in existence in the various OECD countries in March 1974 and the amount of subsidies granted in each country. It is of course difficult to compare the amount of aid in each country, e.g. because of differences in taxation, but Denmark evidently lacks behind most other European countries as regards the amount of aid per inhabitant.
The effect. which the s·.1bsidies have had on employment in the supported areas h&s often been discussed although never thoroughly examined. It is of course difficult to speak of the effect as it is difficult to say with any degree of certainty, how the region would have developed without aid. Furthermore, the trend over the past 10-15 years has been for manufacturing industries to leave the high density urban areas, because of the problems of obtaining sufficiently stable work force there. How far this trend would have gone without regional aid cannot be determined.
The following comments may be made about the various aid measures:
Investment. aid (l-3)
Most types: of incentives are concentrated on investments in buildings, machines and equipment as these items are considered important obstacles (relocation barriers) . The consequence of this could be that mainly capital intensive industry (and mainly production functions) would be drawn to the regional development areas as these firms could obtain most aid.
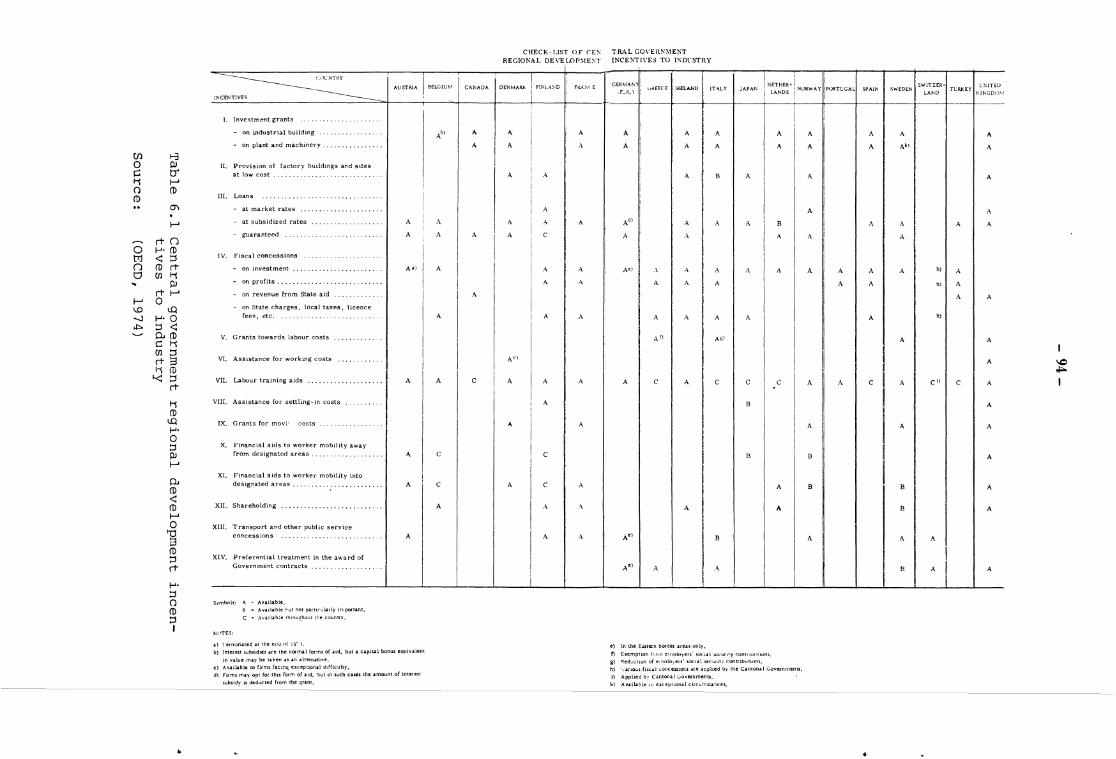
Ul 1-3 0 PJ ~ tJ' li I-' () ([) ([)
(j) . I-'
rtn 0 ~-ro t:r.J ~ !J () ([) rt tJ Ul li
PJ rtl-'
I-' 0 1..0 LQ -...! f-'· 0 .t>- !J ~
0,([) c: li Ul !J rtS i"i ([) '< !J
rt
li ([)
LQ f-'· 0 !J PJ I-'
0. ([)
~ ([) I-' 0
'"Cl s ([) !J rt
f-'· !J () ([) !J I
•
::------:::___ AUSTRIA I B£LGIU!I.1
!NCEI'<
1. Investment grants
- on industrial building ........
- on plant and machinery . .....
II. Provision of factory buildings and sites at low cost . ..........
III. Loans
- at market rates ................. at subsidized rates .........
guaranteed ....
IV. Fiscal concessions
- on investment ................•.
on profits
on revenue from State aid .....
on State charges, local taxes, licence fees, etc.
V. Grants towards labour costs
VI. Assistance for working costs
VII. Labour training aids ....................
VIII. Assistance for settling-in costs
IX. Grants for mov1· costs
X. Financial aids to worker mobility away from designated areas .
XL Financial aids to worker mobility into designated areas ..... ........
XII. Shareholding .... , . . . . . . . . . .
XIII. Transport and other public service concesstons
XIV. Preferential treatment in the award of Government contracts .
s.,ml!ols: A. • Available.
Nl'TES:
B • Avoulable 1-ut not f>il.rl!qJJ.lrly in,portam.
C • Av.ttlahie rhrou~hour t~·e countrv.
a) Temnn.tted .11 the ~::•:o.J of i 'J' ·1.
I i
A
A
A•l
A
I A
A
A
b) Interest subsidtes are the nocmal forms of atd, but a c.tpttal bonus equiv.tlem
tn value rna~ be taken as an .tltetnati~e. c) AvatLible to firms factn~:t exceptional chfficulty. dl Fllms rna~- opt for thn form of a1d, but 1n such cases the o~mount of interest
subsidy is deducted from the ~rant.
Abi
A
A
A
A
A
c
c
A
I
CHECK- LIST 0 F C'E:'\ TRAL GOVEH~\fEt-;T REGIONAL OEVELOP:\IE~T INCE~"TI\"ES TO I!':Dt'STRY
CANADA ' DENMARK ! Fl'tA'D fiV\~( E GERMAI\~; L-t<.EECE W:LAND ITALY JAPAN
MTHER-1
f.K. l LANDS i NORWAy
I
1
A A. A A A A A A
A I A .\ A A A A A ! I
A A A B A A
A A
A A A Adl A A A B
A A c A A A A
A A A') .\ A A .\ A A
A A A A A
A
A A A A A A
A" AtP
A" I I ~ I c A A A A c A c c c A
A B
A A
I I I A
c B B
A c A A B
.\ A A A
A A A'' B
I
A
A'' A A
i
e) In the Entern tlocder are.u only.
f) Exempt ton fr•llll e:ropluyers· -.octal :;ccun•y conr:wt:th.>ns. g) ll_ed·"ctwn of e:'loloiers' '>OCtal sen.ritY contnbuuuns.
h) •,auous f1:><.:.1.l <.-Onces.uor.s.l-fe aaphed by the Cantonal Governments.
i) Applied b:• C:niOn.J.I Governments.
kl A.vaiLihle 111 exceptwr.al circ~.omst.ar~ces •
PORTCGAL SPAIN SWEDEN
A A
A Akl
A A
A
A A A
A A
A
I A I
~ I I I ! A c I A
i ! I
I I
A
~ B
B
A
B
.,
SWITZER-
LAI"D TLR.KEY
A
h) A
hJ A
A
h)
I cil c
A
I A I
I
L!\!TED
K!I'GD().\1
A
A
A
A
A
A
A
A
A
A
I A
A
A
A
A
\C ..... I

Table
- 95-
TOTAL VALliE OF REGIONAL INCENTIVES OF DlllECT BENEFIT TO INDIVIDUAL ENTERPIUSES
(In million US $ at current prices and current exchange rates)
C:OL:NTRY
Belgium ........................... .
Canada ............................ .
Denmark •..•••.•••••••.••.•....•.•.
Finland
France
Germany F. R. . .................... .
Ireland .......................... ..
Italy .......... , ................... .
Netherlands ....................... .
Norway •.••.•••..•••. , .•...•..••..•
Spain .............................. .
Sweden , .......................... .
United Kingdom ................... , .
ANNUAl EXPENDilTR£
1971' 95. 4
Fiscal1969/70' 52
Fiscal 1970/71, 2. 3
3, 9
1972, 71.. 9
1971,206,1
Fiscal 1969/70, S:l. 6
1970,295.4
Average 1964/72:13.8
Average 1968/72' I o. 4
Average 1964/70: 4. 2
Fiscal 1972/73, 26. 8
1967/68 Average 1971172 , 592.8
J~;dTEt The expenditure dat.1 comprise th.e. following elementst
lnteresl subsidies..
Investment gtants,
I
F~lRESEEN ANJ\l'Al EXPEt\DITl'RE
Fiscal1974/75' 119
Fiscall974/75: 121
1972/73 Average 1976177 , 766,8
Belgium
Ca~da
Jlenmarl! Jnveslmentwants. Ov« the 5 yearsl!:NM/11 lot.tl granu and loans amounted to ca. l'S S :,3 miiHon, These are expected to rise to l'S S 100 million in the 5 years 19'72/7fl.
Finland
France
Germ.1ny F, R.
lrel.lnd
}.:fJIWIJ
Spain
Sweden
rnited 1<•1gdom
Jntereu subsidies .and, for I :174, compensation for the employmetU of inexperienced la),our,
Regional developme&U grauu, decenlrallzation auisrance.
26Y millhm UM 1bu~et d.tta In the Federal Budget). Thb Cigurc doc!~ not include other )cinds of regional aids c e, g. tax reducUons, ERP loans). The expenditures or the t.aeudcr are not availahle for this period, In 1 ~6~.~ a uew tn"suumem of regional aid "'·as set up in the fotm of lax exempt investment grants, These are provided by loc.al tax authorities out of current tax revenues, These grants arc not ahowo 111 the Bud~rt, The sh!)(l ~r. II in tax revenues In l!t71 was enimated as being 486 million DM, This bas been lucluded in the fig1ue s.lu:n.·tl 011 the table,
Jnve11me111 grants,
JnvCSlmeut grants, lnterensubtidtes I excluding tboM speciaby given to small and medilltu sized businesses).
Investment !Jtanu.
l>irecl grants ccomndtmentl), Tbete amoumed to 389,3 million Kr over the period 1:•68·72, O.,a thb pea-iod loans .:md guaramect fw ICH~ns tconunhmenu) amounted 10 l, 8020fuilllon 1-:r. These .ue not included in tbe
l>~ble.
Investment grams in the dc¥elnpment poles.
Jnvwrnena grants, employn1en1 prrmiums, interen subsidies,
Expendilure on regional fnccnlives o( direct bencf'it to indhidu&l en1erprises by the l'~oited l<..lngdom Government, net uf loan rcp&ymenu .and faclory·rems and sale;s.
6.2 Total value benefit to
of regional individual
incentives enterprises
of direct
Source: (OECD, 197 4)

-· 96-
However, this appears to conflict with the repeatedly expressed view point that one of the major problems of the regional development areas is that most of the industry that has moved out is labour intensive low wage manufacturing industry.
In this connection, however, the extent to which these labour intensive firms would have moved to the peripheral areas anyway remains an open question. It has been observed, however, that some firms or departments which really have been encouraged to move by the regional aid are capital intensive production departments which could not have expanded \vi th other methods of finance.
Furthermore, a regional aid, which mainly concentrates on investment in production machinery might prompt the individual firm to automate its production machinery to a large extent when it moves and thus create fewer jobs. At the same time it has been observed in certain cases, that the firm may face new problems caused by the automation itself, e.g. with regard to the cash flow with-in the firm (transition from manual production to mass production) .
Tax concessions (4)
These apply in particular to firms with a profit. The problem is that newly established firms, which rarely make a profit in the first years, when they need aid, cannot take advantage of these tax concessions. In addition it is difficult to fix a correct rate of taxation for an establishment that is not a profit center itself.
The Swedish system, which makes it possible to use transfers to investment funds to investments in development areas, has the particular advantage of forcing firms to think regionally in their long term planning.
Reduction of costs (5)
The advantage of an extensive selective cost based aid system, which takes account of the individual firms cost structure and the regional differences in these costs, is that action really can be taken against the individual firm's problem in the relevant region.

- 97-
Examples of these measures can be found e.g. in Sweden, where the public authorities administer the grants to lower the freight rates.
We believe, that more selective aid as regards the firm and type of aid, could make regional development aid more effective. More direct subsidies naturally lead to problems involving the distortion of competition vis-a-vis other firms.
Employment grants (6)
Employment grants in the form of continuous payments per working hour or a once-and-for-all payment on the appointment of staff are found in the United Kingdom and Sweden.
These subsidies will be most attractive in the case of labour intensive production. It could be argued that these subsidies might tend to reduce the aiertness of the firm towards possibilities to rationalize its labour force utilization. In other words the firm is maybe not forced to keep up with competitors, which leads to lack of competitive power. This may also be argued in the case of some of the above-mentioned grants leading to cost reductions.
In connection with the hypothesis contained in the preliminary study concerning the location decision making process, it is a fact that many firms situated in large towns do not even investigate the possibilities of regional aid. This state of affairs is amplified by the fact that it is especially the service industries and head offices which usually fail to investigate the possibilities of regional aid: these firms and departments are typically under-represented in the provinces.
It can thus be postulated that the firms, which have investigated the possibilities of regional aid, are those firms, which will have already considered relocation in view of their particular labour situation, while the types of firms with a labour structure of considerable importance for eliminating the existing regional social economic differences, usually tend not to investigate the possibilities of regional aid.
As indicated in the preliminary study, one general reason why the possibilities of regional aid are often not considered when taking a location decision, is probably that location considerations rarely form part of long term planning. Location considerations usually result from acute problems requiring a relatively rapid solution for which there appears to be no time for far-reaching investigations. This study was unable to prove or disprove

-- 9H-
whether the time taken to process applications in the regional development directorat:e reinforced this trend. More active and informative development aid could encourage more firms at least to investigate the consequences of possible relocation to a development area.
A British study (Green 1977) shows that the level of information about development areas and possibilities is generally very low. At the same time there is a significant difference between firms, which have moved to a regional development area and firms outside these areas - the level of information of the relocat:ed firms was higher.
This seems to confirm that the firms do not always assess the possibilities of location in a development area as part of long-term planning. Few firms conduct really systematic long-term planning. Small and medium sized firms, in particular, usually finds it hardest to set aside capacity for long term planning. It is precisely this type of firm, which may be attractive for a development area because it contains all management functions. The larger firms, on the other hand, will have a 1:endency to relocate only their production departments.
However, the most important factor is that the current regional aid is not considered to be sufficiently effective in affecting the types of firm or depar1:ment typically found in the metropolitan areas to move to a regional development area. Another reason for ·this may be that the regional aid is not sufficiently selective as regards either the original base or the type of firm.
This fact combined with the relatively limited amount of money available for regional development aid, means that only very few service industries and head offices are moved to the development regions. These ·types of departments or firms often do not have so much interest as e.g. a capital intensive production depari:ment in the objectives, which regional aid actually pursues, i.e. investments in buildings and machinery ..
The aid possibilities of the service industries and head offices are extremely limited. At the same time there is of course a tendency for precisely these firms to feel tied to the metropolis because of the availability and range of higher education, which cannot be directly compensated for by subsidies.
Although existing regional aid thus can support many types of firms through building investment grants, it is basically most attractive for the type of firm, which actually has relocated, fully or partly (e.g. production departments) . This preliminary conclusion is in accordance with the results shown in chapter 7.
The EEC study (Deglomeration Policies in Europe, 1977)

- 99-
draws up the hypothesis that a special type of firm or department is concentrated in the peripheral areas, viz.
Small and medium sized business
Family business
Firms in marginal sectors
Sub suppliers
Production departments
Firms, which have lost their independence as a result of mergers
Many of them have purely developed head office functions (decision making, organization, economics and research and development (R&D)) and a low degree of operational complexity.
From the R&D statistics (Forskningsstatistik 1975) it can be seen that a high proportion of the total R&D is concentrated in the Copenhagen region. This fact backs up the discussion above. This trend may be partly caused by side effects of the regional policy pursued although the selective structure of the agglomeration processes may be equally important, since the firms (departments), which have had least success or those with least interest in the urban location, are forced out.
Regional policy should therefore not only attempt to improve the level of development in the peripheral areas (per capita income, number of jobs, etc.), but should also try to improve the ability of these areas to adjust their economic structure and their firms innovative capacity.
Most European countries already have measures such as:
R&D subsidies, write-offs
Technical development aid
Organizational arrangements for technological development
Co-operation agreements between small and medium sized firms (export, marketing)
However, these measures do not seem to have been used systematically or in a coordinated fashion and, of more importance, do not seem to have formed part of a regional development plan.
In view of the regional development problem in Denmark, which, as in the rest of Europe, increasingly appears to be of a qualitative nature, it is important for regional policy to be changed into a more selective innovation oriented instrument.

-- 100-
A considerably more selective form of aid taking into account the needs of each individual firm, its base and possibly its area of relocation can thus have an increased effect on the relocation of the types of firms which are now typically situated in the metropolis. However, the firms still have shortcomings as reqards systematic longterm planning including the analysis of the importance of the location pattern e.g. the centralization/decentralization aspect.
A more active and informative policy could help remedy this state of affairs. This could be done when the public authorities come into contact with the firms (environmental sector, possible future location guidance, etc.). Aid for the location investigations of individual firms may also be expected to produce a certain effect (see below under informative measures). Furthermore, in other countries where firms are consulted on the question of location as a result of restrictive measures or e.g. the annual consultation of firms in Sweden, there is a considerable improvement in the possibilities of at least making the firms include regional aid in their considerations. This fact alone is thought to encourage many firms to move.
However, it can still be asked whether a more selective innovation oriented and active aid system is sufficient on its own to influence current rE~gional problems.
If there is less general growth in the future, less mobility can also be expected on the part of firms. It is there-fore also important to concentrate on existing firms in the development areas and on structural changes in these firms rather than on relocation.
Finally, it can be said that as Danish regional policy has been drawn up and administered it has certainly encouraged a number of firms to move to regional development areas, by reinforcing the "natural process of industrial relocation".
However, because of its general, passive and investment oriented character, it has not been able to create balanced industrial conditions in the periphE!ral areas. Moreover, there has been a lack of guidance in the individual regional development areas, which is why random events and local initiatives have also partly determined this development. (See chapter 7) .
- 101-
6.3 Restrictive measures
In recent years an increasing number of European countries have introduced restrictions on the expansion and establishment of firms in the highest density urban areas.
These restrictive measures can be roughly classified as follows:
1. Restrictions on land utilization
2. Authorizations for expansion/establishment in high density areas (establishment control)
3. Special taxation on investment in a high density area
Only measures of type 1 have been used in Denmark to date, whereas the others are currently used in e.g. The United Kingdom, France, Italy, The Netherlands and since 1st January 1977, Norway.
It is very difficult to judge the effect of the restrictive measures. Firstly, it is not known how many firms find other (unsuitable) solutions when they wish to expand, as contact is never made with them (or the idea is given up in advance). Secondly, the consequences for firms forced out of large towns are not known. This is connected with the fact that there is no real basis for assessing the individual firms need for a metropolitan location. The tendency in The United Kingdom is for these measures to be administered less and less restrictively. France has tended to replace the actual establishment control with taxation. In all circumstances it is important for the restrictive measures to be accompanied by effective incentive measures and to be made selective according to the individual firms need for a metropolitan location.
As the restrictive measures are basically negative and therefore do not encourage new initiatives or investments, there is a risk in a period of recession that they could on the whole act as a break on the total investments. This is the case for an establishment control, which may stop a firm from expanding. Taxes on investment in large urban areas do not have the same directly negative effect as they "only" affect the firm's cost structure and may thus indirectly force out firms. However, it is precisely the most investment intensive (capital intensive) firms/departments, which derive most advantage from the subsidies. Consequently the current regional problems connected with an over-concentration of head offices and superior services in the metropolis will hardly be influenced as these types of firms and departments do not make large investments in machinery etc.

- 102-
6.4 Information measures ------------------------The lack of a systematic procedure and thoroughness in many locational considerations can partly be attributed to the firm's lack of capacity and capability. This fact makes it relevant to consider a locational guidance, which, based upon a location register 'iNith information needed by firms about local conditions, would be able to provide a systematic and objective natiowide guide.
This has been used in Norway and Sweden in the form of compulsory locational guidance for firms of a certain type or size, which wish to expand or establish themselves in high density urban areas.
The committee appointed by the Ministry of the Environment to examine compulsory locational guidance in Denmark, has recently suggested a locational guidance authority to be set up. However, t:he Danish government has decided to postpone a decision on this matter, at least until the regional plans have been completed, possibly in 1980.
The compulsory location guidance in Norway and Sweden is not considered to have any substantial direct effect. There has been only a very limited possibility of changing the location decisions of f irrns which have been through the compulsory guidance. One of 1:he reasons for this is presumably that even when the locational instructions are binding, it is difficult to come into contact with the firms at a sufficiently early stage of the location decision making process. The preliminary study has clearly underlined the importance of this state of affairs.
The situation is slightly different: for the firms, which have not been obliged to follow the location guidance, but have accepted it voluntarily. Many of these firms have applied for locations in development areas. The reason for this is presumably as follows:
Because of this voluntary acceptance, contact was made with firms at an earlier stage, when they had not made up their mind concerning the choice of a site
Many of these cases were new E~stablishments
The firms are fairly small and thus perhaps more location independent than the larger firms.
The experiences of the Swedish and Norwegian location guidance also appear to confirm, that the firms have little knowledge of the possibilities outside their own area including aid opportunities and methods of finance.
Despite the fact that the directly quantifiable experiences with regard to firms covered by the instructions are considered poor, it is worth noting that the number of comparable voluntary cases has risen considerably since the start, i.e. there is a need for the locational guidance.

- 103-
In addition the location guidance has also encouraged communication between the public authorities and the private firms, which may in the long term have an affect i.e. by creating a better understanding of the conditions, determining the firm's choice of location. This will also be of value, when drawing up future industrial employment and regional policy including the use of new locational policy measures.
The latest advisory system in Sweden, where a number of firms have voluntarily accepted the system of permanent discussions with the authorities about the firm's longterm prospects, opens up further opportunities for the authorities to influence the firm's choice of location at an early stage in the decision making process. The provision of direct aid for location analysis will probably also encourage serious consideration.
The provisional findings of this investigation thus suggest that some firms being confronted with the relocation problems and going through an analysis, can be made to consider relocation seriously.
It is clear that the informative measures by themselves, do not directly guide the location behaviour of the firms. It is, however, of importance that a variety of measures are applied. Moreover, measures should be selective and coordinated, so that the total effect is as great as possible. The way in which the individual measures are administered is important in this respect.
Having gone through a number of present and possible location policy measures, we now turn to the results of the present study concerning the possibilities for the public to influence the location behaviour of the firms.


- 105-
7. INFLUENCING LOCATION BEHAVIOUR
7.1 Introduction ----------------The purpose of this chapter is to present our conclusions with respect to the possibilities for the public to influence the location behaviour of Danish firms. The conclusions apply to firms located in the Copenhagen area at present. The main emphasis has been placed upon possible relocation of firms/functions to the provinces. More specifically, we try to focus on those measures which are able to
- affect the operating conditions of the firms
- help to reduce the size of the relocation barriers of the firms
- affect the location decision making process of the firms
It has been particularly important to try to point out measures that are selective, i.e. measures that are able to influence the behaviour of particular groups of firms, which from a public point of view are most attractive to move.
It should be noted that we have not limited the study to cover location policy measures which today are acceptable within the EEC. Moreover it can be mentioned that we have not attempted to study the possible side-effects of various location policy measures. This point is suggested as an area for further research in section 8.4.4.
The chapter contains a discussion of the management perception of the possibilities for their firms to move. The discussion serves as an introduction to a presentation of our conclusions concerning the necessary absolute strength of the measures and the appropriate forms of mea-

-- 106-
sures suited to influence different groups of firms. Moreover the possible effect of indirect public location policy measures is discussed.
As mentioned in section 6.1 the following classification of measures has been applied:
Incentive measures
Restrictive measures
Information measures
Indirect measures
As mentioned in section 6.3 and 6.4 it is very difficult to test the possible effect of restrictive and information measures as to the behaviour of the firms. However, a preliminary conclusion is drawn i section 7.3.3 concerning the information provided by local governments.
We have thus concentrated the evaluation of possible effects of location policy measures upon direct and indirect incentives.
A further classification of incentives has been used as a basis for the selection of methods. The classification is shown in table 7.1.
Directed
towards the firm
Directed
towards the individual
economically transparent
economically transparent
limitation of risk
economically transparent
economically transparent
-·
not
not
At once
E:FE'ECT
Over a period of time
Table 7.1 A classification of locational policy measures.
Incentives are divided according to their effect (im..rnediate or over a period of time) , direction towards the firm or towards the individual, whether the measure is economically transparent or not and whether it aims especially to limit the risk of the firm to move. Economically transparent is used here as an expression which covers the fact that the management of the firm can easily calculate the net effect

- 107-
of the subsidy on the economic situation of the firm. A clearly transparent form of subsidy is a grant of 50 per cent of the building investment paid cash at the relocation time. A subsidy which is less transparent is a possible grant of D.kr. 5.000 per sales journey abroad the first three years after relocation. Lack of transparency occurs since the number of sales journeys is difficult to estimate for the firm relocating. Measures with a varying degree of transparency are compared in section 7.6 of this report. Direct grants as opposed to limitation of risk is treated in section 7.6 as well.
The preferences of the firms concerning long-term or onetime subsidies are treated briefly in section 7.5 and the question whether measures should be directed towards the firm or towards the individual employee is discussed briefly in section 7.6.
A description of the methods used in this part of the study is given in section 7.2.
Several activities in the project have been directed wholly or partly towards the evaluation of the effects of location policy measures. Below is given a short description of those activities.
Case studies
The case studies have included discussions with the managements on the possible effects of various existing and nonexisting location po~icy measures on that particular firm.
Although this is not specifically mentioned in each subsequent section it can be said in general that the case studies have been a main source for our formulation of hyphotheses to be investigated in the sample survey and group discussions. The case studies in many cases have helped us understand deeper the data collected by other sources of information in the project.
~2§~~!_§~~E!~-§~EY~Y A sample survey has taken place in order to confront a wide circle of firms with the policy measures developed in the project.
The survey was aimed at 100 of the firms who participated in the retrospective samle survey by the Danish Building Research Institute in 1976. The firms were selected among those respondents that indicated willingness to participate in an interview describing in depth the considerations which lead to the actual location decisions of the firm. A random sample of 100 firms was selected under the restriction that only firms with an address in the Copenhagen region were accepted.
A preliminary questionnaire was designed and pre-tested on 5 selected firms. After several modifications the question-

-lOB-
naire was distributed in early June 1978 to the target group. A response deadline of 2 weeks was given. An English translation of the questionnaire is shown in annex 7.1 of this report. After the deadline a follow-up by telephone took place. A sl~ary of the response is given in table 7.2
Firms participating in Danish building research insti tut:e investic;ration
Questionnaire distributed 100
Fully answered 20
Partly answered 30
Question-naires Total 50 received -
Per cent 50
Table 7.2 Sample survey performed in order to evaluate
the expected effect ot location policy measures.
It is remarkable that a majority of the questionnaires received were only answered partly. Many questionnaires were accompanied by letters from the firms indicating clearly their attitude to the relocation question. A discussion of the results at this point is given in section 7.4.
§E~~E-£!~£~~~!~~~ A total of 25 persons participated in two group discussions arranged in association with the Danish Management Center (DMC) and the Danish Lawyers and Economists Association (DJ0F) .
The DMC group consisted of 16 persons, all of whom had a management position at first: or second level in Danish firms with more than 250 employees. The group was selected at random from the "Invitation Data Base" of DMC. The DJ0F group was a subgroup from a cours1e on "Economic Project Evaluation" attended by employLes in the public sector. All participants had an academic background and held middle management positions.
A case description designed for this particular purpose was developed and sent to the participants prior to the group discussions. The case description reflects as far as possible an "average" Danish firm with a location decision problem (the Louis Petersen & Co. case). An English translation of the case description is given in annex 7.2. It should be noted here that such "average" Danish firm does in fact not exist. It is our impression after having used this case that there was a tendency that Louis Petersen & Co. was probably "easier" to relocate than intended. A summary of the response from the seven discussion groups is given in annex 7.3.

- 109-
A list of direct location policy incentives is given as part of the questionnaire in annex 7.1. Sections 7.5 and 7.6 contains a discussion of the possible effect of various forms of subsidies. Restrictions and information measures were treated in chapter 6.
7.3.2 Indirect incentives -------------------------Through discussions with the firms the following factors seemed to be most important:
frequent connections by air to Copenhagen and abroad
proximity of educational institutions
technological and other service institutions and firms including marketing and advertising agencies, management consultants etc.
adequate connections by rail and road
proximity of similar firms
The sample survey included questions about the importance of these factors. A discussion of the results is given in section 7.7.
The local government organization, set up to motivate firms to move to development areas, has two levels
- regional development councils (5 regions)
- local development agencies (often at municipality level)
The main activities of the regional and local development agencies are the provision of information concerning
- development aid
- available workforce, buildings, sites, etc.
- the local government and its public service provisions

- llO --
The initiatives of the regional and local development agencies are aimed at firms that consider relocation and firms that are located in the area :itself at present.
The preliminary study has indicated tha·t local activity has played a role in the final location choice of a number of firms. No significant influence on the early stages of the location decision process is recorded. This observation has been evaluated further in the present study.
The local government activity influence on the final location choice has been observed in the present study as well. Having chosen to consider the main alternative, the move away from the metropolis, the firm often gets into contact with either regional or local development agencies to obtain a preliminary scanning of the possibilities to find a suitable site or building in an area which provides sufficient labour with adequate qualifications. The quality of the response received from various local or regional development agencies differs considerably ranging from highly qualified economic evaluations of various possibilities to tourist brochures.
It is not possible directly to measure the local government influence on the location decision-making process from the material made available in this project. However, a preliminary comparison can be made of the development aid received by each municipality and the population on municipality level. In this connection development aid is expressed by the amount of loans and grants to buildings and machinery (investment grants and paragraph 6 loans in the regional development act) . In 1976/77 these loans and grants counted for 72 per cent of the total amount of regional development aid in Denmark.
The development areas consist of 119 municipalities including 54 special development areas. ~~he total amount of paragraph 6 loans and investment grants is D.kr. 439 million for the years 1974/75, 1975/76 and 1976/77. This leaves an average of D.kr. 3.7 million per municipality in this three year period. The following table 7.3 shows 15 municipalities which received the largest amounts in the 3 year period.

-Ill-
Community Loans and Population Loans and Number of grants 1.000 pers. grants per project 1.000 Dkr. inhabitant
Dkr/ inhabitant
Aalborg s 39.440 155 255 32
Hj¢rring s 15.950 34 472 16
Frederikshavn s 15.630 35 451 12
Esbjerg 14.660 79 185 20
Nakskov s 14.130 17 817 6
Hadsund s 11.435 10 1.194 17
Thybor¢n s 11.425 5 2.332 5
Hanstholm s 11.320 5 2.068 14
Arden s 11.095 8 1.431 4
Vejen 10.400 15 707 5
Hobro s 9.770 14 714 14
Maribo s 9.630 12 792 8
Nr. Alslev s 9.415 10 955 4
Sceby s 9.250 17 542 9
Br¢nderslev s 8.400 20 424 9
S; Special development area.
Table 7.3; Development aid (§6 loans and investment grants )1974/75, 1975/76 and 1976/77 to communities ranked by size. The 15 largest are listed.
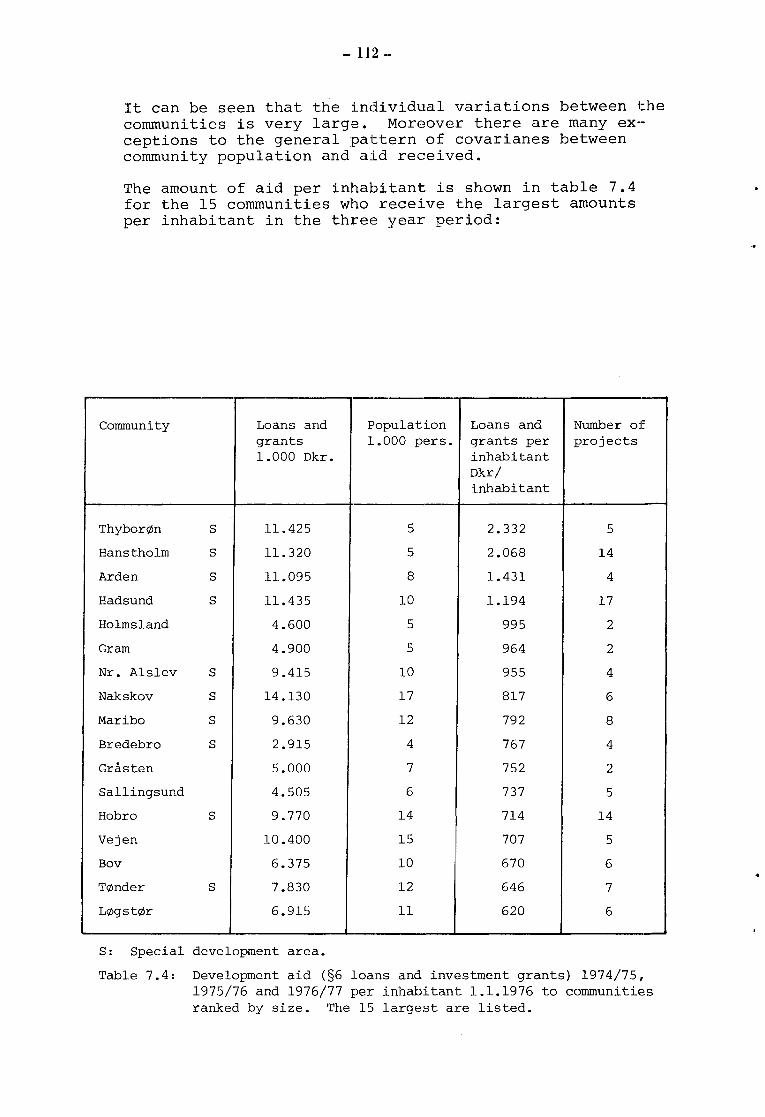
- 112 --
It can be seen that the individual variations between the communi ties is very large. MorE!Ove~r there are many ex-ceptions to the general pattern of covarianes between community population and a:Ld received.
The amount of aid per inhabitant: is shown in table 7. 4 for the 15 communities who receive the largest amounts per inhabitant in the three year period:
Community Loans and grants 1.000 Dkr.
Thybor¢n s 11.425
Hans tho 1m s 11.320
Arden s 11.095
Hadsund s 11.435
Holmsland 4.600
Gram 4.900
Nr. Alslev s 9.415
Nakskov s 14.130
Maribo s 9.630
Bredebro s 2.915
Gras ten 5.000
Sallingsund 4.505
Hobro s 9.770
Vejen 10.400
Bov 6.375
T¢nder s 7.830
L¢gst¢r 6.915
S: Special development area.
p
l 'opulation Loans and Number of .000 pers. grants per projects
inhabitant Dkr/ inhabitant
5 2.332 5
5 2.068 14
8 1.431 4
10 1.194 17
5 995 2
5 964 2
10 955 4
17 817 6
12 792 8
4 767 4
7 752 2
6 737 5
14 714 14 !
15 707 5
10 670 6
12 646 7
ll 620 6
Table 7.4: Development aid (§6 loans and investment grants) 1974/75, 1975/76 and 1976/77 per inhabitan·t 1.1.1976 to communities ranked by size. The 15 largest are listed.

- ll3-
When evaluating the two tables it should be noted that the amounts of §6 loans include loans to local firms who expand. 244 loans were given to local expansions which compared with the total of 312 loans accounts for 78 per cent in the three year period.
The amount of loans and grants per inhabitant is shown graphically in figure 7.5.
It is interesting to note that there seems to be no clear difference between development areas and special development areas as concerns the amount of aid received.
There is no publicly available rating of regional and local development agencies concerning their activity level. From the case studies of the preliminary project and the present project there seems, however, to be no doubt that the communities shown in tables 7.3 and 7.4 above are among the ones that have spent more efforts to influence the decision-making of the firms. Although this observation cannot be scientifically proved at present, it seems to be clear that there is a coherence between strong local government activity and the industrial development.

- 114 --
Fig. 7.5
Source: The.Regional Agency
10
LOANS AND GRANTS
CJ [ill
0
RELBVED 'q7"Y-rs) 'q"'%,: AND '~17~1 PER INHABITANT
a KR ITIIIJ[Jiso -~so ~ Ill <. 19:) KR mil ~ -650 IC1Ii! ...
(MUNIC.JPALITY LE.VE..l-)
S'610 - 7 •so 1e1~
>ISO ~

- ll5-
The preliminary study has indicated that the geographical dimension generally speaking is not included in the long range planning of Danish firms. Relocation considerations are caused by acute problems such as inadequate workforce, buildings etc. The general awareness of relocation as a management tool seems to be low. When considering this observation it should be noted that Danish firms are fairly small by an international scale: only 123 firms had more than 500 employees 1974.
The present study has dealt extensively with the firms' awareness of the relocation question. Observations based upon the case studies are mentioned in section 4.5 of this report. In the present section the treatment of the topic will be extended to include the group discussions and the survey done in association with the Danish Building Research Institute. It should be borne in mind, however, that the size of the empirical basis is still limited. The conclusions must be read with this fact in mind.
At the group discussions with managers from the private (DMC) and public (DJ0F) sector 6 out of 7 groups recom
mended relocation as a solution of the management problems described in the "Louis Petersen & Co." case. This observation must, however, be seen in the light of the fact that the managers present at the group discussions were aware of the fact that one of the aims of the present survey was to investigate various aspects of the relocation of firms.
Out of the 6 groups who recommended relocation as a solution to the problems of Louis Petersen & Co. 5 groups recommended development areas for the relocation. 3 groups recommeded a partial relocation while 2 groups felt that the firm as a whole ought to move to a development area. Partial relocations included production departments (3 groups) research and development departments (2 groups) and export departments (1 group). Market contacts were mentioned as the main reason for partial relocations.
Most of the 7 groups recommended other changes as well: market research, account analysis, revised strategy, budget revisions, etc.
The discussion groups were as mentioned above positive to relocation as a solution to the problems of Louis Petersen & Co. The fact is not generally reflected in the survey of 100 companies done in association with the Danish Building Research Institute. However, 3 firms out of the 50 firms that answered the questionnaire are fairly close to the description of Louis Petersen & Co. It is interesting to note that these 3 firms all indicate that

-· ll6-
relocation to a development area maybe could be considered. A summary of the results is given in table 7.6 below.
Yes Perhaps No E
With your present knowledge of Number the development areas would of 3 5 42 so you at all consider relocation firms of your firm to a development Per area? 6 10 84 100
cent
Table 7. 6 Attitudes by 50 firms to t:he question of possible relocation to a development area.
Although this observation is based upon only 50 replies it is remarkable that 42 out of 50 firms would not even consider the possibility of moving t:o a development area. The following reasons are indicated by the firms who answered yes:
Our market expands in the development areas. quently we will consider a branch location. not expect development aid.
ConseWe do
We must find sources to finance new production machinery. Development grants is a possibility.
Possible financing of production plant. Better workforce.
Those 5 firms who indicated that they could perhaps consider relocation of their firm to a development area did not clearly give their reasons. It can be seen however, from their total answer to the questionnaire that they are aware of the possibilities of getting investment grants.
The 42 firms who answered no to this part of the questionnaire gave a total of 51 indications concerning the reasons not to be able to move from Copenhagen to a development area. The results are shown in table 7.7 on the following page.
24 out of 42 firms mentioned proximity to a main market in Copenhagen as an argument for staying. The immobility of key employees play a role as well. The international contacts through Copenhagen Airport, proximity to public institutions and highly qualified workforce seem to play a role only for very few firms. This observation is reflected in the case studies where contacts are mentioned frequently as a main factor i:hat forces firms to stay in Copenhagen. The reader is referred to section 4.3.4 of this report.
However, the rational economic evaluations tend to show that the actual costs of maintaining the Copenhagen market contacts after a possible relocation are not significant in many cases. The reason why this factor is men-
I ' i
!
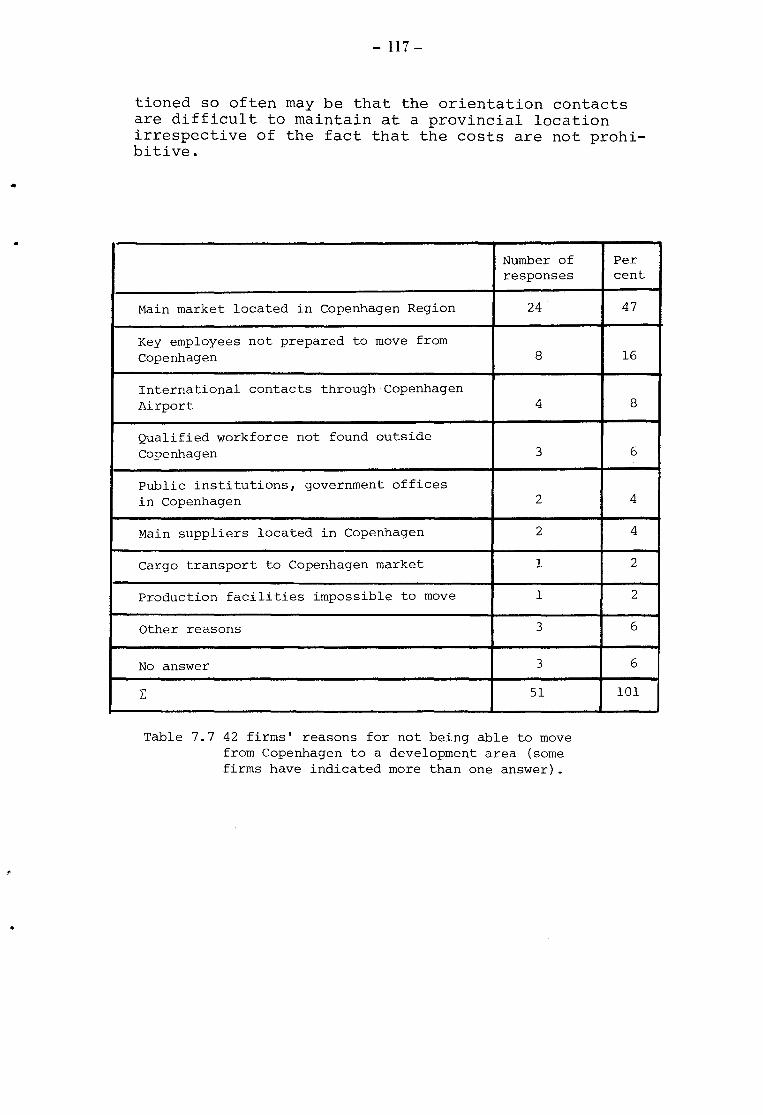
•
- 117-
tioned so often may be that the orientation contacts are difficult to maintain at a provincial location irrespective of the fact that the costs are not prohibitive .
Number of responses
Main market located in Copenhagen Region 24
Key employees not prepared to move from Copenhagen 8
International contacts through Copenhagen Airport 4
Qualified workforce not found outside Copenhagen 3
Public institutions, government offices in Copenhagen 2
Main suppliers located in Copenhagen 2
Cargo transport to Copenhagen market l
Production facilities impossible to move l
Other reasons 3
No answer 3
L: 51
Table 7.7 42 firms' reasons for not being able to move from Copenhagen to a development area (some firms have indicated more than one answer).
Per cent
47
16
8
6
4
4
2
2
6
6
101

-- 118-
These results should be related to our findings concerning the communication pattern as mentioned in section 4.3.4. Referring to table 4.6 it is remarkable that only one firm has a heavy contact intensity towards custumers in Copenhagen (Service 2) . lis mentioned above 24 out of 42 firms in the DBRI survey indicate that market proximity is a main reason for t.heir lack of ability to move from Copenhagen. These observations indicate that the firms place more emphasis on market proximity than what we should expect from a purely economic cost point of view.
It is also remarkable that only 8 out of 42 firms in the DBRI survey indicate key employee immobility as a main reason for their lack of ability to move from Copenhagen to a development area. As mentioned in section 4.4.2.1 key employee immobility is found in most case studies as a main factor making it difficult to move the firm. The lack of coherence between the case studies and the DBRI survey at this point is taken as a demonstration of the importance to use methods that allow the researcher to go behind the immediate answers of i:he respondents. If it had been possible to investigate more deeply the situation behind the DBRI respondents at this particular point it could be expected that key employee immobility and other qualitative factors would emerge to be of much larger importance, whereas the need for market proximity would turn out to be of minor importance.
Although only 8 firms indicated thai: they would possibly consider relocation to a development: area, 7 more firms were willing to answer the questions concerning this issue later in the questionnaire. This adds up to 15 answers to the question whether the firm would consider the possibility to relocate either t:he whole firm or part of the firm. Results are given in table 7.8 below.
The whole Part of firm the firm L:
Would you consider the possibility t.o relocate either the whole firm or part 8 7 15 of the firm?
Table 7.8 Preferences by 15 firms concerning possible relocation from Copenhagen to a development area.
•

..
- 119-
Respondents were asked to give their reasons why they had chosen partial relocation. 4 firms mentioned market proximity and 2 firms gave other reasons: specialized workforce cannot be found outside Copenhagen, relocation takes place because our main office lacks space.
The results of this point can be summarized as follows. In section 4.3.8 it is shown that in general the operating costs of the provinces are from 6 per cent smaller to 5 per cent larger than the operating costs of the Copenhagen location. (Percentages refer to value added). One exception is a printing firm that has a 10.7 per cent provincial advantage due to circumstances which are not of a general nature. The most important single factors are differences in
- wages and salaries
- rent
- transportation and communication costs
At this point the survey indicates that these possible quantifiable advantages do not in many cases outweigh the possible qualitative disadvantages of a relocation, i.e.
- key employee immobility
- external non-programmed face-to-face contacts
- availability of highly skilled and educated la-bour
- risk
This observation may contribute to explain the fact that only very few firms seem to be willing to consider the possibility of relocation to a development area, i.e. they do not see themselves being potentially relocateable.
The comparison of the metropolitan and provincial operating conditions in the case studies of the present project indicate that differences between the Copenhagen region and development areas seldom exceed 6 per cent of the value added.
The group discussions indicate that a 5-year public support of 4-20 per cent of the value added of Louis Petersen & Co.

-- 120 -
(i.e. about 2-10 per cent of total costs per year) would be sufficient to recorrunend a. relocation from Copenhagen to a development area. The equivalent one time support is around the double amount. 15-20.000 Danish kroner is mentioned as a sufficient amount of money per employee to recorrunend relocation to a. development area.
Table 7.9 below show the response of 12 firms from the DBRI sample to a similar question:
Per cent: of total costs of the firm
10 15 20 25 30 40 50 >50
Minimum public support for a 3 year period Maybe 3 2 2 3 0 0 l l necessary for your firm to consider re-location to a develop- Serious-ment area ly 0 l l 2 1 l l 0
Table 7.9 Necessary relocation rneasu.re strenqth to influence the location behaviour of 12 firms ..
2:
12
7
The table should be read as follows: 3 firms have indicated that a public support of 10 per cent of their total operating costs would maybe make the firm consider a possible relocation from Copenhagen to a development area .. A 15 per cent support would maybe make two more firms consider relocation. l firm would consider relocation seriously if a 15 per cent public support was available.
In general the numbers in table 7.9 seem to be higher than those indicated by the discussion groups. This may reflect the fact that the discussion groups seem to emphasize rational calculations more than those firms who have responded to this question. Moreover Louis Petersen & Co. is maybe better suited for a relocation than the firms who participated in the DBRI survey and consequently necessary public amounts are smaller. The reader is reminded of the limited size of the empirical basis for this conclusion.
...

- 121-
The results of table 7.9 are represented graphically in figure 7.10.
Per cent of total costs for 3 year period
50
40
30
20
10
7 firms
0 10
We would consider the possibility seriously
20
We would maybe consider to relocate to a development area
30 per cent of firms
Fig. 7.10 Necessary relocation measure strength to influence the location behaviour of 12/7 firms (percentage refers to the 50 firms who returned the questionnaire. Source: Table 7.8
The figure should be read as follows: If the public wishes 10 per cent of the firms to consider maybe relocation from Copenhagen to a development area, a public support of 15 per cent of the operating costs for a 3 year period is necessary. Serious considerations by 10 per cent of the firms seem to require a 30 per cent public support.
The 12 firms who have answered this question are related to the 50 firms who have returned the questionnaire The sample is too small to draw any general conclusion. The figure, however, indicates the magnitude of possible public support that is necessary in order toinfluence the very decision on relocation or not.
In the DBRI survey and in the group discussions the respondents were asked to specify both the amount of onceand-for-all aid and the amount of aid per year for a three year period of time, necessary to make them consider relocation to a development area.
Leaving liquidity demands out of consideration the fol-

- 122 ·-
lowing trade-off is valid bet:ween once-and-for-all aid (Al) and three year aid per year (A3)
Al = A3 + A3(1-i) + A3(1-i)2
i.e.
Al = A3(3 - 3i + i2
)
Setting i = 0.15 we get
Al/A3 = 2. 57
The corresponding ratio calculated from the response to the DBRI-survey is around 1.3 (based on only 3 firms), which leads to the preliminary conclusion that the liquidity aspect is of considerable importance. If the tendency observed here is of general validity (which we believe is the case) it can be concluded that a once-andfor-all payment which is more than 30 per cent larger than a three-year payment per year will be the most effective form of aid. It is interesting to note that the discussion groups of DMC and DJ0F place less emphasis upon the liquidity aspects, i.e. their Al/A3 ratio is as high as 2.9.
7.6 Relocation measure form
The preliminary study has indicated that development grants and other public support seems t:o influence the location decision process at a late stage. The final location choice is influenced somehow, but the main decision whether to move out of Copenhagen or not seems to be influenced to a very low degree.
The factors that seem to start the location decision process are frequently inadequate buildings and workforce. Those reasons are both negative in the sense that they represent problems that must be solved somehow by the firm.
As mentioned in section 1.1 of this report there has been a trend that industries/functions using unskilled workers have developed stronger in the development areas than in Copenhagen. Development aid may have been one of the factors that have influenced this trend. Consequently it is relevant to investigate whether those functions which are attracted by the present developmen1t subsidies are primarily the ones that employ a large propori:ion of unskilled workers. Moreover, it is of even greater interest in this project to study if white-collar industries/functions could possibly be attracted to the, development areas in a more selective way, i.e. by using measures that attract especially white-collar industries leaving blue-collar industries behind in the metropolis.
Recalling the fact that most location decisions are initiated by "negative" reasons and lead to a choice of location not far from the present site, we have considered a number of location policy measures that differ radically from the measures currently in use in Denmark.
- 123-
From the case studies it can be seen that especially marketing, export, R&D, and management functions employ a high proportion of white-collar staff. These functions often play a major role in the long range planning of the firms. Consequently we have searched for location policy measures that could possibly affect especially these functions.
18 location policy measures have been formulated (see annex 7.1). These measures include 6 former and present Danish regional development instruments (numbers l, 2, 3, 4, 13, 16).
It is not possible to make these measures equivalent in the sense that all measures reveal the same net economic effect on each firm. However, it has been tried as far as possible to avoid obvious lack of equivalence. One exception from this is the measure number 9 which was planned to be: D.kr. 100.000 per R&D employee for 3 years, but which turned out to be D.kr. 10.000 due to a misprint.
The firms of the DBRI survey have been asked to indicate whether they find each measure to be not important, maybe important or highly important (0, l, 2 points).
In order to simplify the analysis we have divided the firms into two groups according to their white-collar staff percentage. Our primary interest is to investigte whether the white-collar firms are attracted by the same location policy measures as the blue-collar firms. The two groups of firms are delimitated as follows:
a) Firms with mere than 50 per cent white-collar staff
b) Firms with less than 50 per cent white-collar staff
Based upon the response concerning the importance of each of the 18 location policy measures we can express two characteristics for each measure:
The selectivity of each measure, and
the attractivity of each measure
For the purpose of this investigation we have designed a definition of the term selectivity as follows:
A location policy measure is called selective if it appeals significantly more to the firms in the whitecollar group than to the firms in the blue-collar group, i.e. if significantly more firms in the whitecollar group find this particular measure more important than to the firms in the blue-collar group.
- 124 --
The attractivity of a location policy measure has been difined as follows:
A location policy measure is called attractive if a majority of all firms investigated (white- and blue-collar firms) are attracted by this particular measure.
These terms have been quantified by defining so called selectivity and attractivity indexes based on the response to the questionnaire 2 of the DBRI survey (Annex 7.1). The selectivity index has been defined as follows:
total number of points, white-collar group x 100 total number of points, all response
An attraction index has been developed along the same lines:
number of points, all response x 100 number of respondents x 2
The highest possible selectivity index value, 100, indicates that this particular location policy instrument can attract only white-collar industries while leaving bluecollar industries out of influence.
The lowest possible selectivity index value, 0, indicates that this particular location measure can attract only blue-collar firms.
The attraction index defined above takes high values for the location measures that attract many firms as a whole. The index varies between 0 and 100.
The absolute values of the selectivity and attraction indexes should not be taken too seriously. However, the ranking indicated by both indexes provide valuable information about each location policy instrument.
Table 7.11 shows the results concerning this point from the DBRI sample.
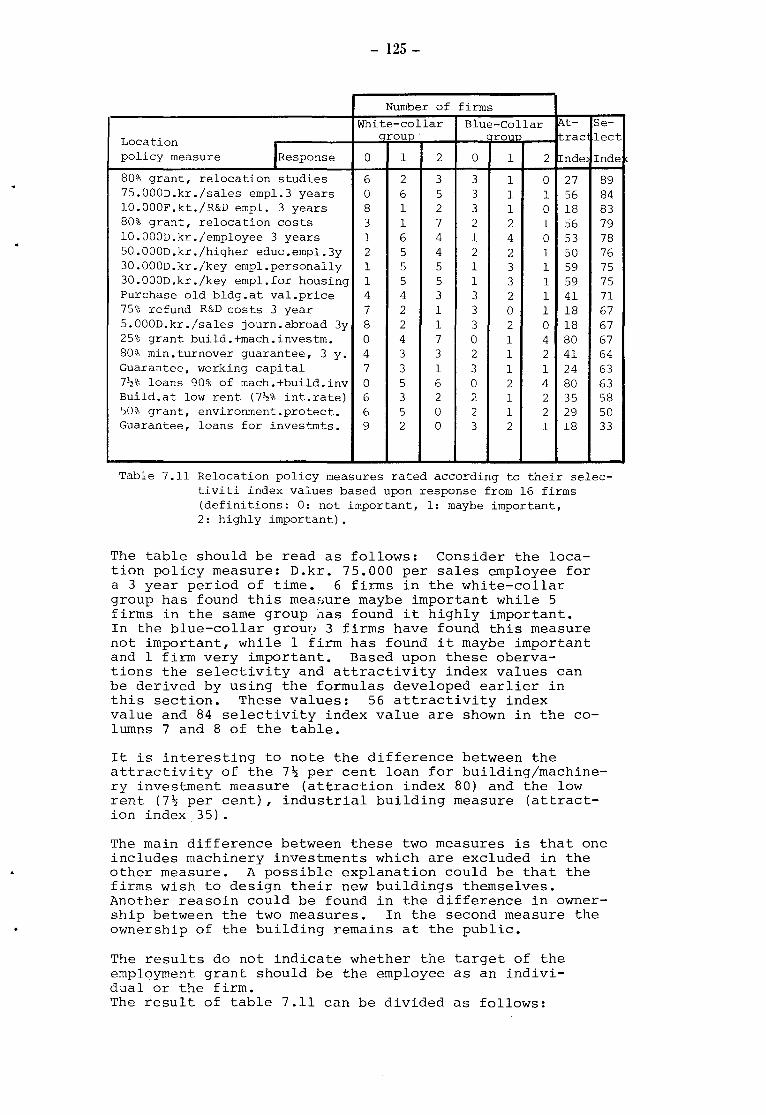
- 125-
Number of firms
White-collar Blue-Collar fA-t Se
Location qroup· rouo ~rae lect
policy measure )Response 0 1 2 0 1 2 In de Inde
80% grant, relocation studies 6 2 3 3 1 0 27 89 75.000D.kr./sales empl.3 years 0 6 5 3 1 1 56 84 lO.OOOF.kt./~&D empl. 3 years 8 1 2 3 1 0 18 83 80% grant, relocation costs 3 1 7 2 2 1 56 79 lO.OOOD.kr./employee 3 years 1 6 4 1 4 0 53 78 50.000D.kr./higher educ.empl.3y 2 5 4 2 2 1 50 76 30.000D.kr./key empl.personally 1 5 5 1 3 1 59 75 30.000D.kr./key empl.for housing 1 5 5 1 3 1 59 75 Purchase old bldg.at val.price 4 4 3 3 2 1 41 71 75% refund R&D costs 3 year 7 2 1 3 0 1 18 67 5.000D.kr./sales journ.abroad 3y 8 2 1 3 2 0 18 67 25% grant build.+mach.investm. 0 4 7 0 1 4 80 67 80% min.turnover guarantee, 3 y. 4 3 3 2 1 2 41 64 Guarantee, working capital 7 3 1 3 1 1 24 63 7~% loans 90% of mach.+build.inv 0 5 6 0 2 4 80 63 Build.at low rent (7!z% int.rate) 6 3 2 2 1 2 35 58 50% grant, environment.protect. 6 5 0 2 1 2 29 50 Guarantee, loans for investmts. 9 2 0 3 2 1 18 33
Table 7.11 Relocation policy measures rated according to their selectiviti index values based upon response from 16 firms (definitions: 0: not important, 1: maybe important, 2: highly important).
The table should be read as follows: Consider the location policy measure: D.kr. 75.000 per sales employee for a 3 year period of time. 6 firms in the white-collar group has found this measure maybe important while 5 firms in the same group nas found it highly important. In the blue-collar grou~J 3 firms have found this measure not important, while 1 firm has found it maybe important and 1 firm very important. Based upon these obervations the selectivity and attractivity index values can be derived by using the formulas developed earlier in this section. These values: 56 attractivity index value and 84 selectivity index value are shown in the columns 7 and 8 of the table.
It is interesting to note the difference between the attractivity of the 7~ per cent loan for building/machinery investment measure (attraction index 80) and the low rent (7~ per cent), industrial building measure (attraction index 35).
The main difference between these two measures is that one includes machinery investments which are excluded in the other measure. A possible explanation could be that the firms wish to design their new buildings themselves. Another reasoin could be found in the difference in ownership between the two measures. In the second measure the ownership of the building remains at the public.
The results do not indicate whether the target of the employment grant should be the employee as an individual or the firm. The result of table 7.11 can be divided as follows:

- 126 --
s E L E C T I V I T y
LOW ( < 67) HIGH ( > 67)
A 80% min. turnover guarantee, 80% grant, relocation studies 3 years D.kr. 10. 000/R&D empl. 3 years
T Guarantee, working capital * Purchase old bldg. at val.price
T L Building at low rent (7~% inL 75% refund, R&D costs, 3 years 0 rate) * D.kr. 50.000/sales journey
R w 50% grant, environment.protect abroad 3 years.
A (< Guarantee loans for inves tm ~
c 50)
T 7~% loans, 90% mach.+bldg. D.kr. 75.000/sales empl. 3 years H investm. * 80% grant, relocation costs * I I D.kr.lO.OOO/employee, 3 years
v G D.kr.50.000/higher educ.empl.,
I H 3 years
(2._ D.k:r. 30 .000/key empl.personally T
50) D .k:r. 30. 000/key empl. f. housing
y 25% grant, bldg.+mach.investm.*
Table 7.12 Location policy measures rated a.cco.rding to selectivity and attractivity. Source: Table 7.11
Note: * This measure is part of t:he current or former Danish regional development aid system.
It is remarkable that only two current or former Danish regional development aid measures are to be found among the 12 measures that are recorded to have high selectivity values. Four current or former Danish development aid measures are found among those measures with a low selectivity value. In other words: The Danish location policy measures investigated here seem to be inadequate as tools to affect the relocation of white-collar firms/ functions from Copenhagen to the provinces.
Moreover, it is possible to point at alternative location policy measures that seem to be significantly better to obtain this purpose. These alternative measures include:
Grants for relocation studies
Grants per sales employee and R&D employee
Grants per employee in sreneral
Grants per highly educated and key employee
Purchase old buildings at valuation price
- 127-
Refund of R&D costs
Grants per sales journey abroad
When considering these results it should be borne in mind, however, that the attractivity and selectivity rating is only based upon response from 16 firms.
If the tendency shown in these results can be taken as a general trend and if it is found more valuable to attract white-collar industries functions than blue-collar industries functions to the development areas, significant changes in the present development policy measures can be recommended.
The results do not clearly indicate whether transparency is a preferable attribute to a location policy measure. It is clear, however, that it is important, not only how much aid is available, but also to what purpose aid is given. It is a general observation that firms in all cases make a calculation of the net economic effect of development aid to be obtained at a possible relocation. The firm that considers relocation will thus make its decision on the basis of an estimated amount of aid although the measure may not be fully transparent. Our conclusion is thus that transparency is not a keyword in evaluating a location policy measure.
In the location policy measure classification of section 7.1 a special group of risk limitation measures was mentioned. Although it was mentioned in section 4.4.2 that the general uncertainty of a relocation is a negative relocation barrier of considerable importance, it seems from table 7.11 and 7.12 that public guarantees on working capital and loans for investments are not very appealing to the firms who have participated in the survey. Moreover, they seem to be of most interest to bluecollar firms. This point may be explained by the fact that the public guarantees tend to limit the risk of the lending institution rather than the risk of the firm itself.
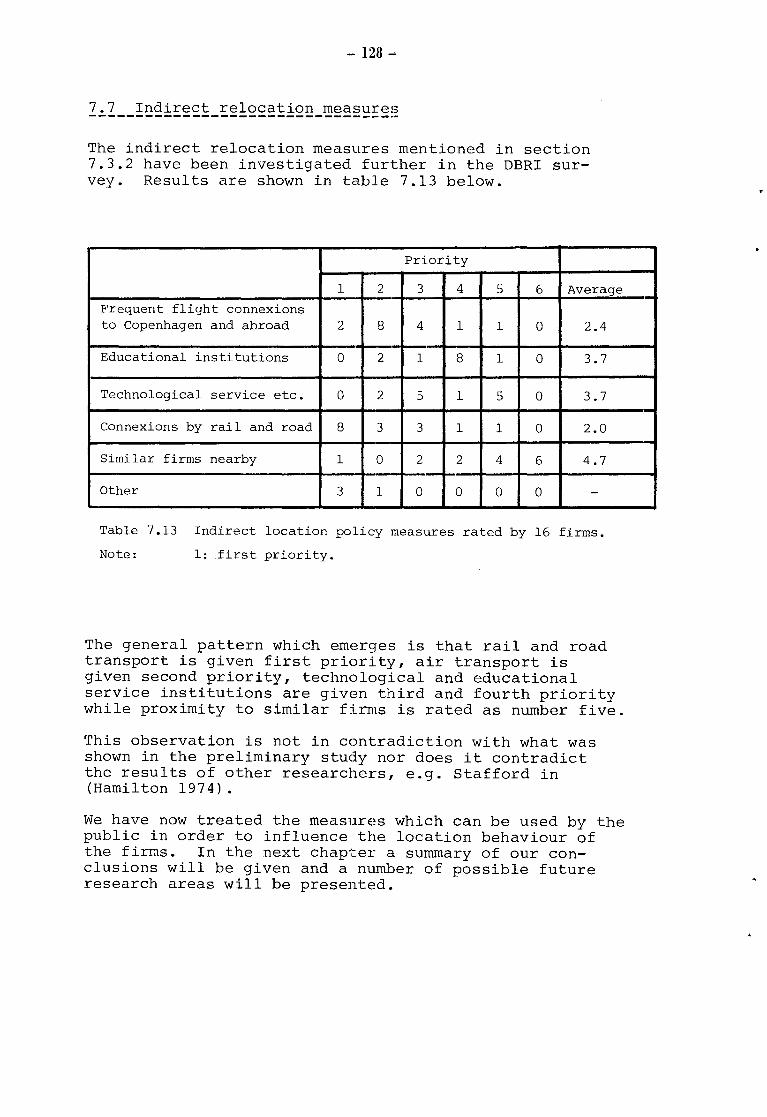
- 128 -·
7.7 Indirect relocation measures
The indirect relocation measures mentioned in section 7.3.2 have been investigated further in the DBRI survey. Results are shown in table 7.13 below.
--Priori t:y
1 2 3 4 5 6 Average
Frequent flight connexions to Copenhagen and abroad 2 8 4 1 1 0 2.4
Educational institutions 0 2 1 8 1 0 3.7
Technological service etc. 0 2 5 1 5 0 3.7
Connexions by rail and road 8 3 3 1 1 0 2.0
Similar firms nearby 1 0 2 2 4 6 4.7
Other 3 1 0 0 0 0 -
Table 7.13 Indirect location policy measures rated by 16 firms.
Note: 1: first priority.
The general pattern which emerges is that rail and road transport is given first priority, air transport is given second priority, technological and educational service institutions are given third and fourth priority while proximity to similar firms is rated as number five.
This observation is not in contradiction with what was shown in the preliminary study nor does it contradict the results of other researchers, e.g. Stafford in (Hamilton 1974).
We have now treated the measures which can be used by the public in order to influence the location behaviour of the firms. In the next chapter a summary of our conclusions will be given and a number of possible future research areas will be presented.

- 129-
8. SUMNARY OF CONCLUSIONS
This chapter is intended to serve as a summary of the project including brief notes on the methods applied and the empirical basis of the study. However, the main emphasis is placed upon the conclusions of the study.
The study has been performed 1976-78 under the supervision of an advisory group appointed by the Commission of the European Communities and the Danish Social Science Research Council. These institutions have each financed 50 per cent of the project.
The purpose of the study has been to analyse:
Which types of firms presently located in the Copenhagen area could have equal or better long term operating conditions in the provinces. (Long term mobile firms) .

- 130 -·
Which long term mobile finns face relocation barriers not higher relative to the potentially improved operating costs than they can be overcome fairly easily (potentially relocatable firms).
Which location policy measures are adequate in order to:
improve the long t:erm operating conditions in the provinces and consequently make more firms long term mobile,
reduce the relocat:ion barriers of long term mobile firms and consE~que~ntly make these firms potentially relocatable,
attract potentially relocatable firms to the provinces.
It should be stressed that the st:udy has not aimed to verify whether it is desirable or not from a public point of view to relocate certain types of firms. Moreover, it has not been the aim to investigate the effects of the present Danish regional development aid. The effec·t of infrastructure on the location behaviour has only been treated to a limited extent.
The present study was preceeded by a preliminary study, which took place in 1975. The preliminary study provided the background for the methods used in the present study, and it produced a number of hypotheses especially concerning the location decision-making process of firms.
The present study has been concerned especially with relocation of firms located in the Copenhagen region. However, it has been argued that many of the results obtained are also valid for expansions of local firms and relocations in general.
The main activities, which have been performed are the following:
A critical examination and summary of various measures for influencing locational behaviour of firms.
An analysis of a questionnaire investigation into the relocation of firms in Denmark, 1960-75, carried out by the Danish Building Research Institute.
Intensive investigations of a total of 19 Danish firms, 3 of which were actually involved in location decision processes at the time when this study took place. (Both Copenhagen and province located es1:ablishments were investigated) . A more detailed description of these investigations is given below.
An initial investigation of the importance of:
technology organizational structure
- 131 -
financial institutions local authorities etc.
in the locational choice of the firm.
A simulated test of various location policy measures based upon:
1. A questionnaire investigation of 100 firms. The firms were asked to evaluate a list of approximately 20 location policy measures. Furthermore, the firms were asked to quantify the necessary economic size of the measures to make the firms seriously consider a relocation.
2. Group discussions with top managers.
A case story of a potential relocateable firm was constructed and 4 groups of top managers were asked to analyse the firm and make recommendations concerning potential actions for the management of the case firm. Furthermore, these managers were asked to evaluate the possible effect of each of the potential location policy measures as tested in 1.
3. Finally the management of 19 firms were interviewed to get their evaluation of the location policy measures.
The intensive investigations mentioned above included a large number of data from each firm. The data collected include:
Sub-sector
Number of establishments in Denmark
Function and production characteristics
Number of owners
Turnover, value added and exports
Employees
Research and development
Variability (change in turnover, employment, technology etc.)
Market relations
External face-to-face contacts
Possibilities of decentralizing
Moreover, consequence analyses have been carried out for each firm, which means that a location in Copenhagen has been compared with one or more possible locations in the provinces. The following have been calculated:
1. Difference in operating costs of specified provincial locations compared to Copenhagen.

- 132 --
2. The sum of 1 and possible effE~cts of regional development aid if any of ·the alternative locations investigated is inside a development area.
3. The sum of 2 and possible reductions of operating costs due to the relocation itself, but independent of the actual location selected.
The following summary of the results is based upon chapters 4, 5, 6 and 7 of this report. We have tried to make the summary as brief as possible and refer the reader to the chapters mentioned for further details.
It should be emphasized that the conclusions mainly are based upon the intensive investi~Jations of firms. The descriptions of these investigations are confidential and consequently not available to the reader. To illustrate the depth of these investigations, it can be said that all investigations were carried through in close collaboration with the management of firms over a period of 3-12 months.
The concept of mobility of metropolitan firms could be divided into three different aspects:
1) Which kind of metropolitan located firms or functions have been mobile in the past?
2) Which kind of metropolitan loca;ted firms or functions would face equal or better operating conditions in the provinces (long term mobile firms) and which of t~hese ar,e facing relocation barriers of reasonable size compared to e.g. the potential net savings due to improved operating conditions (potentially relocatable firms)?
3) Which kind of metropolitan loca;ted firms and functions could be expected to be mobile in the future (dependent upon public location policies)?
Concerning 1) the decentralization of economic activities away from the Copenhagen Metropolitan Region seems up to now mainly to have involved:
production units
more routine oriented managerial functions/firms
local private services
local public services
This development leaves mainly headquar1ter functions and superior services (i.e. service firms/functions with no or little local geographical adherence) in the metropolis.

- 133 -
The decision making process when considering a relocation reflects to some extent this development. In general firms do not incorporate location in their long term planning. Therefore acute problems (lack of space, inadequate workforce etc.) usually initiate location considerations. This often results in a rather unsystematic decision making process with a lot of non-investigated alternatives. The preliminary study has shown that many metropolitan located firms do not investigate (or even consider) a provincial location, an observation which has been further documented in this study.
Especially headquarter functions and some service firms do not appear to investigate the possibility of provincial locations. Furthermore, factors like contact frequency, technology employed (possibilities of decentralization) and market characteristics seem to be correlated with the results of the decision making process (as to stay or move out of the metropolis) •
As the firms studied in the preliminary study did not in general evaluate the consequences of alternative locations as a part of their normal planning procedure, the preliminary study could not conclude whether the metropolitan location was a sine non qua condition for those firms who stayed. Consequently the present study has focused on evaluations of the consequences of alternative locations for different types of firms and functions in order to identify which of the metropolitan oriented firms/functions are in fact long term mobile.
As far as the consequences can be estimated economically, it has been shown that the net yearly savings between a provincial location (outside the big cities) and a location in The Copenhagen Metropolitan Region varies in the range of: +6 per cent to -5 per cent of value added. When measured against total costs the corresponding figures are: +3.5 per cent to -3 per cent of total costs.
This does not include effects of possible regional development aid which might increase the net savings of a provincial location by about 2 per cent of value added.
This main conclusion in fact could be further generalized:
For most firms not having a local market or being dependent on a local raw material the spatial cost variation is fairly small.
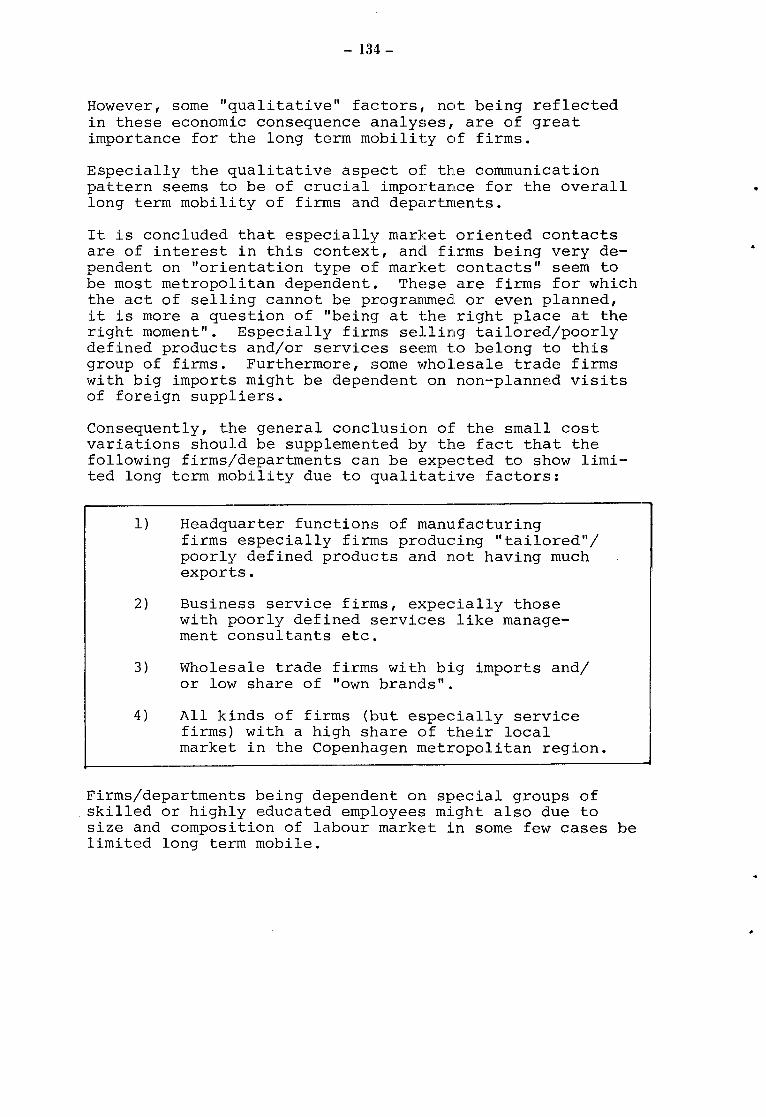
- 134 --
However, some "qualitative" factors, not being reflected in these economic consequence analyses, are of great importance for the long term mobili t:y of firms.
Especially the qualitative aspect of the communication pattern seems to be of crucial importance for the overall long term mobility of firms and departments.
It is concluded that especially market oriented contacts are of interest in this context, and firms being very dependent on "orientation type of market contacts" seem to be most metropolitan dependent. These are firms for which the act of selling cannot be programmed or even planned, it is more a question of "being at the right place at the right moment". Especially firms selling tailored/poorly defined products and/or services seem to belong to this group of firms. Furthermore, some "t.-Tholesale trade firms with big imports might be dependent on non-planned visits of foreign suppliers.
Consequently, the general conclusion of the small cost variations should be supplemented by the fact that the following firms/departments can be expected to show limited long term mobility due to quali t:ative factors:
1) Headquarter functions of manufacturing firms especially firms producing "tailored"/ poorly defined products and not having much exports.
2) Business service firms, expecially those with poorly defined services like management consultants etc.
3) Wholesale trade firms with big imports and/ or low share of "own brands".
4) All kinds of firms (but especially service firms) with a high share of their local market in the Copenhagen metropolitan region. J
·---
Firms/departments being dependent on special groups of skilled or highly educated employees might also due to size and composition of labour markE!t in some few cases be limited long term mobile.
•

- 135-
This general conclusion could be elaborated further:
The probability of a firm or a function being long term mobile (i.e. face equal or better operating---conditions in the provinces as opposed to the metropolis) will gradually decrease by the following firm/ department characteristics:
1) High external face-to-face contact frequency
2) High dependency on "orientation type" market contacts.
3) Many "tailored" products/services.
4) High share of white-collar employment.
5) Well developed headquarter functions.
6) Low exports.
7) High value added per employee.
8) High share of total market in the metropolis
These characteristics are not listed according to any priority.
It should be noted that there is a high degree of co-variation between some of these factors.
Because of a covariation between contact frequency and white-collar employment and furthermore the relatively small differences in salaries (metropolitan vs provincial location) for these occupations, firms with a high degree of vrhite-collar employment usually will not experience big advantages (if any at all) by a provincial location.
In general the more export oriented a firm is the more independent it seems to be of a metropolitan location. This is due to the fact that the contact frequency for foreign customers is very low compared to customers in Denmark. Having a high export rate means that the local market is correspondingly smaller. Thus the proximity to the Copenhagen market ceteris paribus is of less importance to firms with high exports.
Turning to the concept of potentially relocatable firms and departments it can be concluded that for many long term mobile firms the relocation barriers make them non potentially relocatable.

-- l:J6 -
The most important relocation barriers are:
l) Investments in buildings ,r relocation costs of machinery or investment in new machinery etc.
2) Dependence on immobile key employees.
There does not seem to be any correlat:ion between these relocation barriers and firm characteristics, except for firms characterized by key employeE~s within the following groups:
Research and development
Marketing and sales
Services
Investments in machinery and buildings of course are corn~lated with the capital intensity of the firm.
On the other hand possible positiv~ relocation effects can increase the probability of being potentially relocateable. Positive relocation effects are savings due to new technology or a new organization, changes which can not be carried through at the existing location.
In fact in this study we have observed that these firms which really could save money by a relocation are the firms where positive relocation effects are important.
A general conclusion on the terms long term mobility and potential relocatability would be:
Taking into consideration the uncertainties of the calculating method, the many non-quantifiable factors and in general the costs and uncertainties involved in a relocation,the possible savings of a provincial location, in general, are not by themselves of sufficient magnitude to motivate a relocation even if there were no relocation barriers.
The third aspect of the mobility of me·tropolitan firms and functions is to answer t~he question of which firms and functions should be expected to be mobile in the future and which kind of public measurE~s might influence this in which way.
In general there is a high inertia in the spatial distribution of activities. This means e.g. that headquarter functions and superior private services are believed to remain in the metropolis to a very big extent.

- 137-
Future development in technology (edp, non mass production technologies, telecommunication etc.) and the organizational development of the firms might involve higher degrees of freedom concerning decentralization and the location of the individual functions.
The possibilities of vertical decentralization (i.e. product oriented departments with all managerial levels) up to now seem to have been very limited, especially for service firms.
Future development of edp, telecommunication and the organizational and controlling capability of the firms might however induce greater possibilities of vertical decentralization. Greater emphasis on the values of the local community and smaller economic units with shorter communication links might also push this development forward.
However, a crucial point will be whether new technologies will be more or less apt for non-mass production and e.g. which role the future energy situation will play in this development.
Having briefly summarized the major conclusions regarding mobility of metropolitan firms and functions, we will now proceed to summarize the study's conclusion as to how public policies can influence the locational behaviour and future mobility of firms.

-· 138 -
This section briefly summarizes our conclusions concerning location policy measures. It should be borne in mind that restrictive measures have not been investigated. Moreover, it is noted that we have not limited ourselves to measures that today are acceptable within the framework of the EEC.
The present regional development. aid, although aimed at a broad target group of manufacturing and service firms and functions, has mainly appealed to capital intensive manufacturing departments, which employ blue-collar workers. This statistical observation has been supported by the case studies and by contacts with a wide circle of firms, which have been confronted with a number of possible location policy measures.
Some firms, which have received development aid, have used this aid in order to increase the degree of automatization. Thus the development aid in some cases may have resulted in a reduction in the number of jobs.
Relatively speaking, the present development aid has not managed to affect the behaviour of metropolitan oriented firms and functions. It has not been able to reduce the concentration of headquarter functions and superior service firms/functions in the Copenhagen area. A significant change in the present regional development policy is required in order to attract service, research and development, marketing, innovation and other headquarter oriented functions to the provinces.
Less than 20 per cent of the managers of firms located in Copenhagen indicate a positive attitude to considering possible relocation of their firms t~o development areas. This is presumably a result of the fact that only a small percentage of firms seems to include the geographical dimension in their long range planningr. As mentioned previously, relocation considerations mainly seem to turn up in situations where an acute lack of adequate space or workforce is prevailing. These firms, having realized that: a relocation is necessary, at an early state delimit their locational search either to the immediate proximity of the present location (this takes place in a large majority of the cases) or to the provinces, especially in the development areas. After having made a decision in principle (often not in a formal sense) the managements of the latter firms get into contact with t.he regional development agencies in order to investigate the possibilities of obtaining regional aid and finding adequate possible locations in the development areas.
The development aid consequently tends to influence mostly the final location choice and not the basic choice, whether to move away from Copenhagen or ·to stay in the city.

- 139-
If the basic relocation choice (whether to move away from Copenhagen or to stay in the city) should be influenced more effectively by the public, a number of changes and additions to the present regional development policy are required.
It is necessary to find measures that can affect the planning process of the firms at an earlier stage.
Based upon discussions with the firms investigated we have established a list of measures that can possibly affect the planning process at an earlier stage. A number of these measures are mentioned later in this section. The Swedish location policy measure, release of investment funds for regional development investments, will have the same effect.
As mentioned earlier, for almost all the firms investigated, the geographical cost variation is fairly small. Moreover, the observed importance of the non-programmed orientation contacts together with the fact that these contacts from a pure cost point of view are insignificant, lead to the conclusion that
---·----·---.. -- ~
The question of relocation is more of a qualitative - than a quantitative nature for the metropolitan oriented firms.
We have observed a number of cases, where the location behaviour of the firm has been influenced considerably by local activities. It seems to be clear that proper marketing and active participation in the locational search of the firms by local municipalities has been able to attract a number of firms to those specific local municipalities. This observation is reflected statistically by observing the differences between individual local municipalities concerning the amount of development aid received. The differences are very large and it is recognized that there is a correlation between the acquisition activity level of the local municipality and the amount of regional development aid received.
These observations apparently of importance for the actual choice of location by those firms, which have already decided to relocate, also have significance for future policy. In general it can be concluded that it is possible for the public to influence the location behaviour of the firms. We have not investigated in depth whether the location guidance recently proposed in Denmark will be an adequate mean to do so, but expect that the provision of relevant regional data in some sort of public location guidance will be able to some extent to draw regional aspects in-

- 140-
to the decision-making process of a number of Danish firms.
It can be added that this st:udy indicates that firms, which are encouraged to analyse their location situation, in fact introduce relocation poSsibility into the planning and management decision process. Consequently, it can be concluded that
A more active marketing of the development aid measures should take place with the purpose to bring the relocation possibility and other geographical aspects into the planning process of the firms.
In this connection and based upon the assumption that it is desirable to attract more white-collar firms to the provinces, it can moreover be concluded that
It should be investigated further whether present location policy measures should be differentiated according to
Type of firm or function
Emigration/immigration area
This could make it possible to design policy measures specifically aimed at encouraging firms with traditional metropolitan functions to relocate to or to expand their activities in the areas where these functions are less developed.
Such policy differentiations and a :number of new location policy measures could lead metropolitan firms/functions, with mostly white-collar employees, to consider relocation. Based upon discussions with the firms investigated (the case studies) and a further confrontation of possible relocation measures with a wide circle of managers, the suggested location policy measures have been evaluated as to their appeal to especially white-collar oriented firms.
These investigations have lead to t~2 following main conclusion concerning which location policy measures could possibly influence firms/functions with a majority of white-collar employees more effectively:
..

- 141-
* The following location policy measures can be expected to be more effective than the present regional development aid if it is desired to influence those firms, which have a majority of white-collar employees:
grants for relocation studies
grants for sales employees and R&D employees
employment grants in general
grants for highly educated and key employees
purchase of old buildings at valuation price
refund of research and development costs
grants per sales journey abroad
The possible side-effects of these location policy measures have not been investigated. This point has been proposed as a future research area in section 8.4.4.
The present Danish location policy measures investigated in the study cannot be expected to be sufficiently selective to affect the relocation of white-collar firms from Copenhagen to the provjnces. Only two out of the six existing measures can oe expected to be selective in that they will manage to a~tract expecially white-collar firms. These measures are:
Grants for relocation costs
Grants for building/machinery investments (partly selective)
Loans for machine/building investments, guarantee on working capital, low rent buildings and guarantees on loans for investments are not selective in this respect.
Our basic conclusion concerning the present Danish location policy measures can thus be summarized as follows:
* The measures are defined more precisely in annex 7.1, scheme 2.
- 142 --
The present Danish location policy does not contain measures that can be expected to attract effectively fims/funct:ions with traditional metropolitan activities to relocate those activities to the provinces. Significant changes in policy measures are recommended if it is desired to reach this aim. These possible changes should be based upon viewing the relocation of metropolitan oriented firms/functions as being not only of a quantitative nature. A qualitative aspect which is especially important is ·the non-programmed orientation contacts. A more active marketing of development aid is recommended and location policy measures should be more differentiated than they are at present. The policy measures should be directed more clearly towards white-collar firms and they should aim at affecting ·the firms planning process so that relocation will be part of the long range planning of more firms. Furtheremore, the location policy measures should aim at affecting in particular the early stages in the location decision-making process.
In this section a number of areas for further research work are recommended. The list does not indicate any specific priority. It should be noted that some other possible research areas are described in the preliminary study report (Kolind & Matthiesem 1975).
8. 4 .1 Locatio:1 of service fims and service functions -----------------------------------------------------The location of service firms and SE~rvice functions within firms is an important question to be investigated further. The superior service firms seem to be among the ones that face the largest problems when considering relocation from Copenhagen to the provinces or they face significant relocation barriers. Moreover, the management and service functions of larger fims are over-concentrated in the metropolis. In the present study we have developed some conclusions on which public location policy measures could be applied in order to affect the location behaviour of such firms and functions.
However, we have not been able to reach at statistically significant conclusions. It is our recommendation that more research is initiated in this area.

- 143-
As mentioned in section 1.6 the establishment and development of firms presently located in the provinces is not covered by the present study.
However, it is known that these firms play an important role in the development of the provinces.
A considerable public effort takes place already in order to stimulate this development of existing firms in the provinces. However, no coordinated assessment seems to be available on which public measures could most effectively stimulate this local activity. It is our suggestion that this area be given attendance in the planning of future research activities and such research be closely coordinated with the research regarding location policy instruments.
§~~~~-~h~-!~E~£~_2f_~~£h~2!2~!£~!-~~~-~2£!~!-~~~~12E~~~~~ on the location behaviour
In the present project it has not been possible to consider in depth the impact of technological and social developments, i.e.
Organizational structures
Management and control technology
Data communication technology
on the location behaviour of the firms. These factors in general are not seen as location policy measures. However, it is clear from the observations of the present study, that they play an important role in the location behaviour particularly of metropolitan oriented firms. This role should be investigated further in the future.
In the present study a quantitative rating of location policy measures according to their selectivity and attractivity has been set up. Unfortunately the results of the study at this point are only based on a limited empirical material. The results, however, seem to indicate that a further research effort could be worth while.
It has been said many times in this report that a more active marketing of the regional development aid is required in order to reach firms at an earlier stage in the location decision-making process. However, it cannot be assessed fully how this should be done. 've recommend that this area too should be considered in further research efforts.

- 144 -·
Our conclusions concerning the possible effects of location policy measures have concentrated upon the possible influence of these measures on the location behaviour of Danish firms. However, we have not :investigated possible side-effects of these measures and we recorrunend this as an area of further study before possible changes are made in the location policy.
Moreover, we have not investi.gatE~d in dE~pth the effects on the location behaviour of the firms caused by infrastructure (road, rail, air) and decentralization of public authorities.
It is recommended that this guest:ion is investigated further.
8.4.5 Local labour markets --------------------------In the study we have assumed that the locations chosen for consequence analysis have been fairly large so that a limited local labour market will not affect the operating conditions of the firms. However, it is clear that this is not correct in all cases. The actual size of the local labour market and its effect on the operating conditions of the firms should be investigated further. Moreover, it should be invest.igat:ed in <;reneral which towns are adequate to host which kinds of firms. The question should be seen both from the town and the firms point of view.
8. 4. 6 Which firms are desirable t:o relocate? -------------------------------------------This project has indicated some public measures that could effectively influence the location behaviour of various types of firms. However, it has not aimed to delimitate which firms are actually desirable to relocate from a public point of view. This question is a highly political one. However, research activities are necessary in order to investigate the possible effects on the emigration and immigration areas of relocating various types of firms. This could possibly be done through a consequence analysis technique similar to the one applied in the present study, the object of the consequence analysis being the local and regional corrununi ty as a whole and no·t only the f.irm/function relocated.


- 146 --
REFERENCES:
Administrationsdepartementet: Udredning af kursformlen for et serielan, Notat, K¢benhavn 1977.
Agersnap, T.: Modeller i organisationsla~ren, Civil¢konomen, K¢benhavn 1978.
Back, Rolf m.fl.: Lokalisering och ekonomisk strukturutveckling, Malm¢ 1970.
Bet~nkning afgivet af udvalget for lokaliseringsvejledning, K¢benhavn, 1977.
Christiansen, Ulf & Kolind, Lars: Interim Report on an investigation into the Relocation of Business and Industrial Establishments in Denmark, 1960-1975., Danish Building Research Institute, 1977.
Deglomeration Policies in the EuropE~an Community - A comparative Study, Berlin 1978.
Direktoratet for Egnsudvikling. Arsberetninger 1974-77.
Forskningsstatistik 1975, Udredning nr. 1-1977, Forskningssekretariatet, K¢benhavn 1977.
Goddard, J. B. & Morris, Diana: 'I'he Communications Factor in Office Decentralization, Progress in Planning, Volume 6, part 1, Great Britain 1976.
Green, D. Howard: Industrialists Information Levels of Regional Incentives, Regional Studies, Vol. 11, Great Britain 1977.
Hamilton, F.E.I.: Spatial Perspectives on Industrial Decision-making, London 1974.
Industristatistik 1976, Statistiske Meddelelser 1978:2, Danmarks Statistik, K¢benhavn 1978.
Kolind, L. & Matthiesen, P.H.: Alternativ lokalisering af Storbyerhverv, Forstudium, DSKV, K¢benhavn '1975.
Kornmunerne og egnsudviklingen, Kommunernes Landsforening, K¢benhavn 1977.
Maslow, A.H.: Motivation and Personality, 2nd edition, New York 1970.
Matthiesen, Peter H., et.al.: The Agglomeration Problem in Denmark, Copenahgen 1977.

- 147-
Matthiesen, Peter H. & Hoffmann, H.: The Role of the Tertiary Sector in Regional Policy - Denmark - Analyses, Copenhagen 1978.
Nord REFO: Alfa-studiet, 1975.
Nord REFO: Analyse af regionalpolitiske virkemidlers effekt, 1977.
OECD, Reappraisal of Regional Policies in OECD Countries, Paris 1974.
Regional Incentives in the European communityA comparative Study. Berlin 1977.
Schein, E.H.: Organizational Psychology, K¢benhavn 1971 (In Danish).
Statistikken, Funktion~r l¢n september 1977, Dansk Arbejdsgiverforening, K¢benhavn 1978.
Statistikken, nr. 3, 25. argang, 3. kvartal 1977, Dansk Arbejdsgiverforening, K¢benhavn 1978.
Statistisk Arbog 1975, Danmarks Statistik, K¢benhavn 1976.
Thorngren, B.: Communications studies for government office dispersal in Sweden in M. Bannon (ed.): Office location and Regional Development, Dublin 1973.
Thorngren, B.: How do contact systems affect regional development, Environment and Planning, Vol. 2., 1970.


•
PROJEKTGRUPPEN ALTERNATIV LOKALISERING AF STORBYERHVERV
LARS KOLIND I PETER H. MATTHIESEN
FINAL REPORT I ANNEXES ~[El(Q)C~U~(Q)[rJ] (Q)f [E(C(Q)[rJ](Q)M~C L~CU~W~U~[E~ U~~[[]~U~(Q)[rJ]~llW lCDC~U[E[[] ~[rJ] U~[E (C(Q)[p)[E[rJ]~~(GJ[E[rJ] ~~[E~

•
•
..

f
- 151-
LIST OF ANNEXES
Annex 1. 1
Annex 1. 2
Annex 1. 3
Annex 3.1
Annex 3.2
Annex 3.3
Annex 3.4
Annex 7.1
Annex 7.2
Annex 7.3
Page
Working Plan 153
Regional development areas in Denmark 1976 and 1979 • • . • • • • • . . . • . . • . . . • . . . . . • . . . • . . . 169
Counties and major cities in Denmark 1978 173
List of cases, alternatives investigated 177
Guides for firm description and consequence ana Lyses . • • • • • • • • • • • • • • • • • • • • • • • • 183
Questionnaire used to investigate the relocation barriers for key employees having moved together with their firms
Questionnaire used to investigate relocation barriers for employees in BUILDING 1 •••••••••
Questionnaire used at the survey done June 1978 in association with the Danish Building Research Institute .••••••••••
Description of the case study "Louis Petersen & Co." •••••••••••••••••••••••
Summary of the results of group discussions in the Danish Managment Center (DMC) and the Danish Lawyers and Economists Association (DJe'JF) •••••••.••• • • • • • • • • • • • • · • • • • • • • • • • • • • • •
197
203
207
213
223

t

'
PROJEKTGRUPPEN ALTERNATIV LOKALISERING AF STORBYERHVERV
Annex 1.1 Working plan
(Extract from annex l to contract, September 1976) .
LARS KOLIND, PETER H. MATTHIESEN
FINAL REPORT ~[El(Q)(C~U~(Q)~ (Q)f [E(C(Q)~(Q)M~(C ~CU~W~U~lE~ U~~[D)~U~(Q)~~llW l(Q)(C~lf[E[D) ~~ U~[E (C(Q)~[E~~~~[E~ ~~[E~

1

- 155-
2. ;voRKING PLAN
It is suggested that the further study be divided into the following
sub-stages:
Sub-stage 1: Critical exa:nination ::md sum:nary of various measures
Sub-stage 2: Investigation by questionnaire into the relocation of
undertakings in Denmark
Sub-stage 3:
Sub-stage 4:
Sub-stage 5:
Sub-stage 6:
Intensive undertakinJ~nvestigations, Type 1 1)
Intensive undertaking investigations, TyFe 2
Interim report
Initial investigation of the importance of some
selected factors in undertakings r1
6hoice of locatiun
Sub-stage 7: 1 Simulated test 1 of measures and assessment
Sub-stage 8: Final report
The individual sub-stages are explained belo~·,, toGether with a further
sub-division into sub-activities.
2 .1. Sub-stage 1: Critical e~~amination and summary of various measures
Taking as a basis the feasibilitYstudy 1 s re~ort on the decision
making process in an undertaking considering alternative location
, a critical examination is first carried out of other investigations
into the effect of various measures in regional policy.
The purpose of this is to form an initial rou~.:;h assessment of the
various measures employed abroad and in this country as a basis for further
work and discussion with the undertakings investigated.
The investigation of foreign measures is suL·pleraented by dic;cu::;;-;ion:.:;
with Danish officials and others concernint the pos;:;ible measures.
1) Undertakings within the groups "Traditional Metropolitan economic activities" as defined in the feasibility study.
- 156 --
The Regional Development Directorate will therefore be contacted,
as well as regional trade councils, the J'vlinistry <Df the Environment,
associations and others.
Arart from this, other measures that might be employed will be
formulated.
As work on the project's other sub-stages progresses, thiB initial
consideration of measures will become more spHcific, and perhaps supr;lemented.
Contact with the institutions referred to will therefore be maintained
to discuss the proposed measures as they become more specific.
It should be noted that in this initial consideration of mea3ures and
later in the project when these measures become more sr.ecific there will be
no kind of political assessment of the measure~s, aJ;art from the dcr1arcati()l1
implied by the fact that we can only work with measures that the }'roject '::;
Advisory Group considers to be generally acceptable to the community.
This sub-stage will include the following sub-activities:
1.1. Critical examination of the 1:1easures
1.2. Contact with various institutions
1.3. Reporting back
2.2. Sub-stage 2: Investigation by questionnaire into the relocation
of undertakings in Denmark, 1960-1975
Sub-stage 2 includes a retrospective random sample investicatiott of
the relocation of undertakings within the large town-orientated enterl'rises
category during the period 31 December 1960 to 31 December 1975. The
questionnaire's results will form the background to the other sub-stc'it:i;eS
by identifying those forms of undertaking and C'~partments of an undertaldnc;
that are actually moving/relocating.
These results will then be compared with the results of the tc-.tcn<3i'
undertaking analyses (Sub-stages 3 and 4), with a view to distinf;uishinc
undertakings that are potentially movable. The results will also be empJn
in tGe Sub-stage 7 assessment of the anticipat,ed effect of alternative rneth 's.
"

- 157-
Finally, the selection of undertakings in Sub-stage 7 will be carried
out, using this questionnaire as a basis (and also perhaps for the selection
of some undertakings in Sub-stage 4).
The investigation itself (Sub-activity 2.1 - 2.4, see below) will be
carried out by the National Building Research Institute (Statens
Byggeforskningsinstitut) and the Danish Statistical Office (Danmarks
Statistik), possibly in co-operation with the f-iinistry of the Environment,
whereas the statistical consideration and preparation of the report (Sub
activity 2.5 - 2.6) will be carried out by the Project Group.
The object is to illustrate undertakings' relocation patterns, not
only where a complete relocation is concerned but also where a partial
relocation (of parts of an undertaking, for example a manufacturing department)
is concerned. In describing the relocation pattern, the interest lies in
relocation between the metropolitan area and the rest of the country,
relocation in the provinces, relocation within the metropolitan area
(especially between the town centre and the suburbs) and relocation between
the larger provincial towns and their suburbs. As concerns the largest
municipalities, the unit of area upon which undertru~ings and their local
economic units are to be evaluated must therefore be less than a municipality.
It should be noted that official statistics provide no orJ-ortunity
for extracting the informat~_on desired and, similarly, only very limited
research is available on this in Denmark (random samples in less than 200
undertakings in the ¢resund area and North Jutland).
The planned random sample covers 2000 undertakings extracted from
the Danish Statistical Office's trade register. The questionnaire will
seek initially to obtain information on an individual undertaking's age and
original address. The respondent will then be asked to give all addres3es
it is operating from on 31 December 1975. For each address, it i::; asked
whether the main activity at the location concerned is manufRcturine,
management and administration or sales (perhaps a combination of these).
At the same time, the number of employees is given, distributed betvH~en the
given categories.
Moves during the period are then illustrated by giving all a<ldre,-;ses
established and relinquished.

- 158-
Finally, the management is asked whether it is willing at a later
date to be interviewed about the considerations that precede any relocations.
The investigation itself can be divided into six sub-activities:
2.1. Preparation of questionn<'lire amd list of un·lertakings included
in the random sam11le. Budget and detailed programming.
2.2. Distribution of questionnaires and their collection after a
short interval (1-2 weeks).
2.3. Coding and che::::king of questionnaires.
file.
Preparation of data
2.4. Freparation of schedules of conclusions and tabular summaries.
2.5. Further statistical processiq; of data, i. a. to permit hypothesis
testing.
2.6. Preparation of report.
Annex 4 gives a detai1ed desc'ription of the investigation and a
proposed draft for the questionnaire.
2.3. Sub-stage 3: Intensive undertaking investigations\) Type 1
At this stage, a thorough study is carried out of 3-5 undertakings
or departments located in the metropolis (referred to below as Type 1
undertakings) that are actually considering alternative location during
the working period of the research project.
These are selected on the basis of the :feas:i bili ty study 1 s provisiona:
establishment of some essential typological circumstance3 that chiJ.racterize
metropolitan trade and industry, namely contact frequenc;r and market
conditions It is therefore attem:pted to select _:i-5
undertakings (and/or departments) that reflect the circumstances of high/1m:
contact frequency and 1 opaque 1/
1 transparent 1 marke·t.
To avoid any distortion in the inv~!stication throt;gh comi,leration
merely of undertakings that employ manage.;Jent consultants, and in order to
create a better O}~portunity for selecting relevant undertG.kings, the firms
in this and the following sub-stages will not be limited to :uembers of D.St:.V
(Danish Association of !1anagement Consultants). If necessary, contrtct
1) see note on page 6
...

- 159-
will be made with other firms, partly through other consultants (accountants,
solicitors, etc), partly by means of the extensive questionnaire and partly
through contact with regional trade counc.ils and their joint councils.
The feasi bili 1;y study indicates a willingness on the part of the
undertakings which, combined with the op:portunity for giving the rarticipating
undertakings an advantage in the form of discussions and analyses of the
undertakings' location situation in the further study, should make it ~ossible
to secure the participation of the necessary relevant undertakings.
3ince in this sub-stage the analyses are carried out while the
undertakings are considering alternative location, it is expected that
the analyses will provide a better understanding of the deci3ion-rnakine
process and so have better appreciation of any later rationalization, which
is still conceivable notwithstanding the feasibili~study's detailed ~nalysis,
since all undertakings hitherto investigated have already completed their
considerations.
Althoush the undertaking analyses of the feasibilizy study were
concentrated upon the decision-making process, and to a lesser extent upon
the operational conditions for undertakings/departments in the provinces as
opposed to the metropolitan region, this further study ~ill concentrate Uion
analysis of the operational conditions, and so establish the concept of
potentially movable undertakings/departments as well as the ex:pected effect
of the alternative measures upon their choice of location.
Each examination of Type 1 undertakings will be organized as a r.ro1•er
'location project' in which the project researcher and management consultant,
in co-operation with representatj_ves of the undertaking, will carry out
consequence analyses of alternative location pQssibilities, exem}lified by
a location in the· metropolitan area and a location in the 11rovinces.
'rhe aim of these consequence analyses is to illustrate quantitr.-ltively,
as far as is possible, the operational conditions for the undertaking or
department in the metropolito.n area compared with a potential locatioP in
the provinces.

- 160-
An essential starting point in describillg the economic and non-economic
factors that affect the operational conditions for the undertakings will be
the feasi bili cy study's initial charting of th~~ individual factors LinJ their
significance to the f easi bili cy study 1 a undertakings.
The individual items in the profit and loss account will be assessed,
and a.n attempt will be made to estimate these in relation to the rrovincial
location. Nany of these i terns can be estimat~~d directly, for example wages,
rent, transport costs, raw material costs, energy costs, etc.
To be able to estim3.te, for example, wage costs for a given volume
of production it is, however, also necessary to consider effictency. An
attempt will be made to assess this in such a way that it is ex~ressed in
the alternative operating budget for the provincial location.
The undertaking's external contacts v1ill also be analysed. .Ji.rect
personal contacts can probably be roughly quantified and illustrated for
the two locations in the form of travE~lling coE;ts and time emrloyed.
Circumstances more difficult to quantify, for example the imfortance
of living close to institutions and other undertakincs to maintain contact
with them, will if possible be assessE~d qualitatively.
Similarly, the supvly of qualified labour is ~articularly important
if the undertaking moves to the provinces, but the value of alternative
supplies is difficult to estimate quantitatively. However, qualitative
assessments will be made here, which will include as factors the natural
and cultural environment in the provinces. These factors will probably
affect the supply of labour and the attitude of the labour force towards
the undertaking and, in turn, internal rPlations and the working environment.
The consequence analyses therefore result in two o~erating budgets,
one for a location in the provinces and one for a location in the metrorolitan
area, with an assessment of the non-quantifiable differences.
i'
- 161-
In conclusion, an assessment in summary form will be made of the
quantifiable and non-quantifiable conditions to determine those necessities
for the undertaking in relation to the two locations.
Apart from the consequence analyses, the most important purl='ose of
this sub-stage is to carry out a preliminary 'testing' of the measures in
relation to those undertakings that have recognized the existence of a
location problem and have started to consider locations. This opens up
an opportunity to assess realistically the possibility of influencing the
decision-making process and, at the same time, securing a 'first hand'
impression of measures under consideration.
The further business analyses differ practically from the feasibility
study, in that for each undertcl\ing selected a working group is set up
consisting of (1) a project researcher, (2) the management consultant who
knows the undertaking or another expert and (3) an executive from the
undertaking. This creates an opportunity for true dialogue to take place
around the undertaking's location situation, in which the analyses can
simultaneously indicate to what extent it is possible by information and
discussion to persuade the undertaking to consider its location situation,
particularly the question of relocation/non-relocation.
It should be noted in this connexion that the investigations carried
out in the feasibilitY study have already resulted in some of the case
undertakings in the feasibility study having begun to consider more seriouGly
the possibility of relocation.
Finally, the working method referred to in which a project researcher
is included in each investigation should ensure that the material collected
can be summarized and systematized in a manner arrrorriate to the project.
It is anticipated that the analyses will be carried out by co-o:r-erntic
with the selected undertakings continuously over a period of six monthi3 to
one year in a seeking-learning process. This will be in its first ata~·e
more or less descriptive, and in its second stase also ex1eri~~ntal by
confronting the undertaking with present - and perhaps future - \'JD..Y:J c.Lu
means.

- 162-
As an introduction to co-operation with the undertaking, an attempt
is made to record the undertaking's attitudes and opinions on the location
question in order later to reach an assessment of any changes resulting
from the discussions.
As ideas on ways and means take shape during the project, the
undertaking will be confronted with these to get a reaction and, perhnrJs,
proposed alterations. This will to some extent indicate how effective the
measures concerned might be expected to become.
The intensive investigation of Type 1 uJ~dertakings will include
the following sub-activities:
3.1. Selection of u~dertakings and formation of working groups
3.2. Organization of method of procedure
3.3. Consequence analyses for the individual undertakings
3.4. l-reliminary •testing' of the measures
3.5. Reporting back
2.4. Sub-stage 4: Intensive undertaking investigation~: Type 2
To secure a broader illustration of the previous sub-stage's definition
of the operational conditions for a relatively few types of undertakings in
the provinces as agair~t the metropolitan reGion, the connequence analyses
of the 3-5 undertakings are su~plemented by a further 15 or so underta};:ings
or departments.
Since there are so many variables in the description of the
undertakings' operational conditions, only a :small number of undertakin! .R
can be handled; and, since at the same time the distribution of these
variables is unknown, we cannot refer to any formal form of representntivity.
When selecting undertakings, it will be important to cover those
examples of typological circumstances that the r~~asi bili zy study has
indicated as appearing to be deteri:linatiVE! in distinguishing the Jotenti;:;ll
movable undertakings/departments (i.e. undertakings/departments who.-:::;e
operational conditions in the provincE~s appE~ar to be at least as favo~J-~ d.1
as in the metropolitan area, taking into consideration the transition
problems trelocation barrier~l)
1) see note page 6

- 163-
The 15 undertakings will therefore be selected so as to cover,
together with the undertakings of Sub-stage 3, the most essential conJitions:
a. high/low contact frequency;
b. 'transparent 1/' o ~:;aq ue' market;
c. large/small undertaking;
d. st3gnating/expanJing undertaking.
The 15 undertakinGs/departments will at the same time be so selected
that those located in both the provinceG And the metropolis are re2·~renenb·,d.
As in .Sub-stage 3, investigation of the 15 undertakinc:s will ir!clude
consequence analyses, but these, tal{ing the detailed Rnalyses in ,ub-rha.se 3
as a starting point, will take the form of an assescment of similaritie0 and
differences for each of the 15 undertakings.
The studies of these undertakings are a dir~ct continuation of the
f easi bi li ty study's case investigations, and some of the undertakir:3s
included will be among those studied in the feasibilitYstudy, but with
an elaboration of the case material particularly as concerns the fin::mcial
and non-financial factors of importance to location in the metropolis as
against the provinces.
Finally, the object of this sub-stage, like :ub-stuge 3, will be to
carry out a preliminary 'testing' of the measures, in this case upon a
larger circle of undertakings or branches which in contrast are char:1cterized
by not havj ng been in the middle of their considerations. '!'he imrort:tnce
of this fact can be assessed in the final 'testing' in Sub-stage 7 by
comparison between Sub-steQ;es 3 and 4.
The Sub-stase will include the follovfing part-activities:
4.1 Selection of types of undertaking/department
4o2 Setting-up of warking groups for each undert~-:ing
4o3 Establishr.1ent of method of procedure
4.4 Analyses
4.5 Joint discussions between the working groups
4.6 Conclusions on undertakings' potentiaL movability
4. 7 Discussions with the undertakings concerning tneasure.s
4.8 Reporting back.
- 164-
2.5. ;Sub-stage 5: Interim report
A work report is prepared about; half-wa;y into the project, the
purpose being to inform those responsj.ble for the project of the results
to date (status of the project), to propose any adjustments and to set out
the programme for the subsequent work.
Provided that the project is comr:1enced a.bout 1 !·~a.y 19?6, this wor1<
report will be available in Dece~ber 1976.
A summary of the work r--port will he translated into 1~Il(';lish.
The work report will contain:
a. assessment of other investigations into measures;
b. desc·ri:ption of the status of the intensive undertaking
investigations;
c. preliminary results of the questionnaire investigation (Sub-stage 2)
d. detailed propo.:;als for subseque·nt work, including pA.rticularly
the 1 testing' of the measures i.n 3ub-stage 7.
2 .6. Sub-stage 6: Initial in'tllestigatio:n of the importance of some selected
factors in the undertakings' choice of location
·rhe feasibility study has indicated many important factors that
underta:cings can influence to only a limited extent but which, on the other
hand, decisively influence undertakings' location potentials (operational
conditions) and whose expected future development must be included when
putting forward measures.
As a pilot study, it is intended in this sub-stage to carry out
preliminary investigation of some selected essential factors with a view
to clarifying the main trends of their effect upon the location of undertakinc0
and the consequences that these main trends may be expected to have upon
undertakings' location choices in future developments within the recio:cs.
It is intended initially to clarify the follovdrlb factors, which
have been shown to be important on the basis of the f easi bili tys tudy 's
analyses:
1) The study will be commenced about 1 Septe!mber 1976. HeEefore the interim report will be available in May 1977.

- 165-
1) Attitude of financial institutions and other lending institutions
to locations in various parts of the country.
2) Employer and employee organizations' policy on questions of
importance to location, including differences in wages and
efficiency between the metropolis and the provinces.
3) Impo~tance of technology to location, including particularly:
data transmission and EDP;
production technology;
transportation;
organizational development
4) Importance of trade cycle condi tiona.
5) Activity of municipalities in influencing choice of location.
These subjects can, on the one hand, be treated independently of the
individual undertaking by obtaining information from other researchers
(for example, from the Planning Council for. the new planning area as concerns
technological assessment, international projects, etc) and organizations
(banks, Danish TUC, Danish CBI, etc) and, on the other hand, by using the
intensive undertaking investigations as a basis.
The Sub-stage includes the following sub-activities
6.1 Investigation of lending institutions
6.2 Investigation of employer and employee circumstances
6.3 Investigation of the importance of technology
6.4 Importance of trade cycle con~itions
6.5 Investigation of the importance of municipal activity
6.6 Reporting back
On the basis of the results of these preliminary investigations,
further investigation into one or more of the above circumstances could
be formulated.
2.7. Sub-stage 7: 'Simulated test' of measures and assessment
As already indicated, the detailed program~e for this Sub-stage
will be set out in the interim report (Sub-stag'e 5) on the basis of th~·
-· 166-
results of the extensive questionnaire and the preliminary results of the
intensive undertaking investigations.
The following description should therefore be taken only as a
proposal to be discussed, consolidated and perhaps later revised.
The purpose of this sub-stage is to c~ontribute to the maximum extent
towards a 'simulated test' of the measures formulated under the previous
stages.
Although it is scarcely possible to C4arry out a 'simulated test'
on a representative section of undertakings, it is intended at this stage
to confront a wider circle of undertakings w:ith the hypotheses relating to
the measures put forward.
It is considered that this can be don~! by a stratified random sample
investigation in which a small number of und4!rtakings that have moved from
the metropolitan area to the provinces, a corresponding number of undertaki gs
that have moved into the metropolitan area a11d a number of undertakings tha
have not moved are confronted with the measul~es and asked what effect the
proposed measures might be expected to have in connexion with relocation
considerations. The random sample will be selected by a further
stratification of the random sample in the extensive questionnaire
investigation in Sub-stage 2.
The methods it is planned to employ are interviews, conferences,
questionnaires, etc. Apart from this, Delphi--type investigations might
be employed - that is, investigations falling in several stages where the
result of the answers is assessed after the first stage, the undertakingF
included confronted with the results, new anf;wers received in which the
undertakings are influenced by the answers of all the other undertakingb,
the new results assessed, etc.
Against the background of the results of the 'simulated test' an0
the results of the preceding stages, a summarized assessment is final!·
made of the expected efficiency of the measures in so far as this is
quantitatively possible.
•

- 167-
The following sub-activities will be included:
?.1 Establishment of the method of selection and collection
7.2 Selection of undertakings
7.3 Collection of information
7.4 Processing of information
7.5 Assessment of measures
7.6 Reporting back
2.8. Sub-stage 8: Final report
The results of the investigation are summarized in the final report,
which also discusses the areas where further research effort might be
initiated.
The report will be translated into English.


PROJEKTGRUPPEN ALTERNATIV LOKALISERING AF STORBYERHVERV
Annex 1.2 Regional development areas in Denmark 1976 and 1979.
LARS KOLIND, PETER H. MATTHIESEN
FINAL REPORT ~[El(Q)(C~U~(Q)~ (Q)f [E(C(Q)~(Q)M~C ffi\CU~~~U~[E~ U~ffi\[]~U~(Q)~ffi\llW l(Q)(Cffi\U[E[] ~~ lf[}=={J[E (C(Q)~[E~[}=={Jffi\(GJ[E~ ffi\~[E~
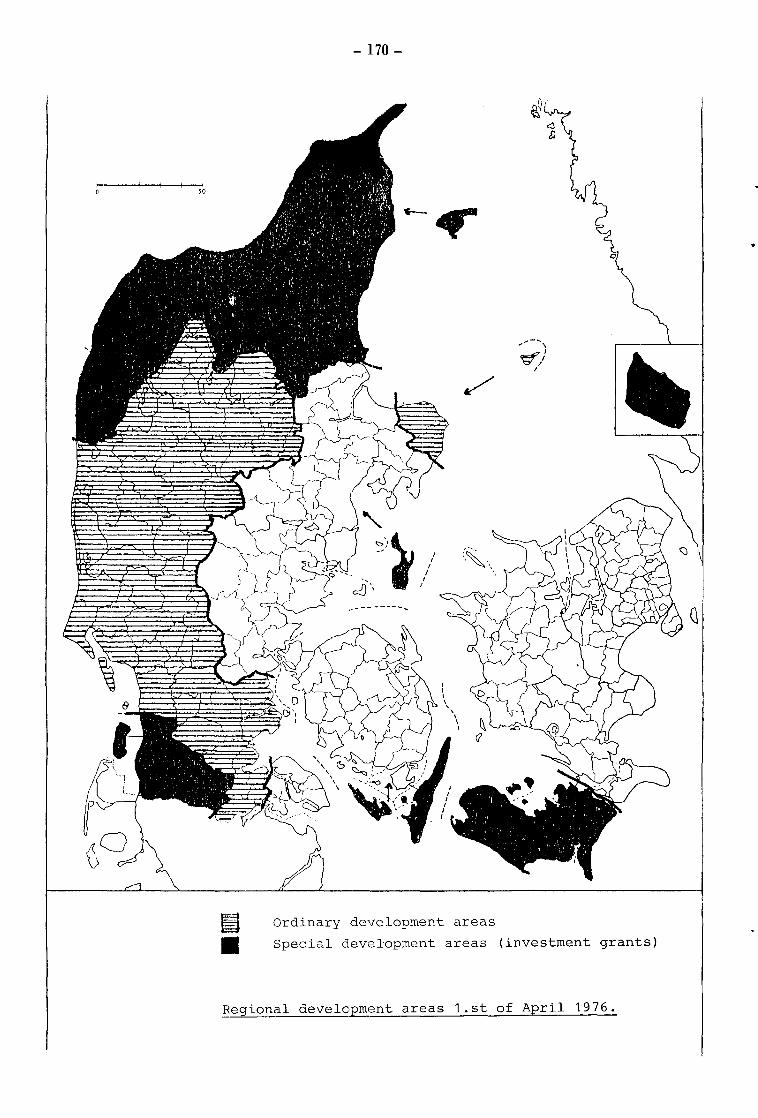
- 170-
~ Ordinary develo?ment areas
• Special development areas (investment gran1:s)
R.egional development areas 1.st of April 1976.
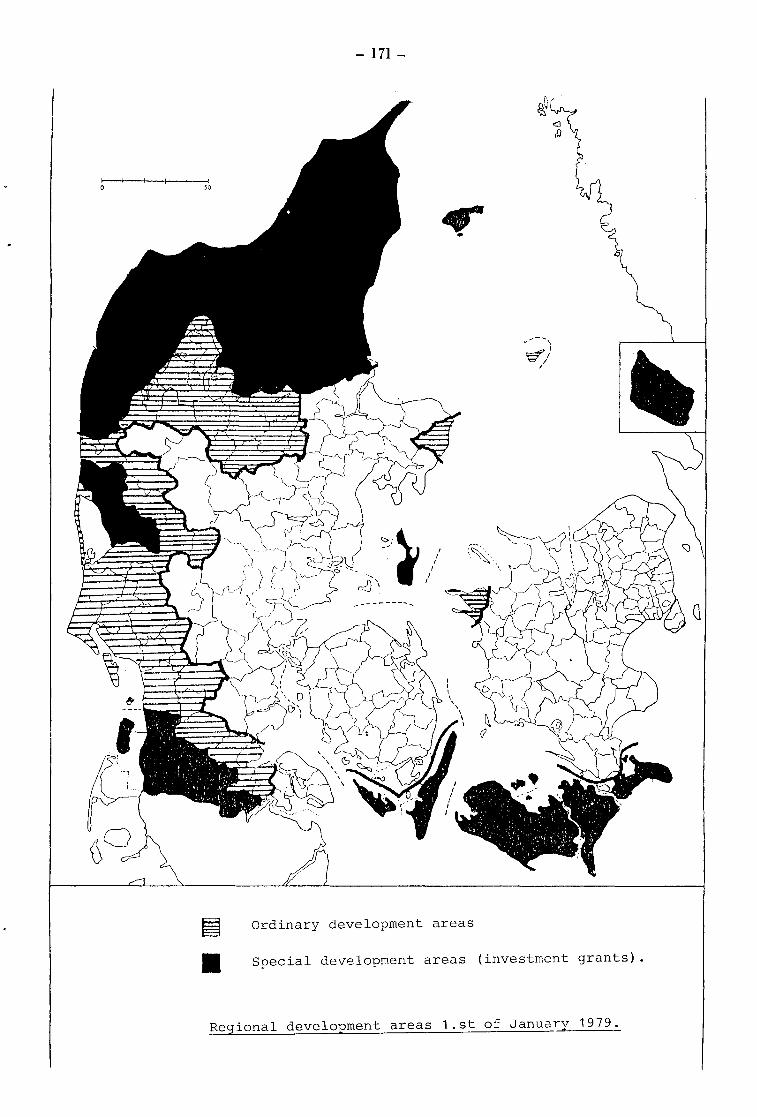
- 171-
~ Ordinary development areas
Jl Special development areas (investment grants) .
Regional development areas 1.st of January 1979.


PROJEKTGRUPPEN ALTERNATIV LOKALISERING AF STORBYERHVERV
Annex 1.3 Counties and major cities in Denmark 1978
LARS KOLIND I PETER H. MATTHIESEN
FINAL REPORT ~lEl(QXC~U~(Q)[NJ (Q)f lE(C(Q)[N](Q)Mu(C ~(CuuwuuulE~ U~~[O)~U~(Q)[NJ~llW l(Q)(C~UlE[O) ~[NJ UrHJlE (C(Q)~[E[NJ[HJ~(G]lE[NJ ~~lE~


- 175-
,.
Annex 1.3 Counties and major cities in Denmark 1978.
Bor cou


PROJEKTGRUPPEN ALTERNATIV LOKALISERING AF STORBYERHVERV
Annex 3.1 List of cases. Alternatives investigated.
LARS KOLIND, PETER H. MATTHIESEN
FINAL REPORT ~rElCQXC~U~(Q)~ (Q)f lEC(Q)~(Q)~~C ~CU~W~U~lE~ U~~[]~U~(Q)~~llW l(Q)C~U[E[] ~~ U[HJ[E (C(Q)[p[E~[HJ~~[E~ ~~[E~


CASE FIRM Subs ector NO ISIC
1968
1 ELECTRIC 1 383 Manufacture of elec-trical machinery ap-paratos, appliances and supplies.
2 SERVICE 1 832 Business services
3 PRINTING 1 342 Printing, publishing and allied industri-es - -
4 TEXTILE 1 321 Manufacture of tex-tiles
5 METAL 1 381 Manufacture of me-talproducts
1 ) Headoffice (H), Production plant (P).
2)present location 2) Alternatives investigated
H 1): Copenhagen H+P: 8 locations Zealand and Lolland-Falster (SDA) . p 1) : SDA Centralized and decentralized.
Copenhagen 2 locations in the provinces ( 1 in DA)
Copenhagen 1 location in the provinces
H: Copenhagen H+P: 2 locations in the provinces P: Copenhagen (including DA) . Centralized,
decentralized
H: Copenhagen No real consequence analyses P: Copenhagen
2 ) Locations are classified as:
SDA: Special develop~ent area
DA: Development area
The Provinces excl. development areas
The Copenhagen Metropolitan Region
I
--l \C
I

CASE FIRM NO
6 BUILDING
7 NETAL 2
8 CHEMICAL 1
9 SERVICE 2
1 0 SERVICE 3
11 ELECTRIC 2
I I I 12 TRADE 1
13 EQUIPMENT1
..
ISIC Subsector I 1 . Present ocat1.on 1968
500 Building and con- Copenhagen struction
381 Manufacture of me- Copenhagen tal-products
351 Manufacture of in- Copenhagen dustrial chemicals
832 Business services Copenhagen
832 Business services Copenhagen
383 Manufacture of elec- H: Copenhagen trical machinery etc.,P: The prov1.nces
610 Whole sale trade
385 Manufacture of pro-fessional and scientific and measuring and controlling equipment and of photographic and optical goods
Copenhagen
SDA
Alternatives investigated
3 locations in the provinces
1 location in SDA
No real consequence analyses
1 location in the provinces
1 location in the provinces
P: Copenhagen
1 location in SDA
Copenhagen
..
-co Q

CASE FIRN ISIC Subsector NO 1968
14 EQUIPMENT2 385 Manufacture of pro-fessional equipm.etc.
15 PAPER 1 341 Manufacture of pa-per and paper pro-ducts
16 OTH.MAN. 1 390 Other manufactu-turing industries
18 ELECTRIC 3 383 Manufacture of elec-trical equipment
19 ELECTRIC 4 383 Manufacture of elec-trical equipment
20 HACHINERY1 382 Manufacture of machinery
--
Present location
H: Copenhagen P: SDA
Copenhagen
Copenhagen
H: Copenhagen P: Copenhagen
H: SDA Marketing:Copenh.
Copenhagen
~ •
Alternatives investigated
P: Copenhagen
1 location in the provinces
1 location in the provinces
H+P: Copenhagen, the provinces inclu-ding SDA. Centralized, decentra-lized (total 5 alterantives)
H: Copenhagen Marketing: SDA
1 location in SDA
I
I
-Qo -


]f
PROJEKTGRUPPEN ALTERNATIV LOKALISERING AF STORBYERHVERV
Annex 3.2 Guides for firm description and consequence analyses.
LARS KOLIND, PETER H. MATTHIESEN

GUIDE 1: CHARACTERISTICS OF THE FIRM

CHARACTERISTICS
OF THE FIRM
1. THE FIRM
SUBSECTOR:
FUNCTION:
PRODUCTS (-LINES):
DEGREE OF SPECIALIZATION:
WAY OF PRODUCTION:
DEGREE OF AUTOMATIZATION:
OWNERSHIP:
ORGANIXATIONAL RELATIONS TO OTHER FIRMS:
- 185-
FIRM
TURNOVER 1976: D.KR. DISTRIBUTED BY (PERCT):
OWN PRODUCTION
SALES OF OTHER PROD.
TOTAL
DENMARK
2. THE ESTABLISHMENTS OF THE FIRM
PRESENT ESTABLISHMENTS:
ESTAB. 1
ESTAB. 2
x) FUNCTION
MARKET
EXPORTS TOTAL
100%
NO OF EMPLOYEES LOCATION
INIT DATE PAGE
1
x) POSSIBLY SUPPLEMENTED BY THE RELATIVE DISTRIBUTION OF EMPLOYEES
BY FUNCTION (ADM, SALES, PROD. ETC.)
THE FUNCTIONAL AND GEOGRAPHICAL DEVELOPMENT OF THE ESTABLISHMENTS OF THE FIRM:

- 186-
CHARACTERISTICS
OF THE FIRM FIRM
-·--·-----..1--------3. EMPLOYEES
ONE DIAGRAM FOR EACH ESTABLISHMENT:
PART~riME m1PLOYEES TRANSFORMED TO FULL TIME EMPLOYEES
1. WHITE COLLAR STAFF, TOTAL
1.1 ADMINISTRATION/MANAGEM/ECONO~Y 1 . 1 . 1 MANAGERS 1.1.2 OTHERS, SPECIAL EDUCATED/QUILIFICATEID 1.1.3 CLERICAL WORKERS
1.2 PRODUCTION 1. 2.1 MANAGERS 1. 2. 2 OTHERS, SPECIAL EDUCATED/QULIFICATED
1.2. 3 FOREMEN 1. 2.4 CLERICAL WORKERS
1.3 SALE/MARKETING/PURCHASE 1. 3.1 MANAGERS 1. 3.2 OTHERS, SPECIAL EDUCATED/QULIFICATED
1. 3. 3 TRAVELLING SALESMEN 1. 3.4 CLERICAL WORKERS
1.4 WAREHOUSE/SERVICE/TRANSPORTATION
1. 4.1 MANAGERS 1.4.2 CLERICAL WORKERS 1.4.3 FITTERS
1.5 RESEARCH AND DEVELOPMENT
1. 5. 1 HIGHER EDUCATION, MANAG
1.5.2 - OTH. 1. 5. 3 ENGINEERS 1.5.4 SKILLED 1.5. 5 UNSKILLED 1.5 .6 CLERICAL WORKERS
1.6 EDP
1.6 .1 MANAGERS 1.6 .2 SYSTEM ANALYSTS 1.6. 3 OTHER SPECIAL EDP EDUCATED
1.6 .4 CLERICAL WORKERS
1.7 OTHERS
2. BLUE COLLAR WORKERS, TOTAL
2. 1 PRODUCTION, SKILLED 2.1.1 GROUP: 2.1.2 GROUP:
2.2 PRODUCTION, UNSKILLED 2.2.1 GROUP: 2.2.2 GROUP:
2.3 OTHERS, SKILLED 2.3.1 FUNCTION: 2.3.2 FUNCTION:
2.4 OTHERS UNSKILLED 2.4 .1 FUNC'I'ION: 2. 4. 2 FUNC'I'ION
F M T
F M T I I I F M T I I
I I
I I
[J] I I I
I I I
I~
I I I I I
I I I I I I I ! [ I I I I
TOTAL Cl

- 187-
CHARACTERISTICS
OF THE FIRM
4. RESEARCH AND DEVELOPMENT (R&D)
FIRM
TOTAL NUMBER OF R&D EMPLOYEES TOTAL NUMBER OF EMPLOYEES
:..,..-----
ANUAL R&D COSTS (1976):
SALARIES OPERATING COSTS EXTERNAL
TOTAL
INVESTMENTS [
TOTAL COSTS + INVESTMENTS
TURNOVER
DISTRIBUTION OF TOTAL COSTS (PER CENT) :
PRODUCT DEVELOPMENT, TOTAL
PRODUCTS NEW TO THE MARKET PRODUCTS NEW TO THE FIRM
IMPROVEMENT OF EXIST. PROD.
PROCESS DEVELOPMENT:
NEW PROCESSES PROCESSES NEW TO THE FIH'·i H1PROVEMENT OF EXIST: F:i<OCESSES
OTHER DEVELOPMENT
PLEASE NOTE:
INIT DATE PAGE
3
[
~ - I f
[ I §
[ I
§ I I
TOTAL I 100% l MOST INFORMATIONS ARE INCLUDED IN THE POSSIBLE QUESTIONNAIRE FILLED OUT FOR: "FORSKNINGSSTATISTIKKEN".

CHARACTERISTICS
OF ~rHE FIRM
5. VARIABILITY
1970
- 188 ·-
FIRM
1973 1976 r------r------T-·---·--
NUMBER OF EMPLOYEES TOTAL WAGES, SALARIES TURNOVER
x) VALUE ADDED NO OF PROCUCT GROUPS
x) VALUE ADDED TURNOVER ·· PURCHASE OF RAW MI\.TERIAL AND SEMI MANUFACTURED ARTICLES
VARIABILITY IN NON - QUANTIFIABLE FACTORS, AS:
TECHNOLOGY
ORGANISATIONII.L STRUCTURE
6. l-iARKET SITUATION
DISTRIBUTION OF TURNOVER BY PRODUCT 3ROUPS:
PRODUCTGROUP 1 PRODUCTGROUP 2
%
TOTAL 100%
(DESCRIPTION)
FOR EACH PRODUCTGROUP A DESCRIPTION AND AN ASSESSMENT OF THE DEGREE OF MARKET
TRANSPARENCY, F .,EX. BY SPECIFYING:
a) IS THE MARGIN BY FIXING PRICES (DUE TO COMPETTIORS) :
SMALL/MEDIUM/LARGE?
b) HOW MANY CO}{PETITORS PRODUCE THE SAME PRODUCT/SER'i(ICE:
0-2, 2-5, MORE THAN 5?
c) FOR SERVICES : HOW WELL DEFINED?
PAGE
4

*
CHARACTERISTICS
OF THE FIRM
- 189-
FIRM
7. SUPPLIERS OF SEMI MANUFACTURED ARTICLES
A TorAL TURNOVER f1976
-KR j B NET PROFIT
C PURCHASE OF SEMI MAN.ART.
c A-B-C
FOR MOST IMPORTANT SUPPLIERS:
SUPPLIER 1 SUPPLIER 2
LOCATION
8. SUPPLIERS OF RAW MATERIAL
QUANTITY
D.KR PER YEAR
TON PER YEAR
INIT DATE PAGE
5
(SHOULD ONLY BE FILLED IN IF ~T IS NECESSARY DUE TO LATER CONSEQUNSE ANALYSES)
SUPPLIER 1 SUPPLIER 2
LOCATION
QUANTITY
D.KR PER YEAR
TON PER YEAR

CHARACTERISTICS
OF THE FIRM
- 190-
FIRM INIT DATE PAGE
6.
~------------------~-------------------------------------~----._----~----~
9. CUSTOMERS
DESCRIPTION OF SALES CHANNELS ETC.
(ONLY DETAILED DESCRIPTIONS IF NECESSARY FOR LATER CONSEQUENSE ANALYSES)
FOR MOST IMPORTANT CUSTOMERS/MARKETS:
1 2 3
OTH
TOTAL
LOCATION
QUAN~7ITY
D.KR. PER YEAR
TON PER YEAR

CHARACTERISTICS
OF THE FIRM
10. EXTERNAL COMMUNICATION PATTERN
- 191-
FIRM INIT DATE PAGE
7
AN OVERALL DESCRIPTION OF THE EXTERNAL COMMUNICATION PATTERN OF THE INDIVIDUAL
DEPARTMENTS, IN PARTICULAR EMPHASISING FACE-TO-FACE CONTACTS, THEIR NATURE,FREQUENSY
AND TARGET GROUP.
AT LEAST FOR THOSE DEPARTMENTS WHICH LATER ARE CONSIDERED AS PART OF THE CONSEQUENCE
ANALYSES SHOULD THE FOLLOWING BE FILLED IN:
NUMBER OF WEEKLY FACE-TO-FACE CONTACTS:
,. fil
~ (/)
<I! u :r1 z fil u 0
......... 1:1:' H
~ D E-< fil p.. u u (/)
......... D H ~ :;i! ......... fil Q > fil OUTSIDE THE FIRM:
~ ...:! Cl 0 ~ m E-< ~ ~ ~ ffi ~ ~
1. ABROAD (CUSTOM, SUPPL.,ETC) 2. COPENHAGEN LOCATED INSTITUTIONS ETC. 3. COPENHAGEN LOCATED AUTHORITIES,
BUSINESSSERVICES ETC. 4. COPENHAGEN LOCATED COSTUMERS 5. COPENHAGEN LOCATED SUPPL. 6. THE REST OF THE COUNTRY CUSTOM 7. THE REST OF THE COUNTRY,SUPPl. 8. THE REST OF THE COUNTRY, OTHERS
INSIDE THE FIRM:
9. CUSTOM, SUPPL. COMMING FROM ABROAD I I I I I I I I 10. CUSTOMERS COMMING FROM COPENHAGEN 11. OTHERS COMMING FROM COPENHAGEN 12. PERSONS COMMING FROM REST OF THE COU~IT._--~ __ _. ____ ~--~--_.--~--~
13. POSSIBLE CONTACTS WITH OTH. ESTABL. IN THE FIRM
AS A BASIS FOR THE FOLLOWING CONSEQUENSE ANALYSIS OF A RELICATION THERE SHOULD BE A DISCUSSION OF:
- WHICH CONTACTS SHOULD BE MAINTAINED AFTER A RELOCATION
- WHICH CONTACTS WILL BE TRANSFORMED TO THE NEW LOCATION
- WHICH FACE-TO-FACE CONTACTS MIGHT BE SUBSTITUTED BY OTHER COMMUNICATION MEDIA·SUCH AS TELEPHONE, LETTERS ETC.
- WHICH CONTACTS, TODAY TAKING PLACE INSIDE THE FIRM, COULD BE EXPECTED TO TAKE PLACE OUTSIDE THE FIRM AFTER A RELOCATION.
THE PRESENT FREQUENCY FOR CONTACT TYPE 1-8 AND 13 MIGHT BE ESTIMATED BY USING TRAVEL ACCOUNTS WHILE OTHER TYPES CAN BE ESTIMATED BY USING Dll\RIES ETC.,
IF THE FOLLOWING CONSEQUENSE ANALYSIS CONSERNS A DECENTRALIZATION OR A CENTRALIZATION THERE SHOULD BE INCLUDED AN ASSESSMENT OF INCREASED/DECREASED CONTACT FREQUENCY BETWEEN INVOLVED DEPARTMENTS.

GUIDE 2: CONSEQUENSE l\.NALYSIS

- 193-
CONSEQUENCE INIT DATE IPAGE
ANALYSIS FIRM 1
• 1. PURCASING COSTS, TOTAL PRES.LQC. NEW LOC.
[ l 1 PRES.LOC. NEW LQC.
1.1 RAW MATERIAL I I l 1.2 SEMI MANUFACT.ARTICLES I I J 1.3 OTHERS I I [
2. SALARIES, WAGES, TOTAL I I I 2.1 WHITE COLLAR STAFF
NUMBER STANDARD SALARY TOTAL ANUAL SALARn ~
~RES. LOC. NEW LOC PRES. LOC. NEW LOC.
SPECIAL QUALIF/EDUC. CLERICAL STAFF FOREMEN OTHERS
TOTAL 2.2 BLUE COLLAR WORKERS
NUMBER ~TANDARD WAGE TOTAL ANUAL WAGES ~RES. LOC~) NEW LOC. PRES.LOC. NEW LOC PRES. LOC. NEW LOC .•
SKILLED, GROUP 1 SKILLED, GROUP 2 UNSKILLED, GROUP 1 UNSKILLED, GROUP 2
*) INCLUDING DIFF. IN STABILITY ETC. TOTAL
3. COSTS FOR TRANSPORTATION OF GOODS, TOTAL ( I 1 - uru:J.· ~,.;v;:.·.L·;:. 1 J.vJ...u.. 1\L'IU.I\L -~,.;v;:.·.L·;:.
QUANTITY PRES . LOC. NEW LOC PRES.LOC. NEW LOC. 3.1 TRANSPORTATION ORIGIN.
FROM: FROM: FROM: --
TOTAL
QUANTITY UNIT COSTS TOTAL ANUAL COSTS
PRES.LOC. NEW LOC PRES . LOC. NEW LOC. 3.1 TRANSPORTATION DESTIN.
FOR: FOR: FOR: FOR: -- TOTAL
TOTAL ANUAL. COSTS PRES. LOC. NEW LOC.
3.3 EXTERNAL WAREHOUSE COSTS I I I

CONSEQUENCE
ANALYSIS
4. TRA\ffiL- AND COMMUNICATION COSTS
4.1 TRAWL COSTS AND TIME
- 194-
FIRM
REFERRING TO POINT 10 OF THE CHARACTERIS~riCS OF THE FIRM THE FOLLOWING SHOULD BE ESTIMATED FOR THOSE FACE-TO-FACE CONTACTS, WHICH DEPEND ON THE LOCATION=
INIT DATE PAGE 2
PRES. LOC. NEW LOC.
.__I ---'-'-·-'
NUMBER OF CONTACTS PER
YEAR
~RES. NEW
UNIT TRAWL COSTS
UNIT COSTS OF TOTAL ANUAL TRAWL TIME TRAWL COSTS
[TOTAL ANUAL COSTS OF TRA·ivEL TIME
CONTACT TYPE 1 2 3 4 5 6 7 8 9
PRES. NEW PRES. NEW PRES . NEW PRES. NEW
10 11 12 ----~--~----+---~~---J~---4---~---+--~~~
TOTAL
ANUAL
TRAWL COSTS TRAWL ~riME BY DECENTR.INCREA SE I I =t BY CEN'IR. DECREA SE I I :J 4.2 OTHER COSTS OF COMMUNICATION
PRES.LOC. NEW LOC.
TELEPHONE I I 1 POSTAL I I r TELEX ETC . I I I
TOT AL I I :::1
~--------------------------------------------------·-----------------------------~

•
CONSEQUENCE
ANALYSIS
5. RENTS
- 195-
FIRM
FLOOR RENTS PER SQUARE r< • ANUAL RENTS SPACE
INIT DATE PAGE 3
PRES.LOC. NEW LOC.
I I 1
PRES. LOC. NEW LOC. PRES. LOC NEW LOC
OFFICE WAREHOUSE PRODUCTION
6. EXTERNAL SERVICES
6.1 SERVICES FOR MACHINERY
6.2 ACCOUNTANTS/MARKETING CONS. ETC.
7. OTHER COSTS DEPENDENT ON THE LOCATION
FOR EXAMPLE:
PRES.LOC. ' NEW LOC.
t I
I
- ENVIRONMENTAL INVESTMENTS (OPERATING COSTS, DEPRECIATION, INTEREST)
- ENERGY
- WATER
~- OTHER COSTS, INDEPENDENT ON THE LOCATION
FOR EXAMPLE:
- FIXED COSTS, DEPRECIATION, INTEREST
- INSURANCE
TOTAL
1
l
I.

PROJEKTGRUPPEN ALTERNATIV LOKALISERING AF STORBYERHVERV
Annex 3.3 Questionnaire used to investigate relocation barriers for key employees having moved together with their firms. (English translation) .
LARS KOLIND, PETER H. MATTHIESEN
FINAL REPORT ~[El(Q)CC~U~(Q)~ (Q)f [E(C(Q)~(Q)M~C ~CU~\ff~U~[E~ U~~[D)~U~(Q)~~llW l(Q)CC~U[E[D) ~~ UrHJ[E CC(Q)~[E~rHJ~CGJ[E~ ~~[E~

- 198-
Name:
Firm:
1. Education:
2. Place of birth:
3. Function in the firm:
a) Before the relocation
b) Immediately after the relocation
c) Today.
4. Residence:
a) Before the relocation: Own residEmce D Leased residence D Address:
b) After the relocation:
5. a) When did you move?
Own residence D Leased residence D Address:
b) When did your family move?
6. Which were the main causes for you to move together with the
firm (state only 3 crosses):
The job opportunities in the firm
Other job opportunities at the new location
Natural/cultural environment at the new location
Possibilities for a better residence
Attractive offer of increased salary
Other (state which kind)
B D 0 0 D
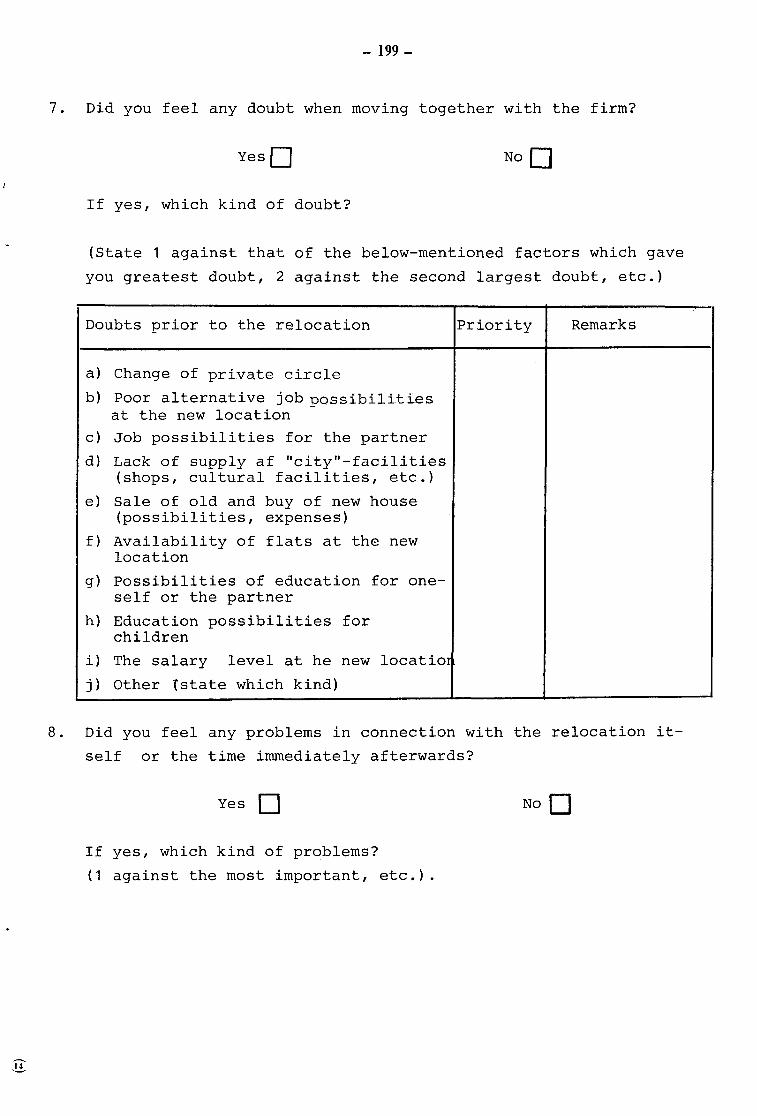
- 199-
7. Did you feel any doubt when moving together with the firm?
YesO
If yes, which kind of doubt?
(State 1 against that of the below-mentioned factors which gave
you greatest doubt, 2 against the second largest doubt, etc.)
Doubts prior to the relocation
a) Change of private circle
b) Poor alternative job possib~lities at the new location
c) Job possibilities for the partner
d) Lack of supply af "city"-facilities (shops, cultural facilities, etc.)
e) Sale of old and buy of new house (possibilities, expenses)
f) Availability of flats at the new location
g) Possibilities of education for oneself or the partner
h) Education possibilities for children
i) The salary level at he new locatior
j) Other {state which kind)
Priority Remarks
8. Did you feel any problems in connection with the relocation it
self or the time immediately afterwards?
Yes D No 0
If yes, which kind of problems?
(1 against the most important, etc.).

Problems in connection with
the relocation
1. Getting new friends
- 200-
2. Lack of city facilities (shops,
cultural facilities etc.)
3. Requiring a flat
4. Bying a new house
5. Selling the old house
6. Relocation expenses
7. Other (state which kind)
Priority Remarks
9. How do you feel that you have settled at the new location?
Well D Fairly D Bad D
10. How has your family settled?
Well D Fairly D Bad D
11 . How do you today consider the advanta<:res and disadvantages of
the new location compared to the former?
State against the below·-ment.ioned factors, whether you find the
new location better ( +) or worse. (-)
Furthermore, please evaluate the different factors in relation
to how important they are to you.
(1 against the most important, 2 against the next etc.)

- 201-
1. Private circle
2. Your job possibilities
3. Job possipilities for your
partner
4. "City-facilities" (shops etc.)
5. The natural/cultural envi
ronment
6. Housing possibilities
7. Education possibilities for
your partner
8. Education possibilities for the
children
9. Relationship to the firm
10. The salary level
11. Other (state which kind)
Better(+)/Worse Priority Remarks
(-) at the new
location

1 1 1 1 1 1 1 1 1 1 1 ,1 1 1 1
"1 1 1 1 1 1 1 1 1 1 1 1 1 1 1 1 1 1 1 1 1 1 1 1 1 1 1 1 1 1 1 1 1 1 1 1 1 1 1 1 1 1 1
.. 1 1 1 1 1 1 1 1 1 1 1
1.

PROJEKTGRUPPEN ALTERNATIV LOKALISERING AF STORBYERHVERV
Annex 3.4 Questionnaire used to investigate relocation barriers for employees in BUILDING1. (English translation).
LARS KOLIND, PETER H. MATTHIESEN
FINAL REPORT ~[El(Q)CCffi\U~(Q)[M (Q)f [E(C(Q)~(Q)~~CC ~CCU~W~lf~[E~ U~~[]~U~(Q)[Mffi\llW lCDCCffi\U[E[] ~[M UU=iJ[E CC(Q)~[E[MU=iJffi\(GJ[E[f\1] ffi\~[Effi\

- 204-
Under [J 30 Y•=ars
30-400 years
41-500 years ____
Over )l 50 years--
1 . PRESENT AGE
2. EMPLOYMENT PERIOD IN THE FIRM
Unde:r ·o 1-5 n 6-10 [] 10 YE!ars[J 1 year years~ years and more
3. PRESENT ADDRESS Jutland LJ Zealand [] 4. DOES YOUR PARTNER WORK AWAY
FROM HOME Yes f~ No[_ 1
5. NO OF CHILDREN LIVING AT HOME
6. AGE OF THESE CHILDREN
7. NUMBER OF CHILDREN BEING EDUCATED
8. l~REQUENCY OF HOBBIES WEEKLY ~
l QUARTERLY YEARLY I
MONTHLY
a. SEA SPORT/FISHING I
b. THEATER/CONCERTS c. SOCIETIES d. ART/SCIENCE e. GARDEN/SUMMER COTTAGE f. FAMILY/FRIENDS g. h. _.L
9. SUPPOSE YOUR FIRM WAS GOING TO RELOCATE. HOW MUCH WOULD THE FOLLOWING FACTORS INFLUENCE YOUR ATTITUDE TOWARDS MOVING TOGETHER WITH THE FIRM:
a. Continous occupation in the firm b. Job possibilities in general at
the new location c. The cultural/natural environ
ment at the new location d. Possibilities of a better
residence e. Possibilities of increased
salary f. Problems in finding a new place
to live q. Job possibilities for the
partner h. Relocation troubles :l. Troubles by selling and bying
residence j. Difficulties in maintaining
private circle k. Lack of "city-facilities" 1. Educational possibilities for
yourself n. Educational possibilities for
your partner n. Educational possibilities for
your children o. p. q.
NOTHING SOME MUCH
~-
:----
1--

- 205-
10. IN CASE OF A RELOCATION: HOW WOULD YOUR PREFERENCES BE AS TO THE NEW LOCATION?
a. The triangle area (Vejle-Fredericia) b. Silkeborg area c. Arhus city d. Arhus periphery e. Skanderborg f. Horsens g. Randers h. Vejen i. Copenhagen city j. Copenhagen periphery k. Funen 1. m. n.
YES MAYBE NO
!

..
PROJEKTGRUPPEN ALTERNATIV LOKALISERING AF STORBYERHVERV
Annex 7.1 Questionnaire used at the survey done June 1978 in association with the Danish Building Research Institute. (English translation) .
LARS KOLIND, PETER H. MATTHIESEN
FINAL REPORT ~lElCD(C~U~(Q)[f\1] (Q)f ~(C(Q)[M(Q)M~(C ~(CU~~~U~~~ U~~[Q)~U~(Q)[f\1]~llW lCD(C~UlE[Q) m~ u~lE (C(Q)[p)~[f\1]~~~lE[f\1] ~~lE~

-· 208-
SCHEME 1
1. Name and address of firm
2.
Branch
Number of Blue-collar J White-collar I __j Lt,~"m~p~l~o~y~e~e~s~ __________ _L_w_o~r __ k~e~r_s~---------- employee_s __________ ~S~U~M~------------
Imagine that your firm happened to be in a situation, where you, because of internal or external circumstances, were forced to relocate the firm or part of it.
Such a situation could appear because of e.g.
A need for more space and no possibil.i ty of expansion at the present lo-· cation.
- Labour situation unacceptable in the area.
- Present premises not appropriate.
With your immediate knowledge of the conditions in the regional development areas and the present possibility of regional development, would you conside:~elocation to a regional development area at alL?
Please give a brief explanation.
c:JYes c:JNo 0 Perhaps
In the following, by relocation we mean relocation to a regional development area i.e. North Jutland, certain part:::; of West and South Jutland and Lolland/Falster.
3. Would you consider to relocate the whole firm (maybe in several stages) or only a part of the firm?
D The whole firm D Part of the firm (why?)
If you think it is possible to relocate the whole firm, leave the next question and continue with question 5.
..

- 209 -
4. If you only think it is possible to relocate a part of the firm it is important to the following question that this part contains management and perhaps sales- and development functions, and therefore it is not a pure production department. However, if you feel it is impossible to relocate other than a production department, please give a brief explanation:
Please state which part of the firm (department) you think it is possible to relocate:
What is the function of Number of employees in
this department? the department
Total
Blue-collar workers
White-collar employees
Sale/marketing
Research/development
5. In the enclosed scheme no. 2 some elements for a new regional development policy are proposed, i.e. some possible forms for public support to firms, which relocate to regional development areas.
Suppose that the authorities had certain limited amounts at their disposal for supporting your ~irm.
How would you like to distribute these li~ited amounts?
Please indicate this in scheme no. 2 by stating for each of the support forms whether you consider this would have none, some or great importance to your firm.
6. Imagine that a new regional development policy consisting of some of the elements which you find important for your firm had been established. Of course this kind of support would have certain economic effects. The total effect for your firm for some kind of support could be assessed as a percentage of the firm's total operating costs. Please assume in general that the authorities would refund a certain percentage of the total yearly expenses of the firm the first 3 years after the relocation. How large a percentage of the costs would be necessary as a support for the first 3 years so that you:
State percentage a) Perhaps would consider a relocation
b) Seriously would consider a relocation:

7.
8.
- 210-
,---------------·-------··----------------------
Instead of an annual support for 3 years, would you prefer ac once-and-for-all amount in connect~ion with t~he relocation?
DYes D No D Don't know
lf so, how much should this amount be in rela1:ion to the total costs of the firm, so that you:
a.) Perhaps would consider a relocation
b) Sincerely would consider a relocation
A.part from these direct incentives, which of the more indirect ber,efits would you prefer in connection with a relocation to a regional development area (make a priority i.e. state 1 in front of the most important a.s.o.)
State percentage
[~ Frequent flight connections t Copenhagen and abroad
[~ Education possibilities for employees nearby
[~ ~;echnological service possibilities nearby for research sales marketing and management consultation
[~ Good road- and train connect:ions
D Similar firms nearby
[~ Others (state which kind).
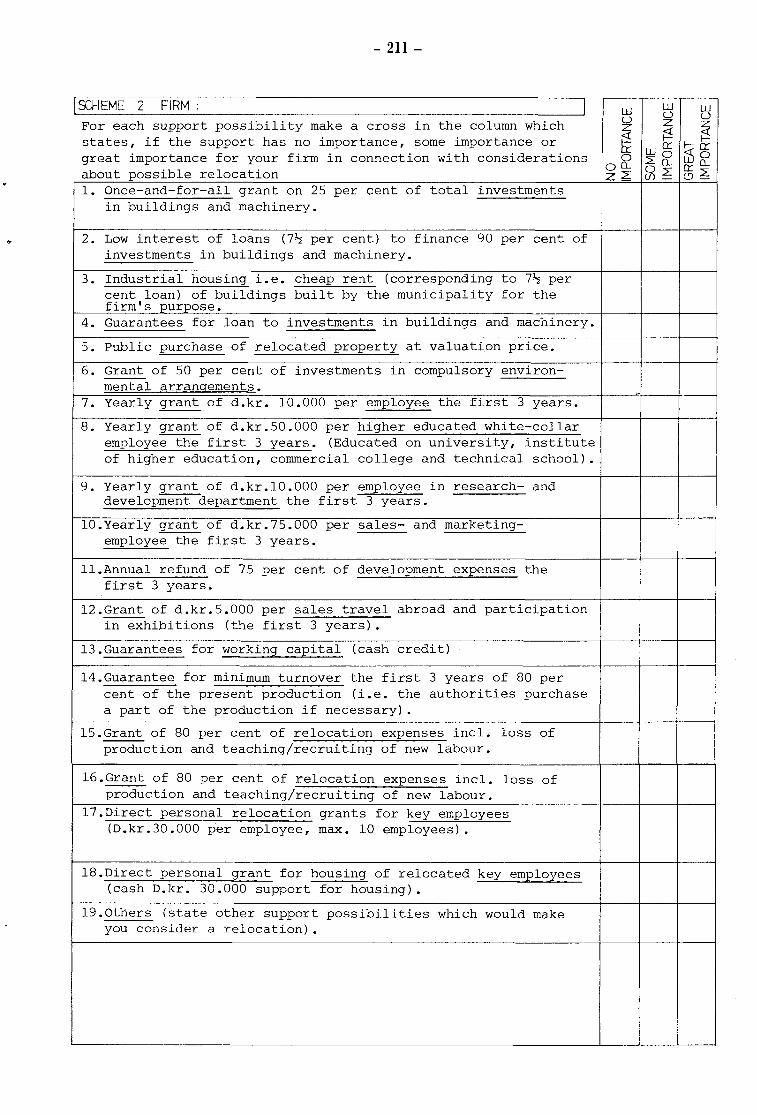
- 2ll-
IS:HEME 2 FIRM: I w w w (_) (_)
For each support possibility make a cross in the column which (_) z
~ z ;::! states, if the support has no importance, some importance or ;::! cr: wcr: ~gs great importance for your firm in connection with considerations 0 20
on... 00... n::O... about possible relocation z2 (/)2 (.9~
l. Once-and-for-all grant on 25 per cent of total investments in buildings and machinery.
2. Low interest of loans (7~ per cent) to finance 90 per cent of investments in buildings and machinery.
3. Industrial housing i.e. cheap rent (corresponding to 7~ per cent loan) of buildings built by the municipality for the firm's purpose.
4. Guarantees for loan to investments in buildings and machinery.
5. Public purchase of relocated property at valuation price.
6. Grant of 50 per cent of investments in compulsory environ-mental arrangements. - ·-
7. Yearly grant of d.kr. 10.000 per employee the first 3 years.
8. Yearly grant of d.kr.SO.OOO per higher educated white-collar employee the first 3 years. (Educated on university, institute of higher education, commercial college and technical school).
9. Yearly grant of d.kr.lO.OOO per employee in research- and development department the first 3 years.
lO.Yearly grant of d.kr.75.000 per sales- and marketing-employee the first 3 years.
ll.Annual refund of 75 per cent of development expenses the first 3 years.
l2.Grant of d.kr.S.OOO per sales travel abroad and participation in exhibitions (the first 3 years) •
l3.Guarantees for working capital (cash credit)
l4.Guarantee for minimum turnover the first 3 years of 80 per cent of the present production (i.e. the authorities purchase a part of the production if necessary) •
lS.Grant of 80 per cent of relocation expenses incl. loss of production and teaching/recruiting of new labour.
l6.Grant of 80 per cent of relocation expenses incl. loss of production and teaching/recruiting of new labour.
l7.Direct personal relocation grants for key employees (D.kr.30.000 per employee, max. 10 employees) •
l8.Direct personal grant for housing of relocated key employees (cash D.kr. 30.000 support for housing) •
l9.0thers (state other support possibilities which would make you consider a relocation) •

J
J
J
J
J
J
. J "j
J
J
J
J
J
J
J
J
J
J
J
J
J
J
J
J
J
J
J
J
J
J
J
J
J
J
J
J
J
J
J
J
J
J
~ J
J
J
J
J
J
J
J
J
J
J
J
J
J
J
J
J

•
PROJEKTGRUPPEN ALTERNATIV LOKALISERING AF STORBYERHVERV
Annex 7.2 Description of the case study "Louis Petersen & Co." (English translation) .
LARS KOUND I PETER H. MATTHIESEN
FINAL REPORT ~[El(Q)(C~U~(Q)[M (Q)f [E(C(Q)[M(Q)M~(C ~(CU~~~U~[E~ U~~[Q)~U~(Q)[M~llW l(Q)(C~U[E[Q) ~[M UrHJ[E (C(Q)~[E[M[HJ~(GJ[E[M ~~[E~

- 214-
Louis Petersen's Eft£. A/S
1\. sample of a Danish firm who is considering relocation from 1:he Copenhagen area to a development area.
Louis Petersen A/S started in 1936 production of fileboxes in a cellar in N¢rrebro. The company started as a one-man-firm, but some years later, it was converted into a joint-stock company and moved in 1955 to the present address in Vanl¢se. 1\.t that time (1955) the company had approximately 30 employees and has since then been characterized by a steady development vvith the present approx. 100 employees.
The company has for years been managed by the two sons of the establisher, who together with a daughter have the majority of shares.
~~he 100 employees are divided as follows:
Number of employeE~s
Employees Labour Total
Hen
16 60 76
Women
12 12 24
Total
28 72
100
The average age is approximately 45 years and many have been in the company for more than 15 years.
The premises of the firm is owned by the firm.
~~he premises are from the 1930 • s and not very suitable for the present production. For instance there is a freight elevator, vvhich often makes trouble, and as a whole, the internal transport is not very appropriate. It has been necessary for the firm to rent another 800 m2 to store the finished goods.
The total value of the property inclusive the site value was in 1977 D.kr. 2.8 mill. The market value is today estimated to be approx. D.kr. 2.0 mill.
In 1973 the firm established it's aims and objectives including the following statements:
We want to be a good and stable production- and trade company inside the filing sector especially within filing of drawings.
We want to stake on all the customers, who want to trade with us. We aim at spreading between big customers (wholesalers) and smaller customers (single firms). We want to deal with both special goods and standard goods.
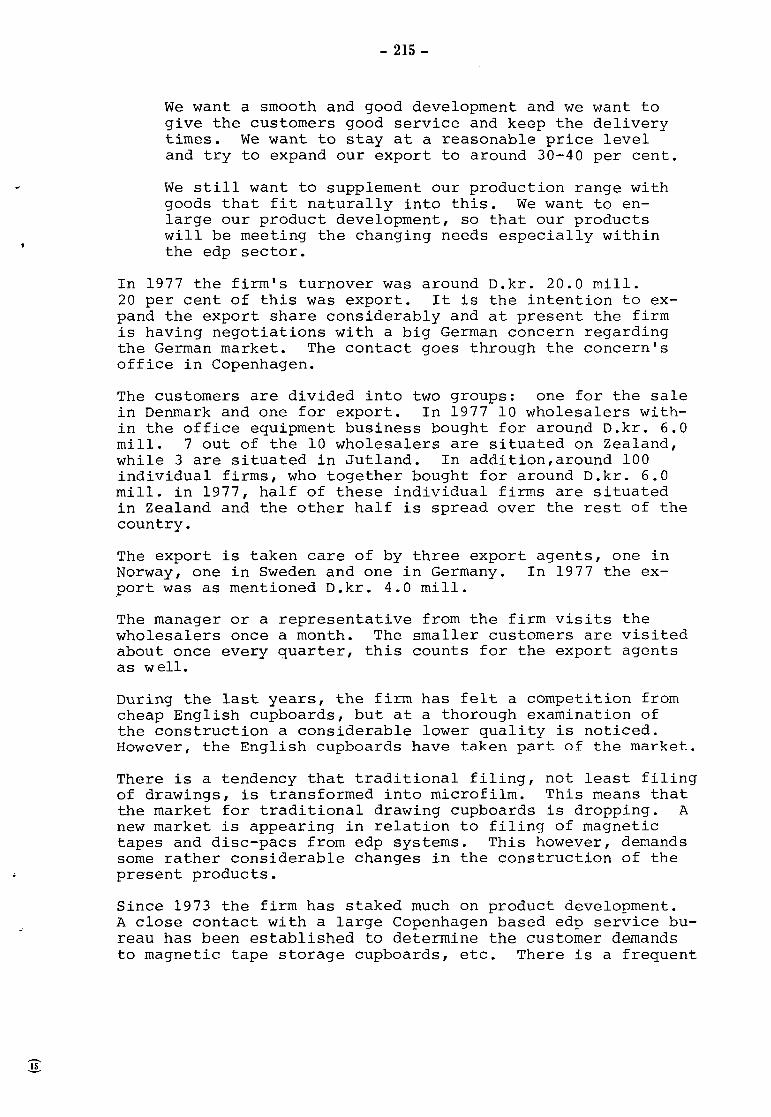
- 215-
We want a smooth and good development and we want to give the customers good service and keep the delivery times. We want to stay at a reasonable price level and try to expand our export to around 30-40 per cent.
We still want to supplement our production range with goods that fit naturally into this. We want to enlarge our product development, so that our products will be meeting the changing needs especially within the edp sector.
In 1977 the firm's turnover was around D.kr. 20.0 mill. 20 per cent of this was export. It is the intention to expand the export share considerably and at present the firm is having negotiations with a big German concern regarding the German market. The contact goes through the concern's office in Copenhagen.
The customers are divided into tv10 groups: one for the sale in Denmark and one for export. In 1977 10 wholesalers within the office equipment business bought for around D.kr. 6.0 mill. 7 out of the 10 wholesalers are situated on Zealand, while 3 are situated in Jutland. In addition,around 100 individual firms, who together bought for around D.kr. 6.0 mill. in 1977, half of these individual firms are situated in Zealand and the other half is spread over the rest of the country.
The export is taken care of by three export agents, one in Norway, one in Sweden and one in Germany. In 1977 the export was as mentioned D.kr. 4.0 mill.
The manager or a representative from the firm visits the wholesalers once a month. The smaller customers are visited about once every quarter, this counts for the export agents as well.
During the last years, the firm has felt a competition from cheap English cupboards, but at a thorough examination of the construction a considerable lower quality is noticed. However, the English cupboards have taken part of the market.
There is a tendency that traditional filing, not least filing of drawings, is transformed into microfilm. This means that the market for traditional drawing cupboards is dropping. A new market is appearing in relation to filing of magnetic tapes and disc-pacs from edp systems. This however, demands some rather considerable changes in the construction of the present products.
Since 1973 the firm has staked much on product development. A close contact with a large Copenhagen based edp service bureau has been established to determine the customer demands to magnetic tape storage cupboards, etc. There is a frequent

- 216-
contact to the edp suppliers, where t:he firm gets information on product changes, which can be of importance to the filing cupboards. A young engineer has established these contacts and now takes care of the product development function. In the product development group there is 3 employees and some know-how is bought from technological institutes etc. The tendency in the product development is pointing towards a larger specialization within the edp filing area.
In connection with the model changes,, the company in 1976 has established a design co-operation with an architect. A new series of cupboards in modern colours has created a conside·rable extra sale, and it has been noticed that the customers have become more design conscious. ~~he management has reco<jnized that a high design standard and frequent changes are a necessity to be competitive.
Within the last years it has appeared that the customers pay more attention to the filing security. This means that the LP cupboards are now delivered with advanced locking systems, making possible an electronic registration of which persons removes which kind of file material at different hours of the day. The knowledge and experience of the firm in this field is now so extensive that it has developE!d a comprehensive consultancy activity.
Although this activity from a business point of view is still limited, the management believes that: within the next years the consultancy will be a major product to the firm next to production and sale.
Apart from the case with the Enqlish cupboards, the customer relationship within the trade is rather strong, and no large competition is noticed.
The final outcome for 1977 is
Income
Sale Consultancy
Total
a .~ ,, follows:
1977
mill.D.kr.
19.1 0.9
20.0
Budget 1978
mill.D.kr.
25.0 2.0
27.0
•
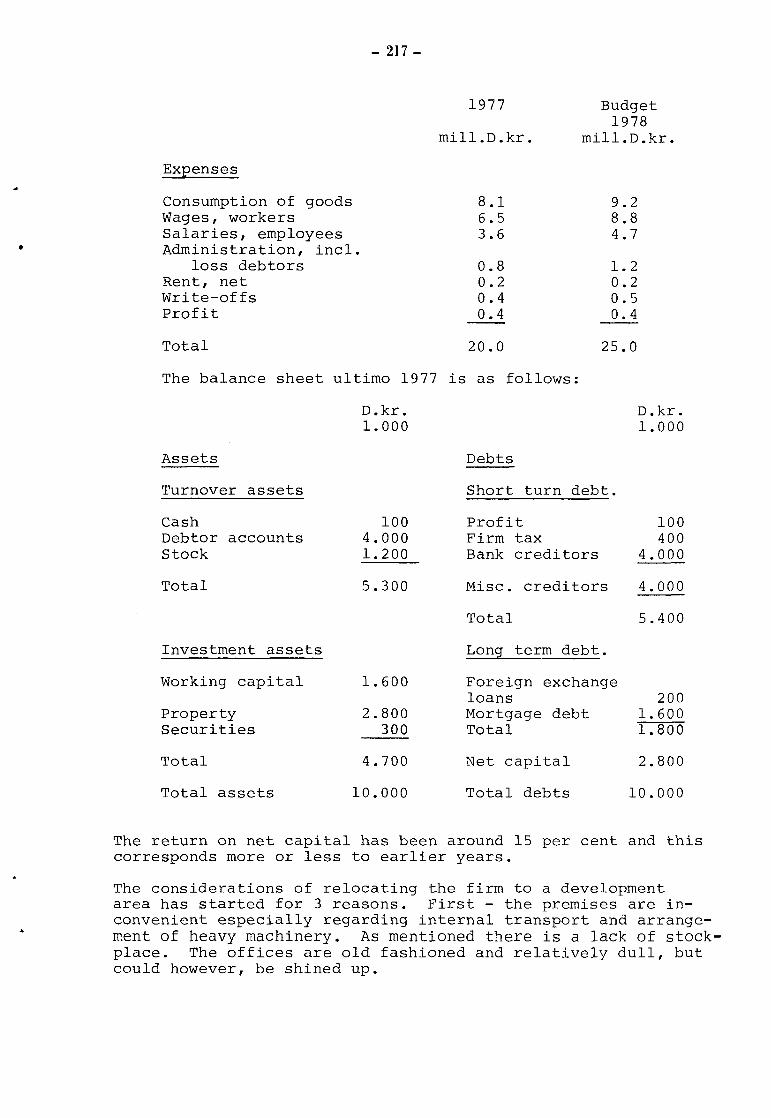
•
Expenses
Consumption of goods Wages, workers Salaries, employees Administration, incl •
loss debtors Rent, net Write-offs Profit
Total
- 217-
1977
mill.D .kr.
8.1 6.5 3.6
0.8 0.2 0.4 0.4
20.0
Budget 1978
mill.D.kr.
9.2 8.8 4.7
1.2 0.2 0.5 0.4
25.0
The balance sheet ultimo 1977 is as follows:
Assets
Turnover assets
Cash Debtor accounts Stock
Total
Investment assets
Working capital
Property Securities
Total
Total assets
D.kr. 1. 000
100 4.000 1. 200
5.300
1.600
2.800 300
4.700
10.000
Debts
Short turn debt.
Profit Firm tax Bank creditors
Misc. creditors
Total
Long term debt.
Foreign exchange loans Mortgage debt Total
Net capital
Total debts
D.kr. 1.000
100 400
4. 000
4.000
5.400
200 1. 600 1.800
2.800
10.000
The return on net capital has been around 15 per cent and this corresponds more or less to earlier years.
The considerations of relocating the firm to a development area has started for 3 reasons. First - the premises are inconvenient especially regarding internal transport and arrangement of heavy machinery. As mentioned there is a lack of stockplace. The offices are old fashioned and relatively dull, but could however, be shined up.

- 2111-
Second - the parking possibilities are few on the premises and the traffic facilities for trucks are bad.
Third- within,the last years there has been some internal labour trouble and there has been a considerable change of workers especially among the young work1ers. There is a considerable difference in age - on one side a group of older foremen and workers and on the other side a group of very young workers. The percentage of organized labour has grown to 100 within the last years.
The environment problems have been increasing within the last yE~ars as well. The external environment has not caused large problems, but there has been a number of complaints from the workers about chemicals used in surface treatment. It ha.s been tried to minimize the use of these chemicals, but the number of complaints has not decreased. Furthermore, within the last months there have been demands for silencing.
Your group has now accepted to function as advisers for the management in connection with solving the firm's problems.
•

•
- 219-
Group discussion
l. Which actions would you advise the management to take in solving the problems of the company?
Give a short justification for this attitude .
The management itself has considered whether possible relocation could help solving the problems.
Some preliminary investigations have been made and can be seen in appendix l.
No matter, how your proposals for a solution might be, the management would like to have your suggestions regarding the following questions 2 and 3.
2. Asking you to disregard the present possibilities for development grants, would you then recommend a relocation of the firm
a)
b)
c)
to another place in the Copenhagen region?
to a city in the provinces outside the Copenhagen region, but not in a development area?
to a development area (North and West Jutland, Southern Islands of Denmark, Lolland/Falster/M¢n and Kalundborg) .
Please give a brief justification.
[]
[]
From three different municipalities A, B and c, you have been offered support to the firm in connection with a possible relocation.
From a location point of view the three municipalities are equally attractive.

- 220 -
3. Would you recommend relocation to a development area, :if
Municipality A
The firm receives a cash once-and-for-all grant from the municipality as an "award" for relocating. How big should this contribution be for you to recom_mend reloca-tion?
c=J D.kr. once and for all
Municipality B
The firm receives a cash contribution every year for 5 years as an "award" for the relocation. How big should this contribution be (same amount every year) for you to recommend relocation?
L_ ___ j D. kr. every year for 5 years
Municipality C
Every employee who is considered "key employee" receives a tax free once-and-for-all contribution from the municipality, if the person accepts to relocate with the firm.
How big do you think this contribut:ion per employee should be?
L_ ___ ]_, D. kr. once and for all per employee?
4. Would there be other initiatives from the authorities that would influence on you to recommend the firm to relocate. Mention the 3 most important:
1)
2)
3)

•
..
- 221-
APPENDIX 1
Preliminary investigations about relocation made by the management.
The present management is willing to relocate. Confidentially three key employees have been asked about their opinion to this and they were not unwilling to move. It is know tha.t 10 employees definitely will not relocate, while there is some uncertainty about the rest of the employees. At least two of the foremen are definitely willing to move, while there is uncertainty about the remaining.
No workers are probably interested in moving, but new workers will be able to replace these after a period of training.
A rough estimate indicates that a site of around 6.000 m2 at a price of around D.kr. 200.000 in a development area would be suitable. A building of around 2.000 m2 at a price of around D.kr. 2.0 mill. is estimated to be necessary.
The costs of moving have been estimated to around D.kr. 400.000 and on top of this a loss in production of around 2 weeks corresponding to an amount of D.kr. 500.000. The expenses to training of new workforce are very difficult to estimate, but a budget of D.kr. 400.000 has been established.
One of the most uncertai~ points are, how the customers will react. But it is expected that the firm will be able to keep most of the customers, 1f the present frequency of visits is kept •

•

•
•
PROJEKTGRUPPEN ALTERNATIV LOKALISERING AF STORBYERHVERV
Annex 7.3 Summary of the results of group discussions in the Danish Management Center (D~~) and the Danish Lawyers and EconoMists Association (DJ0F) .
LARS KOLIND I PETER H. MATTHIESEN
FINAL REPORT ~LElCQJCffi\U~(Q)~ (Q)f LE(C(Q)[f\JJ(Q)M~C ffi\CU~~~U~LE~ U~ffi\[]~U~(Q)[f\J]ffi\llW lCQJCffi\UlE[] ~[f\JJ U~LE (C(Q)[p)[E[f\JJ~ffi\~lE[f\JJ ffi\~LEffi\

QUESTION
Which actions will you recommend?
Would you recommend relocation?
Form of awardings
A: Once
B: Per year in 5 years
C: Per employee
Location policy measures
•
D A N I S H
1
Market analysis Profit analysis Relocation
Yes to metropolitan region
in the interest of:
consulting activity contact edp firms Wholesalers from
Zealand Relocation expenditures
2 mio.
600.000
15.000
M A N A G E M E N T
2
Accounts/expenditure analysis Market analysis 3 years prognosis Structural change Analysis of objective Relocation/rebuilding
Sales/services for metropolitan region
C E N T E R~
3
Preparation of plan for relocation in two parts
Yes to regional develop ment area
Production for a regia- I In the interest of: nal development area
?
?
?
Leased buildings from authorities
Possibility for economical support
transport expenditures
1-Jorkforce basis
400.000
?
?
Environmental demands Tax subsidies Free site
4
Make order in the house. Revise the '78 budget
Yes to metropolitan region
In the interest of keeping the workforce
2 mio.
750.000
?
Tax benefits Building at disposal Education and house for employees
" ...
~ ~ ,j;;o.

• ..
QUESTION
Which actions will you recommend?
would you recommend relocation?
Form of A: Once awar-dings B: Per year
in 5 years
C: Per employee
Location policy measures
D J 0 F
1
Split up the firm in two parts .. a) Production and de-
velopment
b) Consulting and export
Yes. Development and production in Kalundborg
Consultion and export in the metropolitan region
1 mio.
400.000
20.000
-
Decreased interest leve Developed sites Cheap housing Education facilities Improved transport possibilities for travelling abroad Active support from municio~litv
C 0 U R S E
2
Split up the firm in to parts
a) Old production
b) New production and export
Yes. New production, development and export to Kalundborg
?
?
?
•
3
Profitability analysis
Yes to regional development area if possibility of grants
or Vcerl¢se
l. 3 mio
400.000
?
..
t-:1 t-:1 c.n I
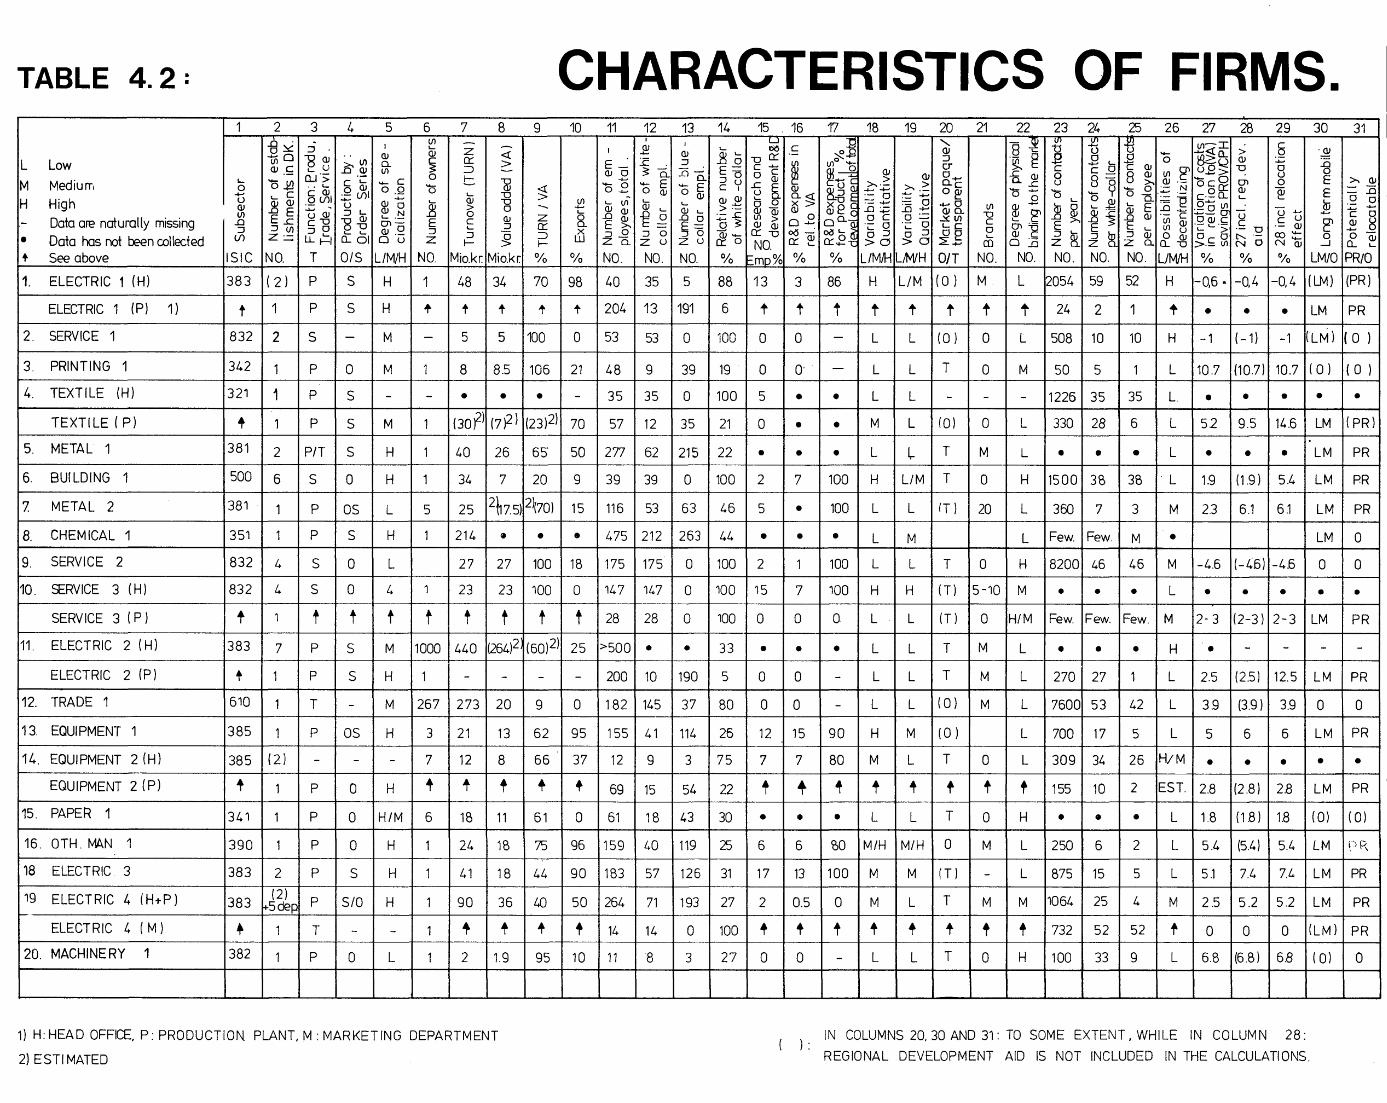
TABLE 4. 2:
L
M H
• + 1.
Low
Medium High Data are naturally missing Data has not been col !ected See above
ELECTRIC 1 (H)
ELECTRIC 1 (P) 1)
2. SERVICE 1
3. PRINTING 1
4. TEXTILE (H)
TEXTILE ( P)
5. METAL 1
6. BU! LDING 1
7. METAL 2
8. CHEMICAL 1
9. SERVICE 2
10. SERVICE 3 (H)
SERVICE 3 ( P)
11. ELECTRIC 2 (H)
ELECTRIC 2 (P)
12. TRADE 1
13. EQUIPMENT 1
14. EQUIPMENT 2 (H)
EQUIPMENT 2 (P)
15. PAPER 1
16. OTH. tvtA.N 1
18 ELECTRIC. 3
19 ELECTRIC 4 (H-t-P)
ELECTRIC 4 ( M)
20. MACHINERY 1
CHARACTERISTICS OF FIRMS. 1 2
'-0 ..... u QJ Ul
..0 ::J Vl
..0~
.Eo Ul c ClJ __
oJ:a '-- c ~QJ EE ::J Ul Z:..=
ISIC INO.
383 I( 2 l
t I 1
832 I 2
342 I 1
321 I 1
3 4 5 • I
::J . . QJ ""0 QJ Ul Q. e u .s Q.J lJ)
0..1"> c ·;:: ....... c ··'-- 0 w oo c w, ·- V>l :.;:: .Q Vl u QJ 0 ...._. ' ::J '- QJ N u QJ QJ '-- ·-c ""0 "B ""0 CJ) 0 ::J 0 '-- '-- QJ ·-
lL ~I 0.. 01 0 u
6 lJ)
; 0
~ E ::J z
T I 0/S IL!M/H I NO.
P I S I H I 1
p s H + s M
p 0 M
p s
7 8
z <I: 0::: > :::> -!::. "@ '-- ""0 QJ ""0 > 0 0 QJ E ::J
~ g
9
~ z 0::: :::> I-
Mio.kr: Mio.krl %
48 I 34 I 70
t I t I t
5 5 1100
10 11 12 13 14 I
Q) I I ...._. QJ QJ'-E-£. ::J . ..o_g w o ?; 0.. ::Oo_ Eo
...... c; ...... E ...... E fY o..._. ow oQJ lJ) '-- Ul- '- '- QJ 2
...... QJ QJ QJ '- QJ '- > ·-5 ..oEw.Oo..oo:.;::~ n. >.E= F= 0>
Wx ::J..Q ::J o 5o (j) ......
ZQ.ZU ZU 0:::0
15 . 16 17 18 19 00 c -----:t1 0::: ·- ~j;l
c c 0 QJ ""0 § Ulo .._
_g QJ ~13 >... -~ ~ U F ClJ ClJ..., ....__ -+-- >... ·-.._ 0. Q. <:( O:-' ·- 0 ~ -0 0 X > X'Oe ::::: -+-- ::::: 0 QJ (ij QJ QJ ..Cl :.;::; ..0 :::: Ul > o n. oc o~ QJ QJ 0 ....... 0 ·- 0 ·- 0 o:::-oo6ajO<'J 0 o::J o::J NO. o::: ...._ o:::.._ > o > a
20
' QJ ::J CT o...., Cl.c 0~ -o (l)Q. ~Ul '-C oe :;E..,
OJo NO. NO. I NO. % Fmp% % % LIMJH L!M!H I 0/T
98 40 35 5 88 13 I 3 I 86 I H I LJ M I ( 0 l
t I 204 I 13 1191 6 t t t t t t
21
lJ)
""0 c 0
m NO.
M
t
0 I 53 53 I 0 100 I 0 0 L L I (0 l I 0
8 I 8.5 1106 I 21 I 48 I 9 39 I 19 0 o· L L I T 0
• • • 35 I 35 I 0 I 100 I 5 • • L L
' p s M 1 I (30fll (7)2) 1(23)2)1 70 I 57 I 12 I 35 I 21 0 • • M L I 10) I 0
381 I 2 I P/T I s H 40 I 26 I 65' I 50 I 277 I 62 I 215 I 22 I • • • L ~ T M
500 I 6 S I 0 I H 34 I 7 I 20 I 9 I 39 I 39 I 0 I 100 I 2 7 I 100 I H I LIM I T I 0
381 I 1 P I OS I L 5 25 12l17.5JI2l(70J I 15 I 116 I 53 I 63 I 46 I 5 • I 100 I L I L I ( T ) I 20
351 I 1 p s H 214 I • • • I 475 I 212 I 263 I 44 I • • • L M
832 I 4 s 0 L 27 I 27 I 100 I 18 I 175 I 175 I 0 I 100 I 2 100 I L L T 0
22 23 24 25 26 27 28 29 - OJ l/1 VJ 2.1 Ul- I c 8 -c iJ U u ....... .......:<{ CL .; 0 ·tii o .E .8 '- E o ~Q w :.;:: >... t: c c o c w O"l uo> -o o o - WUlc ........ u £.~ u So 8 >-ClJ·-oco CJ) o - ....... ..... - y ....... 0 _:.;:: -~ 0 0::: QJ (ij 0 0 0 0 0 15.. :.= ""FI C·- Q_ '-- L
...... '-- QJ '-- ·- t:: 0 ....... lJ) • ru cr. )n 8 Qj ±:: w E :e ....... :z:_Q - -u ..... '-- c 15 >... ..0 ~ ...Q QJ lJ) c 0 QJ c u c u CJ) i5 E E > t: '- Ul w ·;:: .._ ·- .S: ·- w QJ c ::J'- ::J ::J OJ 0~ 0 i:5t--.·-g co:::: 0 j) Z 8_ Z Z Cl. 0.. ""0 >·£ Ul N 0 N QJ
NO. NO. NO. NO. UM!H % % %
L j2054 I 59 I 52 I H l-0,6 ·l-0.4 1-0.4
t 24 I 2 1 t I e • •
30 31
"_£!
:g E >... <lJ
E = :::0 '- 0 0 QJ :.;:: ....... ...... c 0
~ 2 ~ 0 0 QJ
_J CL '--
LM/0 PR/0
(LM) l{PR)
LM I PR
L I 508 I 10 I 10 I H I -1 I ( -1 l I -1 I(LM l I{ 0 l
M I 50 I 5 L 110.7 1(10.7li10.7I(Ol I( 0 l
- · 1226 I 35 I 35 I L • • • • • L I 330 I 28 I 6 L I 52 I 9.5 I 14.6 I LM I ( PR l
L • • • L • • • I LM I PR
H 115 0 0 I 3 S I 3S I L I 1.9 I ( 1.9 ) I 5.4 I L M I PR
L I 360 I 7 I 3 I M I 2.3 I 6.1 I 6.1 I LM I PR
L I Few. I Few. I M • LM I 0
H 182001 46 I 46 I M 1-4.6 H-46)1-4.6 I 0 0
832 I 4 s 0 4 23 I 23 I 100 I o I 14 7 I 14 7 I o I 100 I 15 7 I 100 I H H I (T) 15-10 I M • • • L • • • • • t t t t t t t t t I 28 I 28 I o I 100 I 0 0 0 L L I (T) I 0 IH/M I Few. I Few. I Few. I M 12-3 1(2-3 l 12-3 I LM I PR
383 I 7 p s M 110001440 1(264)2~(60)2)1 25 1>5001 • • 33 I e • • L L T M L • • • H • + p s H 200 I 10 I 190 ! 5 0 0 L L T M L 270 I 27 I 1 L 2.5 I (2.5) 112.5 I LM I PR
610 I 1 T M 1267 I 273 I 20 I 9 0 I 182 I 145 I 37 I 80 I 0 I 0 L L I (0) I M L 176001 53 I 42 I L I 3.9 I (3.9) I 3.9 I 0 0
385 I 1 P I OS I H 3 I 21 13 I 6 2 I 9 5 I 1 55 I 4 1 I 114 I 26 I 12 I 15 I 9 0 I H M I (0) L I 700 I 17 I 5 L 5 6 6 I LM I PR
385 I (2) 7 12 8 66 37 12 9 3 75 7 7 80 M L T 0 L 309 I 34 26 IH/M • • • • •
' p 0 H t ' f + + I 69 I 15 I 54 I 22 ' ~ ~ f ' t t t 1155 I 10 I 2 lEST. I 2.8 1(2.8) I 2.8 I LM I PR
341 I 1 p 0 I HIM I 6 18 I 11 61 0 I 61 I 18 I 43 I 30 • • • L L T 0 H • • • L I 1.8 I ( 1.8 J I 1.8 I ( o l I ( o l 390 I 1 p 0 H 24 I 1S I 75 I 96 1159 I 40 1119 I 25 I 6 6 COO I M/H I M/H I 0 M L I 250 I 6 2 L I 5.4 I (5.4) I 5.4 I LM IPR
383 I 2 I P I S I H 41 I 18 I 44 I 90 1183 I 57 I 126 I 31 I 17 I 13 I 100 I M M I fT) L I 875 I 15 5 L I 5.1 I 7.4 I 7.L I L M I PR
383 ~~~pi P I S/0 I H 90 I 36 I 40 I 50 I 264 I 71 I 193 I 27 I 2 I 0.5 I 0 I M L I T M M 11064 I 25 4 M I 2 .5 I 5 .2 I 5 .2 I L M I PR
+ T + ' + f 14 14 0 100 t ' f ' t ' f f 732 52 52 t 0 0 0 (LM) I PR
382 p 0 L 2 1.9 95 10 11 8 3 27 0 0 L L T 0 H 100 33 9 L 6.8 1(6.8) I 6.8 (Ol I 0
1) H: HEAD OFFICE, P: PRODUCTION PLANT, M: MARKETING DEPARTMENT ) : IN COLUMNS 20. 30 AND 31: TO SOME EXTENT. WHILE IN COLUMN 28:
2) EST I MATED REGIONAL DEVELOPMENT AID IS NOT INCLUDED IN THE CALCULATIONS.

•