FHWA FY 2016 BUDGET - US Department of Transportation · Federal Lands Transportation Program ....
216
FHWA FY 2016 BUDGET TABLE OF CONTENTS Section I: Overview Page Budget Summary Overview I-1 Exhibit I: Organizational Charts – FY 2015 and FY 2016 I-7 Section II: Budget Summary Tables Analysis by Account Exhibit II-1: New Budget Authority II-1 Exhibit II-2: Total Budgetary Resources II-2 Exhibit II-3: Budget Request by Strategic Goal and Objective II-3 Exhibit II-4: Budget Authority II-4 Exhibit II-5: Outlays II-5 Analysis of Change Tables Exhibit II-6: Limitation on Administrative Expenses II-6 Exhibit II-7: Working Capital Fund II-7 Staffing Summary Exhibit II-8: Full-time Equivalent Employment (FTE) II-8 Exhibit II-9: Full-time Permanent Positions (FTP) II-9 Section III: Budget Request by Appropriation Account 10-Year Funding History Table III-1 Reauthorization Table III-3 Federal-aid Highways Appropriations Language III-5 Exhibits Exhibit III-1: Summary by Program Activity III-11 Exhibit III-1a: Summary Analysis of Change III-12 Exhibit III-2: Annual Performance Results and Targets III-13 Financial Schedules III-19 Highway Safety Improvement Program III-25 National Highway Performance Program III-31 Surface Transportation Program III-39 Congestion Mitigation & Air Quality Improvement Program III-45 Metropolitan Transportation Planning III-49 Transportation Alternatives Program III-53 Critical Immediate Safety Investments Program III-57 Federal Lands & Tribal Transportation Programs III-65
Transcript of FHWA FY 2016 BUDGET - US Department of Transportation · Federal Lands Transportation Program ....
FHWA FY 2016 BUDGET
TABLE OF CONTENTS Section I: Overview Page Budget Summary Overview I-1 Exhibit I: Organizational Charts – FY 2015 and FY 2016 I-7 Section II: Budget Summary Tables Analysis by Account Exhibit II-1: New Budget Authority II-1 Exhibit II-2: Total Budgetary Resources II-2 Exhibit II-3: Budget Request by Strategic Goal and Objective II-3 Exhibit II-4: Budget Authority II-4 Exhibit II-5: Outlays II-5 Analysis of Change Tables Exhibit II-6: Limitation on Administrative Expenses II-6 Exhibit II-7: Working Capital Fund II-7 Staffing Summary Exhibit II-8: Full-time Equivalent Employment (FTE) II-8 Exhibit II-9: Full-time Permanent Positions (FTP) II-9 Section III: Budget Request by Appropriation Account 10-Year Funding History Table III-1 Reauthorization Table III-3 Federal-aid Highways
Appropriations Language III-5 Exhibits
Exhibit III-1: Summary by Program Activity III-11 Exhibit III-1a: Summary Analysis of Change III-12 Exhibit III-2: Annual Performance Results and Targets III-13
Financial Schedules III-19 Highway Safety Improvement Program III-25 National Highway Performance Program III-31 Surface Transportation Program III-39 Congestion Mitigation & Air Quality Improvement Program III-45 Metropolitan Transportation Planning III-49 Transportation Alternatives Program III-53 Critical Immediate Safety Investments Program III-57 Federal Lands & Tribal Transportation Programs III-65
Federal Lands Transportation Program Federal Lands Access Program Tribal Transportation Program Nationally Significant Federal Lands and Tribal Projects
Research, Technology, and Education Program III-81 Federal Allocation Programs III-91 Emergency Relief Program
Territorial and Puerto Rico Highway Program Construction of Ferry Boats and Ferry Terminal Facilities On-the-Job Training Disadvantaged Business Enterprise Highway Use Tax Evasion Projects Performance Management Data Support Program Ladders of Opportunity
TIFIA Program III-115 Multimodal Freight Investment Program III-125 Administrative Expenses III-133
Fixing and Accelerating Surface Transportation
Appropriations Language III-145 Program Summary III-147
Other Accounts
Highway Infrastructure Investment, Recovery Act (ARRA) III-151 Emergency Relief III-153 Appalachian Development Highway System III-155 Miscellaneous Appropriations III-159 Miscellaneous Transportation Trust Funds III-161 Miscellaneous Trust Funds III-163 TIFIA Financing Accounts III-165 Right-of-Way Revolving Fund III-171 State Infrastructure Banks III-173 Highway Infrastructure Programs III-175 Payment to the Transportation Trust Fund III-177
Section IV: Research, Development and Technology Exhibit IV-1: Budget Authority IV-1 Program Summary IV-3
I-1
FEDERAL HIGHWAY ADMINISTRATION (FHWA) FISCAL YEAR 2016 BUDGET
BUDGET SUMMARY OVERVIEW
President Obama proposes a six-year surface transportation bill that reflects the Administration’s commitment to achieving greater investment in our surface transportation system. The Generating Renewal, Opportunity, and Work with Accelerated Mobility, Efficiency, and Rebuilding of Infrastructure and Communities throughout America Act, or GROW AMERICA Act, provides a comprehensive plan to repair and modernize the currently outdated highway infrastructure on which our Nation depends to move people and freight safely and efficiently.
Building on the successes of MAP-21, and reflecting the GROW AMERICA proposal, the 2016 Budget will spur economic growth and give States the certainty needed to make sound, long-term investments that will create jobs. FHWA programs will continue the focus on safety, streamlined project delivery, and enhanced performance management, while increasing our investment in projects that facilitate the movement of freight, repair structurally deficient bridges, improve safety on rural roads, empower local communities, and provide ladders of opportunity that connect people to employment, education, and services.
FHWA requests $51.3 billion for FY 2016 to maintain and improve the safety, condition, and performance of our national highway system, and enable FHWA to provide effective stewardship and oversight of highway programs and funding. The budget request will support a performance-based investment approach and streamlined highway grant programs that provide funding flexibility to States and other recipients of FHWA funding. This request is the vital investment in our Nation’s infrastructure needed to keep pace with our growing population while expanding the economy and creating jobs.
The request will continue FHWA’s focus on accelerated project delivery through expedited environmental review and elimination of duplicate processes. Through the Every Day Counts (EDC) initiative, FHWA will accelerate the deployment and implementation of market-ready strategies and technologies in partnership with State and local transportation agencies. Also, consistent with GROW AMERICA, the budget request will further empower local communities by strengthening decision-making and providing more control and funding to high performing Metropolitan Planning Organizations (MPOs).
FHWA’s budget request includes several initiatives proposed in the GROW AMERICA Act that are essential to our Nation’s transportation infrastructure network. The Multimodal Freight Investment Program will advance critically needed, yet complex, multi-modal or multi-jurisdictional projects to improve goods movement and economic competitiveness. The Critical Immediate Safety Investments Program (CISIP) will dedicate necessary resources to high-priority safety-related initiatives such as bridge repair and rehabilitation, safety on rural roads, and state of good repair on the National Highway System (NHS). The budget proposal also builds on the Administration’s focus to strengthen the middle class, create jobs, and grow the economy through the Ladders of Opportunity program. This effort has two parts. First, FHWA proposes to bolster workforce development efforts to assist workers in developing long-term
I-2
skills and strengthen the transportation workforce. Second, it will provide safe travel connections that link people in underserved communities to schools, jobs, services and other destinations.
Through a reauthorized Federal-aid Highway Program (FAHP), we will provide national leadership to connect America’s communities and economies. FHWA programs not only help create jobs today for people willing to build and maintain our infrastructure, but also enable the movement of people and goods, tying communities together, and supporting our economy. The following is a summary of the programs included in the FY 2016 budget request.
Safety remains our highest priority. The Highway Safety Improvement Program ($2.6 billion) will continue to significantly reduce traffic fatalities and serious injuries on all public roads. This program will continue to emphasize a data-driven and performance-based strategic approach to improving highway safety. The foundation of this approach is a safety data system that identifies key safety problems, establishes their relative severity, and then adopts strategic and performance-based measures to maximize safety. Each State will continue to develop and regularly update a State Strategic Highway Safety Plan that lays out strategies to address key safety problems, including bike and pedestrian safety. Safety performance will continue to be monitored via State-specific safety targets for the number of fatalities and serious injuries and the number of such events per vehicle mile of travel. Additionally, States will continue to monitor safety performance regarding older drivers and high risk rural roads.
The National Highway Performance Program ($22.3 billion) will continue to target investment to preserve, modernize, and ultimately save lives on the National Highway System (NHS). This network is composed of 220,000 miles of rural and urban roads serving major population centers, international border crossings, intermodal transportation facilities, and major travel destinations. The NHS includes the Interstate System, all principal arterials, intermodal connectors, and other roads important to mobility, commerce, national defense, and intermodal connectivity. Through a performance-based approach, this program will continue to maintain or improve the condition and performance of the NHS, construct new facilities on the NHS, and ensure that investments of Federal-aid funds are directed to support progress toward the achievement of specified performance targets.
The performance basis of this program will continue to be defined by individual State asset management plans. These plans aim to improve or preserve asset condition and system performance. States will periodically review and update the asset management plans to ensure that they meet or exceed the established minimum performance standards.
The Surface Transportation Program ($10.3 billion) will continue to provide flexible funding that States and localities may use for the following: projects to improve or preserve the condition and performance on any Federal-aid highway; bridge and safety projects on any public road; facilities for non-motorized transportation; transit capital projects; and public bus terminals and facilities. The flexible nature of this program focuses direct funding to priority areas and areas of greatest need.
I-3
The Surface Transportation Program will continue to provide funding for a wide range of eligible projects. Eligible projects range from traditional activities, such as construction and rehabilitation of highways and bridges, to more innovative projects, such as electric and natural gas vehicle charging infrastructure and electronic toll collection facilities. The broad range of eligibility allows States to improve and maintain their critical infrastructure while fostering transportation innovation.
The Congestion Mitigation and Air Quality Improvement Program ($2.3 billion) will continue to provide a flexible funding source to State and local governments for transportation projects and programs designed to help States meet the requirements of the Clean Air Act. Funding is available to reduce congestion and improve air quality for areas that do not meet the National Ambient Air Quality Standards for ozone, carbon monoxide, or particulate matter (nonattainment areas) as well as former nonattainment areas that are now in compliance (maintenance areas).
This program will continue to incorporate performance measures that assess traffic congestion and on-road motor vehicle emissions. To date, each Metropolitan Planning Organization with a transportation management area that serves more than one million people and represents a nonattainment or maintenance area has developed and will continue to update biennially a performance plan to achieve air quality and congestion reduction targets.
Funding for Metropolitan Transportation Planning ($320 million) will continue to provide resources for the improvement of metropolitan and statewide transportation planning processes. FHWA will continue to use a performance-based approach to transportation decision-making to support national goals and critical outcomes for the region of the metropolitan planning organization. To further incentivize best practices, States will prioritize funding to high performing MPOs. The planning process will continue to provide consideration for projects that increase safety (including bike and pedestrian safety), support economic vitality, increase accessibility, mobility, and connectivity, protect and enhance the environment, emphasize the preservation of existing infrastructure, and increase security of the transportation system.
Funding for the Transportation Alternatives Program ($847 million) will continue to provide resources to expand transportation choices and enhance the transportation experience. Eligible projects include bike and pedestrian infrastructure and safety programs, scenic overlooks and turnouts, vegetation management, historic preservation, and environmental mitigation.
The Critical Immediate Safety Investments Program (CISIP) ($7.5 billion) will make critical and immediate improvements to infrastructure condition and highway safety. This is part of the President’s Fix It First initiative. CISIP will achieve its goals through three initiatives—the Interstate Bridge Revitalization Initiative, which will address structurally deficient bridges on the Interstate System; the Systematic Safety Initiative, which will address safety on non-State and rural roads; and the State of Good Repair Initiative, which will address bridge and pavement improvements and preservation on the NHS.
The Multimodal Freight Investment Program ($1.0 billion) will improve goods movement and advance export and economic development opportunities across our Nation. The program will include a discretionary grant program and an incentive grant program that are based on
I-4
distributions to States that account for freight infrastructure and activity. Funding will advance critically needed multi-modal or multi-jurisdictional projects to improve goods movement, economic competitiveness, and sustainability.
The Federal Lands and Tribal Transportation Programs ($1.3 billion) will continue to fund projects that provide access to and within Federal and Tribal lands. The program will continue to treat these lands with uniform policies similar to the policies that apply to Federal-aid highways and other public transportation facilities.
• Federal Lands Transportation Program: $370 million for projects that improve public access on high-priority roads, trails, and transit systems within the Federal estate (national forests, national parks, national wildlife refuges, national recreation areas, and other Federal public lands) on infrastructure owned by the Federal government.
• Federal Lands Access Program: $250 million for projects that improve access to the Federal estate on infrastructure owned by States, counties, and local governments.
• Tribal Transportation Program: $507 million for projects that improve access to and within Tribal Lands.
• Nationally Significant Federal Lands and Tribal Projects: $150 million for rehabilitation, construction, or reconstruction of large, nationally-significant transportation infrastructure within or providing access to Federal or Tribal lands.
The Transportation Infrastructure Finance and Innovation Act Program (TIFIA) ($1.0 billion) will continue to leverage Federal dollars in a time of scarce budgetary resources, facilitating private participation in transportation projects and encouraging innovative financing mechanisms that help advance projects sooner than otherwise possible. TIFIA provides Federal credit assistance for highway, transit, rail, and intermodal freight projects. A $1 billion TIFIA investment will support approximately $10 billion in actual lending capacity.
The Research, Technology, and Education Program ($496 million) will continue to be a flexible, nationally-coordinated research and technology program that addresses fundamental, long-term highway research needs, significant research gaps, emerging issues with national implications, and research related to policy and planning. All research activities will continue to include components of performance measurement and evaluation, will be outcome-based, and will be consistent with the research and technology development strategic plan. In addition, under the GROW AMERICA Act, the Secretary may set aside up to $25 million for implementation of the Future Strategic Highway Research Program (SHRP2) from the amount authorized for apportioned programs.
• Highway Research and Development Program: $130 million for research activities associated with highway safety, infrastructure integrity, planning and the environment, highway operations, exploratory advanced research, and the Turner-Fairbank Highway Research Center.

I-5
• Technology and Innovation Deployment Program: $70 million to accelerate implementation and delivery of new innovations and technologies that result from highway research and development to benefit all aspects of highway transportation.
• Training and Education: $27 million to train the current and future transportation workforce, transferring knowledge quickly and effectively.
The Research, Technology, and Education Program request also includes $269 million for several programs administered by the Office of the Assistant Secretary for Research and Technology:
• Intelligent Transportation Systems ($158 million)
• University Transportation Centers ($82 million)
• Bureau of Transportation Statistics ($29 million) Federal Allocation Programs ($502 million) is comprised of eight vital programs:
• Emergency Relief: $100 million to assist Federal, State, Tribal, and local governments with the expense of repairing serious damage to Federal-aid, Tribal, and Federal Lands highways resulting from natural disasters, or catastrophic failures.
• Territorial and Puerto Rico Highway Program: $190 million to fund highway programs in United States territories and Puerto Rico.
• Construction of Ferry Boats and Ferry Terminal Facilities: $70 million to construct ferry boats and ferry boat terminal facilities, which will improve connectivity, provide travel mode options, and reduce congestion.
• On-the-Job Training: $11 million to enhance the development of our Nation’s highway construction industry workforce.
• Disadvantaged Business Enterprise: $11 million to assist certified DBE firms in becoming competitive when seeking to obtain highway and bridge construction contracts.
• Highway Use Tax Evasion Projects: $10 million to provide funding to the Internal Revenue Service (IRS), other Federal agencies, and the States to carry out intergovernmental enforcement efforts along with training and research to reduce evasion of payment of motor fuel and other highway use taxes.
• Performance Management Data Support Program: $10 million to develop a program to provide enhanced data and analytical tools to MPOs, States and the Department to assist in meeting expanded performance management goals under MAP-21.
• Ladders of Opportunity: o Jobs-Driven Skills Training Incentive: $30 million to strengthen workforce
development services.
I-6
o Connection to Opportunity Pilot Program: $70 million to improve connections between people and economic opportunities, primarily for underserved communities.
The Fixing and Accelerating Surface Transportation (FAST) ($500 million) program will promote best practices and spur innovation in transportation infrastructure. Through competitive grant awards, the program will provide incentives to States, MPOs, Tribal governments and other Federal agencies to improve strategic transportation investment decision-making, further incorporate performance management into project selection, and encourage other reforms to improve strategic transportation outcomes. The total Administrative Expenses request of $442 million includes funding for FHWA General Operating Expenses and Appalachian Regional Commission (ARC) administrative expenses related to the Appalachian Development Highway System. These resources are essential for FHWA and ARC to effectively perform critical oversight functions and successfully implement the programs proposed in the budget.
I-7
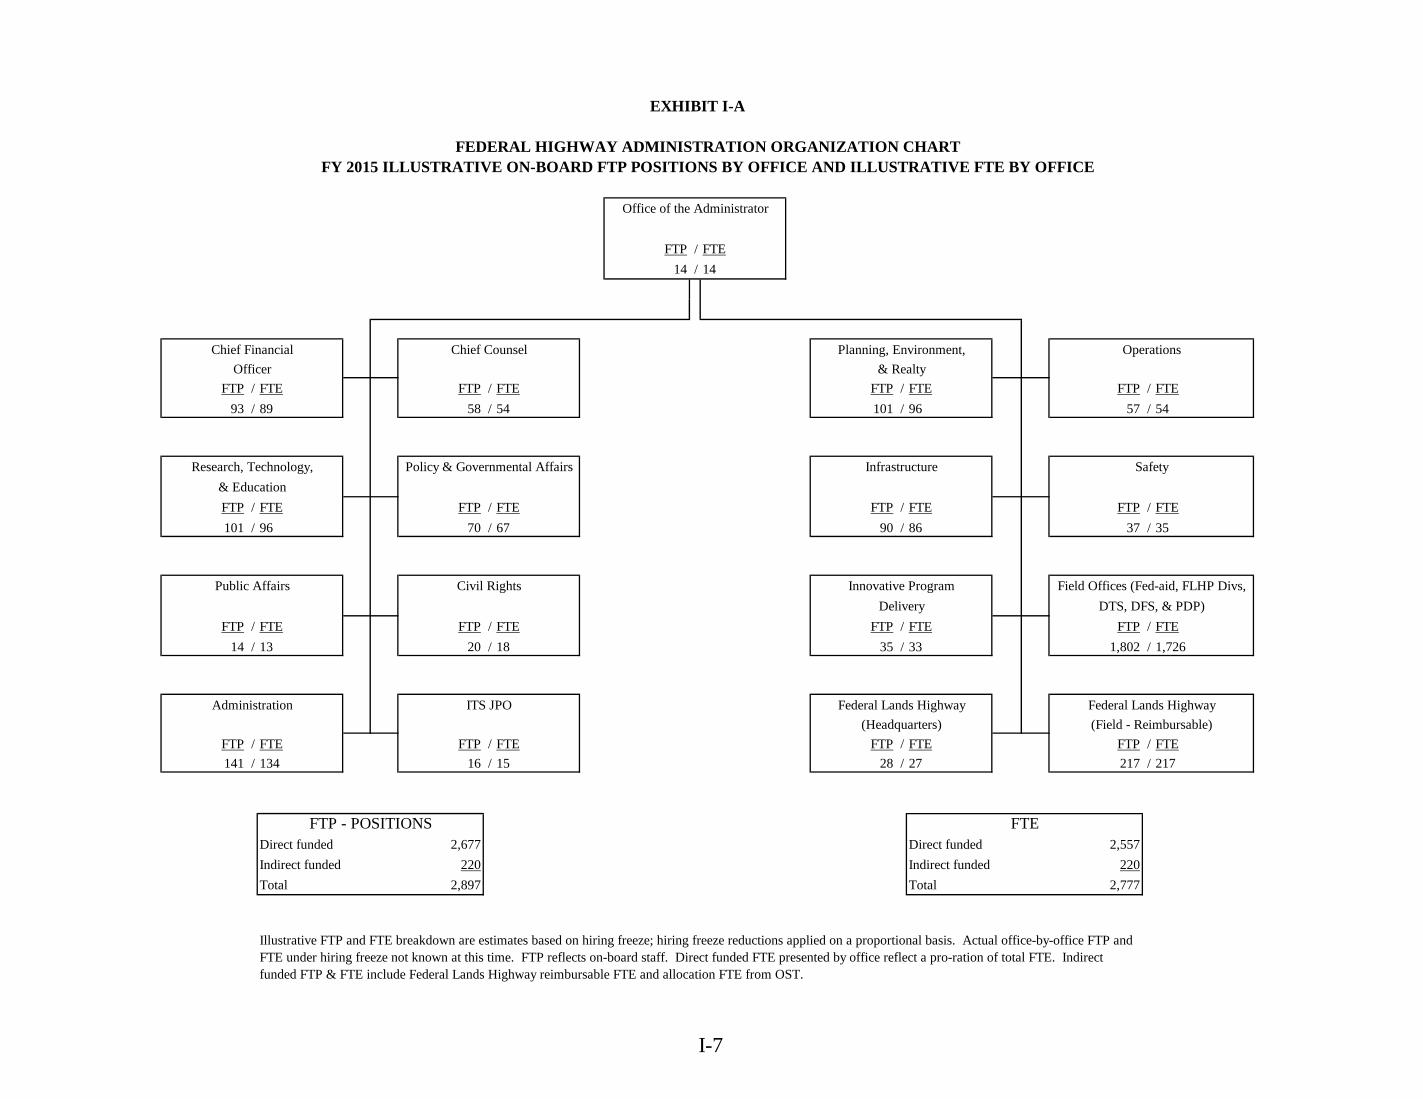
Office of the Administrator
FTP / FTE14 / 14
Chief Financial Chief Counsel Planning, Environment, OperationsOfficer & Realty
FTP / FTE FTP / FTE FTP / FTE FTP / FTE93 / 89 58 / 54 101 / 96 57 / 54
Research, Technology, Policy & Governmental Affairs Infrastructure Safety& EducationFTP / FTE FTP / FTE FTP / FTE FTP / FTE101 / 96 70 / 67 90 / 86 37 / 35
Public Affairs Civil Rights Innovative Program Field Offices (Fed-aid, FLHP Divs,Delivery DTS, DFS, & PDP)
FTP / FTE FTP / FTE FTP / FTE FTP / FTE14 / 13 20 / 18 35 / 33 1,802 / 1,726
Administration ITS JPO Federal Lands Highway Federal Lands Highway(Headquarters) (Field - Reimbursable)
FTP / FTE FTP / FTE FTP / FTE FTP / FTE141 / 134 16 / 15 28 / 27 217 / 217
Direct funded 2,677 Direct funded 2,557Indirect funded 220 Indirect funded 220Total 2,897 Total 2,777
Illustrative FTP and FTE breakdown are estimates based on hiring freeze; hiring freeze reductions applied on a proportional basis. Actual office-by-office FTP and FTE under hiring freeze not known at this time. FTP reflects on-board staff. Direct funded FTE presented by office reflect a pro-ration of total FTE. Indirect funded FTP & FTE include Federal Lands Highway reimbursable FTE and allocation FTE from OST.
FTP - POSITIONS FTE
EXHIBIT I-A
FEDERAL HIGHWAY ADMINISTRATION ORGANIZATION CHARTFY 2015 ILLUSTRATIVE ON-BOARD FTP POSITIONS BY OFFICE AND ILLUSTRATIVE FTE BY OFFICE
I-8
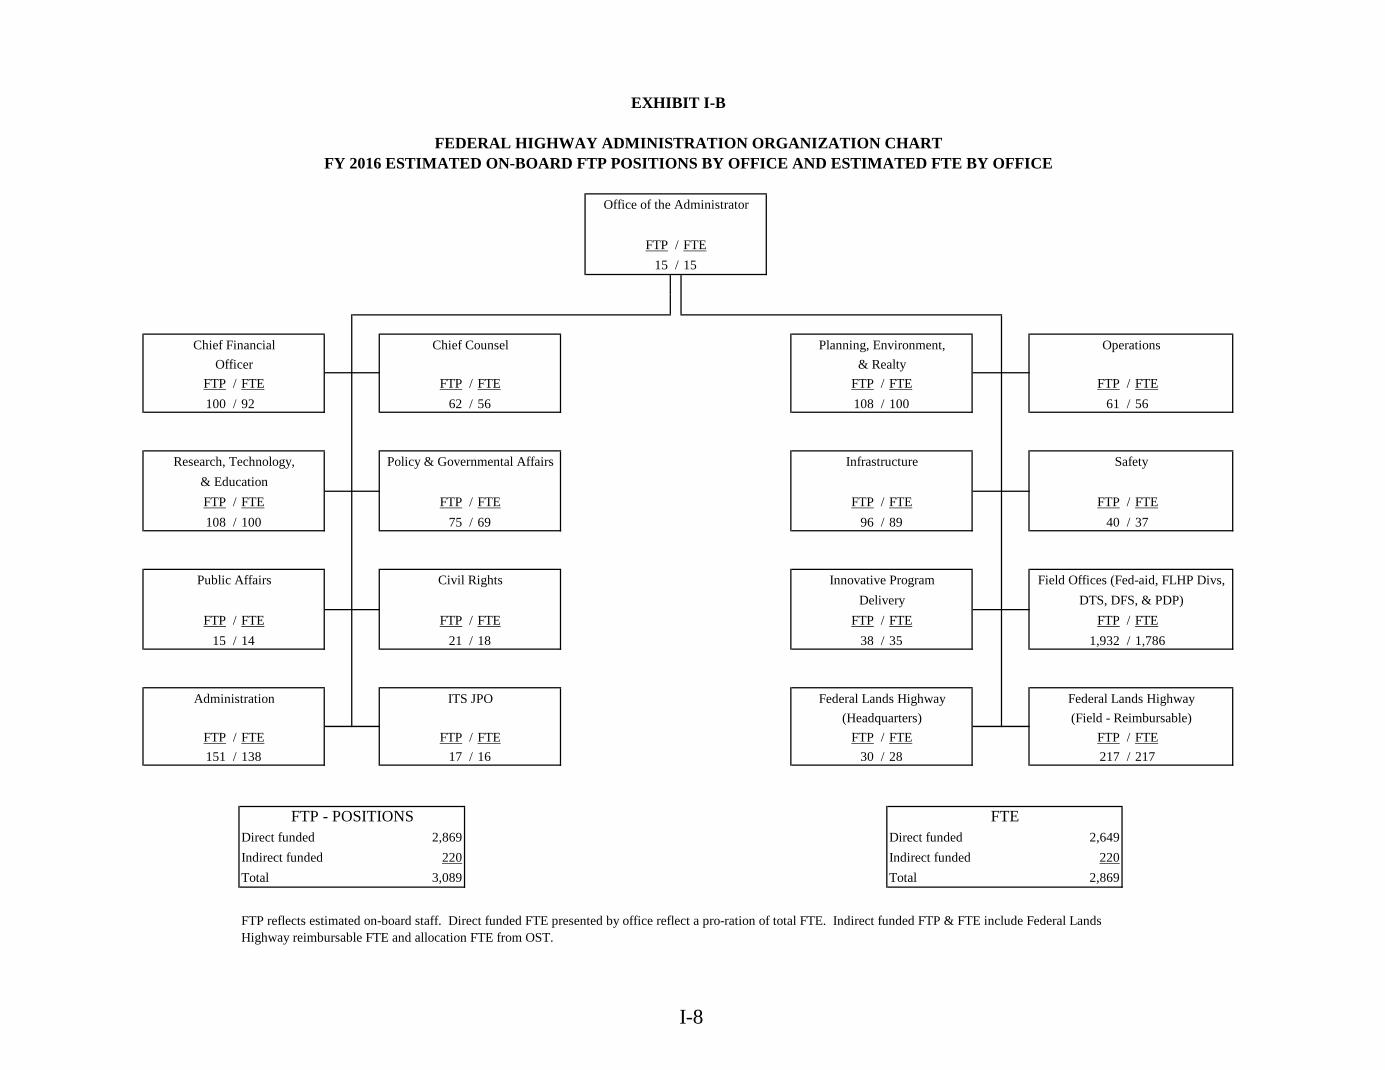
Office of the Administrator
FTP / FTE15 / 15
Chief Financial Chief Counsel Planning, Environment, OperationsOfficer & Realty
FTP / FTE FTP / FTE FTP / FTE FTP / FTE100 / 92 62 / 56 108 / 100 61 / 56
Research, Technology, Policy & Governmental Affairs Infrastructure Safety& EducationFTP / FTE FTP / FTE FTP / FTE FTP / FTE108 / 100 75 / 69 96 / 89 40 / 37
Public Affairs Civil Rights Innovative Program Field Offices (Fed-aid, FLHP Divs,Delivery DTS, DFS, & PDP)
FTP / FTE FTP / FTE FTP / FTE FTP / FTE15 / 14 21 / 18 38 / 35 1,932 / 1,786
Administration ITS JPO Federal Lands Highway Federal Lands Highway(Headquarters) (Field - Reimbursable)
FTP / FTE FTP / FTE FTP / FTE FTP / FTE151 / 138 17 / 16 30 / 28 217 / 217
Direct funded 2,869 Direct funded 2,649Indirect funded 220 Indirect funded 220Total 3,089 Total 2,869
FTP reflects estimated on-board staff. Direct funded FTE presented by office reflect a pro-ration of total FTE. Indirect funded FTP & FTE include Federal Lands Highway reimbursable FTE and allocation FTE from OST.
FTP - POSITIONS FTE
EXHIBIT I-B
FEDERAL HIGHWAY ADMINISTRATION ORGANIZATION CHARTFY 2016 ESTIMATED ON-BOARD FTP POSITIONS BY OFFICE AND ESTIMATED FTE BY OFFICE
II-1
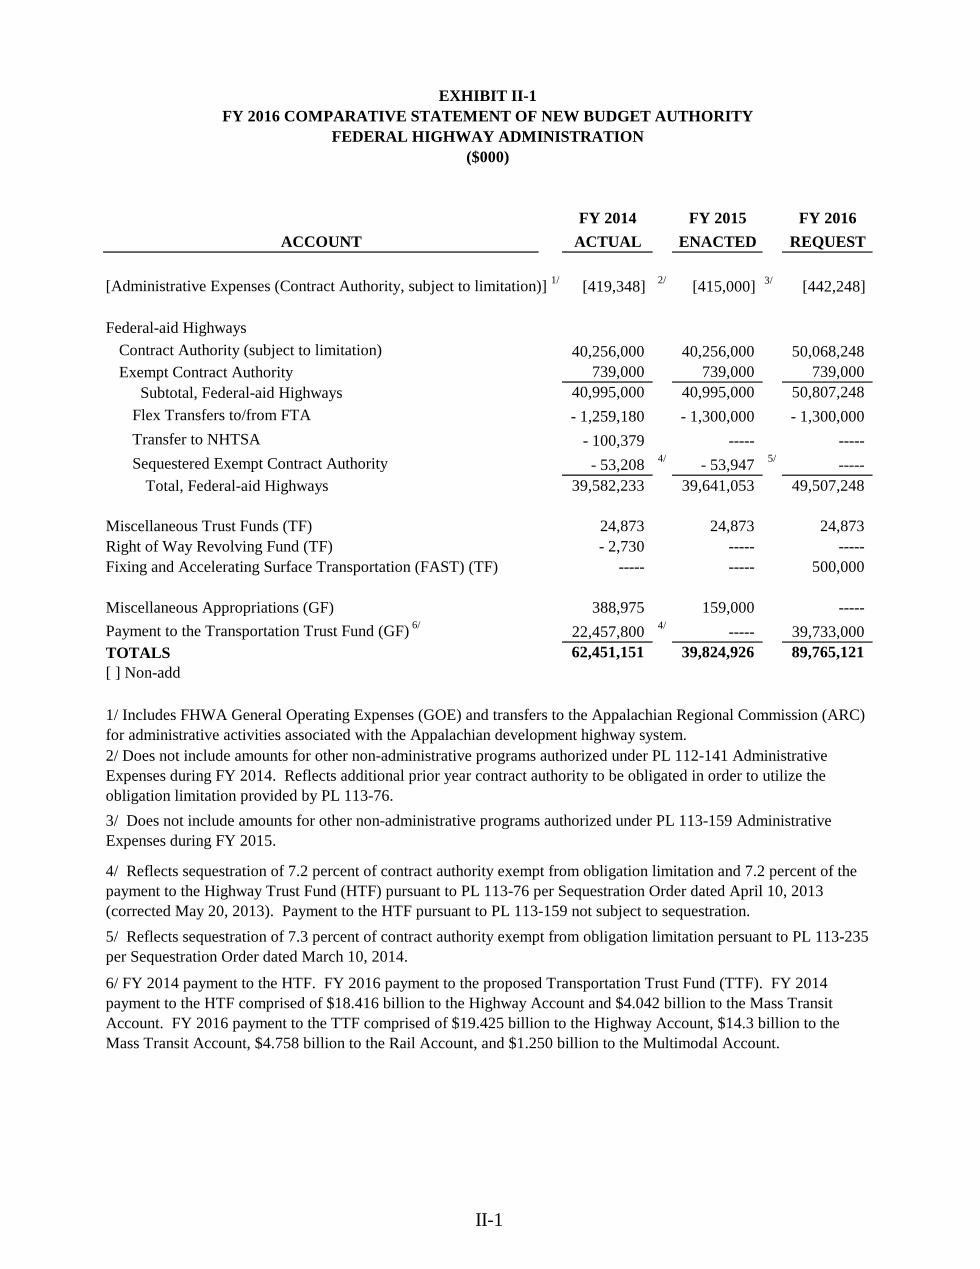
FY 2014 FY 2015 FY 2016ACCOUNT ACTUAL ENACTED REQUEST
[Administrative Expenses (Contract Authority, subject to limitation)] 1/ [419,348] 2/ [415,000] 3/ [442,248]
Federal-aid HighwaysContract Authority (subject to limitation) 40,256,000 40,256,000 50,068,248 Exempt Contract Authority 739,000 739,000 739,000
Subtotal, Federal-aid Highways 40,995,000 40,995,000 50,807,248 Flex Transfers to/from FTA - 1,259,180 - 1,300,000 - 1,300,000Transfer to NHTSA - 100,379 ----- ----- Sequestered Exempt Contract Authority - 53,208 4/ - 53,947 5/ -----
Total, Federal-aid Highways 39,582,233 39,641,053 49,507,248
Miscellaneous Trust Funds (TF) 24,873 24,873 24,873 Right of Way Revolving Fund (TF) - 2,730 ----- ----- Fixing and Accelerating Surface Transportation (FAST) (TF) ----- ----- 500,000
Miscellaneous Appropriations (GF) 388,975 159,000 ----- Payment to the Transportation Trust Fund (GF) 6/ 22,457,800 4/ ----- 39,733,000 TOTALS 62,451,151 39,824,926 89,765,121 [ ] Non-add
EXHIBIT II-1FY 2016 COMPARATIVE STATEMENT OF NEW BUDGET AUTHORITY
FEDERAL HIGHWAY ADMINISTRATION($000)
6/ FY 2014 payment to the HTF. FY 2016 payment to the proposed Transportation Trust Fund (TTF). FY 2014 payment to the HTF comprised of $18.416 billion to the Highway Account and $4.042 billion to the Mass Transit Account. FY 2016 payment to the TTF comprised of $19.425 billion to the Highway Account, $14.3 billion to the Mass Transit Account, $4.758 billion to the Rail Account, and $1.250 billion to the Multimodal Account.
4/ Reflects sequestration of 7.2 percent of contract authority exempt from obligation limitation and 7.2 percent of the payment to the Highway Trust Fund (HTF) pursuant to PL 113-76 per Sequestration Order dated April 10, 2013 (corrected May 20, 2013). Payment to the HTF pursuant to PL 113-159 not subject to sequestration.
2/ Does not include amounts for other non-administrative programs authorized under PL 112-141 Administrative Expenses during FY 2014. Reflects additional prior year contract authority to be obligated in order to utilize the obligation limitation provided by PL 113-76.
1/ Includes FHWA General Operating Expenses (GOE) and transfers to the Appalachian Regional Commission (ARC) for administrative activities associated with the Appalachian development highway system.
5/ Reflects sequestration of 7.3 percent of contract authority exempt from obligation limitation persuant to PL 113-235 per Sequestration Order dated March 10, 2014.
3/ Does not include amounts for other non-administrative programs authorized under PL 113-159 Administrative Expenses during FY 2015.
II-2
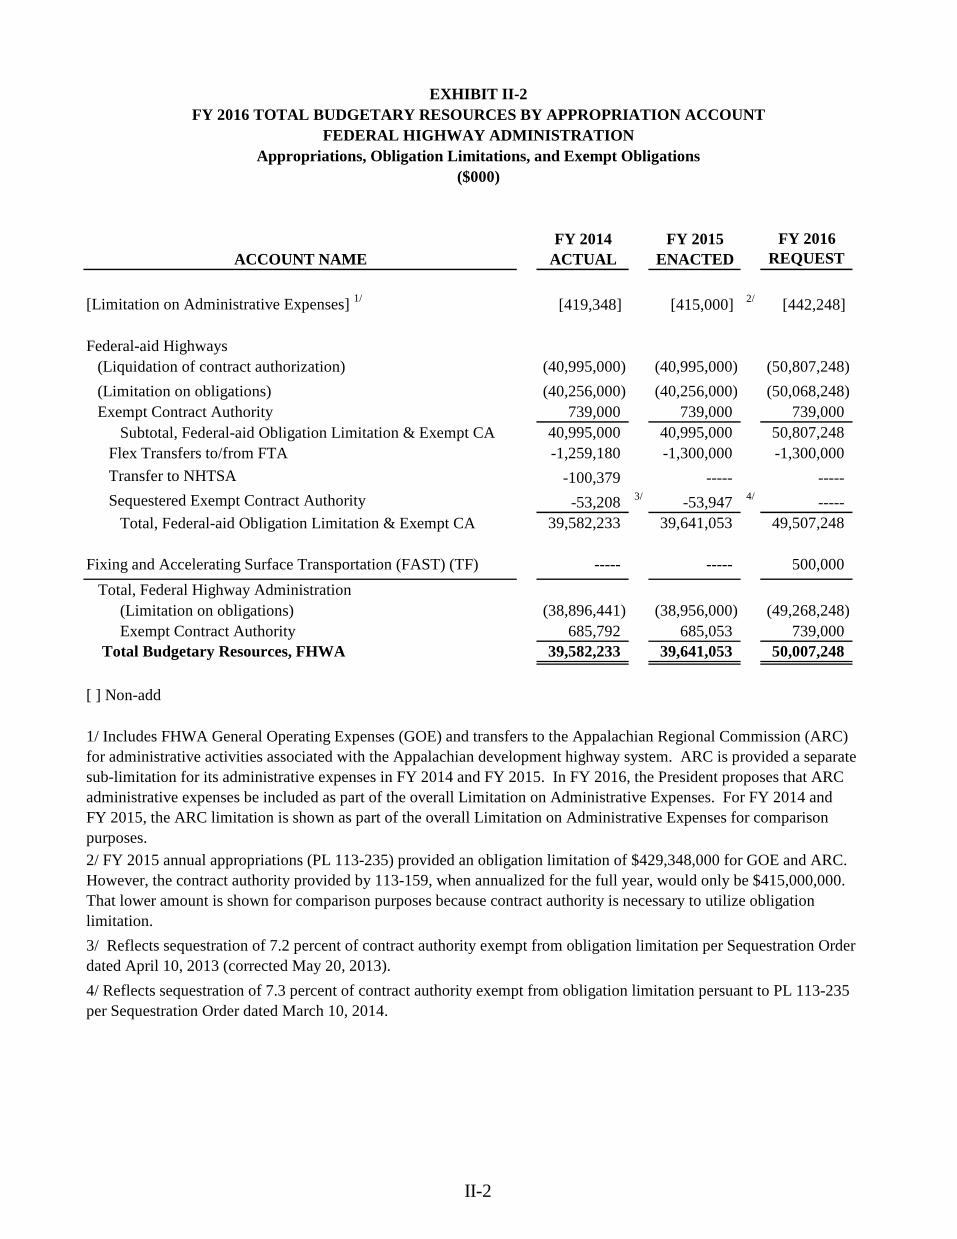
FY 2014 FY 2015 FY 2016ACCOUNT NAME ACTUAL ENACTED REQUEST
[Limitation on Administrative Expenses] 1/ [419,348] [415,000] 2/ [442,248]
Federal-aid Highways(Liquidation of contract authorization) (40,995,000) (40,995,000) (50,807,248)(Limitation on obligations) (40,256,000) (40,256,000) (50,068,248)Exempt Contract Authority 739,000 739,000 739,000
Subtotal, Federal-aid Obligation Limitation & Exempt CA 40,995,000 40,995,000 50,807,248 Flex Transfers to/from FTA -1,259,180 -1,300,000 -1,300,000 Transfer to NHTSA -100,379 ----- ----- Sequestered Exempt Contract Authority -53,208 3/ -53,947 4/ -----
Total, Federal-aid Obligation Limitation & Exempt CA 39,582,233 39,641,053 49,507,248
Fixing and Accelerating Surface Transportation (FAST) (TF) ----- ----- 500,000 Total, Federal Highway Administration
(Limitation on obligations) (38,896,441) (38,956,000) (49,268,248)Exempt Contract Authority 685,792 685,053 739,000
Total Budgetary Resources, FHWA 39,582,233 39,641,053 50,007,248
[ ] Non-add
4/ Reflects sequestration of 7.3 percent of contract authority exempt from obligation limitation persuant to PL 113-235 per Sequestration Order dated March 10, 2014.
3/ Reflects sequestration of 7.2 percent of contract authority exempt from obligation limitation per Sequestration Order dated April 10, 2013 (corrected May 20, 2013).
EXHIBIT II-2FY 2016 TOTAL BUDGETARY RESOURCES BY APPROPRIATION ACCOUNT
FEDERAL HIGHWAY ADMINISTRATIONAppropriations, Obligation Limitations, and Exempt Obligations
($000)
1/ Includes FHWA General Operating Expenses (GOE) and transfers to the Appalachian Regional Commission (ARC) for administrative activities associated with the Appalachian development highway system. ARC is provided a separate sub-limitation for its administrative expenses in FY 2014 and FY 2015. In FY 2016, the President proposes that ARC administrative expenses be included as part of the overall Limitation on Administrative Expenses. For FY 2014 and FY 2015, the ARC limitation is shown as part of the overall Limitation on Administrative Expenses for comparison purposes.2/ FY 2015 annual appropriations (PL 113-235) provided an obligation limitation of $429,348,000 for GOE and ARC. However, the contract authority provided by 113-159, when annualized for the full year, would only be $415,000,000. That lower amount is shown for comparison purposes because contract authority is necessary to utilize obligation limitation.
II-3
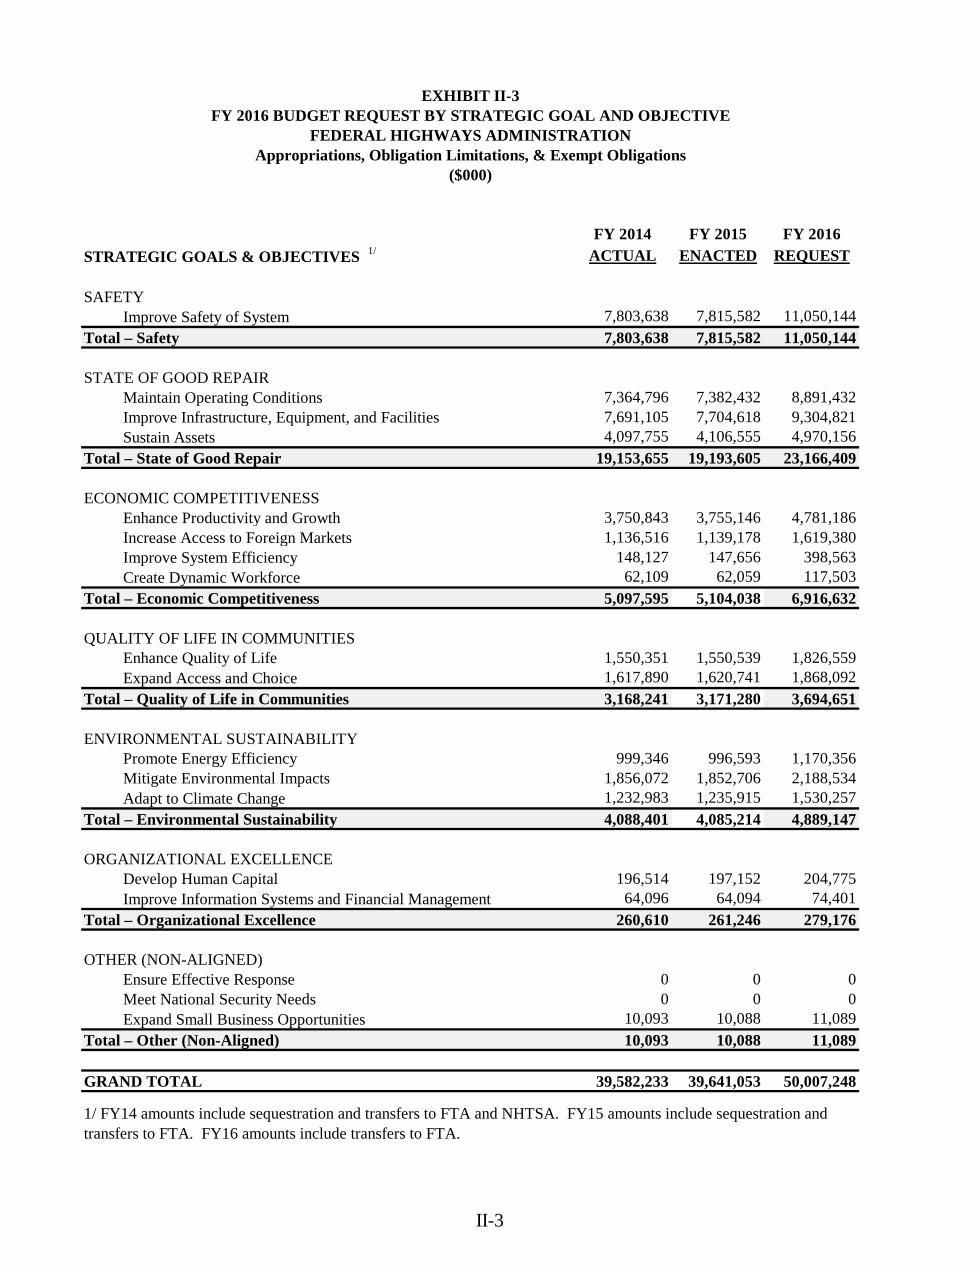
FY 2014 FY 2015 FY 2016STRATEGIC GOALS & OBJECTIVES 1/ ACTUAL ENACTED REQUEST
SAFETYImprove Safety of System 7,803,638 7,815,582 11,050,144
Total – Safety 7,803,638 7,815,582 11,050,144
STATE OF GOOD REPAIRMaintain Operating Conditions 7,364,796 7,382,432 8,891,432Improve Infrastructure, Equipment, and Facilities 7,691,105 7,704,618 9,304,821Sustain Assets 4,097,755 4,106,555 4,970,156
Total – State of Good Repair 19,153,655 19,193,605 23,166,409
ECONOMIC COMPETITIVENESSEnhance Productivity and Growth 3,750,843 3,755,146 4,781,186Increase Access to Foreign Markets 1,136,516 1,139,178 1,619,380Improve System Efficiency 148,127 147,656 398,563Create Dynamic Workforce 62,109 62,059 117,503
Total – Economic Competitiveness 5,097,595 5,104,038 6,916,632
QUALITY OF LIFE IN COMMUNITIESEnhance Quality of Life 1,550,351 1,550,539 1,826,559Expand Access and Choice 1,617,890 1,620,741 1,868,092
Total – Quality of Life in Communities 3,168,241 3,171,280 3,694,651
ENVIRONMENTAL SUSTAINABILITYPromote Energy Efficiency 999,346 996,593 1,170,356Mitigate Environmental Impacts 1,856,072 1,852,706 2,188,534Adapt to Climate Change 1,232,983 1,235,915 1,530,257
Total – Environmental Sustainability 4,088,401 4,085,214 4,889,147
ORGANIZATIONAL EXCELLENCEDevelop Human Capital 196,514 197,152 204,775Improve Information Systems and Financial Management 64,096 64,094 74,401
Total – Organizational Excellence 260,610 261,246 279,176
OTHER (NON-ALIGNED)Ensure Effective Response 0 0 0Meet National Security Needs 0 0 0Expand Small Business Opportunities 10,093 10,088 11,089
Total – Other (Non-Aligned) 10,093 10,088 11,089
GRAND TOTAL 39,582,233 39,641,053 50,007,248
1/ FY14 amounts include sequestration and transfers to FTA and NHTSA. FY15 amounts include sequestration and transfers to FTA. FY16 amounts include transfers to FTA.
EXHIBIT II-3FY 2016 BUDGET REQUEST BY STRATEGIC GOAL AND OBJECTIVE
FEDERAL HIGHWAYS ADMINISTRATIONAppropriations, Obligation Limitations, & Exempt Obligations
($000)
II-4
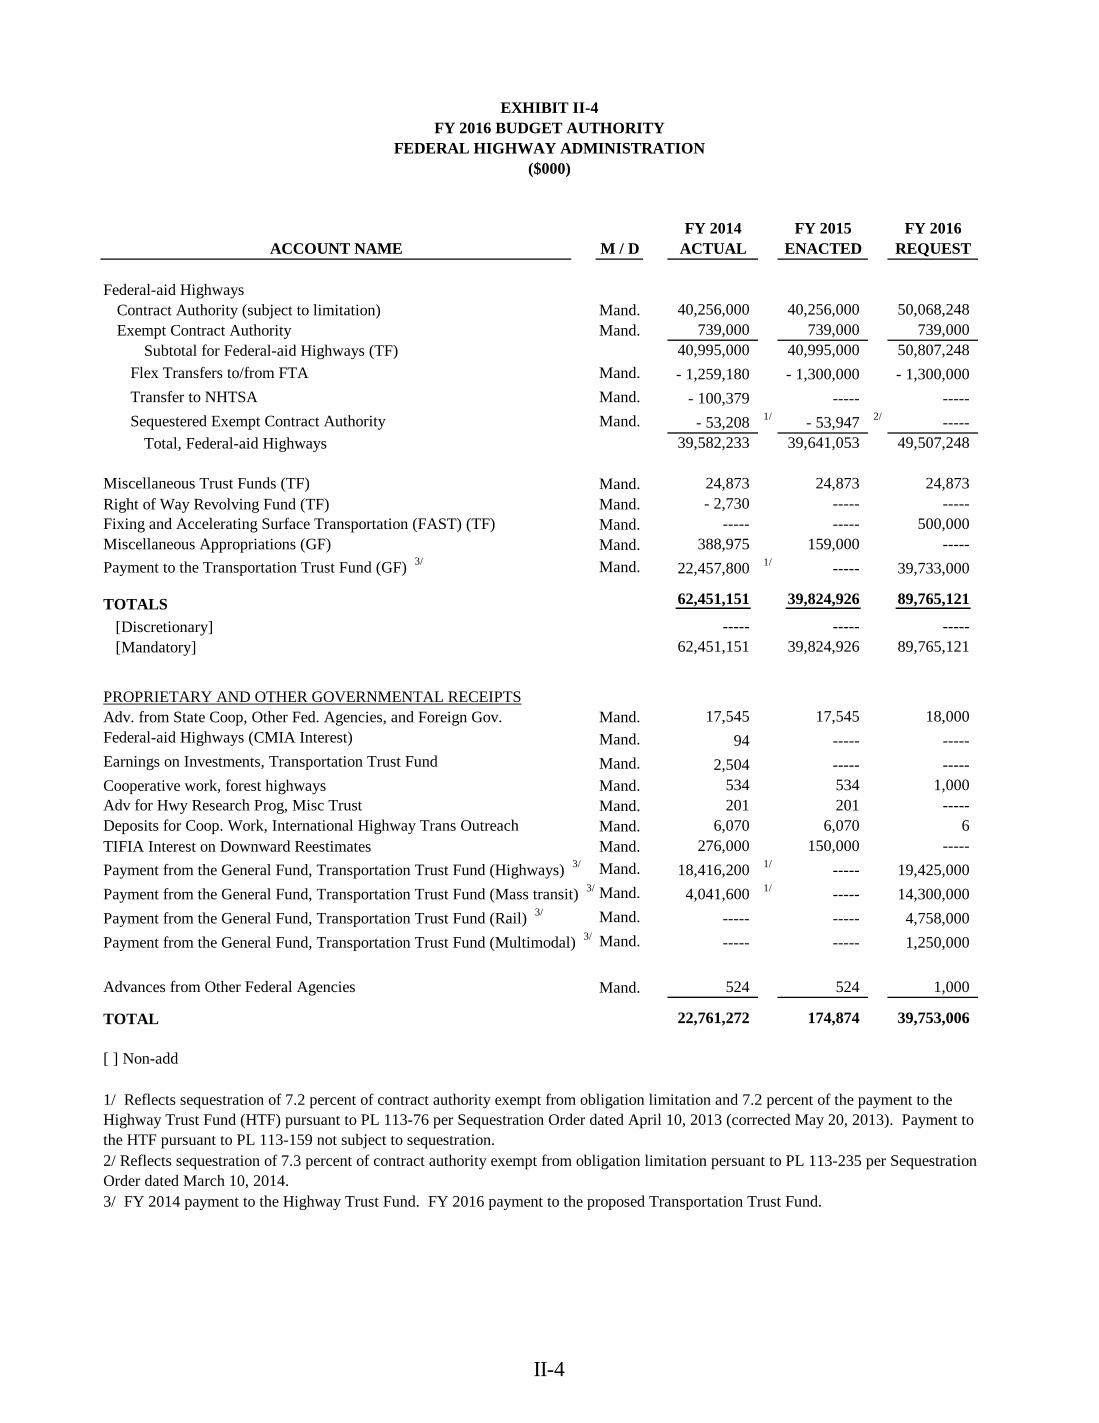
EXHIBIT II-4FY 2016 BUDGET AUTHORITY
FEDERAL HIGHWAY ADMINISTRATION($000)
FY 2014 FY 2015 FY 2016ACCOUNT NAME M / D ACTUAL ENACTED REQUEST
Federal-aid HighwaysContract Authority (subject to limitation) Mand. 40,256,000 40,256,000 50,068,248 Exempt Contract Authority Mand. 739,000 739,000 739,000
Subtotal for Federal-aid Highways (TF) 40,995,000 40,995,000 50,807,248 Flex Transfers to/from FTA Mand. - 1,259,180 - 1,300,000 - 1,300,000Transfer to NHTSA Mand. - 100,379 ----- ----- Sequestered Exempt Contract Authority Mand. - 53,208 1/ - 53,947 2/ -----
Total, Federal-aid Highways 39,582,233 39,641,053 49,507,248
Miscellaneous Trust Funds (TF) Mand. 24,873 24,873 24,873 Right of Way Revolving Fund (TF) Mand. - 2,730 ----- ----- Fixing and Accelerating Surface Transportation (FAST) (TF) Mand. ----- ----- 500,000 Miscellaneous Appropriations (GF) Mand. 388,975 159,000 ----- Payment to the Transportation Trust Fund (GF) 3/ Mand. 22,457,800 1/ ----- 39,733,000
TOTALS 62,451,151 39,824,926 89,765,121
[Discretionary] ----- ----- ----- [Mandatory] 62,451,151 39,824,926 89,765,121
PROPRIETARY AND OTHER GOVERNMENTAL RECEIPTSAdv. from State Coop, Other Fed. Agencies, and Foreign Gov. Mand. 17,545 17,545 18,000 Federal-aid Highways (CMIA Interest) Mand. 94 ----- ----- Earnings on Investments, Transportation Trust Fund Mand. 2,504 ----- ----- Cooperative work, forest highways Mand. 534 534 1,000 Adv for Hwy Research Prog, Misc Trust Mand. 201 201 ----- Deposits for Coop. Work, International Highway Trans Outreach Mand. 6,070 6,070 6 TIFIA Interest on Downward Reestimates Mand. 276,000 150,000 ----- Payment from the General Fund, Transportation Trust Fund (Highways) 3/ Mand. 18,416,200 1/ ----- 19,425,000 Payment from the General Fund, Transportation Trust Fund (Mass transit) 3/ Mand. 4,041,600 1/ ----- 14,300,000 Payment from the General Fund, Transportation Trust Fund (Rail) 3/ Mand. ----- ----- 4,758,000 Payment from the General Fund, Transportation Trust Fund (Multimodal) 3/ Mand. ----- ----- 1,250,000
Advances from Other Federal Agencies Mand. 524 524 1,000
TOTAL 22,761,272 174,874 39,753,006
[ ] Non-add
1/ Reflects sequestration of 7.2 percent of contract authority exempt from obligation limitation and 7.2 percent of the payment to the Highway Trust Fund (HTF) pursuant to PL 113-76 per Sequestration Order dated April 10, 2013 (corrected May 20, 2013). Payment to the HTF pursuant to PL 113-159 not subject to sequestration.
3/ FY 2014 payment to the Highway Trust Fund. FY 2016 payment to the proposed Transportation Trust Fund.
2/ Reflects sequestration of 7.3 percent of contract authority exempt from obligation limitation persuant to PL 113-235 per Sequestration Order dated March 10, 2014.
II-5
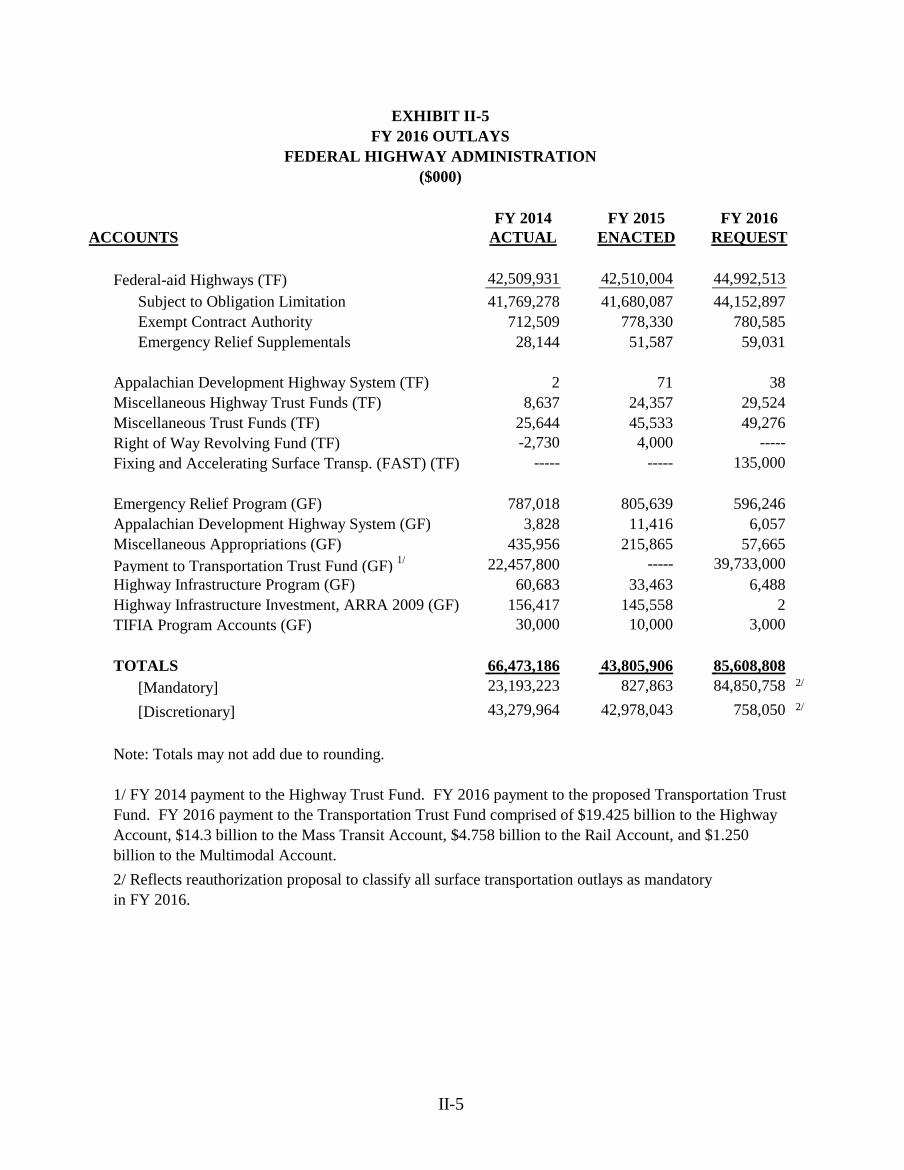
EXHIBIT II-5FY 2016 OUTLAYS
FEDERAL HIGHWAY ADMINISTRATION($000)
FY 2014 FY 2015 FY 2016ACCOUNTS ACTUAL ENACTED REQUEST
Federal-aid Highways (TF) 42,509,931 42,510,004 44,992,513 Subject to Obligation Limitation 41,769,278 41,680,087 44,152,897 Exempt Contract Authority 712,509 778,330 780,585 Emergency Relief Supplementals 28,144 51,587 59,031
Appalachian Development Highway System (TF) 2 71 38 Miscellaneous Highway Trust Funds (TF) 8,637 24,357 29,524 Miscellaneous Trust Funds (TF) 25,644 45,533 49,276 Right of Way Revolving Fund (TF) -2,730 4,000 ----- Fixing and Accelerating Surface Transp. (FAST) (TF) ----- ----- 135,000
Emergency Relief Program (GF) 787,018 805,639 596,246 Appalachian Development Highway System (GF) 3,828 11,416 6,057 Miscellaneous Appropriations (GF) 435,956 215,865 57,665 Payment to Transportation Trust Fund (GF) 1/ 22,457,800 ----- 39,733,000 Highway Infrastructure Program (GF) 60,683 33,463 6,488 Highway Infrastructure Investment, ARRA 2009 (GF) 156,417 145,558 2 TIFIA Program Accounts (GF) 30,000 10,000 3,000
TOTALS 66,473,186 43,805,906 85,608,808 [Mandatory] 23,193,223 827,863 84,850,758 2/
[Discretionary] 43,279,964 42,978,043 758,050 2/
Note: Totals may not add due to rounding.
1/ FY 2014 payment to the Highway Trust Fund. FY 2016 payment to the proposed Transportation Trust Fund. FY 2016 payment to the Transportation Trust Fund comprised of $19.425 billion to the Highway Account, $14.3 billion to the Mass Transit Account, $4.758 billion to the Rail Account, and $1.250 billion to the Multimodal Account.2/ Reflects reauthorization proposal to classify all surface transportation outlays as mandatory in FY 2016.
II-6
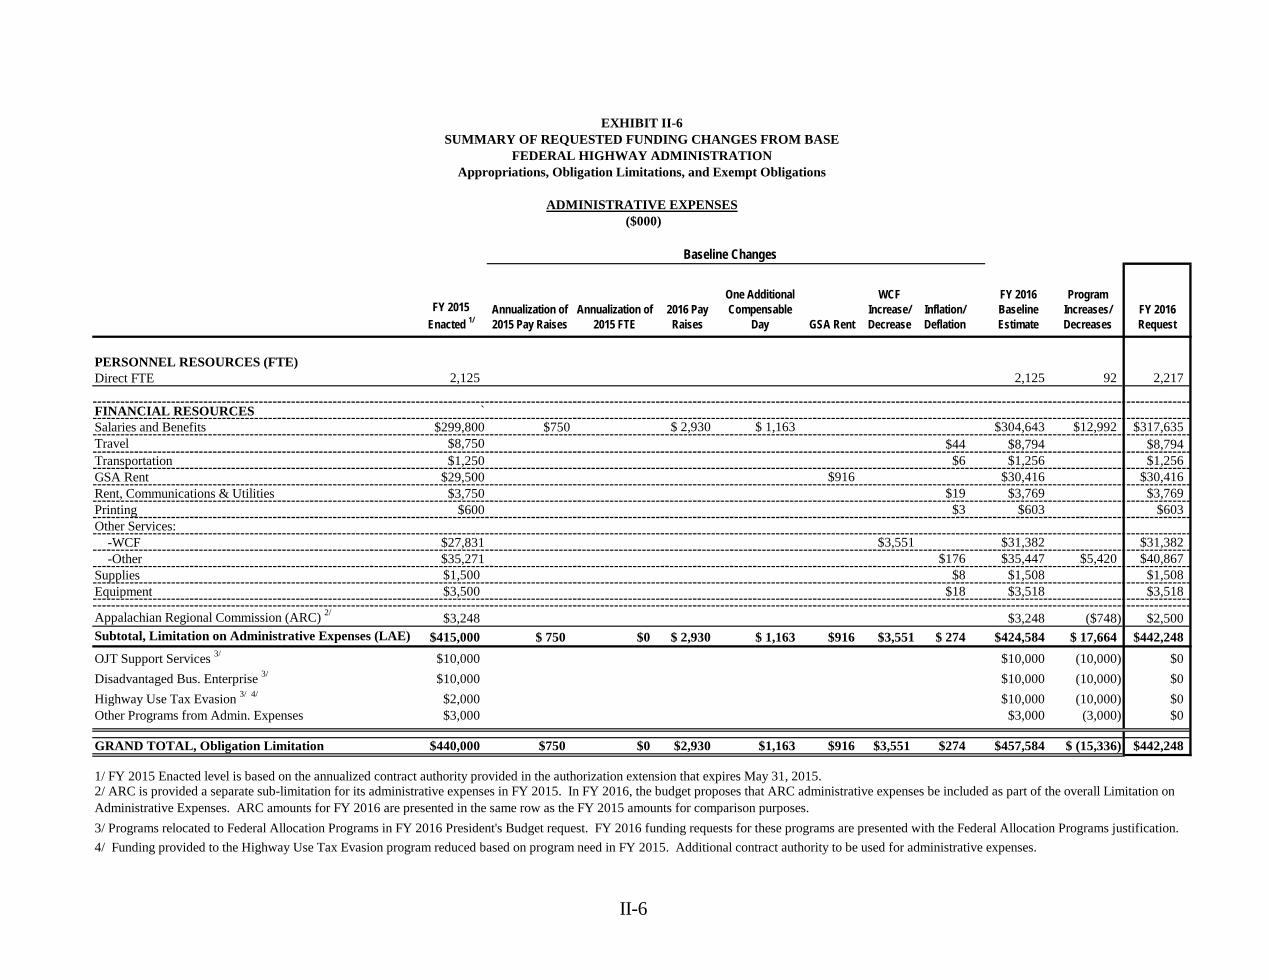
FY 2015Enacted 1/
Annualization of 2015 Pay Raises
Annualization of 2015 FTE
2016 Pay Raises
One AdditionalCompensable
Day GSA Rent
WCF Increase/ Decrease
Inflation/ Deflation
FY 2016 Baseline Estimate
Program Increases/ Decreases
FY 2016Request
PERSONNEL RESOURCES (FTE)Direct FTE 2,125 2,125 92 2,217
FINANCIAL RESOURCES `Salaries and Benefits $299,800 $750 $ 2,930 $ 1,163 $304,643 $12,992 $317,635Travel $8,750 $44 $8,794 $8,794Transportation $1,250 $6 $1,256 $1,256GSA Rent $29,500 $916 $30,416 $30,416Rent, Communications & Utilities $3,750 $19 $3,769 $3,769Printing $600 $3 $603 $603Other Services: -WCF $27,831 $3,551 $31,382 $31,382 -Other $35,271 $176 $35,447 $5,420 $40,867Supplies $1,500 $8 $1,508 $1,508Equipment $3,500 $18 $3,518 $3,518
Appalachian Regional Commission (ARC) 2/ $3,248 $3,248 ($748) $2,500Subtotal, Limitation on Administrative Expenses (LAE) $415,000 $ 750 $0 $ 2,930 $ 1,163 $916 $3,551 $ 274 $424,584 $ 17,664 $442,248OJT Support Services 3/ $10,000 $10,000 (10,000) $0Disadvantaged Bus. Enterprise 3/ $10,000 $10,000 (10,000) $0Highway Use Tax Evasion 3/ 4/ $2,000 $10,000 (10,000) $0Other Programs from Admin. Expenses $3,000 $3,000 (3,000) $0
GRAND TOTAL, Obligation Limitation $440,000 $750 $0 $2,930 $1,163 $916 $3,551 $274 $457,584 $ (15,336) $442,248
ADMINISTRATIVE EXPENSES
EXHIBIT II-6SUMMARY OF REQUESTED FUNDING CHANGES FROM BASE
FEDERAL HIGHWAY ADMINISTRATIONAppropriations, Obligation Limitations, and Exempt Obligations
1/ FY 2015 Enacted level is based on the annualized contract authority provided in the authorization extension that expires May 31, 2015.2/ ARC is provided a separate sub-limitation for its administrative expenses in FY 2015. In FY 2016, the budget proposes that ARC administrative expenses be included as part of the overall Limitation on Administrative Expenses. ARC amounts for FY 2016 are presented in the same row as the FY 2015 amounts for comparison purposes.3/ Programs relocated to Federal Allocation Programs in FY 2016 President's Budget request. FY 2016 funding requests for these programs are presented with the Federal Allocation Programs justification.4/ Funding provided to the Highway Use Tax Evasion program reduced based on program need in FY 2015. Additional contract authority to be used for administrative expenses.
($000)
Baseline Changes
II-7
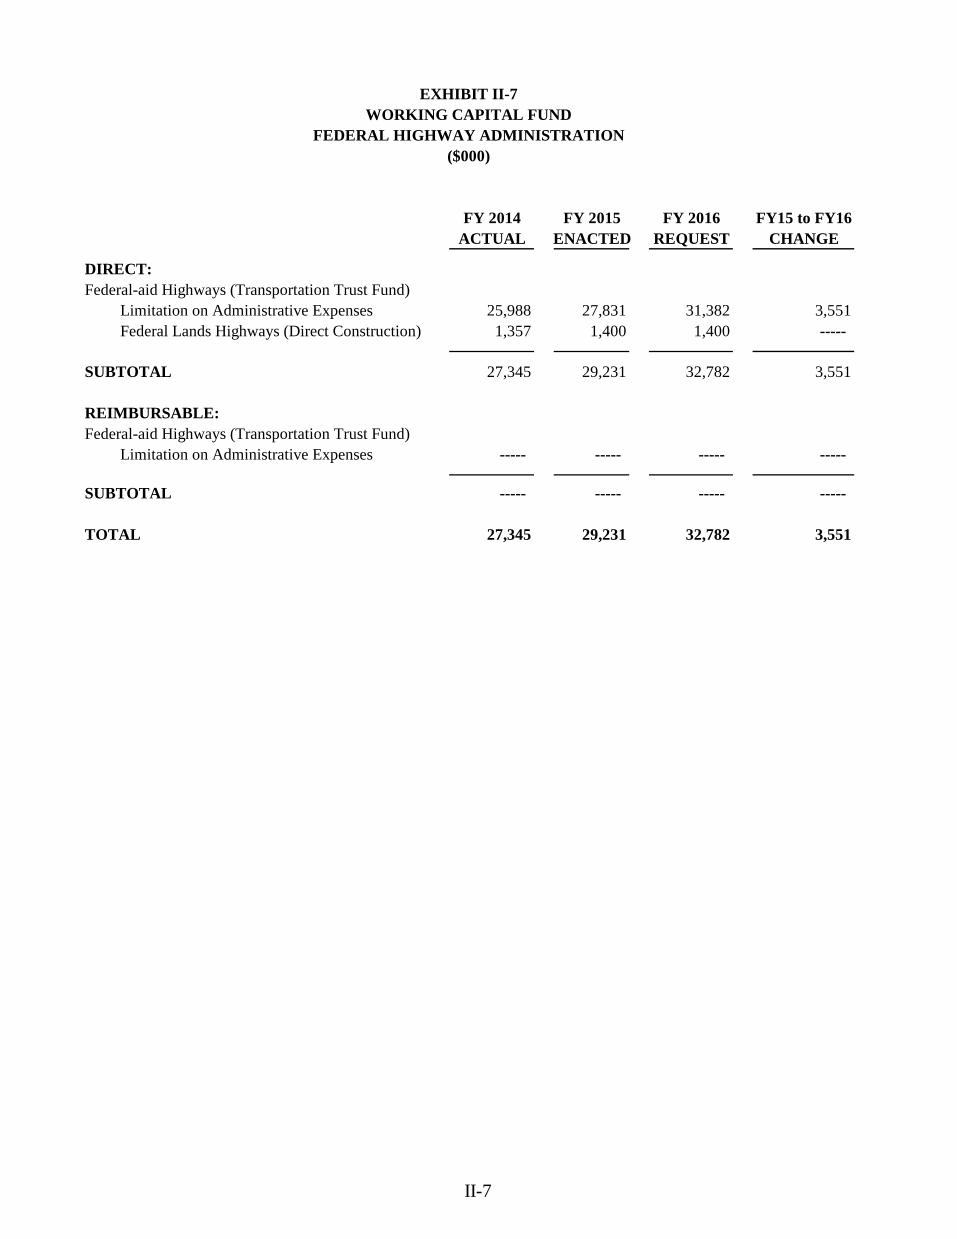
EXHIBIT II-7WORKING CAPITAL FUND
FEDERAL HIGHWAY ADMINISTRATION($000)
FY 2014 FY 2015 FY 2016 FY15 to FY16ACTUAL ENACTED REQUEST CHANGE
DIRECT:Federal-aid Highways (Transportation Trust Fund)
Limitation on Administrative Expenses 25,988 27,831 31,382 3,551Federal Lands Highways (Direct Construction) 1,357 1,400 1,400 -----
SUBTOTAL 27,345 29,231 32,782 3,551
REIMBURSABLE:Federal-aid Highways (Transportation Trust Fund)
Limitation on Administrative Expenses ----- ----- ----- -----
SUBTOTAL ----- ----- ----- -----
TOTAL 27,345 29,231 32,782 3,551
II-8
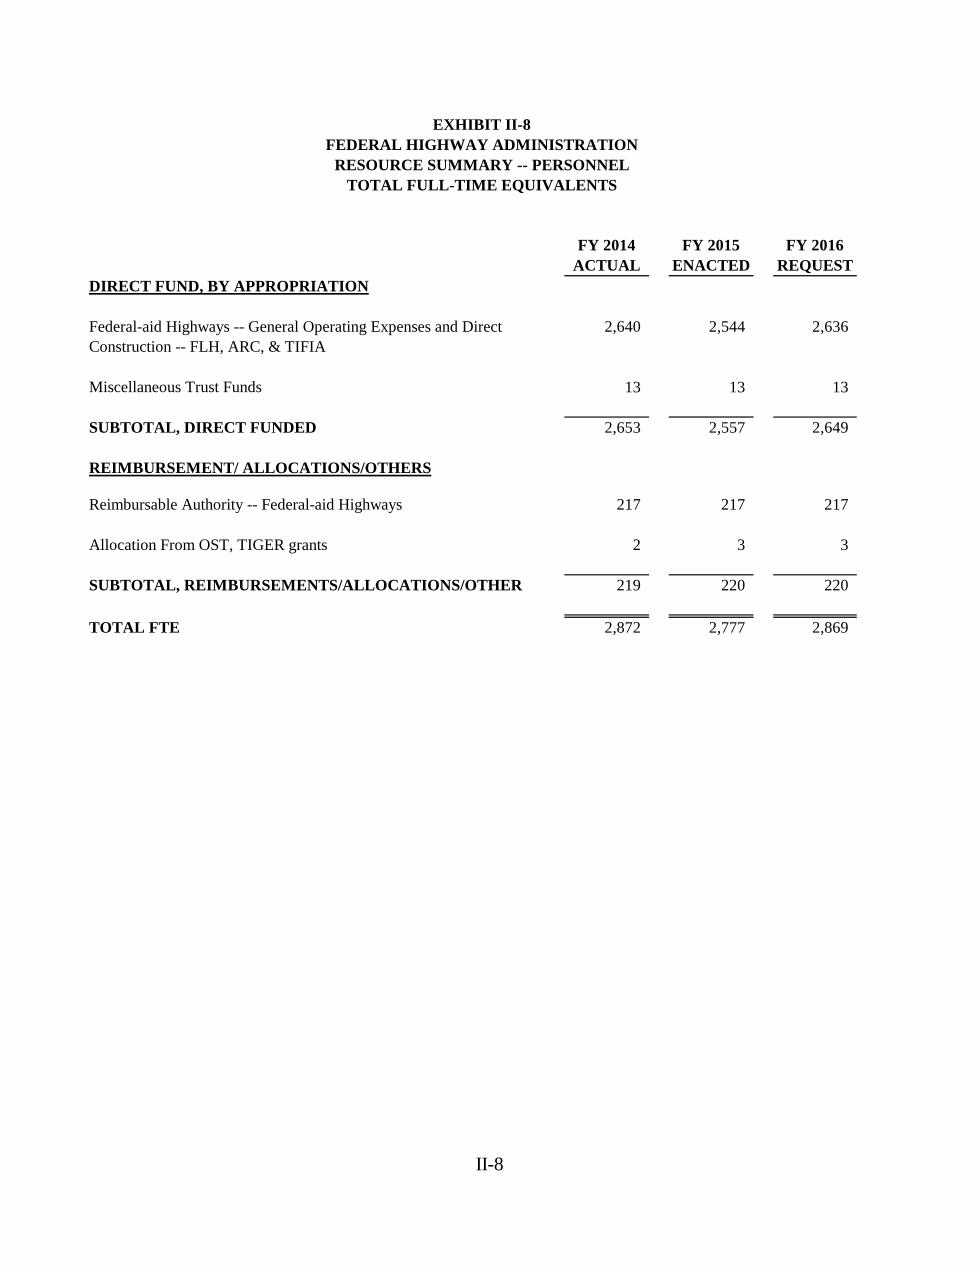
FY 2014 FY 2015 FY 2016ACTUAL ENACTED REQUEST
DIRECT FUND, BY APPROPRIATION
Federal-aid Highways -- General Operating Expenses and Direct Construction -- FLH, ARC, & TIFIA
2,640 2,544 2,636
Miscellaneous Trust Funds 13 13 13
SUBTOTAL, DIRECT FUNDED 2,653 2,557 2,649
REIMBURSEMENT/ ALLOCATIONS/OTHERS
Reimbursable Authority -- Federal-aid Highways 217 217 217
Allocation From OST, TIGER grants 2 3 3
SUBTOTAL, REIMBURSEMENTS/ALLOCATIONS/OTHER 219 220 220
TOTAL FTE 2,872 2,777 2,869
EXHIBIT II-8FEDERAL HIGHWAY ADMINISTRATION
RESOURCE SUMMARY -- PERSONNELTOTAL FULL-TIME EQUIVALENTS
II-9
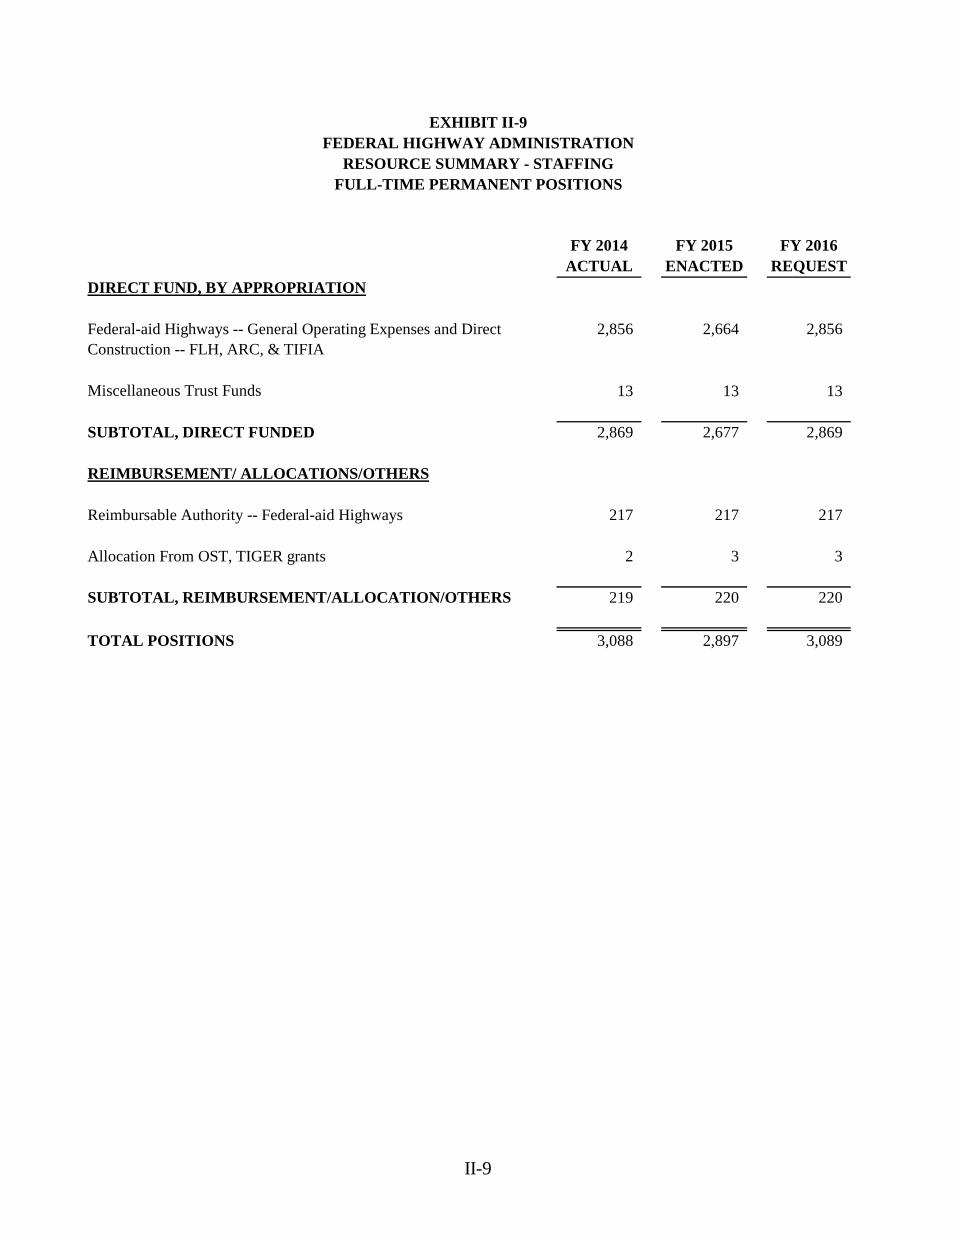
FY 2014 FY 2015 FY 2016ACTUAL ENACTED REQUEST
DIRECT FUND, BY APPROPRIATION
Federal-aid Highways -- General Operating Expenses and Direct Construction -- FLH, ARC, & TIFIA
2,856 2,664 2,856
Miscellaneous Trust Funds 13 13 13
SUBTOTAL, DIRECT FUNDED 2,869 2,677 2,869
REIMBURSEMENT/ ALLOCATIONS/OTHERS
Reimbursable Authority -- Federal-aid Highways 217 217 217
Allocation From OST, TIGER grants 2 3 3
SUBTOTAL, REIMBURSEMENT/ALLOCATION/OTHERS 219 220 220
TOTAL POSITIONS 3,088 2,897 3,089
EXHIBIT II-9FEDERAL HIGHWAY ADMINISTRATION
RESOURCE SUMMARY - STAFFINGFULL-TIME PERMANENT POSITIONS

II-10
This Page Left Blank Intentionally
III-1
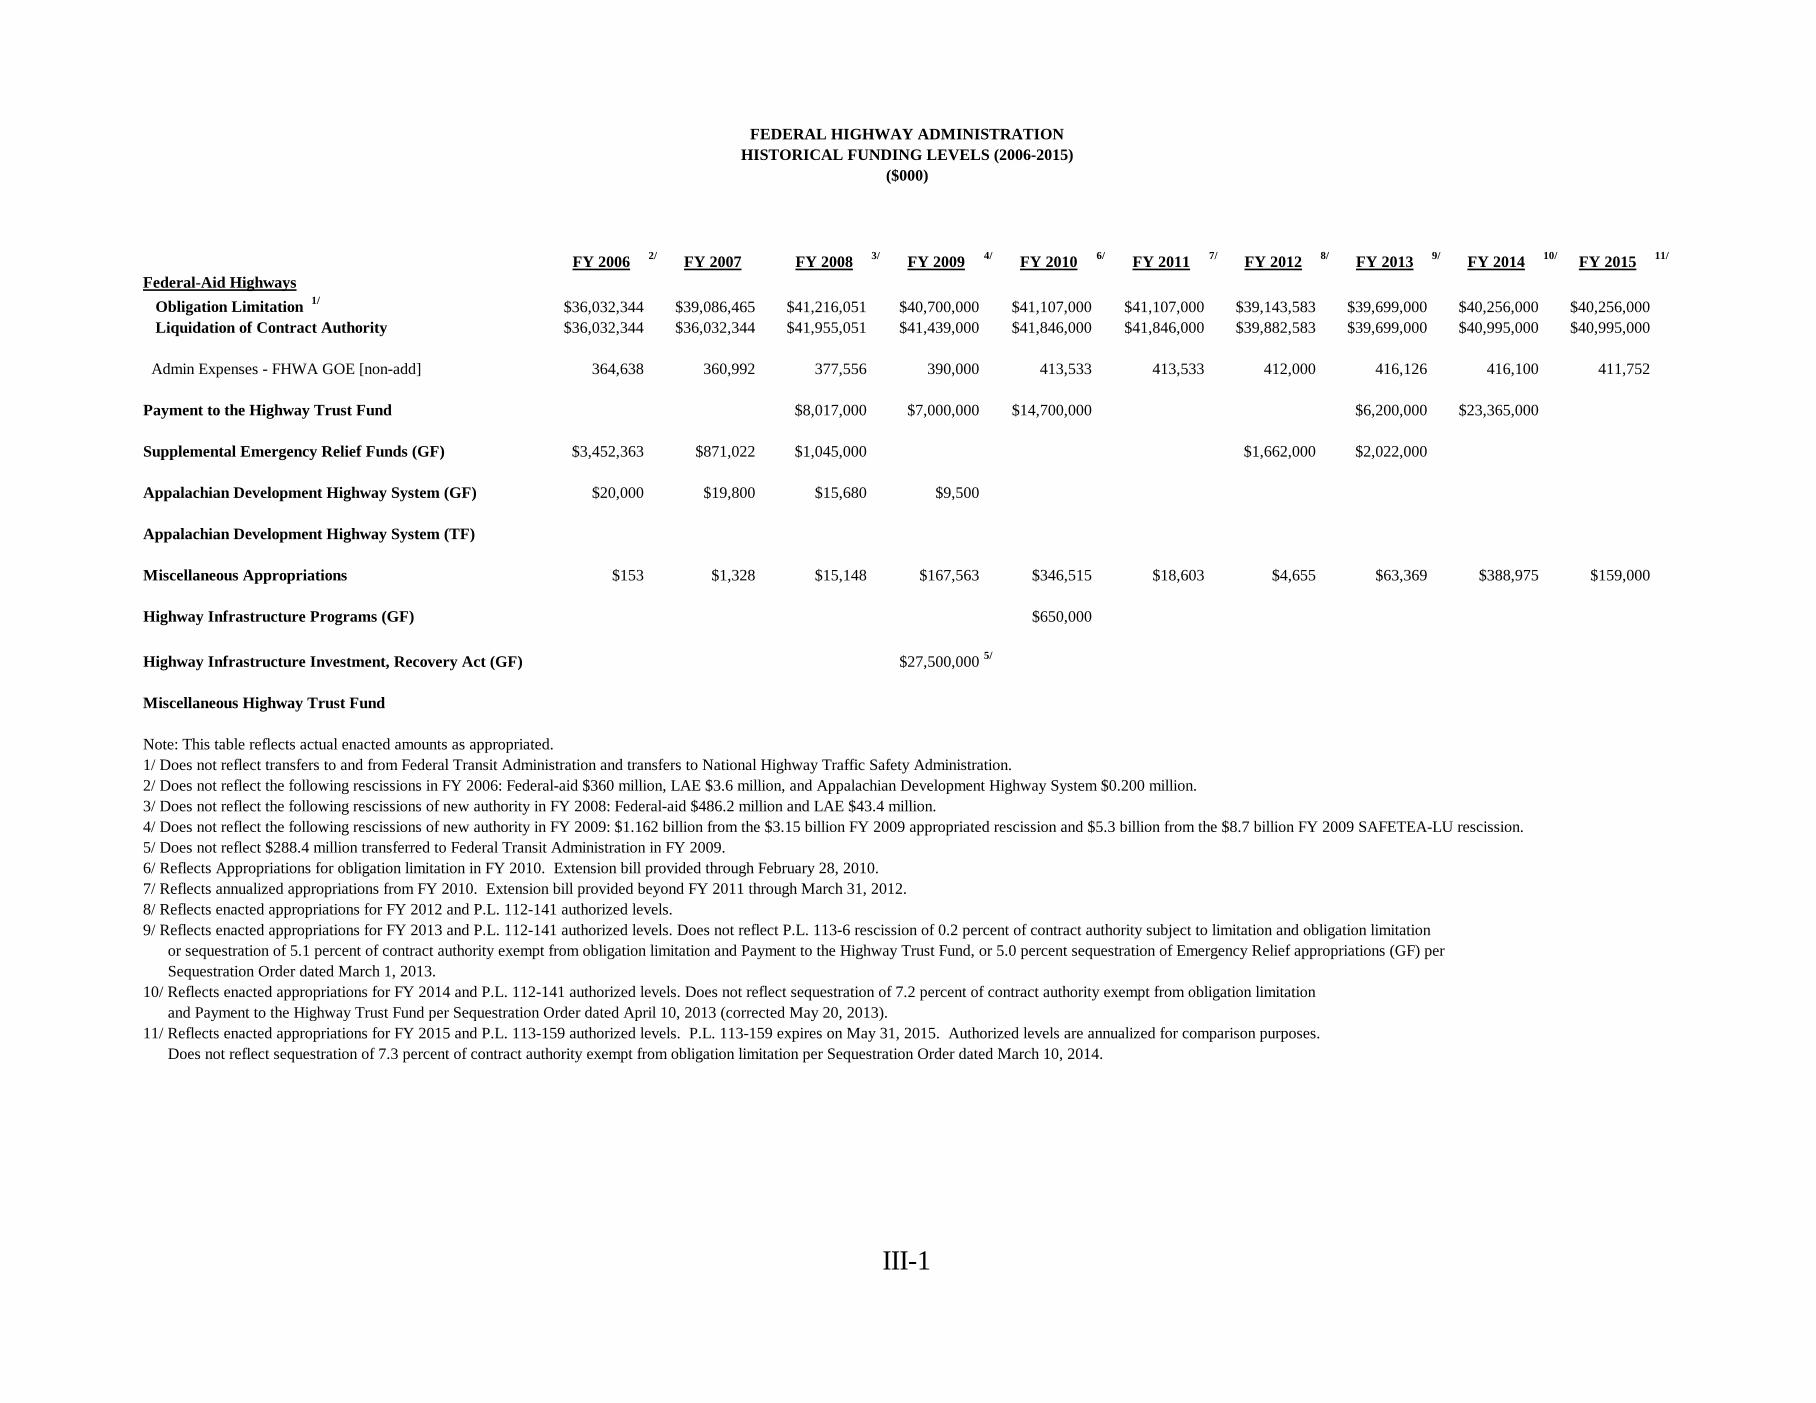
FEDERAL HIGHWAY ADMINISTRATIONHISTORICAL FUNDING LEVELS (2006-2015)
($000)
FY 2006 2/ FY 2007 FY 2008 3/ FY 2009 4/ FY 2010 6/ FY 2011 7/ FY 2012 8/ FY 2013 9/ FY 2014 10/ FY 2015 11/
Federal-Aid Highways Obligation Limitation 1/ $36,032,344 $39,086,465 $41,216,051 $40,700,000 $41,107,000 $41,107,000 $39,143,583 $39,699,000 $40,256,000 $40,256,000 Liquidation of Contract Authority $36,032,344 $36,032,344 $41,955,051 $41,439,000 $41,846,000 $41,846,000 $39,882,583 $39,699,000 $40,995,000 $40,995,000
Admin Expenses - FHWA GOE [non-add] 364,638 360,992 377,556 390,000 413,533 413,533 412,000 416,126 416,100 411,752
Payment to the Highway Trust Fund $8,017,000 $7,000,000 $14,700,000 $6,200,000 $23,365,000
Supplemental Emergency Relief Funds (GF) $3,452,363 $871,022 $1,045,000 $1,662,000 $2,022,000
Appalachian Development Highway System (GF) $20,000 $19,800 $15,680 $9,500
Appalachian Development Highway System (TF)
Miscellaneous Appropriations $153 $1,328 $15,148 $167,563 $346,515 $18,603 $4,655 $63,369 $388,975 $159,000
Highway Infrastructure Programs (GF) $650,000
Highway Infrastructure Investment, Recovery Act (GF) $27,500,000 5/
Miscellaneous Highway Trust Fund
Note: This table reflects actual enacted amounts as appropriated.1/ Does not reflect transfers to and from Federal Transit Administration and transfers to National Highway Traffic Safety Administration.2/ Does not reflect the following rescissions in FY 2006: Federal-aid $360 million, LAE $3.6 million, and Appalachian Development Highway System $0.200 million.3/ Does not reflect the following rescissions of new authority in FY 2008: Federal-aid $486.2 million and LAE $43.4 million.4/ Does not reflect the following rescissions of new authority in FY 2009: $1.162 billion from the $3.15 billion FY 2009 appropriated rescission and $5.3 billion from the $8.7 billion FY 2009 SAFETEA-LU rescission.5/ Does not reflect $288.4 million transferred to Federal Transit Administration in FY 2009.6/ Reflects Appropriations for obligation limitation in FY 2010. Extension bill provided through February 28, 2010.7/ Reflects annualized appropriations from FY 2010. Extension bill provided beyond FY 2011 through March 31, 2012.8/ Reflects enacted appropriations for FY 2012 and P.L. 112-141 authorized levels.9/ Reflects enacted appropriations for FY 2013 and P.L. 112-141 authorized levels. Does not reflect P.L. 113-6 rescission of 0.2 percent of contract authority subject to limitation and obligation limitation or sequestration of 5.1 percent of contract authority exempt from obligation limitation and Payment to the Highway Trust Fund, or 5.0 percent sequestration of Emergency Relief appropriations (GF) per Sequestration Order dated March 1, 2013.10/ Reflects enacted appropriations for FY 2014 and P.L. 112-141 authorized levels. Does not reflect sequestration of 7.2 percent of contract authority exempt from obligation limitation and Payment to the Highway Trust Fund per Sequestration Order dated April 10, 2013 (corrected May 20, 2013).11/ Reflects enacted appropriations for FY 2015 and P.L. 113-159 authorized levels. P.L. 113-159 expires on May 31, 2015. Authorized levels are annualized for comparison purposes. Does not reflect sequestration of 7.3 percent of contract authority exempt from obligation limitation per Sequestration Order dated March 10, 2014.

III-2
This Page Left Blank Intentionally
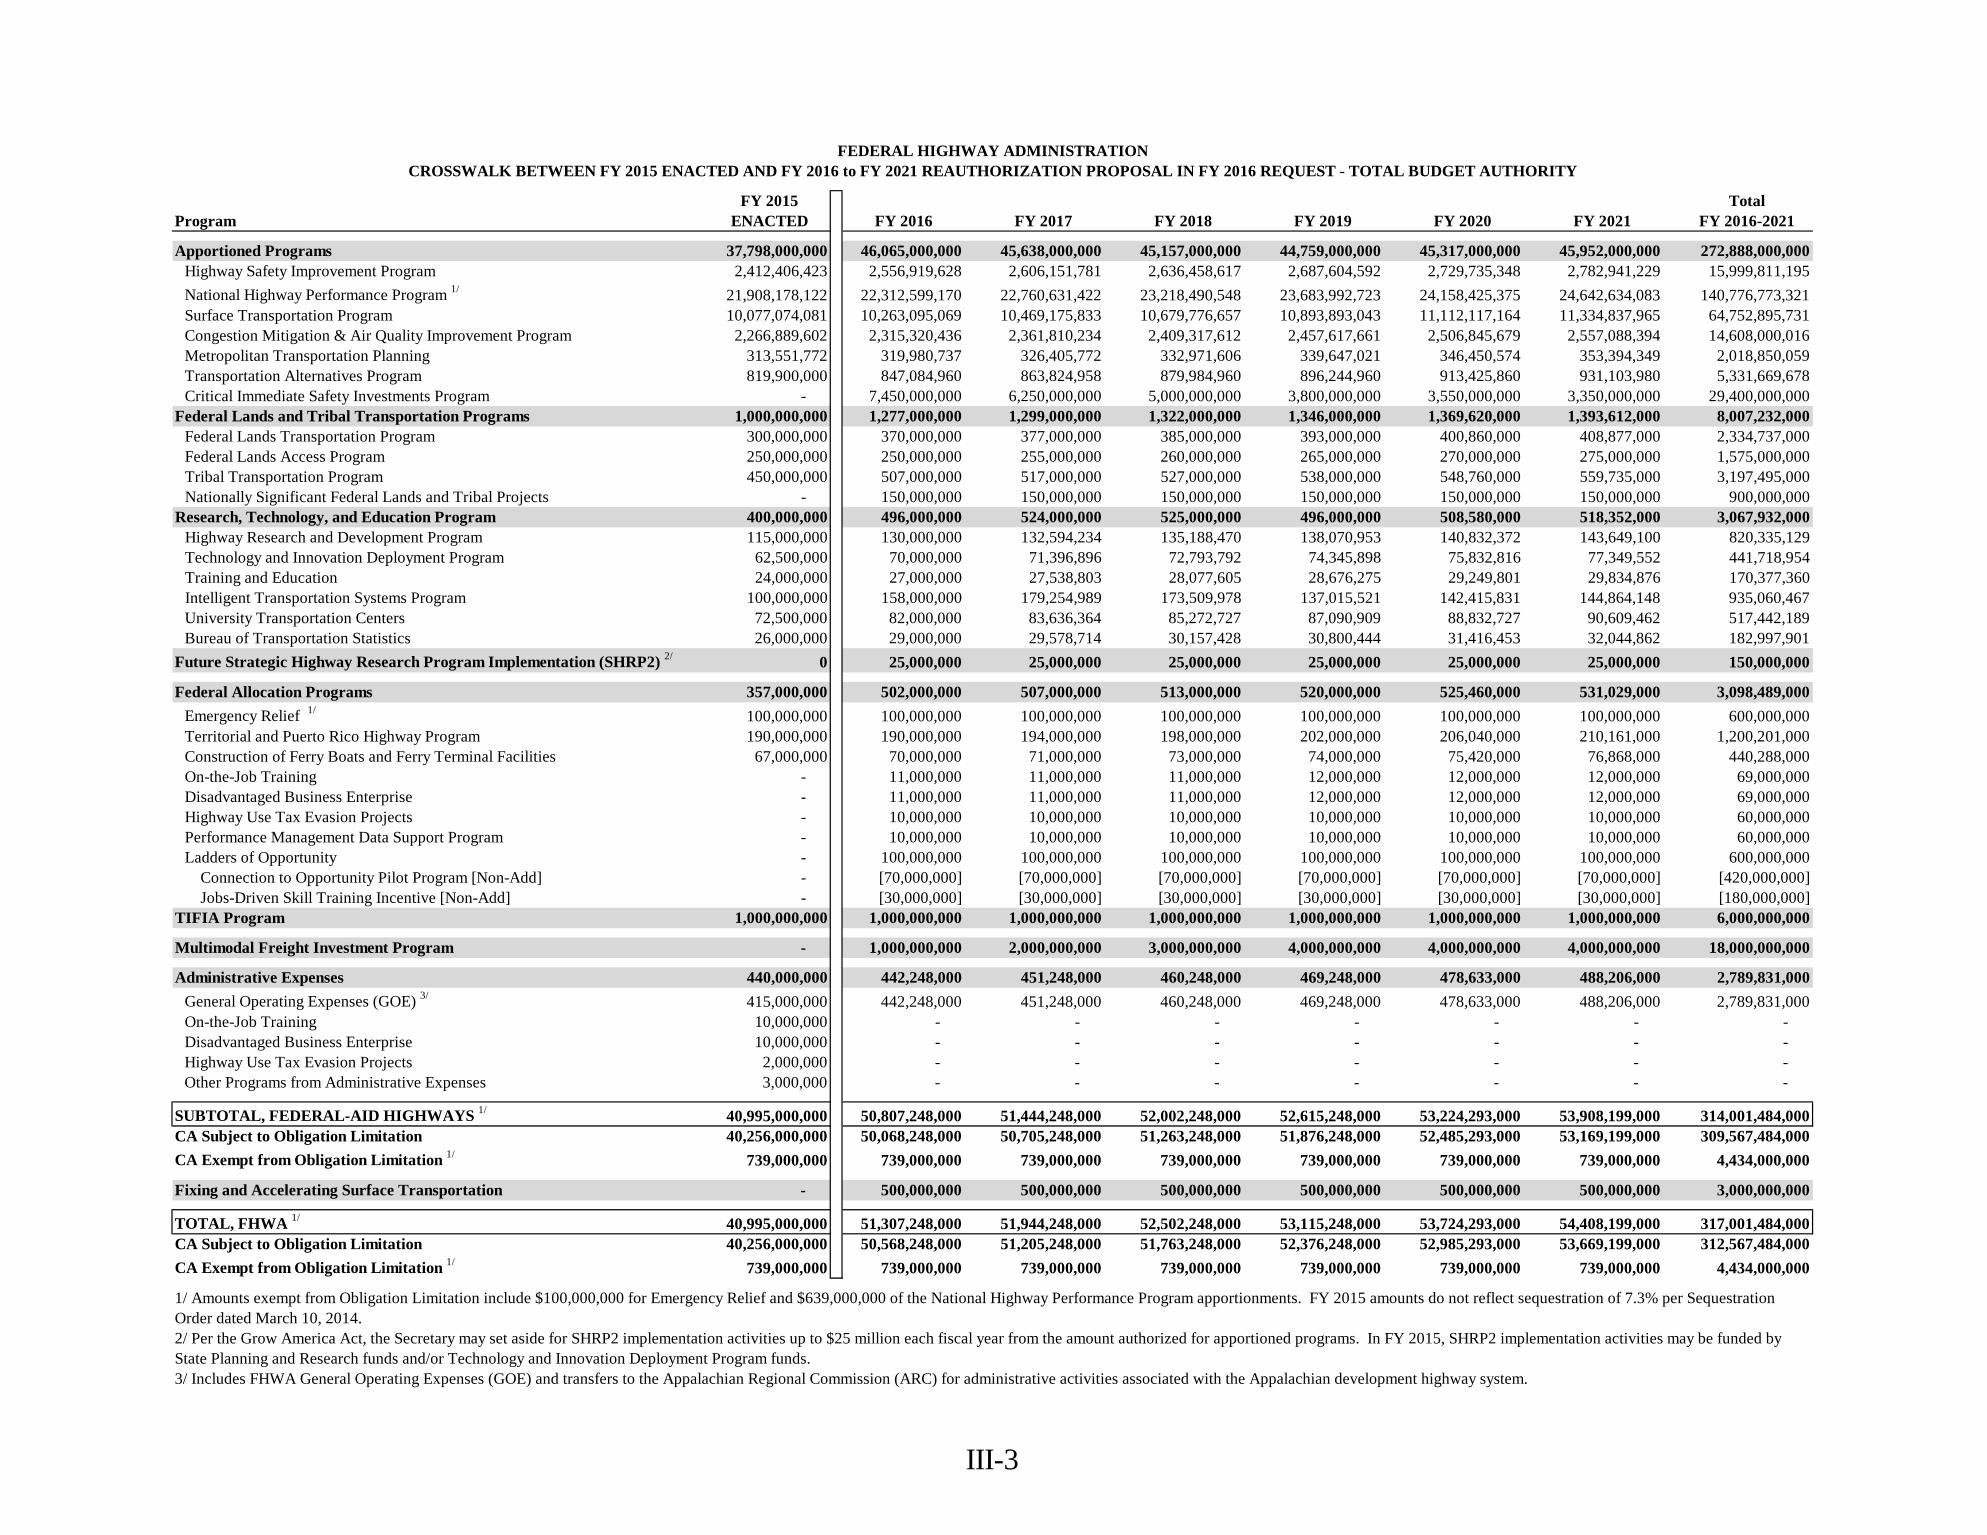
III-3
FY 2015 TotalProgram ENACTED FY 2016 FY 2017 FY 2018 FY 2019 FY 2020 FY 2021 FY 2016-2021
Apportioned Programs 37,798,000,000 46,065,000,000 45,638,000,000 45,157,000,000 44,759,000,000 45,317,000,000 45,952,000,000 272,888,000,000Highway Safety Improvement Program 2,412,406,423 2,556,919,628 2,606,151,781 2,636,458,617 2,687,604,592 2,729,735,348 2,782,941,229 15,999,811,195National Highway Performance Program 1/ 21,908,178,122 22,312,599,170 22,760,631,422 23,218,490,548 23,683,992,723 24,158,425,375 24,642,634,083 140,776,773,321Surface Transportation Program 10,077,074,081 10,263,095,069 10,469,175,833 10,679,776,657 10,893,893,043 11,112,117,164 11,334,837,965 64,752,895,731Congestion Mitigation & Air Quality Improvement Program 2,266,889,602 2,315,320,436 2,361,810,234 2,409,317,612 2,457,617,661 2,506,845,679 2,557,088,394 14,608,000,016Metropolitan Transportation Planning 313,551,772 319,980,737 326,405,772 332,971,606 339,647,021 346,450,574 353,394,349 2,018,850,059Transportation Alternatives Program 819,900,000 847,084,960 863,824,958 879,984,960 896,244,960 913,425,860 931,103,980 5,331,669,678Critical Immediate Safety Investments Program - 7,450,000,000 6,250,000,000 5,000,000,000 3,800,000,000 3,550,000,000 3,350,000,000 29,400,000,000
Federal Lands and Tribal Transportation Programs 1,000,000,000 1,277,000,000 1,299,000,000 1,322,000,000 1,346,000,000 1,369,620,000 1,393,612,000 8,007,232,000Federal Lands Transportation Program 300,000,000 370,000,000 377,000,000 385,000,000 393,000,000 400,860,000 408,877,000 2,334,737,000Federal Lands Access Program 250,000,000 250,000,000 255,000,000 260,000,000 265,000,000 270,000,000 275,000,000 1,575,000,000Tribal Transportation Program 450,000,000 507,000,000 517,000,000 527,000,000 538,000,000 548,760,000 559,735,000 3,197,495,000Nationally Significant Federal Lands and Tribal Projects - 150,000,000 150,000,000 150,000,000 150,000,000 150,000,000 150,000,000 900,000,000
Research, Technology, and Education Program 400,000,000 496,000,000 524,000,000 525,000,000 496,000,000 508,580,000 518,352,000 3,067,932,000Highway Research and Development Program 115,000,000 130,000,000 132,594,234 135,188,470 138,070,953 140,832,372 143,649,100 820,335,129Technology and Innovation Deployment Program 62,500,000 70,000,000 71,396,896 72,793,792 74,345,898 75,832,816 77,349,552 441,718,954Training and Education 24,000,000 27,000,000 27,538,803 28,077,605 28,676,275 29,249,801 29,834,876 170,377,360Intelligent Transportation Systems Program 100,000,000 158,000,000 179,254,989 173,509,978 137,015,521 142,415,831 144,864,148 935,060,467University Transportation Centers 72,500,000 82,000,000 83,636,364 85,272,727 87,090,909 88,832,727 90,609,462 517,442,189Bureau of Transportation Statistics 26,000,000 29,000,000 29,578,714 30,157,428 30,800,444 31,416,453 32,044,862 182,997,901
Future Strategic Highway Research Program Implementation (SHRP2) 2/ 0 25,000,000 25,000,000 25,000,000 25,000,000 25,000,000 25,000,000 150,000,000
Federal Allocation Programs 357,000,000 502,000,000 507,000,000 513,000,000 520,000,000 525,460,000 531,029,000 3,098,489,000Emergency Relief 1/ 100,000,000 100,000,000 100,000,000 100,000,000 100,000,000 100,000,000 100,000,000 600,000,000Territorial and Puerto Rico Highway Program 190,000,000 190,000,000 194,000,000 198,000,000 202,000,000 206,040,000 210,161,000 1,200,201,000Construction of Ferry Boats and Ferry Terminal Facilities 67,000,000 70,000,000 71,000,000 73,000,000 74,000,000 75,420,000 76,868,000 440,288,000On-the-Job Training - 11,000,000 11,000,000 11,000,000 12,000,000 12,000,000 12,000,000 69,000,000Disadvantaged Business Enterprise - 11,000,000 11,000,000 11,000,000 12,000,000 12,000,000 12,000,000 69,000,000Highway Use Tax Evasion Projects - 10,000,000 10,000,000 10,000,000 10,000,000 10,000,000 10,000,000 60,000,000Performance Management Data Support Program - 10,000,000 10,000,000 10,000,000 10,000,000 10,000,000 10,000,000 60,000,000Ladders of Opportunity - 100,000,000 100,000,000 100,000,000 100,000,000 100,000,000 100,000,000 600,000,000 Connection to Opportunity Pilot Program [Non-Add] - [70,000,000] [70,000,000] [70,000,000] [70,000,000] [70,000,000] [70,000,000] [420,000,000] Jobs-Driven Skill Training Incentive [Non-Add] - [30,000,000] [30,000,000] [30,000,000] [30,000,000] [30,000,000] [30,000,000] [180,000,000]
TIFIA Program 1,000,000,000 1,000,000,000 1,000,000,000 1,000,000,000 1,000,000,000 1,000,000,000 1,000,000,000 6,000,000,000
Multimodal Freight Investment Program - 1,000,000,000 2,000,000,000 3,000,000,000 4,000,000,000 4,000,000,000 4,000,000,000 18,000,000,000
Administrative Expenses 440,000,000 442,248,000 451,248,000 460,248,000 469,248,000 478,633,000 488,206,000 2,789,831,000General Operating Expenses (GOE) 3/ 415,000,000 442,248,000 451,248,000 460,248,000 469,248,000 478,633,000 488,206,000 2,789,831,000On-the-Job Training 10,000,000 - - - - - - - Disadvantaged Business Enterprise 10,000,000 - - - - - - - Highway Use Tax Evasion Projects 2,000,000 - - - - - - - Other Programs from Administrative Expenses 3,000,000 - - - - - - -
SUBTOTAL, FEDERAL-AID HIGHWAYS 1/ 40,995,000,000 50,807,248,000 51,444,248,000 52,002,248,000 52,615,248,000 53,224,293,000 53,908,199,000 314,001,484,000CA Subject to Obligation Limitation 40,256,000,000 50,068,248,000 50,705,248,000 51,263,248,000 51,876,248,000 52,485,293,000 53,169,199,000 309,567,484,000CA Exempt from Obligation Limitation 1/ 739,000,000 739,000,000 739,000,000 739,000,000 739,000,000 739,000,000 739,000,000 4,434,000,000
Fixing and Accelerating Surface Transportation - 500,000,000 500,000,000 500,000,000 500,000,000 500,000,000 500,000,000 3,000,000,000
TOTAL, FHWA 1/ 40,995,000,000 51,307,248,000 51,944,248,000 52,502,248,000 53,115,248,000 53,724,293,000 54,408,199,000 317,001,484,000CA Subject to Obligation Limitation 40,256,000,000 50,568,248,000 51,205,248,000 51,763,248,000 52,376,248,000 52,985,293,000 53,669,199,000 312,567,484,000CA Exempt from Obligation Limitation 1/ 739,000,000 739,000,000 739,000,000 739,000,000 739,000,000 739,000,000 739,000,000 4,434,000,000
FEDERAL HIGHWAY ADMINISTRATIONCROSSWALK BETWEEN FY 2015 ENACTED AND FY 2016 to FY 2021 REAUTHORIZATION PROPOSAL IN FY 2016 REQUEST - TOTAL BUDGET AUTHORITY
1/ Amounts exempt from Obligation Limitation include $100,000,000 for Emergency Relief and $639,000,000 of the National Highway Performance Program apportionments. FY 2015 amounts do not reflect sequestration of 7.3% per Sequestration Order dated March 10, 2014.
3/ Includes FHWA General Operating Expenses (GOE) and transfers to the Appalachian Regional Commission (ARC) for administrative activities associated with the Appalachian development highway system.
2/ Per the Grow America Act, the Secretary may set aside for SHRP2 implementation activities up to $25 million each fiscal year from the amount authorized for apportioned programs. In FY 2015, SHRP2 implementation activities may be funded by State Planning and Research funds and/or Technology and Innovation Deployment Program funds.

III-4
This Page Left Blank Intentionally
III-5
FEDERAL-AID HIGHWAYS
LIMITATION ON ADMINISTRATIVE EXPENSES
(TRANSPORTATION TRUST FUND) (INCLUDING TRANSFER OF FUNDS)
Contingent upon enactment of multi-year surface transportation authorization
legislation, not to exceed a total of $442,248,000, together with advances and reimbursements received by the Federal Highway Administration, shall be obligated for necessary expenses for administration and operation of the Federal Highway Administration or transferred to the Appalachian Regional Commission in accordance with section 104(a) of title 23, United States Code.
(LIMITATION ON OBLIGATIONS)
(TRANSPORTATION TRUST FUND)
Contingent upon enactment of multi-year surface transportation authorization
legislation, funds available for the implementation or execution of Federal-aid highway and highway safety construction programs authorized under titles 23 and 49, United States Code, and the provisions of such authorization legislation shall not exceed total obligations of $50,068,248,000 for fiscal year 2016: Provided, That the Secretary may collect and spend fees, as authorized by title 23, United States Code, to cover the costs of services of expert firms, including counsel, in the field of municipal and project finance to assist in the underwriting and servicing of Federal credit instruments and all or a portion of the costs to the Federal Government of servicing such credit instruments: Provided further, That such fees are available until expended to pay for such costs: Provided further, That such amounts are in addition to administrative expenses that are also available for such purpose, and are not subject to any obligation limitation or the limitation on administrative expenses under section 608 of title 23, United States Code.
III-6
(LIQUIDATION OF CONTRACT AUTHORIZATION)
(TRANSPORTATION TRUST FUND)
Contingent upon enactment of multi-year surface transportation authorization legislation, for the payment of obligations incurred in carrying out Federal-aid highway and highway safety construction programs authorized under title 23, United States Code, $50,807,248,000 derived from the Highway Account of the Transportation Trust Fund , to remain available until expended.
(ADMINISTRATIVE PROVISIONS - FEDERAL HIGHWAY ADMINISTRATION)
Sec. 120. Contingent upon enactment of multi-year surface transportation authorization legislation: (a) For fiscal year 2016, the Secretary of Transportation shall--
(1) not distribute from the obligation limitation for Federal-aid highway-- (A) amounts authorized for administrative expenses and programs by section 104(a) of title 23, United States Code; and (B) amounts authorized for the Bureau of Transportation Statistics;
(2) not distribute an amount from the obligation limitation for Federal-aid highway that is equal to the unobligated balance of amounts--
(A) made available from the Highway Trust Fund (other than the Mass Transit Account) or from the Highway Account of the Transportation Trust Fund for Federal-aid highway and highway safety construction programs for previous fiscal years the funds for which are allocated by the Secretary (or apportioned by the Secretary under sections 202 or 204 of title 23, United States Code); and (B) for which obligation limitation was provided in a previous fiscal year;
(3) determine the proportion that-- (A) the obligation limitation for Federal-aid highway, less the aggregate of amounts not distributed under paragraphs (1) and (2) of this subsection; bears to (B) the total of the sums authorized to be appropriated for the Federal-aid highway and highway safety construction programs (other than sums authorized to be appropriated for provisions of law described in paragraphs (1) through (11) of subsection (b) and sums authorized to be appropriated for section 119 of title 23, United States Code, equal to the amount referred to in subsection (b)(12) for such fiscal year), less the aggregate of the amounts not distributed under paragraphs (1) and (2) of this subsection;
(4) distribute the obligation limitation for Federal-aid highway, less the aggregate amounts not distributed under paragraphs (1) and (2), for each of
III-7
the programs (other than programs to which paragraph (1) applies) that are allocated by the Secretary under such authorization legislation and title 23, United States Code, or apportioned by the Secretary under sections 202 or 204 of that title, by multiplying--
(A) the proportion determined under paragraph (3); by (B) the amounts authorized to be appropriated for each such program for such fiscal year; and
(5) distribute the obligation limitation for Federal-aid highway, less the aggregate amounts not distributed under paragraphs (1) and (2) and the amounts distributed under paragraph (4), for Federal-aid highway and highway safety construction programs that are apportioned by the Secretary under such authorization legislation or title 23, United States Code (other than the amounts apportioned for the National Highway Performance Program in section 119 of title 23, United States Code, that are exempt from the limitation under subsection (b)(12) and the amounts apportioned under sections 202 and 204 of that title) in the proportion that--
(A) amounts authorized to be appropriated for the programs that are apportioned under title 23, United States Code, or such authorization legislation to each State for such fiscal year; bears to (B) the total of the amounts authorized to be appropriated for the programs that are apportioned under title 23, United States Code, or such authorization legislation to all States for such fiscal year.
(b) EXCEPTIONS FROM OBLIGATION LIMITATION- The obligation limitation for Federal-aid highway shall not apply to obligations under or for--
(1) section 125 of title 23, United States Code; (2) section 147 of the Surface Transportation Assistance Act of 1978 (23 U.S.C. 144 note; 92 Stat. 2714); (3) section 9 of the Federal-Aid Highway Act of 1981 (95 Stat. 1701); (4) subsections (b) and (j) of section 131 of the Surface Transportation Assistance Act of 1982 (96 Stat. 2119); (5) subsections (b) and (c) of section 149 of the Surface Transportation and Uniform Relocation Assistance Act of 1987 (101 Stat. 198); (6) sections 1103 through 1108 of the Intermodal Surface Transportation Efficiency Act of 1991 (105 Stat. 2027); (7) section 157 of title 23, United States Code (as in effect on June 8, 1998); (8) section 105 of title 23, United States Code (as in effect for fiscal years 1998 through 2004, but only in an amount equal to $639,000,000 for each of those fiscal years); (9) Federal-aid highway programs for which obligation authority was made available under the Transportation Equity Act for the 21st Century (112 Stat. 107) or subsequent Acts for multiple years or to remain available until expended, but only to the extent that the obligation authority has not lapsed or been used;
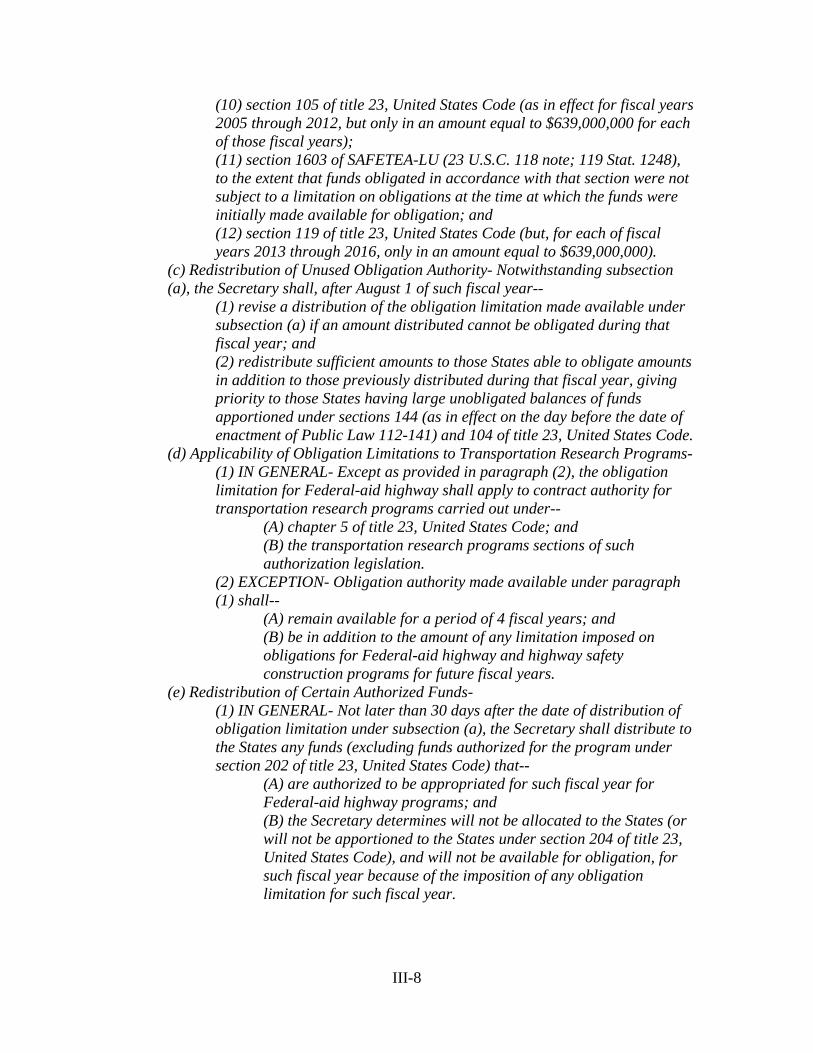
III-8
(10) section 105 of title 23, United States Code (as in effect for fiscal years 2005 through 2012, but only in an amount equal to $639,000,000 for each of those fiscal years); (11) section 1603 of SAFETEA-LU (23 U.S.C. 118 note; 119 Stat. 1248), to the extent that funds obligated in accordance with that section were not subject to a limitation on obligations at the time at which the funds were initially made available for obligation; and (12) section 119 of title 23, United States Code (but, for each of fiscal years 2013 through 2016, only in an amount equal to $639,000,000).
(c) Redistribution of Unused Obligation Authority- Notwithstanding subsection (a), the Secretary shall, after August 1 of such fiscal year--
(1) revise a distribution of the obligation limitation made available under subsection (a) if an amount distributed cannot be obligated during that fiscal year; and (2) redistribute sufficient amounts to those States able to obligate amounts in addition to those previously distributed during that fiscal year, giving priority to those States having large unobligated balances of funds apportioned under sections 144 (as in effect on the day before the date of enactment of Public Law 112-141) and 104 of title 23, United States Code.
(d) Applicability of Obligation Limitations to Transportation Research Programs- (1) IN GENERAL- Except as provided in paragraph (2), the obligation limitation for Federal-aid highway shall apply to contract authority for transportation research programs carried out under--
(A) chapter 5 of title 23, United States Code; and (B) the transportation research programs sections of such authorization legislation.
(2) EXCEPTION- Obligation authority made available under paragraph (1) shall--
(A) remain available for a period of 4 fiscal years; and (B) be in addition to the amount of any limitation imposed on obligations for Federal-aid highway and highway safety construction programs for future fiscal years.
(e) Redistribution of Certain Authorized Funds- (1) IN GENERAL- Not later than 30 days after the date of distribution of obligation limitation under subsection (a), the Secretary shall distribute to the States any funds (excluding funds authorized for the program under section 202 of title 23, United States Code) that--
(A) are authorized to be appropriated for such fiscal year for Federal-aid highway programs; and (B) the Secretary determines will not be allocated to the States (or will not be apportioned to the States under section 204 of title 23, United States Code), and will not be available for obligation, for such fiscal year because of the imposition of any obligation limitation for such fiscal year.
III-9
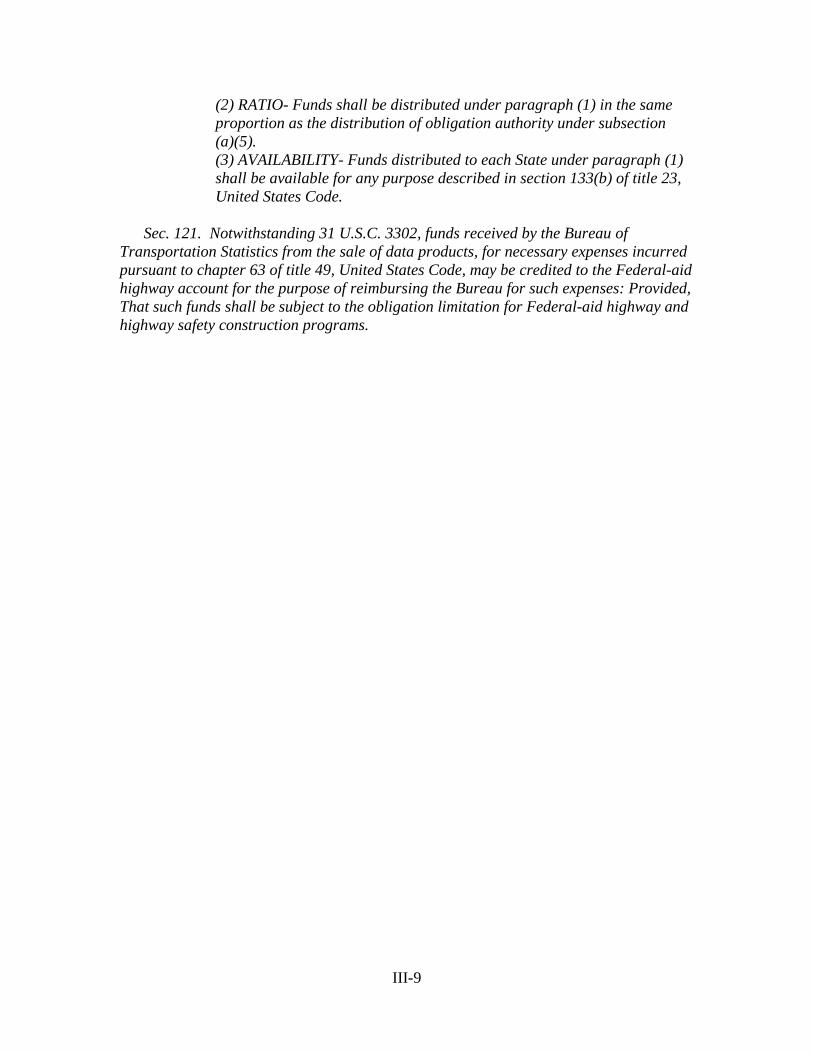
(2) RATIO- Funds shall be distributed under paragraph (1) in the same proportion as the distribution of obligation authority under subsection (a)(5). (3) AVAILABILITY- Funds distributed to each State under paragraph (1) shall be available for any purpose described in section 133(b) of title 23, United States Code.
Sec. 121. Notwithstanding 31 U.S.C. 3302, funds received by the Bureau of
Transportation Statistics from the sale of data products, for necessary expenses incurred pursuant to chapter 63 of title 49, United States Code, may be credited to the Federal-aid highway account for the purpose of reimbursing the Bureau for such expenses: Provided, That such funds shall be subject to the obligation limitation for Federal-aid highway and highway safety construction programs.

III-10
This Page Left Blank Intentionally
III-11
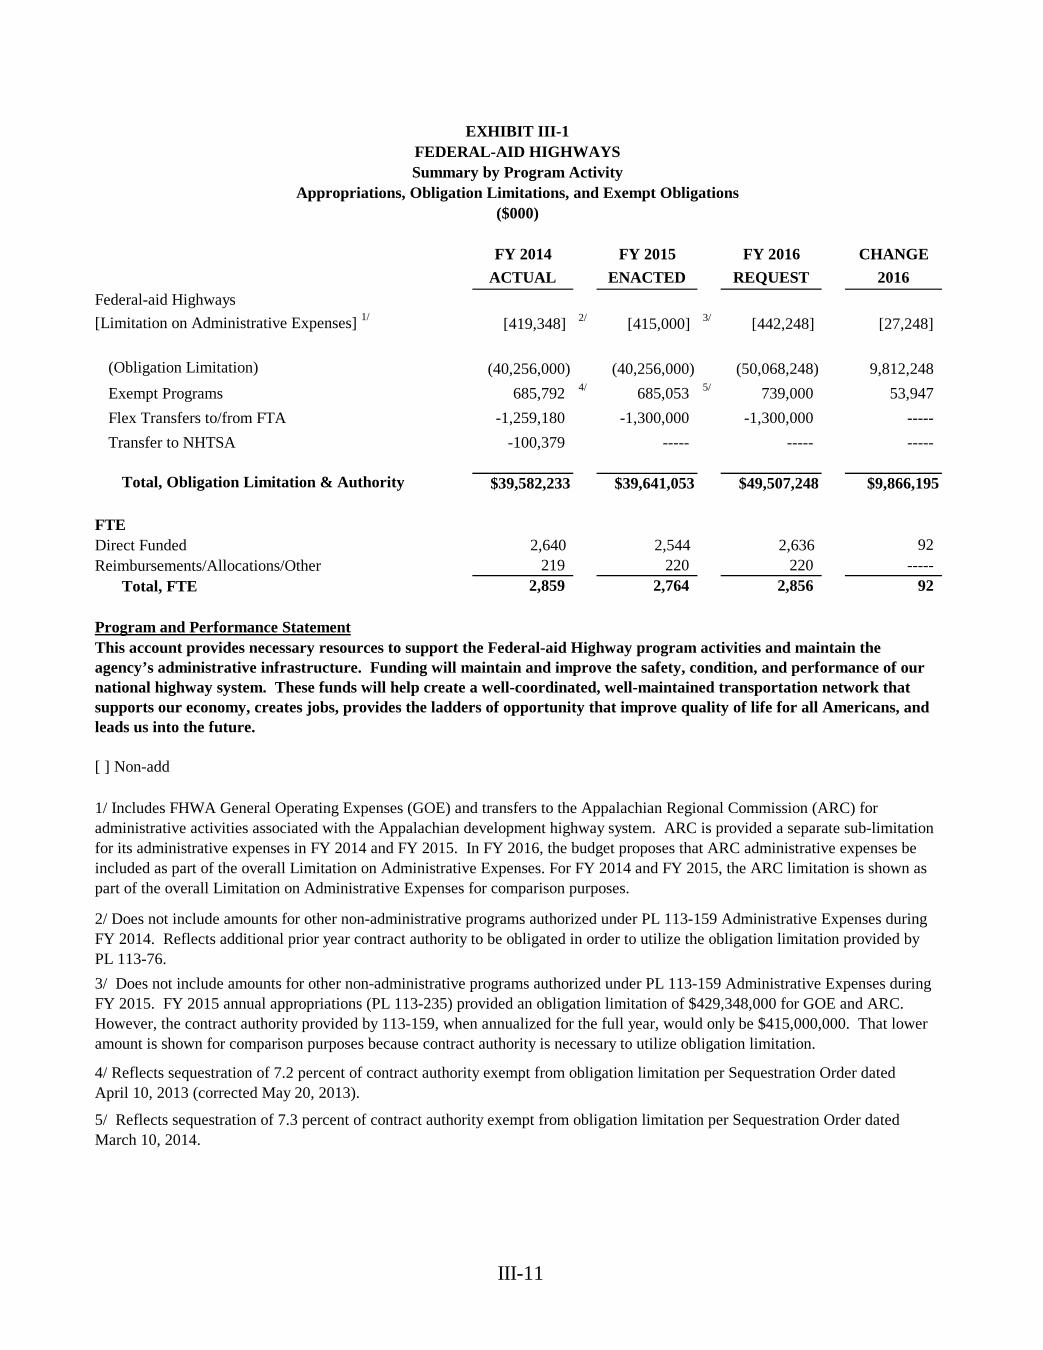
FY 2014 FY 2015 FY 2016 CHANGEACTUAL ENACTED REQUEST
2016
Federal-aid Highways[Limitation on Administrative Expenses] 1/ [419,348] 2/ [415,000] 3/ [442,248] [27,248]
(Obligation Limitation) (40,256,000) (40,256,000) (50,068,248) 9,812,248 Exempt Programs 685,792 4/ 685,053 5/ 739,000 53,947 Flex Transfers to/from FTA -1,259,180 -1,300,000 -1,300,000 ----- Transfer to NHTSA -100,379 ----- ----- -----
Total, Obligation Limitation & Authority $39,582,233 $39,641,053 $49,507,248 $9,866,195
FTEDirect Funded 2,640 2,544 2,636 92 Reimbursements/Allocations/Other 219 220 220 -----
Total, FTE 2,859 2,764 2,856 92
Program and Performance Statement
[ ] Non-add
5/ Reflects sequestration of 7.3 percent of contract authority exempt from obligation limitation per Sequestration Order dated March 10, 2014.
EXHIBIT III-1FEDERAL-AID HIGHWAYSSummary by Program Activity
Appropriations, Obligation Limitations, and Exempt Obligations($000)
4/ Reflects sequestration of 7.2 percent of contract authority exempt from obligation limitation per Sequestration Order dated April 10, 2013 (corrected May 20, 2013).
This account provides necessary resources to support the Federal-aid Highway program activities and maintain the agency’s administrative infrastructure. Funding will maintain and improve the safety, condition, and performance of our national highway system. These funds will help create a well-coordinated, well-maintained transportation network that supports our economy, creates jobs, provides the ladders of opportunity that improve quality of life for all Americans, and leads us into the future.
1/ Includes FHWA General Operating Expenses (GOE) and transfers to the Appalachian Regional Commission (ARC) for administrative activities associated with the Appalachian development highway system. ARC is provided a separate sub-limitation for its administrative expenses in FY 2014 and FY 2015. In FY 2016, the budget proposes that ARC administrative expenses be included as part of the overall Limitation on Administrative Expenses. For FY 2014 and FY 2015, the ARC limitation is shown as part of the overall Limitation on Administrative Expenses for comparison purposes.
2/ Does not include amounts for other non-administrative programs authorized under PL 113-159 Administrative Expenses during FY 2014. Reflects additional prior year contract authority to be obligated in order to utilize the obligation limitation provided by PL 113-76.3/ Does not include amounts for other non-administrative programs authorized under PL 113-159 Administrative Expenses during FY 2015. FY 2015 annual appropriations (PL 113-235) provided an obligation limitation of $429,348,000 for GOE and ARC. However, the contract authority provided by 113-159, when annualized for the full year, would only be $415,000,000. That lower amount is shown for comparison purposes because contract authority is necessary to utilize obligation limitation.
III-12
EXHIBIT III-1aFEDERAL-AID HIGHWAYS
SUMMARY ANALYSIS OF CHANGE FROM FY 2015 TO FY 2016Appropriations, Obligation Limitations, and Exempt Obligations
Change from FY 2015 to
FY 2016
Change from FY 2015 to
FY 2016($000) FTE
ItemFY 2015 Base (Obligation Limitation + Exempt CA) $40,995,000 2,557Federal-aid Highways
Adjustments to BaseAnnualization of 2015 President's Raise (1.0%) $7502016 President's Raise (1.3%) $2,930Additional Compensable Day - FY 2016 $1,163GSA Rent $916Working Capital Fund (WCF) $3,551Inflation $274
Subtotal, Adjustments to Base $9,584 0
Program Increases/DecreasesFederal-aid Highway Program $9,785,000Restoration of Staffing to Pre-Hiring Freeze Levels $12,992 92Restoration of IT Support Services $3,000Restoration of Field/Headquarters Support $2,000Restoration of Training $420Reduction to estimated ARC administrative expenses -$748
Subtotal, New or Expanded Programs $9,802,664 92
FY 2016 Total Request [Ob. Lim. + Exempt CA] $50,807,248 2,649
($000)
III-13
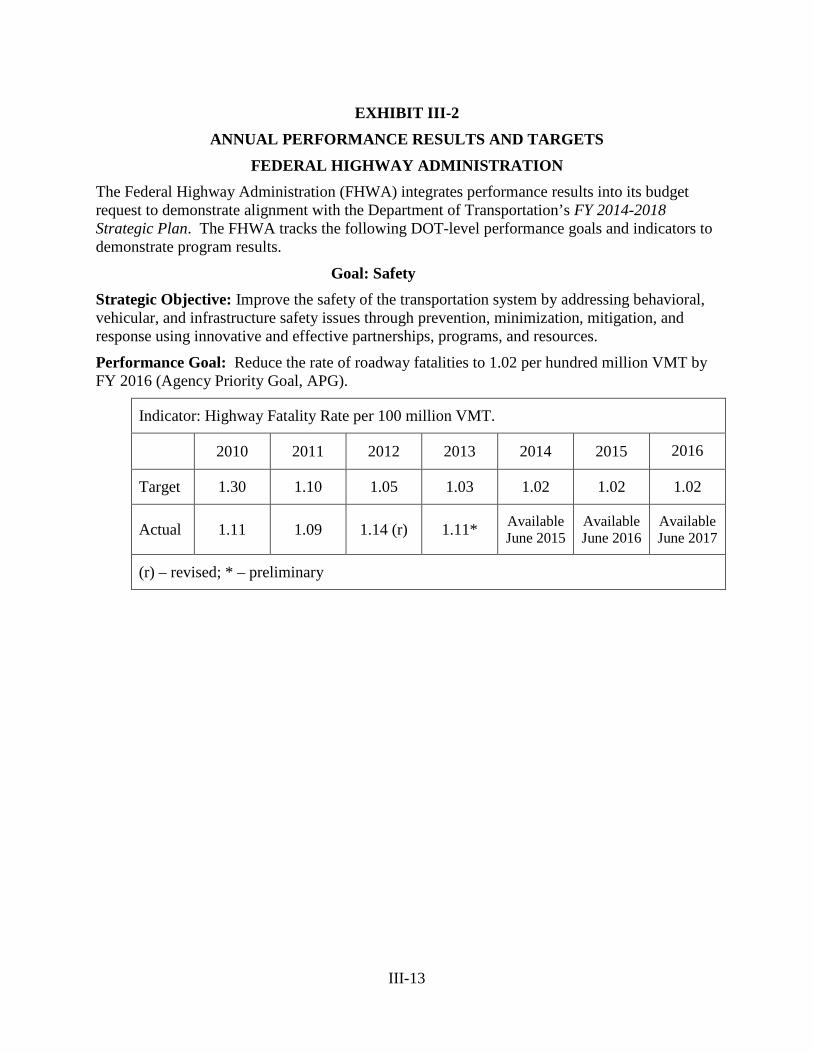
EXHIBIT III-2 ANNUAL PERFORMANCE RESULTS AND TARGETS
FEDERAL HIGHWAY ADMINISTRATION The Federal Highway Administration (FHWA) integrates performance results into its budget request to demonstrate alignment with the Department of Transportation’s FY 2014-2018 Strategic Plan. The FHWA tracks the following DOT-level performance goals and indicators to demonstrate program results.
Goal: Safety Strategic Objective: Improve the safety of the transportation system by addressing behavioral, vehicular, and infrastructure safety issues through prevention, minimization, mitigation, and response using innovative and effective partnerships, programs, and resources.
Performance Goal: Reduce the rate of roadway fatalities to 1.02 per hundred million VMT by FY 2016 (Agency Priority Goal, APG).
Indicator: Highway Fatality Rate per 100 million VMT.
2010 2011 2012 2013 2014 2015 2016
Target 1.30 1.10 1.05 1.03 1.02 1.02 1.02
Actual 1.11 1.09 1.14 (r) 1.11* Available June 2015
Available June 2016
Available June 2017
(r) – revised; * – preliminary
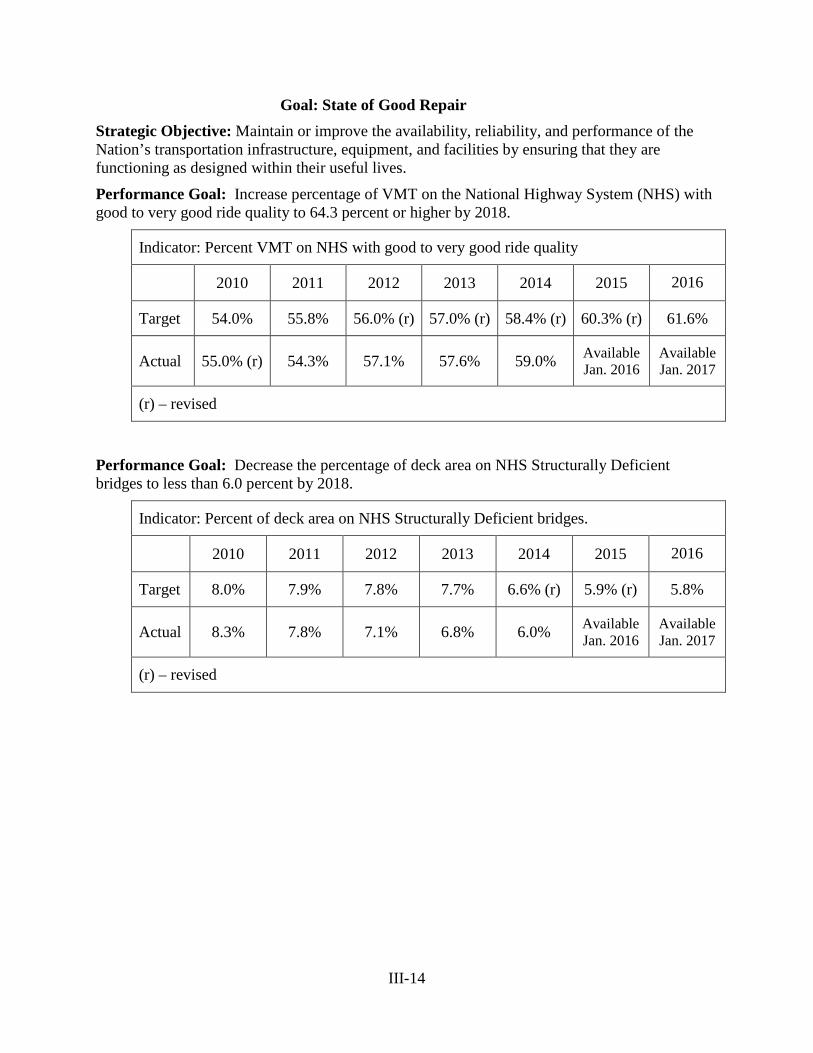
III-14
Goal: State of Good Repair Strategic Objective: Maintain or improve the availability, reliability, and performance of the Nation’s transportation infrastructure, equipment, and facilities by ensuring that they are functioning as designed within their useful lives.
Performance Goal: Increase percentage of VMT on the National Highway System (NHS) with good to very good ride quality to 64.3 percent or higher by 2018.
Indicator: Percent VMT on NHS with good to very good ride quality
2010 2011 2012 2013 2014 2015 2016
Target 54.0% 55.8% 56.0% (r) 57.0% (r) 58.4% (r) 60.3% (r) 61.6%
Actual 55.0% (r) 54.3% 57.1% 57.6% 59.0% Available Jan. 2016
Available Jan. 2017
(r) – revised
Performance Goal: Decrease the percentage of deck area on NHS Structurally Deficient bridges to less than 6.0 percent by 2018.
Indicator: Percent of deck area on NHS Structurally Deficient bridges.
2010 2011 2012 2013 2014 2015 2016
Target 8.0% 7.9% 7.8% 7.7% 6.6% (r) 5.9% (r) 5.8%
Actual 8.3% 7.8% 7.1% 6.8% 6.0% Available Jan. 2016
Available Jan. 2017
(r) – revised
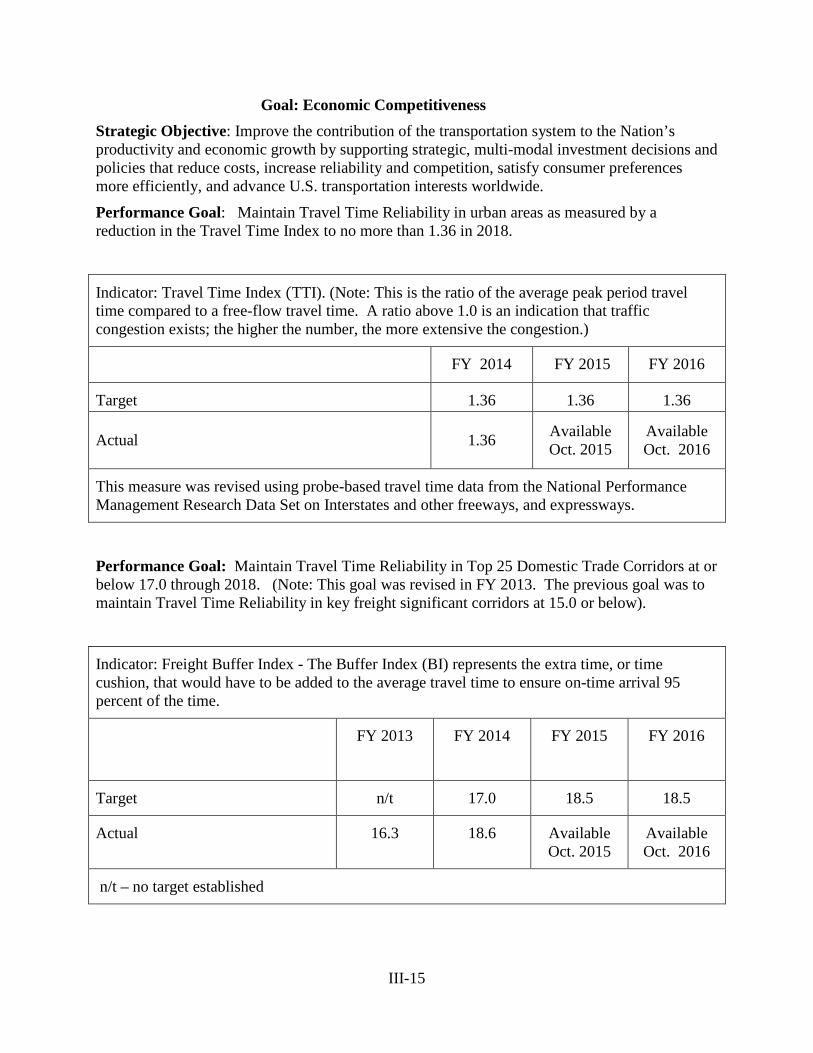
III-15
Goal: Economic Competitiveness Strategic Objective: Improve the contribution of the transportation system to the Nation’s productivity and economic growth by supporting strategic, multi-modal investment decisions and policies that reduce costs, increase reliability and competition, satisfy consumer preferences more efficiently, and advance U.S. transportation interests worldwide.
Performance Goal: Maintain Travel Time Reliability in urban areas as measured by a reduction in the Travel Time Index to no more than 1.36 in 2018.
Indicator: Travel Time Index (TTI). (Note: This is the ratio of the average peak period travel time compared to a free-flow travel time. A ratio above 1.0 is an indication that traffic congestion exists; the higher the number, the more extensive the congestion.)
FY 2014 FY 2015 FY 2016
Target
1.36 1.36 1.36
Actual 1.36 Available Oct. 2015
Available Oct. 2016
This measure was revised using probe-based travel time data from the National Performance Management Research Data Set on Interstates and other freeways, and expressways.
Performance Goal: Maintain Travel Time Reliability in Top 25 Domestic Trade Corridors at or below 17.0 through 2018. (Note: This goal was revised in FY 2013. The previous goal was to maintain Travel Time Reliability in key freight significant corridors at 15.0 or below).
Indicator: Freight Buffer Index - The Buffer Index (BI) represents the extra time, or time cushion, that would have to be added to the average travel time to ensure on-time arrival 95 percent of the time.
FY 2013 FY 2014 FY 2015
FY 2016
Target n/t 17.0 18.5 18.5
Actual 16.3 18.6 Available Oct. 2015
Available Oct. 2016
n/t – no target established
III-16
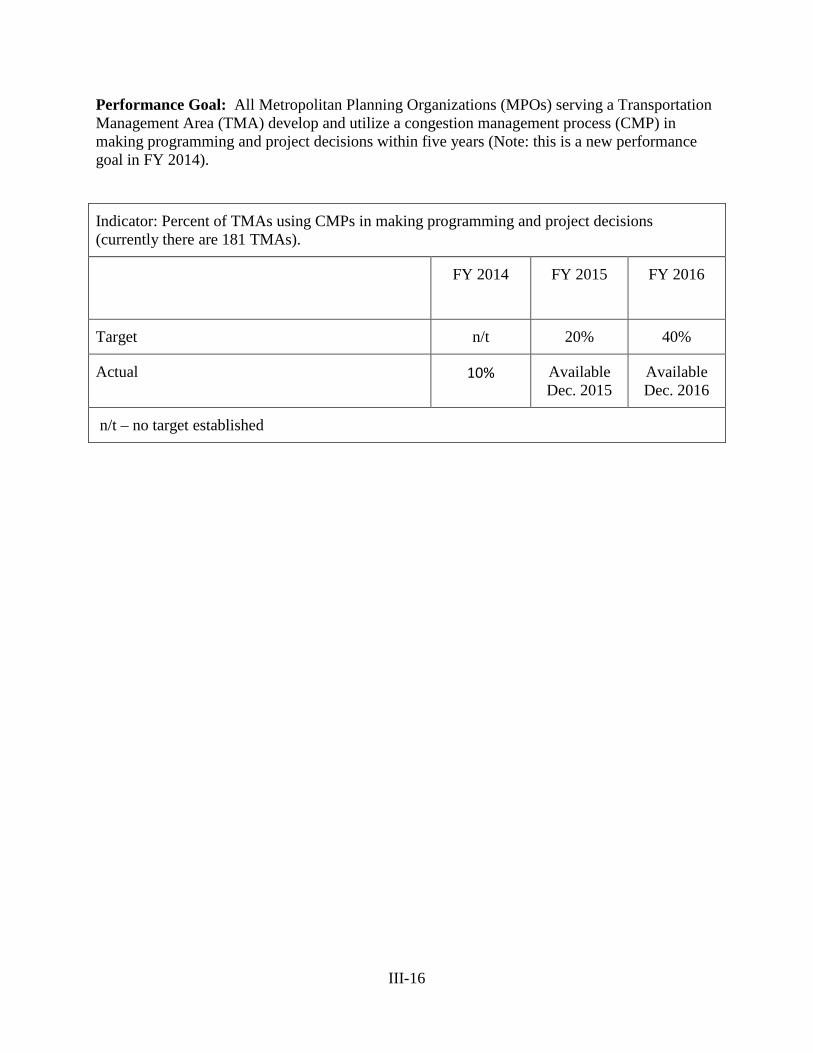
Performance Goal: All Metropolitan Planning Organizations (MPOs) serving a Transportation Management Area (TMA) develop and utilize a congestion management process (CMP) in making programming and project decisions within five years (Note: this is a new performance goal in FY 2014).
Indicator: Percent of TMAs using CMPs in making programming and project decisions (currently there are 181 TMAs).
FY 2014 FY 2015
FY 2016
Target n/t 20% 40%
Actual 10% Available Dec. 2015
Available Dec. 2016
n/t – no target established
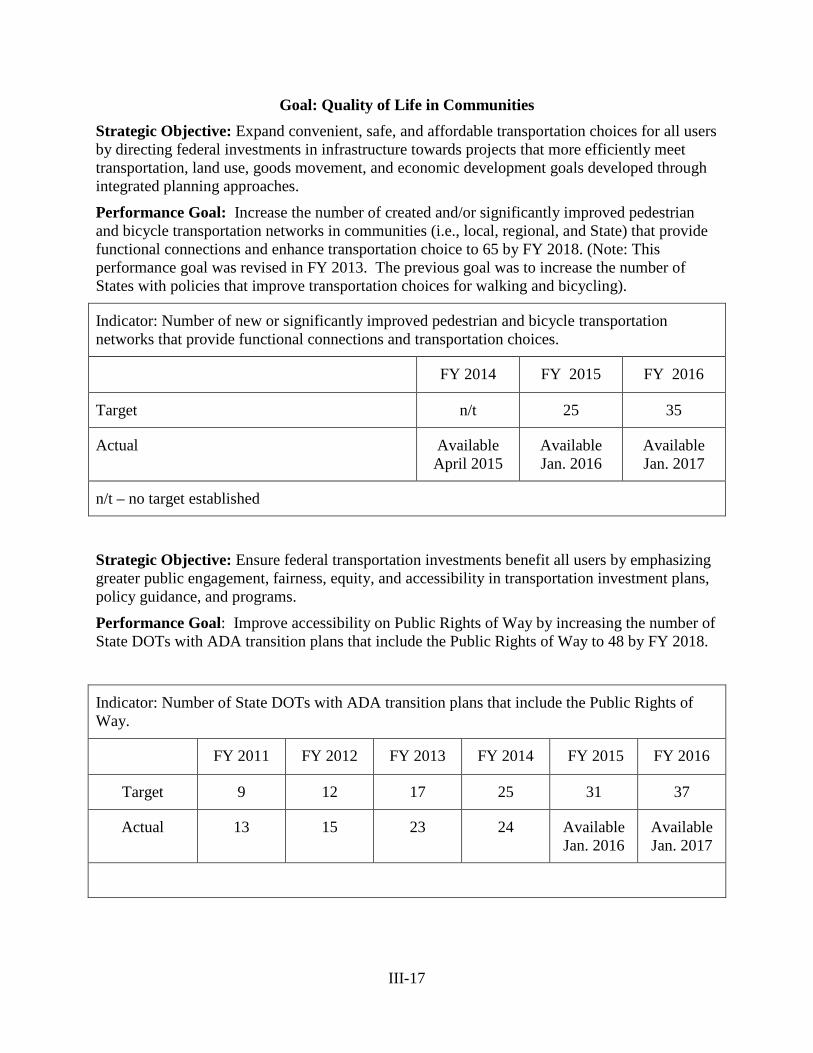
III-17
Goal: Quality of Life in Communities Strategic Objective: Expand convenient, safe, and affordable transportation choices for all users by directing federal investments in infrastructure towards projects that more efficiently meet transportation, land use, goods movement, and economic development goals developed through integrated planning approaches.
Performance Goal: Increase the number of created and/or significantly improved pedestrian and bicycle transportation networks in communities (i.e., local, regional, and State) that provide functional connections and enhance transportation choice to 65 by FY 2018. (Note: This performance goal was revised in FY 2013. The previous goal was to increase the number of States with policies that improve transportation choices for walking and bicycling).
Indicator: Number of new or significantly improved pedestrian and bicycle transportation networks that provide functional connections and transportation choices.
FY 2014 FY 2015 FY 2016
Target n/t 25 35
Actual Available April 2015
Available Jan. 2016
Available Jan. 2017
n/t – no target established
Strategic Objective: Ensure federal transportation investments benefit all users by emphasizing greater public engagement, fairness, equity, and accessibility in transportation investment plans, policy guidance, and programs. Performance Goal: Improve accessibility on Public Rights of Way by increasing the number of State DOTs with ADA transition plans that include the Public Rights of Way to 48 by FY 2018.
Indicator: Number of State DOTs with ADA transition plans that include the Public Rights of Way.
FY 2011 FY 2012 FY 2013 FY 2014 FY 2015 FY 2016
Target 9 12 17 25 31 37
Actual 13 15 23 24 Available Jan. 2016
Available Jan. 2017
III-18
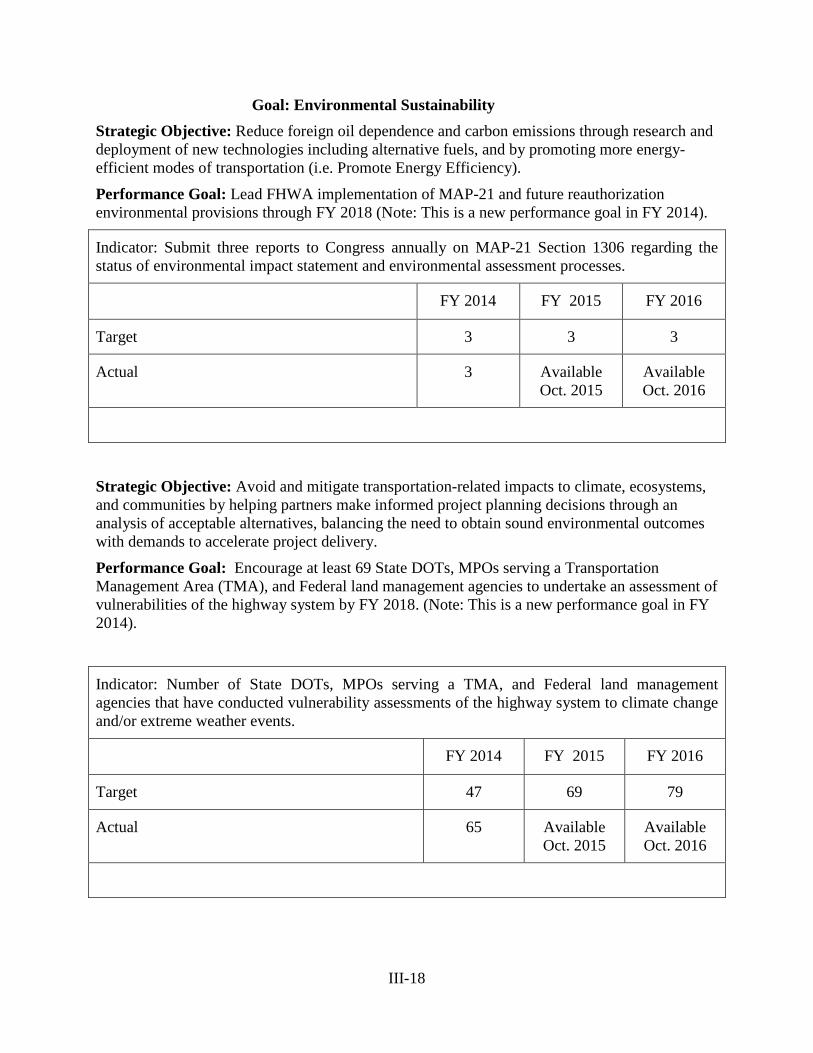
Goal: Environmental Sustainability Strategic Objective: Reduce foreign oil dependence and carbon emissions through research and deployment of new technologies including alternative fuels, and by promoting more energy-efficient modes of transportation (i.e. Promote Energy Efficiency). Performance Goal: Lead FHWA implementation of MAP-21 and future reauthorization environmental provisions through FY 2018 (Note: This is a new performance goal in FY 2014).
Indicator: Submit three reports to Congress annually on MAP-21 Section 1306 regarding the status of environmental impact statement and environmental assessment processes.
FY 2014 FY 2015 FY 2016
Target 3 3 3
Actual 3 Available Oct. 2015
Available Oct. 2016
Strategic Objective: Avoid and mitigate transportation-related impacts to climate, ecosystems, and communities by helping partners make informed project planning decisions through an analysis of acceptable alternatives, balancing the need to obtain sound environmental outcomes with demands to accelerate project delivery. Performance Goal: Encourage at least 69 State DOTs, MPOs serving a Transportation Management Area (TMA), and Federal land management agencies to undertake an assessment of vulnerabilities of the highway system by FY 2018. (Note: This is a new performance goal in FY 2014).
Indicator: Number of State DOTs, MPOs serving a TMA, and Federal land management agencies that have conducted vulnerability assessments of the highway system to climate change and/or extreme weather events.
FY 2014 FY 2015 FY 2016
Target 47 69 79
Actual 65 Available Oct. 2015
Available Oct. 2016
III-19
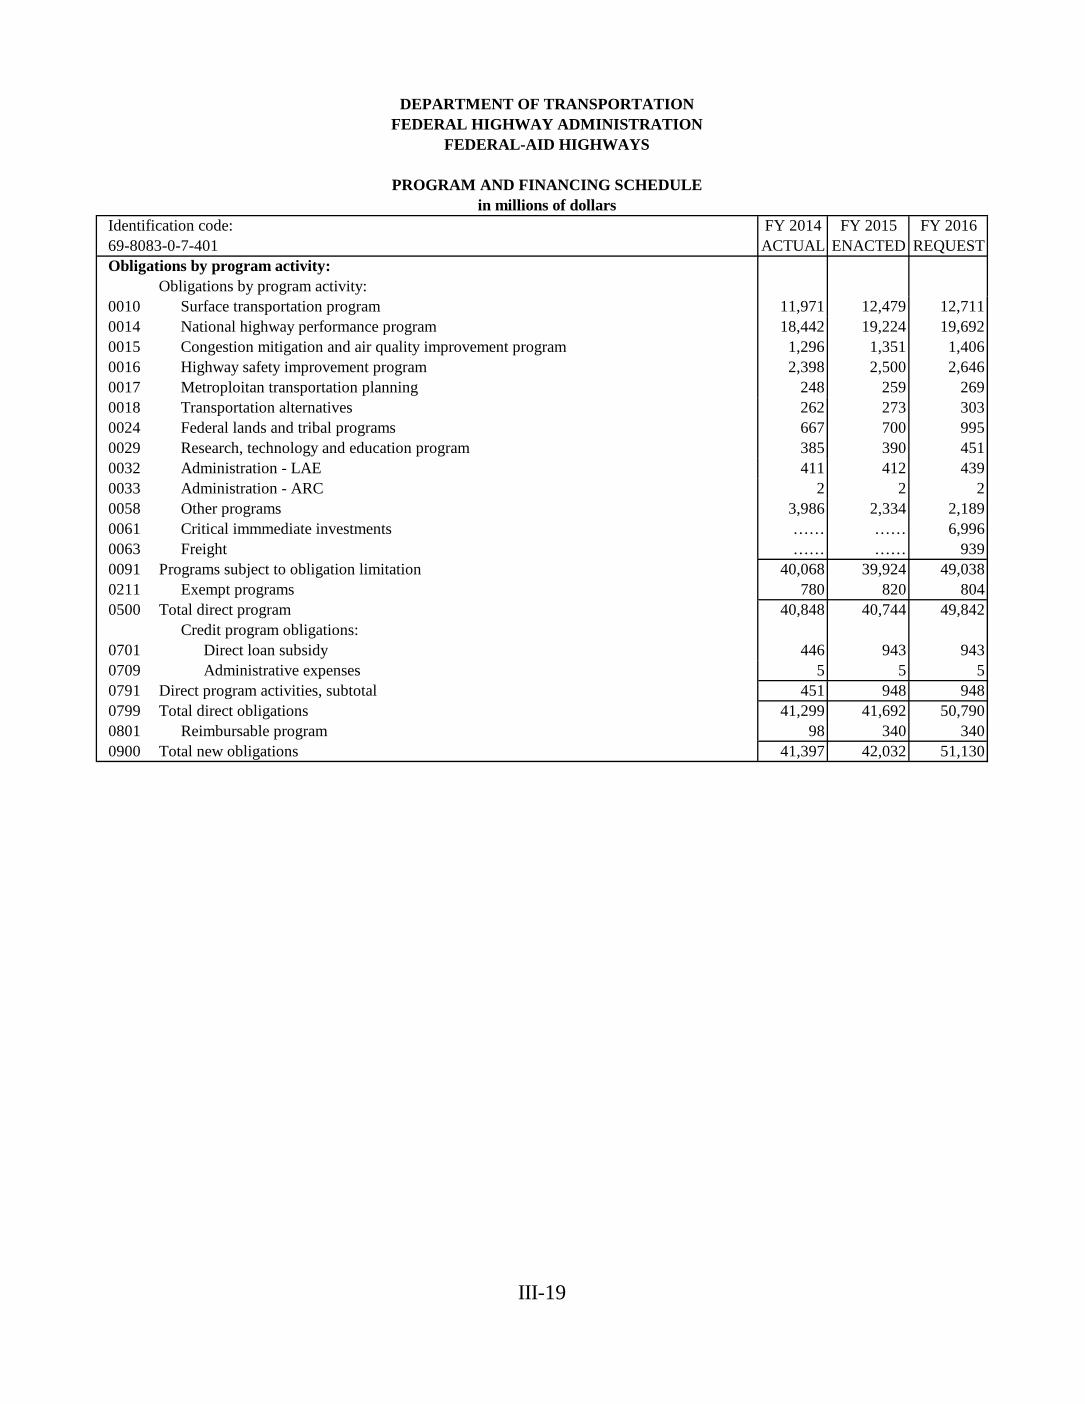
DEPARTMENT OF TRANSPORTATIONFEDERAL HIGHWAY ADMINISTRATION
FEDERAL-AID HIGHWAYS
PROGRAM AND FINANCING SCHEDULEin millions of dollars
Identification code: FY 2014 FY 2015 FY 201669-8083-0-7-401 ACTUAL ENACTED REQUESTObligations by program activity:
Obligations by program activity: 0010 Surface transportation program 11,971 12,479 12,7110014 National highway performance program 18,442 19,224 19,6920015 Congestion mitigation and air quality improvement program 1,296 1,351 1,4060016 Highway safety improvement program 2,398 2,500 2,6460017 Metroploitan transportation planning 248 259 2690018 Transportation alternatives 262 273 3030024 Federal lands and tribal programs 667 700 9950029 Research, technology and education program 385 390 4510032 Administration - LAE 411 412 4390033 Administration - ARC 2 2 20058 Other programs 3,986 2,334 2,1890061 Critical immmediate investments …… …… 6,9960063 Freight …… …… 9390091 Programs subject to obligation limitation 40,068 39,924 49,0380211 Exempt programs 780 820 8040500 Total direct program 40,848 40,744 49,842
Credit program obligations:0701 Direct loan subsidy 446 943 9430709 Administrative expenses 5 5 50791 Direct program activities, subtotal 451 948 9480799 Total direct obligations 41,299 41,692 50,7900801 Reimbursable program 98 340 3400900 Total new obligations 41,397 42,032 51,130
III-20
DEPARTMENT OF TRANSPORTATIONFEDERAL HIGHWAY ADMINISTRATION
FEDERAL-AID HIGHWAYS
PROGRAM AND FINANCING SCHEDULEin millions of dollars
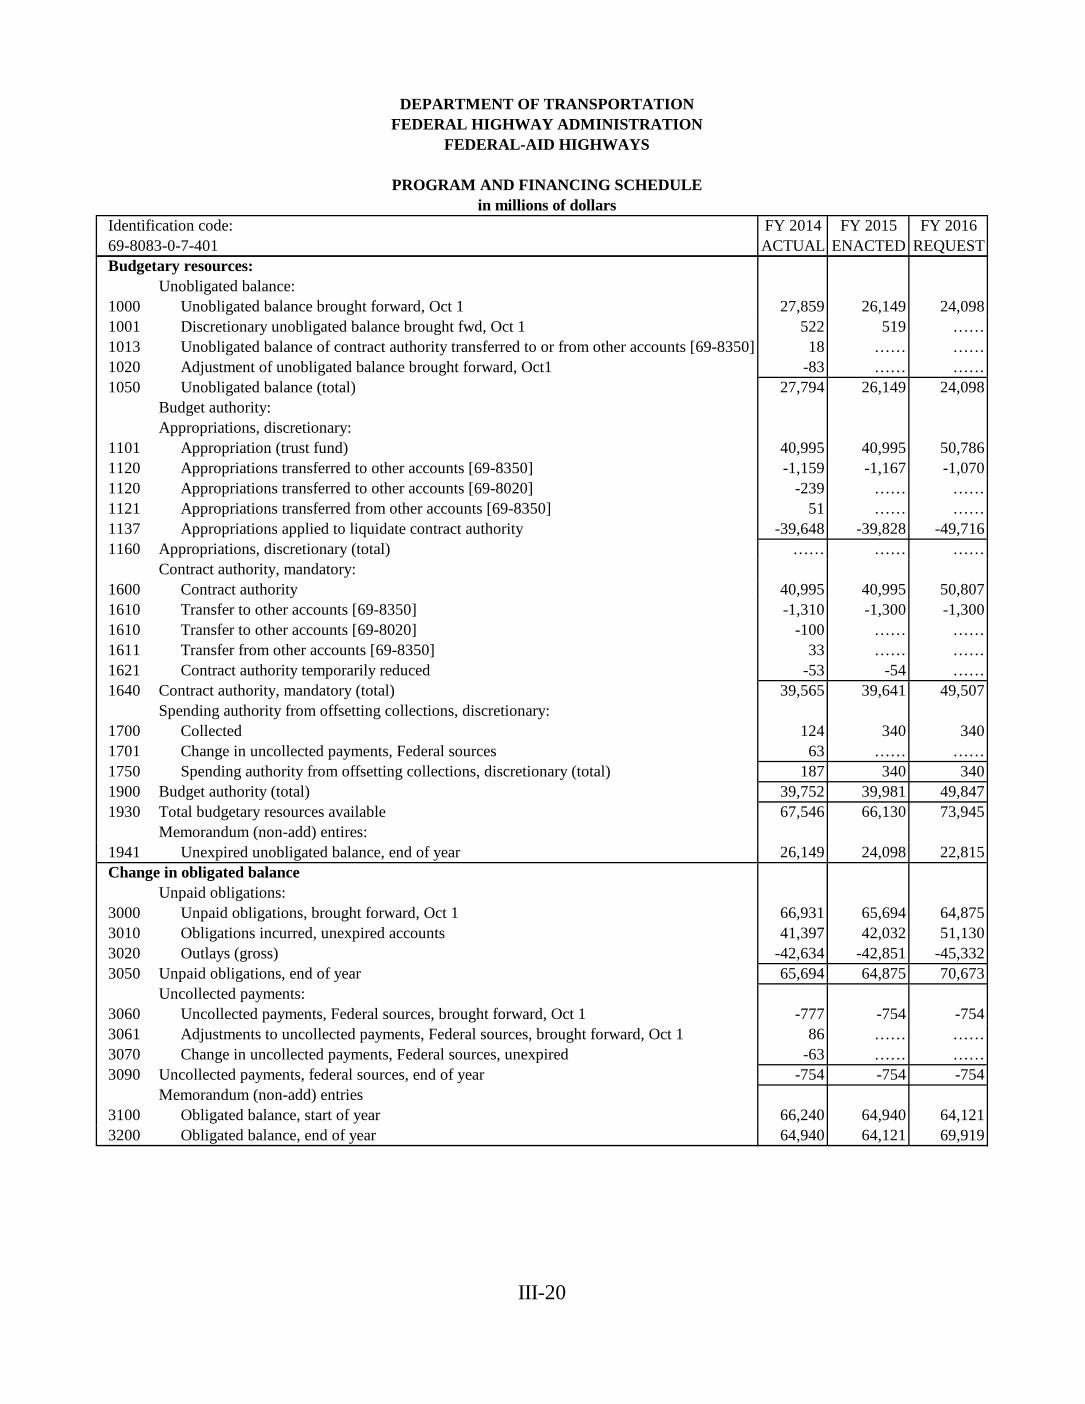
Identification code: FY 2014 FY 2015 FY 201669-8083-0-7-401 ACTUAL ENACTED REQUESTBudgetary resources:
Unobligated balance:1000 Unobligated balance brought forward, Oct 1 27,859 26,149 24,0981001 Discretionary unobligated balance brought fwd, Oct 1 522 519 ……1013 Unobligated balance of contract authority transferred to or from other accounts [69-8350] 18 …… ……1020 Adjustment of unobligated balance brought forward, Oct1 -83 …… ……1050 Unobligated balance (total) 27,794 26,149 24,098
Budget authority:Appropriations, discretionary:
1101 Appropriation (trust fund) 40,995 40,995 50,7861120 Appropriations transferred to other accounts [69-8350] -1,159 -1,167 -1,0701120 Appropriations transferred to other accounts [69-8020] -239 …… ……1121 Appropriations transferred from other accounts [69-8350] 51 …… ……1137 Appropriations applied to liquidate contract authority -39,648 -39,828 -49,7161160 Appropriations, discretionary (total) …… …… ……
Contract authority, mandatory:1600 Contract authority 40,995 40,995 50,8071610 Transfer to other accounts [69-8350] -1,310 -1,300 -1,3001610 Transfer to other accounts [69-8020] -100 …… ……1611 Transfer from other accounts [69-8350] 33 …… ……1621 Contract authority temporarily reduced -53 -54 ……1640 Contract authority, mandatory (total) 39,565 39,641 49,507
Spending authority from offsetting collections, discretionary:1700 Collected 124 340 3401701 Change in uncollected payments, Federal sources 63 …… ……1750 Spending authority from offsetting collections, discretionary (total) 187 340 3401900 Budget authority (total) 39,752 39,981 49,8471930 Total budgetary resources available 67,546 66,130 73,945
Memorandum (non-add) entires:1941 Unexpired unobligated balance, end of year 26,149 24,098 22,815Change in obligated balance
Unpaid obligations:3000 Unpaid obligations, brought forward, Oct 1 66,931 65,694 64,8753010 Obligations incurred, unexpired accounts 41,397 42,032 51,1303020 Outlays (gross) -42,634 -42,851 -45,3323050 Unpaid obligations, end of year 65,694 64,875 70,673
Uncollected payments:3060 Uncollected payments, Federal sources, brought forward, Oct 1 -777 -754 -7543061 Adjustments to uncollected payments, Federal sources, brought forward, Oct 1 86 …… ……3070 Change in uncollected payments, Federal sources, unexpired -63 …… ……3090 Uncollected payments, federal sources, end of year -754 -754 -754
Memorandum (non-add) entries3100 Obligated balance, start of year 66,240 64,940 64,1213200 Obligated balance, end of year 64,940 64,121 69,919
III-21
DEPARTMENT OF TRANSPORTATIONFEDERAL HIGHWAY ADMINISTRATION
FEDERAL-AID HIGHWAYS
PROGRAM AND FINANCING SCHEDULEin millions of dollars
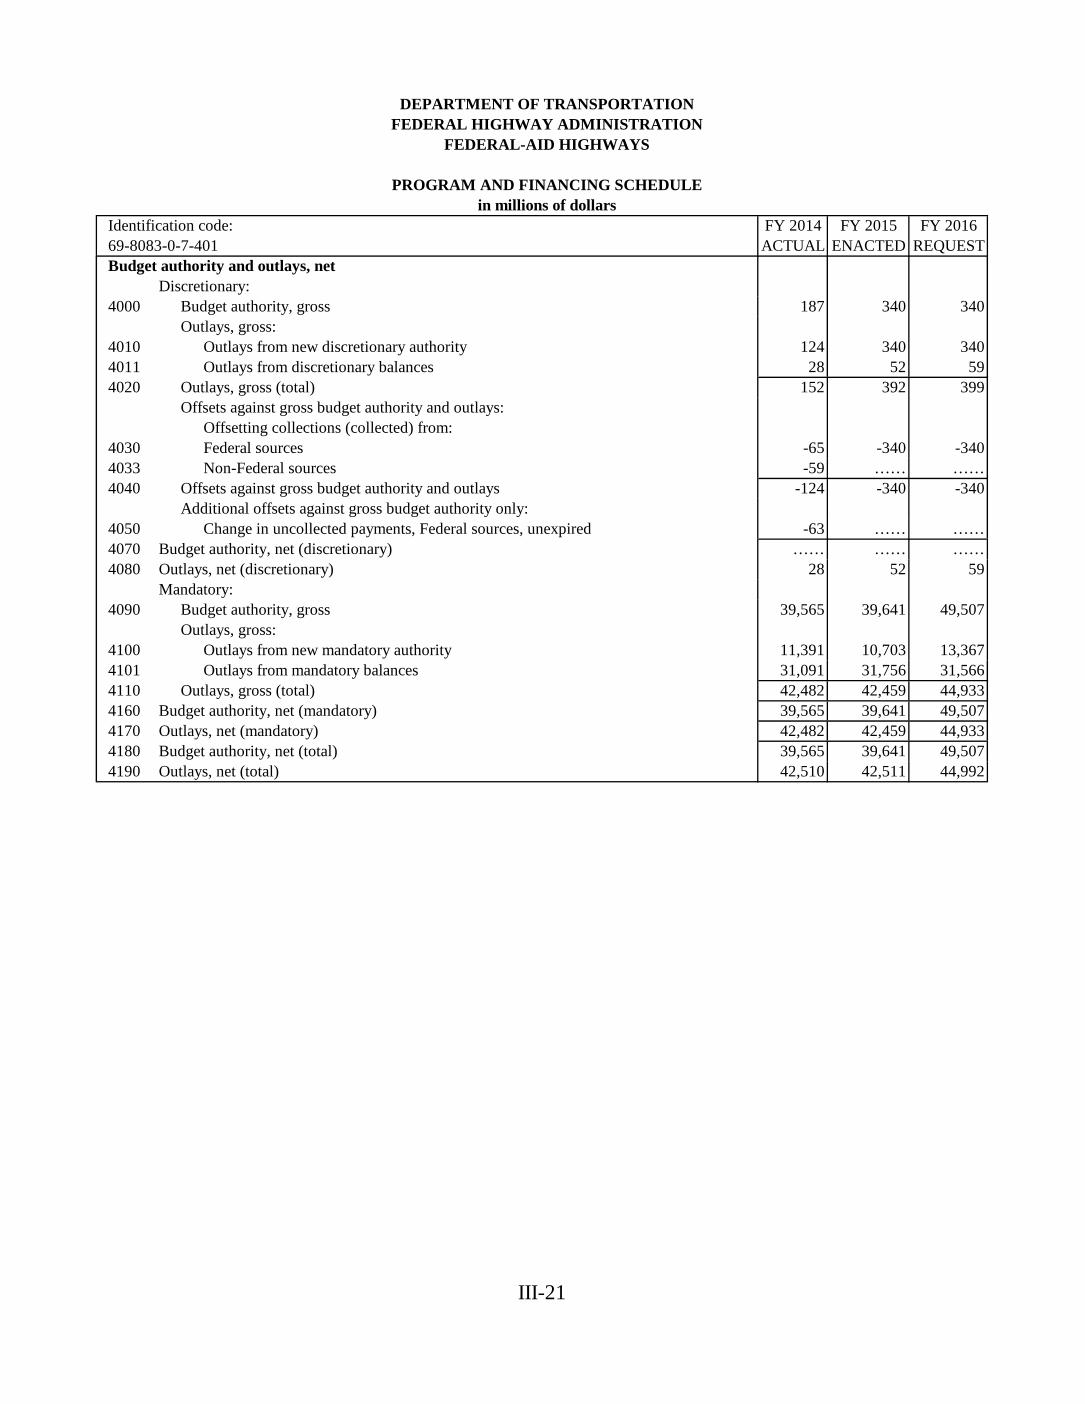
Identification code: FY 2014 FY 2015 FY 201669-8083-0-7-401 ACTUAL ENACTED REQUESTBudget authority and outlays, net
Discretionary:4000 Budget authority, gross 187 340 340
Outlays, gross:4010 Outlays from new discretionary authority 124 340 3404011 Outlays from discretionary balances 28 52 594020 Outlays, gross (total) 152 392 399
Offsets against gross budget authority and outlays:Offsetting collections (collected) from:
4030 Federal sources -65 -340 -3404033 Non-Federal sources -59 …… ……4040 Offsets against gross budget authority and outlays -124 -340 -340
Additional offsets against gross budget authority only:4050 Change in uncollected payments, Federal sources, unexpired -63 …… ……4070 Budget authority, net (discretionary) …… …… ……4080 Outlays, net (discretionary) 28 52 59
Mandatory:4090 Budget authority, gross 39,565 39,641 49,507
Outlays, gross:4100 Outlays from new mandatory authority 11,391 10,703 13,3674101 Outlays from mandatory balances 31,091 31,756 31,5664110 Outlays, gross (total) 42,482 42,459 44,9334160 Budget authority, net (mandatory) 39,565 39,641 49,5074170 Outlays, net (mandatory) 42,482 42,459 44,9334180 Budget authority, net (total) 39,565 39,641 49,5074190 Outlays, net (total) 42,510 42,511 44,992

III-22
This Page Left Blank Intentionally
III-23
DEPARTMENT OF TRANSPORTATIONFEDERAL HIGHWAY ADMINISTRATION
FEDERAL-AID HIGHWAYS
OBJECT CLASSIFICATIONin millions of dollars
Identification code: FY 2014 FY 2015 FY 201669-8083-0-7-401 ACTUAL ENACTED REQUESTDirect obligations:
Personnel compensation:11.1 Full-time permanent 284 288 289
11.3 Other than full-time permanent 2 2 2
11.5 Other personnel compensation 3 3 3
11.9 Total personnel compensation 289 293 294
12.1 Civilian personnel benefits 81 82 83
21.0 Travel and transportation of persons 18 18 18
22.0 Transportation of things 1 1 1
23.1 Rental payments to GSA 28 30 30
23.2 Rental payments to others 1 1 1
23.3 Communications, utilities, and misc. charges 4 4 4
24.0 Printing and reproduction 1 1 1
25.1 Advisory and assistance services 86 86 86
25.2 Other services from non-federal sources 288 288 288
25.3 Other goods and services from federal sources 463 463 463
25.7 Operation and maintenance of equipment 38 36 36
26.0 Supplies and materials 3 3 3
31.0 Equipment 6 6 6
33.0 Investments and loans 446 943 943
41.0 Grants, subsidies, and contributions 38,992 38,883 47,979
99.0 Direct obligations 40,745 41,138 50,236
99.0 Reimbursable obligations 98 340 340
III-24
DEPARTMENT OF TRANSPORTATIONFEDERAL HIGHWAY ADMINISTRATION
FEDERAL-AID HIGHWAYS
OBJECT CLASSIFICATIONin millions of dollars
Identification code: FY 2014 FY 2015 FY 201669-8083-0-7-401 ACTUAL ENACTED REQUESTAllocation account - direct:
Personnel compensation:11.1 Full-time permanent 12 12 12
11.5 Other personnel compensation 39 39 39
11.9 Total personnel compensation 51 51 51
12.1 Civilian personnel benefits 15 15 15
21.0 Travel and transportation of persons 1 1 1
22.0 Transportation of things 1 1 1
23.1 Rental payments to GSA 2 2 2
23.3 Communications, utilities, and misc. charges 6 6 6
25.1 Advisory and assistance services 53 53 53
25.2 Other services from non-federal sources 42 42 42
25.3 Other goods and services from federal sources 15 15 15
25.4 Operation and maintenance of facilities 60 60 60
25.5 Research and development contracts 3 3 3
25.7 Operation and maintenance of equipment 1 1 1
26.0 Supplies and materials 9 9 9
31.0 Equipment 7 7 7
32.0 Land and structures 49 49 49
41.0 Grants, subsidies, and contributions 239 239 239
99.0 Allocation account obligations - direct 554 554 554
99.9 Total new obligations 41,397 42,032 51,130
FEDERAL-AID HIGHWAYS
EMPLOYMENT SUMMARY
Identification code: FY 2014 FY 2015 FY 201669-8083-0-7-401 ACTUAL ENACTED REQUEST
Direct:10.01 Civilian full-time equivalent employment 2,640 2,544 2,636
Reimbursable:20.01 Civilian full-time equivalent employment 217 217 217
Allocation account:30.01 Civilian full-time equivalent employment 2 3 3
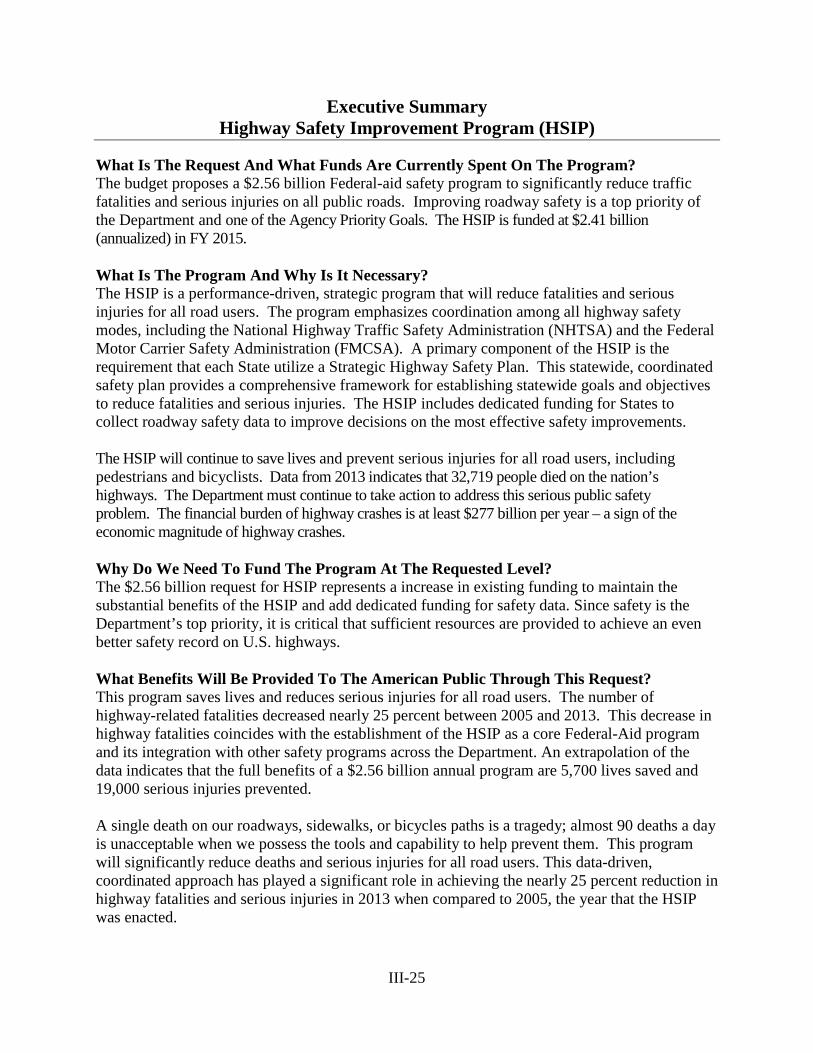
III-25
Executive Summary Highway Safety Improvement Program (HSIP)
What Is The Request And What Funds Are Currently Spent On The Program? The budget proposes a $2.56 billion Federal-aid safety program to significantly reduce traffic fatalities and serious injuries on all public roads. Improving roadway safety is a top priority of the Department and one of the Agency Priority Goals. The HSIP is funded at $2.41 billion (annualized) in FY 2015. What Is The Program And Why Is It Necessary? The HSIP is a performance-driven, strategic program that will reduce fatalities and serious injuries for all road users. The program emphasizes coordination among all highway safety modes, including the National Highway Traffic Safety Administration (NHTSA) and the Federal Motor Carrier Safety Administration (FMCSA). A primary component of the HSIP is the requirement that each State utilize a Strategic Highway Safety Plan. This statewide, coordinated safety plan provides a comprehensive framework for establishing statewide goals and objectives to reduce fatalities and serious injuries. The HSIP includes dedicated funding for States to collect roadway safety data to improve decisions on the most effective safety improvements. The HSIP will continue to save lives and prevent serious injuries for all road users, including pedestrians and bicyclists. Data from 2013 indicates that 32,719 people died on the nation’s highways. The Department must continue to take action to address this serious public safety problem. The financial burden of highway crashes is at least $277 billion per year – a sign of the economic magnitude of highway crashes. Why Do We Need To Fund The Program At The Requested Level? The $2.56 billion request for HSIP represents a increase in existing funding to maintain the substantial benefits of the HSIP and add dedicated funding for safety data. Since safety is the Department’s top priority, it is critical that sufficient resources are provided to achieve an even better safety record on U.S. highways. What Benefits Will Be Provided To The American Public Through This Request? This program saves lives and reduces serious injuries for all road users. The number of highway-related fatalities decreased nearly 25 percent between 2005 and 2013. This decrease in highway fatalities coincides with the establishment of the HSIP as a core Federal-Aid program and its integration with other safety programs across the Department. An extrapolation of the data indicates that the full benefits of a $2.56 billion annual program are 5,700 lives saved and 19,000 serious injuries prevented. A single death on our roadways, sidewalks, or bicycles paths is a tragedy; almost 90 deaths a day is unacceptable when we possess the tools and capability to help prevent them. This program will significantly reduce deaths and serious injuries for all road users. This data-driven, coordinated approach has played a significant role in achieving the nearly 25 percent reduction in highway fatalities and serious injuries in 2013 when compared to 2005, the year that the HSIP was enacted.
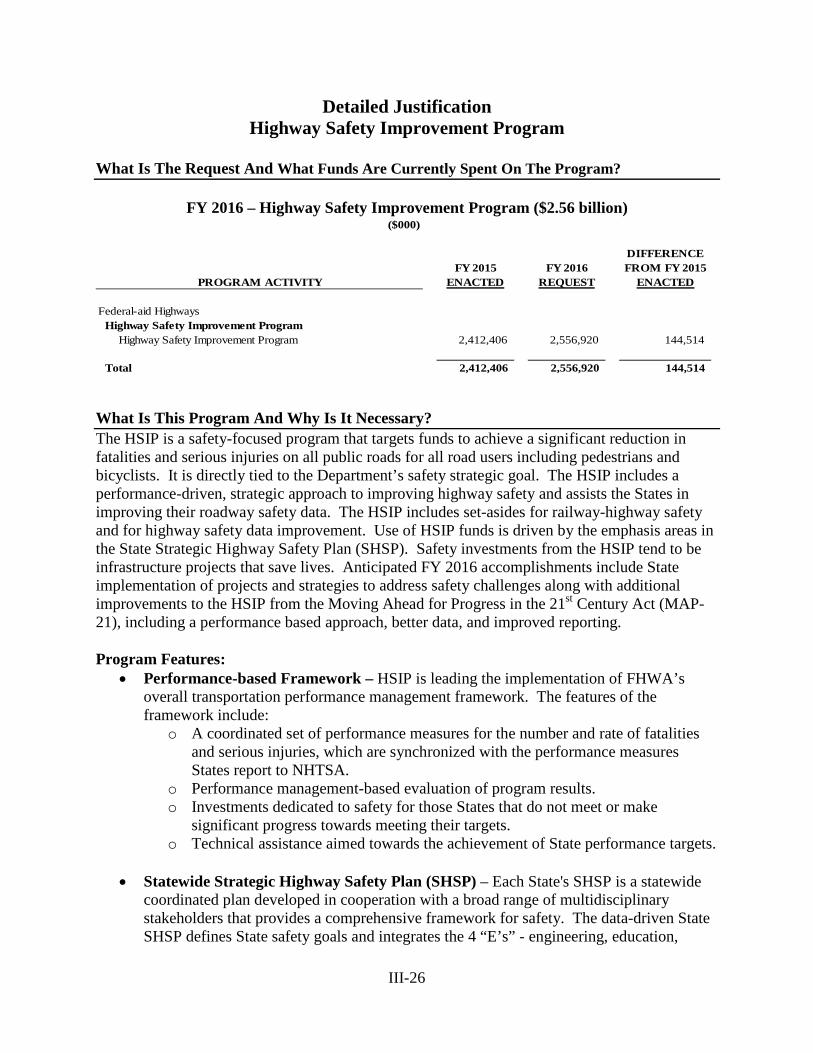
III-26
Detailed Justification Highway Safety Improvement Program
What Is The Request And What Funds Are Currently Spent On The Program?
FY 2016 – Highway Safety Improvement Program ($2.56 billion)
($000)
DIFFERENCEFY 2015 FY 2016 FROM FY 2015
PROGRAM ACTIVITY ENACTED REQUEST ENACTED
Federal-aid HighwaysHighway Safety Improvement Program
Highway Safety Improvement Program 2,412,406 2,556,920 144,514
Total 2,412,406 2,556,920 144,514
What Is This Program And Why Is It Necessary? The HSIP is a safety-focused program that targets funds to achieve a significant reduction in fatalities and serious injuries on all public roads for all road users including pedestrians and bicyclists. It is directly tied to the Department’s safety strategic goal. The HSIP includes a performance-driven, strategic approach to improving highway safety and assists the States in improving their roadway safety data. The HSIP includes set-asides for railway-highway safety and for highway safety data improvement. Use of HSIP funds is driven by the emphasis areas in the State Strategic Highway Safety Plan (SHSP). Safety investments from the HSIP tend to be infrastructure projects that save lives. Anticipated FY 2016 accomplishments include State implementation of projects and strategies to address safety challenges along with additional improvements to the HSIP from the Moving Ahead for Progress in the 21st Century Act (MAP-21), including a performance based approach, better data, and improved reporting. Program Features:
• Performance-based Framework – HSIP is leading the implementation of FHWA’s overall transportation performance management framework. The features of the framework include:
o A coordinated set of performance measures for the number and rate of fatalities and serious injuries, which are synchronized with the performance measures States report to NHTSA.
o Performance management-based evaluation of program results. o Investments dedicated to safety for those States that do not meet or make
significant progress towards meeting their targets. o Technical assistance aimed towards the achievement of State performance targets.
• Statewide Strategic Highway Safety Plan (SHSP) – Each State's SHSP is a statewide
coordinated plan developed in cooperation with a broad range of multidisciplinary stakeholders that provides a comprehensive framework for safety. The data-driven State SHSP defines State safety goals and integrates the 4 “E’s” - engineering, education,
III-27
enforcement and emergency services. The States are guided by the plan and their data in using HSIP and other funds to solve relevant safety problems and save lives. The SHSP provides the overarching strategic framework within which the annual, more tactically oriented, NHTSA and FMCSA plans can be developed.
• Data and Analysis – As part of the HSIP, States are required to develop and maintain a
safety data system or advance their capabilities to collect, maintain, and share a record of safety data on all public roads for all road users including pedestrians and bicyclists; create or enhance a highway basemap of all public roads; develop analytical processes for safety data elements; acquire and implement roadway safety analysis tools; identify roadway features that constitute a danger to all road users and perform safety problem identification and countermeasure analysis.
• HSIP Reporting and Evaluation – Each State prepares an annual report on their
highway safety improvement program that describes the projects implemented under the program, assesses the effectiveness of those projects and describes the extent to which the funded improvements contribute to reducing the number and rate of fatalities and serious injuries on all public roads in the State. The results feed the next iteration of the SHSP.
• High-Risk Rural Roads (HRRR) – If the fatality rate on rural roads in a State increases over the most recent 2-year period for which data are available, that State will be required to obligate in the following year an amount equal to at least 200 percent of the amount of funds the State received for FY 2009 for high-risk rural roads.
• Older Drivers and Pedestrians – If traffic fatalities and serious injuries per capita for drivers and pedestrians age 65 and older in a State increases during the most recent 2-year period for which data are available, that State shall be required to include, in the subsequent SHSP, strategies to address the increases in those rates, taking into account the recommendations included in FHWA’s latest “Highway Design Handbook for Older Drivers and Pedestrians”.
• Railway-Highway Crossing Funds – $220 million of HSIP funds are set aside to
address safety at railway-highway crossings.
Highway Safety Data Improvement – $100 million of HSIP funds are set aside to ensure States have the most complete and reliable highway safety data to make the most cost effective infrastructure design decisions with the greatest safety payoff. The program primarily focuses on roadway inventory data. This set aside bolsters the data-driven principles of the HSIP; supports the data collection, management and maintenance of the roadway safety data elements required under MAP-21 and implemented in the updated HSIP regulation; enables the collection and maintenance of roadway safety data on horizontal curves, at which 1 in 6 motor vehicle fatalities occur; and supports more routine and effective program evaluation.
III-28
Why Do We Need To Fund The Program At The Requested Level? The $2.56 billion request for HSIP represents a modest increase in existing funding to maintain the substantial benefits of the HSIP and dedicate additional funding to Highway Safety Data Improvement. Since safety is the Department’s top priority, it is critical that sufficient resources are provided to achieve a better safety record on U.S. highways. The HSIP is the main instrument for infrastructure safety for achieving the goal of reduced fatalities and serious injuries. The Department of Transportation (DOT)’s Safety Goal is to improve public health and safety by reducing transportation related fatalities and injuries for all transportation users, working toward no fatalities across all modes of travel. Achieving this goal requires undertaking various strategies in the focus areas of safer vehicles, safer driver behavior, and safer highway infrastructure. In MAP-21 the Congress supported that vision by confirming the purpose of HSIP - “to achieve a significant reduction in traffic fatalities and serious injuries”. The Department’s reauthorization proposal and this budget request work to achieve this goal. FHWA contributes a large portion towards the achievement of the Safety Goal through the close working relationship with other safety modes, State, Tribal, and local governments, and other partners. While NHTSA and FMCSA focus their resources on improved vehicle and user safety, FHWA concentrates on ensuring the safety of the highway infrastructure. This balance of coordinated efforts enables the DOT modes to concentrate on their areas of expertise while working towards a single goal. This coordination encourages and enables greater unity of effort. Coupled with a comprehensive focus on shared reliable safety data, the efforts of all modes will ensure that the federal efforts are implemented to their greatest potential. The SHSP process has fostered an unprecedented level of partnership among a variety of safety stakeholders. As life-saving initiatives are identified the demand for dedicated safety resources grows. Furthermore, with an additional emphasis on safety and roadway design characteristics data, States will be able to more effectively use existing and future analysis tools for problem identification, trend analysis, safety projects, and systemic improvement planning. The Highway Safety Data Improvement set aside is based on the annual cost for States to collect all the Model Inventory of Roadway Elements Fundamental Data Elements required in the updated HSIP regulation and the annual costs to maintain that data. Further, the set aside will enable States to collect even more roadway element data to further improve analyses. The costs to collect the next most pressing roadway safety data need – inventories of horizontal curves, at which 1 in 6 motor vehicle fatalities occur – is also included. Finally, this set aside will support more routine and effective program evaluation by funding States to develop and maintain inventories of implemented safety treatments and share that information with other States.
Safety infrastructure investments are effective and cost-beneficial. FHWA identifies and promotes proven safety countermeasures that have a demonstrated ability to reduce crashes. FHWA helps document these at the Crash Modification Clearinghouse (http://www.cmfclearinghouse.org), a Web-based database with supporting documentation to help transportation engineers identify the most appropriate countermeasure for their safety needs. A crash modification factor (CMF) is a multiplicative factor used to compute the expected number of crashes after implementing a given countermeasure at a specific site. For example, the
III-29
installation of centerline rumble strips on a 2-lane roadway can lead to a 14 percent reduction in all crashes and a 55 percent reduction in head-on crashes. Cable median barriers on multi-lane divided roadways can reduce injury crashes by 29 percent. FHWA, as summarized at http://safety.fhwa.dot.gov/hsm/, invests more than $1 million per year to provide outreach guidance, technical support, training, and case studies on the use of the Highway Safety Manual, the CMF Clearinghouse and other related analysis tools such as the systemic safety project selection tool (http://safety.fhwa.dot.gov/systemic/) to support more scientifically rigorous safety investment decision making. FHWA also works with State and local agencies to improve the safety data systems that are the foundation for data-driven, evidence based decision-making. What Benefits Will Be Provided To The American Public Through This Request? HSIP could reduce fatalities by at least 570 per year and serious injuries by at least 1,900 per year and is estimated to save more than 5,700 lives and 19,000 serious injuries over the average 10-year lifecycle of the safety infrastructure countermeasures funded by the HSIP. Funding the program at a lower level would reduce the States’ ability to make the most effective safety investment decisions and result in fewer safety investments. Therefore, less funding will result in fewer lives saved and fewer serious injuries prevented. The $2.56 billion HSIP provides an economic benefit of over $50 billion, a benefit-cost ratio of roughly 20 to 1. A single death on our roadways, sidewalks and bicycles paths is a tragedy; almost 90 deaths a day is unacceptable when we possess the tools and capability to help prevent them. This program will significantly reduce deaths and serious injuries for all road users. This data-driven, coordinated approach has played a significant role in achieving a nearly 25 percent reduction in highway fatalities and serious injuries in 2013 when compared to 2005, the year that the HSIP was enacted.

III-30
This Page Left Blank Intentionally
III-31
Executive Summary National Highway Performance Program
What Is The Request And What Funds Are Currently Spent On The Program? The budget requests $22.31 billion for the National Highway Performance Program (NHPP) to improve the condition and performance of the National Highway System (NHS). A key component of the NHPP includes performance management requirements to focus Federal-aid investments to support progress toward the achievement of performance targets for the NHS. These requirements hold States accountable for achieving performance targets while giving them the flexibility to make transportation investment decisions. The request is a slight increase over the FY 2015 annualized funding level of $21.91 billion. What Is This Program And Why Is It Necessary? The NHPP provides funds to the States on a formula basis. Its purpose is to preserve and improve the NHS. Due to expected population and economic growth, freight and passenger transportation demands are projected to increase 250 percent by 2050. Modernizing and preserving an efficient transportation system in this environment are critical to maintain the competitiveness of our economy. In 2014, 59 percent of vehicle miles travelled on the NHS occurred on pavements with good ride quality. The condition of pavement and bridges across the country varies considerably as many States struggle to maintain current conditions. Investment in our nation’s transportation infrastructure is needed right now if we expect to maintain a global competitive edge. Why Do We Need To Fund The Program At The Requested Level? In FY 2016, the NHPP will need to be funded at $22.31 billion in order to make improvements toward achieving a state of good repair and improved operations on the NHS, consistent with the analyses presented in the biennial Status of the Nation’s Highways, Bridges, and Transit: Conditions and Performance report to Congress (2013 C&P report). Maintaining a state of good repair on the NHS minimizes more costly improvements needed if the infrastructure is allowed to deteriorate. What Benefits Will Be Provided To The American Public Through This Request? Preserving and improving the NHS keeps America’s highways and bridges safe, supports U.S. competitiveness in world trade, and improves the U.S. economy. It binds the country together by making it possible for Americans to visit other parts of the country and to see the wonders it contains. The NHPP emphasizes preservation of the NHS while giving States flexibility to make additional investments to enhance NHS condition and operational performance and to build new capacity. The NHPP addresses all areas of the United States including mobility and access in rural areas, ensuring that improvements to the NHS benefit both urban and rural settings.
III-32
Detailed Justification National Highway Performance Program
What Is The Request And What Funds Are Currently Spent On The Program?
FY 2016 – National Highway Performance Program ($22.31 billion)
($000)
DIFFERENCEFY 2015 FY 2016 FROM FY 2015
PROGRAM ACTIVITY ENACTED REQUEST ENACTED
Federal-aid HighwaysNational Highway Performance Program
National Highway Performance Program 1/ 21,908,178 22,312,599 404,421
Total 21,908,178 22,312,599 404,421
1/ $639 million in each fiscal year is exempt from obligation limitation of which $47 million was sequestered in FY 2015 (sequestration not reflected in table).
What Is This Program And Why Is It Necessary? The NHPP is a formula-based program that supports the Department’s state of good repair outcome to increase the proportion of highways and bridges in good physical and operating condition. It helps to keep our roads and bridges safe; improves our Nation’s competitiveness in global trade; and maximizes the economic returns from transportation policies and investments. The NHPP program provides funding to preserve and improve the NHS. This justification requests that the NHPP be funded at $22.31 billion to continue progress towards achieving a state of good repair on the NHS. The structure of the NHPP in the President’s GROW AMERICA reauthorization proposal mirrors that in MAP-21. Key features of the program include:
• focus on improving and preserving the NHS; • a performance-based framework; • increased flexibility to the States for making transportation investment decisions; and • requirements for risk-based asset management plans.
The National Highway System (NHS) The Federal Government has periodically defined and focused resources on the roads that were critical to national interests and that enhanced mobility, security, economic growth and quality of life. Each time, the decision was made to emphasize a limited network of roads of critical national priority – the Federal-aid system (1921), the Interstate System (1956), and the National Highway System (1991). MAP-21 redefined, and the GROW AMERICA Act continues, the NHS as a network composed of the Interstate System, all principal arterials, intermodal connectors, and roads important to national defense.
III-33
The NHS now totals approximately 220,000 miles. The NHS provides mobility to the vast majority of the Nation’s population and almost all of its commerce. It supports national defense and promotes intermodal connectivity. While NHS mileage accounts for a small portion of the nation's overall public road mileage, it carries 58 percent of all vehicular traffic and the majority of truck-borne freight uses it at some point in its journey. While it comprises 53 percent of U.S. highway border crossings, it handles 98 percent of the value of total truck trade with Canada and Mexico. The key elements of NHS include:
• Principal Arterials (including the Interstate System) serving regional and national needs as conduits for major traffic flow and freight movement. In urban areas, all high volume corridors are included in the NHS. In rural areas, the NHS carries over 47 percent of all vehicle miles traveled and provides critical access for jobs, health care, and commerce.
• Intermodal Connectors providing access between major intermodal facilities and the principal arterial system. These roads are often the important “last mile” connecting critical intermodal facilities, such as rail, bus, ports, etc. This also provides critical access for jobs, health care, and commerce.
• Strategic Highway Network Roadways (STRAHNET) providing defense access, network continuity and emergency capabilities for defense purposes. It contains all of the routes, including connectors to major military installations, designated by the Department of Defense as essential for national defense. This significantly contributes to public health and safety.
• Border Crossings on Principal Arterials providing vital links with our largest trading partners. Maintaining efficient and effective transportation system connections to U.S. ports of entry is essential for global competitiveness and U.S. economic growth.
The NHPP requires a risk-based asset management approach to ensure that States have a strategic and systematic process for operating, preserving, and improving physical assets on the NHS. It focuses on engineering and economic analysis using quality information to identify a structured sequence of maintenance, repair, rehabilitation, and replacement actions that will achieve a desired state of good repair over the lifecycle of the assets at minimum possible cost. The intent of this approach is to better manage system condition and performance. Eligibility: NHPP projects must be on an eligible facility and support progress toward achievement of national performance goals for improving infrastructure condition, safety, mobility, or freight movement on the NHS, and be consistent with metropolitan and statewide planning requirements. Eligible activities include:
• Construction, reconstruction, resurfacing, restoration, rehabilitation, preservation, operational improvements, and protection against extreme events of NHS segments.
• Construction, replacement (including replacement with fill material), rehabilitation, preservation, and protection (including scour countermeasures, seismic retrofits, impact protection measures, security countermeasures, and protection against extreme events) of NHS bridges and tunnels.
• Bridge and tunnel inspection and evaluation on the NHS and inspection and evaluation of other NHS highway infrastructure assets.
III-34
• Training of bridge and tunnel inspectors. • Construction, rehabilitation, or replacement of existing ferry boats and facilities,
including approaches that connect road segments of the NHS. • Construction, reconstruction, resurfacing, restoration, rehabilitation, and preservation of,
and operational improvements for, a Federal-aid highway not on the NHS, and construction of a transit project eligible for assistance under chapter 53 of title 49, if the project is in the same corridor and in proximity to a fully access-controlled NHS route, if the improvement is more cost-effective (as determined by a benefit-cost analysis) than an NHS improvement, and will reduce delays or produce travel time savings on the NHS route and improve regional traffic flow.
• Bicycle transportation and pedestrian walkways. • Highway safety improvements on the NHS. • Capital and operating costs for traffic and traveler information, monitoring, management,
and control facilities and programs. • Development and implementation of a State Asset Management Plan for the NHS
including data collection, maintenance and integration, software costs, and equipment costs.
• Infrastructure-based ITS capital improvements. • Environmental restoration and pollution abatement. • Control of noxious weeds and establishment of native species. • Environmental mitigation related to NHPP projects. • Construction of publicly owned intracity or intercity bus terminals servicing the NHS. • Installation of broadband infrastructure as part of a Federal-aid highway project as
proposed in the GROW AMERICA Act. Funding: FHWA proposes to continue to finance NHPP from the Highway Account of the Transportation Trust Fund (currently the Highway Trust Fund). Funds are subject to the overall Federal-aid obligation limitation. Funds are apportioned by formula. State DOTs can spend NHPP funds on eligible projects on the NHS subject to meeting the performance targets. Projects must be included in the Statewide Transportation Improvement Program (STIP) and in the Transportation Improvement Program (TIP) for urbanized areas. Two percent from each State’s NHPP apportionment is set aside for State Planning and Research (SP&R). Federal Share: The Federal government generally provides 90 percent of eligible project costs of projects on the Interstate system that do not add single occupant vehicle capacity. Otherwise, the federal share is generally 80 percent of eligible project costs of projects on the NHS. Why Do We Need To Fund The Program At The Requested Level? In FY 2016, the NHPP program will need to be funded at $22.31 billion in order to continue progress in achieving a state of good repair and improved operations of the NHS.
III-35
Previous programs that were focused on the NHS significantly improved the condition of the NHS. The NHPP program will continue to focus federal funds to address national performance goals for the NHS. Among these are the condition of pavements and bridges. Past performance has demonstrated that sustained investment in our Nation’s roads and bridges leads to better roadway and bridge conditions. A couple examples of this include:
• The share of travel on NHS pavements with good ride quality rose from 48 percent in 2001 to 59 percent in 2014 despite MAP-21 increasing NHS mileage by almost 60,000 miles. Bringing pavements up to a state of good repair yields benefits to system users in the form of decreased wear and tear on vehicles and resulting repair costs; reduced traveler delays; and lower crash rates.
• Even as the total number of NHS bridges in the Nation's inventory increased from
115,247 to 143,165, the percentage of NHS bridges classified as structurally deficient dropped from 5.7 percent in 2005 to 4.2 percent in 2014. Similarly, the percentage of the deck area (considering bridge size) on NHS bridges classified as structurally deficient has dropped from 8.5 percent in 2005 to 6.0 percent in 2014.
In addition to continued funding, the NHPP has provisions to ensure that States invest their NHPP funds in NHS infrastructure and operations to support the achievement of NHS condition and performance targets. States are also required to develop asset management plans that monitor and evaluate the condition of the NHS and optimize the use of the NHPP funds to improve them. In 2014, 59 percent of NHS vehicle miles travelled occurred on pavements with good ride quality. As shown in Chart A, the proposed GROW AMERICA investment level for the NHPP program is projected to increase this share to almost 68 percent by 2021. This forecast is based on analyses developed for the biennial C&P report, and assumes a mix of highway and bridge investments generally consistent with recent trends.
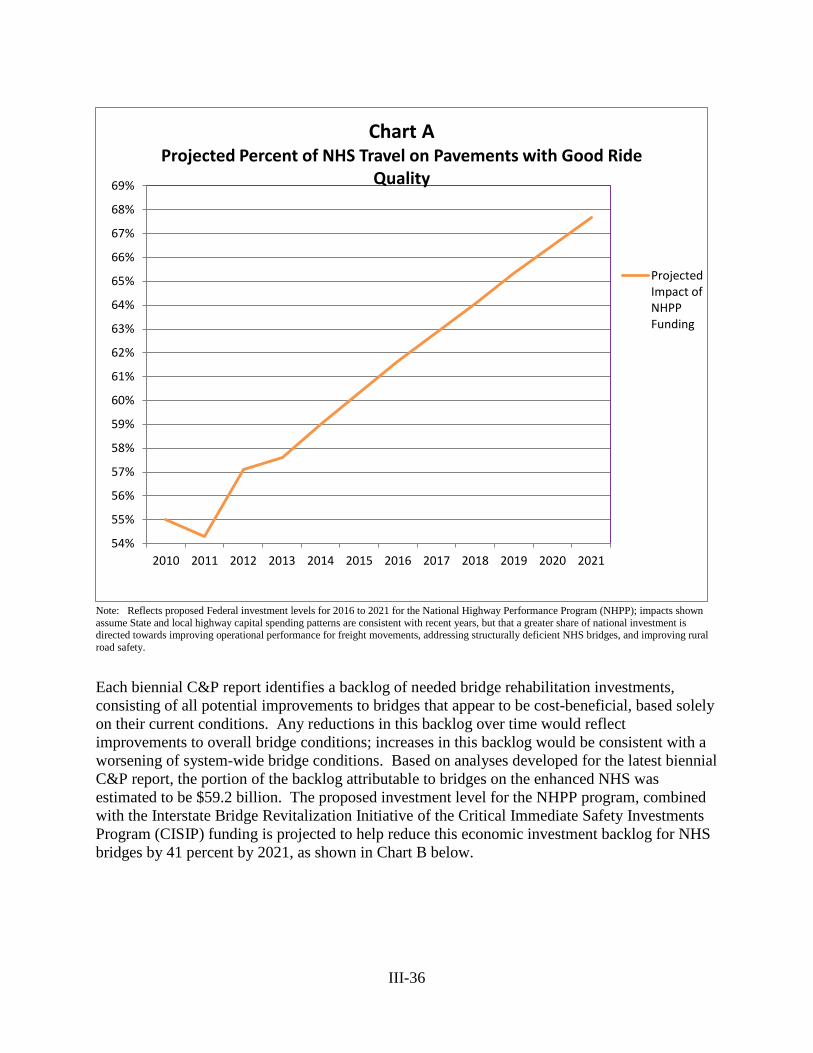
III-36
Note: Reflects proposed Federal investment levels for 2016 to 2021 for the National Highway Performance Program (NHPP); impacts shown assume State and local highway capital spending patterns are consistent with recent years, but that a greater share of national investment is directed towards improving operational performance for freight movements, addressing structurally deficient NHS bridges, and improving rural road safety. Each biennial C&P report identifies a backlog of needed bridge rehabilitation investments, consisting of all potential improvements to bridges that appear to be cost-beneficial, based solely on their current conditions. Any reductions in this backlog over time would reflect improvements to overall bridge conditions; increases in this backlog would be consistent with a worsening of system-wide bridge conditions. Based on analyses developed for the latest biennial C&P report, the portion of the backlog attributable to bridges on the enhanced NHS was estimated to be $59.2 billion. The proposed investment level for the NHPP program, combined with the Interstate Bridge Revitalization Initiative of the Critical Immediate Safety Investments Program (CISIP) funding is projected to help reduce this economic investment backlog for NHS bridges by 41 percent by 2021, as shown in Chart B below.
54%
55%
56%
57%
58%
59%
60%
61%
62%
63%
64%
65%
66%
67%
68%
69%
2010 2011 2012 2013 2014 2015 2016 2017 2018 2019 2020 2021
Chart A Projected Percent of NHS Travel on Pavements with Good Ride
Quality
ProjectedImpact ofNHPPFunding
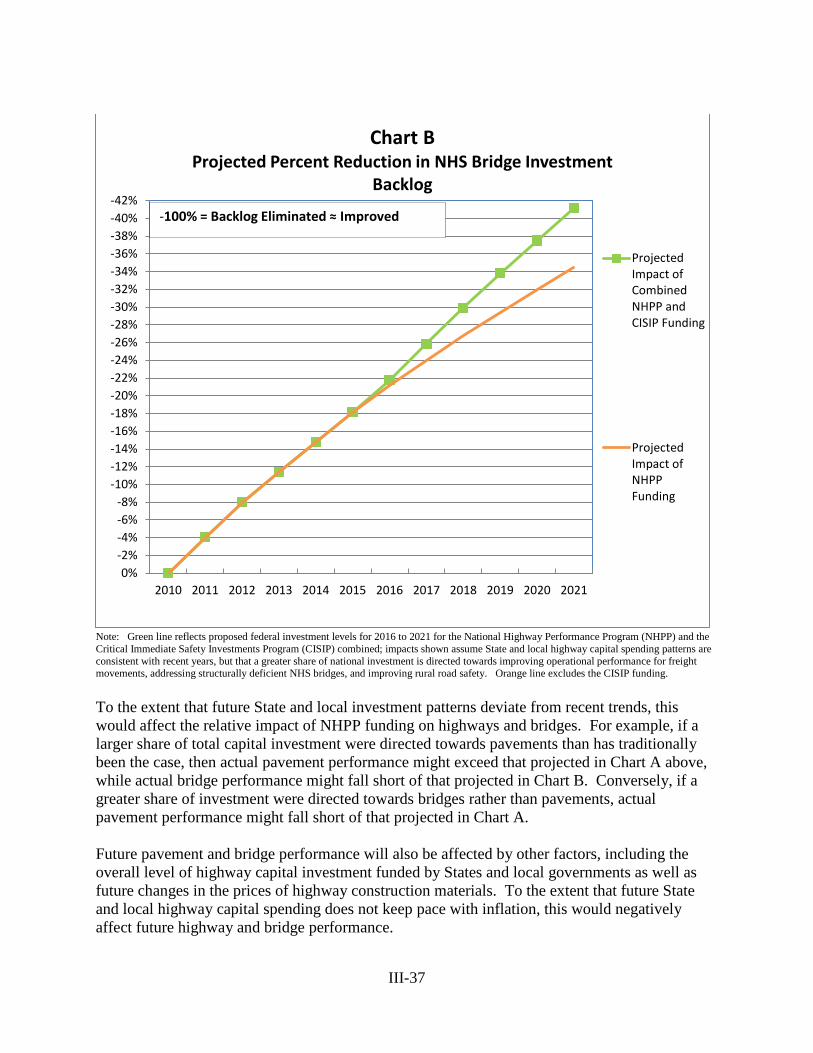
III-37
Note: Green line reflects proposed federal investment levels for 2016 to 2021 for the National Highway Performance Program (NHPP) and the Critical Immediate Safety Investments Program (CISIP) combined; impacts shown assume State and local highway capital spending patterns are consistent with recent years, but that a greater share of national investment is directed towards improving operational performance for freight movements, addressing structurally deficient NHS bridges, and improving rural road safety. Orange line excludes the CISIP funding. To the extent that future State and local investment patterns deviate from recent trends, this would affect the relative impact of NHPP funding on highways and bridges. For example, if a larger share of total capital investment were directed towards pavements than has traditionally been the case, then actual pavement performance might exceed that projected in Chart A above, while actual bridge performance might fall short of that projected in Chart B. Conversely, if a greater share of investment were directed towards bridges rather than pavements, actual pavement performance might fall short of that projected in Chart A. Future pavement and bridge performance will also be affected by other factors, including the overall level of highway capital investment funded by States and local governments as well as future changes in the prices of highway construction materials. To the extent that future State and local highway capital spending does not keep pace with inflation, this would negatively affect future highway and bridge performance.
-42%-40%-38%-36%-34%-32%-30%-28%-26%-24%-22%-20%-18%-16%-14%-12%-10%
-8%-6%-4%-2%0%
2010 2011 2012 2013 2014 2015 2016 2017 2018 2019 2020 2021
Chart B Projected Percent Reduction in NHS Bridge Investment
Backlog
ProjectedImpact ofCombinedNHPP andCISIP Funding
ProjectedImpact ofNHPPFunding
-100% = Backlog Eliminated ≈ Improved
III-38
What Benefits Will Be Provided To The American Public Through This Request? Preserving and improving the NHS keeps America’s highways and bridges safe, supports U.S. economic world trade competiveness, and improves the U.S. economy. The NHPP emphasizes preservation of the NHS while giving States the flexibility to make additional investments to enhance NHS condition and operational performance and to build new capacity. The NHPP addresses all areas of the United States, including mobility and access in rural areas, ensuring that improvements to the NHS benefit both urban and rural settings.
III-39
Executive Summary Surface Transportation Program
What Is The Request And What Funds Are Currently Spent On The Program? The $10.26 billion requested for the Surface Transportation Program (STP) in FY 2016 provides flexible funding that may be used by States and localities for projects to preserve and improve the condition and performance on any Federal-aid highway, bridges on any public road, and transit capital projects, including intercity bus terminals and vehicles. This request is a slight increase over the FY 2015 annualized funding level of $10.08 billion. What Is This Program And Why Is It Necessary? The STP is a formula-based program that helps States and localities to invest in Federal-aid highways. A safe and efficient transportation system is critical for saving lives, reducing injuries, and maintaining the competitiveness of the U.S. economy. The highly developed U.S. transportation system played a key role in allowing GDP per capita to grow faster in the U.S. over the past century than in countries with less developed transportation systems. Additional transportation infrastructure investment is needed to maintain the nation’s global competitive edge. The STP program is the most flexible of FHWA’s core highway programs. Whereas the National Highway Performance Program (NHPP) program is limited to the approximately 220,000 mile NHS; the STP program is available for the roughly 1,000,000 miles of Federal-aid highways (including bridges), for bridges on any public road and for transit capital projects. The STP program expands on the eligibilities included in the NHPP. This program gives transportation agencies the ability to target funding to address State and local priorities. Why Do We Need To Fund The Program At The Requested Level? In FY 2016, the STP program will need to be funded at $10.26 billion to make progress towards improving the condition and performance of Federal-aid highways. This program provides flexible funding that States and localities can use for projects to preserve and improve the condition and performance on any Federal-aid highway, bridges on any public road, and transit capital projects, including intercity bus terminals and vehicles. What Benefits Will Be Provided To The American Public Through This Request? A safe and efficient transportation system is critical for saving lives, reducing injuries, and maintaining the competitiveness of the U.S. economy. The highly developed U.S. transportation system played a key role in allowing GDP per capita to grow faster during the past century in the U.S. than in countries with less developed transportation systems. However, additional transportation infrastructure investment is needed to sustain economic growth. The STP is the most flexible of FHWA’s core highway programs. This flexibility provides transportation agencies with the ability to target funding to State and local priorities. It would also provide incentives for improved decision making by Metropolitan Planning Organizations (MPOs) serving urbanized areas over 200,000 in population by encouraging more equitable and regional approaches to decision making.
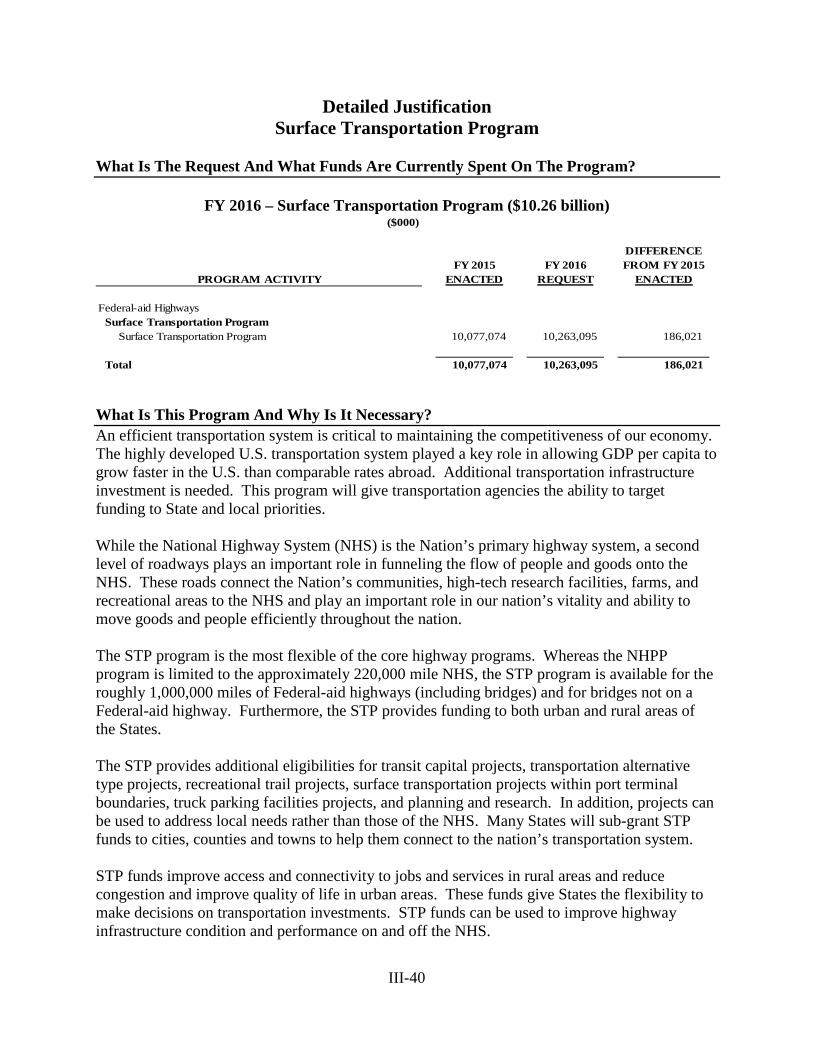
III-40
Detailed Justification Surface Transportation Program
What Is The Request And What Funds Are Currently Spent On The Program?
FY 2016 – Surface Transportation Program ($10.26 billion)
($000)
DIFFERENCEFY 2015 FY 2016 FROM FY 2015
PROGRAM ACTIVITY ENACTED REQUEST ENACTED
Federal-aid HighwaysSurface Transportation Program
Surface Transportation Program 10,077,074 10,263,095 186,021
Total 10,077,074 10,263,095 186,021
What Is This Program And Why Is It Necessary? An efficient transportation system is critical to maintaining the competitiveness of our economy. The highly developed U.S. transportation system played a key role in allowing GDP per capita to grow faster in the U.S. than comparable rates abroad. Additional transportation infrastructure investment is needed. This program will give transportation agencies the ability to target funding to State and local priorities. While the National Highway System (NHS) is the Nation’s primary highway system, a second level of roadways plays an important role in funneling the flow of people and goods onto the NHS. These roads connect the Nation’s communities, high-tech research facilities, farms, and recreational areas to the NHS and play an important role in our nation’s vitality and ability to move goods and people efficiently throughout the nation. The STP program is the most flexible of the core highway programs. Whereas the NHPP program is limited to the approximately 220,000 mile NHS, the STP program is available for the roughly 1,000,000 miles of Federal-aid highways (including bridges) and for bridges not on a Federal-aid highway. Furthermore, the STP provides funding to both urban and rural areas of the States. The STP provides additional eligibilities for transit capital projects, transportation alternative type projects, recreational trail projects, surface transportation projects within port terminal boundaries, truck parking facilities projects, and planning and research. In addition, projects can be used to address local needs rather than those of the NHS. Many States will sub-grant STP funds to cities, counties and towns to help them connect to the nation’s transportation system. STP funds improve access and connectivity to jobs and services in rural areas and reduce congestion and improve quality of life in urban areas. These funds give States the flexibility to make decisions on transportation investments. STP funds can be used to improve highway infrastructure condition and performance on and off the NHS.
III-41
The STP provides funds to the States to invest in Federal-aid eligible highways to replace, rehabilitate, and preserve roads, bridges, and other highway infrastructure and to expand or build new transportation facilities. The STP provides a set-aside to rehabilitate or replace bridges on public roads that are not located on a Federal-aid highway. Other illustrative activities include the following: the removal of bottlenecks; projects and strategies to support congestion pricing, electronic toll collection, and travel demand management strategies and programs; collection and dissemination of real-time travel information; deployment and integration of Intelligent Transportation System (ITS) technologies; and greater use of traffic incident management practices in corridors. Additionally, these funds will help to enhance access to educational opportunities, health care, recreation, and other quality of life needs in rural areas. A long term commitment to funding this program has resulted in the following benefits:
• The share of vehicle miles travelled on the 1,000,000 miles of Federal-aid highways occurring on pavements with good ride quality rose from 43 percent in 2000 to 45 percent in 2013.
• Over the last decade, even as the total number of bridges in the Nation's inventory increased from 594,100 to 607,751, the percentage of bridges classified as structurally deficient dropped from 13.5 percent in 2004 to 10.5 percent in 2013. Similarly, the percentage of the deck area (considering bridge size) on bridges classified as structurally deficient has dropped from 10.1 percent in 2004 to 7.7 percent in 2013.
STP funds are generally limited to projects on Federal-aid highways that include those public roads that are not functionally classified as rural minor collectors or local roads. Federal-aid highways are roads on the National Highway System (including the Interstate system), other arterial roads, urban collectors, and major rural collectors. It accounts for approximately one million of the Nation’s four million miles of public roads. Despite its focus on the higher classification roadways, 23 U.S.C., as amended by MAP-21, contains several exceptions that include:
• Set-aside funding for bridges on public roads that are not located on a Federal-aid highway.
• States may use up to 15 percent of the funds suballocated for areas with a population of less than 5,000 on rural minor collectors.
• Funds may be used for Appalachian local access roads designated in 40 U.S.C. 14501. Eligibility:
• Construction, reconstruction, rehabilitation, resurfacing, restoration, preservation, or operational improvements for highways, including designated routes of the Appalachian Development Highway System (ADHS) and local access roads under 40 U.S.C. 14501.
• Replacement, rehabilitation, preservation, protection, and anti-icing/deicing for bridges and tunnels on any public road, including construction or reconstruction necessary to accommodate other modes.
• Construction of new bridges and tunnels on a Federal-aid highway.
III-42
• Inspection and evaluation of bridges, tunnels and other highway assets as well as training for bridge and tunnel inspectors.
• Capital costs for transit projects eligible for assistance under chapter 53 of title 49, including vehicles and facilities used to provide intercity passenger bus service.
• Carpool projects, fringe and corridor parking facilities and programs, including electric and natural gas vehicle charging infrastructure, bicycle transportation and pedestrian walkways, and modification of public sidewalks to comply with the Americans with Disabilities Act.
• Highway and transit research, development, technology transfer. • Capital and operating costs for traffic monitoring, management, and control facilities and
programs, including advanced truck stop electrification. • Surface transportation planning. • Projects that are eligible under the Transportation Alternatives Program. • Transportation control measures. • Development and establishment of management systems. • Environmental mitigation efforts. • Intersections with high accident rates or levels of congestion. • ITS capital improvements. • Environmental restoration and pollution abatement. • Control of noxious weeds and establishment of native species. • Congestion pricing projects and strategies, including electric toll collection and travel
demand management strategies and programs. • Recreational trails projects. • Construction of ferry boats and terminals. • Border infrastructure projects. • Truck parking facilities. • Development and implementation of State asset management plan for the NHS, and
similar activities related to the development and implementation of a performance-based management program for other public roads.
• Surface transportation infrastructure modifications within port terminal boundaries, only if necessary to facilitate direct intermodal interchange, transfer, and access into and out of the port.
• Construction and operational improvements for a minor collector in the same corridor and in proximity to an NHS route if the improvement is more cost-effective (as determined by a benefit-cost analysis) than an NHS improvement and will enhance NHS level of service and regional traffic flow.
• Administrative and stewardship expenses incurred by State DOTs for oversight of locally administered projects.
• Activities to evaluate the potential impacts of climate change and extreme weather events, and develop and apply adaptation strategies at both the project and system levels.
• Installation of broadband infrastructure as part of a Federal-aid highway project as proposed in the GROW AMERICA Act.
• Workforce development, training, and education activities that are in accordance with 23 U.S.C. 504(e).
III-43
• Construction of any bridge in accordance with 23 U.S.C. 144(f) that replaces any low water crossing (regardless of the length of the low water crossing); any bridge that was destroyed prior to January 1, 1965; any ferry that was in existence on January 1, 1984; or any road bridge that is rendered obsolete as a result of a Corps of Engineers flood control or channelization project and is not rebuilt with funds from the Corps of Engineers.
• Actions in accordance with the definition and conditions in 23 U.S.C. 144(g) to preserve or reduce the impact of a project on the historic integrity of a historic bridge if the load capacity and safety features of the historic bridge are adequate to serve the intended use for the life of the historic bridge.
Funding: FHWA proposes to continue to finance STP from the Highway Account of the Transportation Trust Fund (currently the Highway Trust Fund). Funds are subject to the overall Federal-aid obligation limitation. The following amounts are set aside from each State’s STP apportionment:
• 2 percent for State Planning and Research (SP&R). • 15 percent of the State’s FY 2009 Highway Bridge Program apportionment for off-
system bridges. This set aside may not be taken from the suballocations described below.
The STP includes a suballocation of 50 percent of a State’s annual apportionment, after the SP&R set-aside, to be obligated in the following areas in proportion to their relative shares of a State’s population--
• Urbanized areas with population greater than 200,000 – This portion is divided among those areas based on their relative share of population, unless the Secretary approves a joint request from the State and relevant MPO(s) to use other factors.
• Areas with population greater than 5,000 but less than 200,000. • Areas with population of 5,000 or less.
The remaining 50 percent may be used in any area of the State. An MPO serving an urbanized area with a population over 200,000 that meets certain geographic and governance best practices criteria may request designation by the Secretary as a high performing MPO and would receive suballocations of STP funds that are 50% higher than they would otherwise receive. Federal Share: The Federal Government will provide up to 80 percent of the total project cost. Why Do We Need To Fund The Program At The Requested Level? In FY 2016, the STP program will need to be funded at $10.26 billion to make progress in achieving improved conditions and performance of Federal-aid highways. We request $10.26 billion, which will provide flexible funding that may be used by States and localities for projects to preserve and improve the condition and performance on any Federal-aid
III-44
highway, bridges on any public road, and transit capital projects, including intercity bus terminals and vehicles. What Benefits Will Be Provided To The American Public Through This Request? An efficient transportation system is critical to maintaining the competitiveness of our economy. The highly developed U.S. transportation system played a key role in allowing GDP per capita to grow faster in the U.S. over the past century than in countries with less developed transportation systems. However, additional transportation infrastructure investment is needed to support a globally competitive economy. The STP is the most flexible of the core highway programs. This flexibility provides transportation agencies with the ability to target funding to State and local priorities. Furthermore, the STP targets a significant portion of the funds to both rural and urban areas ensuring that all areas of the U.S. have an opportunity to improve their transportation priorities.
III-45
Executive Summary Congestion Mitigation & Air Quality Improvement Program
What Is The Request And What Funds Are Currently Spent On The Program? The requested level of $2.32 billion for the Congestion Mitigation and Air Quality Improvement (CMAQ) Program will help States and local governments reduce highway congestion and harmful emissions, and also assist many areas in reaching attainment of the National Ambient Air Quality Standards (NAAQS). This request is a slight increase of the FY 2015 annualized funding level of $2.27 billion. What Is The Program And Why Is It Necessary? The CMAQ program provides a funding source for State and local governments to fund transportation projects and programs that help meet the requirements of the Clean Air Act, and that help reduce regional congestion on transportation networks. CMAQ investments support transportation projects that reduce the mobile source emissions for which an area has been designated nonattainment or maintenance of the ozone, carbon monoxide and particulate matter NAAQS by the Environmental Protection Agency (EPA). Many CMAQ-funded projects also reduce highway congestion, which impedes economic development. FHWA will continue to support these types of projects in FY 2016. Why Do We Need To Fund The Program At The Requested Level? Reductions in both harmful emissions and traffic congestion are goals of the Department’s initiative supporting quality of life in communities. The CMAQ program is the only highway program that specifically targets investments to reduce harmful vehicular emissions. Additionally, funding the program at the requested level of $2.32 billion will provide consistency and continuity for States and metropolitan governments that have planned and programmed the types of projects which contribute to the environmental and quality of life goals put forth by the Department. What Benefits Will Be Provided To The American Public Through This Request? The CMAQ program improves air quality, providing cleaner air and a more healthful environment, especially for those impacted by air quality issues. The CMAQ program is the only element of the Federal-aid Highway Program that specifically targets areas with air quality challenges. Through its statutory focus on transportation efforts that reduce harmful emissions, the CMAQ program enhances livability and improves health throughout the nation, by contributing to attainment and maintenance of the NAAQS that act as a public health benchmark for many of the more densely populated areas of the country.
III-46
Detailed Justification Congestion Mitigation & Air Quality Improvement Program
What Is The Request And What Funds Are Currently Spent On The Program?
FY 2016 – Congestion Mitigation & Air Quality Improvement Program ($2.32 billion)
($000)
DIFFERENCEFY 2015 FY 2016 FROM FY 2015
PROGRAM ACTIVITY ENACTED REQUEST ENACTED
Federal-aid HighwaysCongestion Mitigation & Air Quality Improvement Program
Congestion Mitigation & Air Quality Improvement Program 2,266,890 2,315,320 48,430
Total 2,266,890 2,315,320 48,430
What Is This Program And Why Is It Necessary?
The CMAQ Program provides broad flexibility in project selection for States and communities that need to reduce emissions from their transportation sources. The program’s statutory focus on congestion- and emissions-reducing efforts is unique in the Federal-aid Highway Program as it seeks to employ tailored transportation investments to combat formidable air quality challenges around the country. Reductions in both harmful emissions and traffic congestion are goals of the Department’s initiative supporting quality of life in communities. Some of the eligible project categories available to States and local governments include:
• Traffic management centers • Congestion relief efforts, e.g. high occupancy vehicle/high occupancy toll lanes • Intermodal freight projects • Diesel retrofit projects • Transit capital investments • Transit and rail operating costs • Travel demand management strategies • Bicycle and pedestrian programs • Vehicle inspection and maintenance programs • Electric vehicle and natural gas vehicle infrastructure
Projects supported with CMAQ funds must demonstrate the three primary requirements that have been a part of the program since its inception under the Intermodal Surface Transportation Efficiency Act (ISTEA) in 1991. An eligible project must:
• Reduce emissions. • Be located in or benefit an EPA-designated nonattainment or maintenance area. • Be identified as a transportation project.
III-47
The Federal share for most CMAQ projects, with a few exceptions, is 80 percent. While most States must use program funds in either nonattainment or maintenance areas, States with small populations in these designated areas, or with none of these areas, have additional flexibility to use CMAQ funds anywhere in the State for any project eligible under the STP or CMAQ program. The CMAQ program establishes a statutory link to funding projects that reduce harmful emissions and contribute to the attainment of the NAAQS. MAP-21 emphasized the importance of reducing PM2.5 emissions in areas that are nonattainment or maintenance for the PM2.5 NAAQS by setting aside a portion of the CMAQ funds to support projects that would reduce PM2.5 emissions. The GROW AMERICA Act continues this emphasis and also calls for priority consideration for projects that would reduce ozone precursor emissions in ozone nonattainment or maintenance areas. CMAQ is less traditional than other FHWA capital programs, and serves a crossover function between transportation capital investments and environmental stewardship. Projects supported with CMAQ funds are required to demonstrate an emissions reduction projection. In addition, States provide an annual report on all CMAQ investments that covers the fiscal year’s obligations of program funds and provides insight on the program’s potential impact on air quality, congestion, multimodal choice, and its contribution to a region’s quality of life. The program continues to provide incremental benefits through enhanced regional and local air quality, and through contributions to congestion relief. Both these areas—air pollution and highway congestion—are considered to be worsening externalities that affect quality of life in many metropolitan areas of the country. Why Do We Need To Fund The Program At The Requested Level? Funding CMAQ at $2.32 billion is a slight increase over the FY 2015 level. An estimated 142.2 million Americans live in places where the levels of one or more air pollutants exceed national air quality standards, threatening public health. The program will continue to help ensure continuity with State and local programming and provide adequate resources to maintain the air quality progress in many areas as they strive towards attainment of the NAAQS. What Benefits Will Be Provided To The American Public Through This Request?
The CMAQ program improves air quality, providing cleaner air and a more healthful environment, especially for those impacted by air quality issues. The CMAQ program is the only element of the Federal-aid Highway Program that specifically targets areas with air quality challenges. Through its statutory focus on transportation efforts that reduce harmful emissions, the program enhances livability and improves health throughout the nation, by contributing to attainment and maintenance of the NAAQS that act as a public health benchmark for many of the more densely populated areas of the country. Since its inception, $30 billion in CMAQ funds have supported more than 30,000 projects that reduced emissions of particulate matter, carbon monoxide, nitrogen oxides, and/or volatile organic compounds and contributed to improved air quality and public health.

III-48
This Page Left Blank Intentionally
III-49
Executive Summary Metropolitan Transportation Planning
What Is The Request And What Funds Are Currently Spent On The Program? We request $320.0 million for FY 2016 to provide metropolitan transportation planning (PL) funding. The funds are used by Metropolitan Planning Organizations (MPOs) for multimodal transportation planning and programming in metropolitan areas. This request is a slight increase over the FY 2015 annualized funding level of $313.6 million. What Is This Program And Why Is It Necessary? Under the Moving Ahead for Progress in the 21st Century Act (MAP-21), census designated urbanized areas over 50,000 in population are required to designate an MPO to conduct a continuing, cooperative, and comprehensive transportation planning process as a condition to receiving federal funds for transportation projects. Metropolitan areas are comprised of multiple governmental agencies and jurisdictions, each of which have an interest in and have needs for transportation investment. Through a coordinated, regional approach to planning, an MPO engages the local jurisdictions as well as the State DOT and transit operators in a regional process that identifies the needs and investment priorities for the region. The result is a long range (20-year) transportation plan and a shorter term (4-year) program of transportation projects for implementation that are performance-based, whereby the MPOs are required to establish system performance goals and outcomes as part of the metropolitan transportation planning process, and direct their investments toward meeting those system performance outcomes. Why Do We Need To Fund The Program At The Requested Level? This funding request will ensure that MPOs have adequate resources to conduct the metropolitan planning process. What Benefits Will Be Provided To The American Public Through This Request? This request will ensure that MPOs appropriately direct investments toward improving transportation system outcomes in a transparent and accountable manor while engaging the public, elected officials, and other stakeholders in the process. The result will be more efficient and effective use of federal transportation funds, and a focus by the MPOs on the national goal areas identified in MAP-21 and continued in the Department’s reauthorization proposal.
III-50
Detailed Justification Metropolitan Transportation Planning
What Is The Request And What Funds Are Currently Spent On The Program?
FY 2016 – Metropolitan Transportation Planning ($320.0 million)
($000)
DIFFERENCEFY 2015 FY 2016 FROM FY 2015
PROGRAM ACTIVITY ENACTED REQUEST ENACTED
Federal-aid HighwaysMetropolitan Transportation Planning
Metropolitan Transportation Planning 313,552 319,981 6,429
Total 313,552 319,981 6,429
What Is This Program And Why Is It Necessary? MAP-21 requires census designated urbanized areas over 50,000 in population to designate an MPO to conduct a continuing, cooperative, and comprehensive transportation planning process as a condition to receiving federal funds for transportation projects. Metropolitan planning (PL) funds are used by MPOs for multimodal transportation planning and programming in metropolitan areas. Metropolitan planning activities include the collection and analysis of data on demographics, trends, and system performance; travel demand and system performance forecasting; identification and prioritization of transportation system improvement needs; and coordination of the planning process and decision making with the public, elected officials, and stakeholder groups. Metropolitan areas are comprised of multiple governmental agencies and jurisdictions, each of which have an interest in and have needs for transportation investment. Through a coordinated, regional approach to planning, an MPO engages the local jurisdictions as well as the State DOT and transit operators in a regional process that identifies the needs and investment priorities for the region. The result is a long range (20-year) transportation plan and a shorter term (4-year) program of transportation projects for implementation. A performance based approach was added to the metropolitan and statewide transportation planning processes by MAP-21, and is continued in the GROW AMERICA Act, whereby the MPOs are required to establish system performance goals and outcomes as part of the metropolitan transportation planning process, and direct their investments toward meeting those system performance outcomes. Under the GROW AMERICA Act, metropolitan planning would be enhanced by encouraging multiple MPOs serving a single region to better coordinate transportation planning across their boundaries through the development of a common plan and Transportation Improvement Program (TIP) and by providing incentives for the consolidation of MPOs. The Act would also provide additional financial resources to high-performing MPOs that meet geographic and governance best practices. In support of the transition to a performance-driven, outcome-based planning process, MPOs would be required to have a performance-based project selection
III-51
process for their TIPs, and the Secretary could potentially establish additional performance measures for connection to opportunities and for multimodal freight movement. Adaptation, climate change, and resilience would become part of the analysis conducted for metropolitan planning. Public participation would be enhanced by providing the public additional opportunities to participate and comment such as when an MPO chooses to conduct scenario planning as part of its plan development and also by adding public port authorities to the list of interested parties provided an opportunity to comment on the metropolitan plan. Why Do We Need To Fund The Program At The Requested Level? This funding request of $320.0 million will ensure that the PL program has adequate resources to conduct the metropolitan planning process and appropriately direct investments toward improving transportation system outcomes while engaging the public, elected officials, and other stakeholders in the process. Currently there are 411 MPOs. There were 384 MPOs prior to the 2010 Census, and 36 new urbanized areas were identified as a result of the 2010 Census. Some of those were within existing MPOs, or joined an existing MPO, and 27 decided to form new stand-alone MPOs. As a result, the total number of MPOs expanded from 384 to the current total of 411. These funds allow for each MPO to carry out a coordinated transportation planning process and develop long range transportation plans and transportation improvement programs that make effective use of limited transportation funding. These prioritized plans and programs account for transportation system performance needs, future population and employment, future land use, economic development, public involvement, multimodal considerations and connectivity (including bicycle, pedestrian, highway, and transit), freight movement, environmental mitigation, transportation systems operation, safety, and congestion mitigation. What Benefits Will Be Provided To The American Public Through This Request? This request will ensure that MPOs appropriately direct investments toward improving transportation system outcomes in a transparent and accountable manor while engaging the public, elected officials, and other stakeholders in the process. The result will be more efficient and effective use of federal transportation funds, and a focus by the MPOs on coordination with the State DOTs to address the national goal areas identified in MAP-21. Transparency will occur through the use of performance measures and targets by the MPOs as part of the transportation decision making process. Accountability will occur through MPO reporting on progress toward achieving performance targets.

III-52
This Page Left Blank Intentionally
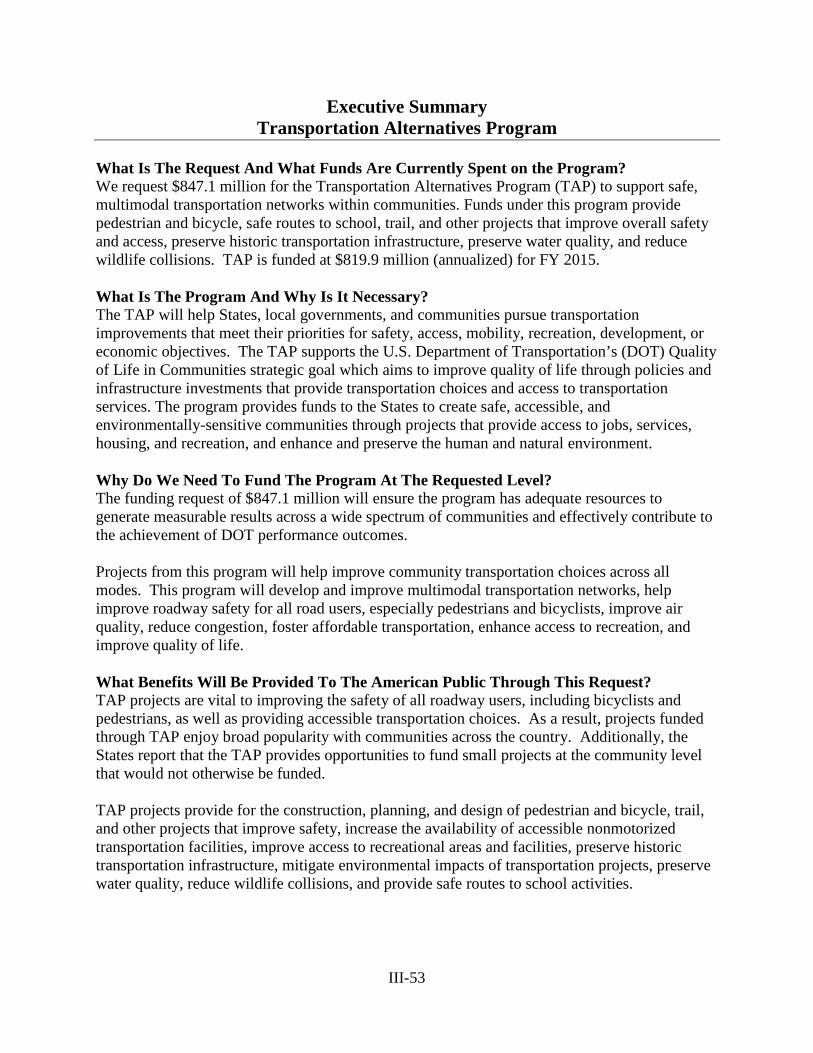
III-53
Executive Summary Transportation Alternatives Program
What Is The Request And What Funds Are Currently Spent on the Program? We request $847.1 million for the Transportation Alternatives Program (TAP) to support safe, multimodal transportation networks within communities. Funds under this program provide pedestrian and bicycle, safe routes to school, trail, and other projects that improve overall safety and access, preserve historic transportation infrastructure, preserve water quality, and reduce wildlife collisions. TAP is funded at $819.9 million (annualized) for FY 2015. What Is The Program And Why Is It Necessary? The TAP will help States, local governments, and communities pursue transportation improvements that meet their priorities for safety, access, mobility, recreation, development, or economic objectives. The TAP supports the U.S. Department of Transportation’s (DOT) Quality of Life in Communities strategic goal which aims to improve quality of life through policies and infrastructure investments that provide transportation choices and access to transportation services. The program provides funds to the States to create safe, accessible, and environmentally-sensitive communities through projects that provide access to jobs, services, housing, and recreation, and enhance and preserve the human and natural environment. Why Do We Need To Fund The Program At The Requested Level? The funding request of $847.1 million will ensure the program has adequate resources to generate measurable results across a wide spectrum of communities and effectively contribute to the achievement of DOT performance outcomes. Projects from this program will help improve community transportation choices across all modes. This program will develop and improve multimodal transportation networks, help improve roadway safety for all road users, especially pedestrians and bicyclists, improve air quality, reduce congestion, foster affordable transportation, enhance access to recreation, and improve quality of life. What Benefits Will Be Provided To The American Public Through This Request? TAP projects are vital to improving the safety of all roadway users, including bicyclists and pedestrians, as well as providing accessible transportation choices. As a result, projects funded through TAP enjoy broad popularity with communities across the country. Additionally, the States report that the TAP provides opportunities to fund small projects at the community level that would not otherwise be funded. TAP projects provide for the construction, planning, and design of pedestrian and bicycle, trail, and other projects that improve safety, increase the availability of accessible nonmotorized transportation facilities, improve access to recreational areas and facilities, preserve historic transportation infrastructure, mitigate environmental impacts of transportation projects, preserve water quality, reduce wildlife collisions, and provide safe routes to school activities.
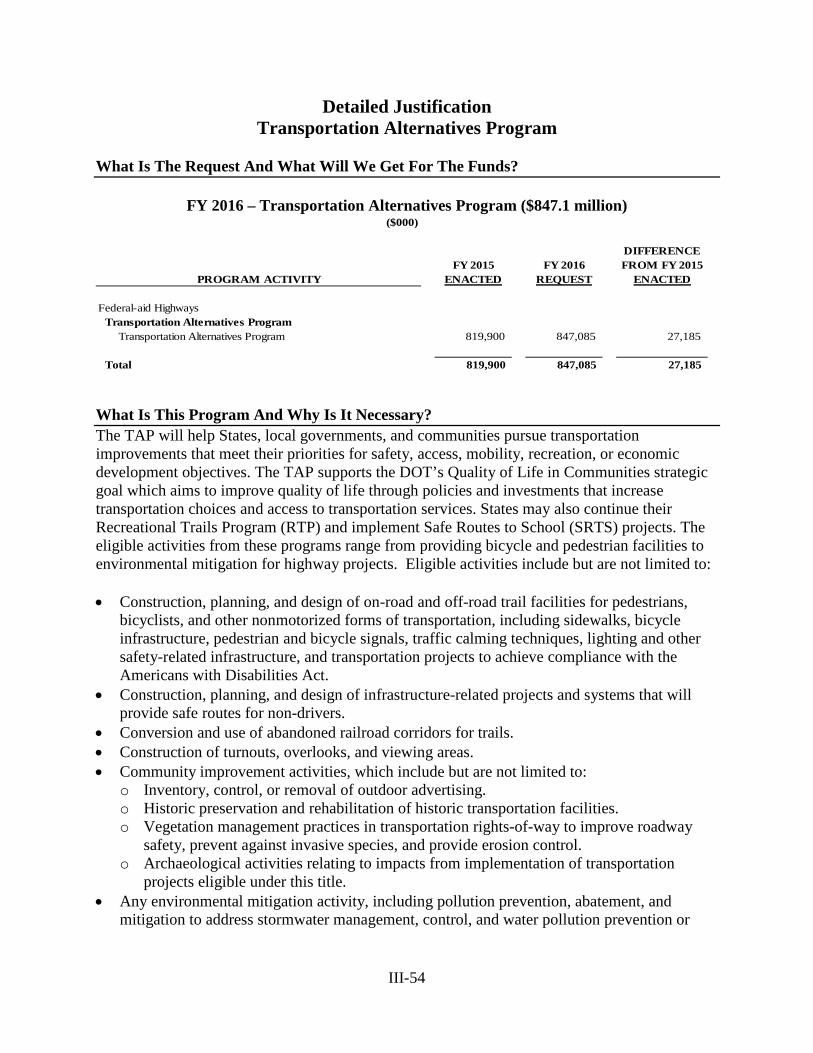
III-54
Detailed Justification Transportation Alternatives Program
What Is The Request And What Will We Get For The Funds?
FY 2016 – Transportation Alternatives Program ($847.1 million)
($000)
DIFFERENCEFY 2015 FY 2016 FROM FY 2015
PROGRAM ACTIVITY ENACTED REQUEST ENACTED
Federal-aid HighwaysTransportation Alternatives Program
Transportation Alternatives Program 819,900 847,085 27,185
Total 819,900 847,085 27,185
What Is This Program And Why Is It Necessary? The TAP will help States, local governments, and communities pursue transportation improvements that meet their priorities for safety, access, mobility, recreation, or economic development objectives. The TAP supports the DOT’s Quality of Life in Communities strategic goal which aims to improve quality of life through policies and investments that increase transportation choices and access to transportation services. States may also continue their Recreational Trails Program (RTP) and implement Safe Routes to School (SRTS) projects. The eligible activities from these programs range from providing bicycle and pedestrian facilities to environmental mitigation for highway projects. Eligible activities include but are not limited to: • Construction, planning, and design of on-road and off-road trail facilities for pedestrians,
bicyclists, and other nonmotorized forms of transportation, including sidewalks, bicycle infrastructure, pedestrian and bicycle signals, traffic calming techniques, lighting and other safety-related infrastructure, and transportation projects to achieve compliance with the Americans with Disabilities Act.
• Construction, planning, and design of infrastructure-related projects and systems that will provide safe routes for non-drivers.
• Conversion and use of abandoned railroad corridors for trails. • Construction of turnouts, overlooks, and viewing areas. • Community improvement activities, which include but are not limited to:
o Inventory, control, or removal of outdoor advertising. o Historic preservation and rehabilitation of historic transportation facilities. o Vegetation management practices in transportation rights-of-way to improve roadway
safety, prevent against invasive species, and provide erosion control. o Archaeological activities relating to impacts from implementation of transportation
projects eligible under this title. • Any environmental mitigation activity, including pollution prevention, abatement, and
mitigation to address stormwater management, control, and water pollution prevention or
III-55
abatement related to highway construction or due to highway runoff; reduce vehicle-caused wildlife mortality; or restore and maintain connectivity among terrestrial or aquatic habitats.
• Continuing the RTP as a set-aside of the TAP. • Continuing eligibility for SRTS projects. • Planning, designing, or constructing boulevards and other roadways largely in the right-of-
way of former Interstate System routes or other divided highways. Why Do We Need To Fund The Program At The Requested Level? The funding request of $847.1 million will ensure that the program has adequate resources to generate measurable results across a wide spectrum of communities, and effectively contribute to the achievement of DOT performance outcomes, including reducing bicycle and pedestrian fatalities and injuries, developing bicycle and pedestrian transportation networks, and providing community-level benefits. TAP projects will help communities to develop and enhance connections to form nonmotorized transportation networks. Some States began implementing the program in FY 2013, but many States and large Metropolitan Planning Organizations (MPOs) began their project selection processes in FYs 2014 and 2015. The TAP’s competitive process requirement will ensure that States and MPOs will select projects based on project merit. What Benefits Will Be Provided To The American Public Through This Request? TAP projects are vital to improving the safety of all roadway users, including bicyclists and pedestrians, as well as providing accessible transportation choices. Projects funded through the TAP enjoy broad popularity with communities across the country. The States report that the TAP provides opportunities to fund small projects at the community level that would not otherwise be funded. TAP projects provide for the construction, planning, and design of pedestrian and bicycle, trail, and other projects that improve overall safety and provide safe routes to school, increase the availability of accessible nonmotorized transportation facilities, improve access to recreational areas and facilities, preserve historic transportation infrastructure, mitigate environmental impacts of transportation projects, preserve water quality, and reduce wildlife collisions. The TAP maintains most project eligibilities from earlier programs that contributed to more than 30,000 Transportation Enhancement projects and more than 20,000 RTP projects since 1992, and more than 7,700 SRTS projects serving nearly 16,500 schools since 2005. We expect more than 1,000 TAP projects (including nearly 500 projects serving nearly 1,000 schools) and 1,000 RTP projects annually in FY 2015 and 2016. The TAP and SRTS projects provide transportation, safety, recreation, and economic benefits at the community level. About three-fourths of TAP projects directly benefit pedestrian and bicycle transportation. SRTS projects help all communities, including schools in low income areas. The RTP represents a portion of the motor fuel excise tax attributable to trail use. States report that RTP projects provide economic stimulus, youth employment, accessibility improvements, safe and livable communities, health and fitness, habitat conservation, and active transportation. Several areas have developed interconnected managed trail systems. In rural areas, trail systems help improve local economies and protect local ecosystems from inappropriate off-trail use.

III-56
This Page Left Blank Intentionally
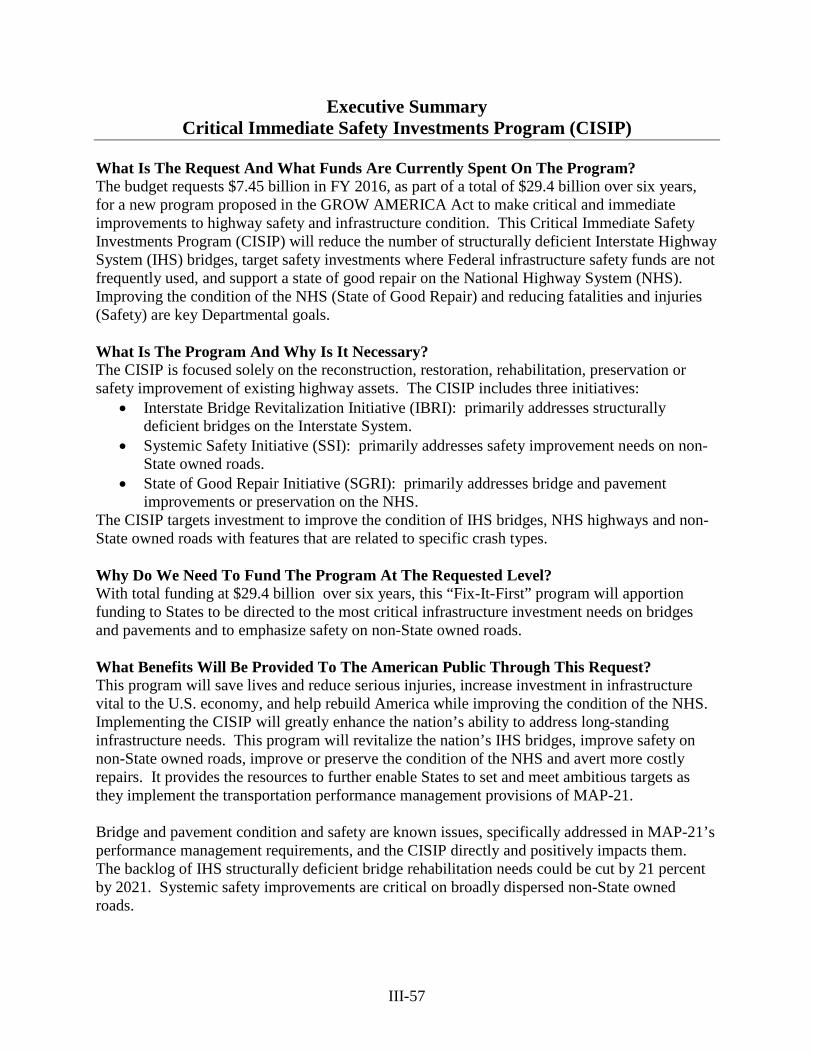
III-57
Executive Summary Critical Immediate Safety Investments Program (CISIP)
What Is The Request And What Funds Are Currently Spent On The Program? The budget requests $7.45 billion in FY 2016, as part of a total of $29.4 billion over six years, for a new program proposed in the GROW AMERICA Act to make critical and immediate improvements to highway safety and infrastructure condition. This Critical Immediate Safety Investments Program (CISIP) will reduce the number of structurally deficient Interstate Highway System (IHS) bridges, target safety investments where Federal infrastructure safety funds are not frequently used, and support a state of good repair on the National Highway System (NHS). Improving the condition of the NHS (State of Good Repair) and reducing fatalities and injuries (Safety) are key Departmental goals. What Is The Program And Why Is It Necessary? The CISIP is focused solely on the reconstruction, restoration, rehabilitation, preservation or safety improvement of existing highway assets. The CISIP includes three initiatives:
• Interstate Bridge Revitalization Initiative (IBRI): primarily addresses structurally deficient bridges on the Interstate System.
• Systemic Safety Initiative (SSI): primarily addresses safety improvement needs on non-State owned roads.
• State of Good Repair Initiative (SGRI): primarily addresses bridge and pavement improvements or preservation on the NHS.
The CISIP targets investment to improve the condition of IHS bridges, NHS highways and non-State owned roads with features that are related to specific crash types. Why Do We Need To Fund The Program At The Requested Level? With total funding at $29.4 billion over six years, this “Fix-It-First” program will apportion funding to States to be directed to the most critical infrastructure investment needs on bridges and pavements and to emphasize safety on non-State owned roads. What Benefits Will Be Provided To The American Public Through This Request? This program will save lives and reduce serious injuries, increase investment in infrastructure vital to the U.S. economy, and help rebuild America while improving the condition of the NHS. Implementing the CISIP will greatly enhance the nation’s ability to address long-standing infrastructure needs. This program will revitalize the nation’s IHS bridges, improve safety on non-State owned roads, improve or preserve the condition of the NHS and avert more costly repairs. It provides the resources to further enable States to set and meet ambitious targets as they implement the transportation performance management provisions of MAP-21. Bridge and pavement condition and safety are known issues, specifically addressed in MAP-21’s performance management requirements, and the CISIP directly and positively impacts them. The backlog of IHS structurally deficient bridge rehabilitation needs could be cut by 21 percent by 2021. Systemic safety improvements are critical on broadly dispersed non-State owned roads.
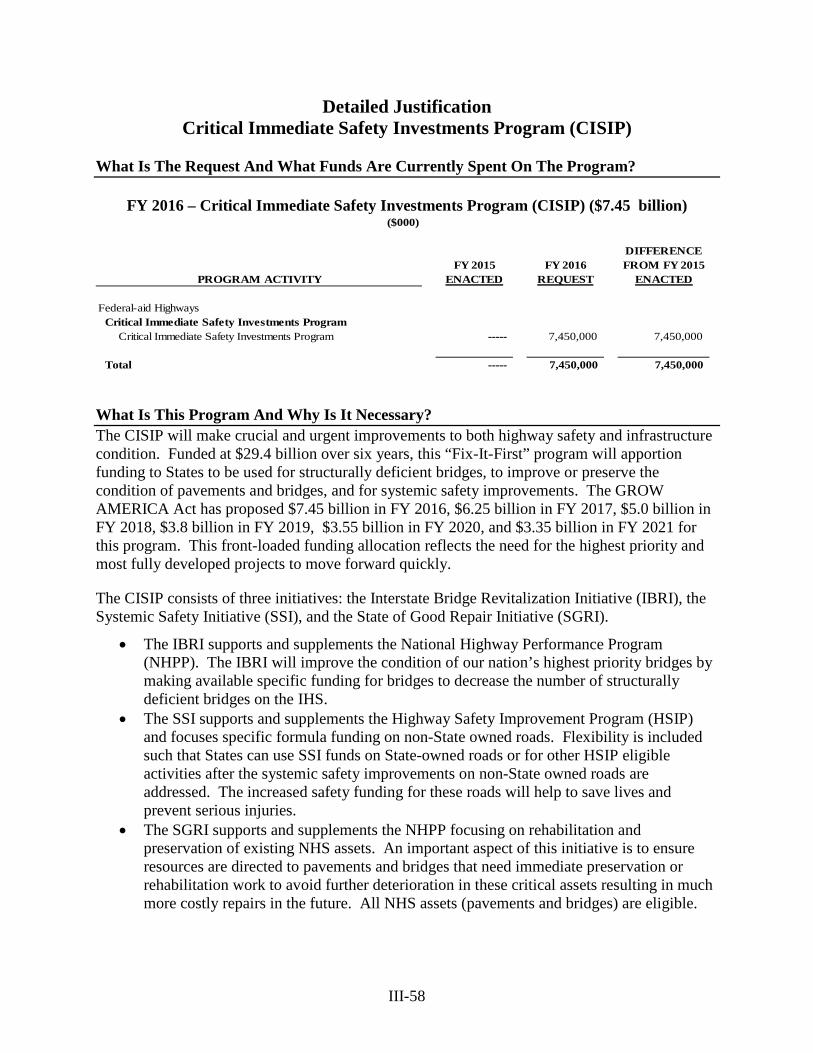
III-58
Detailed Justification Critical Immediate Safety Investments Program (CISIP)
What Is The Request And What Funds Are Currently Spent On The Program?
FY 2016 – Critical Immediate Safety Investments Program (CISIP) ($7.45 billion)
($000)
DIFFERENCEFY 2015 FY 2016 FROM FY 2015
PROGRAM ACTIVITY ENACTED REQUEST ENACTED
Federal-aid HighwaysCritical Immediate Safety Investments Program
Critical Immediate Safety Investments Program ----- 7,450,000 7,450,000
Total ----- 7,450,000 7,450,000
What Is This Program And Why Is It Necessary? The CISIP will make crucial and urgent improvements to both highway safety and infrastructure condition. Funded at $29.4 billion over six years, this “Fix-It-First” program will apportion funding to States to be used for structurally deficient bridges, to improve or preserve the condition of pavements and bridges, and for systemic safety improvements. The GROW AMERICA Act has proposed $7.45 billion in FY 2016, $6.25 billion in FY 2017, $5.0 billion in FY 2018, $3.8 billion in FY 2019, $3.55 billion in FY 2020, and $3.35 billion in FY 2021 for this program. This front-loaded funding allocation reflects the need for the highest priority and most fully developed projects to move forward quickly.
The CISIP consists of three initiatives: the Interstate Bridge Revitalization Initiative (IBRI), the Systemic Safety Initiative (SSI), and the State of Good Repair Initiative (SGRI).
• The IBRI supports and supplements the National Highway Performance Program (NHPP). The IBRI will improve the condition of our nation’s highest priority bridges by making available specific funding for bridges to decrease the number of structurally deficient bridges on the IHS.
• The SSI supports and supplements the Highway Safety Improvement Program (HSIP) and focuses specific formula funding on non-State owned roads. Flexibility is included such that States can use SSI funds on State-owned roads or for other HSIP eligible activities after the systemic safety improvements on non-State owned roads are addressed. The increased safety funding for these roads will help to save lives and prevent serious injuries.
• The SGRI supports and supplements the NHPP focusing on rehabilitation and preservation of existing NHS assets. An important aspect of this initiative is to ensure resources are directed to pavements and bridges that need immediate preservation or rehabilitation work to avoid further deterioration in these critical assets resulting in much more costly repairs in the future. All NHS assets (pavements and bridges) are eligible.
III-59
Funds for the CISIP would be apportioned to each State in the same ratio that NHPP funds are apportioned to each State. The CISIP would provide up to 80 percent of the funding to cover an eligible project’s cost and allow the remaining 20 percent to come from any other source including Federal sources (such as NHPP, STP, HSIP, etc.). The requested CISIP funding will be divided among the three initiatives as follows: 25 percent for IBRI, 25 percent for SSI and 50 percent for SGRI. States would have the ability to transfer their SGRI funds to either the IBRI or SSI to better address their specific needs. CISIP Features:
• Addresses a Clear Need – o The focus of the IBRI is bridges on the IHS, which is our nation’s 46,875 mile
network of freeways carrying 24 percent of all traffic and 50 percent of our nation’s freight. The IHS currently (2014) has 2,128 structurally deficient bridges covering 6.0 percent of the IHS bridge deck area, and the NHS currently (2014) has 5,951structurally deficient bridges covering 6.0 percent of its bridge deck area.
o The focus of the SSI is to improve safety (save lives and reduce serious injuries) on non-State owned roads. On average, 80 percent of roadway mileage is non-State owned and many fatalities occur on these roads. FHWA recently analyzed the extent to which States provide safety resources to local agencies and found that half of the responding States reported no HSIP expenditures on non-State-owned roads. For those reporting States that did spend FHWA safety funds on non-State owned roads, systemic safety improvements, which are the focus of the SSI, were cited as a key success factor to implement non-State owned road safety projects.
o The focus of the SGRI is to improve or preserve the condition and performance of pavements and bridges on the NHS and to provide additional funding to State DOTs so they can address immediate preservation or rehabilitation needs before the respective assets reach a condition that requires a much more costly repair or replacement.
• Adaptable to the Needs of All States – o All States have structurally deficient bridges that can be addressed with the IBRI. o States with extensive data systems can begin to immediately apply SSI funds to
systemic countermeasure application. The systemic approach to safety involves widely implemented improvements based on high-risk roadway features correlated with specific severe crash types. States lacking an adequate data system on non-State owned roadways can use the funds to supplement the Highway Safety Data Improvement set aside to further improve their information to make good systemic decisions. Because the percentage of roadways that are non-State owned within the States ranges from 8 percent to 94 percent, flexibility is included such that States can use SSI funds on State-owned roads or for other HSIP eligible activities after the systemic safety improvements on non-State owned roads are addressed.
III-60
o All States need to improve or preserve the condition of their pavements and bridges; this includes undertaking the “right action” to the “right asset” at the “right time”, in order to minimize delays to projects that will be much more costly if the assets deteriorate further. The SGRI will allow States that are experiencing reduced funding or increased needs to undertake important immediate rehabilitation and preservation actions. This initiative will facilitate taking the “right action” at the “right time”; for example, making preventative repairs to bridges in a timely manner before they become “structurally deficient” and require more substantial rehabilitation or replacement. To maximize their flexibility to meet performance targets, States may choose to transfer their SGRI funds to either the IBRI or SSI.
Interstate Bridge Revitalization Initiative This initiative provides funding to primarily address structurally deficient IHS bridges. Funds from this program are ineligible for use on newly constructed bridges on new highway alignments. States with more than 5 percent IHS deck area on structurally deficient bridges would be required to use funds from this initiative to repair, rehabilitate or replace structurally deficient IHS bridges. States with less than 5 percent IHS deck area on structurally deficient bridges would be allowed to use funds from this initiative to cover the cost to repair, rehabilitate or replace structurally deficient bridges on either the IHS or the National Highway System (NHS). Systemic Safety Initiative This program provides funding for States to use data-driven decision making and proactively apply systemic safety approaches on non-State owned roads - where a large proportion of the fatalities occur. The average percentage of roads by mileage that are non-State owned is 80 percent - many rural fatalities occur on these roads and are typically spread over hundreds or thousands of roadway miles in a State. These dispersed crashes are not concentrated in high crash locations, but are often correlated to high-risk roadway features. The systemic approach to safety proposed by this program targets those locations with high-risk roadway features that are correlated with specific severe crash types. Systemic safety improvements would then be proactively and widely deployed across a system to address those roadway features. Applying the systemic approach requires accurate information on crash location and roadway features. States can use SSI funds to proactively apply systemic countermeasures, or to improve their ability to make good systemic decisions.
• Encourages States to Analyze and Address Safety on All Public Roads - Because SSI
funds are focused on non-State owned roadways, and are linked to the State Strategic Highway Safety Plan (SHSP), the program will encourage those States that are not currently spending HSIP or Highway Safety Data Improvement funds on non-State owned roads to consider the needs of such roads as they move forward.
• Project and In-service Evaluation Feature - $150 million of the SSI funds would be set aside to support evaluations of systemic safety improvements and in-service performance
III-61
evaluations of roadside hardware. States and local agencies could compete for these SSI Evaluation funds administered by FHWA to support projects in return for providing data to support a rigorous evaluation of systemic safety improvements and in service performance evaluations of roadside hardware. Project evaluations could include collecting and analyzing before and after traffic, roadway and crash data for treated sites and control sites. Such information allows the safety community to assess the accuracy and precision of various safety countermeasure projects as well as the general applicability of the specific implementation results. SSI Evaluation funds would ensure that project evaluation studies consider study design, sample size, standard error, potential bias, etc. as encouraged for high quality countermeasures in the Crash Modification Factors Clearinghouse (http://www.cmfclearinghouse.org), a Web-based database of crash modification factors along with supporting documentation to help transportation engineers identify the most appropriate countermeasure for their safety needs. In-service performance evaluations provide additional information to assess efficacy of safety hardware in the real world environment. In-service performance evaluations could include collecting and maintaining roadside hardware inventories, identifying high crash location sites, documenting hardware performance at crash sites, and analyzing overall safety systems performance. SSI Evaluation funds would ensure that States have the resources to document the performance of the devices when impacted and to evaluate how these safety devices are performing under real-world conditions (including installation and maintenance).
State of Good Repair Initiative The SGRI is focused on bridge and pavement improvements on the NHS. To focus these investments, SGRI funds are eligible for the following “constrained” portion of NHPP eligibilities:
• Reconstruction, resurfacing, restoration, rehabilitation or preservation of NHS segments. • Replacement, rehabilitation, preservation and protection of NHS bridges and tunnels.
The objective of this initiative is that States improve or preserve the condition of their pavement and bridge assets on the NHS and avoid further deterioration in these critical assets resulting in much more costly repairs. States should use information from their pavement and bridge management systems to develop optimal strategies and identify potential projects that need immediate action to preserve the asset and avoid further deterioration resulting in substantial repair or replacement costs. Why Do We Need To Fund The Program At The Requested Level? With total funding of $29.4 billion over six years, of which $7.45 billion is requested for FY 2016, this “Fix-It-First” program will apportion funding to States to be used on the most critical infrastructure condition needs and emphasize safety on those non-State owned roads that are least likely to receive federal safety program funds.
III-62
Interstate Bridge Revitalization Initiative Assuming a similar level of investment from other sources and current trends hold, an additional $7.35 billion investment over the next six year ($1.86 billion requested for FY 2016) under the IBRI will likely result in 630fewer structurally deficient bridges on the IHS. Systemic Safety Initiative The $7.35 billion investment over the next six year ($1.86 billion requested for FY 2016) under the SSI could reduce fatalities by at least 270 per year and serious injuries by at least 900 per year and is estimated to save more than 2,700 lives and 9,000 serious injuries over the 10-year lifecycle of the countermeasures. Funding the program at a lower level would reduce the States’ ability to make the most effective safety investment decisions and reduce the safety countermeasures on non-State owned local and rural roads. Therefore, less funding will result in fewer lives saved and fewer serious injuries prevented. Since safety is the Department’s top priority, it is critical that sufficient resources are provided to achieve a better safety record on U.S. highways. A single death on our roadways, sidewalks, and bicycles paths is a tragedy; almost 90 deaths a day is unacceptable when we possess the tools and capability to help prevent them. This program will significantly reduce deaths and serious injuries for all road users helping us work toward the Department’s Safety goal: to improve public health and safety by reducing transportation related fatalities and injuries for all transportation users, working toward no fatalities across all modes of travel. State of Good Repair Initiative Of the CISIP funding, $14.7 billion investment over the next six year ($3.73 billion requested for FY 2016) under the SGRI. This funding is necessary to improve the condition and performance of the NHS and reduce long term funding needs for these assets. Critical and immediate action is needed to many of our nation’s pavements and bridges to avoid having them deteriorate to a condition that would necessitate more costly repairs to return them to a state of good repair. However, if FHWA and the State agree that the data indicate that the State has greater needs in the other portions of this program (IBRI and SSI), which have direct safety impacts, then the State may move up to 50 percent of their SGRI dollars to address the more critical needs in the IBRI or SSI. A minimum of 50 percent of their allocated SGRI funding (25 percent of the CISIP funding) must address immediate preservation or rehabilitation needs before the respective assets reach a condition that would require a much more costly repair or replacement. What Benefits Will Be Provided To The American Public Through This Request? The program would deliver a number of significant benefits to American taxpayers. CISIP eligibility is limited to ensure that States invest their CISIP funds in infrastructure and safety improvements. Implementing the CISIP would save lives, reduce serious injuries, and greatly enhance FHWA’s ability to address long-standing infrastructure needs. Specifically, this program would revitalize many of the nation’s structurally deficient IHS bridges, improve safety on non-State owned roads, improve or preserve the condition of our nation’s highways, and
III-63
further provide the ability for States to set and meet ambitious targets as part of highway performance management. An efficient transportation system is critical to maintaining the competitiveness of our economy. The highly developed U.S. transportation system played a key role in allowing GDP per capita to grow faster in the U.S. over the past century than in countries with less developed transportation systems. Additional transportation infrastructure investment is needed to sustain economic growth. This program will give transportation agencies the ability to invest quickly and target funding to support national goals. Interstate Bridge Revitalization Initiative The focus of this initiative is on the IHS, our nation’s premier highway system. The condition of IHS bridges is essential to the safety of the traveling public and to the efficient movement of people and goods on which the nation’s economy relies. As traffic volumes continue to increase and States struggle to address competing needs, without adequate investment the deterioration of these bridges will accelerate. Structurally deficient bridges that continue to deteriorate often result in structures that have restricted load carrying capabilities. These restrictions can include limiting the weight of the vehicles that use the bridge or removing a lane of traffic from the bridge, both representing significant disruptions to users. Often structurally deficient bridges require more frequent and rigorous monitoring which usually also disrupts traffic. The IBRI will provide additional targeted resources that States can use to specifically reduce the amount of deck area on structurally deficient IHS bridges, underpinning the safety of the highway system and providing a reliable, efficient network over which people and goods can travel efficiently and with confidence. Systemic Safety Initiative This program will proactively save lives and prevent serious injuries on the nation’s highways. The program contributes to the achievement of the Department’s Safety goal; specifically to the Department’s desired outcome to reduce transportation-related fatalities and injuries. Data from 2013 indicates that 32,719 people died on the nation’s highways and the financial burden of highway crashes is at least $277 billion per year. FHWA must continue to take action to address this serious public safety and economic problem. Of the four million miles of roads in the US, less than one million are State-owned, but only half of the States use HSIP funds for safety projects on non-State owned roads. The Department of Transportation (DOT)’s Safety Goal is to improve public health and safety by reducing transportation related fatalities and injuries for all transportation users, working toward no fatalities across all modes of travel. The only way to achieve this goal is to efficiently and effectively address crashes that are spread across an enormous roadway network, and the SSI provides funding and incentives to do so.
III-64
State of Good Repair Initiative Preserving and improving the NHS is essential to ensuring U.S. economic world trade competiveness. The SGRI provides additional investments to enhance and preserve NHS condition and operational performance. Many State DOTs have experienced reduced funding coupled with reduced purchasing power, and few have adequate funding to maintain good roads. This initiative focuses on preservation of those assets that need immediate actions to minimize much more costly future actions to keep them in a state of good repair. State DOTs should use their pavement and bridge management systems as a tool to identify optimal strategies and potential projects that need immediate action to preserve the asset and avoid further deterioration which would result in crippling repair costs.
III-65
Executive Summary Federal Lands & Tribal Transportation Programs
What Is The Request And What Funds Are Currently Spent On The Program? FHWA requests $1.28 billion for the Federal Lands and Tribal Transportation Programs (FLTTP) in FY 2016 to provide funding for transportation construction and engineering projects on Federal and Tribal lands. These projects will provide multimodal access to basic community services for 566 Federally-recognized sovereign Tribal governments, improve multimodal access to recreational areas on public lands/national treasures, and expand economic development and transportation accessibility in and around Federal and Tribal lands. This will promote new opportunities and improve quality of life for all Americans while preserving the environment and reducing congestion. In FY 2015, the FLTTP is authorized at an annualized $1.00 billion. What Is This Program And Why Is It Necessary? The FLTTP is comprised of four programs:
• Federal Lands Transportation Program – $370.0 million for projects that improve public access on high-priority roads, trails, and transit systems within the Federal estate (national forests, national parks, national wildlife refuges, national recreation areas, and other Federal public lands) on infrastructure owned by the Federal government.
• Federal Lands Access Program – $250.0 million for projects that improve access to the Federal estate on infrastructure owned by States, counties, and local governments.
• Tribal Transportation Program – $507.0 million for projects that improve access to and within Tribal lands.
• Nationally Significant Federal Lands and Tribal Projects – $150.0 million for rehabilitation, construction, or reconstruction of large, nationally-significant transportation infrastructure within or providing access to Federal or Tribal lands.
These programs support safe, seamless, and multimodal access to Federal and Tribal lands which in turn provides opportunities for jobs and economic generation for the nearby communities. In the absence of these programs, it is highly likely, based on historical experiences, that the roads and bridges providing vital access to our Federal treasures and critical Indian community services (such as medical and education) would fall into severe disrepair, jeopardizing the public’s and Tribal members’ ability to access these areas and services, respectively. Why Do We Need To Fund The Program At The Requested Level? The requested $1.28 billion will provide a level of investment required to achieve results for these programs of national interest. The investment supports over 50,000 miles of paved and unpaved roads and 6,600 bridges used by over 900 million visitors annually, in addition to approximately 160,000 miles of roads and bridges used in large part by residents of 566 federally recognized, sovereign Tribes. What Benefits Will Be Provided To The American Public Through This Request? The FLTTP has demonstrated that Federal investment improved the condition of roads and bridges on Federal and Tribal lands. During 2005-2014, over 10,000 lane miles of Federal and Tribal roads were improved and over 700 bridges were constructed or improved. Through these improvements, safety, access to and within, and quality of life in and around Federal and Tribal lands are significantly improved.
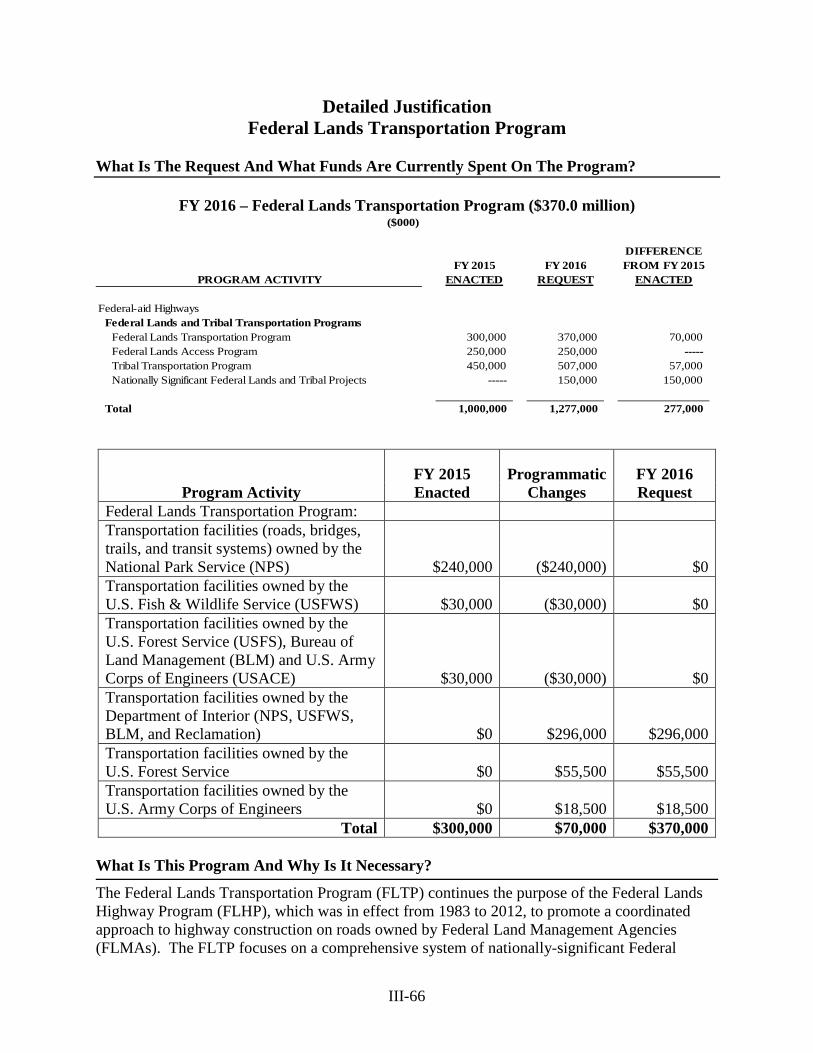
III-66
Detailed Justification Federal Lands Transportation Program
What Is The Request And What Funds Are Currently Spent On The Program?
FY 2016 – Federal Lands Transportation Program ($370.0 million)
($000)
DIFFERENCEFY 2015 FY 2016 FROM FY 2015
PROGRAM ACTIVITY ENACTED REQUEST ENACTED
Federal-aid HighwaysFederal Lands and Tribal Transportation Programs
Federal Lands Transportation Program 300,000 370,000 70,000 Federal Lands Access Program 250,000 250,000 ----- Tribal Transportation Program 450,000 507,000 57,000 Nationally Significant Federal Lands and Tribal Projects ----- 150,000 150,000
Total 1,000,000 1,277,000 277,000
Program Activity FY 2015 Enacted
Programmatic Changes
FY 2016 Request
Federal Lands Transportation Program: Transportation facilities (roads, bridges, trails, and transit systems) owned by the National Park Service (NPS) $240,000 ($240,000) $0 Transportation facilities owned by the U.S. Fish & Wildlife Service (USFWS) $30,000 ($30,000) $0 Transportation facilities owned by the U.S. Forest Service (USFS), Bureau of Land Management (BLM) and U.S. Army Corps of Engineers (USACE) $30,000 ($30,000) $0 Transportation facilities owned by the Department of Interior (NPS, USFWS, BLM, and Reclamation) $0 $296,000 $296,000 Transportation facilities owned by the U.S. Forest Service $0 $55,500 $55,500 Transportation facilities owned by the U.S. Army Corps of Engineers $0 $18,500 $18,500
Total $300,000 $70,000 $370,000 What Is This Program And Why Is It Necessary?
The Federal Lands Transportation Program (FLTP) continues the purpose of the Federal Lands Highway Program (FLHP), which was in effect from 1983 to 2012, to promote a coordinated approach to highway construction on roads owned by Federal Land Management Agencies (FLMAs). The FLTP focuses on a comprehensive system of nationally-significant Federal
III-67
transportation infrastructure (roads, bridges, trails, and transit systems) using a performance management program approach. The anticipated FY 2015 accomplishments will include the design and construction of Federal transportation infrastructure consistent with the FLMAs strategic plans and DOT strategic goals. Based on recent data at comparable funding levels, we estimate improving approximately 20 structurally deficient and/or functionally obsolete bridges to a safe/good condition and improving about 600 lane miles of roads within our national parks, forests, refuges, recreation sites, and Federal public lands. The purpose of the FLTP is to provide access within our national parks, forests, wildlife refuges, recreation areas, Bureau of Land Management lands, and other Federal public lands. The FLTP focuses on the subset of the Federal transportation infrastructure that is nationally significant: those roads, bridges, trails, or transit systems which provide access to high-use recreation areas or provide critical access for economic generation to support the local economy. In this manner, critical funding resources are targeted to those transportation facilities that provide access to the most popular recreational destination points within the Federal estate and thereby generate the greatest return on investment to land owners, communities adjacent to Federal lands, and the American people who are looking for seamless transportation to these popular recreational locations. The FLTP focuses on those transportation facilities that are in the national interest to maintain rather than broadly trying to include every road owned by the Federal Government or every road that provides access to Federal lands. The FLMAs are required to maintain a national transportation facility inventory and report annually on the state of good repair of the transportation infrastructure in the national Federal lands transportation facility inventory. The FLTP funds transportation planning, research, preventive maintenance, engineering, administrative expenses, rehabilitation, and construction of roads and bridges that provide access to, within, or adjacent to Federal lands. Funding allocations within the $370 million request cited above will allow all participating agencies to proactively support long range, statewide, and metropolitan transportation planning requirements, more efficiently enhance their data collection, and promote the leveraging of FLTP funds with other non-traditional sources of revenue thereby directing more funds toward transportation construction projects. The identification of baseline allocations considers each agency’s defined transportation networks, deferred maintenance backlog of transportation needs, transportation performance plans, and prior program allocations. Agencies under the Department of Interior (National Park Service, U.S. Fish & Wildlife Service, Bureau of Land Management, and Bureau of Reclamation) will receive 80 percent of the program funding, the U.S. Forest Service will receive 15 percent of the funding, and the U.S. Army Corps of Engineers will receive 5 percent of the funding. Each agency submits a single investment plan which describes how they intend to use their funds. Each proposed investment plan will be required to demonstrate how it supports the Secretary of Transportation’s goals (state of good repair of transportation facilities, reduction of bridge deficiencies, and safety improvement), most highly visited Federal recreational areas and economic generators, and the goals of the participating agency. This approach incentivizes the administration of a performance-based program. In this manner, agencies can continue to engage
III-68
in long-term transportation planning, multi-year project programming, and leverage management systems and other asset management tools to support better decision making. The FLTP reserves a percentage of the funding for long-range transportation planning, bridge inspections, management systems implementation, research/technology deployment, and road and bridge inventory/condition data collection. This set-aside will support bridge inspection activities for public-use bridges included in FLTP partner’s defined transportation networks, public use bridges outside those network(s), and bridge inspection activities for other Federal agencies not included in the FLTP. The set-aside will focus on comprehensive multi-agency planning efforts and positions the program more effectively to support performance management. The Federal Government owns approximately 30 percent of the land in the United States (see Exhibit 1 that follows). This land is primarily rural in nature, though there are many Federal roads and bridges in urban settings, such as the Golden Gate National Recreation Area in San Francisco, CA and the Federal Mall and Memorial Parks in Washington, DC. This program supports safe, seamless, and multimodal access to and through our national parks, forests, recreation areas, wildlife refuges, and other Federal public lands. The FLTP is focused on a comprehensive and coordinated approach to maintaining, rehabilitating, and improving the nationally-significant portions of the public transportation infrastructure owned by FLMAs, which are used on a daily basis by the American public. The FLTP helps to create ladders of opportunity for all Americans, particularly in rural America, by expanding transportation accessibility and increasing economic development on and around Federal lands. As cities and suburban areas continue to grow, Federal lands that were at one time 70+ miles away from the nearest urban area are now within a 15 minute commute. Many communities outside national parks, refuges, and forests are close enough to urban areas to facilitate the use of transit, vanpools, and/or bicycles to access the Federal estate. Greater use of alternative transportation options within and outside of Federal lands helps to reduce car emissions, ease congestion at the gate, and preserve the environment of our national treasures for future generations.
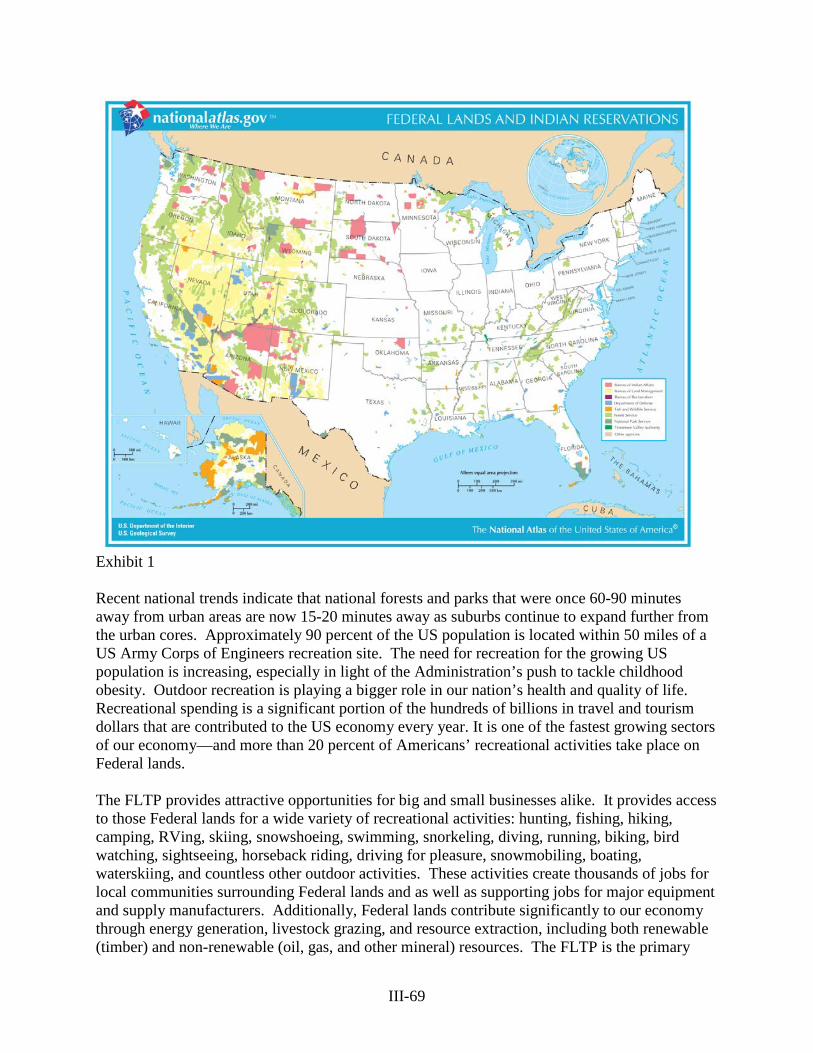
III-69
Exhibit 1 Recent national trends indicate that national forests and parks that were once 60-90 minutes away from urban areas are now 15-20 minutes away as suburbs continue to expand further from the urban cores. Approximately 90 percent of the US population is located within 50 miles of a US Army Corps of Engineers recreation site. The need for recreation for the growing US population is increasing, especially in light of the Administration’s push to tackle childhood obesity. Outdoor recreation is playing a bigger role in our nation’s health and quality of life. Recreational spending is a significant portion of the hundreds of billions in travel and tourism dollars that are contributed to the US economy every year. It is one of the fastest growing sectors of our economy—and more than 20 percent of Americans’ recreational activities take place on Federal lands. The FLTP provides attractive opportunities for big and small businesses alike. It provides access to those Federal lands for a wide variety of recreational activities: hunting, fishing, hiking, camping, RVing, skiing, snowshoeing, swimming, snorkeling, diving, running, biking, bird watching, sightseeing, horseback riding, driving for pleasure, snowmobiling, boating, waterskiing, and countless other outdoor activities. These activities create thousands of jobs for local communities surrounding Federal lands and as well as supporting jobs for major equipment and supply manufacturers. Additionally, Federal lands contribute significantly to our economy through energy generation, livestock grazing, and resource extraction, including both renewable (timber) and non-renewable (oil, gas, and other mineral) resources. The FLTP is the primary
III-70
funding mechanism to keep all of the roads, trails, and other Federal transportation systems that provide this access in a state of good repair. Why Do We Need To Fund The Program At The Requested Level? The requested $370.0 million is $70.0 million above the annualized funding level for FY 2015. This amount supports a comprehensive, coordinated, and performance-oriented approach to Federal transportation infrastructure management. We have determined that the national priority should focus the limited Federal funding on the roads, bridges, trails, and other transportation infrastructure that provide critical access to highly visited Federal recreation areas and economic generators. The anticipated FY 2016 accomplishments will include the design and construction of Federal transportation infrastructure consistent with the FLMAs strategic plans and DOT strategic goals. Based on recent data at comparable funding levels, we estimate improving approximately 20 structurally deficient and/or functionally obsolete bridges to a safe/good condition and improving about 600 lane miles of roads within our national parks, forests, refuges, recreation sites, and Federal public lands. What Benefits Will Be Provided To The American Public Through This Request? The FLTP outcomes include completed construction and engineering projects that will improve multimodal access, support increasing visitation to recreational areas on public lands, expand economic development, and create new jobs in and around Federal lands, resulting in more options to improve the quality of life for all Americans, while increasing safety, preserving the environment and reducing congestion at our national treasures. Overall, the condition of roads and bridges in the FLHP remained about the same over the life of SAFETEA-LU (2005-2012), though some agencies demonstrated significant improvements. The average condition of paved roads owned by the National Park Service increased from a pavement condition rating of 75 in 2005 to 82 in 2012 (on a 1-100 scale), a 9 percent increase. During the same timeframe, the average condition of roads owned by the US Fish & Wildlife Service increased from a roadway condition rating of 3.25 to 3.65 (on a 1-5 scale), an 11 percent increase. Coupled with the increasing volume of visitors to our Federal public lands (e.g., 2 percent increase on National Park Service lands and more than a 35 percent increase on US Fish & Wildlife Service lands over that timeframe), this indicates the program preserved critical assets in our national treasures effectively. In FY 2014, about 1,300 lane miles of road and 56 bridges were constructed or improved. Many of these road and bridge improvements included multimodal options on the same road or bridge thereby providing visitors with transportation options, e.g., car, biking, or walking. In summary, the program’s transportation investments allow visitors from the United States and other countries to experience America’s treasures in a safe and seamless manner.
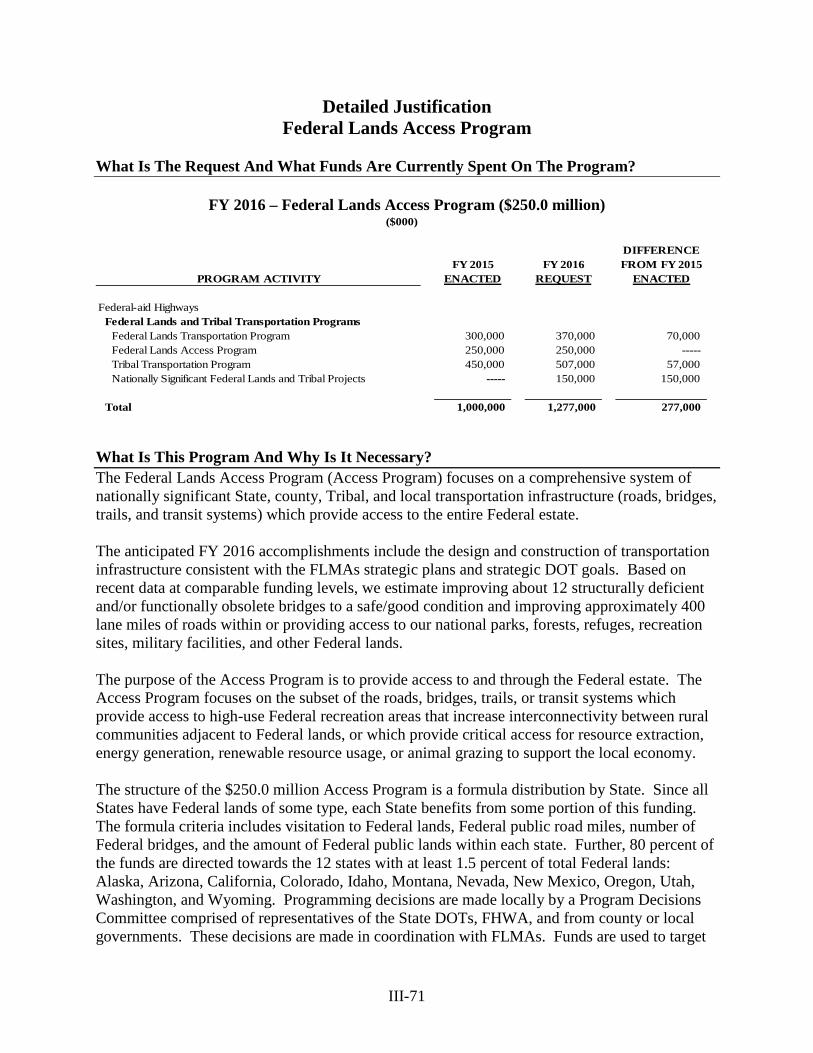
III-71
Detailed Justification Federal Lands Access Program
What Is The Request And What Funds Are Currently Spent On The Program?
FY 2016 – Federal Lands Access Program ($250.0 million)
($000)
DIFFERENCEFY 2015 FY 2016 FROM FY 2015
PROGRAM ACTIVITY ENACTED REQUEST ENACTED
Federal-aid HighwaysFederal Lands and Tribal Transportation Programs
Federal Lands Transportation Program 300,000 370,000 70,000 Federal Lands Access Program 250,000 250,000 ----- Tribal Transportation Program 450,000 507,000 57,000 Nationally Significant Federal Lands and Tribal Projects ----- 150,000 150,000
Total 1,000,000 1,277,000 277,000
What Is This Program And Why Is It Necessary? The Federal Lands Access Program (Access Program) focuses on a comprehensive system of nationally significant State, county, Tribal, and local transportation infrastructure (roads, bridges, trails, and transit systems) which provide access to the entire Federal estate. The anticipated FY 2016 accomplishments include the design and construction of transportation infrastructure consistent with the FLMAs strategic plans and strategic DOT goals. Based on recent data at comparable funding levels, we estimate improving about 12 structurally deficient and/or functionally obsolete bridges to a safe/good condition and improving approximately 400 lane miles of roads within or providing access to our national parks, forests, refuges, recreation sites, military facilities, and other Federal lands. The purpose of the Access Program is to provide access to and through the Federal estate. The Access Program focuses on the subset of the roads, bridges, trails, or transit systems which provide access to high-use Federal recreation areas that increase interconnectivity between rural communities adjacent to Federal lands, or which provide critical access for resource extraction, energy generation, renewable resource usage, or animal grazing to support the local economy. The structure of the $250.0 million Access Program is a formula distribution by State. Since all States have Federal lands of some type, each State benefits from some portion of this funding. The formula criteria includes visitation to Federal lands, Federal public road miles, number of Federal bridges, and the amount of Federal public lands within each state. Further, 80 percent of the funds are directed towards the 12 states with at least 1.5 percent of total Federal lands: Alaska, Arizona, California, Colorado, Idaho, Montana, Nevada, New Mexico, Oregon, Utah, Washington, and Wyoming. Programming decisions are made locally by a Program Decisions Committee comprised of representatives of the State DOTs, FHWA, and from county or local governments. These decisions are made in coordination with FLMAs. Funds are used to target
III-72
transportation infrastructure (roads, bridges, trails, or transit systems) that are owned by States, counties, Tribes, or local governments which provide critical access to Federal lands with high-use Federal recreation areas or high-use Federal economic generators. The Access Program reserves a percentage of the funding for long range transportation planning, bridge inspections, management systems, and road and bridge inventory/condition data collection by FLMAs. This set-aside also supplements costs associated with bridge inspection activities on federally-owned bridges which are not on the national Federal transportation facility inventory. The set-aside focuses on comprehensive multi-agency planning efforts and positions the program more effectively to support performance management. The Access Program funds transportation planning, research, preventive maintenance, engineering, rehabilitation, and construction of roads and bridges owned by States, counties, or local governments that provide access to, within, or are adjacent to Federal lands. The projects link highly used Federal transportation infrastructure inside the boundaries of Federal lands with the Federal-aid system outside the boundaries. In this manner, critical funding resources will be targeted to those roads and bridges that provide access to the most highly used recreational destination points and economic generators within the Federal estate and thereby produce the greatest return on investment to land owners, communities adjacent to Federal lands, and the American people who are looking for seamless transportation to these popular recreational locations. Put more plainly, the Access Program focuses on roads and bridges that are in the national interest to maintain rather than broadly trying to include every road that provides access to Federal lands. The Federal Government owns approximately 30 percent of the land in the United States (see Exhibit 1 that follows). This land is primarily rural in nature, though there are many Federal roads and bridges in urban settings, such as the Golden Gate National Recreation Area in San Francisco, CA and the Federal Mall and Memorial Parks in Washington, DC. This program, in conjunction with the Federal Lands Transportation Program, supports safe, seamless, and multimodal access to and through our national parks, forests, wildlife refuges, Bureau of Land Management lands, US Army Corps of Engineers recreation areas, military installations, and other Federal lands.
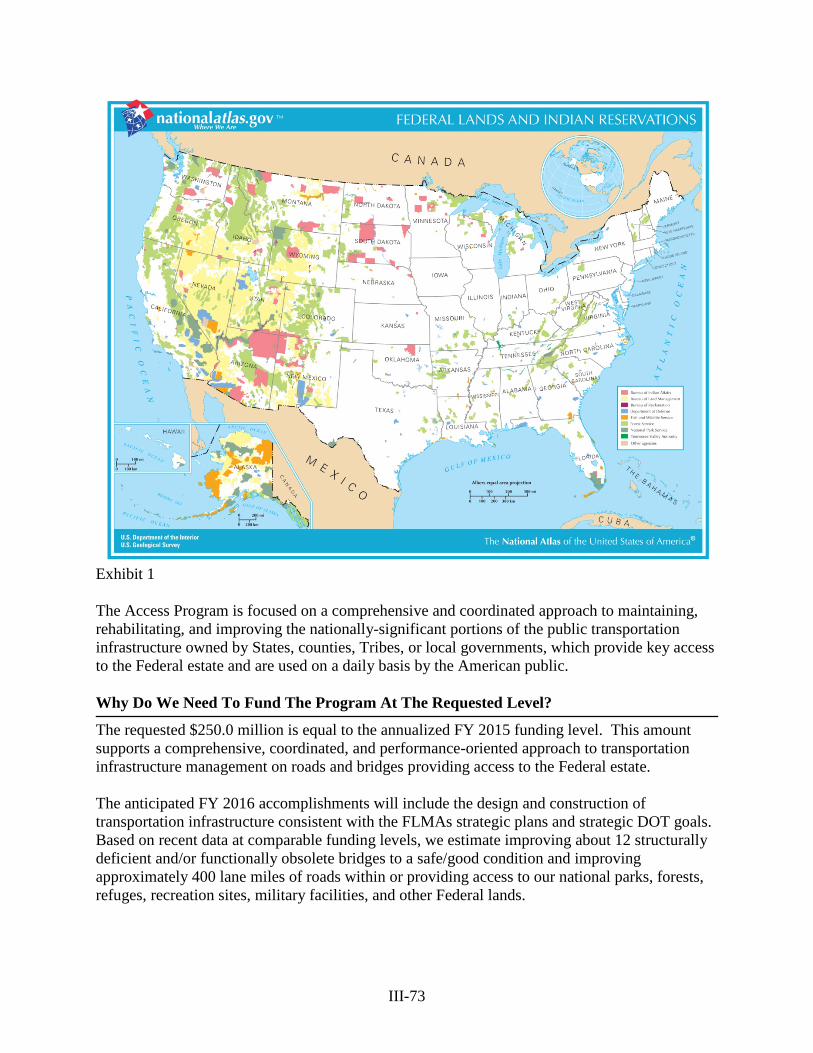
III-73
Exhibit 1 The Access Program is focused on a comprehensive and coordinated approach to maintaining, rehabilitating, and improving the nationally-significant portions of the public transportation infrastructure owned by States, counties, Tribes, or local governments, which provide key access to the Federal estate and are used on a daily basis by the American public. Why Do We Need To Fund The Program At The Requested Level?
The requested $250.0 million is equal to the annualized FY 2015 funding level. This amount supports a comprehensive, coordinated, and performance-oriented approach to transportation infrastructure management on roads and bridges providing access to the Federal estate. The anticipated FY 2016 accomplishments will include the design and construction of transportation infrastructure consistent with the FLMAs strategic plans and strategic DOT goals. Based on recent data at comparable funding levels, we estimate improving about 12 structurally deficient and/or functionally obsolete bridges to a safe/good condition and improving approximately 400 lane miles of roads within or providing access to our national parks, forests, refuges, recreation sites, military facilities, and other Federal lands.
III-74
The national priority is to focus the limited Federal funding on roads or bridges that provide critical access to highly-visited Federal recreation areas, and Federal economic generators. The Access Program focuses on publicly accessible, high-priority roads, bridges, trails, and transit systems owned by the States, counties, and local governments which provide access to the entire Federal estate. What Benefits Will Be Provided To The American Public Through This Request? The Access Program outcomes include completed construction and engineering projects that will improve multimodal access, support increasing visitation to recreational areas on public lands, expand economic development, and create new jobs in and around Federal lands, resulting in more options to improve the quality of life for all Americans, while preserving the environment and reducing congestion at our national treasures. Generally, the condition of roads and bridges in the pre-MAP-21 era remained about the same over the life of SAFETEA-LU (2005-2012). Considering the increasing volume of visitors to our Federal public lands (e.g., 2 percent increase on National Park Service lands and more than a 35 percent increase on US Fish & Wildlife Service lands over that timeframe), this indicates the program preserved critical assets in our national treasures effectively. During FY 2013, 9 structurally deficient and/or functionally obsolete bridges were repaired or replaced, and about 130 lane miles of roads were improved or reconstructed. FY 2013 was the first year of a new program, and we anticipate increased output in future years. Many of these road and bridge improvements included multimodal options on the same road or bridge thereby providing visitors with transportation options (e.g., motoring, biking, walking). We anticipate similar accomplishments through a broader set of State and county facilities that access all public lands under this program. In summary, the program’s transportation investments allow visitors from the United States and numerous countries to experience America’s treasures in a safe and seamless manner. Additionally, the Access Program helps to create ladders of opportunity for all Americans, particularly in rural America, by expanding transportation accessibility and increasing economic development on and around Federal lands. Many communities outside national parks, refuges, forests, recreational areas, and military bases are close enough to urban areas to facilitate the use of transit, vanpools and/or bicycles. Greater use of alternative transportation options inside and outside Federal lands helps reduce car emissions, eases congestion at the gate and preserves the environment inside our national treasures for future generations. This program also provides residents located in communities outside public lands with opportunities to keep their homes and secure jobs or enhance their educational choices provided by nearby cities by using a range of transportation options, e.g., vanpools, buses, and bike paths.
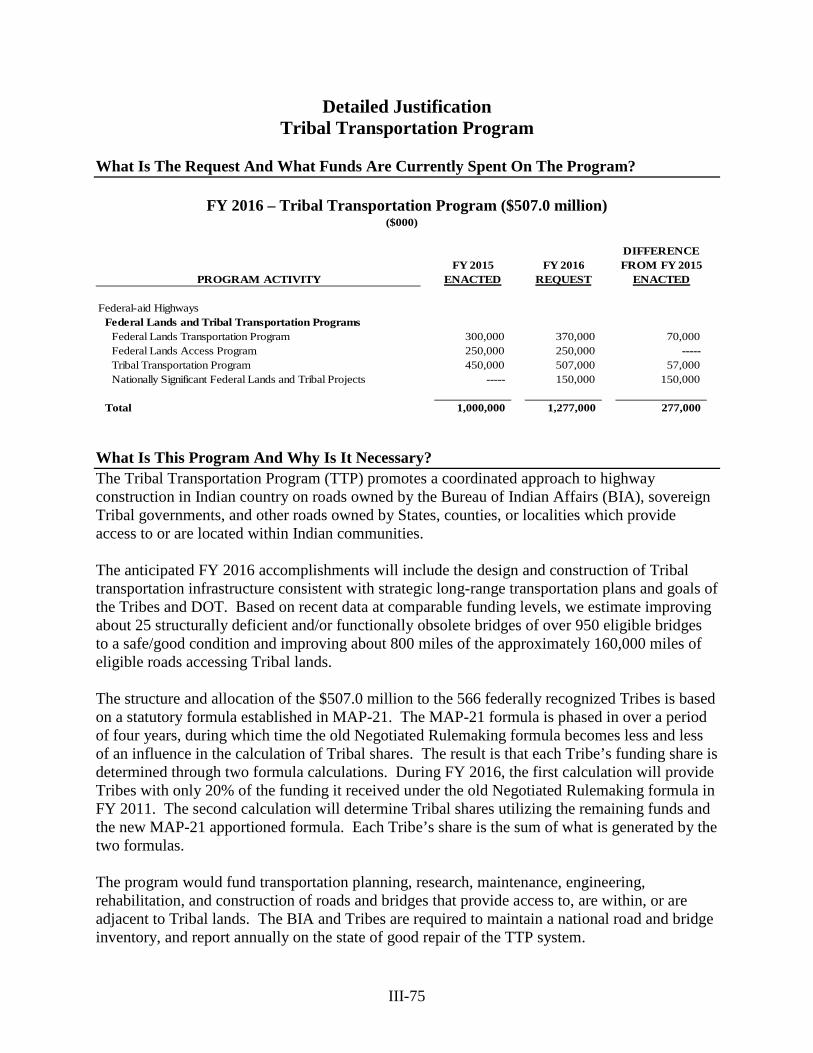
III-75
Detailed Justification Tribal Transportation Program
What Is The Request And What Funds Are Currently Spent On The Program?
FY 2016 – Tribal Transportation Program ($507.0 million)
($000)
DIFFERENCEFY 2015 FY 2016 FROM FY 2015
PROGRAM ACTIVITY ENACTED REQUEST ENACTED
Federal-aid HighwaysFederal Lands and Tribal Transportation Programs
Federal Lands Transportation Program 300,000 370,000 70,000 Federal Lands Access Program 250,000 250,000 ----- Tribal Transportation Program 450,000 507,000 57,000 Nationally Significant Federal Lands and Tribal Projects ----- 150,000 150,000
Total 1,000,000 1,277,000 277,000
What Is This Program And Why Is It Necessary? The Tribal Transportation Program (TTP) promotes a coordinated approach to highway construction in Indian country on roads owned by the Bureau of Indian Affairs (BIA), sovereign Tribal governments, and other roads owned by States, counties, or localities which provide access to or are located within Indian communities. The anticipated FY 2016 accomplishments will include the design and construction of Tribal transportation infrastructure consistent with strategic long-range transportation plans and goals of the Tribes and DOT. Based on recent data at comparable funding levels, we estimate improving about 25 structurally deficient and/or functionally obsolete bridges of over 950 eligible bridges to a safe/good condition and improving about 800 miles of the approximately 160,000 miles of eligible roads accessing Tribal lands. The structure and allocation of the $507.0 million to the 566 federally recognized Tribes is based on a statutory formula established in MAP-21. The MAP-21 formula is phased in over a period of four years, during which time the old Negotiated Rulemaking formula becomes less and less of an influence in the calculation of Tribal shares. The result is that each Tribe’s funding share is determined through two formula calculations. During FY 2016, the first calculation will provide Tribes with only 20% of the funding it received under the old Negotiated Rulemaking formula in FY 2011. The second calculation will determine Tribal shares utilizing the remaining funds and the new MAP-21 apportioned formula. Each Tribe’s share is the sum of what is generated by the two formulas. The program would fund transportation planning, research, maintenance, engineering, rehabilitation, and construction of roads and bridges that provide access to, are within, or are adjacent to Tribal lands. The BIA and Tribes are required to maintain a national road and bridge inventory, and report annually on the state of good repair of the TTP system.
III-76
The TTP advances transportation accessibility in Tribal communities. This program provides better access to housing, emergency services, schools, stores, jobs, and medical services. Access to these basic services improves the quality of life on Tribal lands. Under the GROW AMERICA proposal, the TTP proposes a set-aside of up to seven percent for Tribal High Priority Projects. This set-aside will help address the needs of smaller Tribes by allowing them to apply for funds to help address high-priority transportation concerns within their community. Commonly, the smaller Tribes who receive less funding via the formula may have to wait multiple years to consolidate their allocations before having sufficient funds to administer their highest priority project. This set-aside will provide greater opportunities across Tribal governments and will be administered using the defined program structure that was included as a stand-alone program in MAP-21 Section 1123. Under the GROW AMERICA proposal, the TTP proposes to increase the set-aside for national bridge rehabilitation and replacement priority activities to four percent from the two percent level in MAP-21. This increase is commensurate with pre-MAP-21 bridge funding levels which were found to be effective in addressing bridge deficiencies for all Tribes. The set-aside will be administered using the existing regulatory-defined grant program which prioritizes funds on the bridges with the lowest sufficiency rating. Applications are submitted by Tribes each year. The TTP reserves up to a six percent set aside for administration of the program. Funding from this set-aside helps to provide funding for the seven Tribal Technical Assistance Program Centers which provide technical assistance and training to Tribes, oversight and maintenance of the TTP Inventory, funding for the Coordinated Technology Improvement Program, funding for the TTP Program Coordinating Committee, and funding for the BIA, BIA-DOT, and FHWA staff responsible for carrying out the Stewardship and Oversight and inherent Federal functions/responsibilities of the program. These functions include fund distribution, technical assistance, environmental documentation review and approval, project construction inspection, and the travel by the Federal employees to carry out these activities. Under the GROW AMERICA proposal, the TTP proposes to increase the set-aside for transportation planning and data collection associated with road and bridge inventory and condition reporting to three percent from the two percent level in MAP-21. This set-aside is empirically-derived using spending levels over the previous ten years as well as anticipated future needs. This funding is allocated among the 566 Tribes by formula, but those Tribes can only spend this funding on planning and data collection activities. Safety is the Department’s number one priority, and the TTP addresses this priority by focusing up to two percent of the program towards national safety priority activities. This set-aside targets funding for safety projects using a national grant process similar to the TTP bridge process, i.e., applications are submitted by Tribes each year. In some States, the fatality and crash rates on Tribal lands are three to four times higher when compared to the balance of the same State(s). Therefore, we suggest this situation warrants national attention and dedicated resources to address it.
III-77
Why Do We Need To Fund The Program At The Requested Level? The requested $507.0 million is $57.0 million above the annualized FY 2015 funding level. The request supports a more comprehensive, coordinated, and goal-oriented approach to Tribal transportation infrastructure management. What Benefits Will Be Provided To The American Public Through This Request? The TTP provides funding to improve the access to basic community services for all of the 566 federally-recognized sovereign Tribal governments. The Administration’s focus and support for enhanced quality of life through transportation modal options coupled with creating ladders of opportunity in the mostly rural environments of Indian reservations will translate to better and safer access to housing, emergency services, schools, stores, places of employment, and medical services. On some rural reservations, a “complete street” means an all-weather road instead of a native-surface road. The TTP will promote access to Tribal lands for commerce and economic growth within Tribal communities. More than eight billion vehicle miles are traveled annually on the TTP system, even though it is among the most rudimentary of any transportation network in the United States with more than 60 percent of the system unpaved. Generally, the condition of TTP roads and bridges remained about the same over the prior highway authorization (2005-2014). Considering the increasing traffic on Indian lands, there is a good news story to be told. During 2014, about 470 lane miles of Tribal Transportation Roads were improved and 19 bridges were constructed or improved.
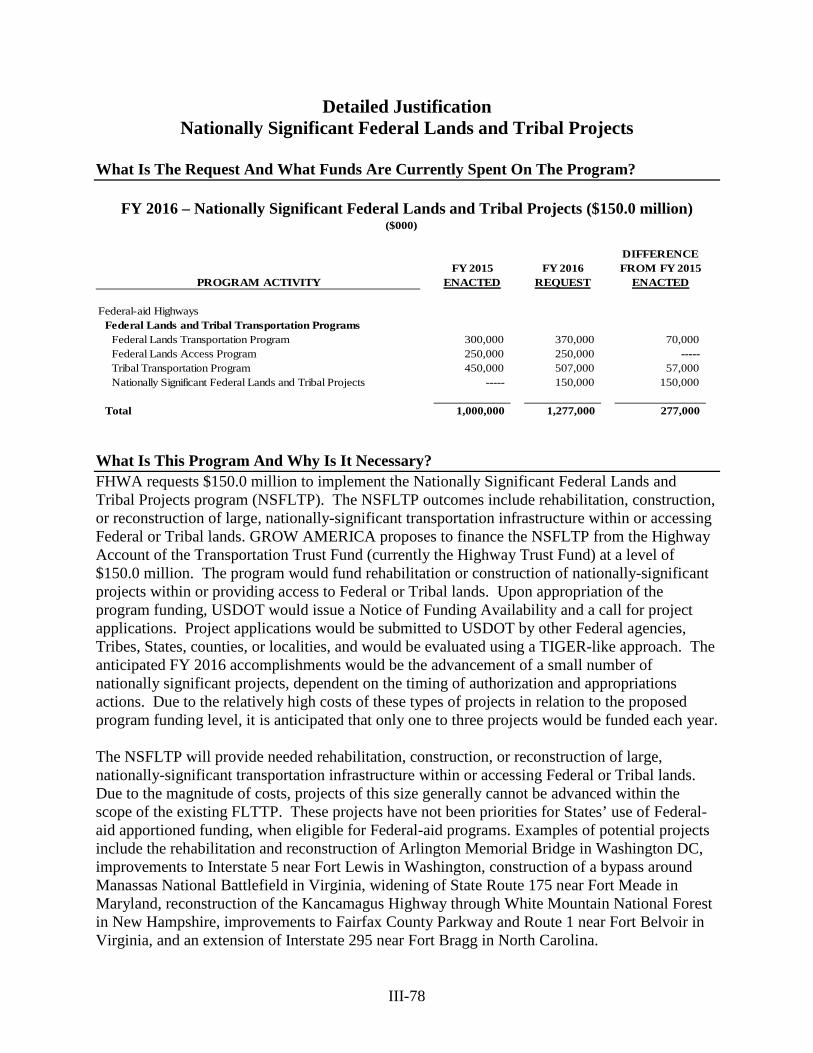
III-78
Detailed Justification Nationally Significant Federal Lands and Tribal Projects
What Is The Request And What Funds Are Currently Spent On The Program?
FY 2016 – Nationally Significant Federal Lands and Tribal Projects ($150.0 million)
($000)
DIFFERENCEFY 2015 FY 2016 FROM FY 2015
PROGRAM ACTIVITY ENACTED REQUEST ENACTED
Federal-aid HighwaysFederal Lands and Tribal Transportation Programs
Federal Lands Transportation Program 300,000 370,000 70,000 Federal Lands Access Program 250,000 250,000 ----- Tribal Transportation Program 450,000 507,000 57,000 Nationally Significant Federal Lands and Tribal Projects ----- 150,000 150,000
Total 1,000,000 1,277,000 277,000
What Is This Program And Why Is It Necessary? FHWA requests $150.0 million to implement the Nationally Significant Federal Lands and Tribal Projects program (NSFLTP). The NSFLTP outcomes include rehabilitation, construction, or reconstruction of large, nationally-significant transportation infrastructure within or accessing Federal or Tribal lands. GROW AMERICA proposes to finance the NSFLTP from the Highway Account of the Transportation Trust Fund (currently the Highway Trust Fund) at a level of $150.0 million. The program would fund rehabilitation or construction of nationally-significant projects within or providing access to Federal or Tribal lands. Upon appropriation of the program funding, USDOT would issue a Notice of Funding Availability and a call for project applications. Project applications would be submitted to USDOT by other Federal agencies, Tribes, States, counties, or localities, and would be evaluated using a TIGER-like approach. The anticipated FY 2016 accomplishments would be the advancement of a small number of nationally significant projects, dependent on the timing of authorization and appropriations actions. Due to the relatively high costs of these types of projects in relation to the proposed program funding level, it is anticipated that only one to three projects would be funded each year. The NSFLTP will provide needed rehabilitation, construction, or reconstruction of large, nationally-significant transportation infrastructure within or accessing Federal or Tribal lands. Due to the magnitude of costs, projects of this size generally cannot be advanced within the scope of the existing FLTTP. These projects have not been priorities for States’ use of Federal-aid apportioned funding, when eligible for Federal-aid programs. Examples of potential projects include the rehabilitation and reconstruction of Arlington Memorial Bridge in Washington DC, improvements to Interstate 5 near Fort Lewis in Washington, construction of a bypass around Manassas National Battlefield in Virginia, widening of State Route 175 near Fort Meade in Maryland, reconstruction of the Kancamagus Highway through White Mountain National Forest in New Hampshire, improvements to Fairfax County Parkway and Route 1 near Fort Belvoir in Virginia, and an extension of Interstate 295 near Fort Bragg in North Carolina.
III-79
As an example, the Arlington Memorial Bridge, linking Washington DC and Arlington VA, is in a serious state of disrepair. The bridge is rated as structurally deficient and is rapidly degrading, due largely to severe corrosion. There is also significant deterioration of the concrete in the arch spans, and recent core samples indicate that the deck concrete is rapidly deteriorating. The total project costs are estimated to be between $100 and $135 million. Currently, the NPS receives about $240 million per year from the Federal Lands Transportation Program. These funds are distributed administratively by formula among the seven NPS Regions; the National Capital Region receives approximately $15 million per year. Most of these funds are prioritized using transportation asset management principles to focus the funding on work required to keep existing assets in good condition rather than expensive reconstruction of structurally deficient condition assets. The National Capital Region cannot advance a project of this size without “saving up” all of its funding for six to nine years, during which time the bridge would continue to deteriorate even further, resulting in higher repair and replacement costs. Additionally, this approach would require a deferment of all of the other needed repair work within the Region, resulting in even more costly repairs in the future. Why Do We Need To Fund The Program At The Requested Level? The requested $150.0 million for NSFLTP will allow the advancement of a number of nationally-significant projects that have not been able to move forward under the current structure of the FLTTP. This level of funding will be sufficient to advance one to three Federal lands or Tribal projects of nationally significant importance each year. What Benefits Will Be Provided To The American Public Through This Request? In recent years, the FLTTP have begun the shift towards prioritizing funding towards the relatively low unit cost work of keeping more good assets in good condition over the much higher unit cost work of reconstructing fewer poor condition assets. Accordingly, the pre-MAP-21 authorization of the FLHP demonstrated that Federal investment improved the condition of roads and bridges on Federal and Tribal lands. During 2005-2014, over 10,000 lane miles of Federal and Tribal roads were improved and over 700 bridges were constructed or improved. The NSFLTP would complement the other components of the FLTTP by advancing projects of national significance that improve safety, access, and mobility to and within our national treasures, but cannot realistically be advanced under the current program structure. The NSFLTP would increase the efficiency of the other components of the FLTTP by continuing to apply sound asset management practices of maintaining a state of good repair of the respective transportation facilities eligible under each of the component programs without also trying to tackle these larger-scale projects.

III-80
This Page Left Blank Intentionally
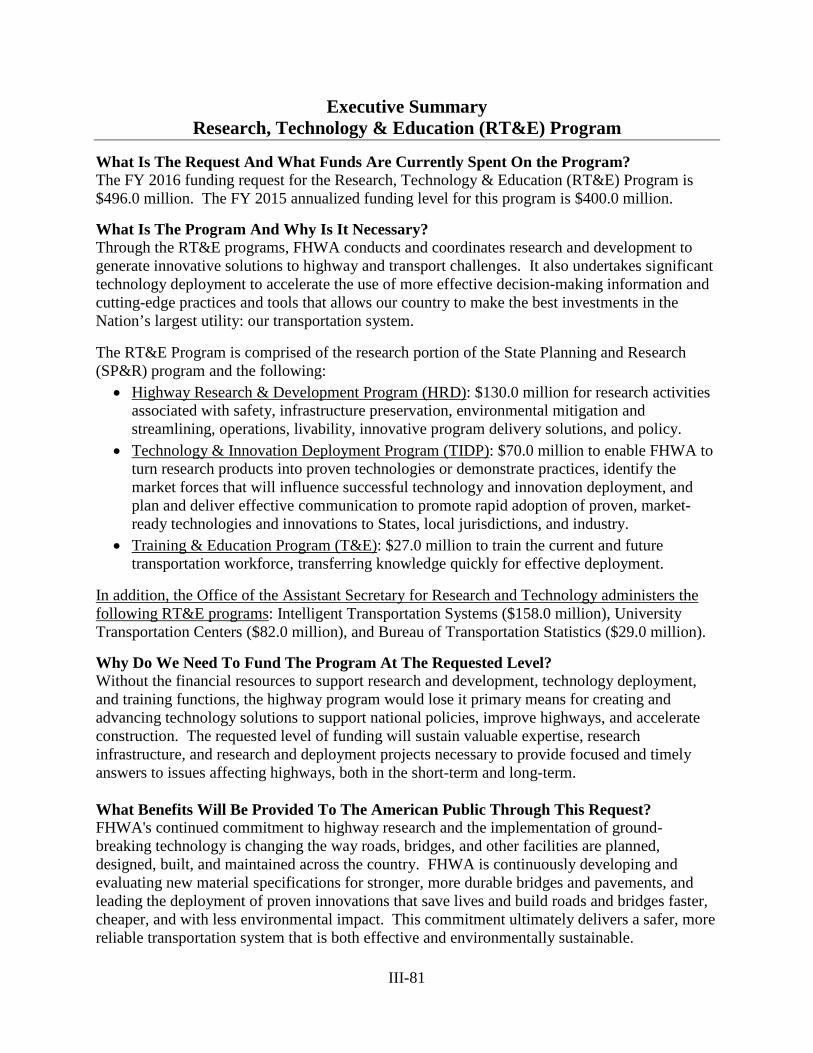
III-81
Executive Summary Research, Technology & Education (RT&E) Program
What Is The Request And What Funds Are Currently Spent On the Program? The FY 2016 funding request for the Research, Technology & Education (RT&E) Program is $496.0 million. The FY 2015 annualized funding level for this program is $400.0 million. What Is The Program And Why Is It Necessary? Through the RT&E programs, FHWA conducts and coordinates research and development to generate innovative solutions to highway and transport challenges. It also undertakes significant technology deployment to accelerate the use of more effective decision-making information and cutting-edge practices and tools that allows our country to make the best investments in the Nation’s largest utility: our transportation system.
The RT&E Program is comprised of the research portion of the State Planning and Research (SP&R) program and the following:
• Highway Research & Development Program (HRD): $130.0 million for research activities associated with safety, infrastructure preservation, environmental mitigation and streamlining, operations, livability, innovative program delivery solutions, and policy.
• Technology & Innovation Deployment Program (TIDP): $70.0 million to enable FHWA to turn research products into proven technologies or demonstrate practices, identify the market forces that will influence successful technology and innovation deployment, and plan and deliver effective communication to promote rapid adoption of proven, market-ready technologies and innovations to States, local jurisdictions, and industry.
• Training & Education Program (T&E): $27.0 million to train the current and future transportation workforce, transferring knowledge quickly for effective deployment.
In addition, the Office of the Assistant Secretary for Research and Technology administers the following RT&E programs: Intelligent Transportation Systems ($158.0 million), University Transportation Centers ($82.0 million), and Bureau of Transportation Statistics ($29.0 million).
Why Do We Need To Fund The Program At The Requested Level? Without the financial resources to support research and development, technology deployment, and training functions, the highway program would lose it primary means for creating and advancing technology solutions to support national policies, improve highways, and accelerate construction. The requested level of funding will sustain valuable expertise, research infrastructure, and research and deployment projects necessary to provide focused and timely answers to issues affecting highways, both in the short-term and long-term. What Benefits Will Be Provided To The American Public Through This Request? FHWA's continued commitment to highway research and the implementation of ground-breaking technology is changing the way roads, bridges, and other facilities are planned, designed, built, and maintained across the country. FHWA is continuously developing and evaluating new material specifications for stronger, more durable bridges and pavements, and leading the deployment of proven innovations that save lives and build roads and bridges faster, cheaper, and with less environmental impact. This commitment ultimately delivers a safer, more reliable transportation system that is both effective and environmentally sustainable.
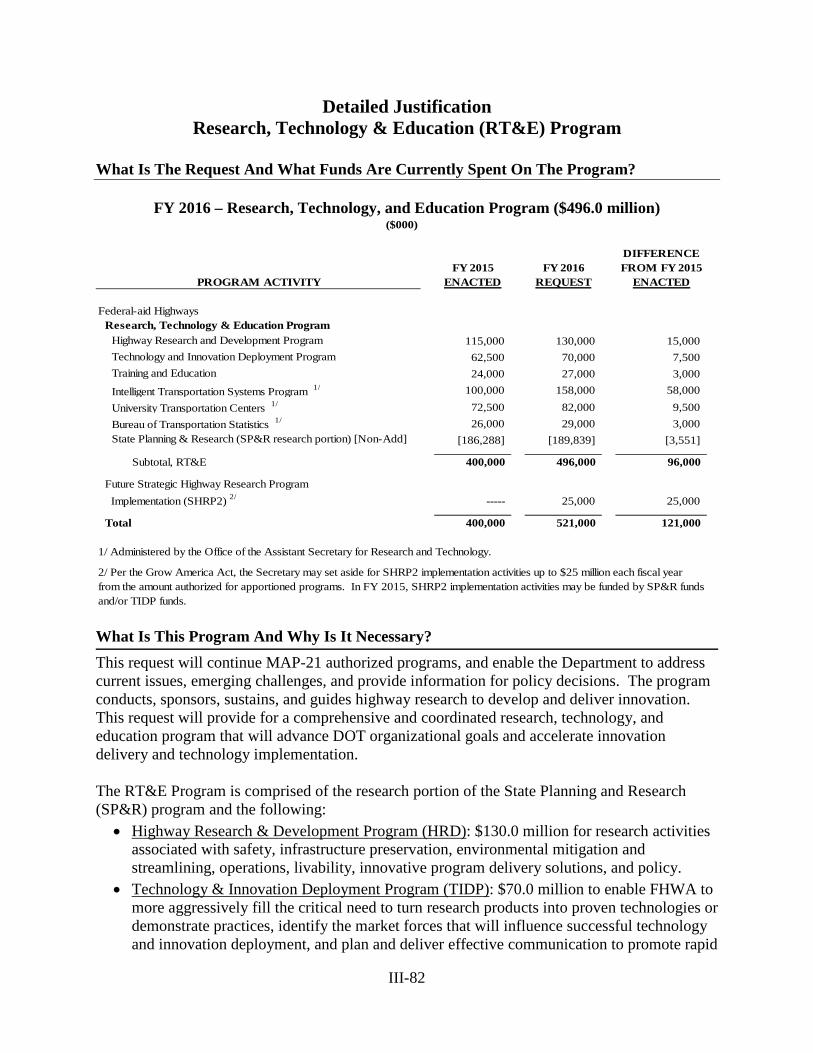
III-82
Detailed Justification Research, Technology & Education (RT&E) Program
What Is The Request And What Funds Are Currently Spent On The Program?
FY 2016 – Research, Technology, and Education Program ($496.0 million) ($000)
DIFFERENCEFY 2015 FY 2016 FROM FY 2015
PROGRAM ACTIVITY ENACTED REQUEST ENACTED
Federal-aid HighwaysResearch, Technology & Education Program
Highway Research and Development Program 115,000 130,000 15,000 Technology and Innovation Deployment Program 62,500 70,000 7,500 Training and Education 24,000 27,000 3,000 Intelligent Transportation Systems Program 1/ 100,000 158,000 58,000 University Transportation Centers 1/ 72,500 82,000 9,500 Bureau of Transportation Statistics 1/ 26,000 29,000 3,000 State Planning & Research (SP&R research portion) [Non-Add] [186,288] [189,839] [3,551]
Subtotal, RT&E 400,000 496,000 96,000
Future Strategic Highway Research Program Implementation (SHRP2) 2/ ----- 25,000 25,000
Total 400,000 521,000 121,000
1/ Administered by the Office of the Assistant Secretary for Research and Technology.
2/ Per the Grow America Act, the Secretary may set aside for SHRP2 implementation activities up to $25 million each fiscal year from the amount authorized for apportioned programs. In FY 2015, SHRP2 implementation activities may be funded by SP&R funds and/or TIDP funds. What Is This Program And Why Is It Necessary? This request will continue MAP-21 authorized programs, and enable the Department to address current issues, emerging challenges, and provide information for policy decisions. The program conducts, sponsors, sustains, and guides highway research to develop and deliver innovation. This request will provide for a comprehensive and coordinated research, technology, and education program that will advance DOT organizational goals and accelerate innovation delivery and technology implementation. The RT&E Program is comprised of the research portion of the State Planning and Research (SP&R) program and the following:
• Highway Research & Development Program (HRD): $130.0 million for research activities associated with safety, infrastructure preservation, environmental mitigation and streamlining, operations, livability, innovative program delivery solutions, and policy.
• Technology & Innovation Deployment Program (TIDP): $70.0 million to enable FHWA to more aggressively fill the critical need to turn research products into proven technologies or demonstrate practices, identify the market forces that will influence successful technology and innovation deployment, and plan and deliver effective communication to promote rapid
III-83
adoption of proven, market-ready technologies and innovations to States, local jurisdictions, and industry.
• Training & Education Program (T&E): $27.0 million to train the current and future transportation workforce, transferring knowledge quickly for effective deployment.
• Office of the Assistant Secretary for Research and Technology-administered RD&T programs: Intelligent Transportation Systems, University Transportation Centers, and Bureau of Transportation Statistics. Detailed justifications for these programs can be found in budget submission for the Office of the Secretary of Transportation (OST) - Office of the Assistant Secretary for Research and Technology.
The three categories under FHWA’s RT&E program cover all phases in the innovation life cycle. The HRD includes advanced and applied research, exploring new areas of research, developing and testing new products and processes with the potential to benefit the transportation system. Once a new product or technology has proven to provide value, after initial testing and evaluation, the TIDP supports the implementation, delivery and deployment phase, conducting refined testing and evaluation, market research, and assisting with marketing and communication matters for the technology or innovation to be widely used in the community. Another part of the innovation lifecycle is performed by the T&E program, which provides assistance to transportation agencies and users of these market-ready technologies, training and educating the workforce on how to efficiently implement and deploy the innovations. Additionally, States use the SP&R to conduct research of local or regional interest that may not be covered under the HRD. The TIDP can assist with the deployment phase of technologies and innovations developed by State research programs, transportation pooled funds, or other research entities. Why Do We Need To Fund The Program At The Requested Level? The RT&E program generates new solutions, provides better decision-making information and tools, and builds effective partnerships that will allow our country to make the best investments in the nation’s largest utility— our transportation system. The entire innovation lifecycle is covered under the RT&E program umbrella: from agenda-setting to research and development, to technology testing and evaluation, to the deployment and impact evaluation of market-ready technologies and innovations. Without funding for the RT&E program, the nation’s highway program would lose its primary means for creating and advancing technology solutions to support national policies, improve highways, and accelerate construction. The loss of expertise, research infrastructure, and research and deployment funds will devastate the ability to provide focused and timely expertise to emergency or emerging issues affecting highways, both in the short-term and long-term. FHWA leadership is committed to working collaboratively with its partners in defining the FHWA research and technology agenda needed to address six national high priority highway research and technology challenges: advancing safety, improving mobility, maintaining infrastructure integrity, enhancing performance, promoting sustainability, and preparing for the future. Partnership is an important aspect, since these partners may at times be the ones implementing the technologies and innovations developed.
III-84
The three main components of the RT&E program are as follows: Highway Research and Development Program (HRD) HRD highlights FHWA’s leadership in developing a comprehensive, nationally-coordinated FHWA highway research and development program, engaging and cooperating with other highway research stakeholders. The research conducted aims to collect information that ultimately provides transportation policymakers tools and products that allows them to make accurate decisions that improve our Nation’s quality of life. The HRD program includes FHWA’s advanced and applied research, and facilitates national and international coordination and collaboration to leverage knowledge and develop solutions to address current and emerging highway transportation needs. The Program is closely coordinated with, but does not duplicate, R&D conducted through the University Transportation Center Program, the Intelligent Transportation System Program, the pooled fund National Cooperative Highway Research Program, and State-based research and technology initiatives. The major areas under the HRD program are:
• Safety - Activities emphasize data-driven analysis of roadway-related safety considerations and specific improvement in four crash areas: roadway departure, intersection, pedestrian, and speeding. The program conducts rigorous evaluations to determine what safety improvements can be expected with the introduction of countermeasure designs or operations. All design or operational changes are assessed from a human factor perspective to eliminate or minimize unexpected consequences of change. FHWA works in cooperation with NHTSA and FMCSA to develop tools and technologies to reduce crashes and improve transportation safety.
• Infrastructure - FHWA conducts problem-focused research, development, and communications outreach activities to preserve the existing investment in our Nation’s highway infrastructure and to build for the future through the application of advanced technologies that improve infrastructure integrity. Infrastructure-related research focuses on three major areas: pavements, bridges and structures, and asset management. This work includes: a) development of metrics to assess the performance of infrastructure over the longer term; b) research and development of technologies and techniques to assure that our Nation’s infrastructure is world class from a standpoint of longevity, safety, performance, climate-change mitigation, and sustainability; and c) leadership to ensure effective follow-up and deployment of the improvements developed, particularly those that will speed construction and reduce congestion caused by construction.
• Planning and Environment - Activities include carrying out short and long-term livability and sustainability initiatives to improve project delivery and enhance communities that are impacted by or benefit from surface transportation projects, including nonmotorized transportation networks; developing comprehensive strategies to minimize negative impacts of and maximize benefits from transportation investment on the natural and human environment; developing capabilities to adjust to changing climate conditions; advancing state of the practice for data collection, geographic information systems applications, and travel forecasting; and providing technical assistance and forums, best practices, and training to assist States, metropolitan planning organizations, local public agencies, and other partners and stakeholders in planning and delivering surface transportation projects.
III-85
• Operations - FHWA conducts research on the application of cutting-edge technologies to move people and goods better, quicker, more reliably, and safer. The primary focus is on congestion relief solutions. This work will mitigate the impacts of recurring congestion, and deal more effectively with non-recurring events that cause congestion; such as traffic incidents, work zones, adverse weather conditions, and planned special events. Activities also include conducting applied research to develop the next generation of traffic management systems and models, and researching specific technologies that can improve the performance of the system’s services and support to the connected vehicle and other Intelligent Transportation System initiatives. This research area also pursues a broad range of activities designed to enhance freight productivity and economic competitiveness of the United States. These are targeted at improving freight movement, reducing freight-related congestion throughout the network, evaluating impacts of vehicle size and weight, advancing freight operations and technology, and developing freight performance measurement and management systems.
• Policy - The Policy program analyzes emerging issues in the transportation community, including climate change, highway revenues, performance management, authorizing legislation, and a host of other issues. The program also supports data collection on motor fuels, motor vehicles, licensed drivers, roadway characteristics, pavement conditions, travel trends, and travel behavior. Policy data collection and forecasting efforts provide the foundation on which program administration, policy analysis and implementation, and legislative support all rely. The Policy area is responsible for the development of the Infrastructure Investment Needs Report, which promotes the ongoing development of engineering and economic analytical tools and related products to assess the current and future conditions and performance of our Nation’s highways and bridges. Policy research initiatives include conducting research through strategic alliances as an associate of the Forum of European Highway Research Laboratories (FEHRL), and other activities to gain better knowledge of technology and best practices put in place in other countries that can improve the U.S. surface transportation system. The initiatives also support implementation of these innovations, leveraging resources to enable the U.S. to benefit from investments made by foreign counterparts, and creating business opportunities for the U.S. private sector.
• Innovative Program Delivery – The FHWA conducts research into innovative strategies for financing, procuring, and delivering large-scale highway infrastructure projects. Because the successful deployment of these strategies requires public sponsors to develop extensive analytical and transactional skills, significant capacity building and technical assistance efforts occur alongside the research activities.
• Next Generation Research & Technology - The Next Generation Research & Technology (R&T) program is responsible for leading the development and coordination of the FHWA components of a national highway research agenda to provide policy-makers and the research community information needed to address critical knowledge gaps, develop collaboration opportunities, and accelerate innovation and technology deployment to meet future highway transportation needs. Next Generation R&T also encompasses the Exploratory Advanced Research (EAR) Program, which conducts longer-term, higher-risk research with the potential for dramatic breakthroughs in surface transportation. Next Generation R&T also supports the operation of the Turner-Fairbank
III-86
Highway Research Center (TFHRC), a Federally-owned and operated research facility in McLean, Virginia that provides State and local governments, FHWA, and the world highway community with advanced and targeted applied research and development related to new highway technologies.
Technology & Innovation Deployment Program (TIDP) After innovations and technologies have gone through an initial testing and evaluation process; and they are ready to be put through a more refined, conclusive testing, or they are ready to be deployed, these technologies are advanced into the TIDP. This is where final analysis, pilots, demonstrations, marketing, communications, and promotional activities are conducted to accelerate its adoption by State DOTs and other government entities or beneficiaries. Previous funding of this aspect of the innovation lifecycle has resulted in the under-utilization of a number of market-ready technologies that could be highly beneficial to the industry. Thus, FHWA has established a separate program area that aims at advancing deployment-ready technologies resulting from HRD, or takes market-ready technologies developed by other entities and supports their accelerated implementation by State DOTs or other stakeholders.
In addition, under the GROW AMERICA Act, the Secretary may set aside each fiscal year up to $25 million from the amount authorized for apportioned programs to fund the Strategic Highway Research Program 2 (SHRP2) implementation.
Examples of TIDP activities include: 1. Accelerated Innovation Deployment Demonstration Program: The program provides
incentive funding for eligible entities to accelerate the implementation and adoption of innovation in highway transportation. Funds are available to cover the full cost of implementation of an innovation on a project, up to the maximum award amount of $1,000,000. Eligible activities must address the TIDP goals and may be in any aspect of highway transportation including planning, financing, operation, structures, materials, pavements, environment, and construction on any project eligible for assistance.
2. State Transportation Innovation Council (STIC) Incentive Program: The STIC Incentive Program offers technical assistance and up to $100,000 per STIC per year to support the costs of standardizing innovative practices in a State transportation agency or other public sector STIC stakeholder. An example of an innovation being accelerated into statewide, standard practice under the STIC Incentive Program in FY2014 is Missouri DOT’s development of connection details and specifications for a Fiber Reinforced Polymer full-depth bridge deck panel.
3. SHRP2 Implementation Assistance Program: The FHWA, in coordination with the American Association of State Highway and Transportation Officials (AASHTO), is implementing a multi-year plan to jointly deploy SHRP2 priority products. Through the SHRP2 Implementation Assistance program, States can apply for incentive funding or technical assistance to deploy SHRP2 products. For example, the Service Life Design Guide for Bridges may be utilized to provide longer service life by design through durable and state-of-the-art materials, construction techniques, and utilization of emerging technologies that are ideally suited for the bridge—saving lives, money, and time.
4. Every Day Counts Initiative (EDC): EDC identifies under-utilized market-ready technologies with high pay-offs and accelerates their deployment and acceptance throughout the Nation.
III-87
Training and Education Program (T&E) T&E is responsible for training the current and future transportation workforce, transferring knowledge quickly and effectively to and among transportation professionals, and providing education solutions throughout the full innovation lifecycle. T&E provides a wide variety of services and products, including:
• The National Highway Institute provides training courses to present the latest technologies and best practices in highway construction.
• The Local and Tribal Technical Assistance Programs (LTAP/TTAP) support technology transfer centers in all 50 States, Puerto Rico, and regional centers serving Native American Tribal governments.
• Training and Workforce Development Programs: o The Dwight David Eisenhower Transportation Fellowship Program provides
opportunities for students and faculty to research transportation topics. o The Garret A. Morgan Technology and Transportation Education Programs enhance
science, technology, engineering, and mathematics at the elementary and secondary school level.
o The Transportation Education Development Program develops new curricula and education programs to train individuals at all levels of the transportation workforce.
o Freight Planning Capacity Building supports enhancements in freight transportation planning.
o The Surface Transportation Centers for Excellence will promote and support strategic programs and activities in the areas of environment, surface transportation safety, rural safety, and project finance.
State Planning & Research Program (SP&R) The SP&R program is a set aside of four of the formula programs: National Highway Performance Program, Surface Transportation Program, Congestion Mitigation Air Quality Program, and Highway Safety Improvement Program that the States must use for planning and research purposes.
States must allocate a minimum of 25 percent of their SP&R apportionment for research, development, and technology activities. SP&R activities involve research on new areas of knowledge; adapting findings to practical applications by developing new technologies; and the transfer of these technologies, including the process of dissemination, demonstration, training, and adoption of innovations by users.
SP&R is intended to solve problems identified by the States. State DOTs are encouraged to develop, establish, and implement research programs that anticipate and address transportation concerns before they become critical problems. High priority is given to applied research on State or regional problems, transfer of technology from researcher to user, and research for setting standards and specifications. State DOTs are encouraged to cooperate with other States, the FHWA, and other agencies to achieve National research objectives and to develop a technology transfer program to promote and use those results. States are encouraged to pool their funds in cooperative research efforts as a means of addressing national and regional issues and as a means of leveraging funds. This includes contributing to cooperative programs such as the National Cooperative Highway Research Program (NCHRP), the Transportation Research Board (TRB), and transportation pooled fund studies.
III-88
What Benefits Will Be Provided To The American Public Through This Request?
FHWA's continued commitment to highway research and the implementation of ground-breaking technology is changing the way roads, bridges, and other facilities are planned, designed, built, and maintained across the country. This commitment ultimately delivers a safer, more reliable transportation system that is both effective and environmentally sustainable. Additionally, research and development activities are crucial to the development of improved performance measures, data collection and analysis tools, modeling and planning tools, accelerated project delivery methods, and more durable materials in support of all departmental goals and objectives. The success of the RT&E program can be illustrated through the following program highlights: Research in Response to Emergency Events and Incidents
• Researchers at FHWA supported the National Transportation Safety Board in investigating and determining the cause of the I-35W bridge collapse in Minneapolis in August 2007. FHWA’s TFHRC then developed tools and procedures that bridge owners across the country are using to ensure the safety of the hundreds of similar bridges through improved evaluation and design methods, and repair techniques.
• Following 9/11, FHWA embarked on a comprehensive research program to improve the safety and security of the Nation’s bridges and tunnels. In partnership with the Department of Homeland Security and the Army Corps of Engineers, FHWA developed design approaches and retrofit methods to allow bridges to withstand blast loadings.
• In response to an industry-initiated warning about potentially elevated chloride levels in grout used to protect post-tensioning steel in major bridges throughout the U.S., FHWA conducted an accelerated corrosion research study and developed the basis used in guidance to State DOTs for assessing and mitigating the impact on bridges with this grout material. Based on the guidance, bridge owners can take appropriate actions to repair, maintain, or replace bridges.
Research that Provides Key Tools and Methods
• Low Cost Safety Countermeasures: FHWA and 38 partner States evaluated the benefits of deploying over 40 low-cost highway safety countermeasures, such as offset improvements for left-turn lanes, increased retro-reflectivity at stop signs, and lane and shoulder width combinations on rural, two-lane, undivided roads.
• Improving Mobility for Travelers with Disabilities: In 2013, FHWA initiated a multi-modal USDOT effort called the Accessible Transportation Technologies Research Initiative (ATTRI) to enhance mobility choices and quality for travelers with disabilities, including those with mobility, vision, hearing and intellectual impairments, veterans with disabilities, as well as our aging population. The goal is to provide these groups with the capability to reliably, safely and independently plan and execute their travel. The National Institute of Disability and Rehabilitation Research and other Federal agencies are participating.
• Corrosion Mitigation: FHWA and its partners have developed and implemented a corrosion mitigation research roadmap to develop improved technologies to find and assess the significance of corrosion on key structural components that are often “hidden” from conventional inspection methods.
III-89
Innovative Research to Improve Highways and Accelerate Construction and Decision-Making
• Bridge Conditions Assessments for Longer-Lasting Structures: FHWA is working closely with State DOTs and industry to develop an improved understanding of how to better design and maintain bridges. In collaboration with Rutgers University, FHWA researchers designed and constructed the RABIT™ concrete bridge deck condition assessment tool. This tool collects and instantly integrates and visualizes quality bridge deck condition data. The approach is much faster and more consistent than conventional approaches. The RABIT™ was selected by the American Society of Civil Engineers for the 2014 Charles Pankow Award for Innovation. FHWA is also developing a device to evaluate existing bridge foundations for the effects of bridge scour, which is the major cause of bridge failure in the U.S. Both of these FHWA innovations will help identify bridge deck and structure deficiencies before they become life threatening.
• Improved Traffic Flow and Safety for Less Cost: Recognized as an outstanding innovation during the last several years by both AASHTO and Popular Science (“Best of What’s New 2009”), the innovative Diverging Diamond interchange design allows States to meet excessive traffic demands at interchanges, without paying for very expensive construction of full interchanges or expanding bridges to accommodate double turn lanes. FHWA’s TFHRC studied, analyzed, simulated and tested the design, which involves shifting traffic to the opposite side of the road to reduce space and traffic signal time for turning vehicles. The design can saves million in construction costs per location.
• Durable and Sustainable Pavements: The Pavement Test Facility at the TFHRC is evaluating the use of high levels of Reclaimed Asphalt Pavement (RAP) and Reclaimed Asphalt Shingles (RAS) mixes. This study will provide the basis for expanded guidance on the use of these materials to achieve durable, cost effective and environmentally sustainable pavements, as well as saving construction time.
• Evaluating Sustainability: FHWA developed a tool, called INVEST, to help State DOTs and MPOs voluntarily evaluate and improve the sustainability of highway systems, programs, and projects. INVEST, which was recognized by the American Society of Engineers, is being used to inform the development of long-range transportation plans and corridor plans, assess and improve the sustainability of specific projects, and inform operations and maintenance programs on more sustainable and cost effective practices.
Exploring and Advancing Technologies and Innovations for the Future • Connected & Automated Vehicles: FHWA research into radio connectivity between
highway infrastructure, vehicles, and other highway users will help reduce up to 80% of non-impaired crashes and enable improved traffic flow capabilities.
• In partnership with the Virginia DOT, FHWA will be demonstrating how connected vehicle technology can improve traffic streams and reduce the effects of bottlenecks, thereby increasing reliability and environmental benefits while improving safety and providing additional travel comfort and convenience.
Accelerating Program Delivery and the Deployment of Innovations • The EDC initiative, which was strongly endorsed by the Congress in the MAP-21
legislation, is a State-based model in which FHWA coordinates rapid deployment of proven, market-ready strategies and technologies to shorten the project delivery process,
III-90
enhance roadway safety, and improve environmental sustainability. Recent accomplishments include:
• Approximately 150 new or updated programmatic agreements were initiated to streamline the process for handling routine environmental requirements, significantly reducing review time on projects.
• Design or construction of more than 850 replacement bridges using prefabricated bridge elements and systems, reducing construction time and associated traffic delays.
• Increased the use of warm-mix asphalt, which provides environmental and construction benefits, from 5% to 30% of the total asphalt produced. Warm-mix asphalt is estimated to increase to over 75% in the next 3 to 5 years.
• Between 2005 and 2013, 164 geosynthetic reinforced soil-integrated bridge systems (GRD-IBS) have been designed or constructed in the U.S., including 14 on the National Highway System. GRS-IBS is an innovative technology developed by FHWA researchers that not only provides a smooth transition from the bridge onto the roadway, alleviating the “bump at the bridge” problem, but also reduces construction time and cost.
Training Staff in Remote Communities through Technical Assistance Programs In 2013, 110,000 local and Tribal transportation officials received training in infrastructure management, safety, and workforce development through Local and Tribal Technical Assistance Program (LTAP/TTAP) centers. The Centers are located in all 50 States and Puerto Rico, with 7 additional regional centers serving Native American Tribal governments. In some rural areas, LTAP centers provide the only professional development and technical training the agency staff receives. LTAP/TTAP Centers are FHWA’s primary connection for technology deployment to local agencies, and they also provide on-site technical assistance to aid local agencies implement low-cost safety improvements and conduct roadway safety audits. For details about the Office of the Assistant Secretary for Research and Technology-administered RT&E programs, see the budget submissions for the Office of the Secretary of Transportation (OST) -- Office of the Assistant Secretary for Research and Technology.
III-91
Executive Summary Federal Allocation Programs
What Is The Request And What Funds Are Currently Spent On The Program? The budget request for the Federal Allocation Programs is as follows: $100.0 million for the Emergency Relief (ER) program; $190.0 million for the Territorial and Puerto Rico Highway Program; $70.0 million for the Construction of Ferry Boats and Ferry Terminal Facilities Program; $11.0 million for the On-The-Job Training (OJT) Program; $11.0 million for the Disadvantaged Business Enterprise (DBE) Program; and $10.0 million for the Highway Use Tax Evasion Projects Program. These funding levels are the same as the annualized levels for FY 2015 with the exception of the OJT Program, the DBE Program, the Ferry Boats Program, and the Highway Use Tax Evasion Projects Program. OJT and DBE are each increased by $1 million, while the Ferry Boats Program is increased by $3 million. The Highway Use Tax Evasion Projects Program is increased by $8 million to restore the program to its FY 2014 level after being temporarily reduced in FY 2015. Additionally, two new programs are proposed in the GROW AMERICA Act. Ladders of Opportunity and the Performance Management Data Support Program (PMDSP) are requested at $100.0 million and $10.0 million, respectively, for FY 2016. What Is The Program And Why Is It Necessary? This program category contains eight separate programs that will provide disparate functions to assist federal highways. This includes assistance: to States and localities for the repair of damage to Federal-aid highways from natural events and catastrophic failures due to an external cause; for Puerto Rico and U.S. territories to build vital transportation infrastructure important for their mobility needs and to serve national defense and global trade needs; to construct ferry boat and ferry terminals to enhance the federal-aid network; for States to enhance the development of our nation’s highway construction industry workforce; for States to assist certified DBE firms in becoming competitive when seeking to obtain highway and bridge construction contracts; and to support highway use tax evasion enforcement efforts. Ladders of Opportunity is a two-part program that: provides enhanced developmental opportunities for disadvantaged persons to qualify them for and place them in transportation jobs; and engages large metropolitan planning organizations (MPOs) in pilot activities that identify and implement approaches to enhance transportation connections to economic opportunities. The PMDSP provides comprehensive resources and analytical tools for use by States and MPOs in responding to Moving Ahead for Progress (MAP-21) and GROW AMERICA requirements, particularly for implementation of a performance-based federal highway program and for the Federal Highway Administration in support of its mission. Why Do We Need To Fund The Program At The Requested Level? These diverse programs serve key functions that provide long-standing, positive impacts on the U.S. highway infrastructure. Funding Ladders of Opportunity at $100 million will incentivize States and MPOs to achieve meaningful results in transportation workforce development for disadvantaged persons and the enhancement of transportation and economic opportunity connectivity. By funding the PMDSP at $10 million, the resulting data and analytical tools can yield significant savings, for State DOTs and others, above and beyond the cost of this program. Use of data by USDOT and its operating administrations, as well as States and local
III-92
governments where applicable, can identify the difference between operational and policy improvements and where capital investment is actually needed. Collection of data and development of analysis tools at the national level, rather than the State or local level, can also create significant economies of scale that reduce the overall investment required. What Benefits Will Be Provided To The American Public Through This Request? The long-standing programs in the overall Federal Allocation Programs perform the following vital functions: help States, territories, and localities repair damage to Federal-aid highways from natural events and catastrophic failures due to an external cause; build vital transportation infrastructure in Puerto Rico and the U.S. territories that is important for their mobility needs and to serve national defense and global trade needs; construct ferry boat and ferry terminals to improve the mobility of the transportation network; enhance development of our nation’s highway construction industry workforce, particularly for historically underrepresented groups; assist certified DBE firms in becoming competitive when seeking to obtain highway and bridge construction contracts; and support highway use tax evasion enforcement efforts. Ladders of Opportunity will help Americans reach the middle class by: providing transportation options that are more affordable and reliable and improving quality of life through greater access to education and new job opportunities; and providing the training and networking that will yield good paying jobs. The PMDSP will result in better investment strategies and improved performance of the transportation system for the American public.
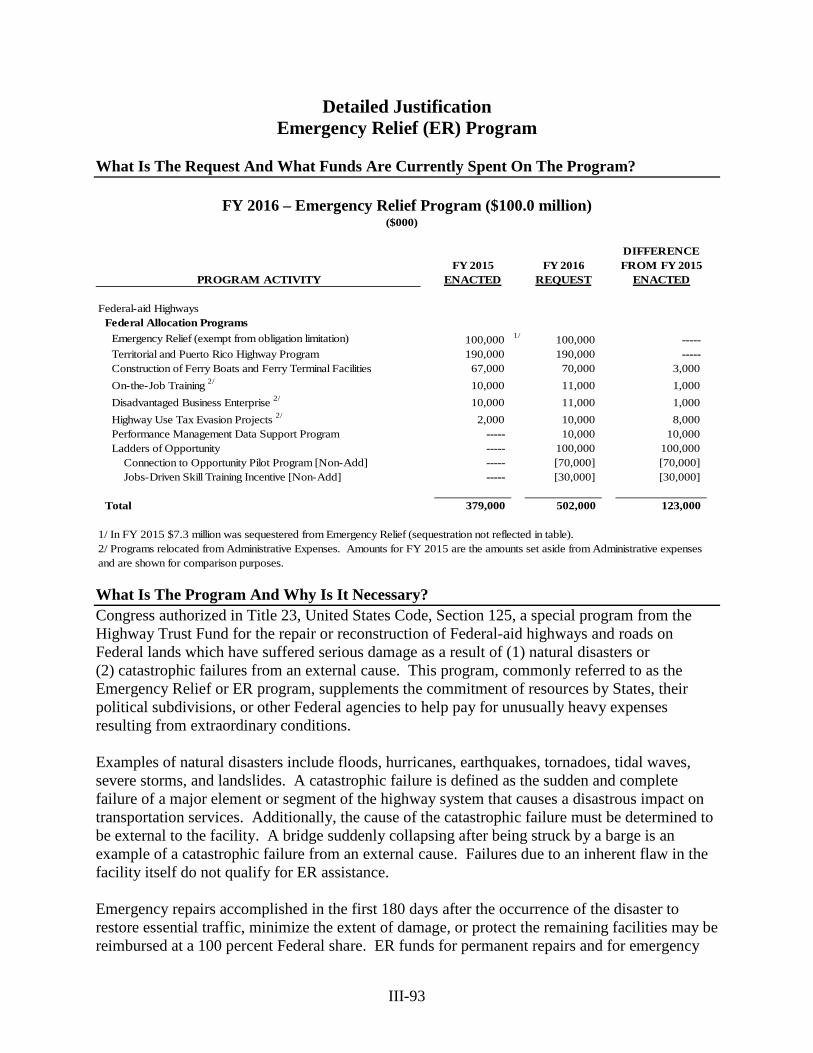
III-93
Detailed Justification Emergency Relief (ER) Program
What Is The Request And What Funds Are Currently Spent On The Program?
FY 2016 – Emergency Relief Program ($100.0 million)
($000)
DIFFERENCEFY 2015 FY 2016 FROM FY 2015
PROGRAM ACTIVITY ENACTED REQUEST ENACTED
Federal-aid HighwaysFederal Allocation Programs
Emergency Relief (exempt from obligation limitation) 100,000 1/ 100,000 ----- Territorial and Puerto Rico Highway Program 190,000 190,000 ----- Construction of Ferry Boats and Ferry Terminal Facilities 67,000 70,000 3,000 On-the-Job Training 2/ 10,000 11,000 1,000 Disadvantaged Business Enterprise 2/ 10,000 11,000 1,000 Highway Use Tax Evasion Projects 2/ 2,000 10,000 8,000 Performance Management Data Support Program ----- 10,000 10,000 Ladders of Opportunity ----- 100,000 100,000 Connection to Opportunity Pilot Program [Non-Add] ----- [70,000] [70,000] Jobs-Driven Skill Training Incentive [Non-Add] ----- [30,000] [30,000]
Total 379,000 502,000 123,000
1/ In FY 2015 $7.3 million was sequestered from Emergency Relief (sequestration not reflected in table).2/ Programs relocated from Administrative Expenses. Amounts for FY 2015 are the amounts set aside from Administrative expenses and are shown for comparison purposes.
What Is The Program And Why Is It Necessary? Congress authorized in Title 23, United States Code, Section 125, a special program from the Highway Trust Fund for the repair or reconstruction of Federal-aid highways and roads on Federal lands which have suffered serious damage as a result of (1) natural disasters or (2) catastrophic failures from an external cause. This program, commonly referred to as the Emergency Relief or ER program, supplements the commitment of resources by States, their political subdivisions, or other Federal agencies to help pay for unusually heavy expenses resulting from extraordinary conditions. Examples of natural disasters include floods, hurricanes, earthquakes, tornadoes, tidal waves, severe storms, and landslides. A catastrophic failure is defined as the sudden and complete failure of a major element or segment of the highway system that causes a disastrous impact on transportation services. Additionally, the cause of the catastrophic failure must be determined to be external to the facility. A bridge suddenly collapsing after being struck by a barge is an example of a catastrophic failure from an external cause. Failures due to an inherent flaw in the facility itself do not qualify for ER assistance. Emergency repairs accomplished in the first 180 days after the occurrence of the disaster to restore essential traffic, minimize the extent of damage, or protect the remaining facilities may be reimbursed at a 100 percent Federal share. ER funds for permanent repairs and for emergency
III-94
repair work accomplished more than 180 days after an event are at the pro rata Federal-aid share that would normally apply to the facility being repaired. This 180 day period can be extended in consideration of any delay in the State’s ability to access damaged facilities to evaluate damage and the cost of repair. Following the 2005 Gulf Coast Hurricanes, more than $2.8 billion in ER funds were provided to assist States in the repair and recovery of Federal-aid highways damaged by the hurricanes. These funds were instrumental in assisting the Gulf Coast region with needed recovery efforts following the devastating impact from Hurricanes Katrina, Rita, and Wilma. More recently, over $500 million was provided to Mid-Atlantic and Northeast states in response to Superstorm Sandy. Nearly $60 million of this funding was provided within days after the storm to allow States to address their most critical emergency needs. The immediate availability of ER funds was essential in providing these funds. When a natural disaster or catastrophe strikes, the ER program is available to provide assistance to get damaged highways open to essential traffic. Longer term permanent repairs to restore damaged highways are also funded through the ER program. Why Do We Need To Fund The Program At The Requested Level?
The ER program has been funded through a recurring annual authorization of $100.0 million since 1972. When ER program needs exceed available funding, Congress has provided supplemental appropriations to cover the ER backlog. Over the past 12 years, the costs of nationwide ER events, not including large scale disasters (e.g., Hurricane Katrina, Hurricane Sandy) have averaged about $350 million annually. Within the same time frame, including large scale disasters, the average costs increased to about $750 million annually. Over the past 20 years, $12.2 billion has been provided through supplemental appropriations to the ER program, in addition to the annual $100 million authorization. In FY 2013, Congress appropriated $2.0 billion for Superstorm Sandy and other disasters. That appropriation is not part of the Federal-aid Highways account and is funded by the General Fund. In 2013, ER funds were provided for 35 separate disasters. The average annual need for ER funds has been in the range of $300-400 million; however, in recent years, large-scale events such as Hurricane Irene and Superstorm Sandy have pushed annual needs above $1 billion. These needs have been funded from the annual ER appropriation as well as supplemental funds, provided by Congress. What Benefits Will Be Provided To The American Public Through This Request?
ER program funds are critical to maintaining mobility and safety for the American public following a disaster. Natural disasters and catastrophes that destroy highways and bridges are unpredictable events and can occur anywhere in the country. The ER program provides funding to States for the repair and reconstruction of Federal-aid highways and roads on Federal lands following a disaster.
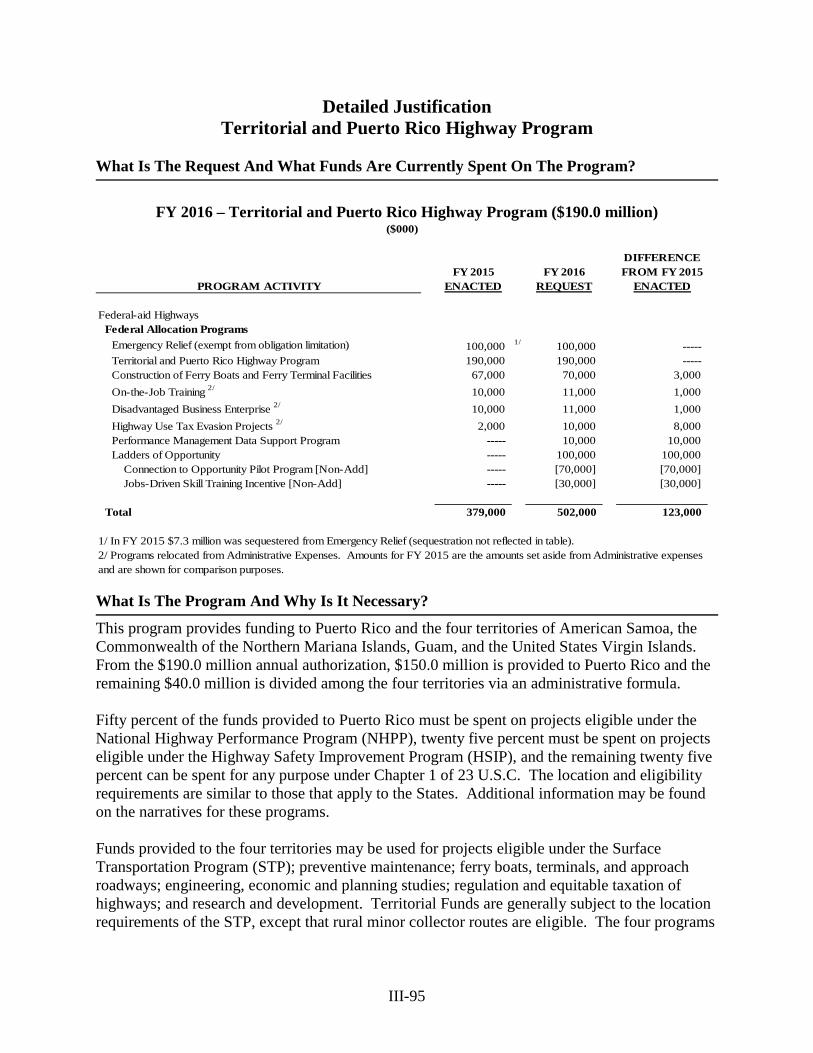
III-95
Detailed Justification Territorial and Puerto Rico Highway Program
What Is The Request And What Funds Are Currently Spent On The Program?
FY 2016 – Territorial and Puerto Rico Highway Program ($190.0 million)
($000)
DIFFERENCEFY 2015 FY 2016 FROM FY 2015
PROGRAM ACTIVITY ENACTED REQUEST ENACTED
Federal-aid HighwaysFederal Allocation Programs
Emergency Relief (exempt from obligation limitation) 100,000 1/ 100,000 ----- Territorial and Puerto Rico Highway Program 190,000 190,000 ----- Construction of Ferry Boats and Ferry Terminal Facilities 67,000 70,000 3,000 On-the-Job Training 2/ 10,000 11,000 1,000 Disadvantaged Business Enterprise 2/ 10,000 11,000 1,000 Highway Use Tax Evasion Projects 2/ 2,000 10,000 8,000 Performance Management Data Support Program ----- 10,000 10,000 Ladders of Opportunity ----- 100,000 100,000 Connection to Opportunity Pilot Program [Non-Add] ----- [70,000] [70,000] Jobs-Driven Skill Training Incentive [Non-Add] ----- [30,000] [30,000]
Total 379,000 502,000 123,000
1/ In FY 2015 $7.3 million was sequestered from Emergency Relief (sequestration not reflected in table).2/ Programs relocated from Administrative Expenses. Amounts for FY 2015 are the amounts set aside from Administrative expenses and are shown for comparison purposes.
What Is The Program And Why Is It Necessary?
This program provides funding to Puerto Rico and the four territories of American Samoa, the Commonwealth of the Northern Mariana Islands, Guam, and the United States Virgin Islands. From the $190.0 million annual authorization, $150.0 million is provided to Puerto Rico and the remaining $40.0 million is divided among the four territories via an administrative formula. Fifty percent of the funds provided to Puerto Rico must be spent on projects eligible under the National Highway Performance Program (NHPP), twenty five percent must be spent on projects eligible under the Highway Safety Improvement Program (HSIP), and the remaining twenty five percent can be spent for any purpose under Chapter 1 of 23 U.S.C. The location and eligibility requirements are similar to those that apply to the States. Additional information may be found on the narratives for these programs. Funds provided to the four territories may be used for projects eligible under the Surface Transportation Program (STP); preventive maintenance; ferry boats, terminals, and approach roadways; engineering, economic and planning studies; regulation and equitable taxation of highways; and research and development. Territorial Funds are generally subject to the location requirements of the STP, except that rural minor collector routes are eligible. The four programs
III-96
are administered under individual agreements between the Secretary and the chief executive officer of each of the territories. Territorial and Puerto Rico Highway Program funding is critical to providing transportation infrastructure to Puerto Rico and the four territories. Puerto Rico and the four territories have military facilities or serve a strategic role important to national defense. They also contribute to the national economy through tourism, agriculture and access to foreign trade. Why Do We Need To Fund The Program At The Requested Level? This level of funding is required to provide critical transportation infrastructure to Puerto Rico and the four territories. This will allow for access to military facilities key to national defense, as well as maintain and improve infrastructure vital to the region’s tourism, agriculture, and foreign trade. What Benefits Will Be Provided To The American Public Through This Request?
The Territorial and Puerto Rico Highway Program has provided for the construction of critical infrastructure in Puerto Rico and the U.S. territories. It helps them to develop economically and contribute to the national economy. It also provides critical infrastructure that serves key facilities or which in themselves serve a strategic role for national defense.
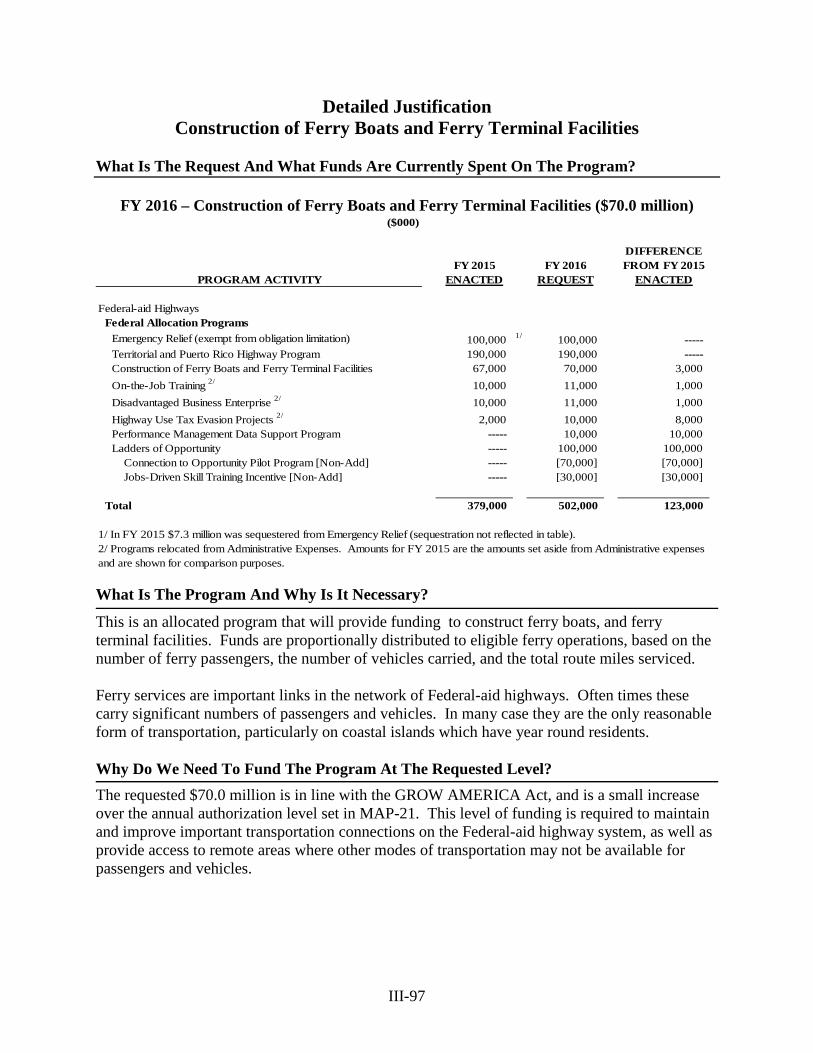
III-97
Detailed Justification Construction of Ferry Boats and Ferry Terminal Facilities
What Is The Request And What Funds Are Currently Spent On The Program?
FY 2016 – Construction of Ferry Boats and Ferry Terminal Facilities ($70.0 million)
($000)
DIFFERENCEFY 2015 FY 2016 FROM FY 2015
PROGRAM ACTIVITY ENACTED REQUEST ENACTED
Federal-aid HighwaysFederal Allocation Programs
Emergency Relief (exempt from obligation limitation) 100,000 1/ 100,000 ----- Territorial and Puerto Rico Highway Program 190,000 190,000 ----- Construction of Ferry Boats and Ferry Terminal Facilities 67,000 70,000 3,000 On-the-Job Training 2/ 10,000 11,000 1,000 Disadvantaged Business Enterprise 2/ 10,000 11,000 1,000 Highway Use Tax Evasion Projects 2/ 2,000 10,000 8,000 Performance Management Data Support Program ----- 10,000 10,000 Ladders of Opportunity ----- 100,000 100,000 Connection to Opportunity Pilot Program [Non-Add] ----- [70,000] [70,000] Jobs-Driven Skill Training Incentive [Non-Add] ----- [30,000] [30,000]
Total 379,000 502,000 123,000
1/ In FY 2015 $7.3 million was sequestered from Emergency Relief (sequestration not reflected in table).2/ Programs relocated from Administrative Expenses. Amounts for FY 2015 are the amounts set aside from Administrative expenses and are shown for comparison purposes.
What Is The Program And Why Is It Necessary?
This is an allocated program that will provide funding to construct ferry boats, and ferry terminal facilities. Funds are proportionally distributed to eligible ferry operations, based on the number of ferry passengers, the number of vehicles carried, and the total route miles serviced. Ferry services are important links in the network of Federal-aid highways. Often times these carry significant numbers of passengers and vehicles. In many case they are the only reasonable form of transportation, particularly on coastal islands which have year round residents. Why Do We Need To Fund The Program At The Requested Level? The requested $70.0 million is in line with the GROW AMERICA Act, and is a small increase over the annual authorization level set in MAP-21. This level of funding is required to maintain and improve important transportation connections on the Federal-aid highway system, as well as provide access to remote areas where other modes of transportation may not be available for passengers and vehicles.
III-98
What Benefits Will Be Provided To The American Public Through This Request?
The Construction of Ferry Boats and Ferry Terminal Facilities program addresses mobility and access in urban and rural areas by providing valuable assistance to help States and other entities replace or acquire new ferry boats; replace propulsion systems with newer cleaner and more energy efficient power plants; update navigational control systems; construct new terminals; improve access for the disabled; and replace and construct new docking facilities. Through these activities, the program provides vital connections on the network of Federal-aid highways, increasing mobility and safety particularly for citizens for which ferry services are the only reasonable transportation option.
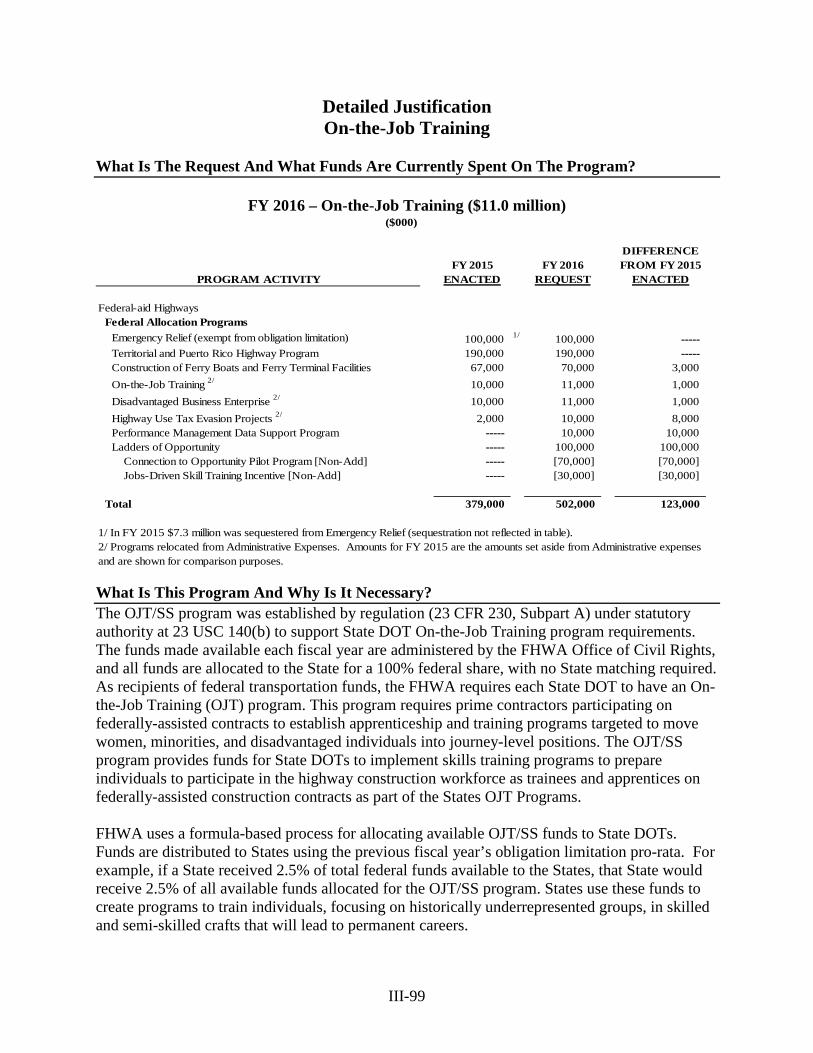
III-99
Detailed Justification On-the-Job Training
What Is The Request And What Funds Are Currently Spent On The Program?
FY 2016 – On-the-Job Training ($11.0 million)
($000)
DIFFERENCEFY 2015 FY 2016 FROM FY 2015
PROGRAM ACTIVITY ENACTED REQUEST ENACTED
Federal-aid HighwaysFederal Allocation Programs
Emergency Relief (exempt from obligation limitation) 100,000 1/ 100,000 ----- Territorial and Puerto Rico Highway Program 190,000 190,000 ----- Construction of Ferry Boats and Ferry Terminal Facilities 67,000 70,000 3,000 On-the-Job Training 2/ 10,000 11,000 1,000 Disadvantaged Business Enterprise 2/ 10,000 11,000 1,000 Highway Use Tax Evasion Projects 2/ 2,000 10,000 8,000 Performance Management Data Support Program ----- 10,000 10,000 Ladders of Opportunity ----- 100,000 100,000 Connection to Opportunity Pilot Program [Non-Add] ----- [70,000] [70,000] Jobs-Driven Skill Training Incentive [Non-Add] ----- [30,000] [30,000]
Total 379,000 502,000 123,000
1/ In FY 2015 $7.3 million was sequestered from Emergency Relief (sequestration not reflected in table).2/ Programs relocated from Administrative Expenses. Amounts for FY 2015 are the amounts set aside from Administrative expenses and are shown for comparison purposes.
What Is This Program And Why Is It Necessary? The OJT/SS program was established by regulation (23 CFR 230, Subpart A) under statutory authority at 23 USC 140(b) to support State DOT On-the-Job Training program requirements. The funds made available each fiscal year are administered by the FHWA Office of Civil Rights, and all funds are allocated to the State for a 100% federal share, with no State matching required. As recipients of federal transportation funds, the FHWA requires each State DOT to have an On- the-Job Training (OJT) program. This program requires prime contractors participating on federally-assisted contracts to establish apprenticeship and training programs targeted to move women, minorities, and disadvantaged individuals into journey-level positions. The OJT/SS program provides funds for State DOTs to implement skills training programs to prepare individuals to participate in the highway construction workforce as trainees and apprentices on federally-assisted construction contracts as part of the States OJT Programs. FHWA uses a formula-based process for allocating available OJT/SS funds to State DOTs. Funds are distributed to States using the previous fiscal year’s obligation limitation pro-rata. For example, if a State received 2.5% of total federal funds available to the States, that State would receive 2.5% of all available funds allocated for the OJT/SS program. States use these funds to create programs to train individuals, focusing on historically underrepresented groups, in skilled and semi-skilled crafts that will lead to permanent careers.
III-100
The OJT/SS Program is necessary to ensure that a competent workforce is available to meet highway construction hiring needs, and to address the historical under-representation of members of these groups in highway construction skilled crafts. The National Summer Transportation Institute (NSTI) Program and the Summer Transportation Internship Program for Diverse Groups (STIPDG) Program are also supported with OJT/SS funds. These programs are necessary to further strengthen FHWA efforts to develop the highway construction workforce of the future by introducing individuals to this industry at the more formative stages of their lives. Why Do We Need To Fund This Program At The Requested Level? The $11.0 million is in line with the GROW AMERICA Act, and is a slight increase over the FY 2015 funding amount. This level of funding is required to empower States to enhance these vital OJT/SS programs. In addition to the increase in funding, FHWA proposes to statutorily strengthen the effectiveness of the existing OJT/SS programs. As amended by the proposal, the OJT/SS program will require each State DOT to collaborate with the State agencies responsible for the State’s workforce, education, labor and economic development in order to:
• Develop detailed plans to train workers to fill these gaps with measurable goals and performance objectives—with a focus on women, minorities, and disadvantaged individuals;
• Establish a workforce compact by working in partnership with stakeholders like the Department of Education and Department of Labor, apprenticeship programs, and others with established programs to provide a coordinated approach to workforce training, employment services, and job placement;
• Demonstrate program outcomes through accomplishment reports that directly address objective measurements such as the number of program participants trained, the type of career job development training provided, the number of participants employed as a result of the training received, and the dollar cost per program participant.
What Benefits Will Be Provided To The American Public Through this Request? The American Public benefits because this program ensures continuity of our nation’s current and future highway construction industry workforce by providing the development and diversity of skilled labor. A skilled workforce is vital to constructing and maintaining a safe and efficient transportation system. Furthermore, this program helps create jobs for groups that are historically underrepresented in the transportation industry.
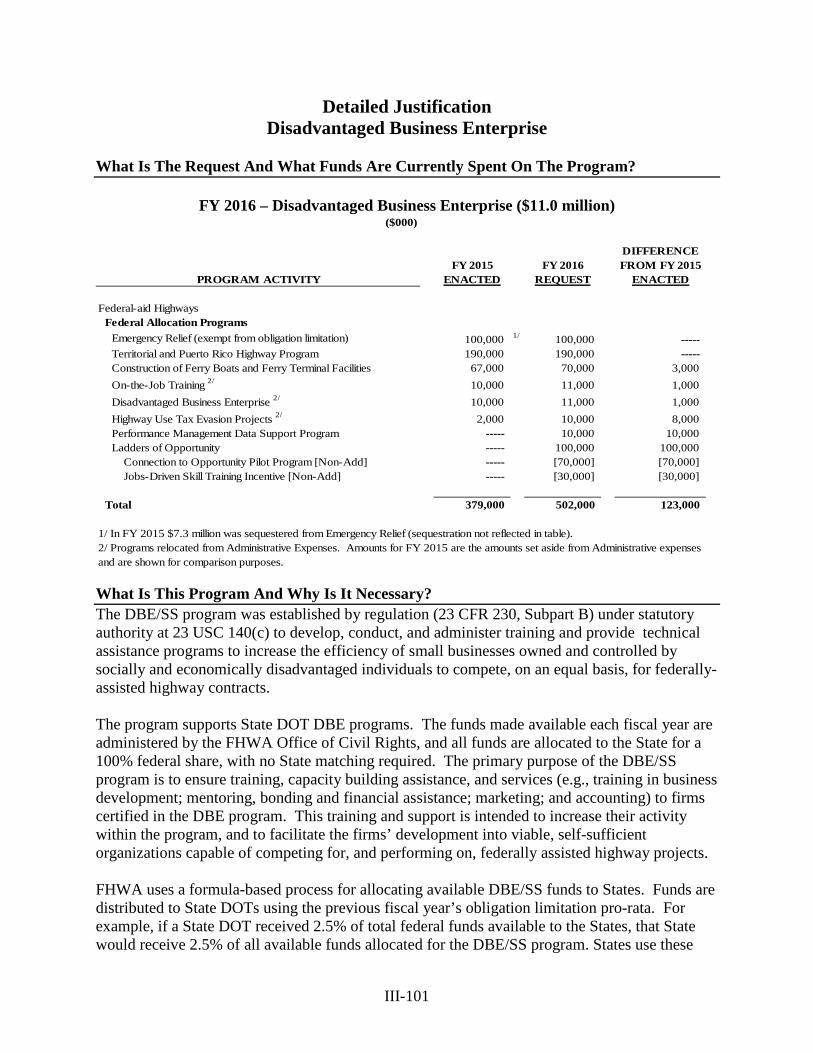
III-101
Detailed Justification Disadvantaged Business Enterprise
What Is The Request And What Funds Are Currently Spent On The Program?
FY 2016 – Disadvantaged Business Enterprise ($11.0 million)
($000)
DIFFERENCEFY 2015 FY 2016 FROM FY 2015
PROGRAM ACTIVITY ENACTED REQUEST ENACTED
Federal-aid HighwaysFederal Allocation Programs
Emergency Relief (exempt from obligation limitation) 100,000 1/ 100,000 ----- Territorial and Puerto Rico Highway Program 190,000 190,000 ----- Construction of Ferry Boats and Ferry Terminal Facilities 67,000 70,000 3,000 On-the-Job Training 2/ 10,000 11,000 1,000 Disadvantaged Business Enterprise 2/ 10,000 11,000 1,000 Highway Use Tax Evasion Projects 2/ 2,000 10,000 8,000 Performance Management Data Support Program ----- 10,000 10,000 Ladders of Opportunity ----- 100,000 100,000 Connection to Opportunity Pilot Program [Non-Add] ----- [70,000] [70,000] Jobs-Driven Skill Training Incentive [Non-Add] ----- [30,000] [30,000]
Total 379,000 502,000 123,000
1/ In FY 2015 $7.3 million was sequestered from Emergency Relief (sequestration not reflected in table).2/ Programs relocated from Administrative Expenses. Amounts for FY 2015 are the amounts set aside from Administrative expenses and are shown for comparison purposes.
What Is This Program And Why Is It Necessary? The DBE/SS program was established by regulation (23 CFR 230, Subpart B) under statutory authority at 23 USC 140(c) to develop, conduct, and administer training and provide technical assistance programs to increase the efficiency of small businesses owned and controlled by socially and economically disadvantaged individuals to compete, on an equal basis, for federally-assisted highway contracts. The program supports State DOT DBE programs. The funds made available each fiscal year are administered by the FHWA Office of Civil Rights, and all funds are allocated to the State for a 100% federal share, with no State matching required. The primary purpose of the DBE/SS program is to ensure training, capacity building assistance, and services (e.g., training in business development; mentoring, bonding and financial assistance; marketing; and accounting) to firms certified in the DBE program. This training and support is intended to increase their activity within the program, and to facilitate the firms’ development into viable, self-sufficient organizations capable of competing for, and performing on, federally assisted highway projects. FHWA uses a formula-based process for allocating available DBE/SS funds to States. Funds are distributed to State DOTs using the previous fiscal year’s obligation limitation pro-rata. For example, if a State DOT received 2.5% of total federal funds available to the States, that State would receive 2.5% of all available funds allocated for the DBE/SS program. States use these
III-102
funds to create business development programs for certified DBEs to assist them in becoming competitive when seeking to obtain highway and bridge construction contracts. The program is necessary to assist a sector of our small business community for which there is clear evidence of current discrimination and/or the lingering effects of past discrimination that has created barriers to fair competition on highway contracts. Why Do We Need To Fund This Program At The Requested Level? The $11.0 million is in line with the GROW AMERICA Act, and is a slight increase over the FY 2015 funding amount. This level of funding is required to empower States to enhance these vital DBE/SS programs. In addition to the increase in funding, FHWA now requires State DOTs to use their DBE/SS allocation to create Business Development Programs to ensure that DBEs are afforded the opportunity to be evaluated and provided a structured process to receive firm-specific training and guidance to be competitive within the heavy highway marketplace. What Benefits Will Be Provided To The American Public Through this Request? The DBE/SS program is an essential tool for a successful DBE program. The DBE/SS program benefits the American Public by assisting small and disadvantaged firms in becoming competitive. These programs help create a level playing field in which these firms have a fair opportunity to participate in federally-assisted contracts without competing against discriminatory barriers related to race, color, gender, or national origin that are so prevalent in the transportation industry.
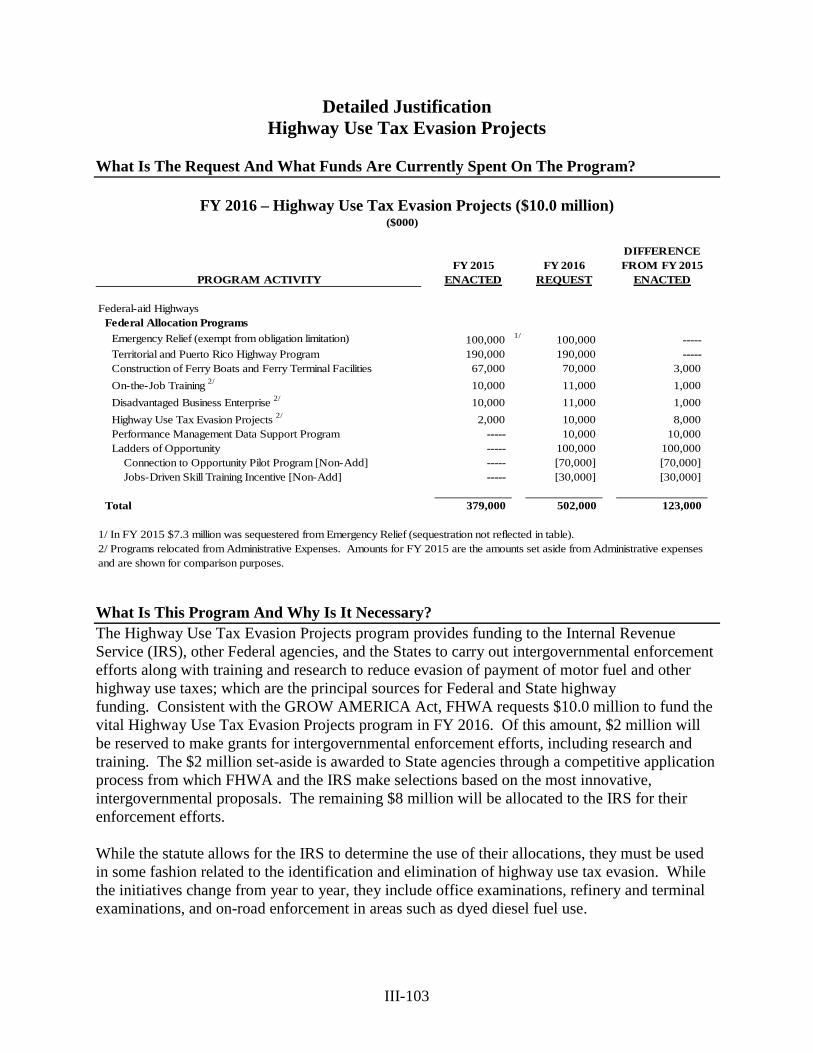
III-103
Detailed Justification Highway Use Tax Evasion Projects
What Is The Request And What Funds Are Currently Spent On The Program?
FY 2016 – Highway Use Tax Evasion Projects ($10.0 million)
($000)
DIFFERENCEFY 2015 FY 2016 FROM FY 2015
PROGRAM ACTIVITY ENACTED REQUEST ENACTED
Federal-aid HighwaysFederal Allocation Programs
Emergency Relief (exempt from obligation limitation) 100,000 1/ 100,000 ----- Territorial and Puerto Rico Highway Program 190,000 190,000 ----- Construction of Ferry Boats and Ferry Terminal Facilities 67,000 70,000 3,000 On-the-Job Training 2/ 10,000 11,000 1,000 Disadvantaged Business Enterprise 2/ 10,000 11,000 1,000 Highway Use Tax Evasion Projects 2/ 2,000 10,000 8,000 Performance Management Data Support Program ----- 10,000 10,000 Ladders of Opportunity ----- 100,000 100,000 Connection to Opportunity Pilot Program [Non-Add] ----- [70,000] [70,000] Jobs-Driven Skill Training Incentive [Non-Add] ----- [30,000] [30,000]
Total 379,000 502,000 123,000
1/ In FY 2015 $7.3 million was sequestered from Emergency Relief (sequestration not reflected in table).2/ Programs relocated from Administrative Expenses. Amounts for FY 2015 are the amounts set aside from Administrative expenses and are shown for comparison purposes.
What Is This Program And Why Is It Necessary? The Highway Use Tax Evasion Projects program provides funding to the Internal Revenue Service (IRS), other Federal agencies, and the States to carry out intergovernmental enforcement efforts along with training and research to reduce evasion of payment of motor fuel and other highway use taxes; which are the principal sources for Federal and State highway funding. Consistent with the GROW AMERICA Act, FHWA requests $10.0 million to fund the vital Highway Use Tax Evasion Projects program in FY 2016. Of this amount, $2 million will be reserved to make grants for intergovernmental enforcement efforts, including research and training. The $2 million set-aside is awarded to State agencies through a competitive application process from which FHWA and the IRS make selections based on the most innovative, intergovernmental proposals. The remaining $8 million will be allocated to the IRS for their enforcement efforts. While the statute allows for the IRS to determine the use of their allocations, they must be used in some fashion related to the identification and elimination of highway use tax evasion. While the initiatives change from year to year, they include office examinations, refinery and terminal examinations, and on-road enforcement in areas such as dyed diesel fuel use.
III-104
Since no system exists that can definitively track all motor fuels in the distribution system in the U.S., it is impossible to determine if all fuel is reported on the Federal and State level. Thus, it is difficult to accurately measure the level of highway fuel tax evasion. However, the Joint Operations Center for National Fuel Tax Compliance (JOC), a joint FHWA/IRS/State initiative, is making great advances in tracking the fuel. Problem areas for evasion include imports, production and distribution of fuels outside of the normal distribution system (including alternative fuels), and correct State identification of sales. The best validation of the need for continued efforts in this area is the assessments made by the IRS and the State agencies in the area of evasion. As with many areas of taxation, new technologies and new fuels are no exception, there are always people willing to find ways of collecting taxes from customers, while never remitting the taxes to the proper agency. The FY 2016 request will continue to fund IRS initiatives, including the expansion of the JOC, and at the State level for new, innovative, and intergovernmental enforcement efforts. Why Do We Need To Fund The Program At The Requested Level? The $10.0 million request for FY 2016 will be used by the IRS, other Federal agencies, and the States to carry out significant intergovernmental enforcement efforts to increase collections, along with training and research, to reduce evasion of payment of motor fuel and other highway use taxes. A portion of the funds will be used to support the participation of States in the JOC. Since that group is adding States on a regular basis, the amount devoted to that area would be determined during FY 2016. The $10.0 million requested funding level will restore the program to its FY 2014 level after being temporarily reduced to $2.0 million in FY 2015. FHWA in coordination with the IRS determined that IRS has sufficient balances from prior fiscal years to execute the program in FY 2015 without any additional funding, allowing the funding to be used for FHWA Administrative Expenses. Through the efforts of this program the IRS has launched a number of initiatives including examinations of mislabeled products at refineries and terminals ($6.3 million in assessments in FY 2012), mislabeled imported fuel examinations ($26.9 million in assessments in 2012), and examinations of questionable credit claims ($27.2 million in assessments, $3.8 million in disallowed credits in 2012). These are just some of the efforts supported in part by the annual allocation to the IRS. As an example of the efforts at the State level, in FY 2013, the State of Arizona reported assessments of dyed diesel use on highways, data validation, and Port of Entry examinations totaling $1,377,967. The following table shows examples of initiatives at the Federal and State level, comparing amounts provided by this program and the results. The IRS initiatives are not solely funded from Highway Use Tax Evasion funds, but they provide a significant portion of the funding. Furthermore, the IRS collections do not include cases still in an appeal process, and thus would likely be higher by a significant degree. As an example, in FY 2010, the assessments totaled over $143 million, while the collections amounted to $44 million. The results column represents the actual assessments.
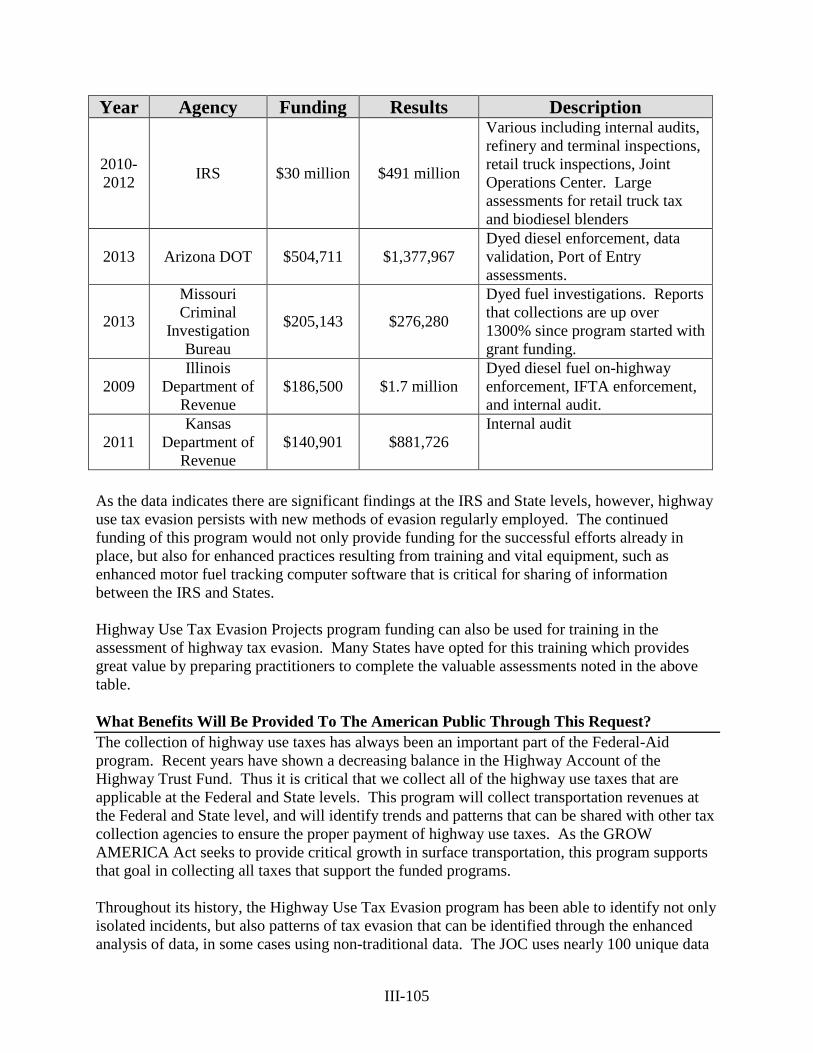
III-105
Year Agency Funding Results Description
2010-2012 IRS $30 million $491 million
Various including internal audits, refinery and terminal inspections, retail truck inspections, Joint Operations Center. Large assessments for retail truck tax and biodiesel blenders
2013 Arizona DOT $504,711 $1,377,967 Dyed diesel enforcement, data validation, Port of Entry assessments.
2013
Missouri Criminal
Investigation Bureau
$205,143 $276,280
Dyed fuel investigations. Reports that collections are up over 1300% since program started with grant funding.
2009 Illinois
Department of Revenue
$186,500 $1.7 million Dyed diesel fuel on-highway enforcement, IFTA enforcement, and internal audit.
2011 Kansas
Department of Revenue
$140,901 $881,726 Internal audit
As the data indicates there are significant findings at the IRS and State levels, however, highway use tax evasion persists with new methods of evasion regularly employed. The continued funding of this program would not only provide funding for the successful efforts already in place, but also for enhanced practices resulting from training and vital equipment, such as enhanced motor fuel tracking computer software that is critical for sharing of information between the IRS and States. Highway Use Tax Evasion Projects program funding can also be used for training in the assessment of highway tax evasion. Many States have opted for this training which provides great value by preparing practitioners to complete the valuable assessments noted in the above table. What Benefits Will Be Provided To The American Public Through This Request? The collection of highway use taxes has always been an important part of the Federal-Aid program. Recent years have shown a decreasing balance in the Highway Account of the Highway Trust Fund. Thus it is critical that we collect all of the highway use taxes that are applicable at the Federal and State levels. This program will collect transportation revenues at the Federal and State level, and will identify trends and patterns that can be shared with other tax collection agencies to ensure the proper payment of highway use taxes. As the GROW AMERICA Act seeks to provide critical growth in surface transportation, this program supports that goal in collecting all taxes that support the funded programs. Throughout its history, the Highway Use Tax Evasion program has been able to identify not only isolated incidents, but also patterns of tax evasion that can be identified through the enhanced analysis of data, in some cases using non-traditional data. The JOC uses nearly 100 unique data

III-106
sources to identify anomalies, which often result in assessments. These assessments represent valuable tax dollars that then can be properly used to increase the safety and mobility of our nation’s roads and bridges.
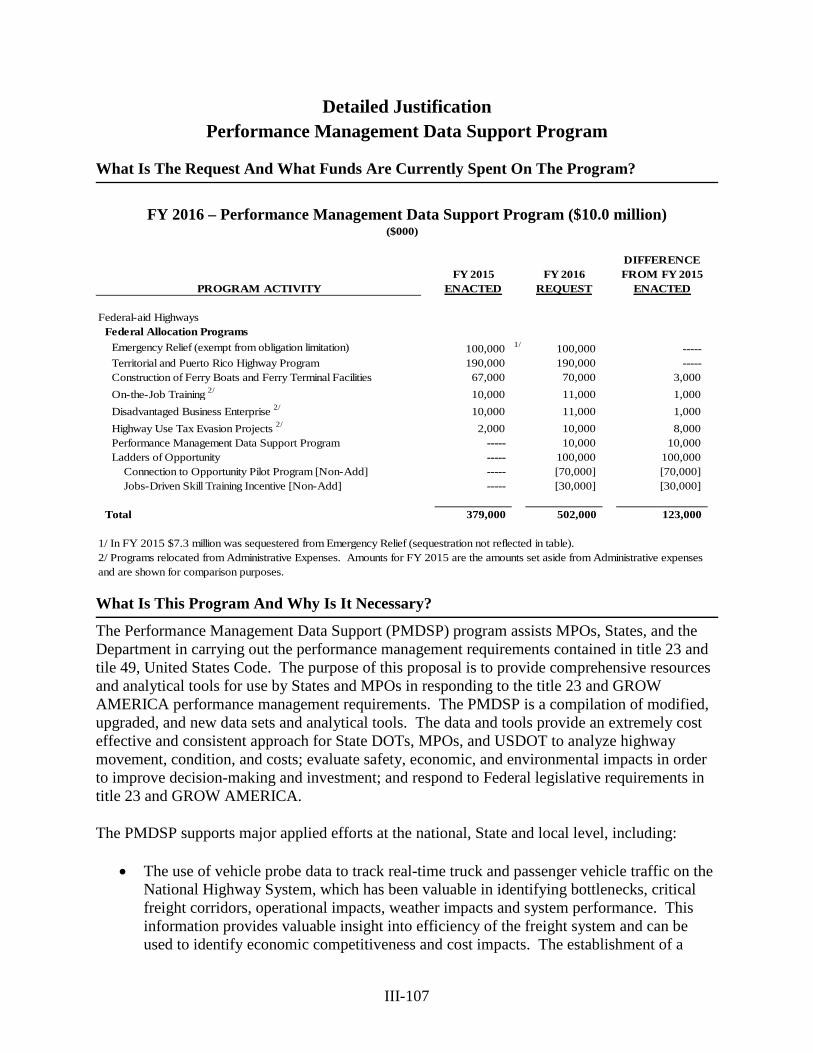
III-107
Detailed Justification Performance Management Data Support Program
What Is The Request And What Funds Are Currently Spent On The Program?
FY 2016 – Performance Management Data Support Program ($10.0 million)
($000)
DIFFERENCEFY 2015 FY 2016 FROM FY 2015
PROGRAM ACTIVITY ENACTED REQUEST ENACTED
Federal-aid HighwaysFederal Allocation Programs
Emergency Relief (exempt from obligation limitation) 100,000 1/ 100,000 ----- Territorial and Puerto Rico Highway Program 190,000 190,000 ----- Construction of Ferry Boats and Ferry Terminal Facilities 67,000 70,000 3,000 On-the-Job Training 2/ 10,000 11,000 1,000 Disadvantaged Business Enterprise 2/ 10,000 11,000 1,000 Highway Use Tax Evasion Projects 2/ 2,000 10,000 8,000 Performance Management Data Support Program ----- 10,000 10,000 Ladders of Opportunity ----- 100,000 100,000 Connection to Opportunity Pilot Program [Non-Add] ----- [70,000] [70,000] Jobs-Driven Skill Training Incentive [Non-Add] ----- [30,000] [30,000]
Total 379,000 502,000 123,000
1/ In FY 2015 $7.3 million was sequestered from Emergency Relief (sequestration not reflected in table).2/ Programs relocated from Administrative Expenses. Amounts for FY 2015 are the amounts set aside from Administrative expenses and are shown for comparison purposes.
What Is This Program And Why Is It Necessary?
The Performance Management Data Support (PMDSP) program assists MPOs, States, and the Department in carrying out the performance management requirements contained in title 23 and tile 49, United States Code. The purpose of this proposal is to provide comprehensive resources and analytical tools for use by States and MPOs in responding to the title 23 and GROW AMERICA performance management requirements. The PMDSP is a compilation of modified, upgraded, and new data sets and analytical tools. The data and tools provide an extremely cost effective and consistent approach for State DOTs, MPOs, and USDOT to analyze highway movement, condition, and costs; evaluate safety, economic, and environmental impacts in order to improve decision-making and investment; and respond to Federal legislative requirements in title 23 and GROW AMERICA.
The PMDSP supports major applied efforts at the national, State and local level, including:
• The use of vehicle probe data to track real-time truck and passenger vehicle traffic on the National Highway System, which has been valuable in identifying bottlenecks, critical freight corridors, operational impacts, weather impacts and system performance. This information provides valuable insight into efficiency of the freight system and can be used to identify economic competitiveness and cost impacts. The establishment of a
III-108
continued program for this data is critical for national reporting and strategic planning of investments; however, States and MPOs will also be able to utilize this data to meet title 23 performance reporting requirements for measures including freight, congestion, and reliability. Without this continued data, States, MPOs and FHWA will be unable to respond to title 23 requirements or most accurately assess national freight conditions for the development of national freight efforts. The nature of probe data makes acquisition by the USDOT for use by all State DOTs and MPOs an extremely cost effective approach and prudent use of Federal funds while at the same time providing the opportunity for consistency in the data that these entities will use for performance management of the Federal-aid system.
• Gathering household travel behavior data crossing local jurisdictional boundaries to accommodate external and through travel. The National Household Travel Survey (NHTS) provides the only publicly and privately available national and regional travel behavior data and information. However, the current granularity of the data is not sufficient to support performance management for MPOs as requested by MAP-21. The enhanced NHTS (more samples) will enable MPOs to assess external trips and through trips associated with their region without conducting over 360 separate surveys. This economy of scale can only be accomplished at the Federal level.
• The development of new and enhanced tools to conduct more effective performance analysis, as well as demonstrate the impact of project investments on performance outcomes. These tools help to identify critical performance issues impacting national performance goals and assist FHWA, States and MPOs in communicating these issues to stakeholders.
• Enhancement of critical data and analytical systems such as the Highway Performance Monitoring System (HPMS), Traffic Monitoring and Analysis System (TMAS) and Motor Fuel and Highway Finance Analysis System for Highways (Fuels and FASH) to accommodate new data requirements as a direct result of MAP-21.
• Improvement and adaptation of the existing highway Needs and Investment Analysis software to develop improved performance predictions for the biennial Status of the Nation’s Highways, Bridges, and Transit: Conditions and Performance report to Congress.
Through FHWA’s use of these data and analytical tools, we can make smarter investments and policy decisions. Additionally, FHWA can be more responsive to public and private sector requests, resulting in better decision-making of a performance-based Federal highway program. The PMDSP is necessary for States, MPOs and FHWA to address recent changes in title 23 and GROW AMERICA requirements, as well as to improve policy, operational and capital changes and investments to optimize the national transportation system. USDOT is in a unique position to develop national-level data sets and tools that provide consistency and cost less than developing the same data at the State or local level, and would eliminate the need for many States to individually purchase the same data. A national-level PMDSP provides an advanced level of capacity for decision-making to guide investments and policy efforts. The ability to
III-109
have such advanced capacity for decision-making could lead to significant cost savings for States and others by using data and analytics to define an optimal transportation system. The use of highway performance measures has grown in recent decades and ranges in scope to include site-specific operations analysis, corridor-level alternative investments analysis, and area-wide planning and public information studies. Federal-aid authorizing legislation, such as The Safe, Accountable, Flexible, Efficient Transportation Equity Act for the 21st Century – A Legacy for Users (SAFETEA-LU), the Moving Ahead for Progress (MAP-21) and GROW AMERICA included performance management requirements. Section 150 of title 23 requires USDOT to establish performance measures for the National Highway Performance Program (NHPP), the Highway Safety Improvement Program (HSIP), the Congestion Mitigation and Air Quality Improvement Program (CMAQ), and the National Freight Movement (Freight) within 18 months after enactment of MAP-21. Additionally, this section also required twelve performance measure categories for carrying out the NHPP, HSIP, CMAQ, and Freight. We are leading numerous activities to advance the implementation and practice of transportation performance measurement at the Federal, State, and local level. In doing so, we have developed a number of data sets and analytical tools to measure performance and guide decision-making. Our efforts are critically important to States, MPOs, local governments and the private sector, all of which are making decisions on investments by using the information that FHWA provides in various capacities. MAP-21 requires States and MPOs to assess and report on infrastructure condition, safety, freight, congestion management, operations, and air quality. The data and analytical capacity USDOT has developed over the past decade provides stakeholders with a high-quality resource that can be applied consistently for decisional purposes to the extent possible. As refinement of data and corresponding tools becomes increasingly necessary, it is critical for USDOT to refine our data system so we can obtain and manage higher quality, comprehensive data for implementation of a performance-based Federal highway program. Through the purchase or collection of this data, USDOT can provide unique cost savings and comprehensive coverage to the State DOTs and MPOs. In the growing world of private data, a single purchase by USDOT can replace the need for 50 State DOTs and over 350 MPOs to each individually buy the same data at rates that are notably higher than the national rate the USDOT can negotiate. The complete national coverage the Department brings when it develops a data set allows us to consistently consolidate, analyze, benchmark and provide it to the States in many ways that an individual State or group of States would be unable to do on their own, such as by multi-State corridors, or across all metropolitan areas. These national data sets allow States and MPOs to analyze how they fit in the national picture and understand relationships with other parts of the country, such as trading patterns, that they would be unable to do if they acquired the data at a State or metropolitan level For an investment of $10.0 million, the PMDSP would coordinate and improve data and analytical needs within FHWA and across operating administrations at USDOT. This will provide an advanced level of capacity for decision-making to guide investments and policy efforts. The proposed program would create a robust, comprehensive and high quality data and analytical system for planning and decision-making. It differs from the Bureau of Transportation Statistics
III-110
(BTS) proposed Intermodal Transportation Data program in that the FHWA proposed program would focus on implementation of the performance-based Federal highway program, while the BTS proposed program would collect data on the use and value of the transportation system rather than on the system’s performance. FHWA and BTS would coordinate efforts between both data programs, make available the BTS information on use of the transportation system and the FHWA information on how the system performs to State DOTs and MPOs to support transportation planning, investment analysis, and management at all levels of government.
Good data is critical to performance management. Poor data or old data may not capture the true performance of the transportation network and may provide misleading information when analyzed. While all datasets have limitations, enhancing national data may provide decision-makers with a very different understanding of performance than by using poor data which leads to less efficient investments in the transportation system. Why Do We Need To Fund The Program At The Requested Level? By investing $10.0 million for data and analytical tools, we can yield significant savings to State DOT’s and others, well above and beyond the cost of this program. Use of data by USDOT and its operating administrations, as well as States and local governments where applicable, can identify the difference between operational and policy improvements and smart choices about where capital investment is needed. Collection of data and the development of analytical tools at the national level, rather than State or local level, can also create significant economies of scale that reduce the overall investment required to maintain and build the infrastructure. What Benefits Will Be Provided To The American Public Through This Request? This program would enable FHWA to provide enhanced data and tools to assist States and MPOs in targeting operational and capital investments strategically and implement policies effectively in support of the national transportation system. FHWA has been engaged in performance measurement throughout its history. In the past decade, and in response to Federal legislative requirements for use of performance management, FHWA has placed specific emphasis on the growth and development of data and analytical tools for use in performance measurement. Through the application of data and analytical tools, FHWA has been able to identify operational and capital investment needs, as well as policy changes that have effectively optimized the transportation network, reduced costs and guided investment. FHWA has long partnered with the Transportation Research Board (TRB) and programs, such as the National Cooperative Highway Research Program and National Cooperative Freight Research Program, to identify best practices and implementation of performance analysis. FHWA, BTS, other modes within USDOT, the TRB and State and academic partners continue to refine data, measures and analytical tools that can provide the most accurate picture of performance to guide decision-making. Based on these efforts, transportation decision-makers know best how the system is performing, and only through continuous improvement of data refinement and analytical capability can decision-making improve. This will ultimately result in better investment strategies and improved performance of the transportation system for the American public.
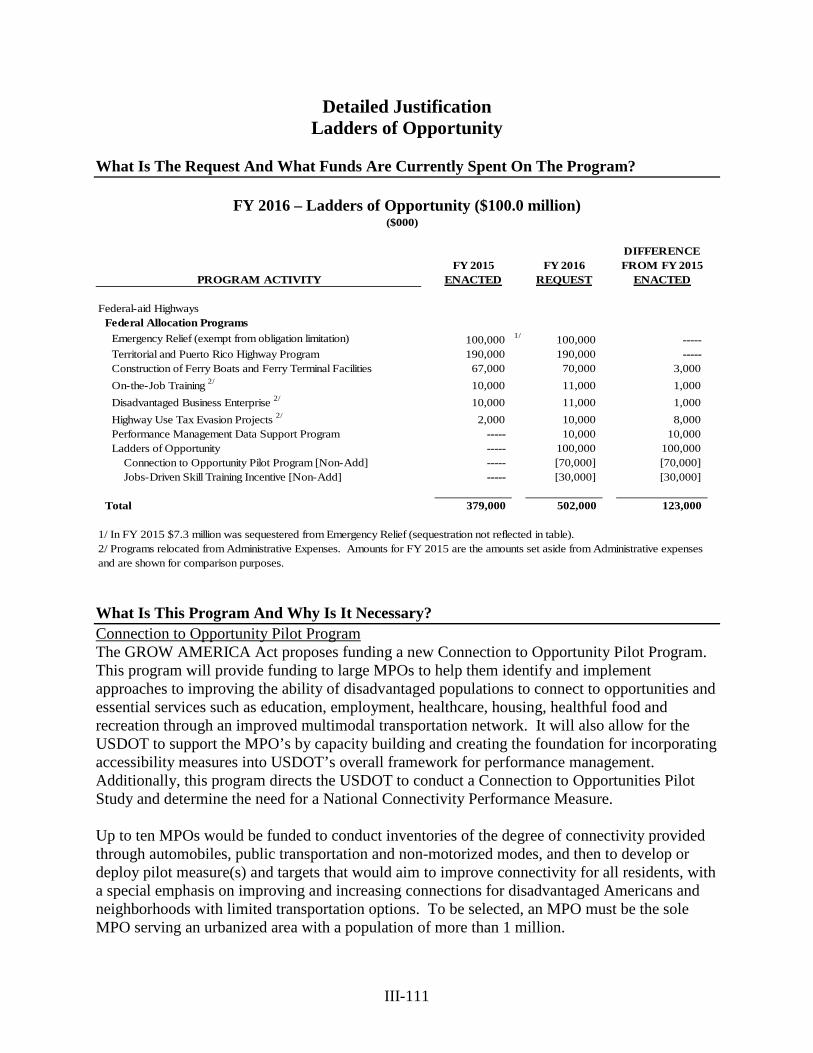
III-111
Detailed Justification Ladders of Opportunity
What Is The Request And What Funds Are Currently Spent On The Program?
FY 2016 – Ladders of Opportunity ($100.0 million)
($000)
DIFFERENCEFY 2015 FY 2016 FROM FY 2015
PROGRAM ACTIVITY ENACTED REQUEST ENACTED
Federal-aid HighwaysFederal Allocation Programs
Emergency Relief (exempt from obligation limitation) 100,000 1/ 100,000 ----- Territorial and Puerto Rico Highway Program 190,000 190,000 ----- Construction of Ferry Boats and Ferry Terminal Facilities 67,000 70,000 3,000 On-the-Job Training 2/ 10,000 11,000 1,000 Disadvantaged Business Enterprise 2/ 10,000 11,000 1,000 Highway Use Tax Evasion Projects 2/ 2,000 10,000 8,000 Performance Management Data Support Program ----- 10,000 10,000 Ladders of Opportunity ----- 100,000 100,000 Connection to Opportunity Pilot Program [Non-Add] ----- [70,000] [70,000] Jobs-Driven Skill Training Incentive [Non-Add] ----- [30,000] [30,000]
Total 379,000 502,000 123,000
1/ In FY 2015 $7.3 million was sequestered from Emergency Relief (sequestration not reflected in table).2/ Programs relocated from Administrative Expenses. Amounts for FY 2015 are the amounts set aside from Administrative expenses and are shown for comparison purposes.
What Is This Program And Why Is It Necessary? Connection to Opportunity Pilot Program The GROW AMERICA Act proposes funding a new Connection to Opportunity Pilot Program. This program will provide funding to large MPOs to help them identify and implement approaches to improving the ability of disadvantaged populations to connect to opportunities and essential services such as education, employment, healthcare, housing, healthful food and recreation through an improved multimodal transportation network. It will also allow for the USDOT to support the MPO’s by capacity building and creating the foundation for incorporating accessibility measures into USDOT’s overall framework for performance management. Additionally, this program directs the USDOT to conduct a Connection to Opportunities Pilot Study and determine the need for a National Connectivity Performance Measure. Up to ten MPOs would be funded to conduct inventories of the degree of connectivity provided through automobiles, public transportation and non-motorized modes, and then to develop or deploy pilot measure(s) and targets that would aim to improve connectivity for all residents, with a special emphasis on improving and increasing connections for disadvantaged Americans and neighborhoods with limited transportation options. To be selected, an MPO must be the sole MPO serving an urbanized area with a population of more than 1 million.
III-112
USDOT’s selections will include: “Mentor grantees” that have demonstrated prior successful use of performance measurement and performance-based planning; and “Novice grantees” that have little or no experience in performance measurement or performance-based planning. USDOT would manage knowledge-sharing and peer exchanges among grant recipients, and conduct a Connection to Opportunities Final Report, which would include recommendations on establishing a national Connectivity performance measure. Under this proposal, the Secretary would have the discretion to promulgate a rule establishing such a measure. Each MPO funded under this program must develop an accessibility plan and measures in consultation with appropriate States, transit agencies, and local governments (and may use that funding on the activities). USDOT will reserve up to $10 million over the six-year period of the pilot to evaluate the connectivity measures that the MPOs develop, and to consider development of a national measure of the extent to which the transportation network provides multimodal connections to opportunity. In connection with this evaluation, USDOT will support MPOs’ development of measures (and related data collection); and produce a final report on the outcomes of the pilot program. After finalizing its report on the pilot program, USDOT may (but is not required to) establish a national performance measure of the extent to which the transportation network provides multimodal connections to opportunity. Throughout the six years of the program, participating jurisdictions will come together to share their experiences as they conduct efforts to develop and test their accessibility measures. USDOT will facilitate this by organizing peer exchange forums (annual in-person and virtual three times per year). All jurisdictions eligible for the Pilot program will be able to participate in these forums. USDOT will also establish an online collaboration center where each jurisdiction can post and share its work, and will develop and post summary reports on that center to document lessons learned. Jobs-Driven Skill Training Incentive The OJT/SS program was established by regulation (23 CFR 230, Subpart A) under statutory authority at 23 USC 140(b). The OJT/SS program funds are available to each State DOT for developing, conducting, and administering surface transportation and technology training, including skill improvement programs and job readiness. The GROW AMERICA Act enhances the OJT/SS program by requiring each participating State DOT to develop an OJT workforce plan that identifies immediate and anticipated demographic and workforce gaps. It also requires each participating State DOT to establish a "workforce development compact" with the State workforce investment board and other agencies that have training and education programs, and to measure program outcomes. The OJT/SS program is further enhanced by creating incentive funding to States for transportation workforce development, including transportation technology and skills training, registered apprenticeship and other work-based training opportunities, and skill improvement programs leading to credential attainment, employment, and career pathways for disadvantaged populations. States would be eligible for this funding through two separate mechanisms:
III-113
• States may receive matching funding up to twice that which they agree to use of their National Highway Performance Program or Surface Transportation Program funding for OJT/SS
• States may receive additional funding by demonstrating that they operate their OJT/SS
programs in partnership with institutions or agencies with established skills training, recruitment, and placement resources and that have demonstrated success in job placement
The program starts by creating incentives for States to invest in the transportation workforce of the future, with State DOTs, Labor, and Education working together and with employers. The Ladders of Opportunity program will provide $30 million for each year in the FY 2016 to FY 2021 reauthorization period proposed by GROW AMERICA to help build a skilled and diverse transportation workforce and create career pathways for disadvantaged populations, leveraging existing funding including FHWA’s existing On-the-Job Training/Supportive Services program (OJT/SS) and workforce, adult and higher education, and apprenticeships. This program provides incentives and resources for States to enhance their efforts to ensure that a skilled and diverse workforce is available to meet highway construction hiring needs, and to address the historical under-representation of members of these groups in highway construction skilled crafts. Why Do We Need To Fund The Program At The Requested Level? Connection to Opportunity Pilot Program Communities have built on equity, environmental justice, and livability analysis and initiatives to make progress toward connectivity goals. Preliminary survey data gathered by FHWA, Association of Metropolitan Planning Organizations (AMPO) and National Association of Regional Councils (NARC) demonstrated that while some progress has been made, additional guidance and tools are needed to efficiently and effectively analyze gaps and program priority projects. The funding request of $70 million for FY 2016, and $420 million total for FY 2016 through FY 2021 as proposed by GROW AMERICA, will ensure the program has adequate resources to generate measurable results across a wide spectrum of communities and effectively contribute to the achievement of USDOT performance outcomes. There are national data sets available describing demographics, employment, transportation, health care, education, and access to food. Further collaboration with agencies such as Census, Bureau of Labor Statistics, Environmental Protection Agency, United States Department of Agriculture, Center for Disease Control, and Health and Human Services is necessary to leverage their data and mapping investments. Information on low income, minority, elderly, limited English proficiency, and disabled populations can be gathered from many sources with varying degrees of accuracy and validation. Practitioners need support in understanding different scales and appropriate use of the data. Tools, such as geographic information systems, visioning and scenario planning tools, economic analysis tools, and travel models, are in use by practitioners in planning agencies, consultancies, and universities to evaluate access and connectivity at regional and neighborhood scales by different modes. Innovations in these tools and best practices need to be better documented and disseminated nationally.
III-114
USDOT will fund case studies and peer exchanges; support data gathering and mapping innovations, and partnerships at local, State, and federal levels. USDOT anticipates providing outreach, and new and updated informational resources that will inform planning and public involvement activities. Providing safe and connected multimodal networks will make walking and biking to transit, jobs, school, and essential services a viable transportation choice, and this is being facilitated by numerous research projects. Efforts are also underway to improve pedestrian and bicycle data. Better data and analytical tools on walking and biking will allow communities to prioritize multimodal infrastructure investments in places where people are more reliant on transit or are less likely to have access to a motor vehicle.
Jobs-Driven Skill Training Incentive The funding request of $30 million in FY 2016 will ensure that the program has adequate resources to carry out the planned activities to ensure that a skilled and diverse workforce is available to meet highway construction needs. The funding level allows participants to achieve meaningful results and provides incentives for them to make additional efforts to enhance transportation workforce development. What Benefits Will Be Provided To The American Public Through This Request? Connection to Opportunity Pilot Program This program will build ladders of opportunity to help Americans get to the middle class by providing transportation options that are more affordable and reliable and by improving quality of life through greater access to education and new job opportunities. Transportation and economic opportunity and mobility are deeply interconnected. Transportation is second to housing as the largest expense for American households, costing more than food, clothing, and health care. Households with annual incomes of less than $25,000 are seven times less likely to have a car compared to higher income households. Unreliable, infrequent bus service and streets with unsafe sidewalks or crosswalks interfere with reaching jobs and other destinations. Recent research shows improving transportation infrastructure can be one of the easiest ways to build ladders of opportunity (http://obs.rc.fas.harvard.edu/chetty/mobility_geo.pdf ). Poor transportation connections can limit labor mobility, and limit local and regional economic growth. This program holds the promise to stimulate long-term job growth, especially in economically distressed areas. Jobs-Driven Skill Training Incentive The American Public benefits because this program ensures continuity of our nation’s current and future highway construction industry workforce by developing and diversifying skilled labor. Further, this program builds ladders of opportunities to help Americans reach the middle class by providing the training and networking that will yield good paying jobs.
III-115
Executive Summary Transportation Infrastructure Finance Innovation Act (TIFIA) Program
What Is The Request And What Funds Are Currently Spent On The Program? The FY 2016 FHWA budget request includes $1.0 billion for the Transportation Infrastructure Finance and Innovation Act (TIFIA) Program. The program is funded at an annualized level of $1.0 billion for FY 2015. What Is The Program and Why Is It Necessary? The TIFIA Program provides Federal credit assistance to surface transportation projects of national or regional significance. The TIFIA Program leverages Federal dollars in a time of scarce budgetary resources, facilitating private participation in transportation projects and encouraging innovative financing mechanisms that help accelerate project delivery. By offering flexible repayment terms and attracting private capital, the TIFIA Program will stimulate infrastructure investment that would be temporarily or permanently delayed without TIFIA financing. Why Do We Need To Fund The Program At The Requested Level? The TIFIA Program funding level of $1.0 billion, as proposed in the GROW AMERICA Act, will help meet the continuing demand for TIFIA credit support. Funding at the requested level will enable the TIFIA Joint Program Office (JPO) to meet the expanded scope of the program under the GROW AMERICA Act, such as subsidizing the advisory costs for small projects of less than $75 million. Additionally, it will provide administrative resources to meet the TIFIA Program’s staffing needs.
What Benefits Will Be Provided To The American Public Through This Request? The TIFIA Program will accelerate delivery of significant transportation projects throughout the United States. It will also facilitate projects that would otherwise be delayed or deferred because of lack of funding. By stimulating investment in the country’s transportation infrastructure, the TIFIA program will improve the economy – it will help create jobs and opportunities, improve mobility and enhance transportation options, help American businesses improve productivity and competitiveness, and improve local communities’ access to opportunities and needs.
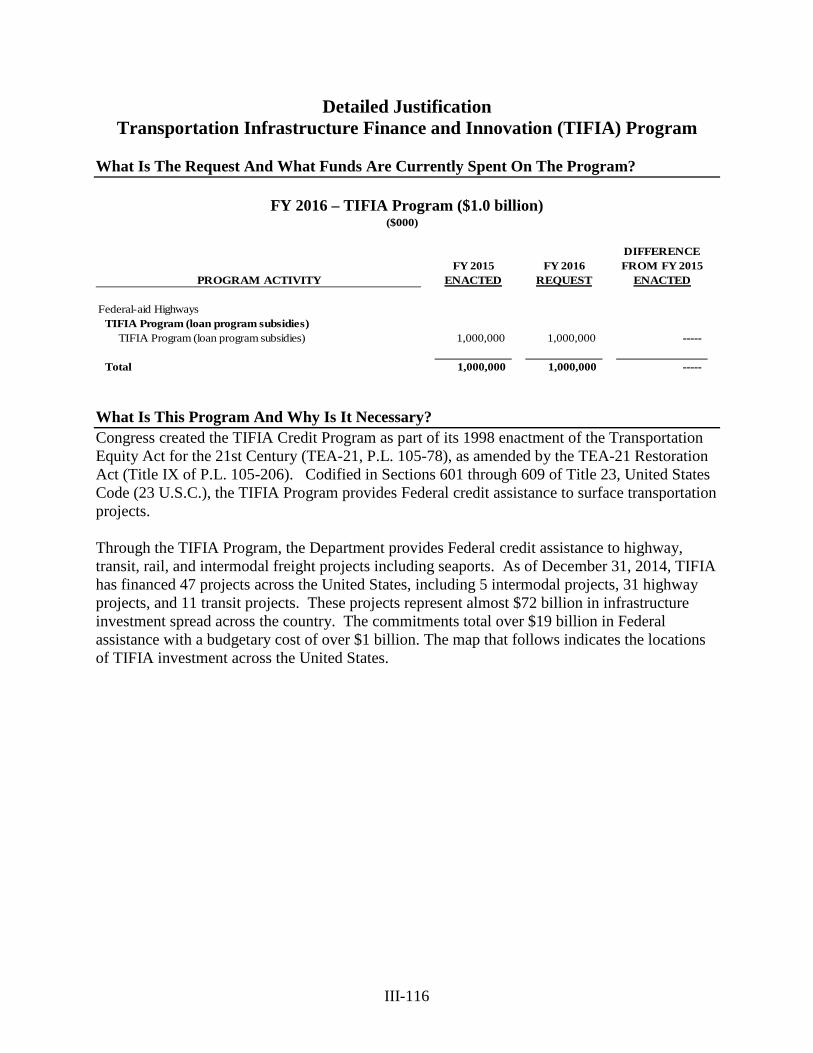
III-116
Detailed Justification Transportation Infrastructure Finance and Innovation (TIFIA) Program
What Is The Request And What Funds Are Currently Spent On The Program?
FY 2016 – TIFIA Program ($1.0 billion)
($000)
DIFFERENCEFY 2015 FY 2016 FROM FY 2015
PROGRAM ACTIVITY ENACTED REQUEST ENACTED
Federal-aid HighwaysTIFIA Program (loan program subsidies)
TIFIA Program (loan program subsidies) 1,000,000 1,000,000 -----
Total 1,000,000 1,000,000 -----
What Is This Program And Why Is It Necessary? Congress created the TIFIA Credit Program as part of its 1998 enactment of the Transportation Equity Act for the 21st Century (TEA-21, P.L. 105-78), as amended by the TEA-21 Restoration Act (Title IX of P.L. 105-206). Codified in Sections 601 through 609 of Title 23, United States Code (23 U.S.C.), the TIFIA Program provides Federal credit assistance to surface transportation projects. Through the TIFIA Program, the Department provides Federal credit assistance to highway, transit, rail, and intermodal freight projects including seaports. As of December 31, 2014, TIFIA has financed 47 projects across the United States, including 5 intermodal projects, 31 highway projects, and 11 transit projects. These projects represent almost $72 billion in infrastructure investment spread across the country. The commitments total over $19 billion in Federal assistance with a budgetary cost of over $1 billion. The map that follows indicates the locations of TIFIA investment across the United States.
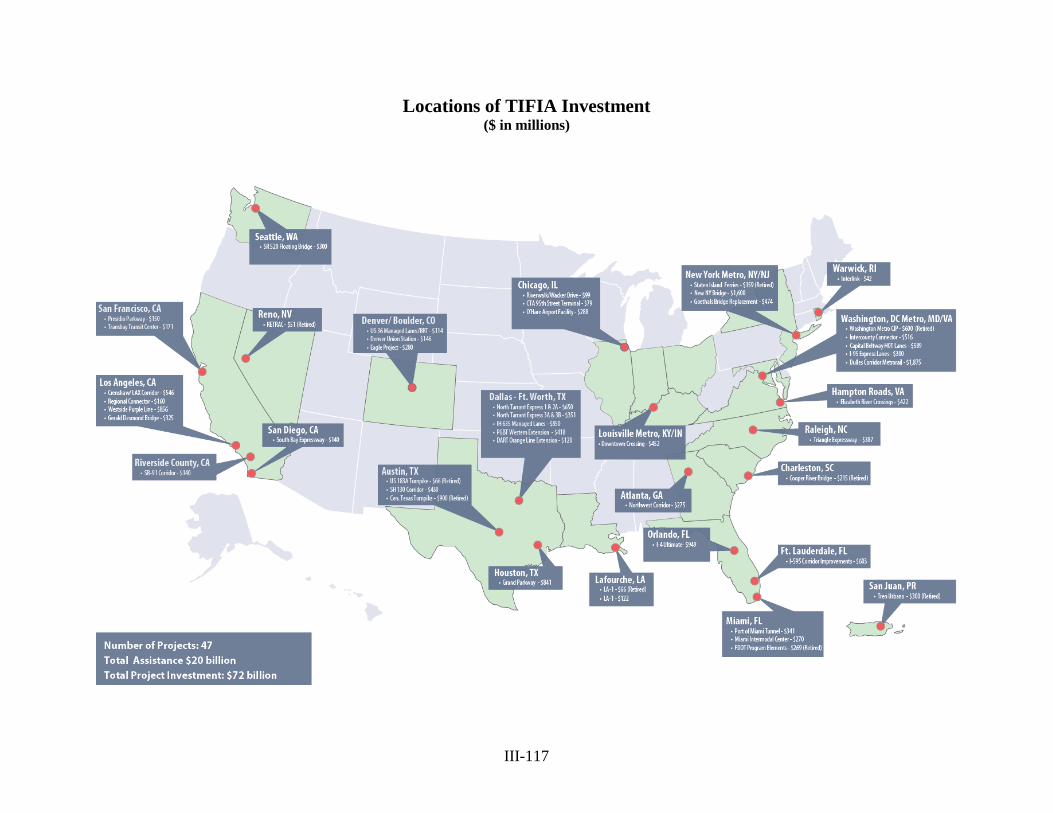
III-117
Locations of TIFIA Investment ($ in millions)
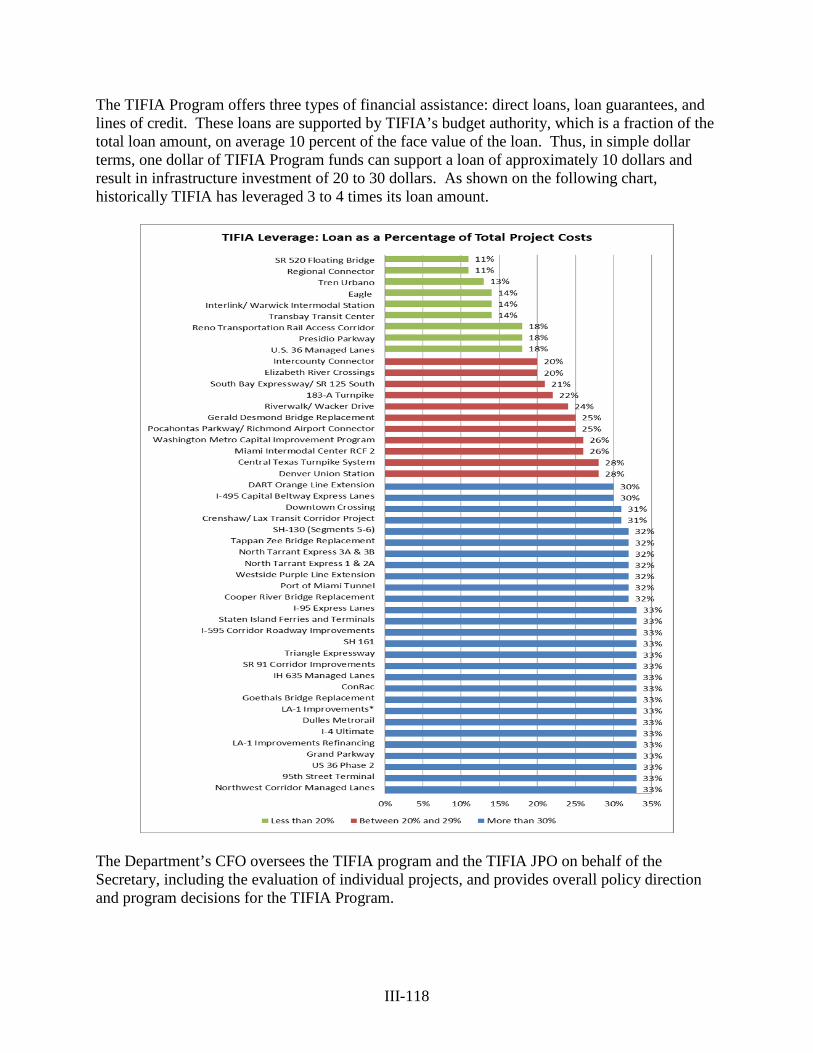
III-118
The TIFIA Program offers three types of financial assistance: direct loans, loan guarantees, and lines of credit. These loans are supported by TIFIA’s budget authority, which is a fraction of the total loan amount, on average 10 percent of the face value of the loan. Thus, in simple dollar terms, one dollar of TIFIA Program funds can support a loan of approximately 10 dollars and result in infrastructure investment of 20 to 30 dollars. As shown on the following chart, historically TIFIA has leveraged 3 to 4 times its loan amount.
The Department’s CFO oversees the TIFIA program and the TIFIA JPO on behalf of the Secretary, including the evaluation of individual projects, and provides overall policy direction and program decisions for the TIFIA Program.
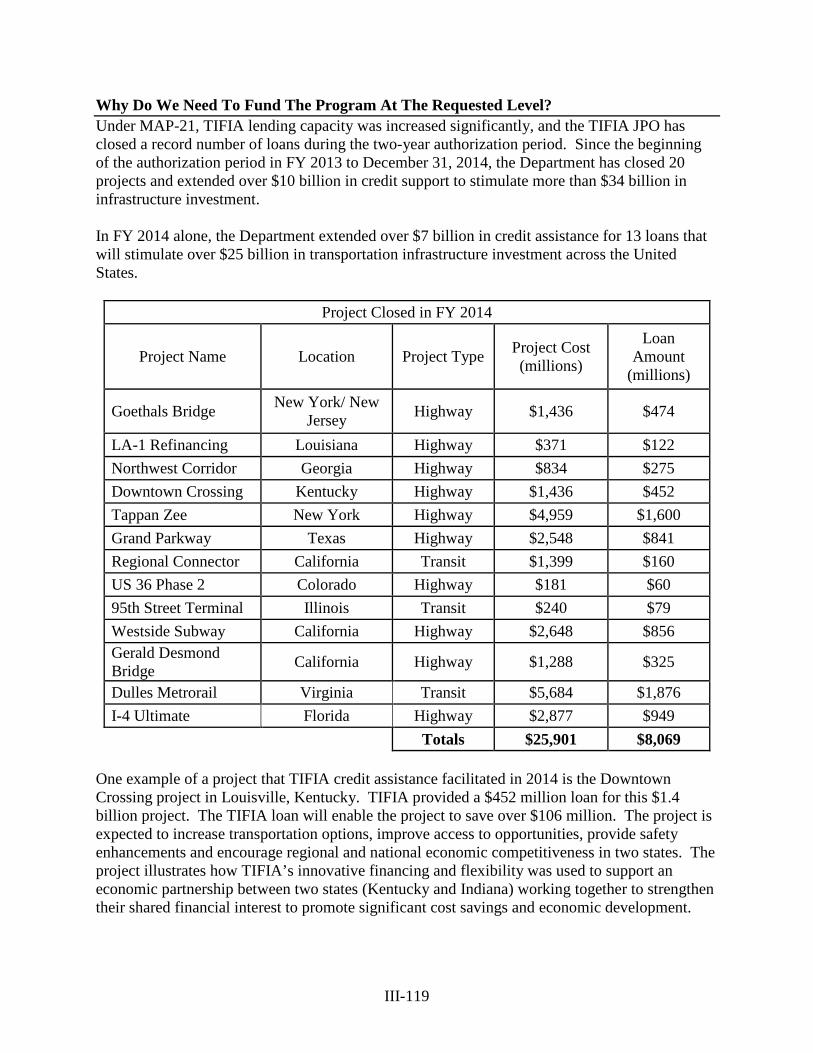
III-119
Why Do We Need To Fund The Program At The Requested Level? Under MAP-21, TIFIA lending capacity was increased significantly, and the TIFIA JPO has closed a record number of loans during the two-year authorization period. Since the beginning of the authorization period in FY 2013 to December 31, 2014, the Department has closed 20 projects and extended over $10 billion in credit support to stimulate more than $34 billion in infrastructure investment. In FY 2014 alone, the Department extended over $7 billion in credit assistance for 13 loans that will stimulate over $25 billion in transportation infrastructure investment across the United States.
Project Closed in FY 2014
Project Name Location Project Type Project Cost (millions)
Loan Amount
(millions)
Goethals Bridge New York/ New Jersey Highway $1,436 $474
LA-1 Refinancing Louisiana Highway $371 $122 Northwest Corridor Georgia Highway $834 $275 Downtown Crossing Kentucky Highway $1,436 $452 Tappan Zee New York Highway $4,959 $1,600 Grand Parkway Texas Highway $2,548 $841 Regional Connector California Transit $1,399 $160 US 36 Phase 2 Colorado Highway $181 $60 95th Street Terminal Illinois Transit $240 $79 Westside Subway California Highway $2,648 $856 Gerald Desmond Bridge California Highway $1,288 $325
Dulles Metrorail Virginia Transit $5,684 $1,876 I-4 Ultimate Florida Highway $2,877 $949
Totals $25,901 $8,069 One example of a project that TIFIA credit assistance facilitated in 2014 is the Downtown Crossing project in Louisville, Kentucky. TIFIA provided a $452 million loan for this $1.4 billion project. The TIFIA loan will enable the project to save over $106 million. The project is expected to increase transportation options, improve access to opportunities, provide safety enhancements and encourage regional and national economic competitiveness in two states. The project illustrates how TIFIA’s innovative financing and flexibility was used to support an economic partnership between two states (Kentucky and Indiana) working together to strengthen their shared financial interest to promote significant cost savings and economic development.
III-120
Another example is the Tappan Zee Bridge Replacement Project also known as the New NY Bridge (NNY Bridge) Project, which is approximately 20 miles north of New York City. The Department approved a $1.6 billion loan to help fund the $4.96 billion project. The TIFIA Loan is secured by a system wide pledge of revenues from the Thruway Authority (NYSTA). The TIFIA loan will reduce the project’s interest cost and thereby relieve pressure on the debt capacity of the System as a whole. The difference in interest cost between the TIFIA Loan and the alternate short term debt the Thruway Authority incurred for this project is approximately $10 million in savings per year, over 35 years. With overall lower debt service as a result of the TIFIA Loan, NYSTA will be able to keep future bridge tolls lower than without the TIFIA Loan. This project also illustrates how TIFIA loan was used to encourage economic development and significant cost savings. In addition to the 13 projects closed in FY 2014, the Department is positioned to close additional projects in FY 2015. Currently, the Department has requested further information from or is actively reviewing 21 projects that will add over $27 billion in infrastructure investment when closed.
An example of a project expected to close in FY 2015 is the $1.33 billion TIFIA loan for the East Link project in Washington. According to Sound Transit, the project sponsor, TIFIA credit assistance is estimated to generate up to $300 million in additional financial capacity while reducing the risk of scope deduction and service delays. The project is expected to create 49,000 new jobs, connect over 200,000 people to the major employment centers within the Puget Sound Region, reduce 10,000 vehicle hours travel and 230,000 vehicle miles traveled per day, reduce greenhouse gases by 22,000-29,000 metric tons, and provide significant seismic and fire safety features on the light rail line and along I-90. The TIFIA Program’s success and the active pipeline of projects support this budget request of $1 billion for FY 2016. Through TIFIA, the Department has helped advance important infrastructure projects around the country during the MAP-21 authorization period, and this positive momentum will continue in FY 2016 under the GROW AMERICA Act. What Benefits Will Be Provided To The American Public Through This Request? The TIFIA Program will accelerate delivery of significant transportation projects throughout the United States. By stimulating investment in the country’s transportation infrastructure, the TIFIA program will improve the economy, create jobs, and improve access to opportunities. The TIFIA Program is designed to fill market gaps and leverage substantial private co-investment by providing supplemental and subordinate capital to projects. TIFIA credit assistance provides improved access to capital markets, flexible repayment terms, and more favorable interest rates than can be found in private capital markets for similar instruments. In this way, the TIFIA Program can help accelerate delivery of qualified projects that otherwise might be delayed or deferred because of size, complexity, or uncertainty over the timing of revenues. One example of a complex project that benefited greatly from receiving TIFIA assistance is the Los Angeles County Metropolitan Transportation Authority’s (LACMTA) Westside Subway.
III-121
The TIFIA loan provides significant benefits to LACMTA and is a key financing tool for the Measure R Expenditure Plan. The interest rate for the loan is lower than rates for LACMTA’s traditional debt. TIFIA secured loans can be issued at a subordinate lien level with lower debt service coverage ratios, allowing LACMTA to maximize its debt capacity. The flexible repayment terms of the TIFIA loan program are critical to LACMTA’s transit capital program by allowing deferred payments until project completion and ascending debt service payment structures that leverage projected sales tax revenue growth. Overall, TIFIA loans for this and other LACMTA projects have helped accelerate infrastructure investment in the region. Investment that has significant economic advantages: according to LACMTA estimates, the Westside Subway Project is expected to create 25,330 jobs and produce an economic impact of more than $2 billion over the next 30 years. TIFIA was created because State and local governments often had difficulty financing projects with innovative revenue streams at reasonable rates due to the uncertainties associated with these non-traditional repayment sources. Tolls and other project-based revenues are difficult to predict, particularly for new facilities because it is hard to estimate how many transportation users will pay fees during the initial ramp-up years after construction. By supporting these projects, TIFIA facilitates an introduction of alternative revenue streams to surface transportation projects. As a new toll facility with revenue uncertainties, the TIFIA loan was critical to helping fund the Northwest Corridor Project. The Department approved a $275 million loan for the State Road and Tollway Authority (SRTA) to fund the project. The project will add reversible managed lanes along I-75 and I-575 north of Atlanta, Georgia. The managed lanes will reduce congestion, provide additional transportation choices, improve mobility and connectivity between centers, and encourage transit transportation solutions in the region. The project will be constructed under a Design-Build-Finance (DBF) agreement between a private developer and SRTA. The TIFIA loan will leverage $59.9 million in developer financing and $498.8 million in public funds to support the project’s total cost of $833.7 million. In addition to stimulating new revenue streams, TIFIA credit assistance can help attract private debt and equity participation to transportation projects. TIFIA has been an integral part of public private partnerships. One such example is the I-4 Ultimate Project in Orlando, Florida, for which TIFIA is providing $950 million in credit assistance. The project is expected to increase transportation options, reduce congestion, provide safety enhancements, and promote economic growth in the region. Through the use of TIFIA and utilizing the public private partnership delivery method, the Florida Department of Transportation estimates that they’ll be able to save hundreds of millions of dollars and deliver the project 50% quicker than they would have under other delivery methods. There have been 15 projects financed with TIFIA that have advanced as public private partnerships, and the private equity committed to those projects exceeds $3 billion. On the debt side, TIFIA has been combined with other debt sources including Private Activity Bonds (PABs), bank debt, and GARVEE Bonds, that total over $11 billion in financing for surface
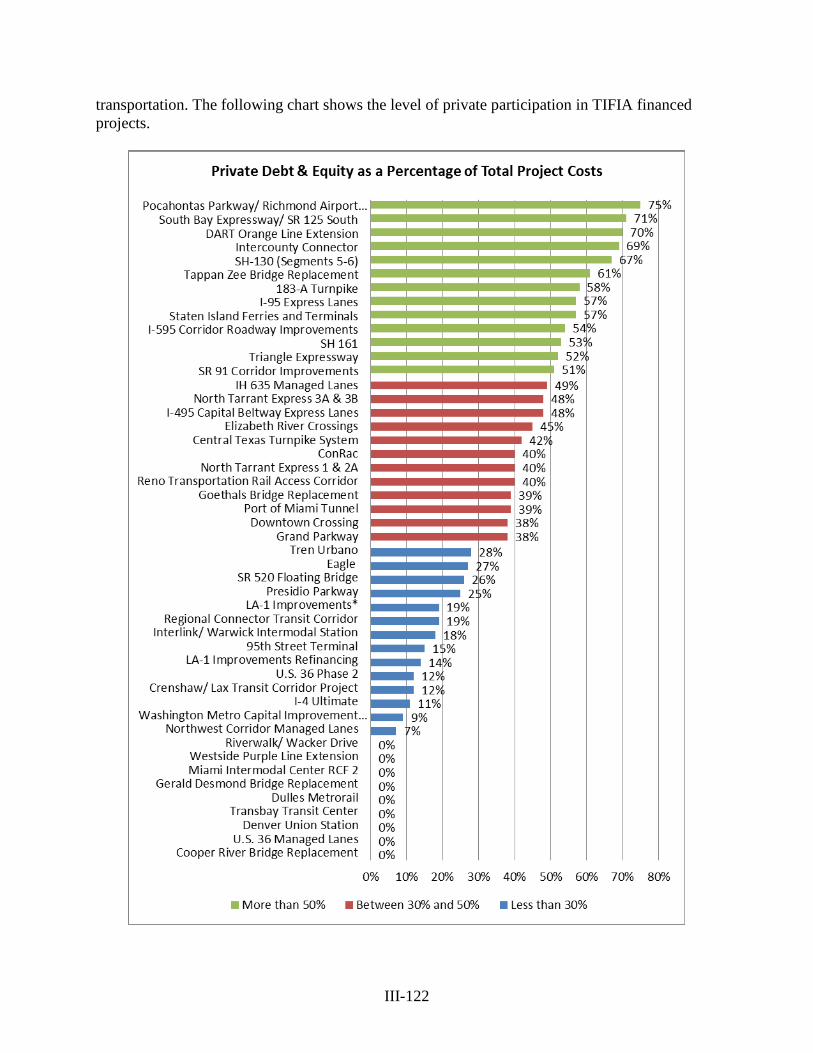
III-122
transportation. The following chart shows the level of private participation in TIFIA financed projects.
III-123
By facilitating projects that would have been delayed or deferred, the TIFIA program will help modernize our transportation system, thereby creating access to opportunities that will advance communities and help American businesses compete and grow in the global economy. Consistent with the GROW AMERICA Act, the TIFIA Program will accelerate project delivery by stimulating new revenue streams for transportation projects and attracting private investment. This funding will enable the Department to meet the growing demand for infrastructure financing options in the United States. Furthermore, TIFIA funding will leverage limited Federal funds, so that a relatively small Federal commitment will stimulate a large amount of State, local, and private investment.

III-124
This Page Left Blank Intentionally
III-125
Executive Summary Multimodal Freight Investment Program
What Is The Request And What Funds Are Currently Spent On The Program? In line with the GROW AMERICA Act, FHWA requests $18.0 billion over 6 years, including $1.0 billion in FY 2016, for a multimodal freight program that will improve goods movement and advance export and economic development opportunities in the United States (U.S.). Funding will advance critically-needed, yet complex, multimodal or multi-jurisdictional projects to improve goods movement, economic competitiveness and sustainability. What Is This Program and Why Is It Necessary? The Multimodal Freight Investment Program (MFIP) includes a discretionary grant program (National Freight Infrastructure Program) and an incentive grant program (Multimodal Freight Incentive Grants) based on distributions to States that account for State freight infrastructure and activity. Funding for the program is provided from the proposed Transportation Trust Fund (TTF), currently the Highway Trust Fund, beginning in FY 2016 at $1.0 billion, rising to $2.0 billion in FY 2017, $3.0 billion in FY 2018, $4.0 billion in FY 2019, $4.0 billion in FY 2020, and $4.0 billion in FY 2021. In each year, no less than half the authorized funding will be allocated for the discretionary grants portion of the program. Incentive funding not earned by States would be transferred to the discretionary program at the end of each fiscal year. Funding for this program in FY 2016 is necessary as freight projects are often multimodal, multi-jurisdictional, complex, or involve partnership with the private sector, making them difficult to administer under current federal and State funding programs. As a consequence, critical freight investment is not advancing sufficiently to keep pace with our nation’s goods movement needs. This may have a significant negative economic impact for the national economy. Why Do Need To Fund The Program At The Requested Level? Expansion of the U.S. population, coupled with increasing consumer demand for goods, will continue to drive high levels of freight growth. Congestion in the freight network severely impedes the ability of U.S. industries to efficiently manage their supply chains in order to remain competitive and thrive in the global marketplace. Increased congestion due to freight growth will negatively impact the U.S. economy. The proposed program will benefit both the producers and transporters of goods in order to meet the growth in demand in a responsible, effective and sustainable way. What Benefits Will Be Provided To The American Public Through This Request? The establishment of a multimodal freight program with multi-year authorization offering public-sector agencies and their private-sector partners a path forward to make real improvements in freight infrastructure and operations would be unprecedented and yield a high rate of return on federal investment for the economy and for public benefits in safety, mobility, health and the environment. Investments in freight infrastructure have a profoundly positive effect on the national economy, create jobs, and support economic growth and competitiveness.
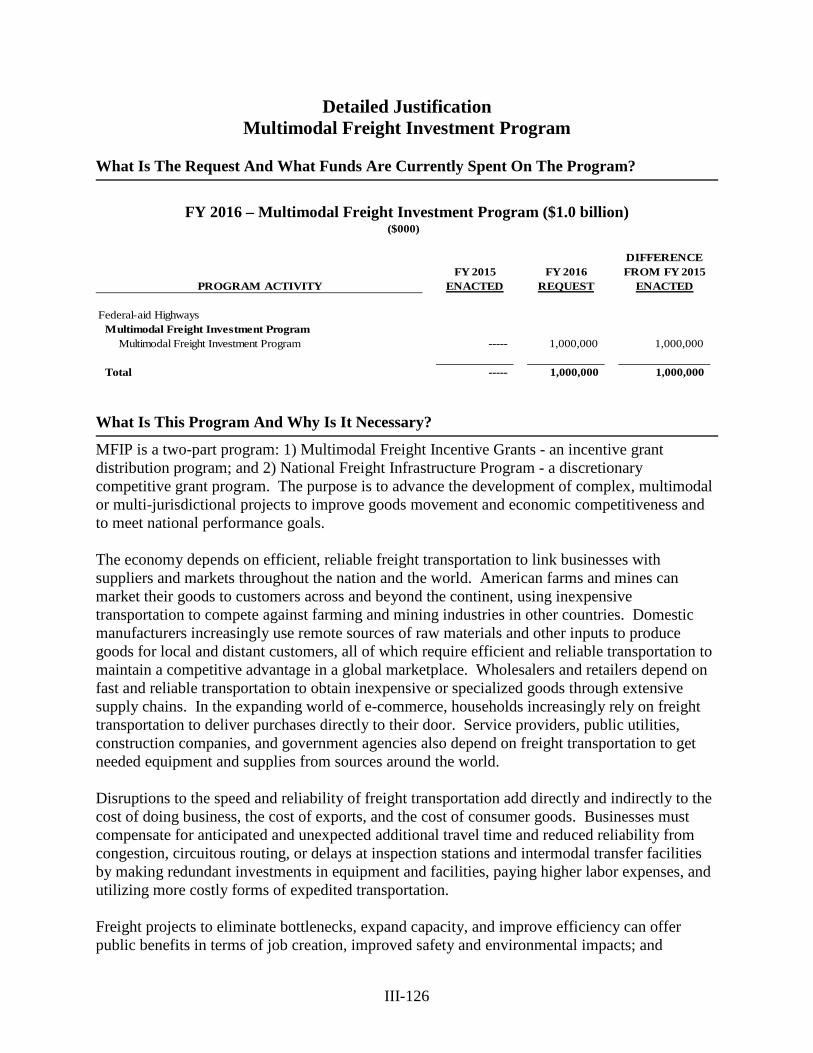
III-126
Detailed Justification Multimodal Freight Investment Program
What Is The Request And What Funds Are Currently Spent On The Program?
FY 2016 – Multimodal Freight Investment Program ($1.0 billion)
($000)
DIFFERENCEFY 2015 FY 2016 FROM FY 2015
PROGRAM ACTIVITY ENACTED REQUEST ENACTED
Federal-aid HighwaysMultimodal Freight Investment Program
Multimodal Freight Investment Program ----- 1,000,000 1,000,000
Total ----- 1,000,000 1,000,000
What Is This Program And Why Is It Necessary?
MFIP is a two-part program: 1) Multimodal Freight Incentive Grants - an incentive grant distribution program; and 2) National Freight Infrastructure Program - a discretionary competitive grant program. The purpose is to advance the development of complex, multimodal or multi-jurisdictional projects to improve goods movement and economic competitiveness and to meet national performance goals. The economy depends on efficient, reliable freight transportation to link businesses with suppliers and markets throughout the nation and the world. American farms and mines can market their goods to customers across and beyond the continent, using inexpensive transportation to compete against farming and mining industries in other countries. Domestic manufacturers increasingly use remote sources of raw materials and other inputs to produce goods for local and distant customers, all of which require efficient and reliable transportation to maintain a competitive advantage in a global marketplace. Wholesalers and retailers depend on fast and reliable transportation to obtain inexpensive or specialized goods through extensive supply chains. In the expanding world of e-commerce, households increasingly rely on freight transportation to deliver purchases directly to their door. Service providers, public utilities, construction companies, and government agencies also depend on freight transportation to get needed equipment and supplies from sources around the world. Disruptions to the speed and reliability of freight transportation add directly and indirectly to the cost of doing business, the cost of exports, and the cost of consumer goods. Businesses must compensate for anticipated and unexpected additional travel time and reduced reliability from congestion, circuitous routing, or delays at inspection stations and intermodal transfer facilities by making redundant investments in equipment and facilities, paying higher labor expenses, and utilizing more costly forms of expedited transportation. Freight projects to eliminate bottlenecks, expand capacity, and improve efficiency can offer public benefits in terms of job creation, improved safety and environmental impacts; and
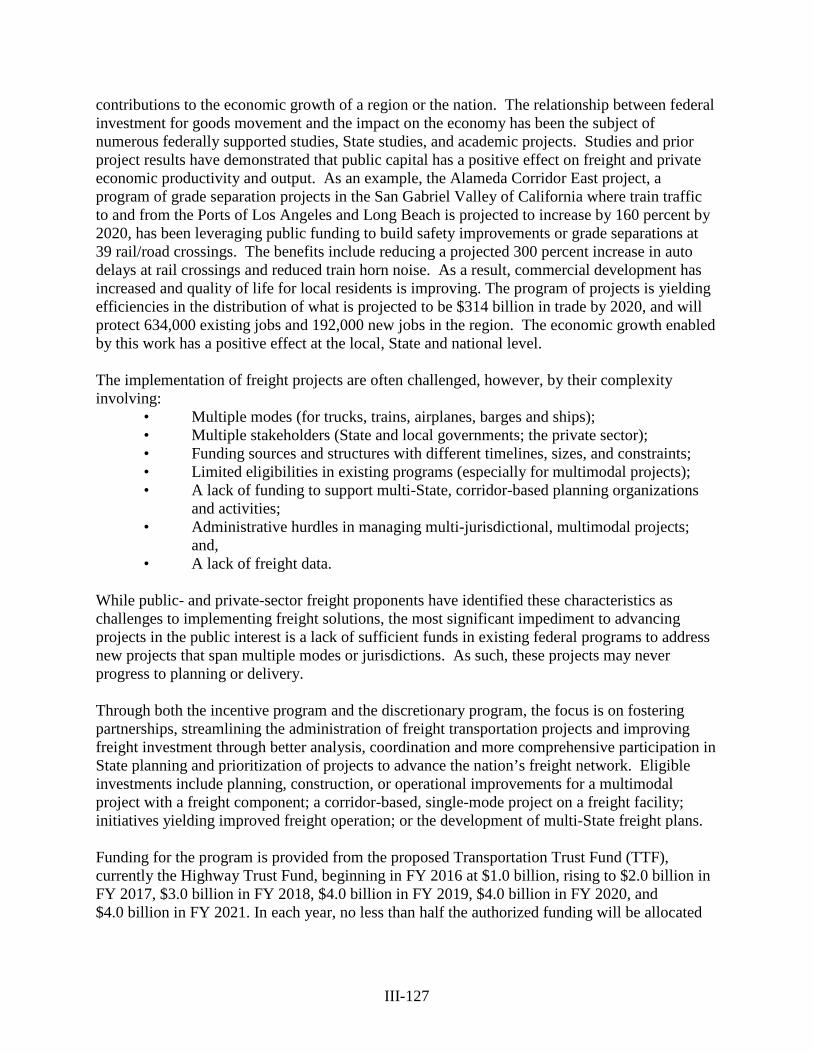
III-127
contributions to the economic growth of a region or the nation. The relationship between federal investment for goods movement and the impact on the economy has been the subject of numerous federally supported studies, State studies, and academic projects. Studies and prior project results have demonstrated that public capital has a positive effect on freight and private economic productivity and output. As an example, the Alameda Corridor East project, a program of grade separation projects in the San Gabriel Valley of California where train traffic to and from the Ports of Los Angeles and Long Beach is projected to increase by 160 percent by 2020, has been leveraging public funding to build safety improvements or grade separations at 39 rail/road crossings. The benefits include reducing a projected 300 percent increase in auto delays at rail crossings and reduced train horn noise. As a result, commercial development has increased and quality of life for local residents is improving. The program of projects is yielding efficiencies in the distribution of what is projected to be $314 billion in trade by 2020, and will protect 634,000 existing jobs and 192,000 new jobs in the region. The economic growth enabled by this work has a positive effect at the local, State and national level. The implementation of freight projects are often challenged, however, by their complexity involving:
• Multiple modes (for trucks, trains, airplanes, barges and ships); • Multiple stakeholders (State and local governments; the private sector); • Funding sources and structures with different timelines, sizes, and constraints; • Limited eligibilities in existing programs (especially for multimodal projects); • A lack of funding to support multi-State, corridor-based planning organizations
and activities; • Administrative hurdles in managing multi-jurisdictional, multimodal projects;
and, • A lack of freight data.
While public- and private-sector freight proponents have identified these characteristics as challenges to implementing freight solutions, the most significant impediment to advancing projects in the public interest is a lack of sufficient funds in existing federal programs to address new projects that span multiple modes or jurisdictions. As such, these projects may never progress to planning or delivery. Through both the incentive program and the discretionary program, the focus is on fostering partnerships, streamlining the administration of freight transportation projects and improving freight investment through better analysis, coordination and more comprehensive participation in State planning and prioritization of projects to advance the nation’s freight network. Eligible investments include planning, construction, or operational improvements for a multimodal project with a freight component; a corridor-based, single-mode project on a freight facility; initiatives yielding improved freight operation; or the development of multi-State freight plans. Funding for the program is provided from the proposed Transportation Trust Fund (TTF), currently the Highway Trust Fund, beginning in FY 2016 at $1.0 billion, rising to $2.0 billion in FY 2017, $3.0 billion in FY 2018, $4.0 billion in FY 2019, $4.0 billion in FY 2020, and $4.0 billion in FY 2021. In each year, no less than half the authorized funding will be allocated
III-128
for the discretionary grants portion of the program. Incentive funding not earned by States would be transferred to the discretionary program at the end of each fiscal year. Administration Incentive Program - For the purpose of administering the incentive grants, funds authorized may be transferred within the Department and administered in accordance with the requirements of title 23 or 49 of the United States Code applicable to the agency to which the funds are transferred and any other requirements applicable to the project. Discretionary Program - For the discretionary grant program, the Secretary may retain up to one-half of one percent of the amounts authorized for the discretionary program each fiscal year for administration and oversight of the discretionary grants. Additionally, the Secretary may choose to transfer portions of the retained funds from the one-half of one percent retainer to the modes under USDOT for the purpose of administering and providing oversight of the grants. Incentive Grant Program: Multimodal Freight Incentive Grants The incentive grant program would distribute funds to the State Departments of Transportation upon completion of certain milestones to advance State-based planning and multi-State coordination for investment in critical freight infrastructure. For each fiscal year, incentive funding amounts for each State would be determined by the State’s proportion of freight infrastructure (ports, highway and rail facilities, and cargo handling airports) and freight activity (measured by tonnage and value) to the national total for these factors. The minimum share for each State would be 0.5 percent of the total available incentive funding. The ability to use incentive funding is determined by a tiered approach. The percent of funding a State may access will rise as the State achieves higher tiers of planning and coordination. Funds may only be used for capital projects, equipment and operational improvements on highways, rail, ports, airports, and connectors eligible under Titles 23 and 49 that are prioritized and programmed for funding in a freight investment plan approved by a State Freight Advisory Committee (as defined under 49 USC 54). Funds associated with these incentive grants may not be transferred to any other Federal-aid program. Routine repair and preventative maintenance activities would not be eligible. Discretionary Program: National Freight Infrastructure Program The discretionary grant program would provide funds for an annual competition with the goal of implementing projects to reduce the cost of freight transportation, improve the safety of freight transportation, reduce congestion in the freight transportation system, improve the functioning of the freight transportation system, and reduce the adverse environmental and community impacts of freight transportation. Eligible applicants are States, U.S. Territories, local governments, MPOs, public transportation authorities including port authorities, Tribal governments or groups of these eligible applicants. Eligible projects are capital investments for a transportation infrastructure facility or operational improvements or equipment that is significantly used for the movement of freight, that the Secretary has determined will help to achieve the goals of the program and for which funding committed by State and local governments and other public and private partners, along with the federal funding requested, will be sufficient to complete the capital investment, and that upon completion will have independent utility. Selection of projects
III-129
is based on criteria that include a project’s cost benefit ratio, the advancement of the goals of the program, innovative technologies, strategies and practices, impact to increase U.S. exports, and coordination with national and State freight planning. Eligibilities The following describes project eligibilities for the incentive program:
• the development of corridor freight plans or regional freight plans; or • one or more phases of capital projects, equipment or operational improvements on roads,
rails, ports, airports, and connectors included in a State freight plan that:
o maintain or improve the efficiency and reliability of freight supply chains; o demonstrate public freight benefits; o improve modal components of a multimodal corridor that is critical to a State or
region; o address freight needs to facilitate a regionally or nationally significant economic
development issue; o are multimodal, multi-jurisdictional, or corridor-based and address freight needs; o relieve freight or non-freight access, congestion, or safety issues; or o address first and last mile connectors between facilities and modes of transport.
The following describes project eligibilities for the discretionary program:
• a capital investment for a transportation infrastructure facility, or for an operational improvement or equipment a facility significantly used for the movement of freight, and that:
o is a road, rail, air, water, or pipeline facility; o is an intermodal facility such as a seaport or port on the inland waterway system,
an airport, or a highway/rail intermodal facility; or o is a facility related to an international border crossing; o will help to achieve the goals set of the program;
o has funding committed by State and local governments and other public and private partners, along with the federal funding requested, that will be sufficient to complete the capital investment; and
o is a project that will have independent utility upon completion. Considerations for Funding The $18.0 billion will be available over six fiscal years (FY 2016-2021). The funding is divided equally between the incentive distribution and the discretionary program and at the end of each fiscal year unearned incentive funding would be made available for the discretionary program. Multimodal Freight Incentive Program To be eligible for the distribution funding under the incentive program, States must meet criteria under two tiers. Funding levels are determined depending on whether or not a State meets the criteria for each tier. Each Tier requires an increasing degree of freight planning and
III-130
coordination with freight advisory committees, regional and private-sector partners. A State meeting the criteria for the tiers may access a percentage of the funding determined by the distribution of funding for States based on the apportionment described above. National Freight Infrastructure Program To be eligible for a discretionary grant, projects must meet criteria related to how the project will advance the freight goals of the program, demonstrate the benefits of the project relative to the costs, demonstrate innovative technology, strategies and practices, the effect of the project on improving U.S. exports, and consistency with national and State freight plans. Why Do We Need To Fund The Program At The Requested Level?
The establishment of a multimodal freight program with multi-year authorization offering public sector agencies and their private sector partners a path forward to make real improvements in freight infrastructure and operations is unprecedented and yields a high rate of return on federal investment for the economy and for public benefits in safety, mobility, health and the environment. There is a significant unmet need in the nation for freight investment, and during the last reauthorization process, numerous public- and private-sector stakeholders called for federal funding of both formula and discretionary programs for freight. The proposed program will help in achieving national export goals, as well as national performance goals in many sectors (reduced emissions and energy use, reduced vehicle miles traveled, improved efficiency, improved safety, etc.). The U.S. population growth, coupled with consumer demand for goods, will continue to drive freight growth. Today, that demand is 57 tons of freight, per person, per year. The proposed program will have a significant effect on the ability of the U.S. freight industry to meet the growth in demand in a responsible, effective and sustainable way. Freight projects are often multimodal, multi-jurisdictional, complex, or involve partnership with the private sector, making them difficult to administer under current federal and State funding programs. Public- and private-sector freight proponents identify these issues along with a lack of predictable federal funds as challenges to implementing freight solutions despite widespread need and a significant backlog of projects (over $65 billion in a review of five multimodal State freight plans). In work undertaken by FHWA, the agency identified over 200 bottlenecks that result in significant truck hours of delay and lost productivity. The delay from these bottlenecks total upwards of 243 million hours annually, with direct costs to the trucking industry from these bottlenecks of almost $8 billion per year. States have long requested federal assistance to advance their most significant projects, many of which have benefits beyond the improvement of freight flow. Of the State freight plans showing project needs, nearly one-third of the projects identified involve non-highway modes. During the last reauthorization efforts, numerous public- and private- sector stakeholders called for federal funding of both formula and discretionary programs for freight. Freight program proposals included, the American Association of State Highway and Transportation Official’s (AASHTO) National Freight Corridors Investment Fund, an investment fund for freight related projects on national freight corridors that included funding freight system multimodal investments such as bottlenecks, improved access, freight transportation to/from gateways, freight routes, truck only lanes, and freight rail; the American Road and Transportation Builders Association’s (ARTBA) Critical Commerce Corridors Program that would have provided
III-131
funding for new surface transportation system capacity and operational improvements exclusively focused on securing the safe and efficient movement of freight; the Association of Metropolitan Planning Organizations’ (AMPO) National Program for Freight Mobility and Transparent Borders; Freight Stakeholders Coalition‘s dedicated fund for freight mobility/goods movement, and the Bi-Partisan Policy Center Sustaining National Connectivity and Improving Federal Connections programs. The program proposed here will help in achieving national export goals, as well as national performance goals in many sectors (reduced emissions and energy use, reduced vehicle miles traveled (VMT), improved efficiency, improved safety, etc.). This program is designed to address the following:
• Competition – Freight improvements to grow our economy often must wait behind a backlog of system preservation and other projects. Existing formula and grant programs are not sized to handle the backlog of multimodal or transformational freight infrastructure projects.
• Eligibility – Current formula programs are limited to specific modes or types of projects and do not relate directly to other MAP-21 freight goals.
• Comprehensiveness – The variety of freight needs demand both a robust predictable funding stream for advancing public sector freight plans and a high impact discretionary program to address one-time freight projects in the national and regional interest.
• Multi-jurisdictional – A discretionary component will advance corridor projects and initiatives with multi-party participation that are vital to meeting supply chain needs across political subdivisions.
• Private-Sector Investment – The private sector will be attracted by the certainty of distribution funding and/or by a robust freight discretionary program with multimodal eligibilities and will partner with public entities to realize priorities set out in State freight plans.
This program will:
• Allow freight projects, that are often complex, involving numerous modes, public and private owners and operators, and diverse funding sources, which do not neatly fit into the design of current funding programs to be more easily funded.
• Address the lack of a funding program that encompasses the ability to fund multi-jurisdictional planning and corridor development, operational improvements and construction efforts.
• Address the lack of sufficient funds in existing federal programs for freight projects as challenges to implementing freight solutions.
• Generate a high rate of return on federal dollars due to a highly positive correlation between federal (and non-federal) investment in freight and economic growth.
What Benefits Will Be Provided To The American Public Through This Request? Investments in freight improve the economy - Investments in freight infrastructure have had a profoundly positive effect on the national economy. Research has documented a highly positive
III-132
correlation between federal investment in freight and economic growth. Further, these analyses confirm that an efficient, reliable transportation system enables the economic competitiveness that is vital to maintaining economic health and supporting employment for the Nation, States, and localities. For example, disruptions to the speed and reliability of freight transportation add directly and indirectly to businesses costs, export costs, the cost of consumer goods and the ability of industry to support jobs. Freight Projects Create Jobs and Supports Growth and Sustainability - Investment in freight projects creates jobs, supports economic growth and competitiveness, and can improve safety and the environment. However, freight projects are often complex, involving numerous modes, public and private owners and operators, and diverse funding sources, and do not neatly fit into the design of current funding programs. Public- and private- sector freight proponents identify these characteristics along with a lack of sufficient funds in existing federal programs for freight projects as challenges to implementing freight solutions. As such, these projects struggle to progress. Freight Projects Yield a High Rate of Return - A multimodal freight program with multi-year authorization offers public-sector agencies and their private-sector partners a path forward to make real improvements in freight infrastructure and operations. This is unprecedented and yields a high rate of return on federal investment for the economy and for public benefits in safety, mobility, health and the environment. The demand for freight investment through the individual TIGER program years has not waned, and the private sector continues to come to the table as funding and project delivery partners, reflecting a belief in the return on investment of these projects.
III-133
Executive Summary Administrative Expenses
What Is The Request And What Funds Are Currently Spent On The Program? FHWA requests $442.2 million for FHWA General Operating Expenses (GOE) and Appalachian Regional Commission (ARC) operating expenses. Other programs previously authorized by MAP-21 within Administrative Expenses are now included in the Federal Allocation Programs section of the budget request. This includes On-The-Job Training Support Services, Disadvantaged Business Enterprises, and Highway Use Tax Evasion. What Is This Program And Why Is It Necessary? This program provides essential resources to carry out the agency’s mission. FHWA requires adequate administrative funding to maintain its leadership and oversight role as the Federal-aid Highway Program continues a new era of complexity, accountability, and transparency under the proposed GROW AMERICA Act. GOE funds salaries and benefits, rent, communications, utilities, contractual services, travel, supplies, and equipment to support the delivery of the Federal-aid Highway Program. Why Do We Need To Fund The Program At The Requested Level? From FY 2013 to 2015, FHWA’s GOE contract authority level has decreased from $416 million to $404 million, while compulsory costs, such as pay and benefits, rent, utilities, and Working Capital Fund (WCF), have increased. The combination of these factors has forced FHWA to institute significant cost savings measures, including an agency-wide hiring freeze which will reduce the workforce by approximately 100 people, reductions to information technology (IT) support, cuts to field and headquarters operations, and curtailing many critical training programs. Most FHWA staff are in the field, and the result of the necessary staffing reductions is that FHWA simply can no longer deliver the Federal-aid Highway program as effectively as in the past. FHWA requests baseline increases to enable the agency to restore staffing and operational support in FY 2016, allowing FHWA to effectively deliver the Federal-aid Highway program. While FHWA has been trying to mitigate the impact of funding reductions, without these increases, FHWA’s partners and stakeholders will begin to recognize degradation in the quality of FHWA’s program delivery and technical assistance. What Benefits Will Be Provided To The American Public Through This Request? The Federal-aid program requires an appropriately staffed workforce that is sufficiently supported and well-trained. FHWA’s immediate response to the recent I-5 bridge collapse, our efforts to finalize the Record of Decision (ROD) for the Tappan Zee project in just over a year, and innovations like adaptive signal control and use of warm-mix asphalt, which have national safety and emissions benefits, are just a few examples of how the agency is providing clear benefits to the American public. Without qualified staff and necessary contracts to provide oversight, FHWA would not be able to make roadways safer, maintain and improve road conditions, rehabilitate and repair structurally deficient bridges, improve access to and roads within Federal and Tribal lands, conduct and deploy innovative transportation research, and many other functions critical to maintaining a safe and efficient transportation network.
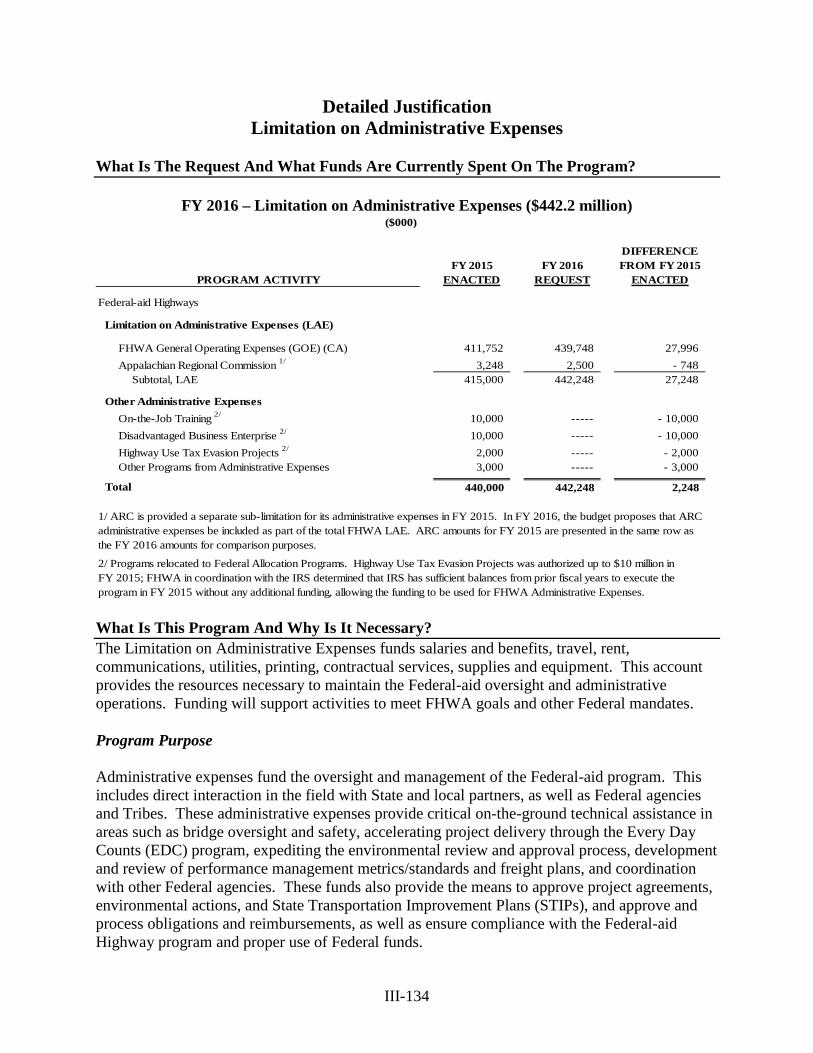
III-134
Detailed Justification Limitation on Administrative Expenses
What Is The Request And What Funds Are Currently Spent On The Program?
FY 2016 – Limitation on Administrative Expenses ($442.2 million)
($000)
DIFFERENCEFY 2015 FY 2016 FROM FY 2015
PROGRAM ACTIVITY ENACTED REQUEST ENACTED
Federal-aid Highways
Limitation on Administrative Expenses (LAE)
FHWA General Operating Expenses (GOE) (CA) 411,752 439,748 27,996 Appalachian Regional Commission 1/ 3,248 2,500 - 748
Subtotal, LAE 415,000 442,248 27,248
Other Administrative ExpensesOn-the-Job Training 2/ 10,000 ----- - 10,000Disadvantaged Business Enterprise 2/ 10,000 ----- - 10,000Highway Use Tax Evasion Projects 2/ 2,000 ----- - 2,000Other Programs from Administrative Expenses 3,000 ----- - 3,000
Total 440,000 442,248 2,248
1/ ARC is provided a separate sub-limitation for its administrative expenses in FY 2015. In FY 2016, the budget proposes that ARC administrative expenses be included as part of the total FHWA LAE. ARC amounts for FY 2015 are presented in the same row as the FY 2016 amounts for comparison purposes.
2/ Programs relocated to Federal Allocation Programs. Highway Use Tax Evasion Projects was authorized up to $10 million in FY 2015; FHWA in coordination with the IRS determined that IRS has sufficient balances from prior fiscal years to execute the program in FY 2015 without any additional funding, allowing the funding to be used for FHWA Administrative Expenses. What Is This Program And Why Is It Necessary? The Limitation on Administrative Expenses funds salaries and benefits, travel, rent, communications, utilities, printing, contractual services, supplies and equipment. This account provides the resources necessary to maintain the Federal-aid oversight and administrative operations. Funding will support activities to meet FHWA goals and other Federal mandates. Program Purpose Administrative expenses fund the oversight and management of the Federal-aid program. This includes direct interaction in the field with State and local partners, as well as Federal agencies and Tribes. These administrative expenses provide critical on-the-ground technical assistance in areas such as bridge oversight and safety, accelerating project delivery through the Every Day Counts (EDC) program, expediting the environmental review and approval process, development and review of performance management metrics/standards and freight plans, and coordination with other Federal agencies. These funds also provide the means to approve project agreements, environmental actions, and State Transportation Improvement Plans (STIPs), and approve and process obligations and reimbursements, as well as ensure compliance with the Federal-aid Highway program and proper use of Federal funds.
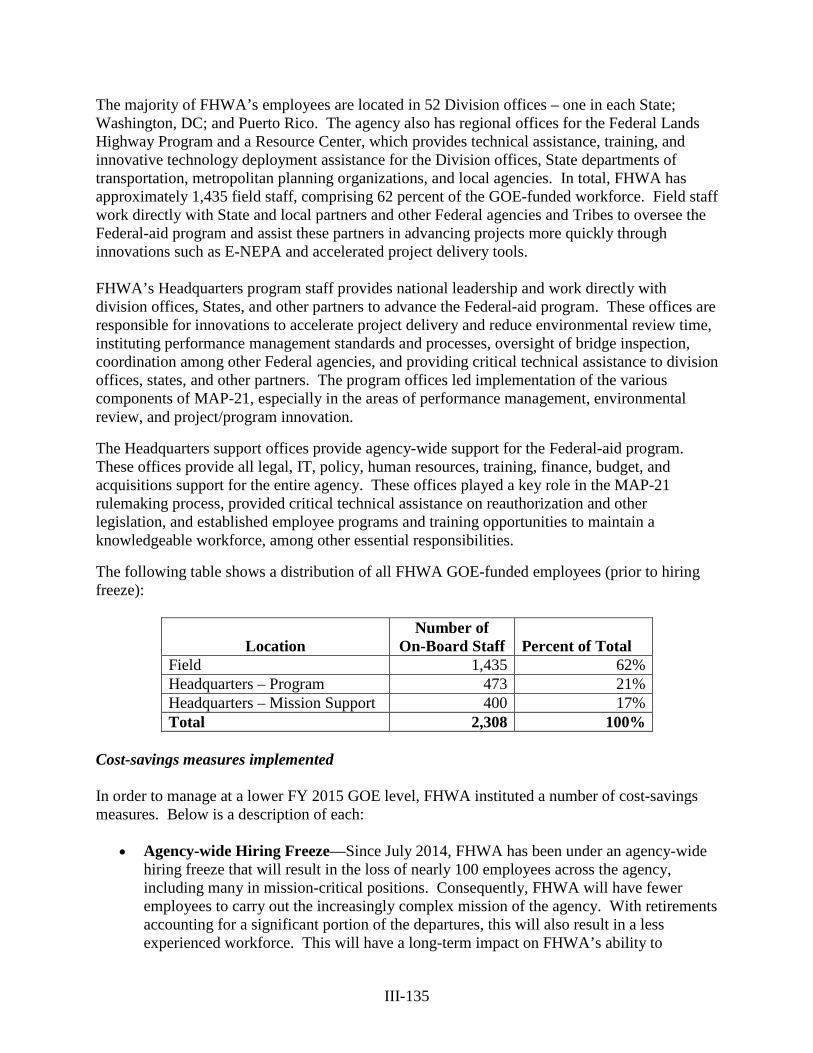
III-135
The majority of FHWA’s employees are located in 52 Division offices – one in each State; Washington, DC; and Puerto Rico. The agency also has regional offices for the Federal Lands Highway Program and a Resource Center, which provides technical assistance, training, and innovative technology deployment assistance for the Division offices, State departments of transportation, metropolitan planning organizations, and local agencies. In total, FHWA has approximately 1,435 field staff, comprising 62 percent of the GOE-funded workforce. Field staff work directly with State and local partners and other Federal agencies and Tribes to oversee the Federal-aid program and assist these partners in advancing projects more quickly through innovations such as E-NEPA and accelerated project delivery tools. FHWA’s Headquarters program staff provides national leadership and work directly with division offices, States, and other partners to advance the Federal-aid program. These offices are responsible for innovations to accelerate project delivery and reduce environmental review time, instituting performance management standards and processes, oversight of bridge inspection, coordination among other Federal agencies, and providing critical technical assistance to division offices, states, and other partners. The program offices led implementation of the various components of MAP-21, especially in the areas of performance management, environmental review, and project/program innovation.
The Headquarters support offices provide agency-wide support for the Federal-aid program. These offices provide all legal, IT, policy, human resources, training, finance, budget, and acquisitions support for the entire agency. These offices played a key role in the MAP-21 rulemaking process, provided critical technical assistance on reauthorization and other legislation, and established employee programs and training opportunities to maintain a knowledgeable workforce, among other essential responsibilities.
The following table shows a distribution of all FHWA GOE-funded employees (prior to hiring freeze):
Location Number of
On-Board Staff Percent of Total Field 1,435 62% Headquarters – Program 473 21% Headquarters – Mission Support 400 17% Total 2,308 100%
Cost-savings measures implemented In order to manage at a lower FY 2015 GOE level, FHWA instituted a number of cost-savings measures. Below is a description of each:
• Agency-wide Hiring Freeze—Since July 2014, FHWA has been under an agency-wide hiring freeze that will result in the loss of nearly 100 employees across the agency, including many in mission-critical positions. Consequently, FHWA will have fewer employees to carry out the increasingly complex mission of the agency. With retirements accounting for a significant portion of the departures, this will also result in a less experienced workforce. This will have a long-term impact on FHWA’s ability to
III-136
effectively deliver the highway program as it has in the past. Also, it will restrict FHWA’s capacity to provide value-added services to our State partners and other stakeholders in the areas of technical assistance and technology deployment, as well as restrict support to key programs such as Every Day Counts (EDC), performance management, bridge safety, and emergency relief (ER).
• Reduction of IT Support Services—FHWA has significantly curtailed a number of agency IT support services, including reduced contractor support, reductions to IT infrastructure and application software, deferral of data center consolidation, and limited data governance and enterprise architecture support. The result of these cost-cutting measures is that FHWA will not be able to maintain its IT systems as it has in the past. Services in these areas will be limited to only critical, “break/fix” items and reduced support will mean delays in issue resolution, resulting in overall IT performance degradation for users.
• Reduction to Field/Headquarters Operations—FHWA has cut back on its field and headquarters operations by approximately $7 million in FY 2015. Field and Headquarters operations have been refocused to only mission-critical activities, and travel has been substantially reduced. In order to continue to deliver the Federal-aid program with reduced funding, FHWA has implemented a risk-based stewardship and oversight program, which has enabled the agency to focus its limited resources on areas of greatest risk to the agency. However, cuts in recent years are negatively impacting our capacity to effectively deliver and oversee the Federal-aid highway program. The ongoing funding constraints are also forcing FHWA to decrease value-added activities that are in high demand by our partners and stakeholders, such technical assistance and technology development.
Additionally, FHWA is reducing IT services across the agency, including limiting IT hardware replacement to “break/fix”, and deferring all office phone conversions to Voice over Internet Protocol (VoIP). Most of these cost savings measures are only deferrals and cannot be delayed indefinitely. By pushing these necessary services into future years, it will raise the cost, and have a negative impact on current agency operations.
• Reduction in Agency-wide Training—Training programs and technical discipline seminars were reduced in FY 2014 and will be further reduced in FY 2015. Discipline seminars and professional/technical programs will be effectively eliminated in FY 2015, and there will be cutbacks to leadership and supervisory programs. In an effort to find low-cost solutions, in FY 2015, FHWA will begin conducting its New Hire Orientation program virtually. The combination of a reduced, less experienced workforce and limited training will have a negative impact on FHWA’s ability to carry out the Federal-aid program as it has previously done.
Funding Request FHWA requests a $442.2 million Limitation on Administrative Expenses (LAE) consisting of $439.7 million for FHWA Federal-Aid General Operating Expenses (GOE) and $2.5 million for the Appalachian Regional Commission (ARC). In accordance with section 104 of title 23,
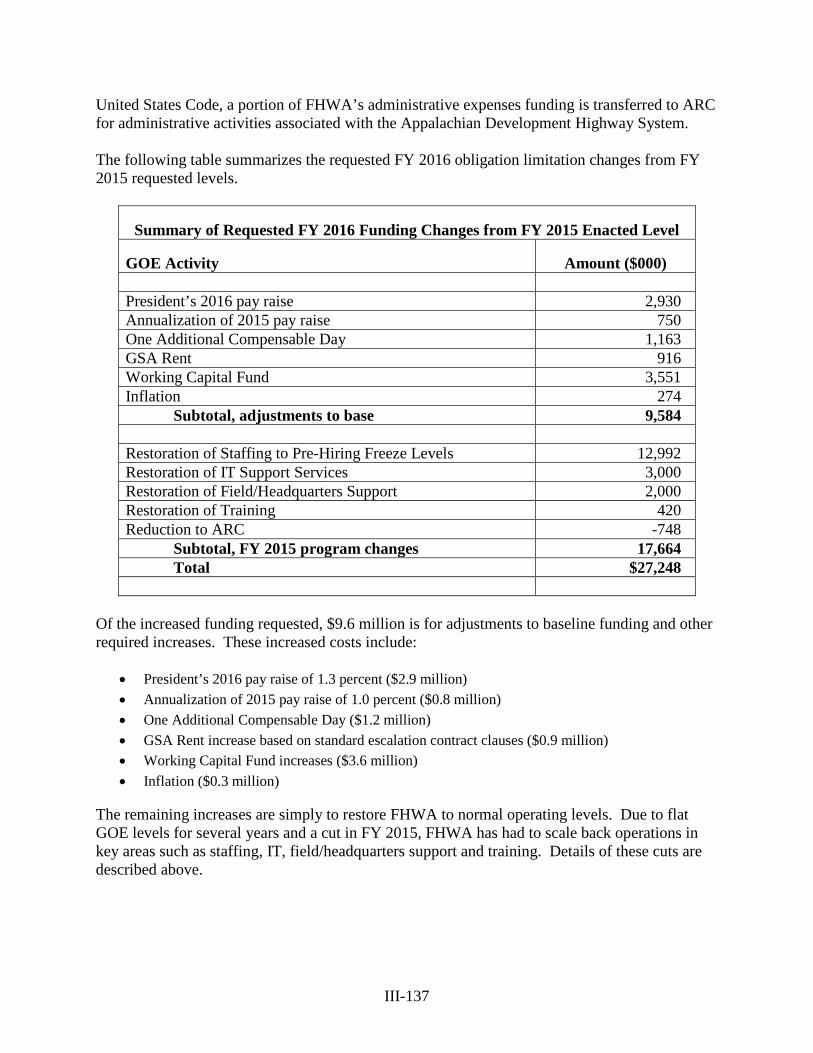
III-137
United States Code, a portion of FHWA’s administrative expenses funding is transferred to ARC for administrative activities associated with the Appalachian Development Highway System. The following table summarizes the requested FY 2016 obligation limitation changes from FY 2015 requested levels.
Summary of Requested FY 2016 Funding Changes from FY 2015 Enacted Level
GOE Activity Amount ($000) President’s 2016 pay raise 2,930 Annualization of 2015 pay raise 750 One Additional Compensable Day 1,163 GSA Rent 916 Working Capital Fund 3,551 Inflation 274
Subtotal, adjustments to base 9,584 Restoration of Staffing to Pre-Hiring Freeze Levels 12,992 Restoration of IT Support Services 3,000 Restoration of Field/Headquarters Support 2,000 Restoration of Training 420 Reduction to ARC -748
Subtotal, FY 2015 program changes 17,664 Total $27,248
Of the increased funding requested, $9.6 million is for adjustments to baseline funding and other required increases. These increased costs include:
• President’s 2016 pay raise of 1.3 percent ($2.9 million) • Annualization of 2015 pay raise of 1.0 percent ($0.8 million) • One Additional Compensable Day ($1.2 million) • GSA Rent increase based on standard escalation contract clauses ($0.9 million) • Working Capital Fund increases ($3.6 million) • Inflation ($0.3 million)
The remaining increases are simply to restore FHWA to normal operating levels. Due to flat GOE levels for several years and a cut in FY 2015, FHWA has had to scale back operations in key areas such as staffing, IT, field/headquarters support and training. Details of these cuts are described above.
III-138
Following is a description of the request: Restore Staffing to Pre-hiring Freeze Levels ($13.0 million)— This would simply allow FHWA to restore staffing levels and to effectively administer the Federal-aid Highway Program as it has in the past. To operate at FY 2015 funding levels, FHWA must reduce approximately 100 FTE. With the requested funding for FY 2016, we would staff up during the fiscal year and return to the previous FTE levels in FY 2017. Without additional funding, the reductions would become permanent, forcing FHWA to reduce its number of positions going forward. As FHWA’s workload is not decreasing, this would have a negative long-term impact on FHWA’s ability to retain existing staff and deliver the Federal-aid program. Restore IT Support Services ($3.0 million)— This additional funding would allow FHWA to restore critical IT support services such as infrastructure and application support, enterprise architecture and data governance, and contractor support. Without this funding, IT services will continue to degrade, leaving FHWA’s workforce without sufficient IT support to effectively administer the Federal-aid program. Restore Field/HQ Operations ($2.0 million)— This funding will allow FHWA to support necessary field operations such as previously deferred office refurbishments, and phone conversion to VoIP. By restoring these important initiatives in FY 2016, it will save money in future years when these repairs and upgrades would be more costly. Restore Agency-wide Training ($0.4 million)— FHWA’s training investment slipped to an historic low in FY 2014 as the agency was only able to spend $1.5 million on training—20% below FY 2013’s level. With reduced GOE funding in FY 2015, training investment will slip even further. This modest amount of additional funding will allow FHWA to restore needed professional and technical training programs, which are necessary to maintaining the knowledge base of the workforce.
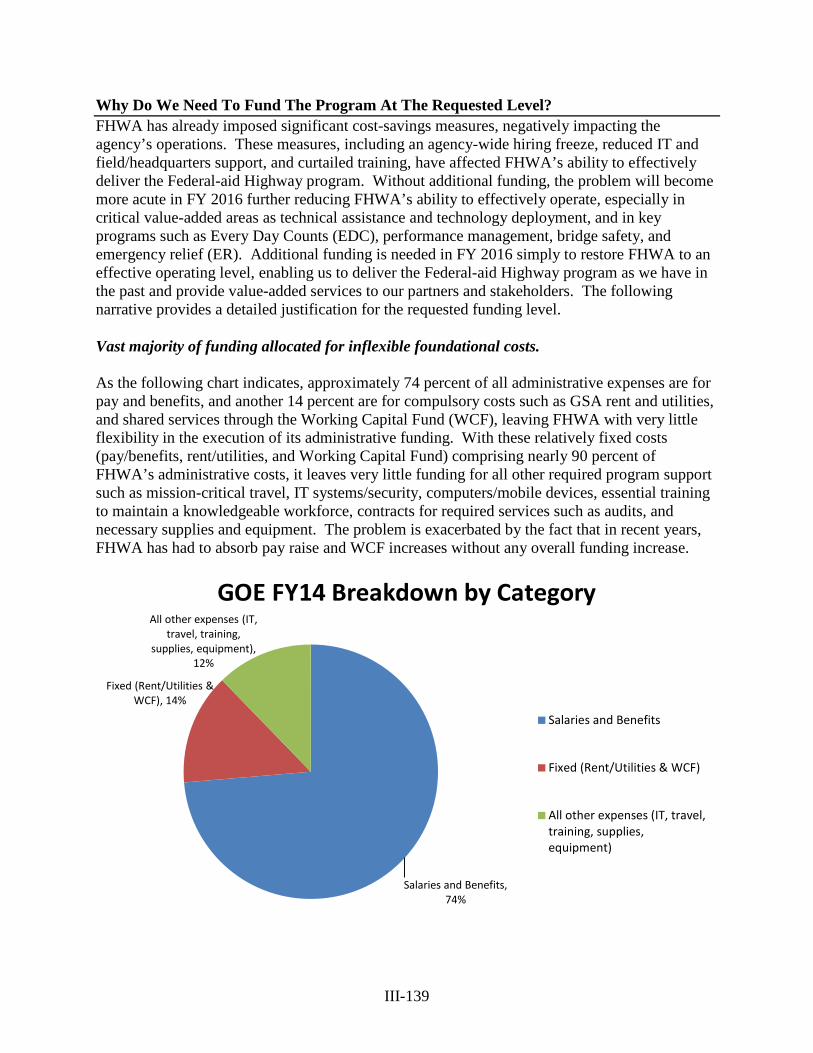
III-139
Why Do We Need To Fund The Program At The Requested Level? FHWA has already imposed significant cost-savings measures, negatively impacting the agency’s operations. These measures, including an agency-wide hiring freeze, reduced IT and field/headquarters support, and curtailed training, have affected FHWA’s ability to effectively deliver the Federal-aid Highway program. Without additional funding, the problem will become more acute in FY 2016 further reducing FHWA’s ability to effectively operate, especially in critical value-added areas as technical assistance and technology deployment, and in key programs such as Every Day Counts (EDC), performance management, bridge safety, and emergency relief (ER). Additional funding is needed in FY 2016 simply to restore FHWA to an effective operating level, enabling us to deliver the Federal-aid Highway program as we have in the past and provide value-added services to our partners and stakeholders. The following narrative provides a detailed justification for the requested funding level. Vast majority of funding allocated for inflexible foundational costs. As the following chart indicates, approximately 74 percent of all administrative expenses are for pay and benefits, and another 14 percent are for compulsory costs such as GSA rent and utilities, and shared services through the Working Capital Fund (WCF), leaving FHWA with very little flexibility in the execution of its administrative funding. With these relatively fixed costs (pay/benefits, rent/utilities, and Working Capital Fund) comprising nearly 90 percent of FHWA’s administrative costs, it leaves very little funding for all other required program support such as mission-critical travel, IT systems/security, computers/mobile devices, essential training to maintain a knowledgeable workforce, contracts for required services such as audits, and necessary supplies and equipment. The problem is exacerbated by the fact that in recent years, FHWA has had to absorb pay raise and WCF increases without any overall funding increase.
GOE FY14 Breakdown by Category
Salaries and Benefits, 74%
Fixed (Rent/Utilities & WCF), 14%
All other expenses (IT, travel, training,
supplies, equipment), 12%
Salaries and Benefits
Fixed (Rent/Utilities & WCF)
All other expenses (IT, travel,training, supplies,equipment)
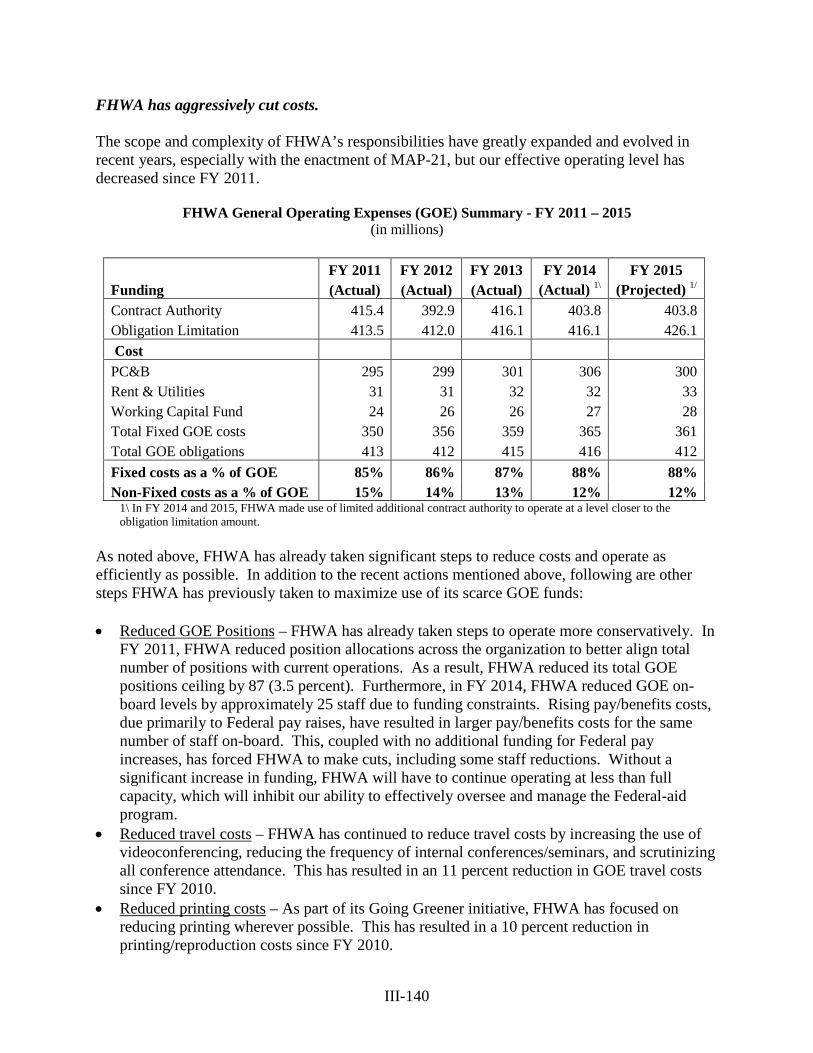
III-140
FHWA has aggressively cut costs. The scope and complexity of FHWA’s responsibilities have greatly expanded and evolved in recent years, especially with the enactment of MAP-21, but our effective operating level has decreased since FY 2011.
FHWA General Operating Expenses (GOE) Summary - FY 2011 – 2015 (in millions)
FY 2011 FY 2012 FY 2013 FY 2014 FY 2015 Funding (Actual) (Actual) (Actual) (Actual) 1\ (Projected) 1/ Contract Authority 415.4 392.9 416.1 403.8 403.8 Obligation Limitation 413.5 412.0 416.1 416.1 426.1 Cost PC&B 295 299 301 306 300 Rent & Utilities 31 31 32 32 33 Working Capital Fund 24 26 26 27 28 Total Fixed GOE costs 350 356 359 365 361 Total GOE obligations 413 412 415 416 412 Fixed costs as a % of GOE 85% 86% 87% 88% 88% Non-Fixed costs as a % of GOE 15% 14% 13% 12% 12%
1\ In FY 2014 and 2015, FHWA made use of limited additional contract authority to operate at a level closer to the obligation limitation amount.
As noted above, FHWA has already taken significant steps to reduce costs and operate as efficiently as possible. In addition to the recent actions mentioned above, following are other steps FHWA has previously taken to maximize use of its scarce GOE funds: • Reduced GOE Positions – FHWA has already taken steps to operate more conservatively. In
FY 2011, FHWA reduced position allocations across the organization to better align total number of positions with current operations. As a result, FHWA reduced its total GOE positions ceiling by 87 (3.5 percent). Furthermore, in FY 2014, FHWA reduced GOE on-board levels by approximately 25 staff due to funding constraints. Rising pay/benefits costs, due primarily to Federal pay raises, have resulted in larger pay/benefits costs for the same number of staff on-board. This, coupled with no additional funding for Federal pay increases, has forced FHWA to make cuts, including some staff reductions. Without a significant increase in funding, FHWA will have to continue operating at less than full capacity, which will inhibit our ability to effectively oversee and manage the Federal-aid program.
• Reduced travel costs – FHWA has continued to reduce travel costs by increasing the use of videoconferencing, reducing the frequency of internal conferences/seminars, and scrutinizing all conference attendance. This has resulted in an 11 percent reduction in GOE travel costs since FY 2010.
• Reduced printing costs – As part of its Going Greener initiative, FHWA has focused on reducing printing wherever possible. This has resulted in a 10 percent reduction in printing/reproduction costs since FY 2010.
III-141
Even with these and other actions, FHWA has not been able to maintain existing operations due to reduced GOE funding, necessitating more severe action such as the agency-wide hiring freeze, reduction of IT and field/headquarters operations, and elimination in FY 2015 of a number of training programs. Without funding at the requested level, many of these cost-savings actions will become permanent. MAP-21 program consolidation did not reduce staffing requirements. The consolidated program structure in MAP-21 involved a program restructuring but not the elimination of eligibilities or activities. For example, while the Highway Bridge Program was eliminated as a separate program, the eligibilities for bridge activities now reside in other programs, such as the Surface Transportation Program and the National Highway Performance Program. As a result, FHWA still requires the expertise of the bridge infrastructure engineers. FHWA has been and remains organized around core areas of expertise such as infrastructure, safety, operations, environmental assessments, and project planning. Those core areas of expertise remain key to delivering the consolidated program structure under MAP-21 and the proposed GROW AMERICA Act. Federal-aid program is growing in size and complexity. MAP-21 continued and expanded many of the management and oversight responsibilities without providing additional administrative funding. Additionally, MAP-21 required numerous rulemakings and studies that, although unfunded, have required additional resources. While increased project management, accelerated project delivery, and shortening environmental reviews and approvals are all worthy initiatives, they require both human and financial resources to achieve. FHWA fully supports these initiatives, and proposes to continue these efforts in the President’s proposed GROW AMERICA Act—we simply ask that we have sufficient resources to effectively carry out these tasks. On the project delivery side, project design and development has become more complicated as States and partners are increasingly turning to Public-Private-Partnerships (PPPs), innovative contracting and project delivery mechanisms (e.g. design-build), as a means for our partners and others to deliver large complex and higher cost projects. These methods require extensive FHWA involvement on issues ranging from contracting, project development, financing, tolling, construction, maintenance, and operations. MAP-21 established a performance-based framework for the Federal-aid program, requiring a number of ongoing implementation actions for FHWA and its partners. As part of performance management under MAP-21, FHWA is required to develop performance measures in the National Highway Performance Program (NHPP), Highway Safety Improvement Program (HSIP), the Congestion Mitigation and Air Quality Program (CMAQ), and National Freight Movement. Also, FHWA must develop 12 performance measure categories in these areas. In each area, FHWA must work with its state partners to develop performance measures, targets, plans, and reports, as well as ongoing assistance to ensure that targets are achieved. The President’s GROW AMERICA Act continues this performance-based framework. This will
III-142
require the continued development and expansion of systems and processes to support a more robust performance management structure. The organization must dedicate both human and systems resources to fulfill the performance management requirements. The planning process has become more complicated, with new requirements in the areas of environmental mitigation, safety, operations and management, asset management, freight movement, fiscal constraint, land use and multi-modal issues. Also, the operations and freight program areas, which largely did not exist 10 years ago, are now integral parts of the Federal-aid program Finally, FHWA’s role in preparing for and responding to manmade and natural disasters has grown significantly as a result of events in recent years. FHWA has been able to respond immediately to emergency events such as the I-5 bridge collapse in Washington, and Superstorm Sandy in the Northeast, providing funding and on-the-ground support, allowing these affected areas to recover more quickly. FHWA seeks to continue this emergency response capability, which is why it is essential to fund the agency’s GOE at the requested level. The technical assistance provided in these instances was predominantly from GOE funding. Reduced request for Appalachian Regional Commission (ARC) administrative funding. The administrative funding amount for ARC is included within FHWA’s overall administrative request. ARC administrative funds provide for pay/benefits, travel, and related expenses for both ARC and FHWA employees that are working on the Appalachian Development Highway System (ADHS). With the completion of the ADHS in the coming years, FHWA staff currently supporting the ADHS program will return to support other FHWA programs. This will mean less spending in FY 2016 and future years on ARC administrative expenses. In order to provide flexibility for FHWA and ARC to align resources with estimated needs, and to ensure that administrative funds are most efficiently used, FHWA proposes to fund ARC administrative expenses from its overall request. What Benefits Will Be Provided To The American Program Through This Request? FHWA and our administrative funding are integral to the effective delivery of the federal-aid program. We:
• Ensure that $40 billion of Federal funding is delivered in accordance with Federal laws and regulations and protected from fraud, waste and abuse.
• Protect the safety of the traveling public through highway and bridge design and operations standards and guidance as well as by establishing requirements for and monitoring bridge inspection practice.
• Help communities recover from national disasters through administration of the emergency relief program and by providing internationally recognized technical expertise.
III-143
• Shorten project delivery through assistance to State and local governments in the planning, design and construction process, including meeting NEPA requirements and coordinating with other federal agencies to obtain the required permits.
• Design and manage the construction for projects on federal lands, including National Parks, forest highways, etc. We provide public access to America's treasures.
• Conduct research, advance technologies and practices, deliver training and provide technical assistance to States, local and tribal governments. These new technologies save taxpayer time, money and lives
With qualified staff and necessary contracts to provide oversight, FHWA will be able to make roadways safer, maintain and improve road conditions, rehabilitate and repair structurally deficient bridges, improve access to and roads within Federal and Tribal lands, conduct and deploy innovative transportation research, and many other functions critical to maintaining an efficient and safe transportation network. In recent years, FHWA has increased its focus on innovation through the Every Day Counts (EDC) initiative, which has led to significant improvements in shortening project delivery and accelerating technology and innovation deployment. For example, FHWA has worked closely with its State partners to develop the Construction Manager General Contractor contracting method to shorten project delivery. As a result, new or revitalized roadways and bridges are opening to the public sooner. EDC initiatives have also had a significant impact on safety and emissions. For example, adaptive signal control, which adjusts signal phases based on traffic patterns, were implemented in 90 locations as of 2012. These signals reduce fuel consumption and crashes. Also, EDC supported the development and use of warm-mix asphalt (WMA), which allows asphalt to be mixed at lower temperatures, reducing costs and fuel consumption. In 2012, WMA represented 30 percent of the asphalt market, resulting in a 5 percent reduction in overall air emissions -- the equivalent of taking 160,000 vehicles off the road. FHWA works closely with its State, local, Federal and Tribal partners to shorten the environmental review process. For example, on the Tappan Zee bridge project, one of the largest bridge projects in the nation, FHWA worked with New York State to develop a concurrent environmental review process, resulting in a significantly expedited review and approval process. This type of collaboration reduces costs and enables projects to be completed sooner, which reduces commute times for the nearly 140,000 drivers who use the bridge each day. These are just a few examples of FHWA employing innovation to assist its partners in completing transportation projects more safely, quickly, and efficiently, which results in fewer fatalities and accidents, reduced congestion and commute times, and accelerates better movement of goods and services throughout the national. By providing funding at the requested level, FHWA can continue to provide these valuable services, enhancing the transportation experience for all Americans.

III-144
This Page Left Blank Intentionally
III-145
FIXING AND ACCELERATING SURFACE TRANSPORTATION
(LIMITATION ON OBLIGATIONS)
(LIQUIDATION OF CONTRACT AUTHORITY) (TRANSPORTATION TRUST FUND)
Contingent upon enactment of multi-year surface transportation authorization
legislation, for the payment of obligations incurred in carrying out the Fixing and Accelerating Surface Transportation program under title 49, United States Code, $500,000,000 to be derived from the Highway Account of the Transportation Trust Fund and to remain available until expended: Provided, that funds available for the implementation or execution of such program shall not exceed total obligations of $500,000,000.

III-146
This Page Left Blank Intentionally
III-147
Executive Summary Fixing and Accelerating Surface Transportation Program
What Is The Request And What Funds Are Currently Spent On The Program? The FHWA budget requests $500.0 million for the Fixing and Accelerating Surface Transportation (FAST) program. An additional $500.0 million is requested by the Federal Transit Administration (FTA) in its budget request. FAST is funded by the Transportation Trust Fund to award grants to States, Tribes, and MPOs that adopt bold, innovative strategies and best practices in transportation that would have long-term impact on all projects across surface transportation programs. This is a new program proposed in the Administration’s GROW AMERICA Act at a total of $1.0 billion for each of fiscal years 2016-2021. What Is This Program And Why Is It Necessary? As our Nation addresses its infrastructure deficit, it is necessary to encourage and reward innovation that helps find infrastructure solutions and move forward more efficiently and effectively. FAST is a competitive grant program, jointly managed by FHWA and FTA. FAST is designed to spur major reform in the way States and metropolitan regions make transportation policy and investments and to encourage new and innovative solutions to transportation challenges. FAST uses competition and a sizable grant incentive to reward long-term, systematic innovation and reform in our Nation’s transportation system. FAST is necessary to incentivize innovative reform by States and MPOs that benefit national priorities, including reducing transportation fatalities, improving efficiency, strengthening economic competitiveness, improving state of good repair of the transportation system, encouraging partnership between the public and private sectors, and providing access to jobs and opportunity. Since the majority of transportation funds are distributed by formula to States, the decisions on which projects to fund are made at the State level. The FAST competitive grant program would supplement these formula funds and provide additional resources designed to encourage States and localities to work across jurisdictional lines to address national transportation priorities, with awardees chosen based on the boldness of their proposal and the outcomes expected to follow. Why Do We Need To Fund The Program At The Requested Level? A FY 2016 funding amount of $500.0 million, along with the additional $500.0 million requested by FTA, is needed to provide a strong incentive for States and MPOs to take on ambitious, innovative reforms that lead to large-scale adoption. What Benefits Will Be Provided To The American Public Through This Request? The American public benefits from the FAST program because it provides surface transportation solutions and reduced costs, allowing the public to get to their destinations more safely, more quickly, and more economically. FAST is based on the U.S. Department of Education’s Race to the Top concept, which spurred unprecedented competition, innovation and reform in our Nation’s education system. Competition in transportation has proven to be a powerful incentive for States and local governments to tackle long-standing barriers to making performance-based, outcome-driven investment decisions and policies that best achieve national goals benefitting all Americans.
III-148
Detailed Justification Fixing and Accelerating Surface Transportation Program
What Is The Request And What Funds Are Currently Spent On The Program?
FY 2016 – Fixing and Accelerating Surface Transportation (FAST) ($500.0 million)
($000)
DIFFERENCEFY 2015 FY 2016 FROM FY 2015
PROGRAM ACTIVITY ENACTED REQUEST ENACTED
Federal-aid HighwaysFixing and Accelerating Surface Transportation
Fixing and Accelerating Surface Transportation ----- 500,000 500,000
Total ----- 500,000 500,000
What Is This Program And Why Is It Necessary? The Fixing and Accelerating Surface Transportation (FAST) program is a competitive grant program proposed in the Administration’s GROW AMERICA Act at a total of $1.0 billion for each of fiscal years 2016-2021. FAST is jointly managed by FHWA and FTA. FHWA’s budget requests $500.0 million for FAST. An additional $500.0 million is requested by FTA in its budget request. The program is designed to spur major reform in the way States and metropolitan regions make transportation policy and investments, and to encourage innovative solutions to transportation challenges. Based on the U.S. Department of Education’s Race to the Top concept, the FAST program will use competition and a sizable grant incentive to reward long-term systematic innovation in our Nation’s transportation system. Long-term systematic reforms usually require change to established, customary practices. Often change to these practices requires legislation, regulation or broad restructuring of traditional programs. The FAST program offers an opportunity to effect near-term change by encouraging States and localities to move away from established practice. There is public agreement that transportation should be a seamless, multimodal network designed to move people and goods to their destination. However, our transportation programs at the Federal, State and local level continue to operate in siloes; with separate funds, rules and systems for each mode of transportation. For example, many States have legislative or constitutional prohibitions against using gas tax funds for non-roadway projects, resulting in inflexible transportation solutions and moving further from multimodal and systematic solutions. Current practice for selecting projects within MPOs also offers opportunities for improvement. Some urban areas are represented by as many as four or five MPOs, which can inhibit regional strategies for transportation problems. Other MPOs fail to coordinate with other infrastructure and economic development activities in the region.
III-149
The Department of Transportation is pursuing multiple strategies for rectifying deficiencies in current practice for selecting projects—including seeking changes to authorizing language for transportation programs, and developing regulations and performance measures for States and localities where appropriate. The FAST program complements these efforts by offering a mechanism for inducing rapid change, through incentives rather than enforcement. As a competitive grant program, FAST will choose awardees based on the boldness of the proposal and the expected outcomes in the form of transportation benefits. Awards will be made based on the extent to which a project benefits national priorities, including reducing transportation fatalities, improving efficiency, strengthening economic competitiveness, improving state of good repair of the transportation system, and providing access to jobs and opportunity. MPOs that are designated by the Secretary as high-performing and that meet geographic and governance best practices will each receive a set-aside from FAST of between $1 million and $3 million per year depending on population. The set-aside funding can be used on any project eligible under title 23 or chapter 53 of title 49, United States Code, and may be used to pay the non-Federal share of projects funded under these same titles. As with Race to the Top, FAST needs to be a large enough program that the grant awards can incentivize States and MPOs to break from current practice. An overall $1.0 billion program—split between $500.0 million requested by FHWA and $500.0 million requested by FTA—provides sufficient funding to encourage States and localities to generate bold, regional-scale project proposals. Past attempts to provide minor monetary incentives to make improvements, such as encouraging investment in freight projects with a higher Federal match, have not proven large enough to incentivize transformative project proposals. With the funding level requested for FAST, States and localities will compete to build multimodal, regional transportation projects that achieve national goals and provide superior transportation benefits. Why Do We Need To Fund The Program At The Requested Level? A FY 2016 funding amount of $500.0 million, along with the additional $500.0 million requested by FTA, is needed to provide a strong incentive for States and MPOs to take on ambitious, innovative reforms that lead to large-scale adoption. What Benefits Will Be Provided To The American Public Through This Request? The American public benefits from the FAST program because it provides surface transportation solutions and reduced costs, allowing the public to get to their destinations more safely, more quickly, and more economically. FAST is based on the U.S. Department of Education’s Race to the Top concept, which spurred significant competition, innovation and reform in our Nation’s education system. Race to the Top brought unprecedented change to our education system, particularly in raising standards and aligning policies and structures to the goal of college and career readiness. Race to the Top has helped drive states nationwide to pursue higher standards, improve teacher effectiveness, use data effectively in the classroom, and adopt new strategies to help struggling schools. FAST will similarly help to bring positive change to surface transportation projects.
III-150
Similar to the education sector, competition in transportation has proven to be a powerful incentive for States and local governments to tackle long-standing barriers to making performance-based, outcome-driven investment decisions and policies that best achieve national goals such as economic competitiveness, safety, and environmental sustainability which benefit all Americans. One way that this will be accomplished by FAST is by providing incentives for high performing MPOs that have high levels of regional collaboration, utilize performance based planning and programming to improve long-range planning and project selection, and employ equitable and regional approaches to decision making.
III-151
DEPARTMENT OF TRANSPORTATION FEDERAL HIGHWAY ADMINISTRATION
HIGHWAY INFRASTRUCTURE INVESTMENT, RECOVERY ACT
BACKGROUND Enacted on February 17, 2009, the American Recovery and Reinvestment Act of 2009 (Recovery Act) provided $27.5 billion from the General Fund to the Federal Highway Administration (FHWA), of which $26.6 billion was apportioned to States based on formulas described in the Recovery Act and $0.9 billion was allocated to programs identified in the Recovery Act, including the Indian Reservation Roads Program, Park Roads and Parkway Program, Forest Highway Program, Refuge Roads Program, Disadvantaged Business Enterprise Bonding Assistance, Territorial Highway Program, Puerto Rico Highway Program, and the Ferry Boat Discretionary Program. Administrative oversight funds were available through September 30, 2012 and all other funds were available through September 30, 2010. The FHWA Recovery Act funds have been used to invest in transportation, environmental protection, and other infrastructure that will provide long-term economic benefits to the Nation. The Recovery Act funds augmented existing investments authorized by the Safe, Accountable, Flexible, Efficient Transportation Equity Act of 2005: A Legacy for Users (SAFETEA-LU), enabling States, regional, and local governments to accelerate to completion a number of highway infrastructure projects planned or underway. Since the Recovery Act was enacted in February 2009, more than 42,000 miles of pavement across the United States have been improved. Of the 12,914 highway projects for which Recovery Act funds were obligated, 1,294 projects are under construction and 11,620 projects have been completed. BUDGETARY RESOURCES No new budget authority is requested for FY 2016.
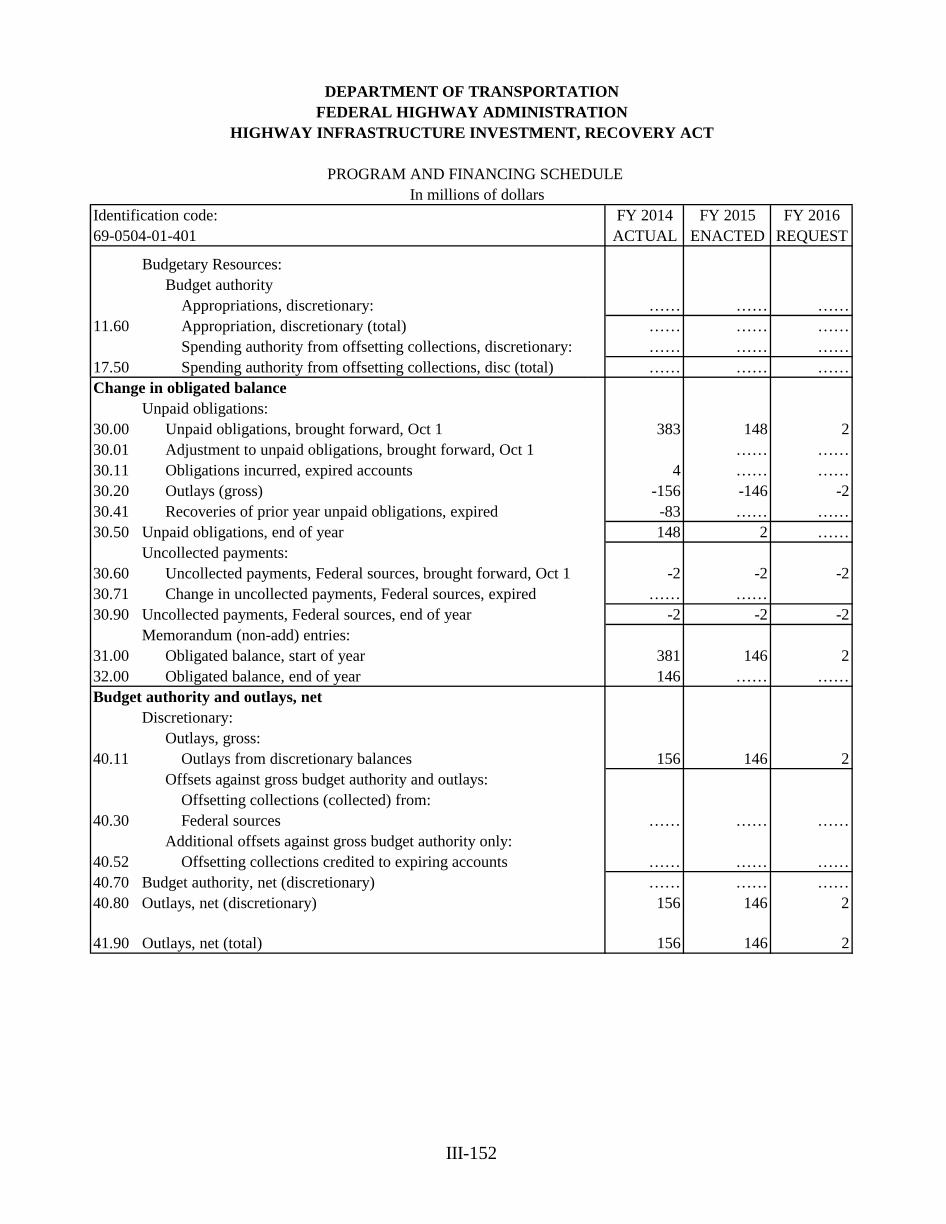
III-152
DEPARTMENT OF TRANSPORTATIONFEDERAL HIGHWAY ADMINISTRATION
PROGRAM AND FINANCING SCHEDULE In millions of dollars
Identification code: FY 2014 FY 2015 FY 201669-0504-01-401 ACTUAL ENACTED REQUEST
Budgetary Resources:Budget authority
Appropriations, discretionary: …… …… ……11.60 Appropriation, discretionary (total) …… …… ……
Spending authority from offsetting collections, discretionary: …… …… ……17.50 Spending authority from offsetting collections, disc (total) …… …… ……Change in obligated balance
Unpaid obligations:30.00 Unpaid obligations, brought forward, Oct 1 383 148 230.01 Adjustment to unpaid obligations, brought forward, Oct 1 …… ……30.11 Obligations incurred, expired accounts 4 …… ……30.20 Outlays (gross) -156 -146 -230.41 Recoveries of prior year unpaid obligations, expired -83 …… ……30.50 Unpaid obligations, end of year 148 2 ……
Uncollected payments:30.60 Uncollected payments, Federal sources, brought forward, Oct 1 -2 -2 -230.71 Change in uncollected payments, Federal sources, expired …… ……30.90 Uncollected payments, Federal sources, end of year -2 -2 -2
Memorandum (non-add) entries:31.00 Obligated balance, start of year 381 146 232.00 Obligated balance, end of year 146 …… ……Budget authority and outlays, net
Discretionary:Outlays, gross:
40.11 Outlays from discretionary balances 156 146 2Offsets against gross budget authority and outlays:
Offsetting collections (collected) from:40.30 Federal sources …… …… ……
Additional offsets against gross budget authority only:40.52 Offsetting collections credited to expiring accounts …… …… ……40.70 Budget authority, net (discretionary) …… …… ……40.80 Outlays, net (discretionary) 156 146 2
41.90 Outlays, net (total) 156 146 2
HIGHWAY INFRASTRUCTURE INVESTMENT, RECOVERY ACT
III-153
DEPARTMENT OF TRANSPORTATION FEDERAL HIGHWAY ADMINISTRATION
EMERGENCY RELIEF
BACKGROUND The Emergency Relief program receives $100 million annually in mandatory funds in the Federal-aid Highways account. The Safe, Accountable, Flexible, Efficient Transportation Equity Act of 2005: A Legacy for Users (SAFETEA-LU); and the Moving Ahead for Progress in the 21st Century Act (MAP-21), enacted July 6, 2012, authorized the program to receive additional General Fund discretionary funding as needed. In 2012, $1,662 million was enacted to remain available until expended, and in 2013, $2,022 million was enacted to remain available until expended, both for necessary expenses resulting from major disasters declared pursuant to the Robert T. Stafford Disaster Relief and Emergency Assistance Act (42 U.S.C. 5121 et seq.). BUDGETARY RESOURCES No further appropriations are requested for this account in FY 2016.
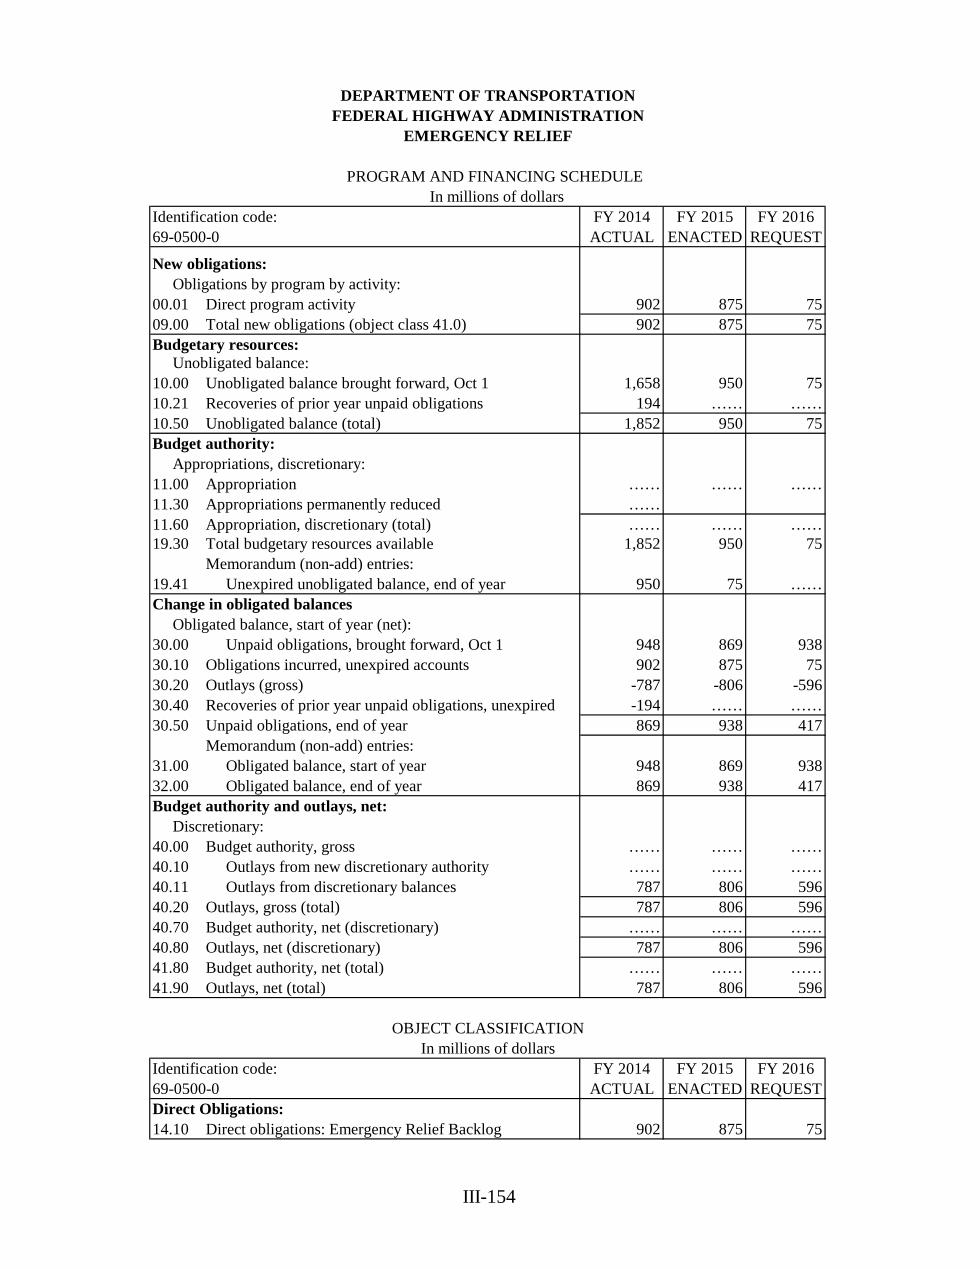
III-154
DEPARTMENT OF TRANSPORTATIONFEDERAL HIGHWAY ADMINISTRATION
PROGRAM AND FINANCING SCHEDULE In millions of dollars
Identification code: FY 2014 FY 2015 FY 201669-0500-0 ACTUAL ENACTED REQUEST
New obligations: Obligations by program by activity:00.01 Direct program activity 902 875 7509.00 Total new obligations (object class 41.0) 902 875 75Budgetary resources: Unobligated balance:10.00 Unobligated balance brought forward, Oct 1 1,658 950 7510.21 Recoveries of prior year unpaid obligations 194 …… ……10.50 Unobligated balance (total) 1,852 950 75Budget authority: Appropriations, discretionary:11.00 Appropriation …… …… ……11.30 Appropriations permanently reduced ……11.60 Appropriation, discretionary (total) …… …… ……19.30 Total budgetary resources available 1,852 950 75
Memorandum (non-add) entries:19.41 Unexpired unobligated balance, end of year 950 75 ……Change in obligated balances Obligated balance, start of year (net):30.00 Unpaid obligations, brought forward, Oct 1 948 869 93830.10 Obligations incurred, unexpired accounts 902 875 7530.20 Outlays (gross) -787 -806 -59630.40 Recoveries of prior year unpaid obligations, unexpired -194 …… ……30.50 Unpaid obligations, end of year 869 938 417
Memorandum (non-add) entries:31.00 Obligated balance, start of year 948 869 93832.00 Obligated balance, end of year 869 938 417Budget authority and outlays, net: Discretionary:40.00 Budget authority, gross …… …… ……40.10 Outlays from new discretionary authority …… …… ……40.11 Outlays from discretionary balances 787 806 59640.20 Outlays, gross (total) 787 806 59640.70 Budget authority, net (discretionary) …… …… ……40.80 Outlays, net (discretionary) 787 806 59641.80 Budget authority, net (total) …… …… ……41.90 Outlays, net (total) 787 806 596
OBJECT CLASSIFICATIONIn millions of dollars
Identification code: FY 2014 FY 2015 FY 201669-0500-0 ACTUAL ENACTED REQUESTDirect Obligations:14.10 Direct obligations: Emergency Relief Backlog 902 875 75
EMERGENCY RELIEF
III-155
DEPARTMENT OF TRANSPORTATION FEDERAL HIGHWAY ADMINISTRATION
APPALACHIAN DEVELOPMENT HIGHWAY SYSTEM
BACKGROUND Funding for this program is used for the necessary expenses relating to construction of, and improvements to, corridors of the Appalachian Development Highway System as distributed to the following states: Alabama, Georgia, Kentucky, Maryland, Mississippi, New York, North Carolina, Ohio, Pennsylvania, South Carolina, Tennessee, Virginia, and West Virginia. This schedule shows the obligation and outlay of amounts made available in prior years. BUDGETARY RESOURCES No new budget authority is requested for FY 2016.
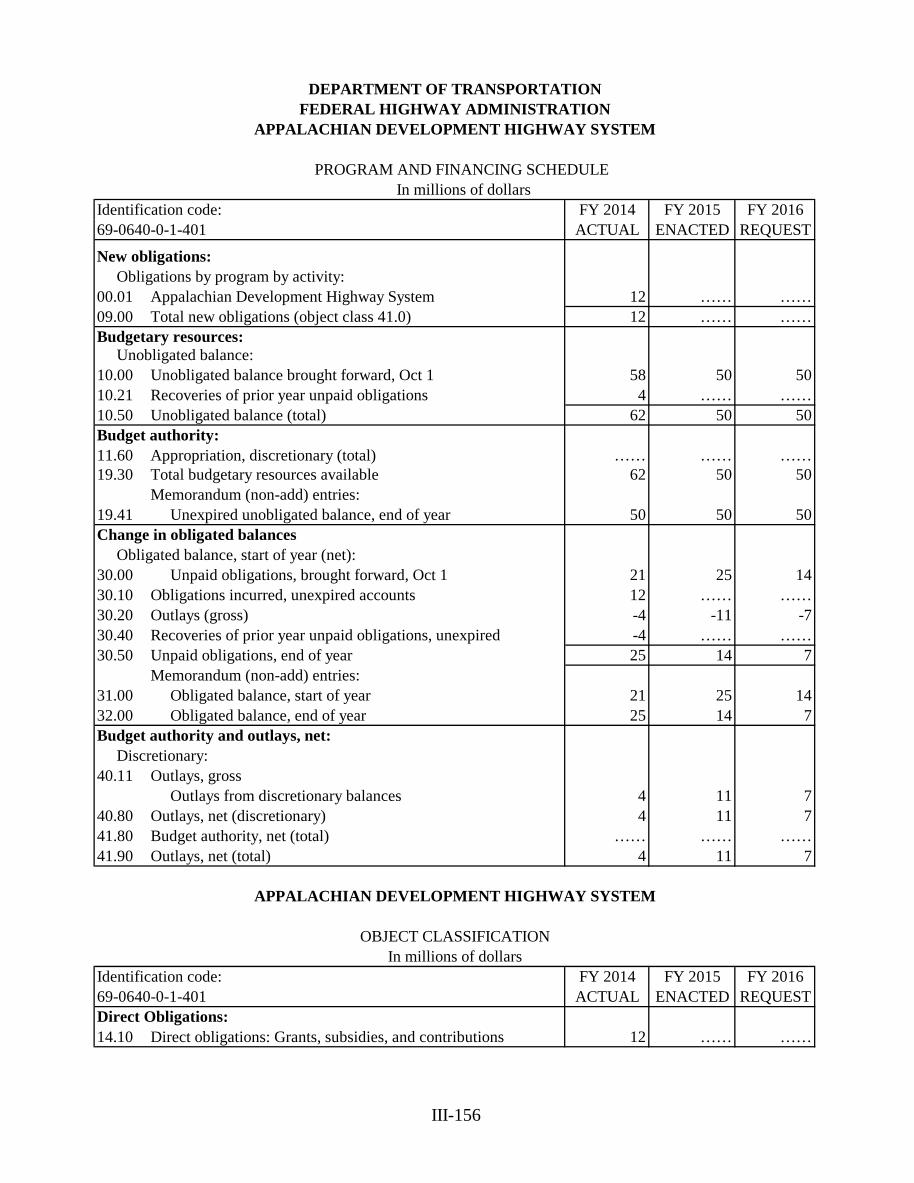
III-156
DEPARTMENT OF TRANSPORTATIONFEDERAL HIGHWAY ADMINISTRATION
PROGRAM AND FINANCING SCHEDULE In millions of dollars
Identification code: FY 2014 FY 2015 FY 201669-0640-0-1-401 ACTUAL ENACTED REQUEST
New obligations: Obligations by program by activity:00.01 Appalachian Development Highway System 12 …… ……09.00 Total new obligations (object class 41.0) 12 …… ……Budgetary resources: Unobligated balance:10.00 Unobligated balance brought forward, Oct 1 58 50 5010.21 Recoveries of prior year unpaid obligations 4 …… ……10.50 Unobligated balance (total) 62 50 50Budget authority:11.60 Appropriation, discretionary (total) …… …… ……19.30 Total budgetary resources available 62 50 50
Memorandum (non-add) entries:19.41 Unexpired unobligated balance, end of year 50 50 50Change in obligated balances Obligated balance, start of year (net):30.00 Unpaid obligations, brought forward, Oct 1 21 25 1430.10 Obligations incurred, unexpired accounts 12 …… ……30.20 Outlays (gross) -4 -11 -730.40 Recoveries of prior year unpaid obligations, unexpired -4 …… ……30.50 Unpaid obligations, end of year 25 14 7
Memorandum (non-add) entries:31.00 Obligated balance, start of year 21 25 1432.00 Obligated balance, end of year 25 14 7Budget authority and outlays, net: Discretionary:40.11 Outlays, gross
Outlays from discretionary balances 4 11 740.80 Outlays, net (discretionary) 4 11 741.80 Budget authority, net (total) …… …… ……41.90 Outlays, net (total) 4 11 7
APPALACHIAN DEVELOPMENT HIGHWAY SYSTEM
OBJECT CLASSIFICATIONIn millions of dollars
Identification code: FY 2014 FY 2015 FY 201669-0640-0-1-401 ACTUAL ENACTED REQUESTDirect Obligations:14.10 Direct obligations: Grants, subsidies, and contributions 12 …… ……
APPALACHIAN DEVELOPMENT HIGHWAY SYSTEM
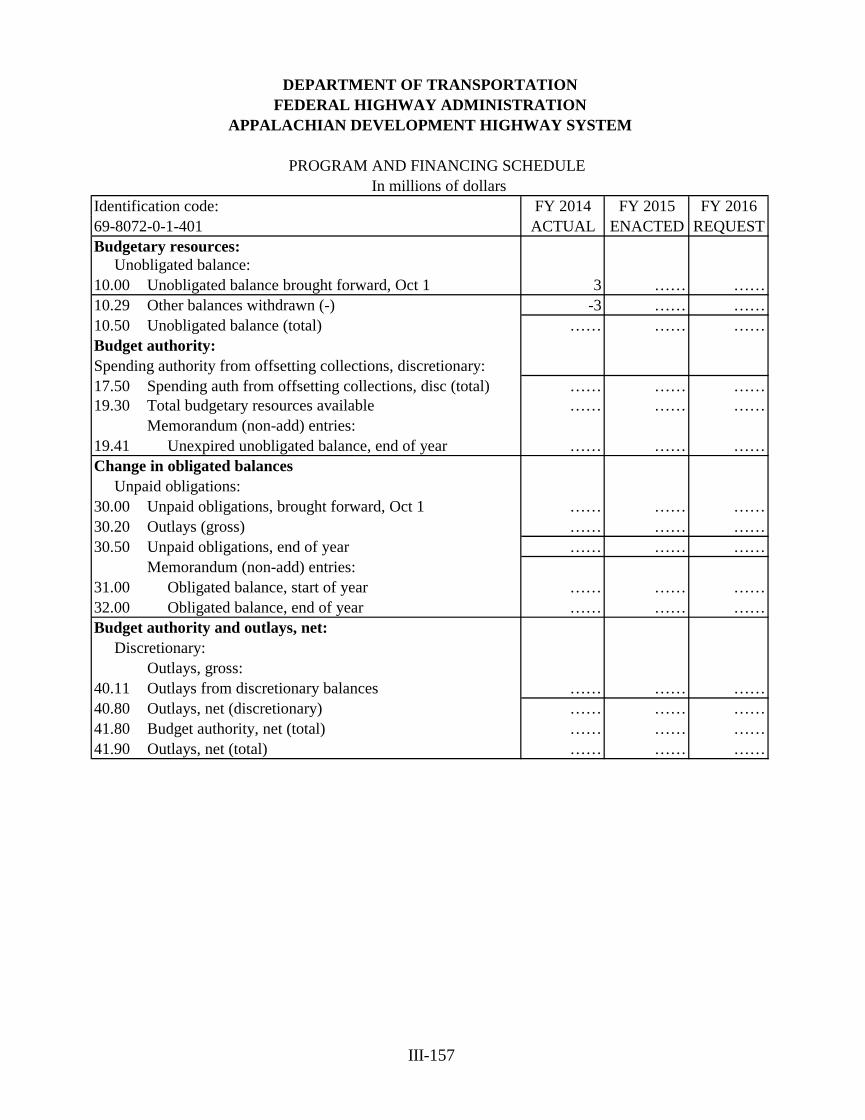
III-157
DEPARTMENT OF TRANSPORTATIONFEDERAL HIGHWAY ADMINISTRATION
PROGRAM AND FINANCING SCHEDULE In millions of dollars
Identification code: FY 2014 FY 2015 FY 201669-8072-0-1-401 ACTUAL ENACTED REQUESTBudgetary resources: Unobligated balance:10.00 Unobligated balance brought forward, Oct 1 3 …… ……10.29 Other balances withdrawn (-) -3 …… ……10.50 Unobligated balance (total) …… …… ……Budget authority:Spending authority from offsetting collections, discretionary:17.50 Spending auth from offsetting collections, disc (total) …… …… ……19.30 Total budgetary resources available …… …… ……
Memorandum (non-add) entries:19.41 Unexpired unobligated balance, end of year …… …… ……Change in obligated balances Unpaid obligations:30.00 Unpaid obligations, brought forward, Oct 1 …… …… ……30.20 Outlays (gross) …… …… ……30.50 Unpaid obligations, end of year …… …… ……
Memorandum (non-add) entries:31.00 Obligated balance, start of year …… …… ……32.00 Obligated balance, end of year …… …… ……Budget authority and outlays, net: Discretionary:
Outlays, gross:40.11 Outlays from discretionary balances …… …… ……40.80 Outlays, net (discretionary) …… …… ……41.80 Budget authority, net (total) …… …… ……41.90 Outlays, net (total) …… …… ……
APPALACHIAN DEVELOPMENT HIGHWAY SYSTEM

III-158
This Page Left Blank Intentionally
III-159
DEPARTMENT OF TRANSPORTATION FEDERAL HIGHWAY ADMINISTRATION
MISCELLANEOUS APPROPRIATIONS
BACKGROUND This consolidated schedule shows the obligation and outlay of amounts appropriated from the General Fund for miscellaneous programs. The schedule reflects a Transportation Infrastructure Finance and Innovation (TIFIA) Act program upward interest re-estimate of $389 million for FY 2014 and $159 million for FY 2015. The Moving Ahead for Progress in the 21st Century Act (MAP-21), enacted July 6, 2012, includes the TIFIA Act program upward subsidy re-estimate with this account instead of its previous inclusion in the Federal-aid Highways account. BUDGETARY RESOURCES No further discretionary appropriations are requested for FY 2016.
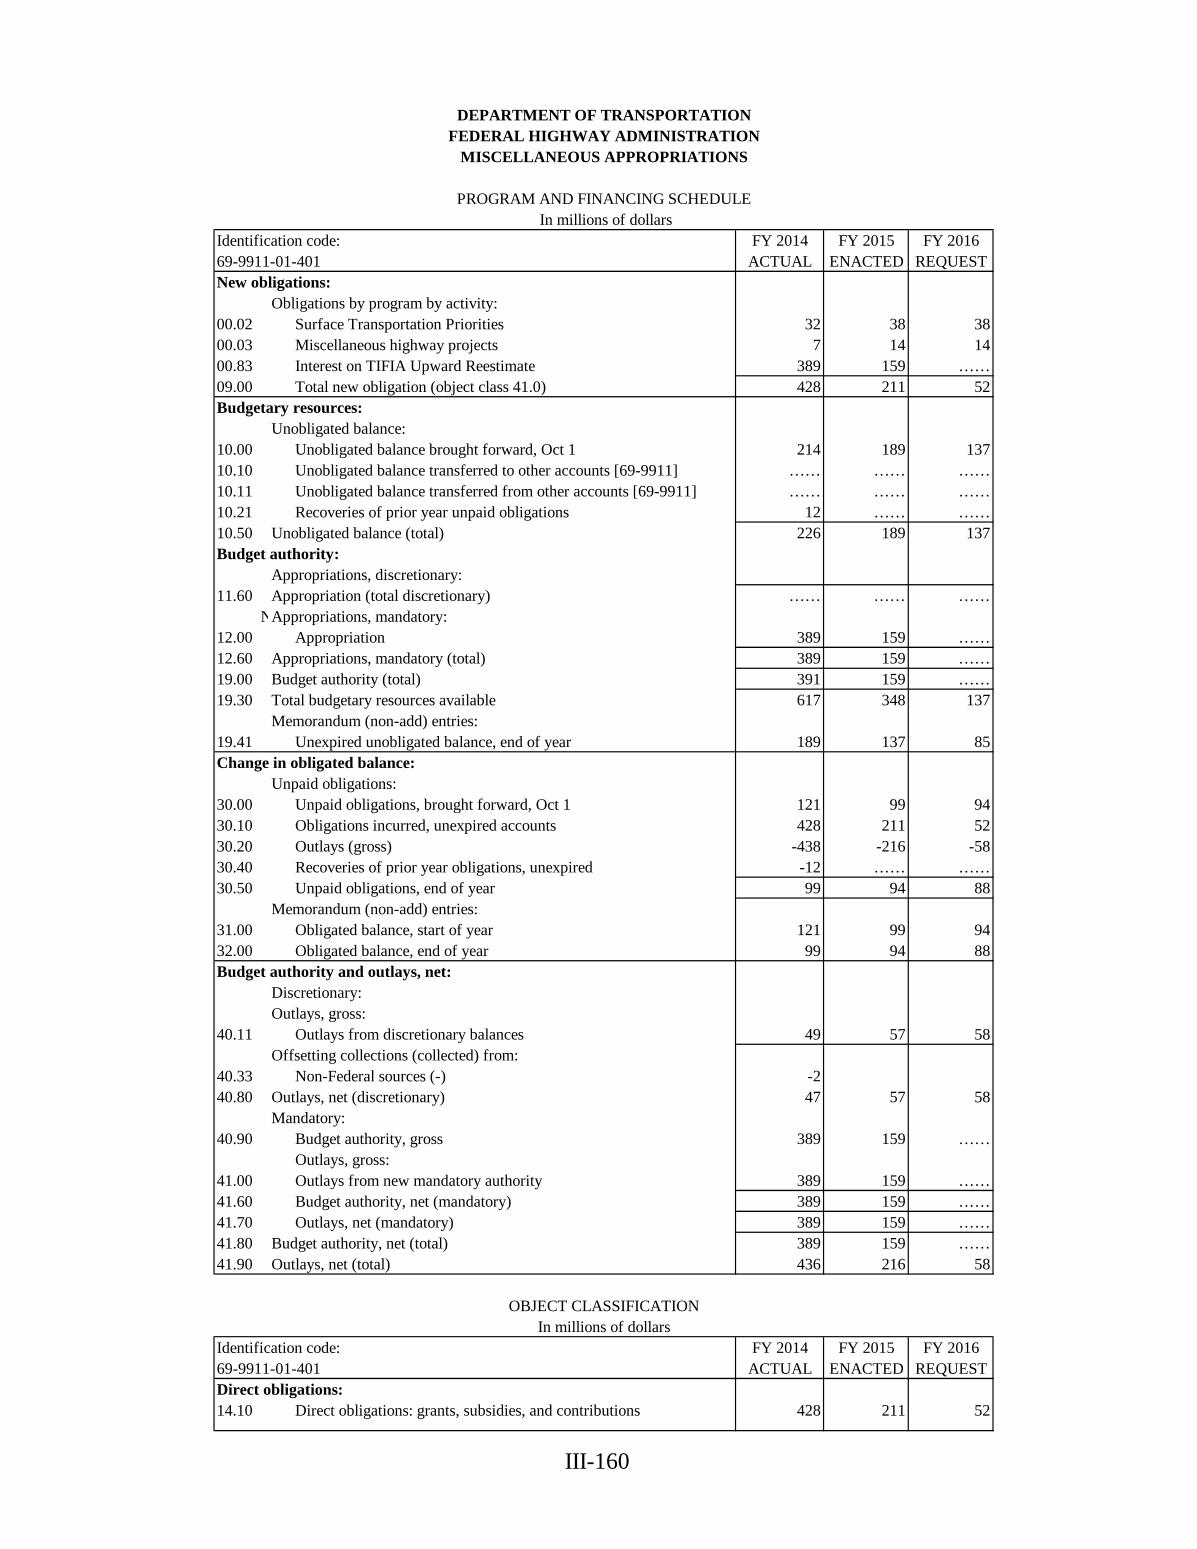
III-160
DEPARTMENT OF TRANSPORTATIONFEDERAL HIGHWAY ADMINISTRATION
MISCELLANEOUS APPROPRIATIONS
PROGRAM AND FINANCING SCHEDULE In millions of dollars
Identification code: FY 2014 FY 2015 FY 201669-9911-01-401 ACTUAL ENACTED REQUESTNew obligations:
Obligations by program by activity:00.02 Surface Transportation Priorities 32 38 3800.03 Miscellaneous highway projects 7 14 1400.83 Interest on TIFIA Upward Reestimate 389 159 ……09.00 Total new obligation (object class 41.0) 428 211 52Budgetary resources:
Unobligated balance:10.00 Unobligated balance brought forward, Oct 1 214 189 13710.10 Unobligated balance transferred to other accounts [69-9911] …… …… ……10.11 Unobligated balance transferred from other accounts [69-9911] …… …… ……10.21 Recoveries of prior year unpaid obligations 12 …… ……10.50 Unobligated balance (total) 226 189 137Budget authority:
Appropriations, discretionary:11.60 Appropriation (total discretionary) …… …… …… N Appropriations, mandatory:12.00 Appropriation 389 159 ……12.60 Appropriations, mandatory (total) 389 159 ……19.00 Budget authority (total) 391 159 ……19.30 Total budgetary resources available 617 348 137
Memorandum (non-add) entries:19.41 Unexpired unobligated balance, end of year 189 137 85Change in obligated balance:
Unpaid obligations:30.00 Unpaid obligations, brought forward, Oct 1 121 99 9430.10 Obligations incurred, unexpired accounts 428 211 5230.20 Outlays (gross) -438 -216 -5830.40 Recoveries of prior year obligations, unexpired -12 …… ……30.50 Unpaid obligations, end of year 99 94 88
Memorandum (non-add) entries:31.00 Obligated balance, start of year 121 99 9432.00 Obligated balance, end of year 99 94 88Budget authority and outlays, net:
Discretionary:Outlays, gross:
40.11 Outlays from discretionary balances 49 57 58Offsetting collections (collected) from:
40.33 Non-Federal sources (-) -240.80 Outlays, net (discretionary) 47 57 58
Mandatory:40.90 Budget authority, gross 389 159 ……
Outlays, gross:41.00 Outlays from new mandatory authority 389 159 ……41.60 Budget authority, net (mandatory) 389 159 ……41.70 Outlays, net (mandatory) 389 159 ……41.80 Budget authority, net (total) 389 159 ……41.90 Outlays, net (total) 436 216 58
OBJECT CLASSIFICATIONIn millions of dollars
Identification code: FY 2014 FY 2015 FY 201669-9911-01-401 ACTUAL ENACTED REQUESTDirect obligations:14.10 Direct obligations: grants, subsidies, and contributions 428 211 52
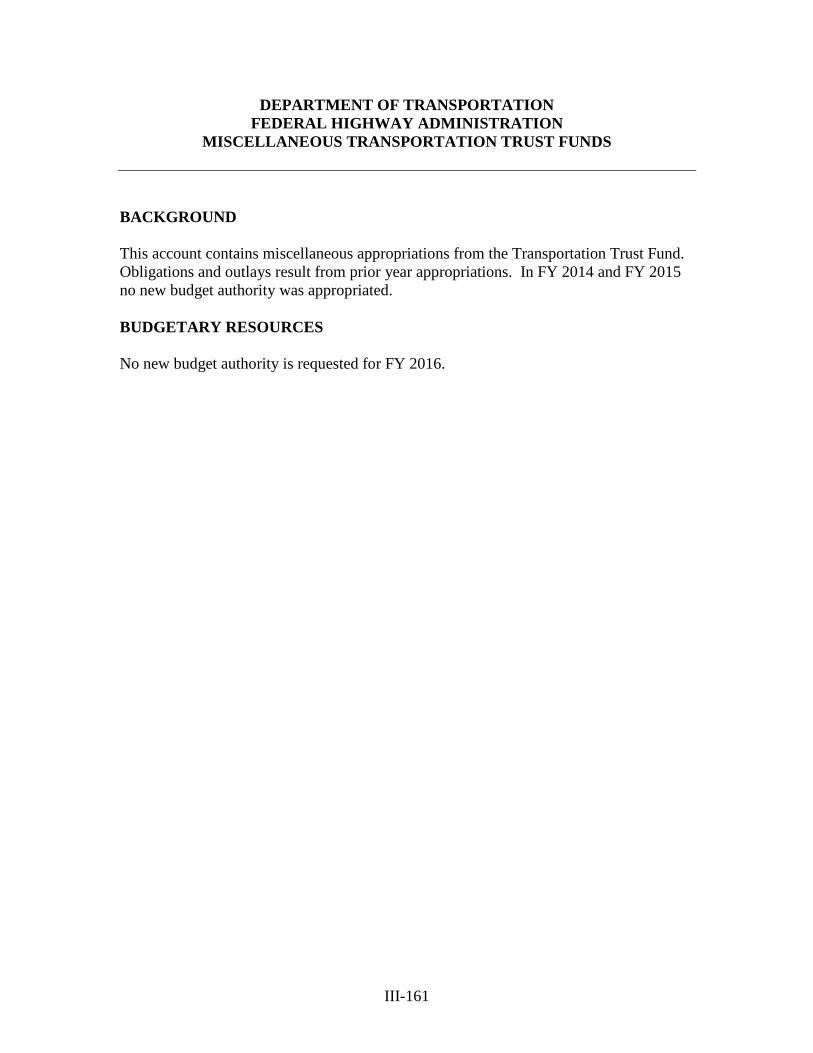
III-161
DEPARTMENT OF TRANSPORTATION FEDERAL HIGHWAY ADMINISTRATION
MISCELLANEOUS TRANSPORTATION TRUST FUNDS
BACKGROUND This account contains miscellaneous appropriations from the Transportation Trust Fund. Obligations and outlays result from prior year appropriations. In FY 2014 and FY 2015 no new budget authority was appropriated. BUDGETARY RESOURCES No new budget authority is requested for FY 2016.
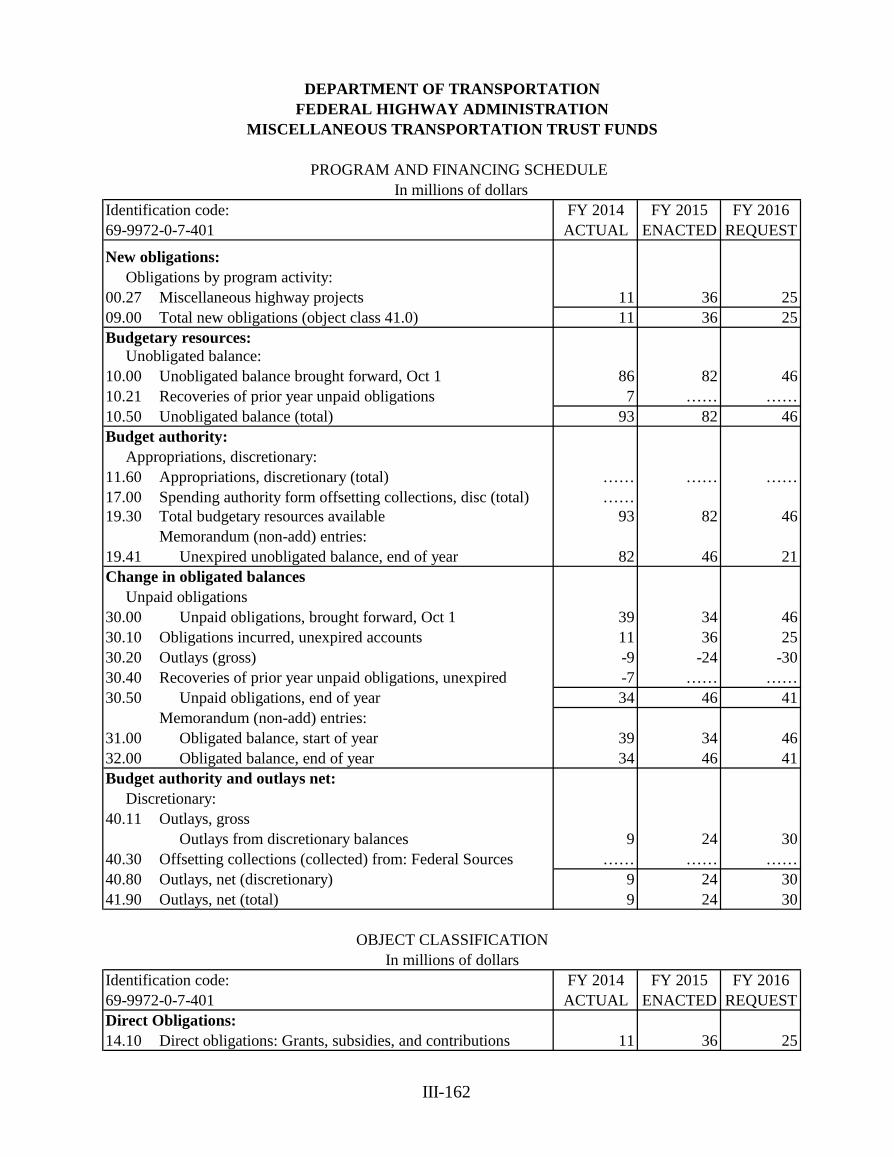
III-162
DEPARTMENT OF TRANSPORTATIONFEDERAL HIGHWAY ADMINISTRATION
PROGRAM AND FINANCING SCHEDULE In millions of dollars
Identification code: FY 2014 FY 2015 FY 201669-9972-0-7-401 ACTUAL ENACTED REQUEST
New obligations: Obligations by program activity:00.27 Miscellaneous highway projects 11 36 2509.00 Total new obligations (object class 41.0) 11 36 25Budgetary resources: Unobligated balance:10.00 Unobligated balance brought forward, Oct 1 86 82 4610.21 Recoveries of prior year unpaid obligations 7 …… ……10.50 Unobligated balance (total) 93 82 46Budget authority: Appropriations, discretionary:11.60 Appropriations, discretionary (total) …… …… ……17.00 Spending authority form offsetting collections, disc (total) ……19.30 Total budgetary resources available 93 82 46
Memorandum (non-add) entries:19.41 Unexpired unobligated balance, end of year 82 46 21Change in obligated balances Unpaid obligations30.00 Unpaid obligations, brought forward, Oct 1 39 34 4630.10 Obligations incurred, unexpired accounts 11 36 2530.20 Outlays (gross) -9 -24 -3030.40 Recoveries of prior year unpaid obligations, unexpired -7 …… ……30.50 Unpaid obligations, end of year 34 46 41
Memorandum (non-add) entries:31.00 Obligated balance, start of year 39 34 4632.00 Obligated balance, end of year 34 46 41Budget authority and outlays net: Discretionary:40.11 Outlays, gross
Outlays from discretionary balances 9 24 3040.30 Offsetting collections (collected) from: Federal Sources …… …… ……40.80 Outlays, net (discretionary) 9 24 3041.90 Outlays, net (total) 9 24 30
OBJECT CLASSIFICATIONIn millions of dollars
Identification code: FY 2014 FY 2015 FY 201669-9972-0-7-401 ACTUAL ENACTED REQUESTDirect Obligations:14.10 Direct obligations: Grants, subsidies, and contributions 11 36 25
MISCELLANEOUS TRANSPORTATION TRUST FUNDS
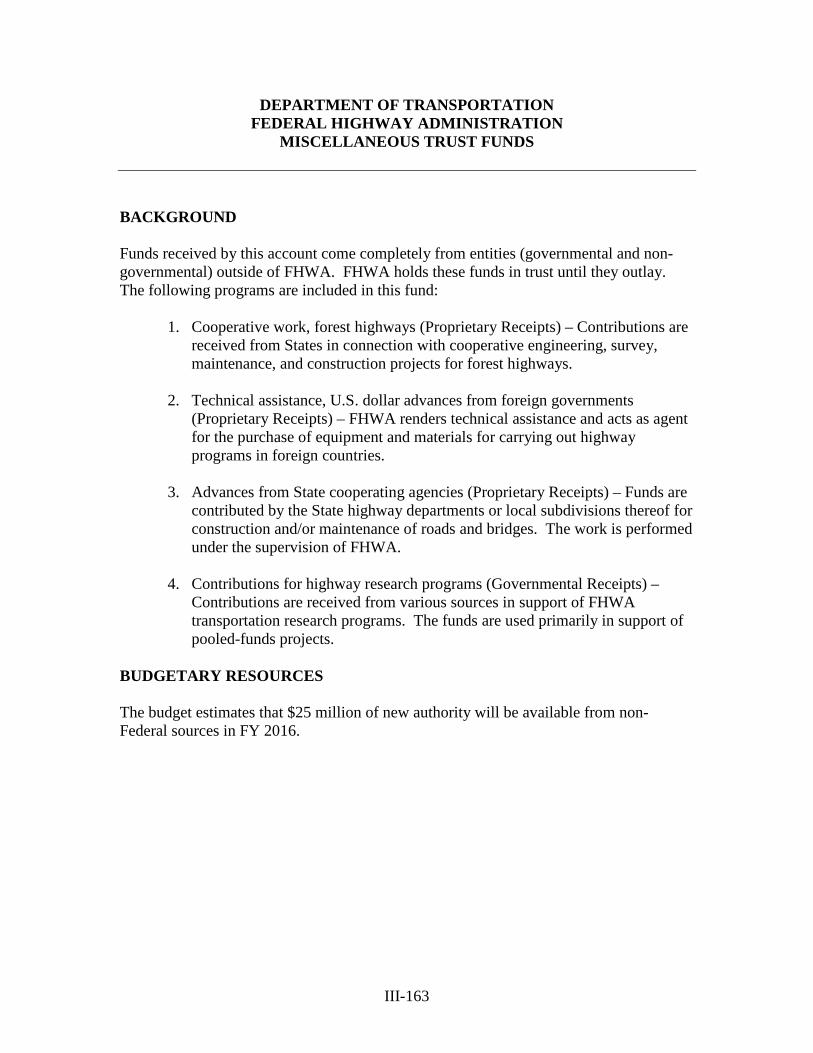
III-163
DEPARTMENT OF TRANSPORTATION FEDERAL HIGHWAY ADMINISTRATION
MISCELLANEOUS TRUST FUNDS
BACKGROUND Funds received by this account come completely from entities (governmental and non-governmental) outside of FHWA. FHWA holds these funds in trust until they outlay. The following programs are included in this fund:
1. Cooperative work, forest highways (Proprietary Receipts) – Contributions are received from States in connection with cooperative engineering, survey, maintenance, and construction projects for forest highways.
2. Technical assistance, U.S. dollar advances from foreign governments
(Proprietary Receipts) – FHWA renders technical assistance and acts as agent for the purchase of equipment and materials for carrying out highway programs in foreign countries.
3. Advances from State cooperating agencies (Proprietary Receipts) – Funds are
contributed by the State highway departments or local subdivisions thereof for construction and/or maintenance of roads and bridges. The work is performed under the supervision of FHWA.
4. Contributions for highway research programs (Governmental Receipts) –
Contributions are received from various sources in support of FHWA transportation research programs. The funds are used primarily in support of pooled-funds projects.
BUDGETARY RESOURCES
The budget estimates that $25 million of new authority will be available from non-Federal sources in FY 2016.
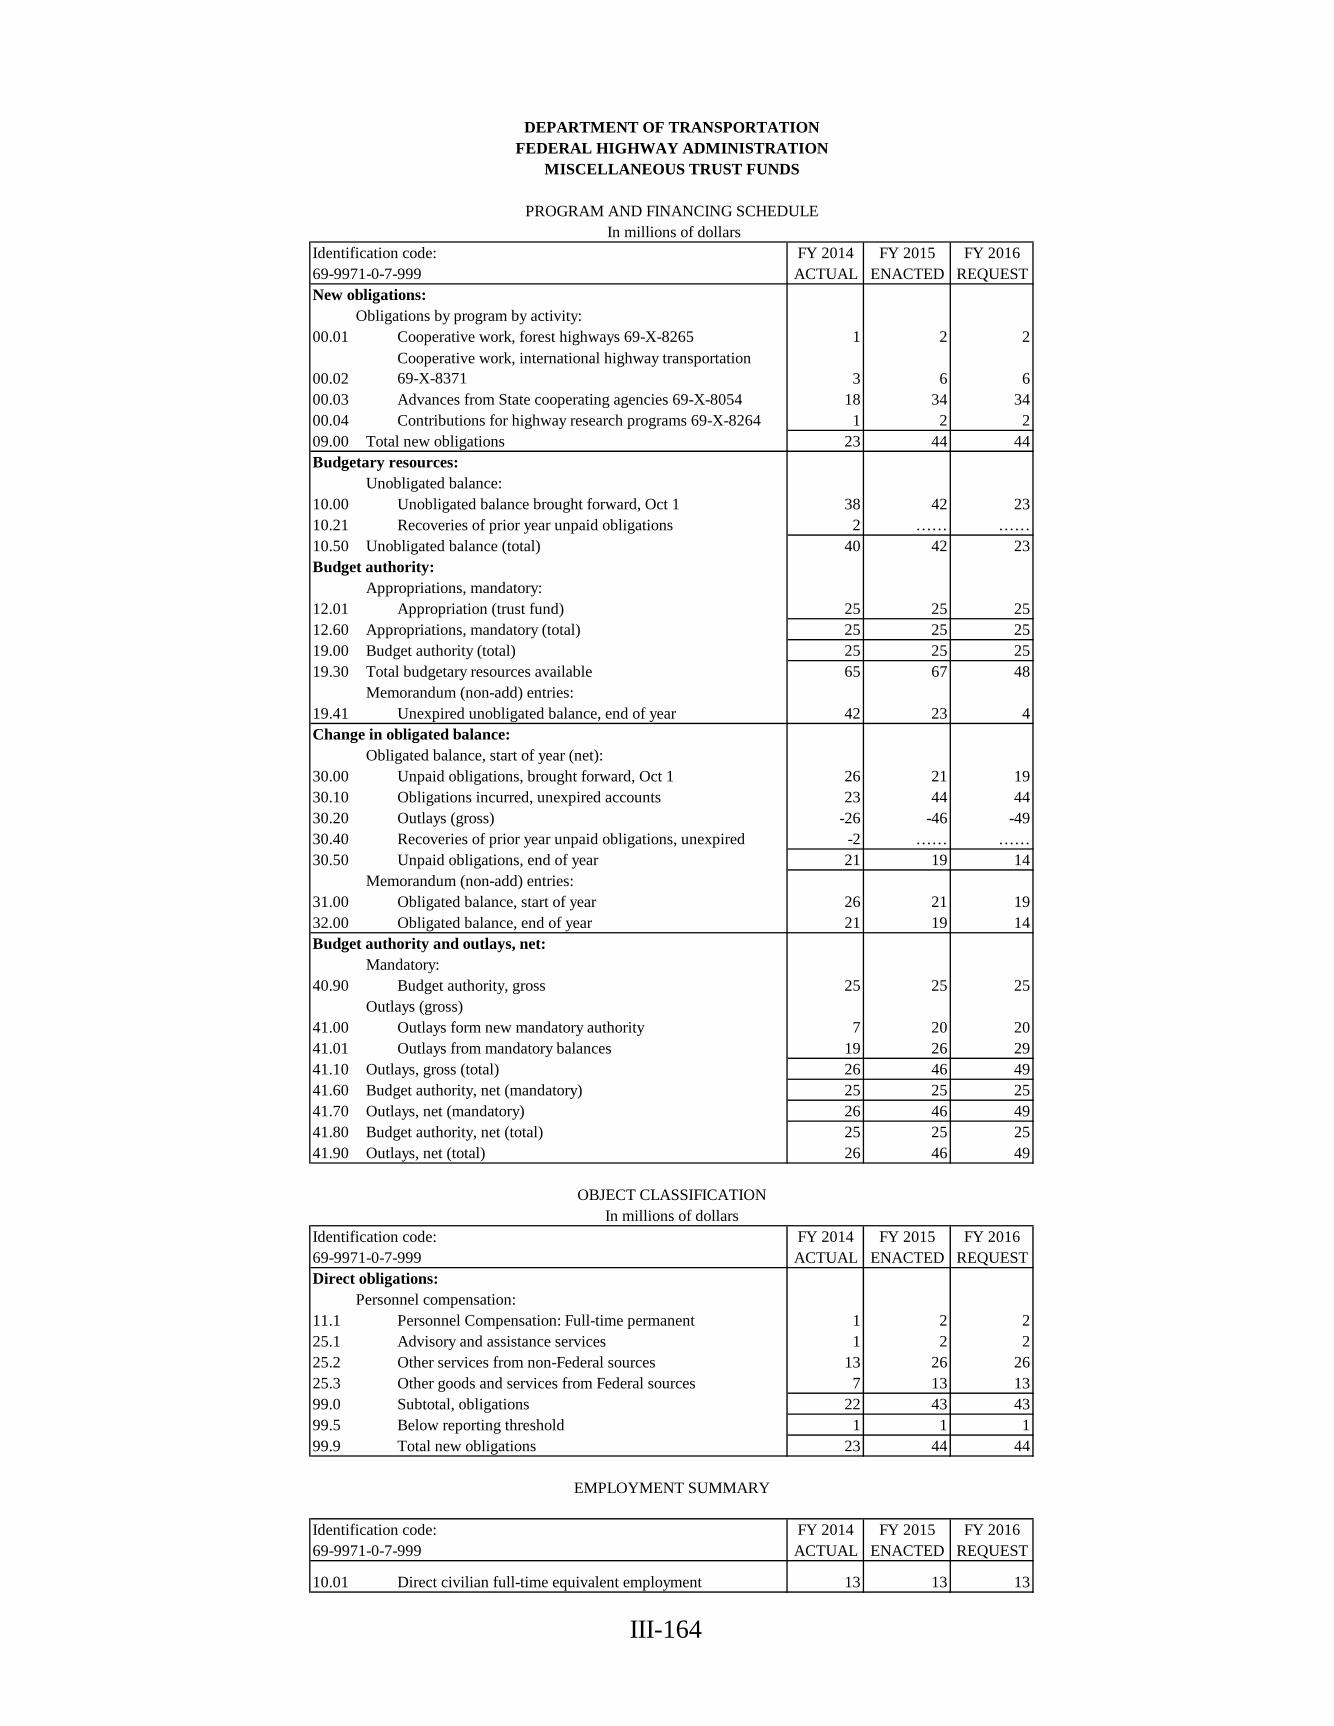
III-164
DEPARTMENT OF TRANSPORTATIONFEDERAL HIGHWAY ADMINISTRATION
MISCELLANEOUS TRUST FUNDS
PROGRAM AND FINANCING SCHEDULE In millions of dollars
Identification code: FY 2014 FY 2015 FY 201669-9971-0-7-999 ACTUAL ENACTED REQUESTNew obligations: Obligations by program by activity:00.01 Cooperative work, forest highways 69-X-8265 1 2 2
00.02Cooperative work, international highway transportation 69-X-8371 3 6 6
00.03 Advances from State cooperating agencies 69-X-8054 18 34 3400.04 Contributions for highway research programs 69-X-8264 1 2 209.00 Total new obligations 23 44 44Budgetary resources:
Unobligated balance:10.00 Unobligated balance brought forward, Oct 1 38 42 2310.21 Recoveries of prior year unpaid obligations 2 …… ……10.50 Unobligated balance (total) 40 42 23Budget authority:
Appropriations, mandatory:12.01 Appropriation (trust fund) 25 25 2512.60 Appropriations, mandatory (total) 25 25 2519.00 Budget authority (total) 25 25 2519.30 Total budgetary resources available 65 67 48
Memorandum (non-add) entries:19.41 Unexpired unobligated balance, end of year 42 23 4Change in obligated balance:
Obligated balance, start of year (net):30.00 Unpaid obligations, brought forward, Oct 1 26 21 1930.10 Obligations incurred, unexpired accounts 23 44 4430.20 Outlays (gross) -26 -46 -4930.40 Recoveries of prior year unpaid obligations, unexpired -2 …… ……30.50 Unpaid obligations, end of year 21 19 14
Memorandum (non-add) entries:31.00 Obligated balance, start of year 26 21 1932.00 Obligated balance, end of year 21 19 14Budget authority and outlays, net:
Mandatory:40.90 Budget authority, gross 25 25 25
Outlays (gross)41.00 Outlays form new mandatory authority 7 20 2041.01 Outlays from mandatory balances 19 26 2941.10 Outlays, gross (total) 26 46 4941.60 Budget authority, net (mandatory) 25 25 2541.70 Outlays, net (mandatory) 26 46 4941.80 Budget authority, net (total) 25 25 2541.90 Outlays, net (total) 26 46 49
OBJECT CLASSIFICATIONIn millions of dollars
Identification code: FY 2014 FY 2015 FY 201669-9971-0-7-999 ACTUAL ENACTED REQUESTDirect obligations: Personnel compensation:11.1 Personnel Compensation: Full-time permanent 1 2 225.1 Advisory and assistance services 1 2 225.2 Other services from non-Federal sources 13 26 2625.3 Other goods and services from Federal sources 7 13 1399.0 Subtotal, obligations 22 43 4399.5 Below reporting threshold 1 1 199.9 Total new obligations 23 44 44
EMPLOYMENT SUMMARY
Identification code: FY 2014 FY 2015 FY 201669-9971-0-7-999 ACTUAL ENACTED REQUEST
10.01 Direct civilian full-time equivalent employment 13 13 13
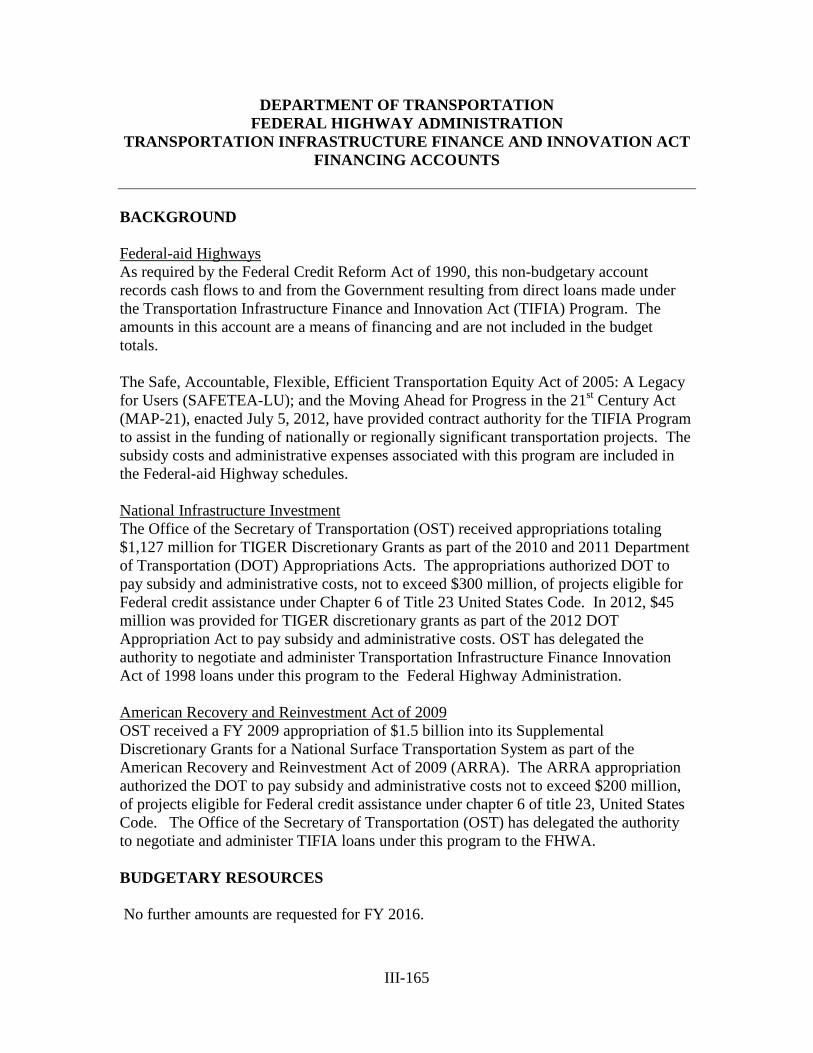
III-165
DEPARTMENT OF TRANSPORTATION FEDERAL HIGHWAY ADMINISTRATION
TRANSPORTATION INFRASTRUCTURE FINANCE AND INNOVATION ACT FINANCING ACCOUNTS
BACKGROUND Federal-aid Highways As required by the Federal Credit Reform Act of 1990, this non-budgetary account records cash flows to and from the Government resulting from direct loans made under the Transportation Infrastructure Finance and Innovation Act (TIFIA) Program. The amounts in this account are a means of financing and are not included in the budget totals. The Safe, Accountable, Flexible, Efficient Transportation Equity Act of 2005: A Legacy for Users (SAFETEA-LU); and the Moving Ahead for Progress in the 21st Century Act (MAP-21), enacted July 5, 2012, have provided contract authority for the TIFIA Program to assist in the funding of nationally or regionally significant transportation projects. The subsidy costs and administrative expenses associated with this program are included in the Federal-aid Highway schedules. National Infrastructure Investment The Office of the Secretary of Transportation (OST) received appropriations totaling $1,127 million for TIGER Discretionary Grants as part of the 2010 and 2011 Department of Transportation (DOT) Appropriations Acts. The appropriations authorized DOT to pay subsidy and administrative costs, not to exceed $300 million, of projects eligible for Federal credit assistance under Chapter 6 of Title 23 United States Code. In 2012, $45 million was provided for TIGER discretionary grants as part of the 2012 DOT Appropriation Act to pay subsidy and administrative costs. OST has delegated the authority to negotiate and administer Transportation Infrastructure Finance Innovation Act of 1998 loans under this program to the Federal Highway Administration. American Recovery and Reinvestment Act of 2009 OST received a FY 2009 appropriation of $1.5 billion into its Supplemental Discretionary Grants for a National Surface Transportation System as part of the American Recovery and Reinvestment Act of 2009 (ARRA). The ARRA appropriation authorized the DOT to pay subsidy and administrative costs not to exceed $200 million, of projects eligible for Federal credit assistance under chapter 6 of title 23, United States Code. The Office of the Secretary of Transportation (OST) has delegated the authority to negotiate and administer TIFIA loans under this program to the FHWA. BUDGETARY RESOURCES No further amounts are requested for FY 2016.
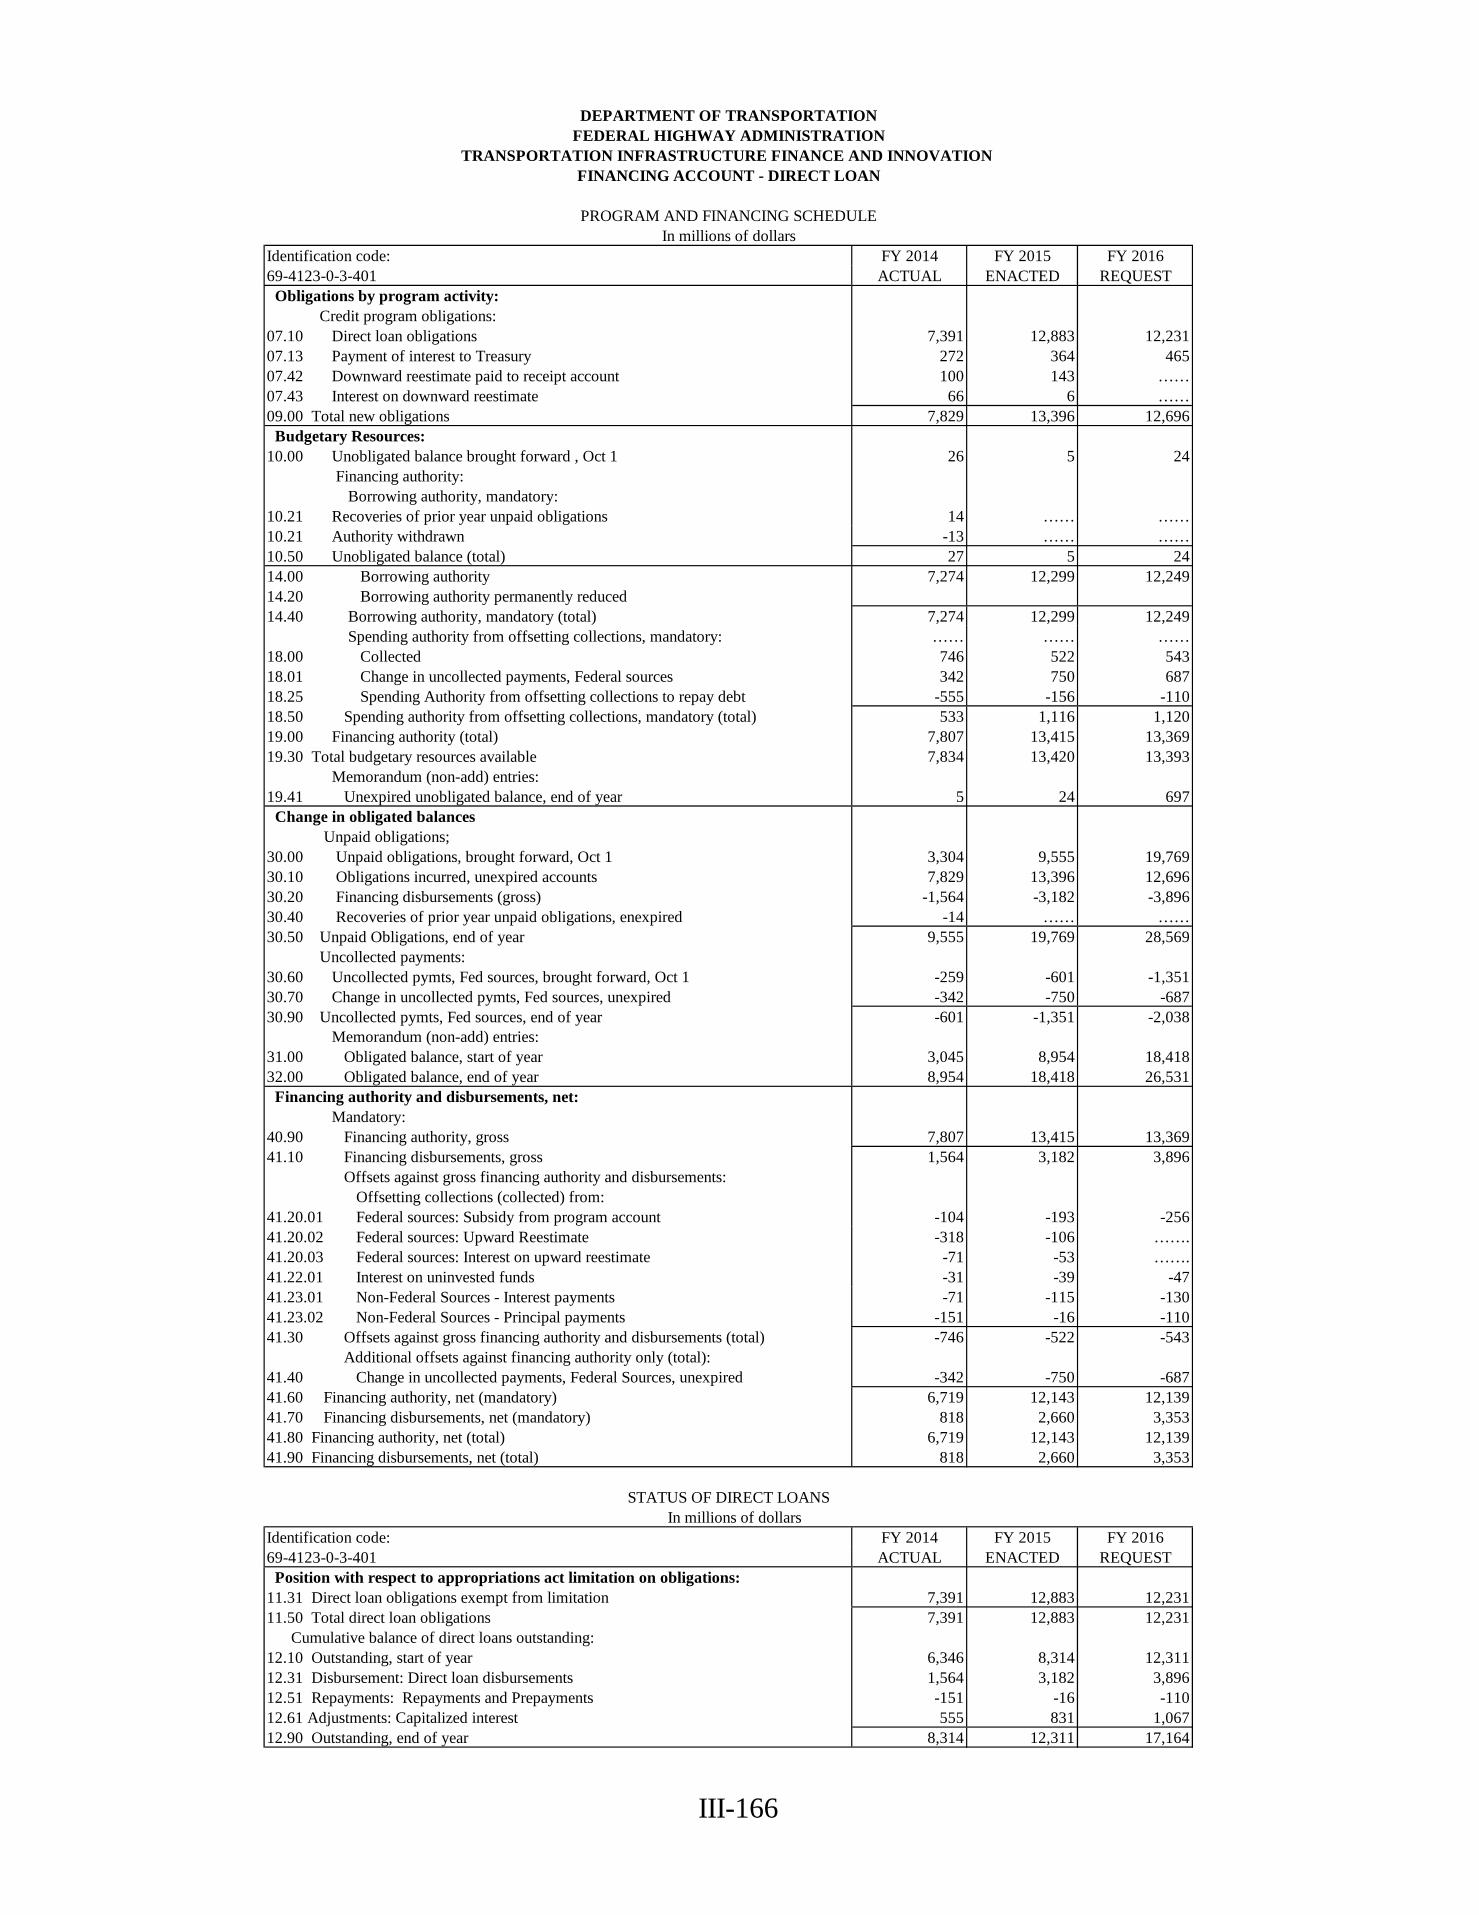
III-166
DEPARTMENT OF TRANSPORTATIONFEDERAL HIGHWAY ADMINISTRATION
TRANSPORTATION INFRASTRUCTURE FINANCE AND INNOVATION FINANCING ACCOUNT - DIRECT LOAN
PROGRAM AND FINANCING SCHEDULEIn millions of dollars
Identification code: FY 2014 FY 2015 FY 201669-4123-0-3-401 ACTUAL ENACTED REQUEST Obligations by program activity: Credit program obligations:07.10 Direct loan obligations 7,391 12,883 12,23107.13 Payment of interest to Treasury 272 364 46507.42 Downward reestimate paid to receipt account 100 143 ……07.43 Interest on downward reestimate 66 6 ……09.00 Total new obligations 7,829 13,396 12,696 Budgetary Resources:10.00 Unobligated balance brought forward , Oct 1 26 5 24 Financing authority: Borrowing authority, mandatory:10.21 Recoveries of prior year unpaid obligations 14 …… ……10.21 Authority withdrawn -13 …… ……10.50 Unobligated balance (total) 27 5 2414.00 Borrowing authority 7,274 12,299 12,24914.20 Borrowing authority permanently reduced 14.40 Borrowing authority, mandatory (total) 7,274 12,299 12,249 Spending authority from offsetting collections, mandatory: …… …… ……18.00 Collected 746 522 54318.01 Change in uncollected payments, Federal sources 342 750 68718.25 Spending Authority from offsetting collections to repay debt -555 -156 -11018.50 Spending authority from offsetting collections, mandatory (total) 533 1,116 1,12019.00 Financing authority (total) 7,807 13,415 13,36919.30 Total budgetary resources available 7,834 13,420 13,393 Memorandum (non-add) entries:19.41 Unexpired unobligated balance, end of year 5 24 697 Change in obligated balances Unpaid obligations; 30.00 Unpaid obligations, brought forward, Oct 1 3,304 9,555 19,76930.10 Obligations incurred, unexpired accounts 7,829 13,396 12,69630.20 Financing disbursements (gross) -1,564 -3,182 -3,89630.40 Recoveries of prior year unpaid obligations, enexpired -14 …… ……30.50 Unpaid Obligations, end of year 9,555 19,769 28,569 Uncollected payments:30.60 Uncollected pymts, Fed sources, brought forward, Oct 1 -259 -601 -1,35130.70 Change in uncollected pymts, Fed sources, unexpired -342 -750 -68730.90 Uncollected pymts, Fed sources, end of year -601 -1,351 -2,038 Memorandum (non-add) entries:31.00 Obligated balance, start of year 3,045 8,954 18,41832.00 Obligated balance, end of year 8,954 18,418 26,531 Financing authority and disbursements, net: Mandatory:40.90 Financing authority, gross 7,807 13,415 13,36941.10 Financing disbursements, gross 1,564 3,182 3,896 Offsets against gross financing authority and disbursements: Offsetting collections (collected) from:41.20.01 Federal sources: Subsidy from program account -104 -193 -25641.20.02 Federal sources: Upward Reestimate -318 -106 …….
-71 -53 …….41.22.01 Interest on uninvested funds -31 -39 -4741.23.01 Non-Federal Sources - Interest payments -71 -115 -13041.23.02 Non-Federal Sources - Principal payments -151 -16 -11041.30 Offsets against gross financing authority and disbursements (total) -746 -522 -543 Additional offsets against financing authority only (total):41.40 Change in uncollected payments, Federal Sources, unexpired -342 -750 -68741.60 Financing authority, net (mandatory) 6,719 12,143 12,13941.70 Financing disbursements, net (mandatory) 818 2,660 3,35341.80 Financing authority, net (total) 6,719 12,143 12,13941.90 Financing disbursements, net (total) 818 2,660 3,353
STATUS OF DIRECT LOANSIn millions of dollars
Identification code: FY 2014 FY 2015 FY 201669-4123-0-3-401 ACTUAL ENACTED REQUEST Position with respect to appropriations act limitation on obligations:11.31 Direct loan obligations exempt from limitation 7,391 12,883 12,23111.50 Total direct loan obligations 7,391 12,883 12,231 Cumulative balance of direct loans outstanding:12.10 Outstanding, start of year 6,346 8,314 12,31112.31 Disbursement: Direct loan disbursements 1,564 3,182 3,89612.51 Repayments: Repayments and Prepayments -151 -16 -11012.61 Adjustments: Capitalized interest 555 831 1,06712.90 Outstanding, end of year 8,314 12,311 17,164
41.20.03 Federal sources: Interest on upward reestimate
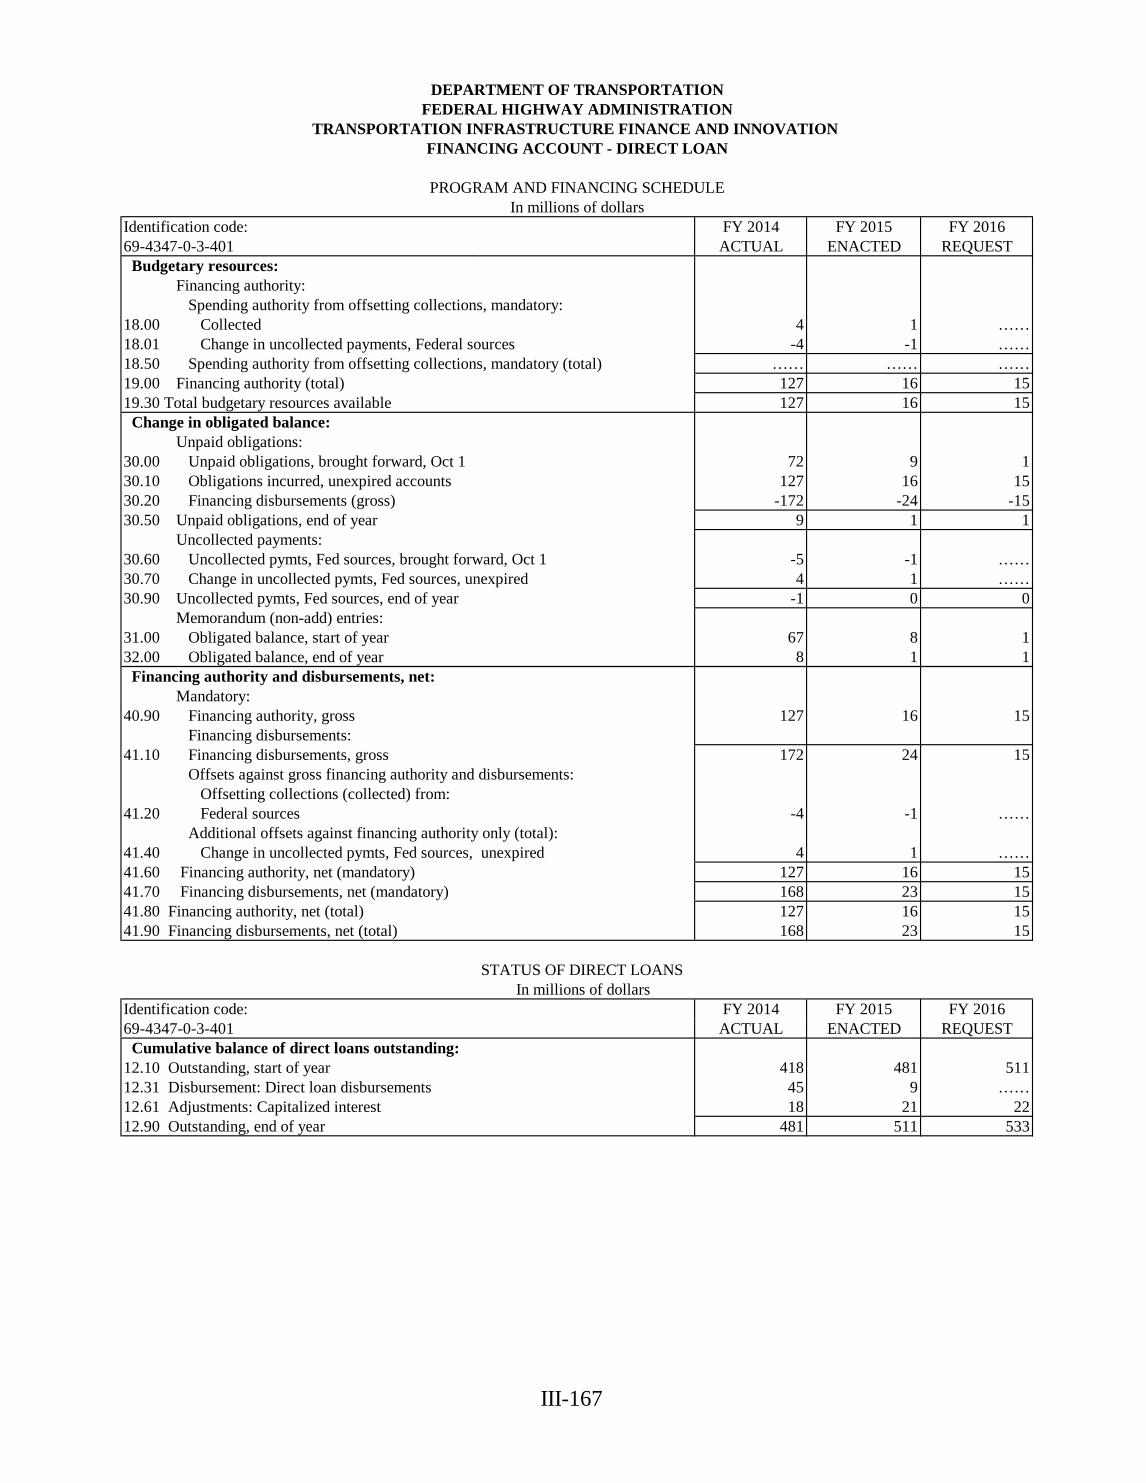
III-167
DEPARTMENT OF TRANSPORTATIONFEDERAL HIGHWAY ADMINISTRATION
TRANSPORTATION INFRASTRUCTURE FINANCE AND INNOVATION FINANCING ACCOUNT - DIRECT LOAN
PROGRAM AND FINANCING SCHEDULEIn millions of dollars
Identification code: FY 2014 FY 2015 FY 201669-4347-0-3-401 ACTUAL ENACTED REQUEST Budgetary resources: Financing authority: Spending authority from offsetting collections, mandatory:18.00 Collected 4 1 ……18.01 Change in uncollected payments, Federal sources -4 -1 ……18.50 Spending authority from offsetting collections, mandatory (total) …… …… ……19.00 Financing authority (total) 127 16 1519.30 Total budgetary resources available 127 16 15 Change in obligated balance: Unpaid obligations: 30.00 Unpaid obligations, brought forward, Oct 1 72 9 130.10 Obligations incurred, unexpired accounts 127 16 1530.20 Financing disbursements (gross) -172 -24 -1530.50 Unpaid obligations, end of year 9 1 1 Uncollected payments:30.60 Uncollected pymts, Fed sources, brought forward, Oct 1 -5 -1 ……30.70 Change in uncollected pymts, Fed sources, unexpired 4 1 ……30.90 Uncollected pymts, Fed sources, end of year -1 0 0 Memorandum (non-add) entries:31.00 Obligated balance, start of year 67 8 132.00 Obligated balance, end of year 8 1 1 Financing authority and disbursements, net: Mandatory:40.90 Financing authority, gross 127 16 15 Financing disbursements:41.10 Financing disbursements, gross 172 24 15 Offsets against gross financing authority and disbursements: Offsetting collections (collected) from:41.20 Federal sources -4 -1 …… Additional offsets against financing authority only (total):41.40 Change in uncollected pymts, Fed sources, unexpired 4 1 ……41.60 Financing authority, net (mandatory) 127 16 1541.70 Financing disbursements, net (mandatory) 168 23 1541.80 Financing authority, net (total) 127 16 1541.90 Financing disbursements, net (total) 168 23 15
STATUS OF DIRECT LOANSIn millions of dollars
Identification code: FY 2014 FY 2015 FY 201669-4347-0-3-401 ACTUAL ENACTED REQUEST Cumulative balance of direct loans outstanding:12.10 Outstanding, start of year 418 481 51112.31 Disbursement: Direct loan disbursements 45 9 ……12.61 Adjustments: Capitalized interest 18 21 2212.90 Outstanding, end of year 481 511 533
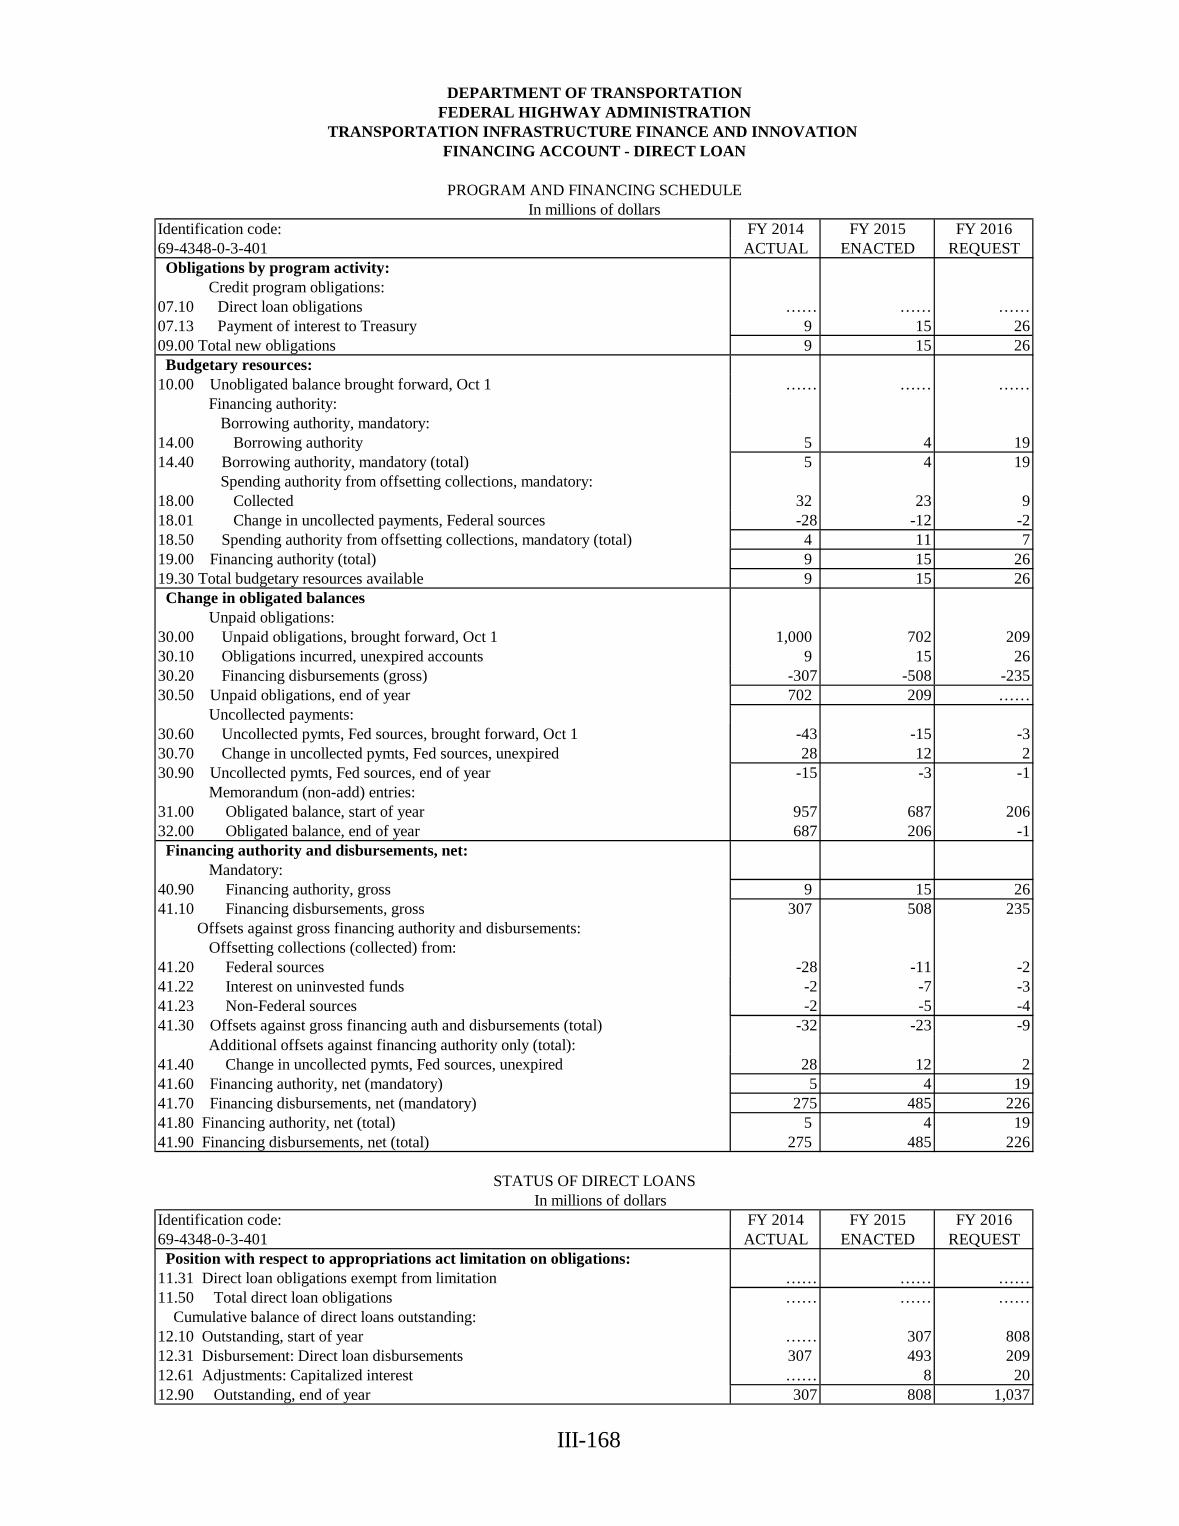
III-168
DEPARTMENT OF TRANSPORTATIONFEDERAL HIGHWAY ADMINISTRATION
TRANSPORTATION INFRASTRUCTURE FINANCE AND INNOVATION FINANCING ACCOUNT - DIRECT LOAN
PROGRAM AND FINANCING SCHEDULEIn millions of dollars
Identification code: FY 2014 FY 2015 FY 201669-4348-0-3-401 ACTUAL ENACTED REQUEST Obligations by program activity: Credit program obligations:07.10 Direct loan obligations …… …… ……07.13 Payment of interest to Treasury 9 15 2609.00 Total new obligations 9 15 26 Budgetary resources:10.00 Unobligated balance brought forward, Oct 1 …… …… …… Financing authority: Borrowing authority, mandatory:14.00 Borrowing authority 5 4 1914.40 Borrowing authority, mandatory (total) 5 4 19 Spending authority from offsetting collections, mandatory:18.00 Collected 32 23 918.01 Change in uncollected payments, Federal sources -28 -12 -218.50 Spending authority from offsetting collections, mandatory (total) 4 11 719.00 Financing authority (total) 9 15 2619.30 Total budgetary resources available 9 15 26 Change in obligated balances Unpaid obligations: 30.00 Unpaid obligations, brought forward, Oct 1 1,000 702 20930.10 Obligations incurred, unexpired accounts 9 15 2630.20 Financing disbursements (gross) -307 -508 -23530.50 Unpaid obligations, end of year 702 209 …… Uncollected payments:30.60 Uncollected pymts, Fed sources, brought forward, Oct 1 -43 -15 -330.70 Change in uncollected pymts, Fed sources, unexpired 28 12 230.90 Uncollected pymts, Fed sources, end of year -15 -3 -1 Memorandum (non-add) entries:31.00 Obligated balance, start of year 957 687 20632.00 Obligated balance, end of year 687 206 -1 Financing authority and disbursements, net: Mandatory:40.90 Financing authority, gross 9 15 2641.10 Financing disbursements, gross 307 508 235 Offsets against gross financing authority and disbursements: Offsetting collections (collected) from:41.20 Federal sources -28 -11 -241.22 Interest on uninvested funds -2 -7 -341.23 Non-Federal sources -2 -5 -441.30 Offsets against gross financing auth and disbursements (total) -32 -23 -9 Additional offsets against financing authority only (total):41.40 Change in uncollected pymts, Fed sources, unexpired 28 12 241.60 Financing authority, net (mandatory) 5 4 1941.70 Financing disbursements, net (mandatory) 275 485 22641.80 Financing authority, net (total) 5 4 1941.90 Financing disbursements, net (total) 275 485 226
STATUS OF DIRECT LOANSIn millions of dollars
Identification code: FY 2014 FY 2015 FY 201669-4348-0-3-401 ACTUAL ENACTED REQUEST Position with respect to appropriations act limitation on obligations:11.31 Direct loan obligations exempt from limitation …… …… ……11.50 Total direct loan obligations …… …… …… Cumulative balance of direct loans outstanding:12.10 Outstanding, start of year …… 307 80812.31 Disbursement: Direct loan disbursements 307 493 20912.61 Adjustments: Capitalized interest …… 8 2012.90 Outstanding, end of year 307 808 1,037
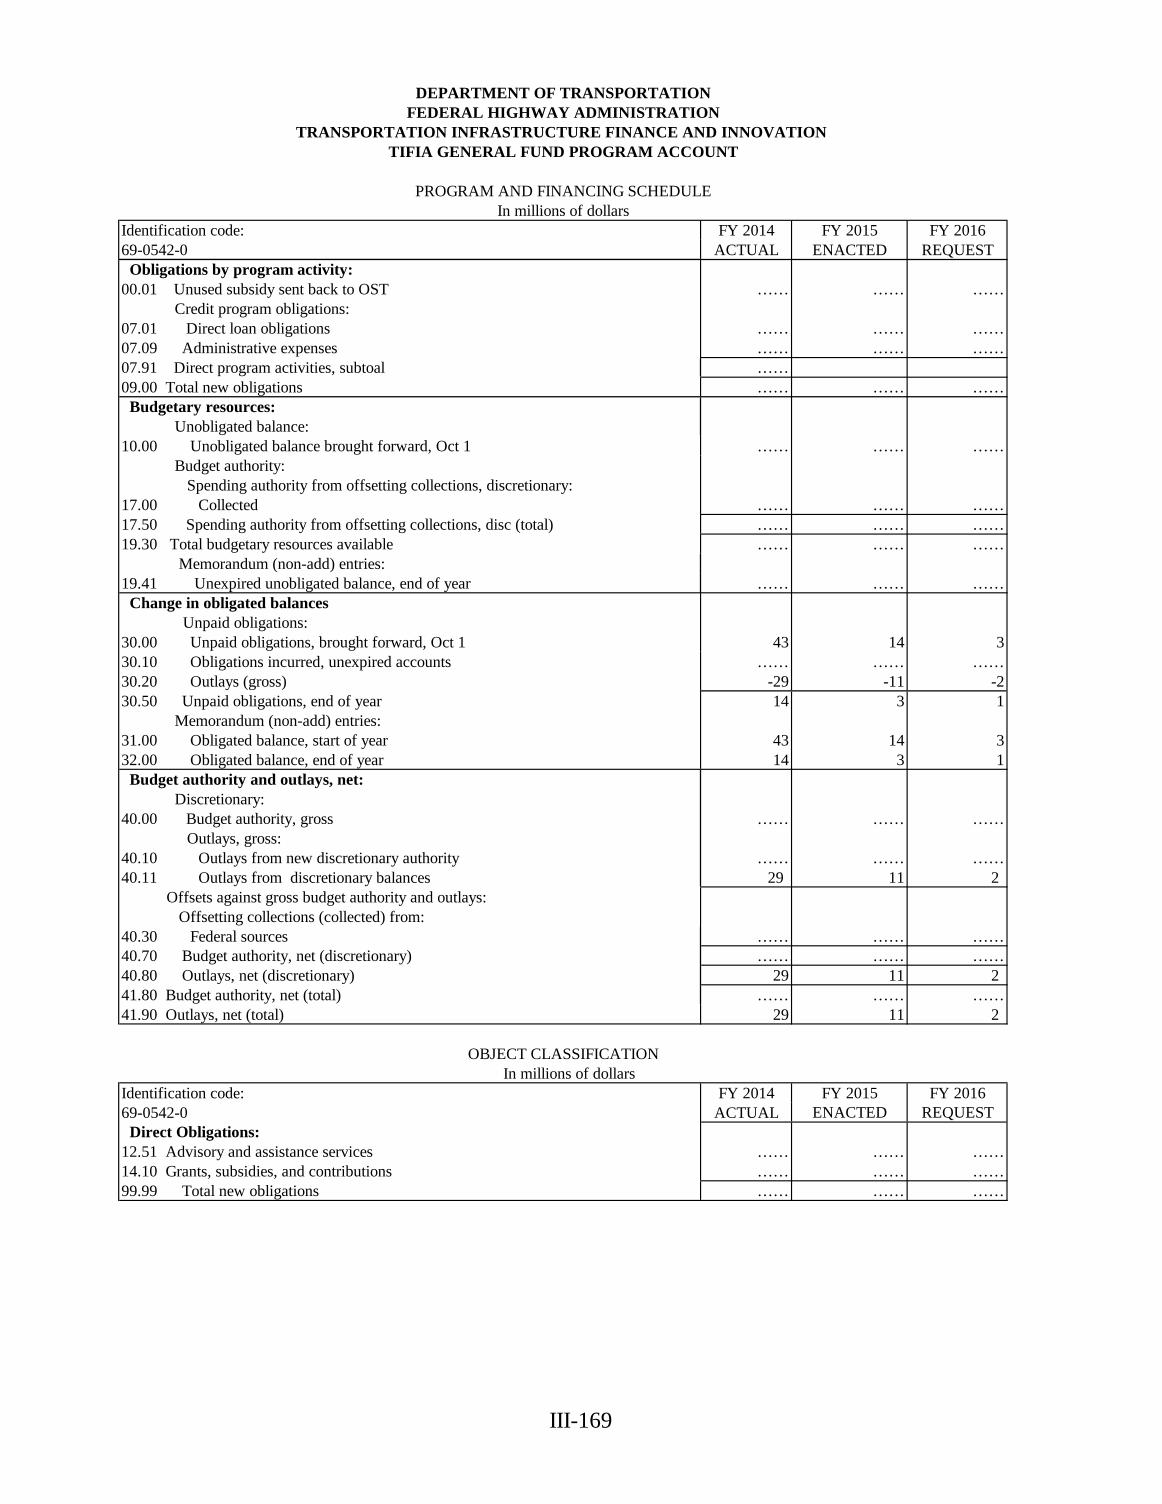
III-169
DEPARTMENT OF TRANSPORTATIONFEDERAL HIGHWAY ADMINISTRATION
TRANSPORTATION INFRASTRUCTURE FINANCE AND INNOVATION TIFIA GENERAL FUND PROGRAM ACCOUNT
PROGRAM AND FINANCING SCHEDULEIn millions of dollars
Identification code: FY 2014 FY 2015 FY 201669-0542-0 ACTUAL ENACTED REQUEST Obligations by program activity:00.01 Unused subsidy sent back to OST …… …… …… Credit program obligations:07.01 Direct loan obligations …… …… ……07.09 Administrative expenses …… …… ……07.91 Direct program activities, subtoal ……09.00 Total new obligations …… …… …… Budgetary resources: Unobligated balance:10.00 Unobligated balance brought forward, Oct 1 …… …… …… Budget authority: Spending authority from offsetting collections, discretionary:17.00 Collected …… …… ……17.50 Spending authority from offsetting collections, disc (total) …… …… ……19.30 Total budgetary resources available …… …… …… Memorandum (non-add) entries:19.41 Unexpired unobligated balance, end of year …… …… …… Change in obligated balances Unpaid obligations: 30.00 Unpaid obligations, brought forward, Oct 1 43 14 330.10 Obligations incurred, unexpired accounts …… …… ……30.20 Outlays (gross) -29 -11 -230.50 Unpaid obligations, end of year 14 3 1 Memorandum (non-add) entries:31.00 Obligated balance, start of year 43 14 332.00 Obligated balance, end of year 14 3 1 Budget authority and outlays, net: Discretionary:40.00 Budget authority, gross …… …… …… Outlays, gross:40.10 Outlays from new discretionary authority …… …… ……40.11 Outlays from discretionary balances 29 11 2 Offsets against gross budget authority and outlays: Offsetting collections (collected) from:40.30 Federal sources …… …… ……40.70 Budget authority, net (discretionary) …… …… ……40.80 Outlays, net (discretionary) 29 11 241.80 Budget authority, net (total) …… …… ……41.90 Outlays, net (total) 29 11 2
OBJECT CLASSIFICATIONIn millions of dollars
Identification code: FY 2014 FY 2015 FY 201669-0542-0 ACTUAL ENACTED REQUEST Direct Obligations:12.51 Advisory and assistance services …… …… ……14.10 Grants, subsidies, and contributions …… …… ……99.99 Total new obligations …… …… ……

III-170
This Page Left Blank Intentionally
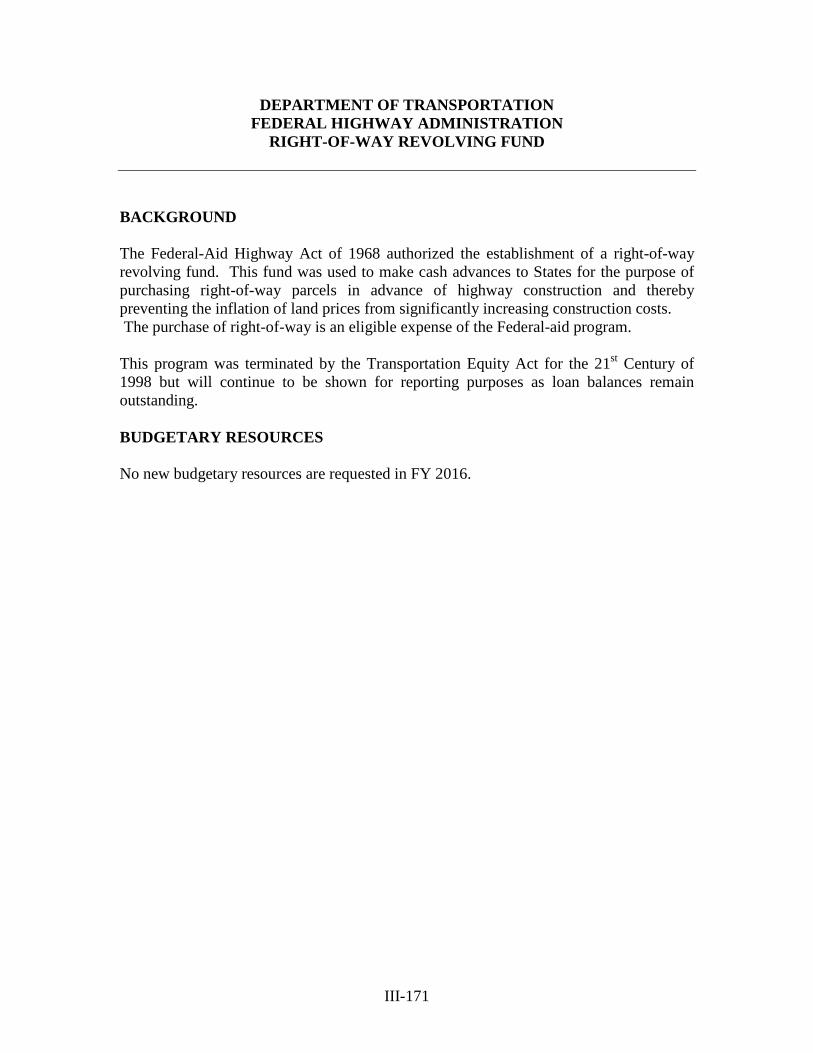
III-171
DEPARTMENT OF TRANSPORTATION FEDERAL HIGHWAY ADMINISTRATION
RIGHT-OF-WAY REVOLVING FUND
BACKGROUND The Federal-Aid Highway Act of 1968 authorized the establishment of a right-of-way revolving fund. This fund was used to make cash advances to States for the purpose of purchasing right-of-way parcels in advance of highway construction and thereby preventing the inflation of land prices from significantly increasing construction costs. The purchase of right-of-way is an eligible expense of the Federal-aid program. This program was terminated by the Transportation Equity Act for the 21st Century of 1998 but will continue to be shown for reporting purposes as loan balances remain outstanding. BUDGETARY RESOURCES No new budgetary resources are requested in FY 2016.
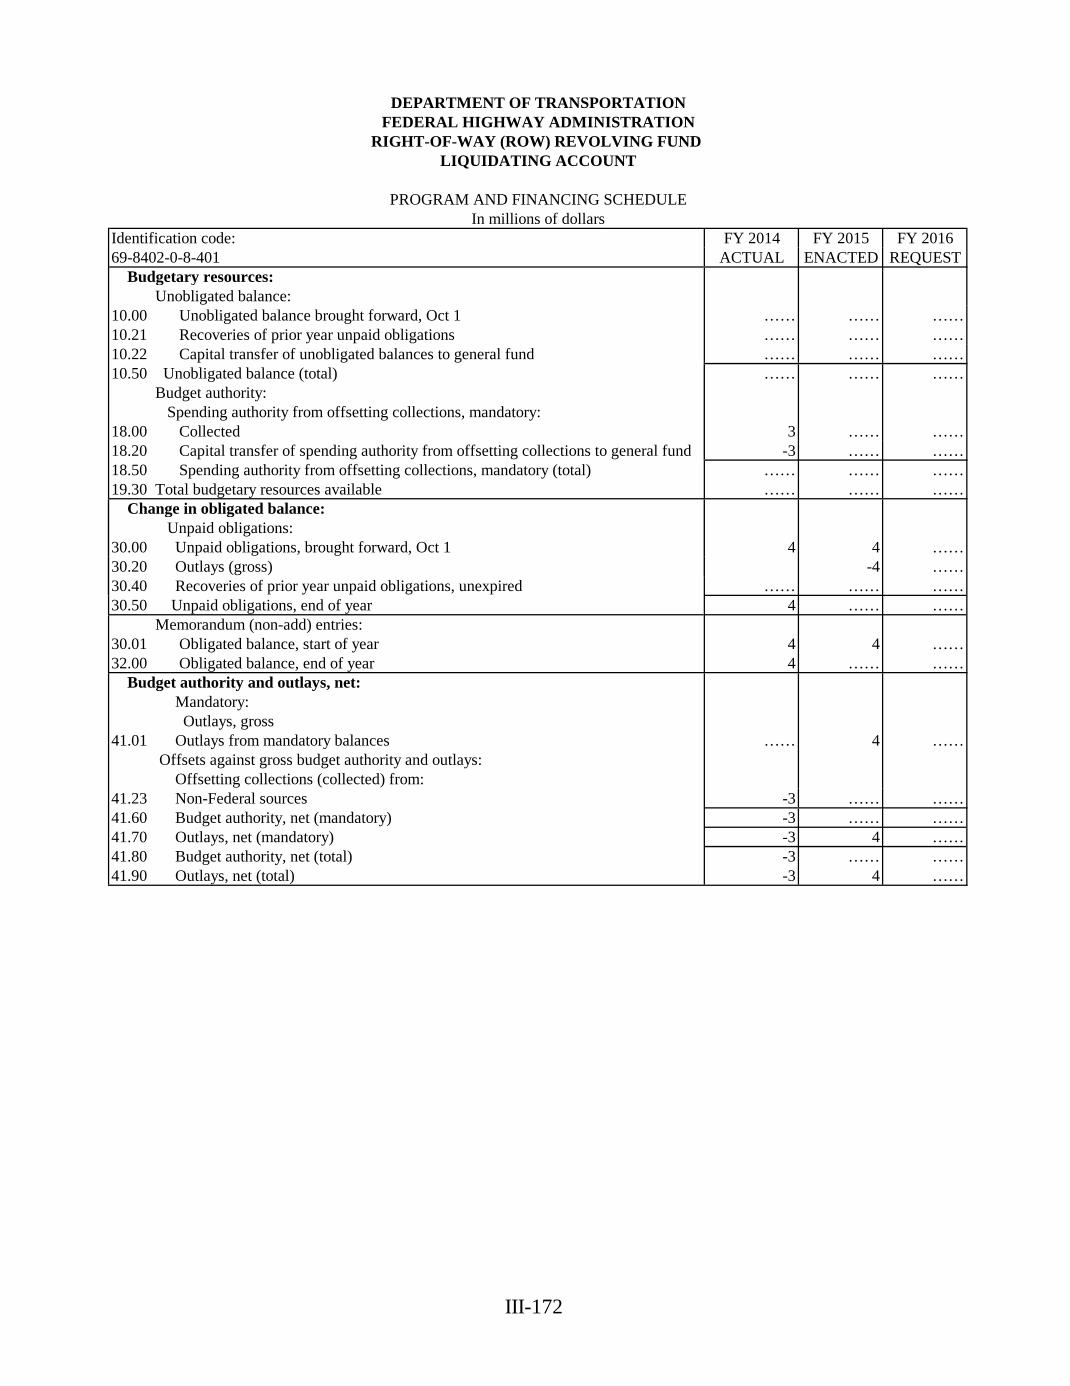
III-172
DEPARTMENT OF TRANSPORTATIONFEDERAL HIGHWAY ADMINISTRATION
RIGHT-OF-WAY (ROW) REVOLVING FUND LIQUIDATING ACCOUNT
PROGRAM AND FINANCING SCHEDULEIn millions of dollars
Identification code: FY 2014 FY 2015 FY 201669-8402-0-8-401 ACTUAL ENACTED REQUEST Budgetary resources: Unobligated balance:10.00 Unobligated balance brought forward, Oct 1 …… …… ……10.21 Recoveries of prior year unpaid obligations …… …… ……10.22 Capital transfer of unobligated balances to general fund …… …… ……10.50 Unobligated balance (total) …… …… …… Budget authority: Spending authority from offsetting collections, mandatory:18.00 Collected 3 …… ……18.20 Capital transfer of spending authority from offsetting collections to general fund -3 …… ……18.50 Spending authority from offsetting collections, mandatory (total) …… …… ……19.30 Total budgetary resources available …… …… …… Change in obligated balance: Unpaid obligations:30.00 Unpaid obligations, brought forward, Oct 1 4 4 ……30.20 Outlays (gross) -4 ……30.40 Recoveries of prior year unpaid obligations, unexpired …… …… ……30.50 Unpaid obligations, end of year 4 …… …… Memorandum (non-add) entries:30.01 Obligated balance, start of year 4 4 ……32.00 Obligated balance, end of year 4 …… …… Budget authority and outlays, net: Mandatory: Outlays, gross41.01 Outlays from mandatory balances …… 4 ……
Offsets against gross budget authority and outlays: Offsetting collections (collected) from:41.23 Non-Federal sources -3 …… ……41.60 Budget authority, net (mandatory) -3 …… ……41.70 Outlays, net (mandatory) -3 4 ……41.80 Budget authority, net (total) -3 …… ……41.90 Outlays, net (total) -3 4 ……
III-173
DEPARTMENT OF TRANSPORTATION FEDERAL HIGHWAY ADMINISTRATION
STATE INFRASTRUCTURE BANKS
BACKGROUND In FY 1997, FHWA received an appropriation from the General Fund for the State Infrastructure Banks (SIBs) program. This schedule shows the obligation and outlay of that funding. All of the funds have been provided to the States to capitalize the infrastructure banks. Because the funding was provided as grants, and not loans, FHWA will not receive reimbursements of amounts expended for the SIBs program. BUDGETARY RESOURCES No new budgetary resources are requested in FY 2016.
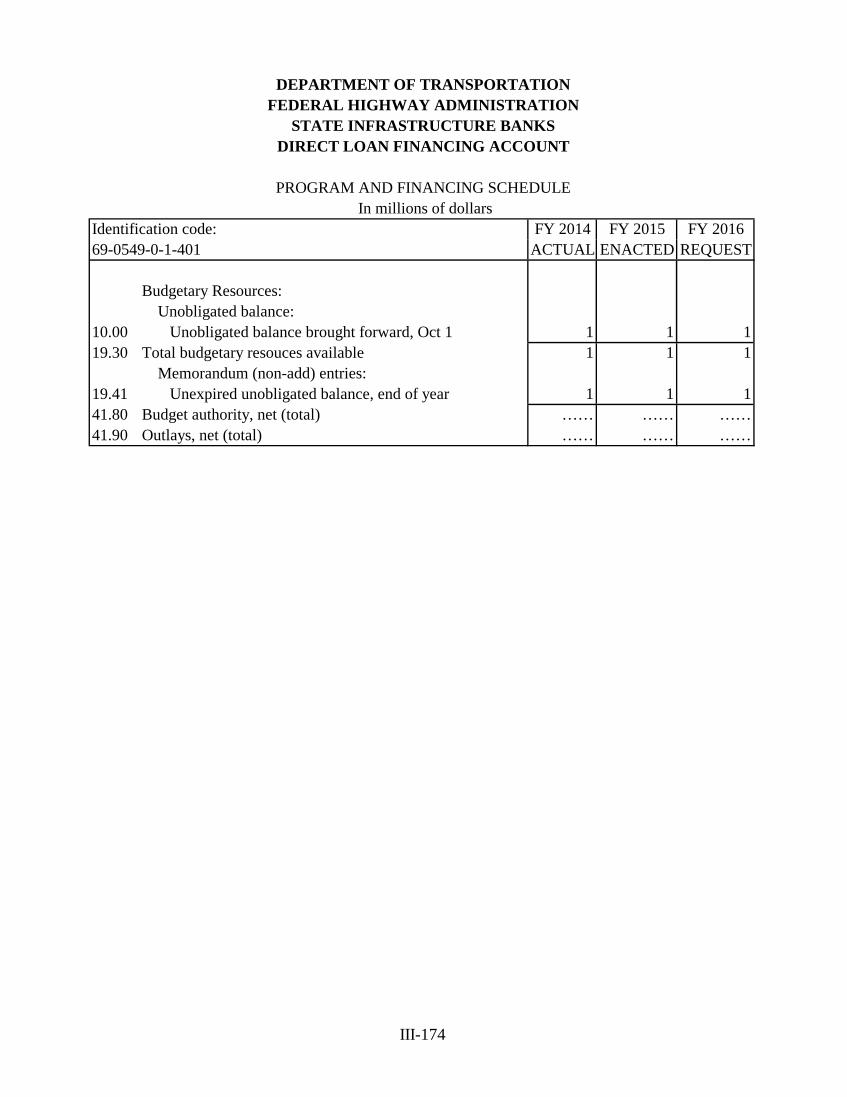
III-174
PROGRAM AND FINANCING SCHEDULE In millions of dollars
Identification code: FY 2014 FY 2015 FY 201669-0549-0-1-401 ACTUAL ENACTED REQUEST
Budgetary Resources: Unobligated balance:
10.00 Unobligated balance brought forward, Oct 1 1 1 119.30 Total budgetary resouces available 1 1 1 Memorandum (non-add) entries:19.41 Unexpired unobligated balance, end of year 1 1 141.80 Budget authority, net (total) …… …… ……41.90 Outlays, net (total) …… …… ……
DIRECT LOAN FINANCING ACCOUNTSTATE INFRASTRUCTURE BANKS
FEDERAL HIGHWAY ADMINISTRATIONDEPARTMENT OF TRANSPORTATION
III-175
DEPARTMENT OF TRANSPORTATION FEDERAL HIGHWAY ADMINISTRATION
HIGHWAY INFRASTRUCTURE PROGRAMS
BACKGROUND In FY 2010, the Federal Highway Administration received a General Fund appropriation of $650 million for the restoration, repair, and construction of highway infrastructure and other activities eligible under paragraph (b) of section 133 of title 23, United States Code. The authority for this appropriation is Division A, Title I of P.L. 111-117 (Consolidated Appropriations Act, 2010), Section 122 and was available through FY 2012.
BUDGETARY RESOURCES No new budget authority is requested for FY 2016.
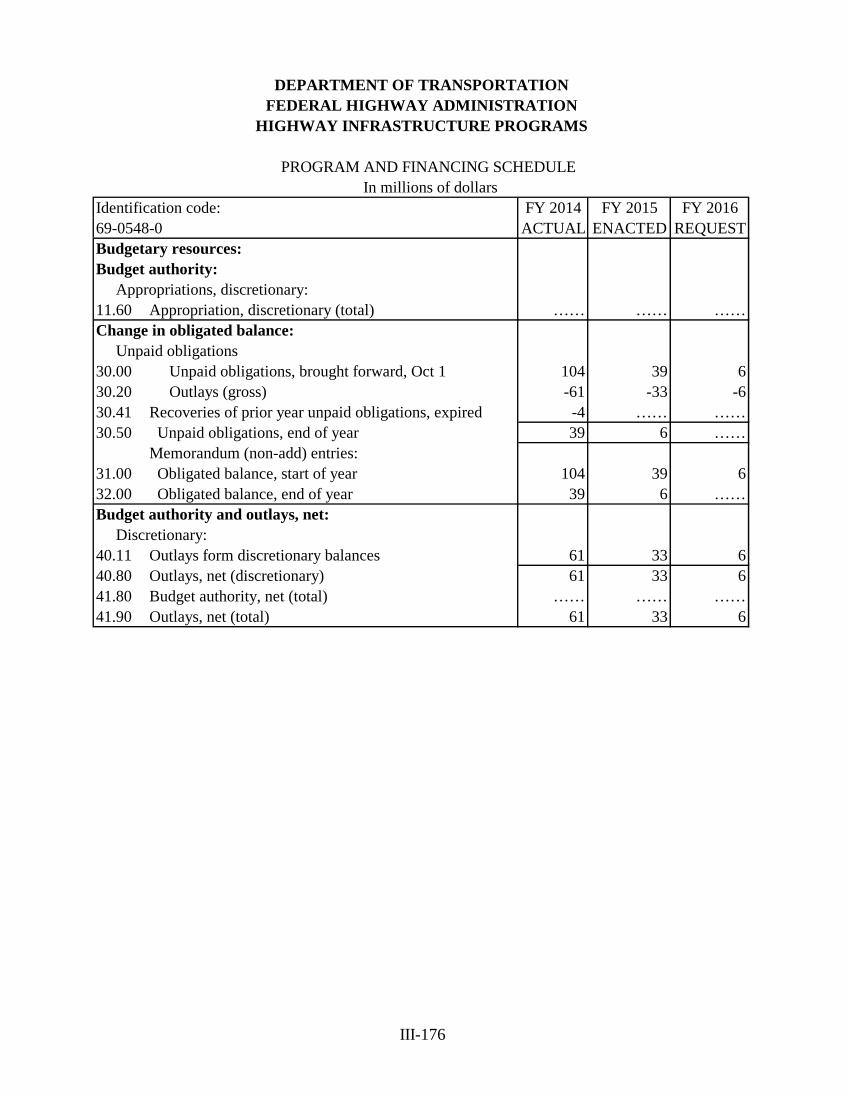
III-176
DEPARTMENT OF TRANSPORTATIONFEDERAL HIGHWAY ADMINISTRATION
PROGRAM AND FINANCING SCHEDULE In millions of dollars
Identification code: FY 2014 FY 2015 FY 201669-0548-0 ACTUAL ENACTED REQUESTBudgetary resources:Budget authority: Appropriations, discretionary:11.60 Appropriation, discretionary (total) …… …… ……Change in obligated balance: Unpaid obligations30.00 Unpaid obligations, brought forward, Oct 1 104 39 630.20 Outlays (gross) -61 -33 -630.41 Recoveries of prior year unpaid obligations, expired -4 …… ……30.50 Unpaid obligations, end of year 39 6 ……
Memorandum (non-add) entries:31.00 Obligated balance, start of year 104 39 632.00 Obligated balance, end of year 39 6 ……Budget authority and outlays, net: Discretionary:40.11 Outlays form discretionary balances 61 33 640.80 Outlays, net (discretionary) 61 33 641.80 Budget authority, net (total) …… …… ……41.90 Outlays, net (total) 61 33 6
HIGHWAY INFRASTRUCTURE PROGRAMS
III-177
DEPARTMENT OF TRANSPORTATION FEDERAL HIGHWAY ADMINISTRATION
PAYMENT TO THE TRANSPORTATION TRUST FUND
BACKGROUND Section 40251 of Public Law 112-141, Moving Ahead for Progress in the 21st Century Act (MAP-21) authorized additional appropriations from the General Fund of the Treasury to the Highway Account of the Highway Trust Fund in the amount of $6,200,000,000 for FY 2013. This funding was subject to a 5.1% permanent reduction in accordance with Presidential Sequestration Order dated March 1, 2013, pursuant to sections 251A and 256(k) of the Balanced Budget and Emergency Deficit Control Act, as amended (BBEDCA), 2 U.S.C. 901a, 2 U.S.C. 906(k)(1), which resulted in a total transfer of $5,883,800,000 in FY13. For FY 2014, MAP-21 authorized additional appropriations from the General Fund of the Treasury to the Highway Trust Fund in the amount of $12,600,000,000. Of this amount $10,400,000,000 was designated for the Highway Account of the Highway Trust Fund, and $2,200,000,000 was designated for the Mass Transit Account of the Highway Trust Fund. This funding was subject to a 7.2% permanent reduction in accordance with Presidential Sequestration Order dated April 10, 2013 (corrected May 20, 2013), pursuant to the Budget Control Act of 2011, Public Law 112-25, which resulted in a total transfer of $11,692,800,000 in FY14. Of this amount, $9,651,200,000 went to the Highway Account and $2,041,600,000 went to the Mass Transit Account. In addition to the FY 2014 funds above, PL 113-159 provided an additional appropriation of funds under the MAP-21 extension. This extension provided an appropriation from the General Fund in the amount of $9,765,000,000-- $7,765,000,000 to the Highway Account of the Highway Trust Fund, and $2,000,000,000 to the Mass Transit account. The MAP-21 extension also provided an appropriation from the Leaking Underground Storage Tank Trust Fund in the amount of $1,000,000,000 to the Highway Account of the Highway Trust Fund. This funding provided by the Map-21 extension was not subject to sequestration, per OMB A-11 Section 100.15, because the budgetary resources were enacted after the Sequestration order was issued for the applicable year. BUDGETARY RESOURCES The FY 2016 payment to the Transportation Trust Fund is comprised of $19.425 billion to the Highway Account, $14.3 billion to the Mass Transit Account, $4.758 billion to the Rail Account, and $1.250 billion to the Multimodal Account.
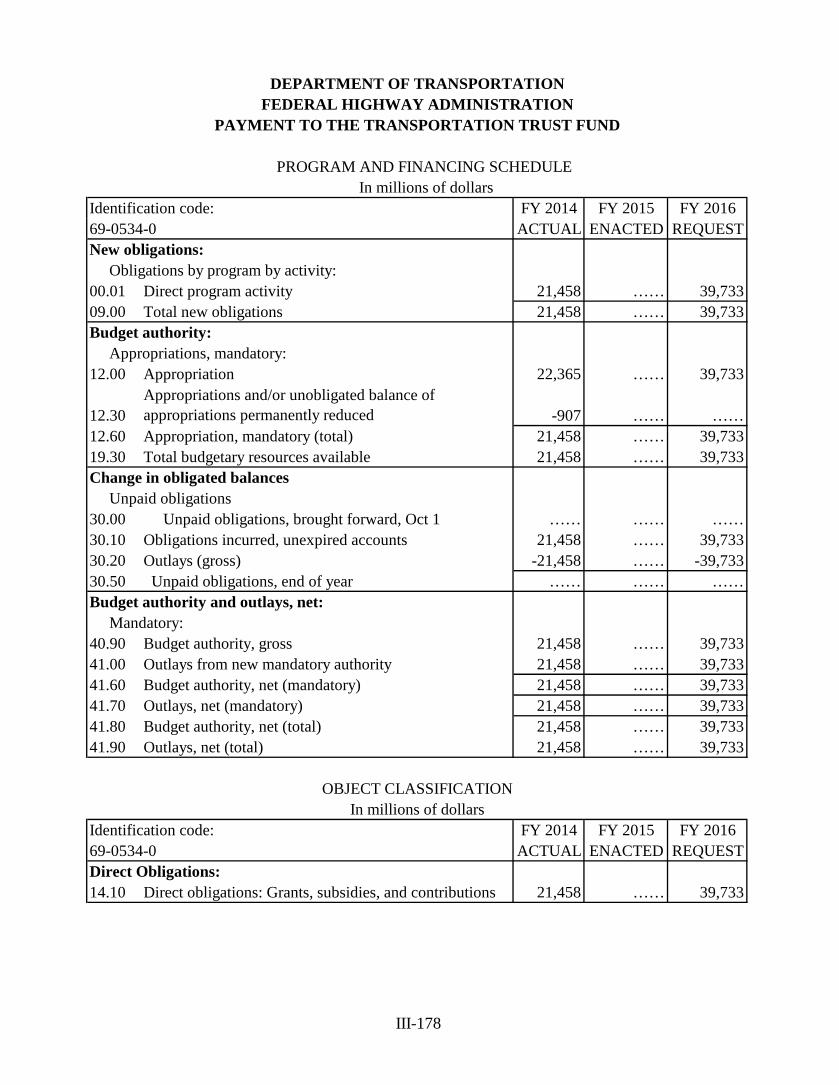
III-178
DEPARTMENT OF TRANSPORTATIONFEDERAL HIGHWAY ADMINISTRATION
PROGRAM AND FINANCING SCHEDULE In millions of dollars
Identification code: FY 2014 FY 2015 FY 201669-0534-0 ACTUAL ENACTED REQUESTNew obligations: Obligations by program by activity:00.01 Direct program activity 21,458 …… 39,73309.00 Total new obligations 21,458 …… 39,733Budget authority: Appropriations, mandatory:12.00 Appropriation 22,365 …… 39,733
12.30Appropriations and/or unobligated balance of appropriations permanently reduced -907 …… ……
12.60 Appropriation, mandatory (total) 21,458 …… 39,73319.30 Total budgetary resources available 21,458 …… 39,733Change in obligated balances Unpaid obligations30.00 Unpaid obligations, brought forward, Oct 1 …… …… ……30.10 Obligations incurred, unexpired accounts 21,458 …… 39,73330.20 Outlays (gross) -21,458 …… -39,73330.50 Unpaid obligations, end of year …… …… ……Budget authority and outlays, net: Mandatory:40.90 Budget authority, gross 21,458 …… 39,73341.00 Outlays from new mandatory authority 21,458 …… 39,73341.60 Budget authority, net (mandatory) 21,458 …… 39,73341.70 Outlays, net (mandatory) 21,458 …… 39,73341.80 Budget authority, net (total) 21,458 …… 39,73341.90 Outlays, net (total) 21,458 …… 39,733
OBJECT CLASSIFICATIONIn millions of dollars
Identification code: FY 2014 FY 2015 FY 201669-0534-0 ACTUAL ENACTED REQUESTDirect Obligations:14.10 Direct obligations: Grants, subsidies, and contributions 21,458 …… 39,733
PAYMENT TO THE TRANSPORTATION TRUST FUND
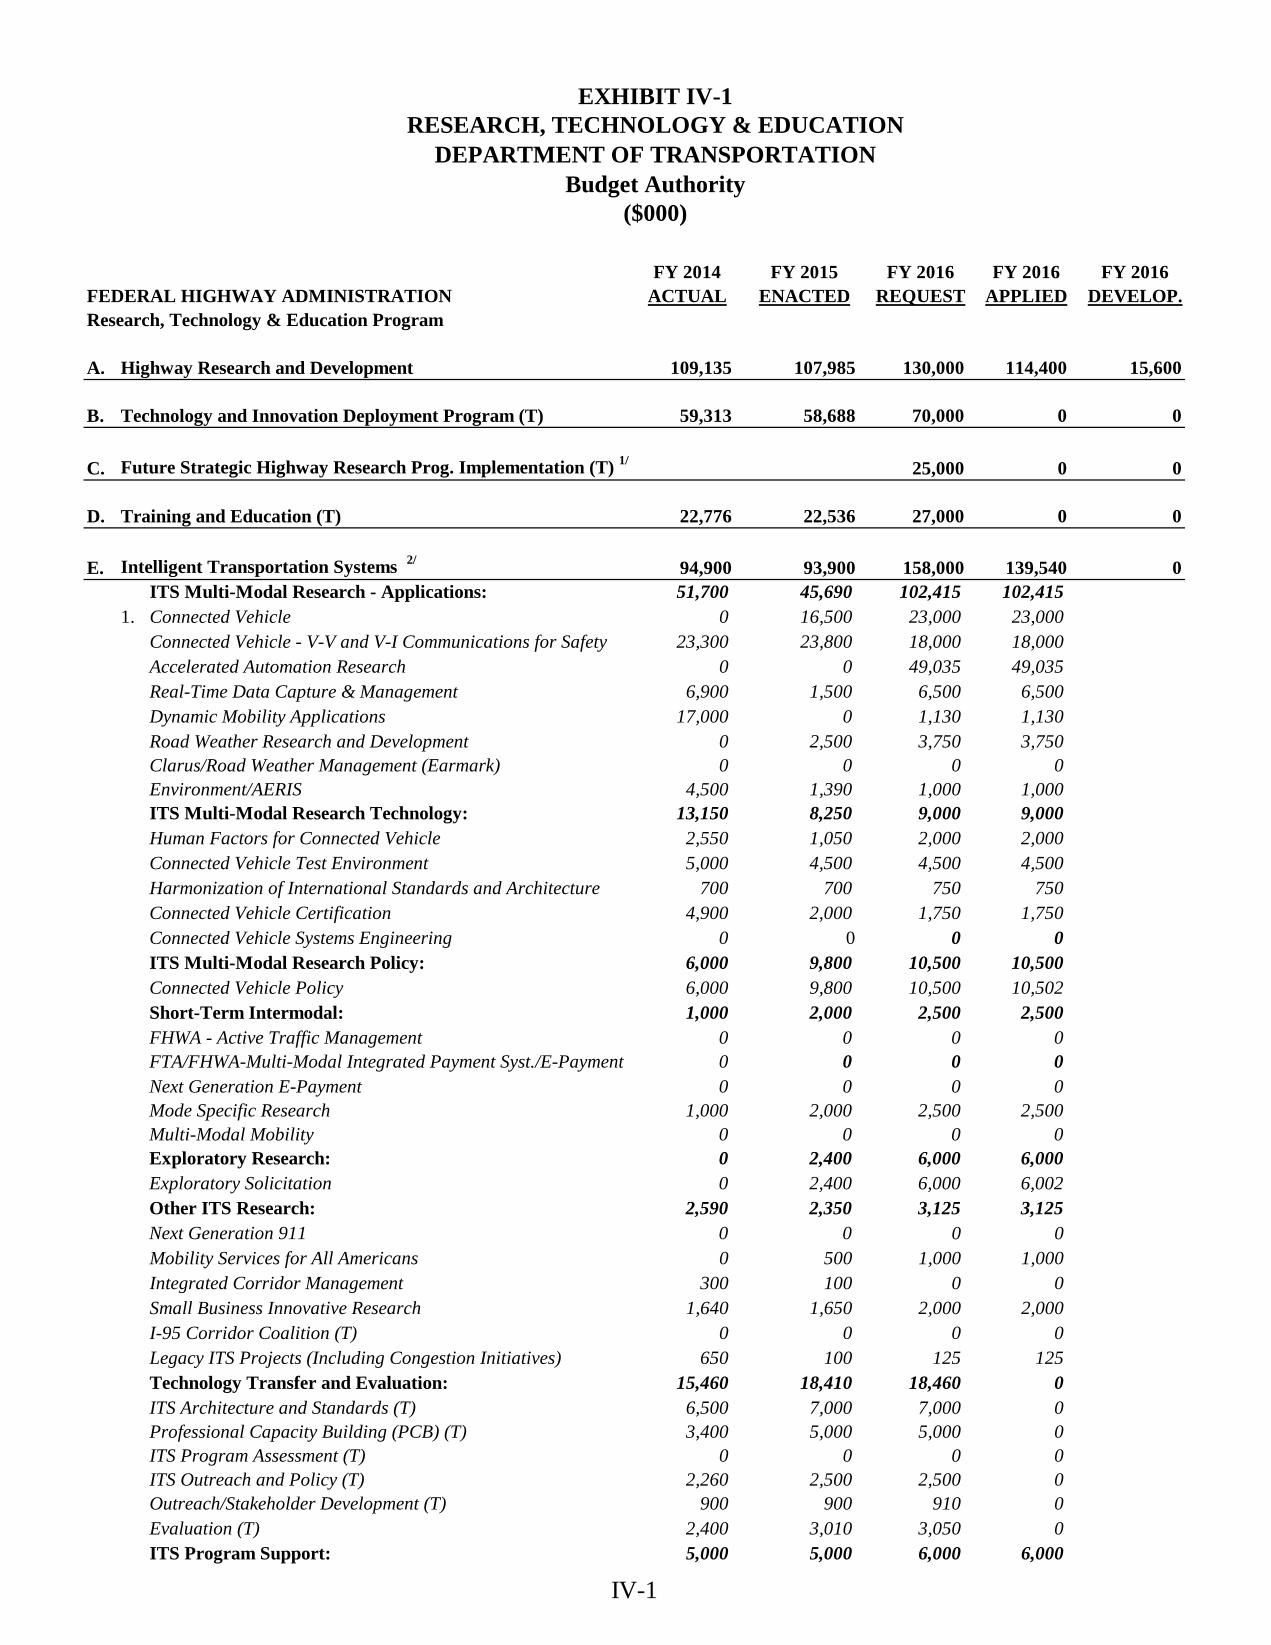
IV-1
EXHIBIT IV-1RESEARCH, TECHNOLOGY & EDUCATION
DEPARTMENT OF TRANSPORTATIONBudget Authority
($000)
FY 2014 FY 2015 FY 2016 FY 2016 FY 2016FEDERAL HIGHWAY ADMINISTRATION ACTUAL ENACTED REQUEST APPLIED DEVELOP.Research, Technology & Education Program
A. Highway Research and Development 109,135 107,985 130,000 114,400 15,600
B. Technology and Innovation Deployment Program (T) 59,313 58,688 70,000 0 0
C. Future Strategic Highway Research Prog. Implementation (T) 1/ 25,000 0 0
D. Training and Education (T) 22,776 22,536 27,000 0 0
E. Intelligent Transportation Systems 2/ 94,900 93,900 158,000 139,540 0ITS Multi-Modal Research - Applications: 51,700 45,690 102,415 102,415
1. Connected Vehicle 0 16,500 23,000 23,000Connected Vehicle - V-V and V-I Communications for Safety 23,300 23,800 18,000 18,000Accelerated Automation Research 0 0 49,035 49,035Real-Time Data Capture & Management 6,900 1,500 6,500 6,500Dynamic Mobility Applications 17,000 0 1,130 1,130Road Weather Research and Development 0 2,500 3,750 3,750Clarus/Road Weather Management (Earmark) 0 0 0 0Environment/AERIS 4,500 1,390 1,000 1,000ITS Multi-Modal Research Technology: 13,150 8,250 9,000 9,000Human Factors for Connected Vehicle 2,550 1,050 2,000 2,000Connected Vehicle Test Environment 5,000 4,500 4,500 4,500Harmonization of International Standards and Architecture 700 700 750 750Connected Vehicle Certification 4,900 2,000 1,750 1,750Connected Vehicle Systems Engineering 0 0 0 0ITS Multi-Modal Research Policy: 6,000 9,800 10,500 10,500Connected Vehicle Policy 6,000 9,800 10,500 10,502Short-Term Intermodal: 1,000 2,000 2,500 2,500FHWA - Active Traffic Management 0 0 0 0FTA/FHWA-Multi-Modal Integrated Payment Syst./E-Payment 0 0 0 0Next Generation E-Payment 0 0 0 0Mode Specific Research 1,000 2,000 2,500 2,500Multi-Modal Mobility 0 0 0 0Exploratory Research: 0 2,400 6,000 6,000Exploratory Solicitation 0 2,400 6,000 6,002Other ITS Research: 2,590 2,350 3,125 3,125Next Generation 911 0 0 0 0Mobility Services for All Americans 0 500 1,000 1,000Integrated Corridor Management 300 100 0 0Small Business Innovative Research 1,640 1,650 2,000 2,000I-95 Corridor Coalition (T) 0 0 0 0Legacy ITS Projects (Including Congestion Initiatives) 650 100 125 125Technology Transfer and Evaluation: 15,460 18,410 18,460 0ITS Architecture and Standards (T) 6,500 7,000 7,000 0Professional Capacity Building (PCB) (T) 3,400 5,000 5,000 0ITS Program Assessment (T) 0 0 0 0ITS Outreach and Policy (T) 2,260 2,500 2,500 0Outreach/Stakeholder Development (T) 900 900 910 0Evaluation (T) 2,400 3,010 3,050 0ITS Program Support: 5,000 5,000 6,000 6,000
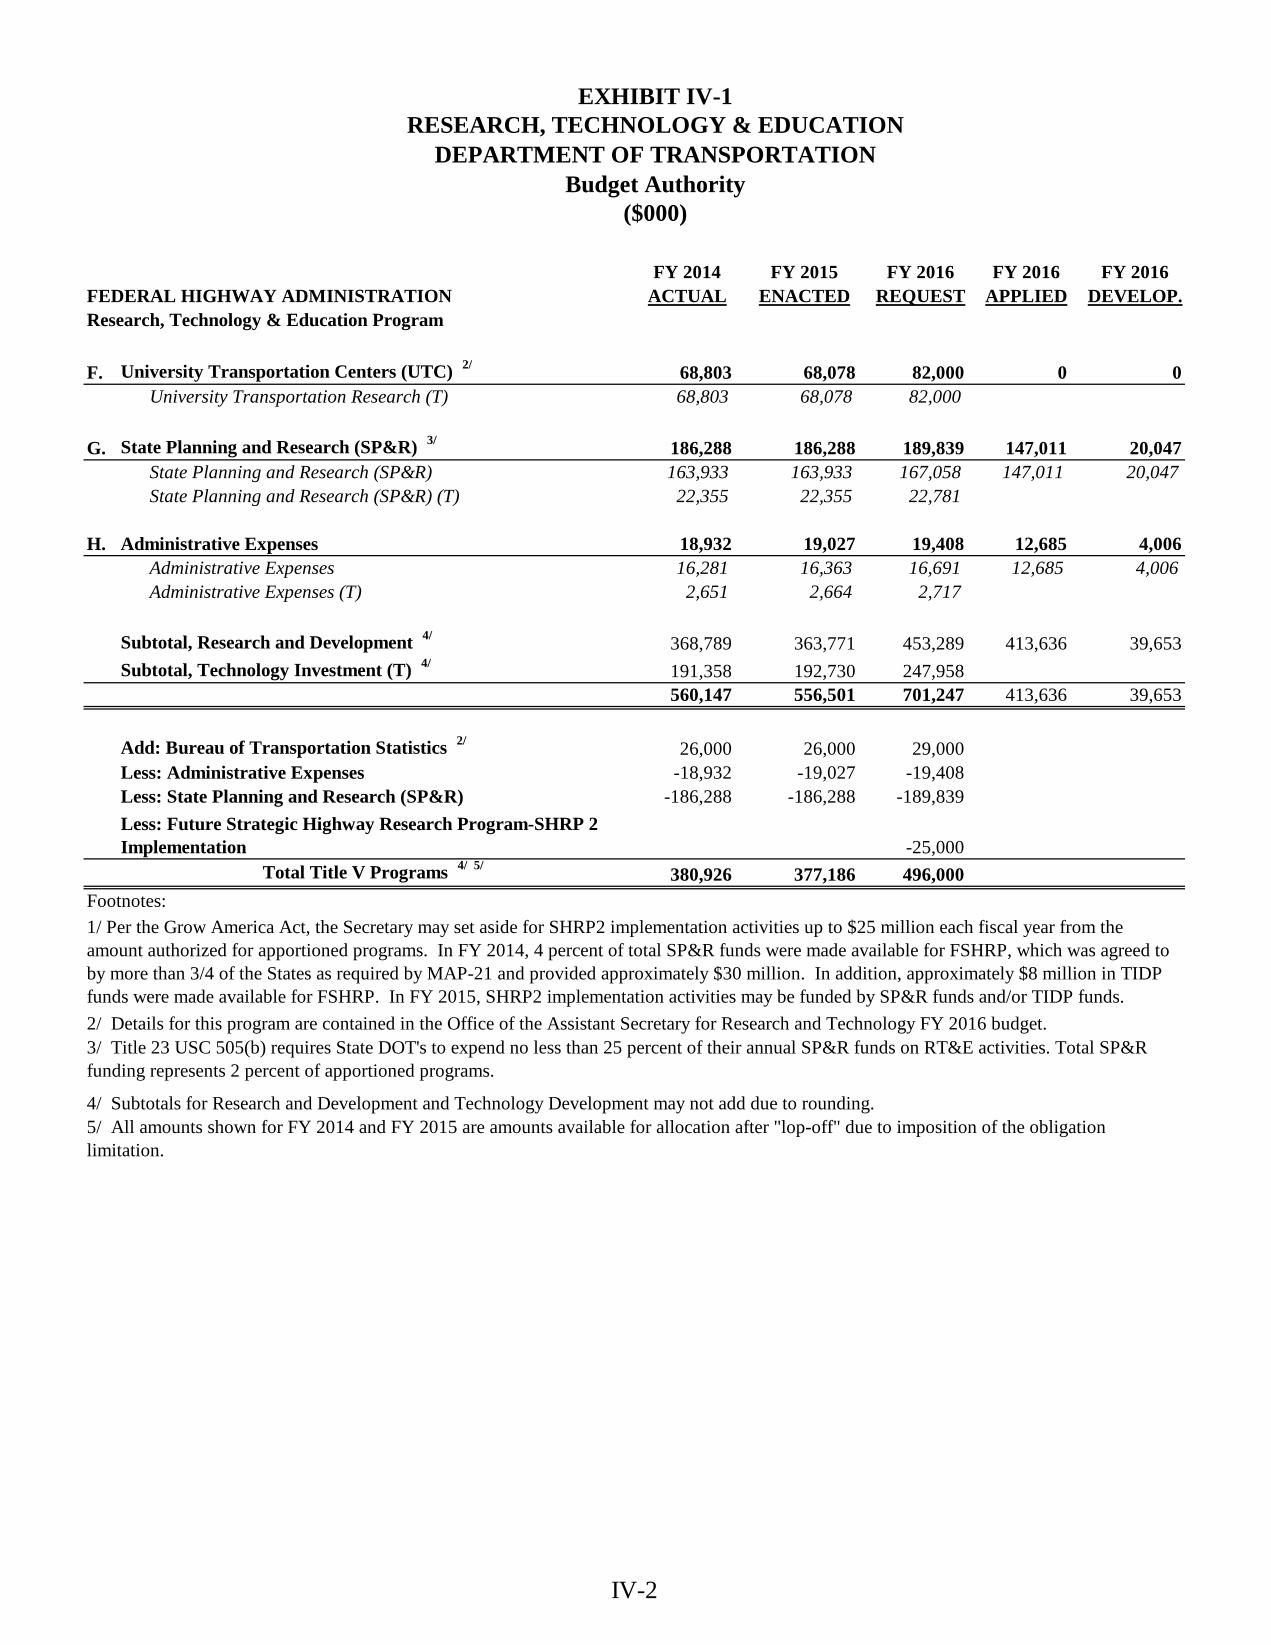
IV-2
EXHIBIT IV-1RESEARCH, TECHNOLOGY & EDUCATION
DEPARTMENT OF TRANSPORTATIONBudget Authority
($000)
FY 2014 FY 2015 FY 2016 FY 2016 FY 2016FEDERAL HIGHWAY ADMINISTRATION ACTUAL ENACTED REQUEST APPLIED DEVELOP.Research, Technology & Education Program
F. University Transportation Centers (UTC) 2/ 68,803 68,078 82,000 0 0University Transportation Research (T) 68,803 68,078 82,000
G. State Planning and Research (SP&R) 3/ 186,288 186,288 189,839 147,011 20,047State Planning and Research (SP&R) 163,933 163,933 167,058 147,011 20,047State Planning and Research (SP&R) (T) 22,355 22,355 22,781
H. Administrative Expenses 18,932 19,027 19,408 12,685 4,006Administrative Expenses 16,281 16,363 16,691 12,685 4,006Administrative Expenses (T) 2,651 2,664 2,717
Subtotal, Research and Development 4/ 368,789 363,771 453,289 413,636 39,653Subtotal, Technology Investment (T) 4/ 191,358 192,730 247,958
560,147 556,501 701,247 413,636 39,653
Add: Bureau of Transportation Statistics 2/ 26,000 26,000 29,000Less: Administrative Expenses -18,932 -19,027 -19,408Less: State Planning and Research (SP&R) -186,288 -186,288 -189,839
-25,000 Total Title V Programs 4/ 5/ 380,926 377,186 496,000
Footnotes:
4/ Subtotals for Research and Development and Technology Development may not add due to rounding.
3/ Title 23 USC 505(b) requires State DOT's to expend no less than 25 percent of their annual SP&R funds on RT&E activities. Total SP&R funding represents 2 percent of apportioned programs.
1/ Per the Grow America Act, the Secretary may set aside for SHRP2 implementation activities up to $25 million each fiscal year from the amount authorized for apportioned programs. In FY 2014, 4 percent of total SP&R funds were made available for FSHRP, which was agreed to by more than 3/4 of the States as required by MAP-21 and provided approximately $30 million. In addition, approximately $8 million in TIDP funds were made available for FSHRP. In FY 2015, SHRP2 implementation activities may be funded by SP&R funds and/or TIDP funds.2/ Details for this program are contained in the Office of the Assistant Secretary for Research and Technology FY 2016 budget.
5/ All amounts shown for FY 2014 and FY 2015 are amounts available for allocation after "lop-off" due to imposition of the obligation limitation.
Less: Future Strategic Highway Research Program-SHRP 2 Implementation
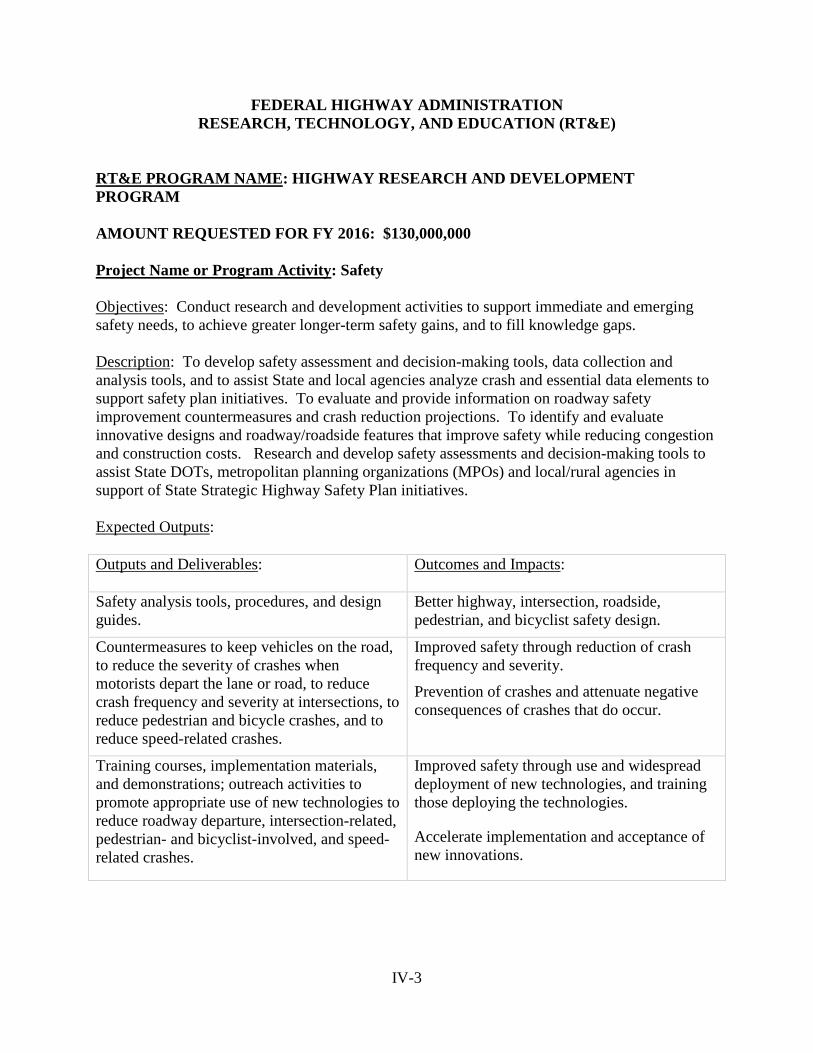
IV-3
FEDERAL HIGHWAY ADMINISTRATION RESEARCH, TECHNOLOGY, AND EDUCATION (RT&E)
RT&E PROGRAM NAME: HIGHWAY RESEARCH AND DEVELOPMENT PROGRAM AMOUNT REQUESTED FOR FY 2016: $130,000,000 Project Name or Program Activity: Safety Objectives: Conduct research and development activities to support immediate and emerging safety needs, to achieve greater longer-term safety gains, and to fill knowledge gaps. Description: To develop safety assessment and decision-making tools, data collection and analysis tools, and to assist State and local agencies analyze crash and essential data elements to support safety plan initiatives. To evaluate and provide information on roadway safety improvement countermeasures and crash reduction projections. To identify and evaluate innovative designs and roadway/roadside features that improve safety while reducing congestion and construction costs. Research and develop safety assessments and decision-making tools to assist State DOTs, metropolitan planning organizations (MPOs) and local/rural agencies in support of State Strategic Highway Safety Plan initiatives. Expected Outputs: Outputs and Deliverables: Outcomes and Impacts:
Safety analysis tools, procedures, and design guides.
Better highway, intersection, roadside, pedestrian, and bicyclist safety design.
Countermeasures to keep vehicles on the road, to reduce the severity of crashes when motorists depart the lane or road, to reduce crash frequency and severity at intersections, to reduce pedestrian and bicycle crashes, and to reduce speed-related crashes.
Improved safety through reduction of crash frequency and severity.
Prevention of crashes and attenuate negative consequences of crashes that do occur.
Training courses, implementation materials, and demonstrations; outreach activities to promote appropriate use of new technologies to reduce roadway departure, intersection-related, pedestrian- and bicyclist-involved, and speed-related crashes.
Improved safety through use and widespread deployment of new technologies, and training those deploying the technologies.
Accelerate implementation and acceptance of new innovations.
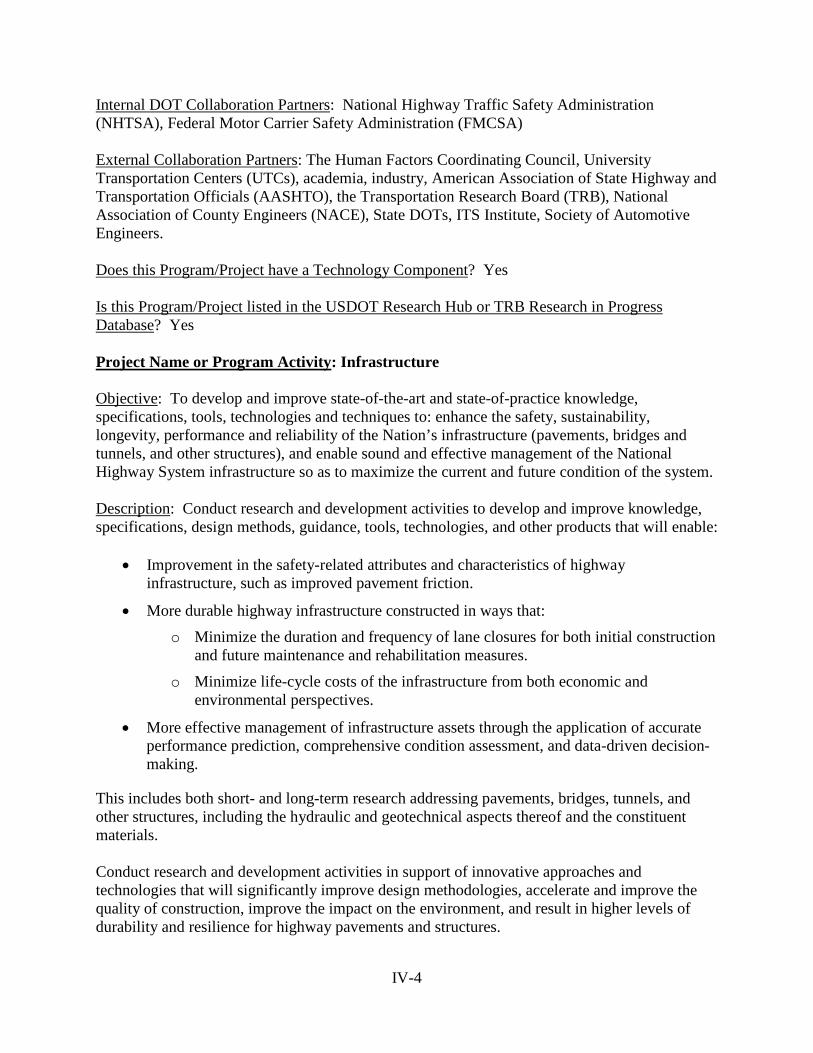
IV-4
Internal DOT Collaboration Partners: National Highway Traffic Safety Administration (NHTSA), Federal Motor Carrier Safety Administration (FMCSA) External Collaboration Partners: The Human Factors Coordinating Council, University Transportation Centers (UTCs), academia, industry, American Association of State Highway and Transportation Officials (AASHTO), the Transportation Research Board (TRB), National Association of County Engineers (NACE), State DOTs, ITS Institute, Society of Automotive Engineers. Does this Program/Project have a Technology Component? Yes Is this Program/Project listed in the USDOT Research Hub or TRB Research in Progress Database? Yes Project Name or Program Activity: Infrastructure Objective: To develop and improve state-of-the-art and state-of-practice knowledge, specifications, tools, technologies and techniques to: enhance the safety, sustainability, longevity, performance and reliability of the Nation’s infrastructure (pavements, bridges and tunnels, and other structures), and enable sound and effective management of the National Highway System infrastructure so as to maximize the current and future condition of the system. Description: Conduct research and development activities to develop and improve knowledge, specifications, design methods, guidance, tools, technologies, and other products that will enable:
• Improvement in the safety-related attributes and characteristics of highway infrastructure, such as improved pavement friction.
• More durable highway infrastructure constructed in ways that: o Minimize the duration and frequency of lane closures for both initial construction
and future maintenance and rehabilitation measures.
o Minimize life-cycle costs of the infrastructure from both economic and environmental perspectives.
• More effective management of infrastructure assets through the application of accurate performance prediction, comprehensive condition assessment, and data-driven decision-making.
This includes both short- and long-term research addressing pavements, bridges, tunnels, and other structures, including the hydraulic and geotechnical aspects thereof and the constituent materials. Conduct research and development activities in support of innovative approaches and technologies that will significantly improve design methodologies, accelerate and improve the quality of construction, improve the impact on the environment, and result in higher levels of durability and resilience for highway pavements and structures.
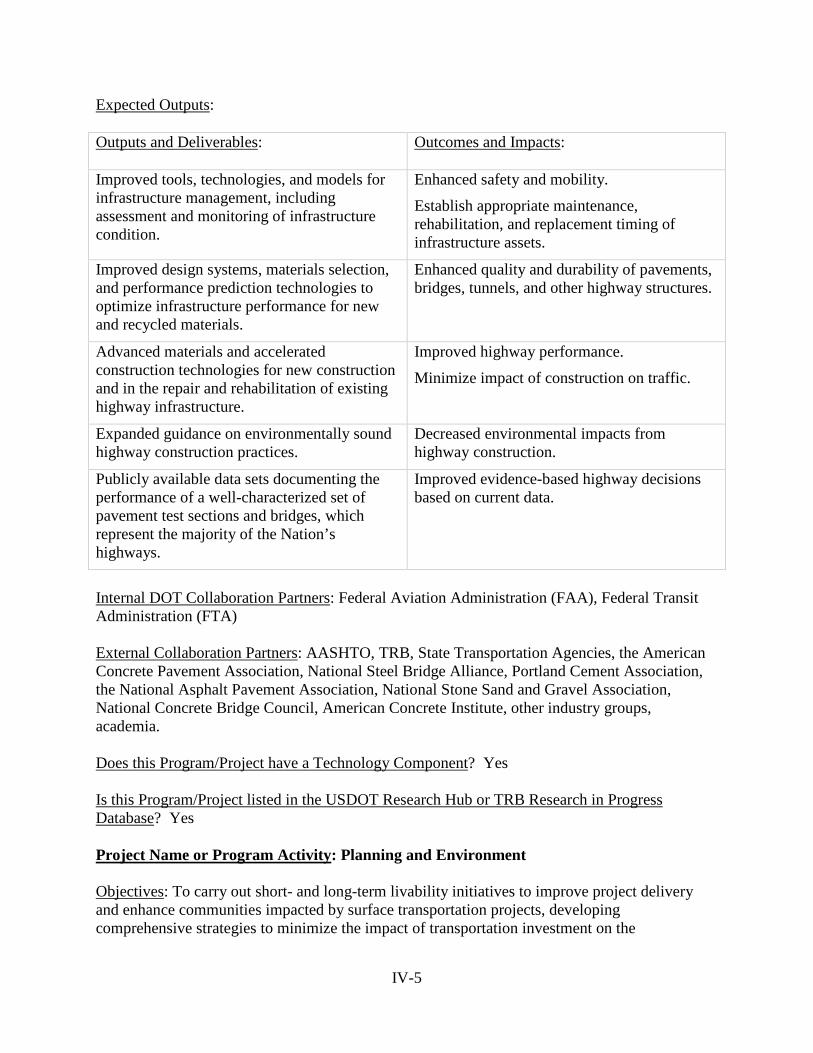
IV-5
Expected Outputs: Outputs and Deliverables: Outcomes and Impacts:
Improved tools, technologies, and models for infrastructure management, including assessment and monitoring of infrastructure condition.
Enhanced safety and mobility.
Establish appropriate maintenance, rehabilitation, and replacement timing of infrastructure assets.
Improved design systems, materials selection, and performance prediction technologies to optimize infrastructure performance for new and recycled materials.
Enhanced quality and durability of pavements, bridges, tunnels, and other highway structures.
Advanced materials and accelerated construction technologies for new construction and in the repair and rehabilitation of existing highway infrastructure.
Improved highway performance.
Minimize impact of construction on traffic.
Expanded guidance on environmentally sound highway construction practices.
Decreased environmental impacts from highway construction.
Publicly available data sets documenting the performance of a well-characterized set of pavement test sections and bridges, which represent the majority of the Nation’s highways.
Improved evidence-based highway decisions based on current data.
Internal DOT Collaboration Partners: Federal Aviation Administration (FAA), Federal Transit Administration (FTA) External Collaboration Partners: AASHTO, TRB, State Transportation Agencies, the American Concrete Pavement Association, National Steel Bridge Alliance, Portland Cement Association, the National Asphalt Pavement Association, National Stone Sand and Gravel Association, National Concrete Bridge Council, American Concrete Institute, other industry groups, academia. Does this Program/Project have a Technology Component? Yes Is this Program/Project listed in the USDOT Research Hub or TRB Research in Progress Database? Yes Project Name or Program Activity: Planning and Environment Objectives: To carry out short- and long-term livability initiatives to improve project delivery and enhance communities impacted by surface transportation projects, developing comprehensive strategies to minimize the impact of transportation investment on the
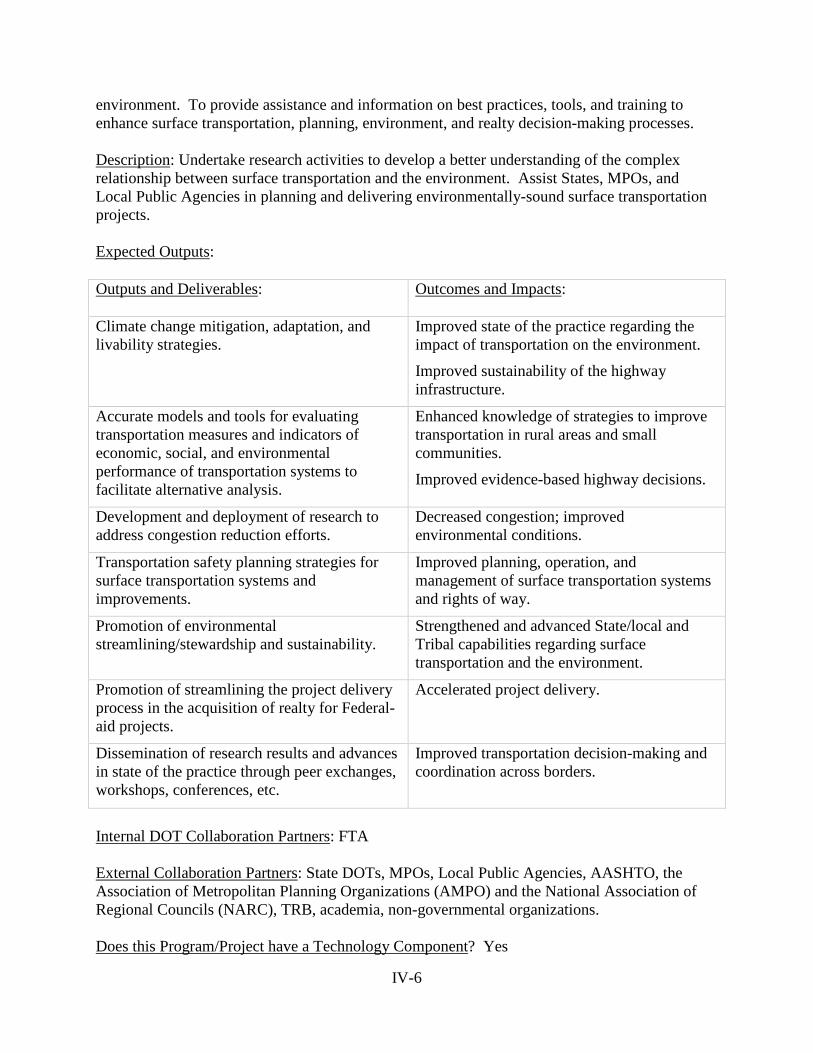
IV-6
environment. To provide assistance and information on best practices, tools, and training to enhance surface transportation, planning, environment, and realty decision-making processes. Description: Undertake research activities to develop a better understanding of the complex relationship between surface transportation and the environment. Assist States, MPOs, and Local Public Agencies in planning and delivering environmentally-sound surface transportation projects. Expected Outputs: Outputs and Deliverables: Outcomes and Impacts:
Climate change mitigation, adaptation, and livability strategies.
Improved state of the practice regarding the impact of transportation on the environment.
Improved sustainability of the highway infrastructure.
Accurate models and tools for evaluating transportation measures and indicators of economic, social, and environmental performance of transportation systems to facilitate alternative analysis.
Enhanced knowledge of strategies to improve transportation in rural areas and small communities.
Improved evidence-based highway decisions.
Development and deployment of research to address congestion reduction efforts.
Decreased congestion; improved environmental conditions.
Transportation safety planning strategies for surface transportation systems and improvements.
Improved planning, operation, and management of surface transportation systems and rights of way.
Promotion of environmental streamlining/stewardship and sustainability.
Strengthened and advanced State/local and Tribal capabilities regarding surface transportation and the environment.
Promotion of streamlining the project delivery process in the acquisition of realty for Federal-aid projects.
Accelerated project delivery.
Dissemination of research results and advances in state of the practice through peer exchanges, workshops, conferences, etc.
Improved transportation decision-making and coordination across borders.
Internal DOT Collaboration Partners: FTA External Collaboration Partners: State DOTs, MPOs, Local Public Agencies, AASHTO, the Association of Metropolitan Planning Organizations (AMPO) and the National Association of Regional Councils (NARC), TRB, academia, non-governmental organizations. Does this Program/Project have a Technology Component? Yes
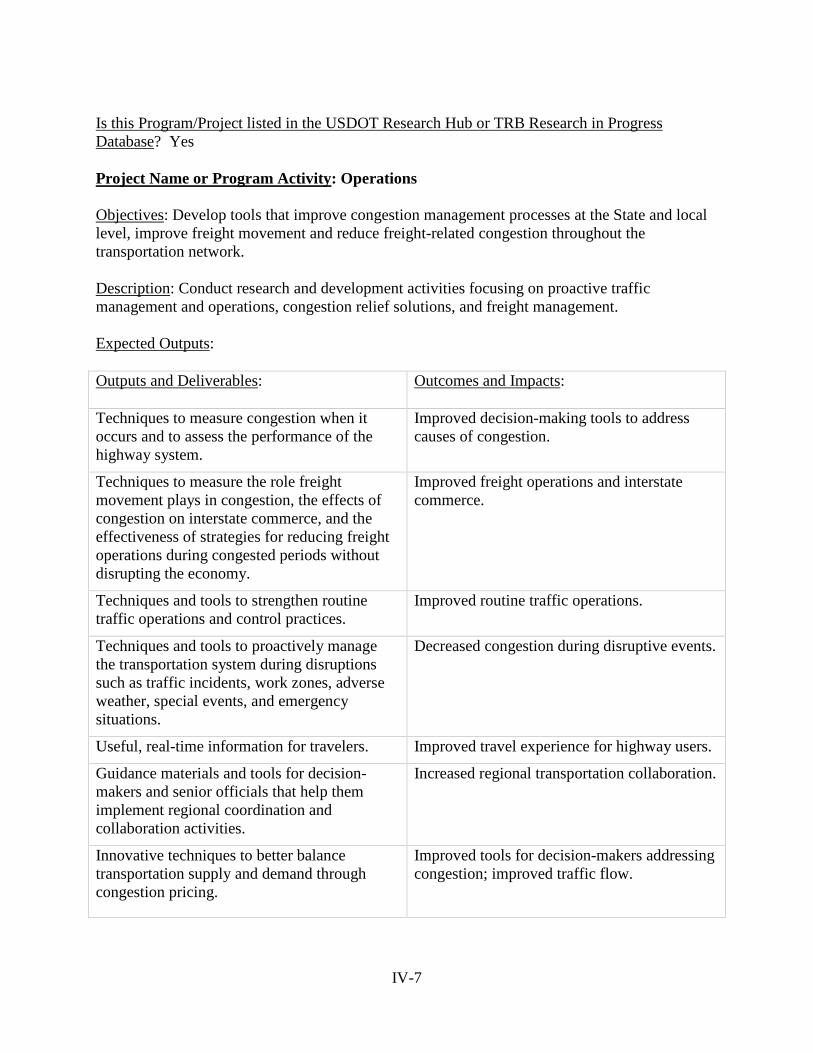
IV-7
Is this Program/Project listed in the USDOT Research Hub or TRB Research in Progress Database? Yes Project Name or Program Activity: Operations Objectives: Develop tools that improve congestion management processes at the State and local level, improve freight movement and reduce freight-related congestion throughout the transportation network. Description: Conduct research and development activities focusing on proactive traffic management and operations, congestion relief solutions, and freight management. Expected Outputs: Outputs and Deliverables: Outcomes and Impacts:
Techniques to measure congestion when it occurs and to assess the performance of the highway system.
Improved decision-making tools to address causes of congestion.
Techniques to measure the role freight movement plays in congestion, the effects of congestion on interstate commerce, and the effectiveness of strategies for reducing freight operations during congested periods without disrupting the economy.
Improved freight operations and interstate commerce.
Techniques and tools to strengthen routine traffic operations and control practices.
Improved routine traffic operations.
Techniques and tools to proactively manage the transportation system during disruptions such as traffic incidents, work zones, adverse weather, special events, and emergency situations.
Decreased congestion during disruptive events.
Useful, real-time information for travelers. Improved travel experience for highway users.
Guidance materials and tools for decision-makers and senior officials that help them implement regional coordination and collaboration activities.
Increased regional transportation collaboration.
Innovative techniques to better balance transportation supply and demand through congestion pricing.
Improved tools for decision-makers addressing congestion; improved traffic flow.
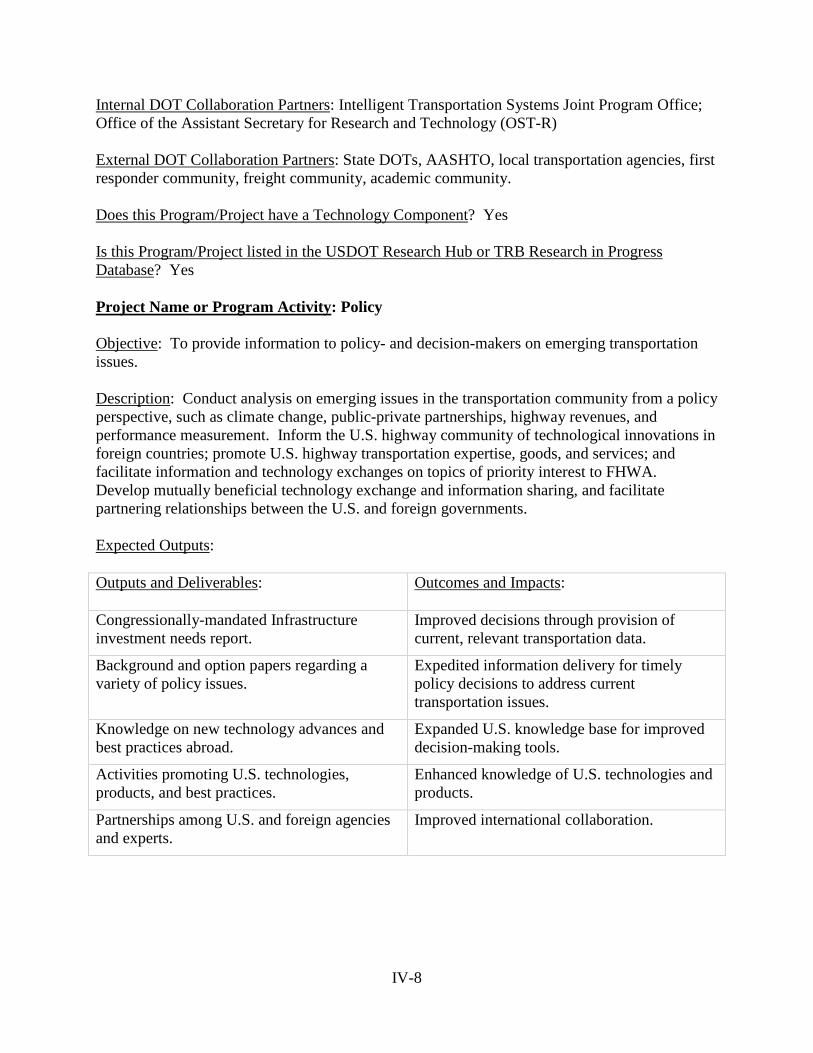
IV-8
Internal DOT Collaboration Partners: Intelligent Transportation Systems Joint Program Office; Office of the Assistant Secretary for Research and Technology (OST-R) External DOT Collaboration Partners: State DOTs, AASHTO, local transportation agencies, first responder community, freight community, academic community. Does this Program/Project have a Technology Component? Yes Is this Program/Project listed in the USDOT Research Hub or TRB Research in Progress Database? Yes Project Name or Program Activity: Policy Objective: To provide information to policy- and decision-makers on emerging transportation issues. Description: Conduct analysis on emerging issues in the transportation community from a policy perspective, such as climate change, public-private partnerships, highway revenues, and performance measurement. Inform the U.S. highway community of technological innovations in foreign countries; promote U.S. highway transportation expertise, goods, and services; and facilitate information and technology exchanges on topics of priority interest to FHWA. Develop mutually beneficial technology exchange and information sharing, and facilitate partnering relationships between the U.S. and foreign governments. Expected Outputs: Outputs and Deliverables: Outcomes and Impacts:
Congressionally-mandated Infrastructure investment needs report.
Improved decisions through provision of current, relevant transportation data.
Background and option papers regarding a variety of policy issues.
Expedited information delivery for timely policy decisions to address current transportation issues.
Knowledge on new technology advances and best practices abroad.
Expanded U.S. knowledge base for improved decision-making tools.
Activities promoting U.S. technologies, products, and best practices.
Enhanced knowledge of U.S. technologies and products.
Partnerships among U.S. and foreign agencies and experts.
Improved international collaboration.
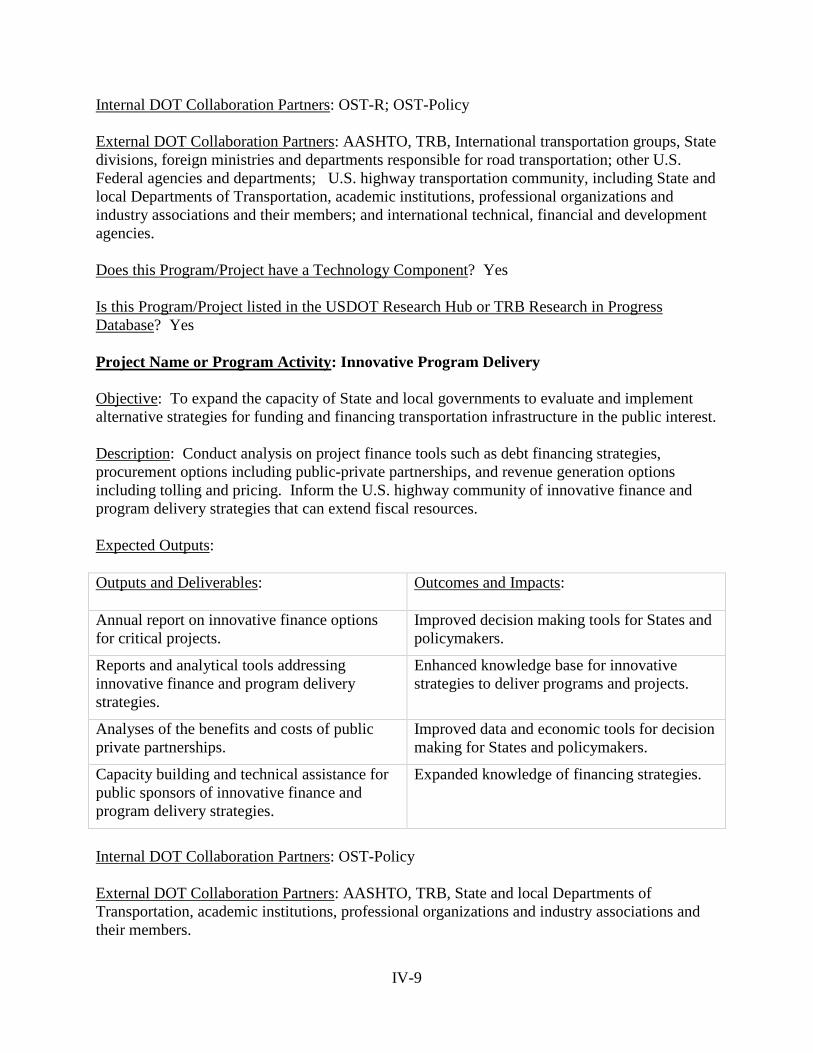
IV-9
Internal DOT Collaboration Partners: OST-R; OST-Policy External DOT Collaboration Partners: AASHTO, TRB, International transportation groups, State divisions, foreign ministries and departments responsible for road transportation; other U.S. Federal agencies and departments; U.S. highway transportation community, including State and local Departments of Transportation, academic institutions, professional organizations and industry associations and their members; and international technical, financial and development agencies. Does this Program/Project have a Technology Component? Yes Is this Program/Project listed in the USDOT Research Hub or TRB Research in Progress Database? Yes Project Name or Program Activity: Innovative Program Delivery Objective: To expand the capacity of State and local governments to evaluate and implement alternative strategies for funding and financing transportation infrastructure in the public interest. Description: Conduct analysis on project finance tools such as debt financing strategies, procurement options including public-private partnerships, and revenue generation options including tolling and pricing. Inform the U.S. highway community of innovative finance and program delivery strategies that can extend fiscal resources. Expected Outputs: Outputs and Deliverables: Outcomes and Impacts:
Annual report on innovative finance options for critical projects.
Improved decision making tools for States and policymakers.
Reports and analytical tools addressing innovative finance and program delivery strategies.
Enhanced knowledge base for innovative strategies to deliver programs and projects.
Analyses of the benefits and costs of public private partnerships.
Improved data and economic tools for decision making for States and policymakers.
Capacity building and technical assistance for public sponsors of innovative finance and program delivery strategies.
Expanded knowledge of financing strategies.
Internal DOT Collaboration Partners: OST-Policy External DOT Collaboration Partners: AASHTO, TRB, State and local Departments of Transportation, academic institutions, professional organizations and industry associations and their members.
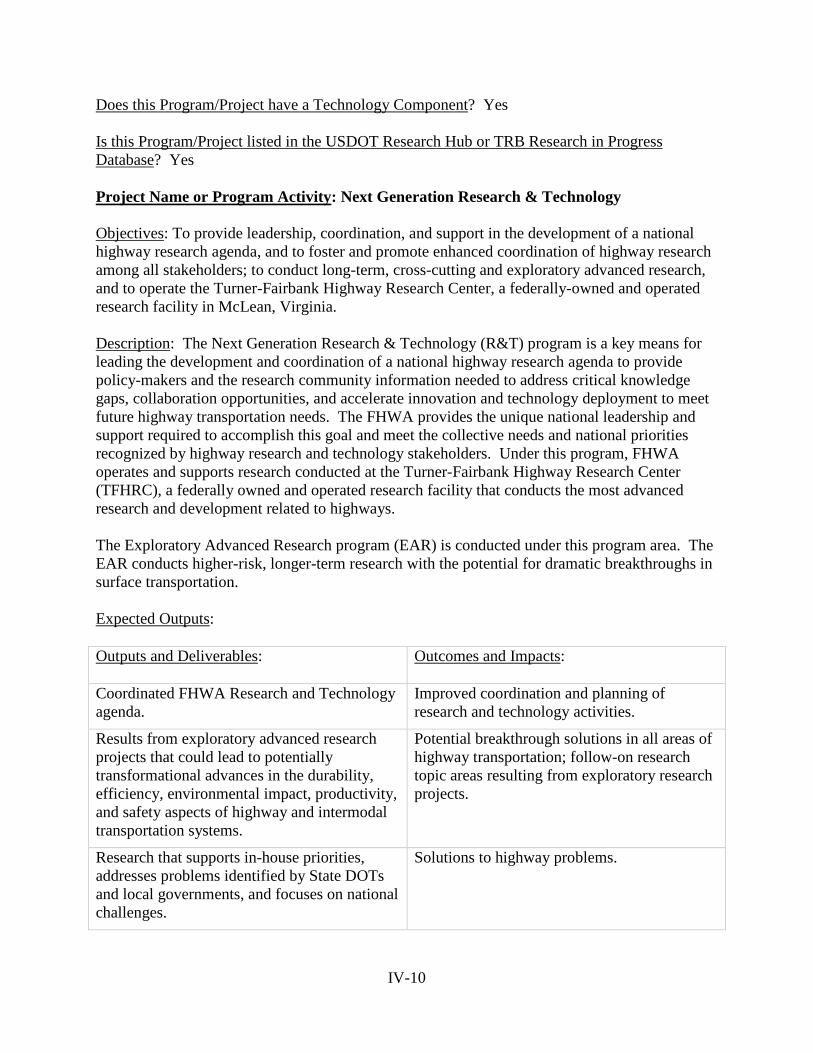
IV-10
Does this Program/Project have a Technology Component? Yes Is this Program/Project listed in the USDOT Research Hub or TRB Research in Progress Database? Yes Project Name or Program Activity: Next Generation Research & Technology Objectives: To provide leadership, coordination, and support in the development of a national highway research agenda, and to foster and promote enhanced coordination of highway research among all stakeholders; to conduct long-term, cross-cutting and exploratory advanced research, and to operate the Turner-Fairbank Highway Research Center, a federally-owned and operated research facility in McLean, Virginia. Description: The Next Generation Research & Technology (R&T) program is a key means for leading the development and coordination of a national highway research agenda to provide policy-makers and the research community information needed to address critical knowledge gaps, collaboration opportunities, and accelerate innovation and technology deployment to meet future highway transportation needs. The FHWA provides the unique national leadership and support required to accomplish this goal and meet the collective needs and national priorities recognized by highway research and technology stakeholders. Under this program, FHWA operates and supports research conducted at the Turner-Fairbank Highway Research Center (TFHRC), a federally owned and operated research facility that conducts the most advanced research and development related to highways. The Exploratory Advanced Research program (EAR) is conducted under this program area. The EAR conducts higher-risk, longer-term research with the potential for dramatic breakthroughs in surface transportation. Expected Outputs: Outputs and Deliverables: Outcomes and Impacts:
Coordinated FHWA Research and Technology agenda.
Improved coordination and planning of research and technology activities.
Results from exploratory advanced research projects that could lead to potentially transformational advances in the durability, efficiency, environmental impact, productivity, and safety aspects of highway and intermodal transportation systems.
Potential breakthrough solutions in all areas of highway transportation; follow-on research topic areas resulting from exploratory research projects.
Research that supports in-house priorities, addresses problems identified by State DOTs and local governments, and focuses on national challenges.
Solutions to highway problems.
IV-11
Internal DOT Collaboration Partners: OST-R; ITS-JPO; NHTSA, FTA, FRA, FAA External DOT Collaboration Partners: AASHTO, State DOT Research Managers, UTCs, TRB, Forum of European Highway Research Labs. Does this Program/Project have a Technology Component? Yes Is this Program/Project listed in the USDOT Research Hub or TRB Research in Progress Database? Yes RT&E PROGRAM NAME: TECHNOLOGY AND INNOVATION DEPLOYMENT PROGRAM (TIDP) AMOUNT REQUESTED FOR FY 2016: $70,000,000 (plus $25,000,000 non-add take-down for implementation of Future Strategic Highway Research Program – SHRP2) Objectives: To accelerate the adoption of proven innovative practices and technologies as standard practices to significantly improve safety, system efficiency, infrastructure health, reliability and performance, and livable and sustainable communities. To identify high-payoff, currently under-utilized market-ready technologies, conduct market research to understand critical needs and audience, develop and deliver implementation plans, monitor, document, and openly disseminate results. To implement the results of the Strategic Highway Research Program 2 (SHRP2); which focuses on solving top problems in the areas of highway safety, reliability, capacity, and renewal. To accelerate the implementation and deployment of pavement technologies. Description: Accelerate the delivery and deployment of innovation and technology to shorten project planning and delivery time, accomplish the fast construction of efficient and safe highways and bridges, improve safety during and after construction, reduce recurring and non-recurring congestion, improve freight movement, and enhance the quality of the highway infrastructure. This program shall include but not be limited to innovative technologies, manufacturing practices, construction practices, equipment, processes, operating arrangements, plan reviews, decision-making tools, designs, financing, contracting methods, performance measures, preservation practices, rehabilitation practices, and project delivery practices. This program shall monitor the performance of the innovations, determine effectiveness, document results, and communicate to stakeholders and the public. The program shall include an active program of technology transfer, information dissemination, and outreach to stakeholders and the public. FHWA is working with AASHTO, the States, TRB, and others on the implementation of SHRP2 products. Under SHRP2, the FHWA, in coordination with AASHTO, has identified 65 priority SHRP2 products and has developed and is currently initiating a multi-year implementation plan to jointly deploy those products. This includes incentivizing of products through FHWA’s SHRP2 Implementation Assistance program. For example, the Service Life Design Guide for Bridges, developed as part of SHRP2, may be utilized to provide longer service life by design
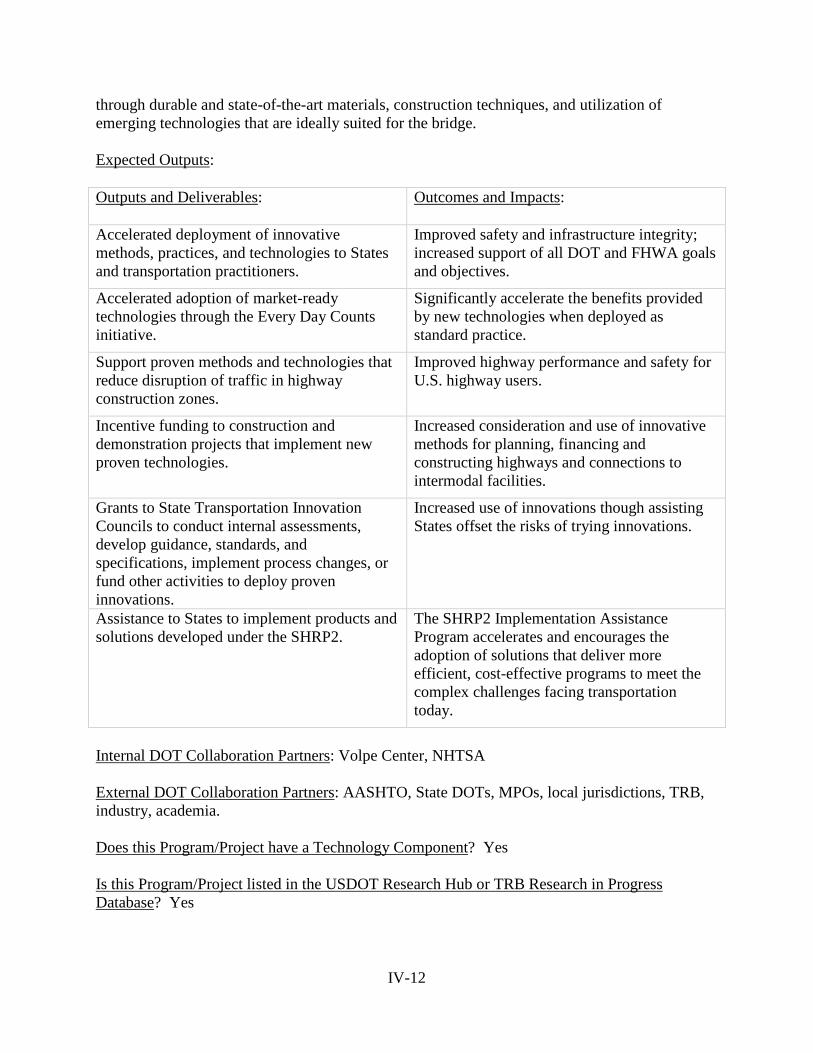
IV-12
through durable and state-of-the-art materials, construction techniques, and utilization of emerging technologies that are ideally suited for the bridge. Expected Outputs: Outputs and Deliverables: Outcomes and Impacts:
Accelerated deployment of innovative methods, practices, and technologies to States and transportation practitioners.
Improved safety and infrastructure integrity; increased support of all DOT and FHWA goals and objectives.
Accelerated adoption of market-ready technologies through the Every Day Counts initiative.
Significantly accelerate the benefits provided by new technologies when deployed as standard practice.
Support proven methods and technologies that reduce disruption of traffic in highway construction zones.
Improved highway performance and safety for U.S. highway users.
Incentive funding to construction and demonstration projects that implement new proven technologies.
Increased consideration and use of innovative methods for planning, financing and constructing highways and connections to intermodal facilities.
Grants to State Transportation Innovation Councils to conduct internal assessments, develop guidance, standards, and specifications, implement process changes, or fund other activities to deploy proven innovations.
Increased use of innovations though assisting States offset the risks of trying innovations.
Assistance to States to implement products and solutions developed under the SHRP2.
The SHRP2 Implementation Assistance Program accelerates and encourages the adoption of solutions that deliver more efficient, cost-effective programs to meet the complex challenges facing transportation today.
Internal DOT Collaboration Partners: Volpe Center, NHTSA External DOT Collaboration Partners: AASHTO, State DOTs, MPOs, local jurisdictions, TRB, industry, academia. Does this Program/Project have a Technology Component? Yes Is this Program/Project listed in the USDOT Research Hub or TRB Research in Progress Database? Yes
IV-13
RT&E PROGRAM NAME: TRAINING AND EDUCATION (T&E) AMOUNT REQUESTED FOR FY 2016: $27,000,000 Objectives: To train the current and future transportation workforce, transferring knowledge quickly and effectively to and among transportation professionals; to foster a safe, efficient, and environmentally sound surface transportation system by improving skills and increasing the knowledge of the transportation workforce and decision makers through training, technology transfer, and information exchange activities. To attract qualified students to the field of transportation education and research, and advance transportation workforce development to help upgrade the scope of knowledge of the entire transportation community in the U.S. Description: Provide leadership, training, educational materials and resources for the development and delivery of training, professional development and education programs to improve the quality of our highway system and its intermodal connections. Provide training, resource materials, and educational opportunities to the surface transportation community to develop both core competencies and new skills, enable technology transfer, and share best practices. Expected Outputs: Outputs and Deliverables: Outcomes and Impacts:
Training resources to customers, partners, and learners in every State.
Improved workforce training.
Information, professional development, training, and facilitate technology transfer to local governments and Tribal agencies.
Advance State, local, and Tribal capabilities regarding the complex relationships in surface transportation.
Scholarships, fellowships, and educational grants.
Advance careers in transportation; build capacity.
Courses and workshops for professionals. Expand and promote transportation knowledge.
Grants to educational pipeline organizations for educational materials and innovative practices in transportation.
A well-educated transportation workforce.
Congressionally-mandated centers for surface transportation excellence to address the areas of environment, surface transportation safety, rural safety, and project finance.
Improved safety, mitigate environmental impacts, and promote project finance options.
IV-14
Internal DOT Collaboration Partners: Local and Tribal Technical Assistance Program Centers. External DOT Collaboration Partners: State DOTs, MPOs and local governments, academia, educational institutions, professional organizations. Does this Program/Project have a Technology Component? Yes Is this Program/Project listed in the USDOT Research Hub or TRB Research in Progress Database? Yes RT&E PROGRAM NAME: STATE PLANNING & RESEARCH (SP&R) AMOUNT REQUESTED FOR FY 2016: $189,839,418 (non-add) Projects – Various Objectives: To solve transportation problems identified by the States. To encourage cooperation among States to leverage funds and conduct research of relevance to multi-State regions. Description: States are required to set aside 2 percent of the apportionments they receive from four of the major Federal-aid apportioned programs authorized in MAP-21 for their State Planning and Research Program. The four core programs are: National Highway Performance Program, Surface Transportation Program, Congestion Mitigation & Air Quality Program, and Highway Safety Improvement Program. At least 25 percent of the total SP&R has to be used for research, development, and technology transfer purposes. Activities involve research on new areas of knowledge, adapting findings to practical applications by developing new technologies, and the transfer of these technologies. Each State must develop, establish, and implement a research program that ensures effective use of available SP&R funds for research and development activities on a statewide basis, and each State may tailor its RT&E program to meet local needs. High priority is given to applied research on Sstate or regional problems, transfer of technologies from researchers to users, and research for setting standards and specifications. Major research and development subject areas include infrastructure renewal (including pavement, structures, and asset management), safety activities, operations and management, environmental, and policy analysis. States can contribute SP&R research funds to cooperative research programs such as the National Cooperative Highway Research Program and transportation pooled fund studies.
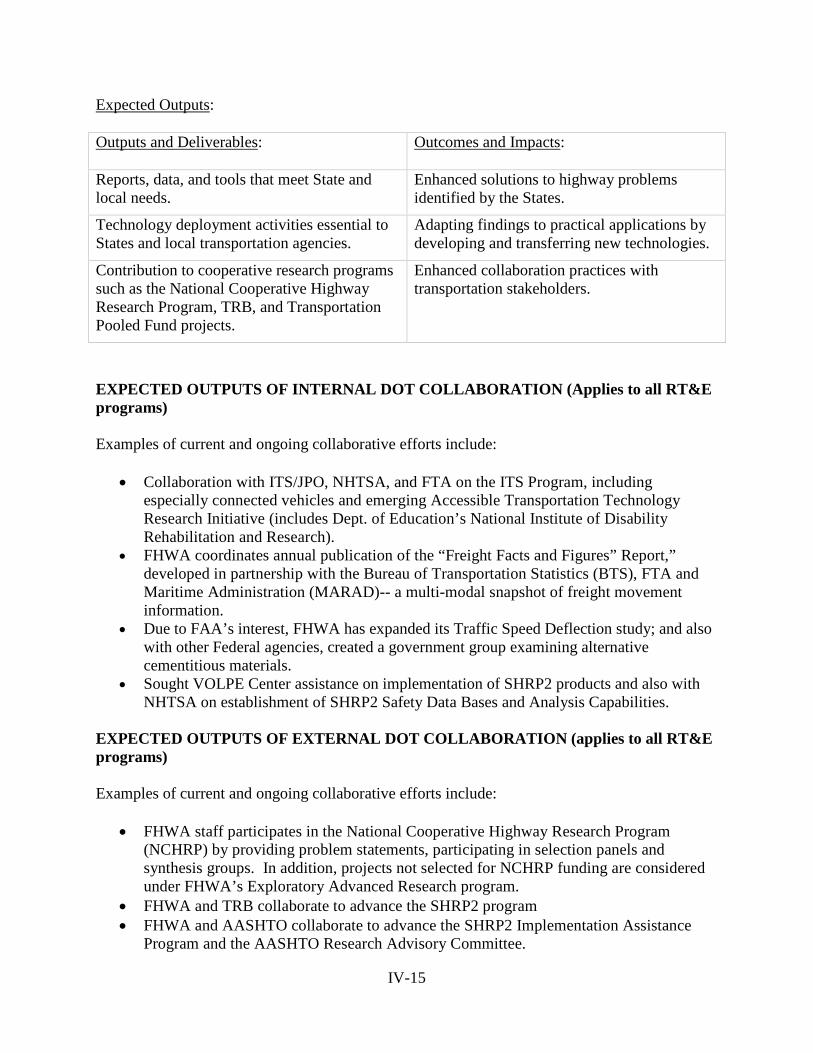
IV-15
Expected Outputs: Outputs and Deliverables: Outcomes and Impacts:
Reports, data, and tools that meet State and local needs.
Enhanced solutions to highway problems identified by the States.
Technology deployment activities essential to States and local transportation agencies.
Adapting findings to practical applications by developing and transferring new technologies.
Contribution to cooperative research programs such as the National Cooperative Highway Research Program, TRB, and Transportation Pooled Fund projects.
Enhanced collaboration practices with transportation stakeholders.
EXPECTED OUTPUTS OF INTERNAL DOT COLLABORATION (Applies to all RT&E programs) Examples of current and ongoing collaborative efforts include:
• Collaboration with ITS/JPO, NHTSA, and FTA on the ITS Program, including especially connected vehicles and emerging Accessible Transportation Technology Research Initiative (includes Dept. of Education’s National Institute of Disability Rehabilitation and Research).
• FHWA coordinates annual publication of the “Freight Facts and Figures” Report,” developed in partnership with the Bureau of Transportation Statistics (BTS), FTA and Maritime Administration (MARAD)-- a multi-modal snapshot of freight movement information.
• Due to FAA’s interest, FHWA has expanded its Traffic Speed Deflection study; and also with other Federal agencies, created a government group examining alternative cementitious materials.
• Sought VOLPE Center assistance on implementation of SHRP2 products and also with NHTSA on establishment of SHRP2 Safety Data Bases and Analysis Capabilities.
EXPECTED OUTPUTS OF EXTERNAL DOT COLLABORATION (applies to all RT&E programs) Examples of current and ongoing collaborative efforts include:
• FHWA staff participates in the National Cooperative Highway Research Program (NCHRP) by providing problem statements, participating in selection panels and synthesis groups. In addition, projects not selected for NCHRP funding are considered under FHWA’s Exploratory Advanced Research program.
• FHWA and TRB collaborate to advance the SHRP2 program • FHWA and AASHTO collaborate to advance the SHRP2 Implementation Assistance
Program and the AASHTO Research Advisory Committee.
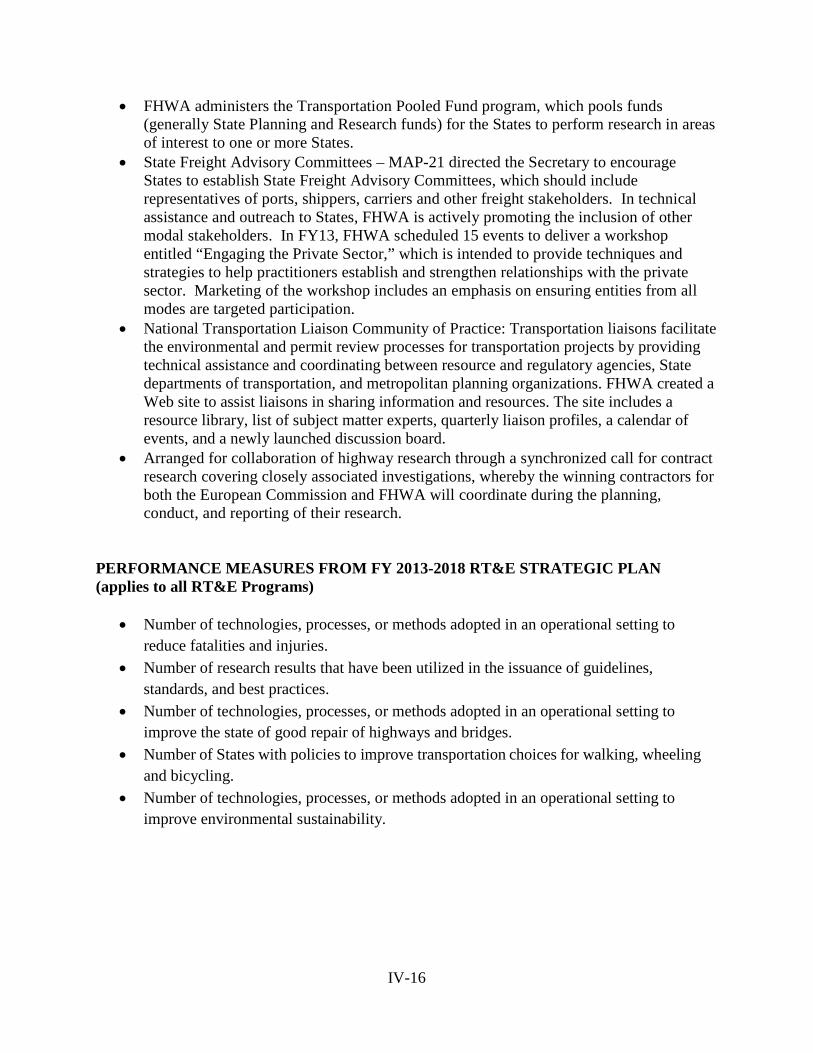
IV-16
• FHWA administers the Transportation Pooled Fund program, which pools funds (generally State Planning and Research funds) for the States to perform research in areas of interest to one or more States.
• State Freight Advisory Committees – MAP-21 directed the Secretary to encourage States to establish State Freight Advisory Committees, which should include representatives of ports, shippers, carriers and other freight stakeholders. In technical assistance and outreach to States, FHWA is actively promoting the inclusion of other modal stakeholders. In FY13, FHWA scheduled 15 events to deliver a workshop entitled “Engaging the Private Sector,” which is intended to provide techniques and strategies to help practitioners establish and strengthen relationships with the private sector. Marketing of the workshop includes an emphasis on ensuring entities from all modes are targeted participation.
• National Transportation Liaison Community of Practice: Transportation liaisons facilitate the environmental and permit review processes for transportation projects by providing technical assistance and coordinating between resource and regulatory agencies, State departments of transportation, and metropolitan planning organizations. FHWA created a Web site to assist liaisons in sharing information and resources. The site includes a resource library, list of subject matter experts, quarterly liaison profiles, a calendar of events, and a newly launched discussion board.
• Arranged for collaboration of highway research through a synchronized call for contract research covering closely associated investigations, whereby the winning contractors for both the European Commission and FHWA will coordinate during the planning, conduct, and reporting of their research.
PERFORMANCE MEASURES FROM FY 2013-2018 RT&E STRATEGIC PLAN (applies to all RT&E Programs)
• Number of technologies, processes, or methods adopted in an operational setting to reduce fatalities and injuries.
• Number of research results that have been utilized in the issuance of guidelines, standards, and best practices.
• Number of technologies, processes, or methods adopted in an operational setting to improve the state of good repair of highways and bridges.
• Number of States with policies to improve transportation choices for walking, wheeling and bicycling.
• Number of technologies, processes, or methods adopted in an operational setting to improve environmental sustainability.
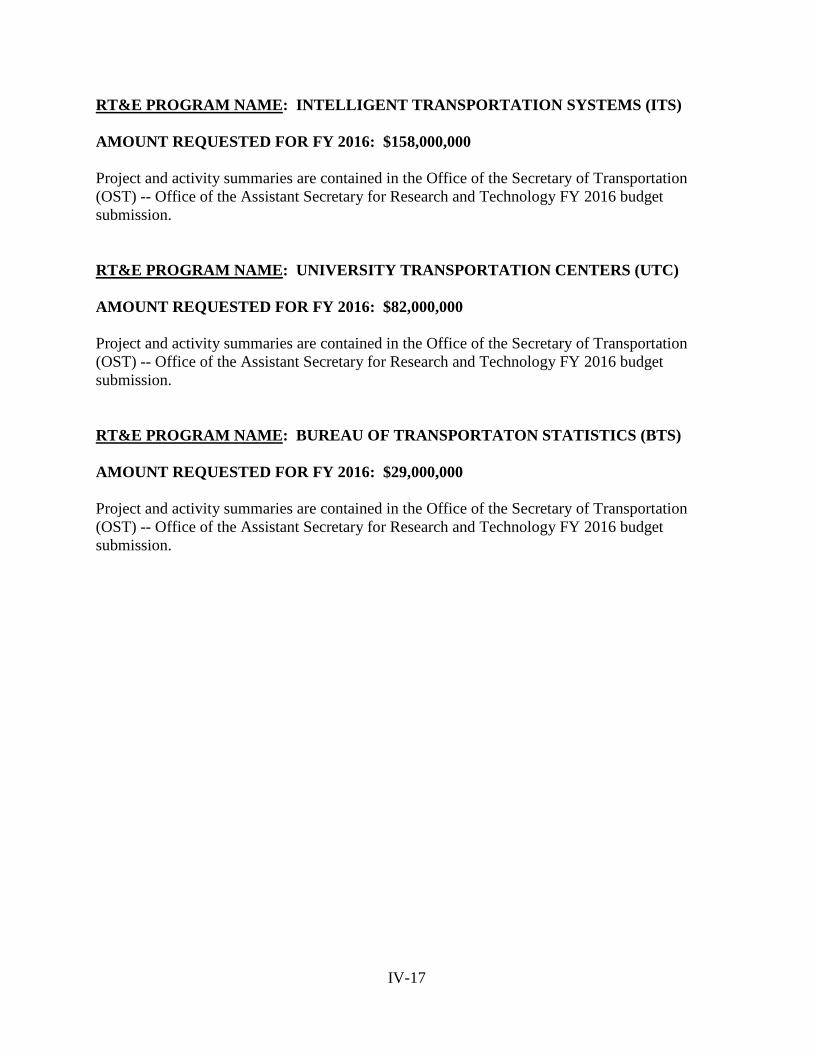
IV-17
RT&E PROGRAM NAME: INTELLIGENT TRANSPORTATION SYSTEMS (ITS) AMOUNT REQUESTED FOR FY 2016: $158,000,000 Project and activity summaries are contained in the Office of the Secretary of Transportation (OST) -- Office of the Assistant Secretary for Research and Technology FY 2016 budget submission. RT&E PROGRAM NAME: UNIVERSITY TRANSPORTATION CENTERS (UTC) AMOUNT REQUESTED FOR FY 2016: $82,000,000 Project and activity summaries are contained in the Office of the Secretary of Transportation (OST) -- Office of the Assistant Secretary for Research and Technology FY 2016 budget submission. RT&E PROGRAM NAME: BUREAU OF TRANSPORTATON STATISTICS (BTS) AMOUNT REQUESTED FOR FY 2016: $29,000,000 Project and activity summaries are contained in the Office of the Secretary of Transportation (OST) -- Office of the Assistant Secretary for Research and Technology FY 2016 budget submission.

IV-18
This Page Left Blank Intentionally