FFY 2013 Part C State Performance Plan (SPP)/Annual ... · FFY 2013 Part C State Performance Plan...
62
ND Part C FFY2013 State Performance Plan / Annual Performance Report FFY 2013 Part C State Performance Plan (SPP)/Annual Performance Report (APR) 8/3/2017 Page 1 of 62
Transcript of FFY 2013 Part C State Performance Plan (SPP)/Annual ... · FFY 2013 Part C State Performance Plan...

NDPart C
FFY2013State Performance Plan /
Annual Performance Report
FFY 2013 Part C State Performance Plan (SPP)/Annual Performance Report (APR)
8/3/2017 Page 1 of 62

Introduction to the State Performance Plan (SPP)/Annual Performance Report (APR)
General Supervision System:
The systems that are in place to ensure that IDEA Part C requirements are met, e.g., monitoring systems, dispute resolution systems.
Since FFY 2010, North Dakota (ND) has been engaged in improving General Supervision, and in doing so,has taken advantage of national technical assistance (TA) resources from a number of entities, as reportedin the past two Annual Performance Reports. To assist with ongoing accountability, the ND InteragencyCoordinating Council established a standing agenda item to review General Supervision activities on aquarterly basis.
Over the past two federal fiscal years, ND Early Intervention staff along with our data staff have reviewed thequeries that we use from our electronic data system to assure that the reports are being generatedconsistently across the years and continue to meet the state's needs to determine state and regionalprogram performance. This work has provided ongoing direction to the regional program on moreconsistent data entry and application of Part C regulations.
Technical Assistance System:
The mechanisms that the State has in place to ensure the timely delivery of high quality, evidenced based technical assistance and support toearly intervention service (EIS) programs.
General Supervision/APR Preparation/SSIP Preparation/Part C Regulation Implementation – DAC/ MPRRC/NECTAC/ ECPC/ ECTA/ ITCA
Date Event
July 2, 2013 TA Call
July 28-31, 2013 Leadership Conference
August 12, 2013 TA Call
August 20, 2013 TA Call
August 29, 2013 TA Call
September 5, 2013 TA Call
September 12, 2013 TA Call
September 15-16, 2013 TA Conference
October 10, 2013 TA Call
November 15, 2013 TA Call
December 2-5, 2013 TA Conference
December 17-19, 2013 On-Site TA with State Team
January 8, 2014 TA Call
February 13, 2014 TA Call
February 20, 2014 TA Call
February 21, 2014 TA Call
March 6, 2014 TA Call
March 10, 2014 TA Call
March 20, 2014 TA Call
March 30-April 2, 2014 TA Conference
May 1, 2014 TA Call
May 6-7, 2013 TA Conference
FFY 2013 Part C State Performance Plan (SPP)/Annual Performance Report (APR)
8/3/2017 Page 2 of 62

May 9, 2014 TA Call
May 16, 2014 TA Call
May 29, 2014 TA Call
June 4-6, 2014 On-Site TA with State Team
June 17, 2014 TA Call
June 27, 2014 TA Call
Professional Development System:
The mechanisms the State has in place to ensure that service providers are effectively providing services that improve results for infantsand toddlers with disabilities and their families.
A bulk of our professional development is provided over PolyCom, the video conferencing system we haveacross the state. We train on a variety of topics determined by the Part C Coordinator and as requested bythe field. We do hold an in-person conference, which has a specific track for Early Intervention, and we trainon a variety of topics. Service Coordinators, Early Intervention providers, Right Track Coordinators andconsultants (which perform our child find activity) are able to attend.
Date Event Topic(s)
August 20, 2013 Video Conference TrainingID ServicesLeadership Conf.Family Survey
October 1-3, 2013 Training Conference Variety of Part C Sessions
October 15, 2013 Video Conference Training Personnel Qualifications
November 19, 2013 Video Conference TrainingEI Core CompetenciesCase Review Tool (Quality
Monitoring)
December 17, 2013 Video Conference TrainingCompetency Assessment
ToolACA update
February 18, 2014 Video Conference Training
Review of 2013/2014 APRData Guidance
Review of the FFY 2012Statewide APR Data
Review of the EI SystemDescription
Review of Referral andIntake Policy/Procedure
Review of GeneralSupervision Policy
Related RequirementsDocument
March 18, 2014 Video Conference TrainingFFY 2014 Data GuidanceFamily Survey
May 19-20, 2014 TA Bootcamp
May 20, 2014 Video Conference Training
ND ChildCare Awarepresentation
Updates to the ND EIWebsite
Update on Experienced
FFY 2013 Part C State Performance Plan (SPP)/Annual Performance Report (APR)
8/3/2017 Page 3 of 62

Parent RFPFamily SurveyUpdate on amended ASD
WaiverReview of changes in Therap
for June rolloutJune 12-13, 2014 TA Bootcamp
Stakeholder Involvement:
The mechanism for soliciting broad stakeholder input on targets in the SPP, including revisions to targets.
The ND Department of Human Services (ND DHS), as the Part C Lead Agency, reviewed all of the indicatordata, as well as set targets for all results indicators, with the ND Interagency Coordinating Council (NDICC)on December 4th, 2014.
Reporting to the Public:
How and where the State reported to the public on the FFY 2012 performance of each EIS Program or Provider located in the State on thetargets in the SPP/APR as soon as practicable, but no later than 120 days following the State’s submission of its FFY 2012 APR, as requiredby 34 CFR §300.602(b)(1)(i)(A); and a description of where, on its Web site, a complete copy of the State’s SPP, including any revision if theState has revised the SPP that it submitted with its FFY 2012 APR in 2014, is available.
The North Dakota Early Intervention website can be found at: www.ndearlyintervention.org. The FFY 2012APR and SPP are posted under the Part C Info tab. The FFY 2012 ND Part C Level of Determination, as wellas the local program Levels of Determination can also be found on the same page.
In addition to the posting on the website, this information is shared with the ND Interagency CoordinatingCouncil, at the meeting following the receipt of the ND Part C Level of Determination. The local programLevels of Determination are also shared with the ND Interagency Coordinating Council at the meeting thattakes place after the local programs have received their determinations and have had the time andopportunity to share any concerns with the Part C Coordinator.
This information is also shared with the Service Coordinators & Early Intervention providers during videoconferencing sessions, either after receipt of the State's level of determination or after the providers havereceived their individual determinations and have had time and opportunity to express concerns with the PartC Coordinator.
OSEP Response
Required Actions
FFY 2013 Part C State Performance Plan (SPP)/Annual Performance Report (APR)
8/3/2017 Page 4 of 62

Indicator 1: Timely provision of services
Baseline Data: 2005
Monitoring Priority: Early Intervention Services In Natural Environments
Compliance indicator: Percent of infants and toddlers with IFSPs who receive the early intervention services on their IFSPs in a timely manner.
(20 U.S.C. 1416(a)(3)(A) and 1442)
Historical Data
FFY 2005 2006 2007 2008 2009 2010 2011 2012
Target 100% 100% 100% 100% 100% 100% 100%
Data 59.26% 98.00% 98.19% 98.50% 92.16% 85.00% 92.70% 94.40%
Key: Gray – Data Prior to Baseline Yellow – Baseline
FFY 2013 - FFY 2018 Targets
FFY 2013 2014 2015 2016 2017 2018
Target 100% 100% 100% 100% 100% 100%
FFY 2013 SPP/APR Data
Prepopulated Data
Source Date Description Data Overwrite Data
SY 2013-14 ChildCount/Educational Environment
Data Groups9/24/2014 Total number of infants and toddlers with IFSPs 1,040 748
Explanation of Alternate Data
The definition for timely initiation of services in North Dakota is the occurrence of those services starting priorto or on the date agreed upon in the IFSP. The alternate data is different from the data provided in GRADS360, because we only consider new services whether on an initial IFSP or subsequent annual IFSP,including periodic reviews. Since the 1,040 was our single point-in-time count from December 2013, not allof those children had new services. Data are collected in our electronic record by our service coordinators.
FFY 2013 SPP/APR Data
Number of infants and toddlers with IFSPswho receive the early intervention services
on their IFSPs in a timely manner
Total number of infants and toddlers withIFSPs
FFY 2012Data*
FFY 2013Target*
FFY 2013Data
636 748 94.40% 100% 94.52%
Number of documented delays attributable to exceptional family circumstances (this number will be added to the Number of infants andtoddlers with IFSPs who receive their early intervention services on their IFSPs in a timely manner)
71
FFY 2013 Part C State Performance Plan (SPP)/Annual Performance Report (APR)
8/3/2017 Page 5 of 62

What is the source of the data provided for this indicator?
State monitoring
State database
Provide the time period in which the data were collected (e.g., September through December, fourth quarter, selectionfrom the full reporting period).
July 1, 2013 through June 30, 2014
Describe how the data accurately reflect data for infants and toddlers with IFSPs for the full reporting period.
Data for Indicator 1 is taken from North Dakota’s state electronic record system, Therap. North Dakotaobtained a full year of data for reporting on Indicator 1, using Therap, for FFY 2013. In FFY 2013, NorthDakota had ten early intervention programs across the state. The performance of all ten of these programsis represented in this data.
Provide additional information about this indicator (optional)
In reviewing the local program data, the majority (seven) of the programs had performance above 90%. Three of those nine programs were at 100%. We had three programs that had performances under 90%. Without these three programs included in the state calculation, North Dakota’s performance would be at97.1%.
Based on the FFY 2013 data, seven programs had noncompliance:
The seven programs that had noncompliance will be issued letters of findings by April 1, 2015. Thestate will continue to track correction of noncompliance until verification is completed according tofederal requirements for Prong 1 and Prong 2.
Actions required in FFY 2012 response table
None
Responses to actions required in FFY 2012 response table, not including correction of findings
Correction of Findings of Noncompliance Identified in FFY 2012
Findings of Noncompliance IdentifiedFindings of Noncompliance Verified
as Corrected Within One YearFindings of Noncompliance
Subsequently CorrectedFindings Not Yet Verified as Corrected
7 7 null 0
FFY 2012 Findings of Noncompliance Verified as Corrected
Describe how the State verified that each LEA with noncompliance is correctly implementing the regulatory requirements
The state issued findings for noncompliance found in FFY 2012 in April 2014 to seven programs.
As of September 5, 2014, seven programs corrected their noncompliance. Verification of the correction
FFY 2013 Part C State Performance Plan (SPP)/Annual Performance Report (APR)
8/3/2017 Page 6 of 62

for the seven findings was made according to OSEP memo 09-02. Specifically, in each instance, theState verified that the EIS programs were correctly implementing the specific regulatory requirements(i.e., achieved 100% compliance) based on a review of updated data, via record review and Stateelectronic record (Prong 2).
Describe how the State verified that each LEA corrected each individual case of noncompliance
The state assured correction of each individual case of noncompliance, except for children who were nolonger within the jurisdiction of the EIS program (Prong 1) based on a review by the regional programadministrators and the state.
OSEP Response
The State provided targets for FFYs 2013 through 2018 for this indicator, and OSEP accepts those targets.
Because the State reported less than 100% compliance for FFY 2013, the State must report on the status of correction of noncompliance identified in FFY 2013 for this indicator.When reporting on the correction of noncompliance, the State must report, in its FFY 2014 APR, that it has verified that each EIS program or provider with noncomplianceidentified in FFY 2013 for this indicator: (1) is correctly implementing the specific regulatory requirements (i.e., achieved 100% compliance) based on a review of updated datasuch as data subsequently collected through on-site monitoring or a State data system; and (2) has corrected each individual case of noncompliance, unless the child is no longerwithin the jurisdiction of the EIS program or provider, consistent with OSEP Memo 09-02. In the FFY 2014 APR, the State must describe the specific actions that were taken toverify the correction.
Required Actions
FFY 2013 Part C State Performance Plan (SPP)/Annual Performance Report (APR)
8/3/2017 Page 7 of 62

Indicator 2: Services in Natural Environments
Baseline Data: 2005
Monitoring Priority: Early Intervention Services In Natural Environments
Results indicator: Percent of infants and toddlers with IFSPs who primarily receive early intervention services in the home or community-based settings.
(20 U.S.C. 1416(a)(3)(A) and 1442)
Historical Data
FFY 2005 2006 2007 2008 2009 2010 2011 2012
Target ≥ 96.40% 96.50% 96.60% 96.80% 97.00% 97.20% 97.40%
Data 98.26% 92.70% 94.30% 99.30% 97.91% 99.25% 99.02% 99.68%
Key: Gray – Data Prior to Baseline Yellow – Baseline
FFY 2013 - FFY 2018 Targets
FFY 2013 2014 2015 2016 2017 2018
Target ≥ 99.30% 99.30% 99.30% 99.30% 99.30% 99.70%
Targets: Description of Stakeholder Input
The North Dakota Department of Human Services (ND DHS), as the Part C Lead Agency, along with ourstakeholders, the North Dakota Interagency Coordinating Council (NDICC), reviewed the trend andperformance data for the previous 3 years for all the results indicators to set targets for FFY 2013-2018 onDecember 4th, 2014.
Prepopulated Data
Source Date Description Data Overwrite Data
SY 2013-14 ChildCount/Educational Environment
Data Groups9/24/2014
Number of infants and toddlers with IFSPs who primarily receive earlyintervention services in the home or community-based settings
1,037
SY 2013-14 ChildCount/Educational Environment
Data Groups9/24/2014 Total number of infants and toddlers with IFSPs 1,040
FFY 2013 SPP/APR Data
Number of infants and toddlers withIFSPs who primarily receive early
intervention services in the home orcommunity-based settings
Total number of infants andtoddlers with IFSPs
FFY 2012Data*
FFY 2013Target*
FFY 2013Data
1,037 1,040 99.68% 99.30% 99.71%
Provide additional information about this indicator (optional)
There were one thousand and forty (1040) children in FFY 2013 child count. One thousand and twenty two
FFY 2013 Part C State Performance Plan (SPP)/Annual Performance Report (APR)
8/3/2017 Page 8 of 62

(1022) children primarily received services in home + fifteen (15) children primarily received services incommunity = 1037 children
99.71% = (1037/1040) X 100
This exceeded the state target of 99.30%.
Table 2 of 618 indicated 1022 children primarily received early intervention services in their home. Fifteen(15) children primarily received early intervention services in community based settings for typicallydeveloping peers. Three (3) children primarily received early intervention services in “other” settings that arenot designed for typically developing peers. There were a total of one thousand and forty (1040) childrenreported on the 618 table on 12/01/2013.
Actions required in FFY 2012 response table
None
Responses to actions required in FFY 2012 response table
OSEP Response
The State provided targets for FFYs 2013 through 2018 for this indicator, and OSEP accepts those targets.
Required Actions
FFY 2013 Part C State Performance Plan (SPP)/Annual Performance Report (APR)
8/3/2017 Page 9 of 62

Indicator 3: Early Childhood Outcomes
Monitoring Priority: Early Intervention Services In Natural Environments
Results indicator: Percent of infants and toddlers with IFSPs who demonstrate improved:
Positive social-emotional skills (including social relationships);A.Acquisition and use of knowledge and skills (including early language/ communication); andB.Use of appropriate behaviors to meet their needs.C.
(20 U.S.C. 1416(a)(3)(A) and 1442)
Historical Data
Baseline Year FFY 2005 2006 2007 2008 2009 2010 2011 2012
A1 2008Target ≥ 34.00% 34.50% 34.60% 34.70%
Data 33.30% 34.50% 31.20% 35.80% 37.70%
A2 2008Target ≥ 61.00% 61.50% 61.60% 61.70%
Data 60.30% 55.20% 34.10% 39.70% 44.60%
B1 2008Target ≥ 48.00% 48.50% 48.60% 48.70%
Data 47.50% 42.30% 41.60% 56.70% 61.10%
B2 2008Target ≥ 52.50% 53.00% 53.10% 53.20%
Data 52.00% 46.00% 32.50% 37.00% 46.20%
C1 2008Target ≥ 65.00% 65.50% 65.60% 65.70%
Data 64.80% 56.70% 55.00% 58.80% 67.42%
C2 2008Target ≥ 81.50% 82.00% 82.10% 82.20%
Data 80.90% 66.50% 55.30% 61.10% 67.90%
Key: Gray – Data Prior to Baseline Yellow – Baseline
FFY 2013 - FFY 2018 Targets
FFY 2013 2014 2015 2016 2017 2018
Target A1 ≥ 37.70% 37.80% 37.90% 38.00% 39.10% 39.20%
Target A2 ≥ 44.70% 44.80% 44.90% 45.00% 45.10% 60.40%
Target B1 ≥ 61.10% 61.20% 61.30% 61.40% 61.50% 62.50%
Target B2 ≥ 46.20% 46.30% 46.40% 46.50% 46.60% 52.10%
Target C1 ≥ 67.40% 67.50% 67.60% 67.70% 67.80% 68.80%
Target C2 ≥ 67.90% 68.00% 68.10% 68.20% 68.30% 81.00%
Targets: Description of Stakeholder Input
The North Dakota Department of Human Services (ND DHS), as the Part C Lead Agency, along with ourstakeholders, the North Dakota Interagency Coordinating Council (NDICC), reviewed the trend andperformance data for the previous 3 years for all the results indicators to set targets for FFY 2013-2018 onDecember 4th, 2014.
FFY 2013 SPP/APR Data
FFY 2013 Part C State Performance Plan (SPP)/Annual Performance Report (APR)
8/3/2017 Page 10 of 62

Number of infants and toddlers with IFSPs assessed 335
Does the State’s Part C eligibility criteria include infants and toddlers who are at risk of having substantial developmentaldelays (or “at-risk infants and toddlers”) under IDEA section 632(5)(B)(i)? No
Outcome A: Positive social-emotional skills (including social relationships)
Number ofChildren
a. Infants and toddlers who did not improve functioning 12
b. Infants and toddlers who improved functioning but not sufficient to move nearer to functioning comparable to same-aged peers 128
c. Infants and toddlers who improved functioning to a level nearer to same-aged peers but did not reach it 44
d. Infants and toddlers who improved functioning to reach a level comparable to same-aged peers 42
e. Infants and toddlers who maintained functioning at a level comparable to same-aged peers 109
Numerator DenominatorFFY 2012
Data*FFY 2013Target*
FFY 2013Data
A1. Of those children who entered or exited theprogram below age expectations in Outcome A, the
percent who substantially increased their rate of growthby the time they turned 3 years of age or exited the
program (c+d)/(a+b+c+d).
86 226 37.70% 37.70% 38.05%
A2. The percent of infants and toddlers who werefunctioning within age expectations in Outcome A by
the time they turned 3 years of age or exited theprogram (d+e)/(a+b+c+d+e).
151 335 44.60% 44.70% 45.07%
Outcome B. Acquisition and use of knowledge and skills (including early language/ communication)
Number ofChildren
a. Infants and toddlers who did not improve functioning 7
b. Infants and toddlers who improved functioning but not sufficient to move nearer to functioning comparable to same-aged peers 106
c. Infants and toddlers who improved functioning to a level nearer to same-aged peers but did not reach it 74
d. Infants and toddlers who improved functioning to reach a level comparable to same-aged peers 89
e. Infants and toddlers who maintained functioning at a level comparable to same-aged peers 59
Numerator DenominatorFFY 2012
Data*FFY 2013Target*
FFY 2013Data
B1. Of those children who entered or exited theprogram below age expectations in Outcome B, the
percent who substantially increased their rate of growthby the time they turned 3 years of age or exited the
program (c+d)/(a+b+c+d).
163 276 61.10% 61.10% 59.06%
B2. The percent of infants and toddlers who werefunctioning within age expectations in Outcome B by
the time they turned 3 years of age or exited theprogram (d+e)/(a+b+c+d+e).
148 335 46.20% 46.20% 44.18%
Explanation of B1 Slippage
North Dakota’s percentages demonstrated slippage for B1 in FFY 2013. North Dakota’s performance wasbelow our state target of 61.10% in summary statement B1 falling from 61.10% in FFY 2012 to 59.06% in FFY2013. North Dakota is engaged in data analysis activities on this indicator to determine why the slippage
FFY 2013 Part C State Performance Plan (SPP)/Annual Performance Report (APR)
8/3/2017 Page 11 of 62
occurred and what strategies will assist in improving performance on this indicator. Four of ten regionalprograms decreased in their B1 percentage in FFY 2013.
The current tool, which was originally developed out of the state of Oregon, has not sustained continueddevelopment and is outdated. On December 8, 2011, North Dakota addressed the issue with the NorthDakota Interagency Coordinator Council (NDICC) and the members endorsed the need to pursue newmeasurement tools. In October 2012, North Dakota’s Part C Coordinator met with Lynne Kahn of the ECOCenter to discuss the state’s transition to a new tool. The state has identified the need for a new tool as atop priority & will be taking the necessary steps to identify the best option & begin transitioning to a new tool. This will allow service providers to be trained to fidelity, and the state will have better access to timely, valid &reliable data.
Explanation of B2 Slippage
North Dakota’s percentages demonstrated slippage for B2 in FFY 2013. North Dakota’s performance wasbelow our state target of 46.20% in summary statement B2 falling from 46.20% in FFY 2012 to 44.18% in FFY2013. North Dakota is engaged in data analysis activities on this indicator to determine why the slippageoccurred and what strategies will assist in improving performance on this indicator. Six of ten regionalprograms decreased in their B2 percentage in FFY 2013.
The current tool, which was originally developed out of the state of Oregon, has not sustained continueddevelopment and is outdated. On December 8, 2011, North Dakota addressed the issue with the NorthDakota Interagency Coordinator Council (NDICC) and the members endorsed the need to pursue newmeasurement tools. In October 2012, North Dakota’s Part C Coordinator met with Lynne Kahn of the ECOCenter to discuss the state’s transition to a new tool. The state has identified the need for a new tool as a toppriority and will be taking the necessary steps to identify the best option and begin transitioning to a new tool.This will allow service providers to be trained to fidelity, and the state will have better access to timely, valid,and reliable data.
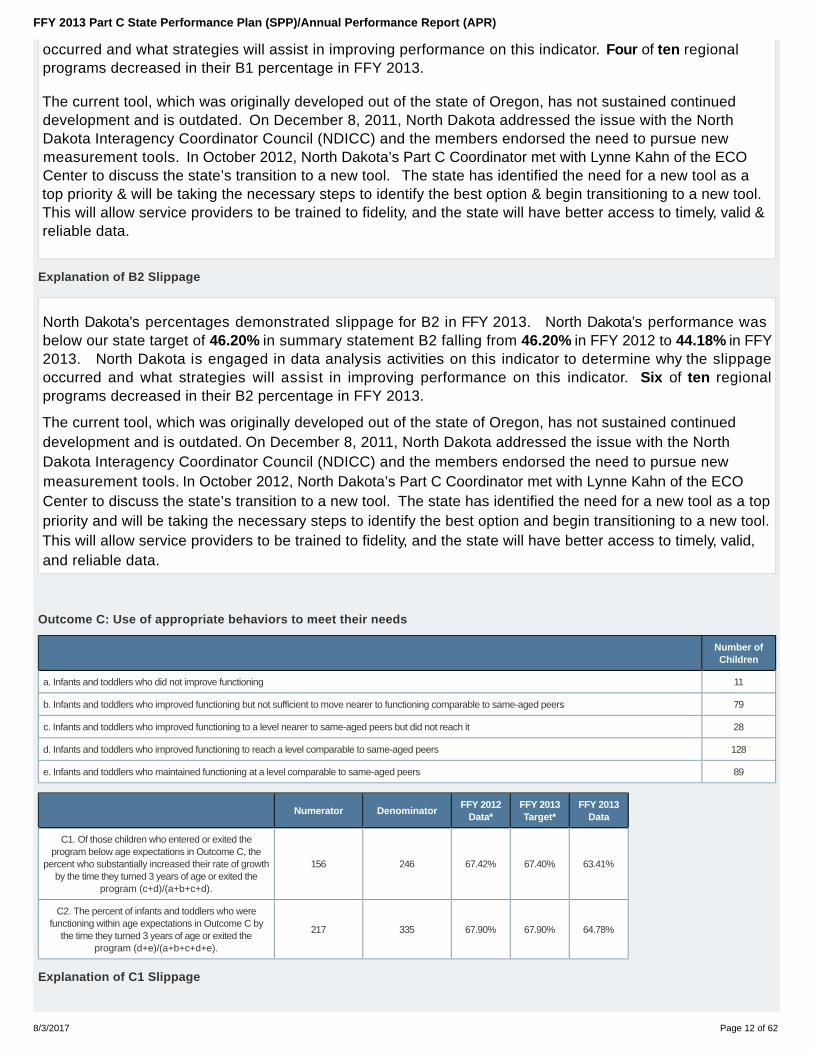
Outcome C: Use of appropriate behaviors to meet their needs
Number ofChildren
a. Infants and toddlers who did not improve functioning 11
b. Infants and toddlers who improved functioning but not sufficient to move nearer to functioning comparable to same-aged peers 79
c. Infants and toddlers who improved functioning to a level nearer to same-aged peers but did not reach it 28
d. Infants and toddlers who improved functioning to reach a level comparable to same-aged peers 128
e. Infants and toddlers who maintained functioning at a level comparable to same-aged peers 89
Numerator DenominatorFFY 2012
Data*FFY 2013Target*
FFY 2013Data
C1. Of those children who entered or exited theprogram below age expectations in Outcome C, the
percent who substantially increased their rate of growthby the time they turned 3 years of age or exited the
program (c+d)/(a+b+c+d).
156 246 67.42% 67.40% 63.41%
C2. The percent of infants and toddlers who werefunctioning within age expectations in Outcome C by
the time they turned 3 years of age or exited theprogram (d+e)/(a+b+c+d+e).
217 335 67.90% 67.90% 64.78%
Explanation of C1 Slippage
FFY 2013 Part C State Performance Plan (SPP)/Annual Performance Report (APR)
8/3/2017 Page 12 of 62

North Dakota’s percentages demonstrated slippage for C1 in FFY 2013. North Dakota’s performance wasbelow our state target of 67.40% in summary statement C1 falling from 67.42% in FFY 2012 to 63.41% in FFY2013. North Dakota is engaged in data analysis activities on this indicator to determine why the slippageoccurred and what strategies will assist in improving performance on this indicator. Seven of ten regionalprograms decreased in their C1 percentage in FFY 2013.
The current tool, which was originally developed out of the state of Oregon, has not sustained continueddevelopment and is outdated. On December 8, 2011, North Dakota addressed the issue with the NorthDakota Interagency Coordinator Council (NDICC) and the members endorsed the need to pursue newmeasurement tools. In October 2012, North Dakota’s Part C Coordinator met with Lynne Kahn of the ECOCenter to discuss the state’s transition to a new tool. The state has identified the need for a new tool as atop priority & will be taking the necessary steps to identify the best option & begin transitioning to a new tool.This will allow service providers to be trained to fidelity, and the state will have better access to timely, valid &reliable data.
Explanation of C2 Slippage
North Dakota’s percentages demonstrated slippage for C2 in FFY 2013. North Dakota’s performance wasbelow our state target of 67.90% in summary statement C2 falling from 67.90% in FFY 2012 to 64.78% in FFY2013. North Dakota is engaged in data analysis activities on this indicator to determine why the slippageoccurred and what strategies will assist in improving performance on this indicator. Seven of ten regionalprograms decreased in their C2 percentage in FFY 2013.
The current tool, which was originally developed out of the state of Oregon, has not sustained continueddevelopment and is outdated. On December 8, 2011, North Dakota addressed the issue with the NorthDakota Interagency Coordinator Council (NDICC) and the members endorsed the need to pursue newmeasurement tools. In October 2012, North Dakota’s Part C Coordinator met with Lynne Kahn of the ECOCenter to discuss the state’s transition to a new tool. The state has identified the need for a new tool as a toppriority & will be taking the necessary steps to identify the best option & begin transitioning to a new tool. Thiswill allow service providers to be trained to fidelity, and the state will have better access to timely, valid &reliable data.
Was sampling used? No
Did you use the Early Childhood Outcomes Center (ECO) Child Outcomes Summary Form (COSF)? No
Provide the criteria for defining “comparable to same-aged peers” and list the instruments and procedures used to gatherdata for this indicator.
The tool utilized in North Dakota to measure this indicator was developed by the Oregon Department ofEducation and Portland State University through a grant from OSEP. Cut off points received from PortlandState University are used to compare children at entry and exit with same age peers across 16 foundationareas. The foundations are then mapped to the three outcomes areas addressed in this indicator.
North Dakota uses the Oregon Early Childhood Assessment as the assessment tool for child outcome data.The tool is currently embedded into North Dakota’s electronic data system (Therap) and entry occurs online.The Service Coordinator (DDPM) is responsible to ensure completion of the tool by local Infant Developmentproviders. Initial child outcome assessment (also known as Child PAR) is completed and entered into thedata system by the Infant Development provider, and activated by the Service Coordinator (DDPM) within 30calendar days of the initial IFSP meeting date. Exit child outcome assessments are activated by the ServiceCoordinator (DDPM) no later than the day the child turns 3 or exits services. The assessment cannot be
FFY 2013 Part C State Performance Plan (SPP)/Annual Performance Report (APR)
8/3/2017 Page 13 of 62

completed earlier than 30 calendar days prior to the child’s 3rd birthday or exiting services.
The current tool, which was originally developed out of the state of Oregon, has not sustained continueddevelopment and is outdated. On December 8, 2011, North Dakota addressed the issue with the NorthDakota Interagency Coordinator Council (NDICC) and the members endorsed the need to pursue newmeasurement tools. In October 2012, North Dakota’s Part C coordinator met with Lynne Kahn of the ECOCenter to discuss the state’s transition to a new tool. The state has identified the need for a new tool as atop priority & will be taking the necessary steps to identify the best option & begin transitioning to a new tool.This will allow service providers to be trained to fidelity, and the state will have better access to timely, valid &reliable data.
Actions required in FFY 2012 response table
The State must report progress data and actual target data for FFY 2013 in the FFY 2013 APR.
Responses to actions required in FFY 2012 response table
OSEP Response
The State provided targets for FFYs 2013 through 2018 for this indicator, and OSEP accepts those targets.
Required Actions
FFY 2013 Part C State Performance Plan (SPP)/Annual Performance Report (APR)
8/3/2017 Page 14 of 62

Indicator 4: Family Involvement
Monitoring Priority: Early Intervention Services In Natural Environments
Results indicator: Percent of families participating in Part C who report that early intervention services have helped the family:
Know their rights;A.Effectively communicate their children's needs; andB.Help their children develop and learn.C.
(20 U.S.C. 1416(a)(3)(A) and 1442)
Historical Data
Baseline Year FFY 2005 2006 2007 2008 2009 2010 2011 2012
A 2006Target ≥ 86.00% 86.50% 87.00% 87.20% 87.40%
Data 88.12% 89.14% 88.00% 90.00% 90.00% 88.00% 86.92%
B 2006Target ≥ 90.00% 90.50% 91.00% 91.20% 91.40%
Data 88.46% 92.10% 91.00% 90.00% 92.00% 94.00% 92.99%
C 2006Target ≥ 88.00% 88.50% 89.00% 89.20% 89.40%
Data 85.79% 89.80% 90.00% 92.00% 92.00% 90.00% 91.59%
Key: Gray – Data Prior to Baseline Yellow – Baseline
FFY 2013 - FFY 2018 Targets
FFY 2013 2014 2015 2016 2017 2018
Target A ≥ 87.40% 87.50% 87.60% 87.70% 87.80% 88.20%
Target B ≥ 93.00% 93.10% 93.20% 93.30% 93.40% 94.00%
Target C ≥ 91.60% 91.70% 91.80% 91.90% 92.00% 92.60%
Targets: Description of Stakeholder Input
The North Dakota Department of Human Services (ND DHS), as the Part C Lead Agency, along with our stakeholders, the NorthDakota Interagency Coordinating Council (NDICC), reviewed the trend and performance data for the previous 3 years for all theresults indicators to set targets for FFY 2013-2018 on December 4th, 2014.
FFY 2013 SPP/APR Data
Number of respondent families participating in Part C 300
A1. Number of respondent families participating in Part C who report that early intervention services have helped the family know their rights 297
A2. Number of responses to the question of whether early intervention services have helped the family know their rights 300
B1. Number of respondent families participating in Part C who report that early intervention services have helped the family effectively communicate their children's needs 298
B2. Number of responses to the question of whether early intervention services have helped the family effectively communicate their children's needs 300
C1. Number of respondent families participating in Part C who report that early intervention services have helped the family help their children develop and learn 296
C2. Number of responses to the question of whether early intervention services have helped the family help their children develop and learn 300
FFY 2012Data*
FFY 2013Target*
FFY 2013Data
A. Percent of families participating in Part C who report that early intervention services have helped the family knowtheir rights
86.92% 87.40% 99.00%
B. Percent of families participating in Part C who report that early intervention services have helped the familyeffectively communicate their children's needs
92.99% 93.00% 99.33%
C. Percent of families participating in Part C who report that early intervention services have helped the family helptheir children develop and learn
91.59% 91.60% 98.67%
Describe how the State has ensured that any response data are valid and reliable, including how the data represent the demographics of the
FFY 2013 Part C State Performance Plan (SPP)/Annual Performance Report (APR)
8/3/2017 Page 15 of 62

State.
Each year in North Dakota, a Family Outcomes Survey is delivered to every family that has a child or children in North Dakota EarlyIntervention for at least six months. In FFY 2013, the survey methodology was updated with the goal of increasing participationand demographic representation. A survey was hand-delivered by the Service Coordinator (DDPM) to every family who had anannual IFSP or Periodic Review meeting between April 1, 2014, to September 30, 2014, in a self-addressed stampedenvelope. The annual IFSP meeting and Periodic Review meetings were chosen during that time frame because all familieswould have had a required meeting during the time frame offering the opportunity for the survey to be hand-delivered.
The ECO Family Outcomes Survey-Revised (FOS-R) was used, and it included a cover letter and newsletter with the FFY 2012results and information. The family could self report their Regional Human Service Center and Race/Ethnicity. Families couldchoose to complete the survey at the IFSP meeting/Periodic Review and hand it back to the Service Coordinator, or complete thesurvey at a later date and mail it back to the Regional Human Service Center. At the end of the collection period, all surveys werereturned to the Part C Coordinator's office to be scanned for data collection. The survey was made into a document that can bescanned for ease of analysis.
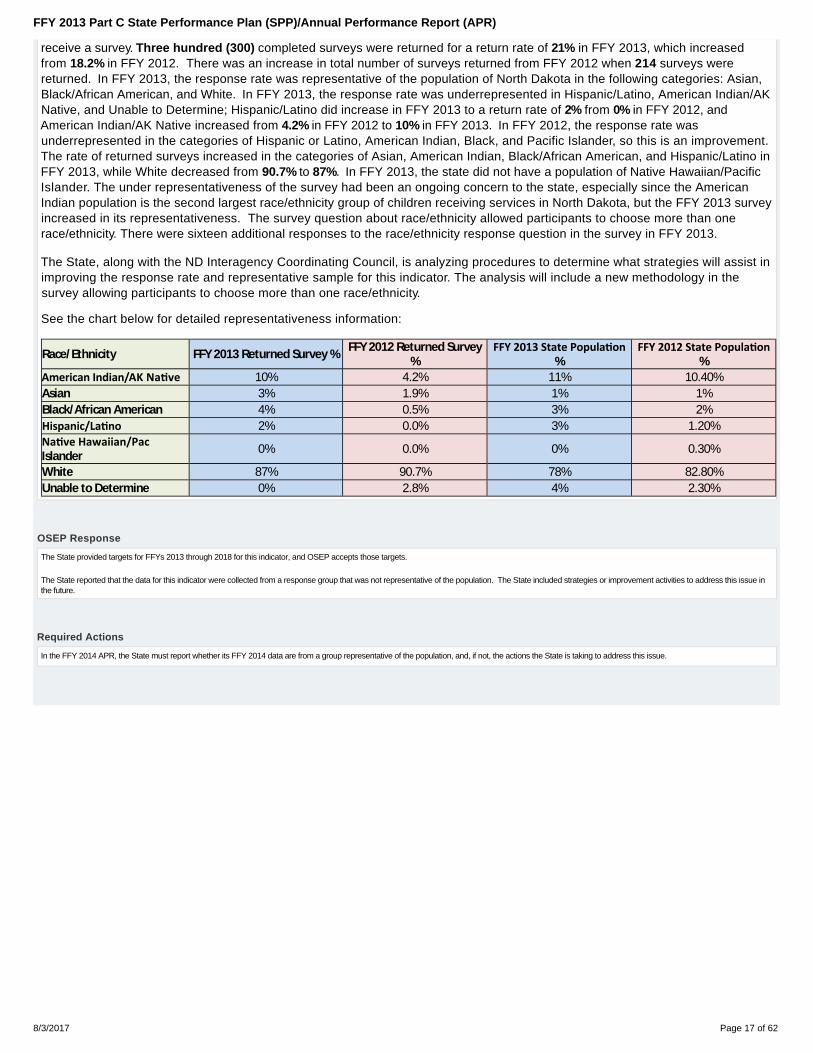
Based on the electronic record, there were 1435 families, whose child was in services at least six months and therefore eligible toreceive a survey. Three hundred (300) completed surveys were returned for a return rate of 21% in FFY 2013, which increasedfrom 18.2% in FFY 2012. There was an increase in total number of surveys returned from FFY 2012 when 214 surveys werereturned. In FFY 2013, the response rate was representative of the population of North Dakota in the following categories: Asian,Black/African American, and White. In FFY 2013, the response rate was underrepresented in Hispanic/Latino, American Indian/AKNative, and Unable to Determine; Hispanic/Latino did increase in FFY 2013 to a return rate of 2% from 0% in FFY 2012, andAmerican Indian/AK Native increased from 4.2% in FFY 2012 to 10% in FFY 2013. In FFY 2012, the response rate wasunderrepresented in the categories of Hispanic or Latino, American Indian, Black, and Pacific Islander, so this is an improvement.The rate of returned surveys increased in the categories of Asian, American Indian, Black/African American, and Hispanic/Latino inFFY 2013, while White decreased from 90.7% to 87%. In FFY 2013, the state did not have a population of Native Hawaiian/PacificIslander. The under representativeness of the survey had been an ongoing concern to the state, especially since the AmericanIndian population is the second largest race/ethnicity group of children receiving services in North Dakota, but the FFY 2013 surveyincreased in its representativeness. The survey question about race/ethnicity allowed participants to choose more than onerace/ethnicity. There were sixteen additional responses to the race/ethnicity response question in the survey in FFY 2013. See thechart below for detailed representativeness information:
Race/Ethnicity Returned SurveyEthnicity Response # Returned Survey % State Total # State Popula on %
American Indian/AK Na ve 30 10% 153 11%Asian 8 3% 13 1%Black/African American 11 4% 43 3%Hispanic/La no 6 2% 36 3%Na ve Hawaiian/PacIslander 0 0% 0 0%
White 261 87% 1126 78%Unable to Determine 0 0% 64 4%Total 316 1435
Was sampling used? No
Was a collection tool used? Yes
Is it a new or revised collection tool? Yes
Yes, the data accurately represent the demographics of the State
No, the data does not accurately represent the demographics of the State
Submitted collection tool: ND Family Outcomes Survey FFY 2013
Actions required in FFY 2012 response table
In the FFY 2013 APR, the State must report whether its FFY 2013 data are from a group representative of the population, and, if not, the actions the State is taking to address this issue.
Responses to actions required in FFY 2012 response table, not including correction of findings
Based on the electronic record, there were 1435 families, whose child was in services at least six months and therefore eligible to
FFY 2013 Part C State Performance Plan (SPP)/Annual Performance Report (APR)
8/3/2017 Page 16 of 62
receive a survey. Three hundred (300) completed surveys were returned for a return rate of 21% in FFY 2013, which increasedfrom 18.2% in FFY 2012. There was an increase in total number of surveys returned from FFY 2012 when 214 surveys werereturned. In FFY 2013, the response rate was representative of the population of North Dakota in the following categories: Asian,Black/African American, and White. In FFY 2013, the response rate was underrepresented in Hispanic/Latino, American Indian/AKNative, and Unable to Determine; Hispanic/Latino did increase in FFY 2013 to a return rate of 2% from 0% in FFY 2012, andAmerican Indian/AK Native increased from 4.2% in FFY 2012 to 10% in FFY 2013. In FFY 2012, the response rate wasunderrepresented in the categories of Hispanic or Latino, American Indian, Black, and Pacific Islander, so this is an improvement.The rate of returned surveys increased in the categories of Asian, American Indian, Black/African American, and Hispanic/Latino inFFY 2013, while White decreased from 90.7% to 87%. In FFY 2013, the state did not have a population of Native Hawaiian/PacificIslander. The under representativeness of the survey had been an ongoing concern to the state, especially since the AmericanIndian population is the second largest race/ethnicity group of children receiving services in North Dakota, but the FFY 2013 surveyincreased in its representativeness. The survey question about race/ethnicity allowed participants to choose more than onerace/ethnicity. There were sixteen additional responses to the race/ethnicity response question in the survey in FFY 2013.
The State, along with the ND Interagency Coordinating Council, is analyzing procedures to determine what strategies will assist inimproving the response rate and representative sample for this indicator. The analysis will include a new methodology in thesurvey allowing participants to choose more than one race/ethnicity.
See the chart below for detailed representativeness information:
Race/Ethnicity FFY 2013 Returned Survey % FFY 2012 Returned Survey%
FFY 2013 State Popula on%
FFY 2012 State Popula on%
American Indian/AK Na ve 10% 4.2% 11% 10.40%Asian 3% 1.9% 1% 1%Black/African American 4% 0.5% 3% 2%Hispanic/La no 2% 0.0% 3% 1.20%Na ve Hawaiian/PacIslander 0% 0.0% 0% 0.30%
White 87% 90.7% 78% 82.80%Unable to Determine 0% 2.8% 4% 2.30%
OSEP Response
The State provided targets for FFYs 2013 through 2018 for this indicator, and OSEP accepts those targets.
The State reported that the data for this indicator were collected from a response group that was not representative of the population. The State included strategies or improvement activities to address this issue inthe future.
Required Actions
In the FFY 2014 APR, the State must report whether its FFY 2014 data are from a group representative of the population, and, if not, the actions the State is taking to address this issue.
FFY 2013 Part C State Performance Plan (SPP)/Annual Performance Report (APR)
8/3/2017 Page 17 of 62

Indicator 5: Child Find (Birth to One)
Baseline Data: 2005
Monitoring Priority: Effective General Supervision Part C / Child Find
Results indicator: Percent of infants and toddlers birth to 1 with IFSPs compared to national data.
(20 U.S.C. 1416(a)(3)(B) and 1442)
Historical Data
FFY 2005 2006 2007 2008 2009 2010 2011 2012
Target ≥ 1.78% 1.81% 1.84% 1.87% 1.90% 1.93% 1.96%
Data 1.58% 1.92% 2.12% 1.99% 1.95% 2.14% 1.62% 1.98%
Key: Gray – Data Prior to Baseline Yellow – Baseline
FFY 2013 - FFY 2018 Targets
FFY 2013 2014 2015 2016 2017 2018
Target ≥ 2.00% 2.00% 2.00% 2.00% 2.10% 2.20%
Targets: Description of Stakeholder Input
The North Dakota Department of Human Services (ND DHS), as the Part C Lead Agency, along with ourstakeholders, the North Dakota Interagency Coordinating Council (NDICC), reviewed the trend andperformance data for the previous 3 years for all the results indicators to set targets for FFY 2013-2018 onDecember 4th, 2014.
Prepopulated Data
Source Date Description Data Overwrite Data
SY 2013-14 ChildCount/Educational Environment
Data Groups9/24/2014 Number of infants and toddlers birth to 1 with IFSPs 188 null
U.S. Census Annual StateResident Population Estimates
April 1, 2010 to July 1, 201312/16/2014 Population of infants and toddlers birth to 1 10,088 null
FFY 2013 SPP/APR Data
Number of infants and toddlers birth to 1with IFSPs
Population of infants andtoddlers birth to 1
FFY 2012Data*
FFY 2013Target*
FFY 2013Data
188 10,088 1.98% 2.00% 1.86%
Explanation of Slippage
North Dakota is engaged in data analysis activities on this indicator to determine why the slippage occurredand what strategies will assist in improving performance on this indicator. Three regions had fewer childrenenrolled with IFSP's from birth to 1 year of age. One region stayed the same. Five regions increased thenumber of children birth to one with IFSP's . The total number of children birth to one years with an IFSP
FFY 2013 Part C State Performance Plan (SPP)/Annual Performance Report (APR)
8/3/2017 Page 18 of 62

actually increased from 181 to 188. However, the poplulation of children birth to one increased from 9,122 to10,088.
Provide additional information about this indicator (optional)
On December 1, 2013 there were 188 children birth to 12 months of age with IFSP’s. The number served isfrom Table 1 (618 data). The total North Dakota population of children birth to 12 months of age is 10,088from US Census 2013 data as reflected in Table C1-9.
1.86% = (188/10088 X 100).
The national average for FFY 2013 is 1.26%. Compared to other states, North Dakota ranks 8th overallaccording to table C1-9. North Dakota exceeded the national average of 1.26%.
Actions required in FFY 2012 response table
None
Responses to actions required in FFY 2012 response table
OSEP Response
The State provided targets for FFYs 2013 through 2018 for this indicator, and OSEP accepts those targets.
Required Actions
FFY 2013 Part C State Performance Plan (SPP)/Annual Performance Report (APR)
8/3/2017 Page 19 of 62

Indicator 6: Child Find (Birth to Three)
Baseline Data: 2005
Monitoring Priority: Effective General Supervision Part C / Child Find
Results indicator: Percent of infants and toddlers birth to 3 with IFSPs compared to national data.
(20 U.S.C. 1416(a)(3)(B) and 1442)
Historical Data
FFY 2005 2006 2007 2008 2009 2010 2011 2012
Target ≥ 2.98% 3.07% 3.16% 3.25% 3.28% 3.30% 3.40%
Data 3.02% 3.11% 3.29% 3.58% 3.39% 3.44% 3.41% 3.43%
Key: Gray – Data Prior to Baseline Yellow – Baseline
FFY 2013 - FFY 2018 Targets
FFY 2013 2014 2015 2016 2017 2018
Target ≥ 3.43% 3.43% 3.43% 3.43% 3.43% 3.46%
Targets: Description of Stakeholder Input
The North Dakota Department of Human Services (ND DHS), as the Part C Lead Agency, along with ourstakeholders, the North Dakota Interagency Coordinating Council (NDICC), reviewed the trend andperformance data for the previous 3 years for all the results indicators to set targets for FFY 2013-2018 onDecember 4th, 2014.
Prepopulated Data
Source Date Description Data Overwrite Data
SY 2013-14 ChildCount/Educational Environment
Data Groups9/24/2014 Number of infants and toddlers birth to 3 with IFSPs 1,040
U.S. Census Annual StateResident Population Estimates
April 1, 2010 to July 1, 201312/16/2014 Population of infants and toddlers birth to 3 29,674
FFY 2013 SPP/APR DataNumber of infants and toddlers birth
to 3 with IFSPsPopulation of infants and toddlers
birth to 3FFY 2012
Data*FFY 2013Target*
FFY 2013Data
1,040 29,674 3.43% 3.43% 3.50%
Provide additional information about this indicator (optional)
On December 1, 2013 there were 1040 children birth to 3 years of age with IFSP’s. The number served isfrom Table 1 (618 data). The total North Dakota population of children birth to 3 years of age is 29,674 fromUS Census 2013 data as reflected in Table C1-9.
FFY 2013 Part C State Performance Plan (SPP)/Annual Performance Report (APR)
8/3/2017 Page 20 of 62
3.50% = (1040/29674 X 100)
Compared to other states, North Dakota ranks 15th overall according to table C1-9. North Dakota exceededthe national average of 3.03%.
This demonstrates slight progress from the FFY 2012 performance of 3.43%. North Dakota exceeded thestate target.
Actions required in FFY 2012 response table
None
Responses to actions required in FFY 2012 response table
OSEP Response
The State provided targets for FFYs 2013 through 2018 for this indicator, and OSEP accepts those targets.
Required Actions
FFY 2013 Part C State Performance Plan (SPP)/Annual Performance Report (APR)
8/3/2017 Page 21 of 62

Indicator 7: 45-day timeline
Baseline Data: 2005
Monitoring Priority: Effective General Supervision Part C / Child Find
Compliance indicator: Percent of eligible infants and toddlers with IFSPs for whom an initial evaluation and initial assessment and an initial IFSP meeting wereconducted within Part C’s 45-day timeline.
(20 U.S.C. 1416(a)(3)(B) and 1442)
Historical Data
FFY 2005 2006 2007 2008 2009 2010 2011 2012
Target 100% 100% 100% 100% 100% 100% 100%
Data 39.39% 56.25% 84.37% 96.70% 87.70% 87.30% 95.10% 97.10%
Key: Gray – Data Prior to Baseline Yellow – Baseline
FFY 2013 - FFY 2018 Targets
FFY 2013 2014 2015 2016 2017 2018
Target 100% 100% 100% 100% 100% 100%
FFY 2013 SPP/APR Data
Number of eligible infants and toddlerswith IFSPs for whom an initial evaluation
and assessment and an initial IFSP meetingwas conducted within Part C’s 45-day
timeline
Number of eligible infants and toddlersevaluated and assessed for whom an initial
IFSP meeting was required to beconducted
FFY 2012Data*
FFY 2013Target*
FFY 2013Data
702 912 97.10% 100% 94.63%
Number of documented delays attributable to exceptional family circumstances (this number will be added to the Number of eligible infants andtoddlers with IFSPs for whom an initial evaluation and assessment and an initial IFSP meeting was conducted within Part C's 45-day timeline)
161
Explanation of Slippage
The state has determined that one program was below 85%. Removal of this one program that performed at70.2% would bring the state to 97.1%, which would not be slippage. The state is unsure at this time to thesignificant drop for this program when they were performing above the state performance in FFY 2012 onthis indicator. The state will investigate this low performance through our Regional Action Plan process. Thestate's Regional Action Plan includes a correction action plan.
What is the source of the data provided for this indicator?
State monitoring
State database
Provide the time period in which the data were collected (e.g., September through December, fourth quarter, selectionfrom the full reporting period).
FFY 2013 Part C State Performance Plan (SPP)/Annual Performance Report (APR)
8/3/2017 Page 22 of 62

July 1, 2013 through June 30, 2014
Describe how the data accurately reflect data for infants and toddlers with IFSPs for the full reporting period.
Data for Indicator 7 is taken from North Dakota’s state electronic record system, Therap. North Dakotaobtained a full year of data for reporting on Indicator 7, using Therap, for FFY 2013. In FFY 2013, NorthDakota had ten early intervention programs across the state. The performance of all ten of these programsis represented in this data.
Provide additional information about this indicator (optional)
In reviewing the local program data, the majority (nine) of the programs had performance above 85%. Four ofthose nine programs were at 100%. We had one program that had performance under 85%. Without thisone program included in the state calculation, North Dakota’s performance would be at 97.1%.
Based on the FFY 2013 data, six programs had noncompliance:
The six programs that had noncompliance will be issued letters of findings by April 1, 2015. The statewill continue to track correction of noncompliance until verification is completed according to federalrequirements for Prong 1 and Prong 2.
Actions required in FFY 2012 response table
None
Responses to actions required in FFY 2012 response table, not including correction of findings
Correction of Findings of Noncompliance Identified in FFY 2012
Findings of Noncompliance IdentifiedFindings of Noncompliance Verified
as Corrected Within One YearFindings of Noncompliance
Subsequently CorrectedFindings Not Yet Verified as Corrected
9 9 0 0
FFY 2012 Findings of Noncompliance Verified as Corrected
Describe how the State verified that each LEA with noncompliance is correctly implementing the regulatory requirements
The state issued findings for noncompliance found in FFY 2012 in April 2014 to nine programs.
As of September 5, 2014, nine programs corrected their noncompliance. Verification of the correction forthe nine findings was made according to OSEP memo 09-02. Specifically, in each instance, the Stateverified that the EIS programs were correctly implementing the specific regulatory requirements (i.e.,achieved 100% compliance) based on a review of updated data, via record review and State electronicrecord (Prong 2).
Describe how the State verified that each LEA corrected each individual case of noncompliance
The state assured correction of each individual case of noncompliance, except for children who were nolonger within the jurisdiction of the EIS program (Prong 1) based on a review by the regional program
FFY 2013 Part C State Performance Plan (SPP)/Annual Performance Report (APR)
8/3/2017 Page 23 of 62

administrators and the state.
OSEP Response
The State provided targets for FFYs 2013 through 2018 for this indicator, and OSEP accepts those targets.
Because the State reported less than 100% compliance for FFY 2013, the State must report on the status of correction of noncompliance identified in FFY 2013 for this indicator.When reporting on the correction of noncompliance, the State must report, in its FFY 2014 APR, that it has verified that each EIS program or provider with noncomplianceidentified in FFY 2013 for this indicator: (1) is correctly implementing the specific regulatory requirements (i.e., achieved 100% compliance) based on a review of updated datasuch as data subsequently collected through on-site monitoring or a State data system; and (2) has corrected each individual case of noncompliance, unless the child is no longerwithin the jurisdiction of the EIS program or provider, consistent with OSEP Memo 09-02. In the FFY 2014 APR, the State must describe the specific actions that were taken toverify the correction.
Required Actions
FFY 2013 Part C State Performance Plan (SPP)/Annual Performance Report (APR)
8/3/2017 Page 24 of 62

Indicator 8A: Early Childhood Transition
Baseline Data: 2005
Monitoring Priority: Effective General Supervision Part C / Effective Transition
Compliance indicator: The percentage of toddlers with disabilities exiting Part C with timely transition planning for whom the Lead Agency has:
Developed an IFSP with transition steps and services at least 90 days, and at the discretion of all parties, not more than nine months, prior to the toddler’sthird birthday;
A.
Notified (consistent with any opt-out policy adopted by the State) the SEA and the LEA where the toddler resides at least 90 days prior to the toddler’s thirdbirthday for toddlers potentially eligible for Part B preschool services; and
B.
Conducted the transition conference held with the approval of the family at least 90 days, and at the discretion of all parties, not more than nine months,prior to the toddler’s third birthday for toddlers potentially eligible for Part B preschool services.
C.
(20 U.S.C. 1416(a)(3)(B) and 1442)
Historical Data
FFY 2005 2006 2007 2008 2009 2010 2011 2012
Target 100% 100% 100% 100% 100% 100% 100%
Data 100% 100% 100% 46.20% 50.00% 89.20% 59.70% 96.60%
Key: Gray – Data Prior to Baseline Yellow – Baseline
FFY 2013 - FFY 2018 Targets
FFY 2013 2014 2015 2016 2017 2018
Target 100% 100% 100% 100% 100% 100%
FFY 2013 SPP/APR Data
Data include only those toddlers with disabilities exiting Part C with timely transition planning for whom the Lead Agencyhas developed an IFSP with transition steps and services at least 90 days, and at the discretion of all parties, not morethan nine months, prior to the toddler’s third birthday.
Yes
No
Number of children exiting Part C whohave an IFSP with transition steps and
servicesNumber of toddlers with disabilities exiting
Part CFFY 2012
Data*FFY 2013Target*
FFY 2013Data
140 144 96.60% 100% 97.22%
Number of documented delays attributable to exceptional family circumstances (this number will be added to the Number of children exitingPart C who have an IFSP with transition steps and services)
0
What is the source of the data provided for this indicator?
State monitoring
State database
Provide the time period in which the data were collected (e.g., September through December, fourth quarter, selection
FFY 2013 Part C State Performance Plan (SPP)/Annual Performance Report (APR)
8/3/2017 Page 25 of 62

from the full reporting period).
July 1, 2013 through June 30, 2014
July 1, 2013 through June 30, 2014
Describe how the data accurately reflect data for infants and toddlers with IFSPs for the full reporting period.
A data set for Indicator 8A is taken from North Dakota’s state electronic record system, Therap. North Dakotaobtained a full year of data for reporting on Indicator 8A, using Therap, for FFY 2013. Child records,representative of all ten programs, were pulled from the data set for review based on the size of theprogram. The state monitoring team reviewed the records using the state case review tool. In FFY 2013,North Dakota had ten early intervention programs across the state. The performance of all ten of theseprograms is represented in this data.
July 1, 2013 through June 30, 2014
Provide additional information about this indicator (optional)
Based on the FFY 2013 data, three programs had noncompliance:
The three programs that had noncompliance will be issued letters of findings by April 1, 2015. Thestate will continue to track correction of noncompliance until verification is completed according tofederal requirements for Prong 1 and Prong 2.
Actions required in FFY 2012 response table
None
Responses to actions required in FFY 2012 response table, not including correction of findings
Correction of Findings of Noncompliance Identified in FFY 2012
Findings of Noncompliance IdentifiedFindings of Noncompliance Verified
as Corrected Within One YearFindings of Noncompliance
Subsequently CorrectedFindings Not Yet Verified as Corrected
1 1 0 0
FFY 2012 Findings of Noncompliance Verified as Corrected
Describe how the State verified that each LEA with noncompliance is correctly implementing the regulatory requirements
The state issued findings for noncompliance found in FFY 2012 in April 2014 to one program.
As of September 5, 2014, one program corrected their noncompliance. Verification of the correction forthe one finding was made according to OSEP memo 09-02. Specifically, in each instance, the Stateverified that the EIS programs were correctly implementing the specific regulatory requirements (i.e.,achieved 100% compliance) based on a review of updated data, via record review and State electronicrecord (Prong 2).
Describe how the State verified that each LEA corrected each individual case of noncompliance
FFY 2013 Part C State Performance Plan (SPP)/Annual Performance Report (APR)
8/3/2017 Page 26 of 62

The state assured correction of each individual case of noncompliance, except for children who were nolonger within the jurisdiction of the EIS program (Prong 1) based on a review by the regional programadministrators and the state.
OSEP Response
The State provided targets for FFYs 2013 through 2018 for this indicator, and OSEP accepts those targets.
Because the State reported less than 100% compliance for FFY 2013, the State must report on the status of correction of noncompliance identified in FFY 2013 for this indicator.When reporting on the correction of noncompliance, the State must report, in its FFY 2014 APR, that it has verified that each EIS program or provider with noncomplianceidentified in FFY 2013 for this indicator: (1) is correctly implementing the specific regulatory requirements (i.e., achieved 100% compliance) based on a review of updated datasuch as data subsequently collected through on-site monitoring or a State data system; and (2) has corrected each individual case of noncompliance, unless the child is no longerwithin the jurisdiction of the EIS program or provider, consistent with OSEP Memo 09-02. In the FFY 2014 APR, the State must describe the specific actions that were taken toverify the correction.
Required Actions
FFY 2013 Part C State Performance Plan (SPP)/Annual Performance Report (APR)
8/3/2017 Page 27 of 62

Indicator 8B: Early Childhood Transition
Baseline Data: 2005
Monitoring Priority: Effective General Supervision Part C / Effective Transition
Compliance indicator: The percentage of toddlers with disabilities exiting Part C with timely transition planning for whom the Lead Agency has:
Developed an IFSP with transition steps and services at least 90 days, and at the discretion of all parties, not more than nine months, prior to the toddler’sthird birthday;
A.
Notified (consistent with any opt-out policy adopted by the State) the SEA and the LEA where the toddler resides at least 90 days prior to the toddler’s thirdbirthday for toddlers potentially eligible for Part B preschool services; and
B.
Conducted the transition conference held with the approval of the family at least 90 days, and at the discretion of all parties, not more than nine months,prior to the toddler’s third birthday for toddlers potentially eligible for Part B preschool services.
C.
(20 U.S.C. 1416(a)(3)(B) and 1442)
Historical Data
FFY 2005 2006 2007 2008 2009 2010 2011 2012
Target 100% 100% 100% 100% 100% 100% 100%
Data 95.52% 100% 100% 82.14% 67.00% 81.00% 64.30% 0%
Key: Gray – Data Prior to Baseline Yellow – Baseline
FFY 2013 - FFY 2018 Targets
FFY 2013 2014 2015 2016 2017 2018
Target 100% 100% 100% 100% 100% 100%
FFY 2013 SPP/APR Data
Data include notification to both the SEA and LEA
Yes
No
Number of toddlers with disabilities exitingPart C where notification to the SEA and
LEA occurred at least 90 days prior to theirthird birthday for toddlers potentiallyeligible for Part B preschool services
Number of toddlers with disabilities exitingPart C who were potentially eligible for Part
BFFY 2012
Data*FFY 2013Target*
FFY 2013Data
118 144 0% 100% 88.06%
Number of parents who opted out (this number will be subtracted from the number of toddlers with disabilities exiting Part C who werepotentially eligible for Part B when calculating the FFY 2013 Data)
10
Describe the method used to collect these data
The state used a full year of data from its electronic record system, Therap, to identify children whoserecords were reviewed to monitor for the presence of the notification to the LEA. For the FFY 2013 APR, datawas collected from July 1, 2013 through June 30, 2014. Child records, representative of all ten programs,
FFY 2013 Part C State Performance Plan (SPP)/Annual Performance Report (APR)
8/3/2017 Page 28 of 62

were pulled for review based on the size of the program. A state monitoring team reviewed the recordsusing the state case review tool. The SEA received notice of all children exiting who were potentially eligiblein FFY 2013, excluding the 10 that opted-out of the notification, as agreed upon in the Interagency Agreement.
A total of 144 records were reviewed. Of those 134 required LEA/SEA notification, as they had not chosen toopt out of the Part B referral. Of the 134 records reviewed which required LEA/SEA notification, 118 of therecords contained a notification. Sixteen (16) records did not contain a notification.
Do you have a written opt-out policy? Yes
Is the policy on file with the Department? Yes
Provide additional information about this indicator (optional)
Based on the FFY 2013 data, eight programs had noncompliance:
The eight programs that had noncompliance will be issued letters of findings by April 1, 2015. The statewill continue to track correction of noncompliance until verification is completed according to federalrequirements for Prong 1 and Prong 2.
Actions required in FFY 2012 response table
None
Responses to actions required in FFY 2012 response table, not including correction of findings
Correction of Findings of Noncompliance Identified in FFY 2012
Findings of Noncompliance IdentifiedFindings of Noncompliance Verified
as Corrected Within One YearFindings of Noncompliance
Subsequently CorrectedFindings Not Yet Verified as Corrected
8 8 0 0
FFY 2012 Findings of Noncompliance Verified as Corrected
Describe how the State verified that each LEA with noncompliance is correctly implementing the regulatory requirements
The state issued findings for noncompliance found in FFY 2012 in April 2014 to eight programs.
As of September 5, 2014, eight programs corrected their noncompliance. Verification of the correctionfor the eight findings were made according to OSEP memo 09-02. Specifically, in each instance, theState verified that the EIS programs were correctly implementing the specific regulatory requirements(i.e., achieved 100% compliance) based on a review of updated data, via record review and Stateelectronic record (Prong 2).
Describe how the State verified that each LEA corrected each individual case of noncompliance
FFY 2013 Part C State Performance Plan (SPP)/Annual Performance Report (APR)
8/3/2017 Page 29 of 62

The state assured correction of each individual case of noncompliance, except for children who were nolonger within the jurisdiction of the EIS program (Prong 1) based on a review by the regional programadministrators and the state.
OSEP Response
The State provided targets for FFYs 2013 through 2018 for this indicator, and OSEP accepts those targets.
Because the State reported less than 100% compliance for FFY 2013, the State must report on the status of correction of noncompliance identified in FFY 2013 for this indicator.When reporting on the correction of noncompliance, the State must report, in its FFY 2014 APR, that it has verified that each EIS program or provider with noncomplianceidentified in FFY 2013 for this indicator: (1) is correctly implementing the specific regulatory requirements (i.e., achieved 100% compliance) based on a review of updated datasuch as data subsequently collected through on-site monitoring or a State data system; and (2) has corrected each individual case of noncompliance, unless the child is no longerwithin the jurisdiction of the EIS program or provider, consistent with OSEP Memo 09-02. In the FFY 2014 APR, the State must describe the specific actions that were taken toverify the correction.
Required Actions
FFY 2013 Part C State Performance Plan (SPP)/Annual Performance Report (APR)
8/3/2017 Page 30 of 62

Indicator 8C: Early Childhood Transition
Baseline Data: 2005
Monitoring Priority: Effective General Supervision Part C / Effective Transition
Compliance indicator: The percentage of toddlers with disabilities exiting Part C with timely transition planning for whom the Lead Agency has:
Developed an IFSP with transition steps and services at least 90 days, and at the discretion of all parties, not more than nine months, prior to the toddler’sthird birthday;
A.
Notified (consistent with any opt-out policy adopted by the State) the SEA and the LEA where the toddler resides at least 90 days prior to the toddler’s thirdbirthday for toddlers potentially eligible for Part B preschool services; and
B.
Conducted the transition conference held with the approval of the family at least 90 days, and at the discretion of all parties, not more than nine months,prior to the toddler’s third birthday for toddlers potentially eligible for Part B preschool services.
C.
(20 U.S.C. 1416(a)(3)(B) and 1442)
Historical Data
FFY 2005 2006 2007 2008 2009 2010 2011 2012
Target 100% 100% 100% 100% 100% 100% 100%
Data 83.30% 100% 100% 68.75% 73.00% 83.00% 92.10% 96.50%
Key: Gray – Data Prior to Baseline Yellow – Baseline
FFY 2013 - FFY 2018 Targets
FFY 2013 2014 2015 2016 2017 2018
Target 100% 100% 100% 100% 100% 100%
FFY 2013 SPP/APR Data
Data reflect only those toddlers for whom the Lead Agency has conducted the transition conference held with the approvalof the family at least 90 days, and at the discretion of all parties, not more than nine months, prior to the toddler’s thirdbirthday for toddlers potentially eligible for Part B preschool services
Yes
No
Number of toddlers with disabilities exitingPart C where the transition conference
occurred at least 90 days, and at thediscretion of all parties at least ninemonths prior to the toddler’s third
birthday for toddlers potentially eligible forPart B
Number of toddlers with disabilities exitingPart C who were potentially eligible for Part
BFFY 2012
Data*FFY 2013Target*
FFY 2013Data
136 144 96.50% 100% 95.80%
Number of toddlers for whom the parent did not provide approval for the transition conference (this number will be subtracted from the numberof toddlers with disabilities exiting Part C who were potentially eligible for Part B when calculating the FFY 2013 Data)
1
Number of documented delays attributable to exceptional family circumstances (this number will be added to the Number of toddlers withdisabilities exiting Part C where the transition conference occurred at least 90 days, and at the discretion of all parties at least nine monthsprior to the toddler’s third birthday for toddlers potentially eligible for Part B)
1
FFY 2013 Part C State Performance Plan (SPP)/Annual Performance Report (APR)
8/3/2017 Page 31 of 62

What is the source of the data provided for this indicator?
State monitoring
State database that includes data for the entire reporting year
Provide the time period in which the data were collected (e.g., September through December, fourth quarter, selectionfrom the full reporting period).
July 1, 2013 through June 30, 2014
Describe how the data accurately reflect data for infants and toddlers with IFSPs for the full reporting period.
The state used a full year of data from its electronic record system, Therap, to identify children whoserecords were reviewed to monitor for the presence of the transition conference. Child records, representativeof all ten programs, were pulled for review based on the size of the program. A state monitoring teamreviewed the records using the state case review tool.
A total of 144 records were reviewed. Of those, 136 toddlers with disabilities exiting Part C had a transitionconference, which occurred at least 90 days, and at the discretion of all parties at least nine months prior tothe toddler’s third birthday for toddlers potentially eligible for Part B. One toddler did not have a transitionplanning conference timely, due to exceptional family circumstances. One toddler didn't have a transitionplanning conference, due to their parents not giving approval. Six toddlers didn't have a transition planningconference when they should have, due to agency reason.
Provide additional information about this indicator (optional)
Based on the FFY 2013 data, four programs had noncompliance:
The four programs that had noncompliance will be issued letters of findings by April 1, 2015. The statewill continue to track correction of noncompliance until verification is completed according to federalrequirements for Prong 1 and Prong 2.
Actions required in FFY 2012 response table
None
Responses to actions required in FFY 2012 response table, not including correction of findings
Correction of Findings of Noncompliance Identified in FFY 2012
Findings of Noncompliance IdentifiedFindings of Noncompliance Verified
as Corrected Within One YearFindings of Noncompliance
Subsequently CorrectedFindings Not Yet Verified as Corrected
4 4 0 0
FFY 2012 Findings of Noncompliance Verified as Corrected
Describe how the State verified that each LEA with noncompliance is correctly implementing the regulatory requirements
The state issued findings for noncompliance found in FFY 2012 in April 2014 to four programs.
FFY 2013 Part C State Performance Plan (SPP)/Annual Performance Report (APR)
8/3/2017 Page 32 of 62
As of September 5, 2014, four programs corrected their noncompliance. Verification of the correction forthe four findings were made according to OSEP memo 09-02. Specifically, in each instance, the Stateverified that the EIS programs were correctly implementing the specific regulatory requirements (i.e.,achieved 100% compliance) based on a review of updated data, via record review and State electronicrecord (Prong 2).
Describe how the State verified that each LEA corrected each individual case of noncompliance
The state assured correction of each individual case of noncompliance, except for children who were nolonger within the jurisdiction of the EIS program (Prong 1) based on a review by the regional programadministrators and the state.
OSEP Response
The State provided targets for FFYs 2013 through 2018 for this indicator, and OSEP accepts those targets.
Because the State reported less than 100% compliance for FFY 2013, the State must report on the status of correction of noncompliance identified in FFY 2013 for this indicator.When reporting on the correction of noncompliance, the State must report, in its FFY 2014 APR, that it has verified that each EIS program or provider with noncomplianceidentified in FFY 2013 for this indicator: (1) is correctly implementing the specific regulatory requirements (i.e., achieved 100% compliance) based on a review of updated datasuch as data subsequently collected through on-site monitoring or a State data system; and (2) has corrected each individual case of noncompliance, unless the child is no longerwithin the jurisdiction of the EIS program or provider, consistent with OSEP Memo 09-02. In the FFY 2014 APR, the State must describe the specific actions that were taken toverify the correction.
Required Actions
FFY 2013 Part C State Performance Plan (SPP)/Annual Performance Report (APR)
8/3/2017 Page 33 of 62

Indicator 9: Resolution Sessions
Baseline Data:
Monitoring Priority: Effective General Supervision Part C / General Supervision
Results indicator: Percent of hearing requests that went to resolution sessions that were resolved through resolution session settlement agreements (applicable ifPart B due process procedures are adopted).
(20 U.S.C. 1416(a)(3)(B) and 1442)
Historical Data
FFY 2005 2006 2007 2008 2009 2010 2011 2012
Target ≥
Data 0% 0% 0% 0% 0%
Key: Gray – Data Prior to Baseline Yellow – Baseline
FFY 2013 - FFY 2018 Targets
FFY 2013 2014 2015 2016 2017 2018
Target ≥
Targets: Description of Stakeholder Input
Prepopulated Data
Source Date Description Data Overwrite Data
EMAPS IDEA Part B DisputeResolution Survey; Section C:
Due Process Complaints11/12/2013 3.1 Number of resolution sessions null null
EMAPS IDEA Part B DisputeResolution Survey; Section C:
Due Process Complaints11/12/2013 3.1(a) Number resolution sessions resolved through settlement agreements null null
FFY 2013 SPP/APR Data
3.1 Number of resolution sessions3.1(a) Number resolution sessions
resolved through settlementagreements
FFY 2012Data*
FFY 2013 Target*FFY 2013
Data
null null 0%
Actions required in FFY 2012 response table
None
FFY 2013 Part C State Performance Plan (SPP)/Annual Performance Report (APR)
8/3/2017 Page 34 of 62
Responses to actions required in FFY 2012 response table
OSEP Response
This indicator is not applicable to the State.
Required Actions
FFY 2013 Part C State Performance Plan (SPP)/Annual Performance Report (APR)
8/3/2017 Page 35 of 62

Indicator 10: Mediation
Baseline Data: 2005
Monitoring Priority: Effective General Supervision Part C / General Supervision
Results indicator: Percent of mediations held that resulted in mediation agreements.
(20 U.S.C. 1416(a)(3)(B) and 1442)
Historical Data
FFY 2005 2006 2007 2008 2009 2010 2011 2012
Target ≥
Data 0% 0% 0% 0% 0%
Key: Gray – Data Prior to Baseline Yellow – Baseline
FFY 2013 - FFY 2018 Targets
FFY 2013 2014 2015 2016 2017 2018
Target ≥
Targets: Description of Stakeholder Input
The North Dakota Department of Human Services (ND DHS), as the Part C Lead Agency, along with ourstakeholders, the North Dakota Interagency Coordinating Council (NDICC), reviewed the trend andperformance data for the previous 3 years for all the results indicators to set targets for FFY 2013-2018 onDecember 4th, 2014. Given that North Dakota hasn't yet received 10 mediation requests in a FFY, no targetshave been set.
Prepopulated Data
Source Date Description Data Overwrite Data
EMAPS IDEA Part B DisputeResolution Survey; Section B:
Mediation Requests11/5/2014 2.1.a.i Mediations agreements related to due process complaints n null
EMAPS IDEA Part B DisputeResolution Survey; Section B:
Mediation Requests11/5/2014 2.1.b.i Mediations agreements not related to due process complaints n null
EMAPS IDEA Part B DisputeResolution Survey; Section B:
Mediation Requests11/5/2014 2.1 Mediations held n null
FFY 2013 SPP/APR Data2.1.a.i Mediations
agreements related to dueprocess complaints
2.1.b.i Mediationsagreements not related todue process complaints
2.1 Mediations heldFFY 2012
Data*FFY 2013Target*
FFY 2013Data
0 0 0 0%
FFY 2013 Part C State Performance Plan (SPP)/Annual Performance Report (APR)
8/3/2017 Page 36 of 62

Actions required in FFY 2012 response table
None
Responses to actions required in FFY 2012 response table
OSEP Response
The State reported fewer than ten mediations held in FFY2013. The State is not required to provide targets or improvement activities until any fiscal year in which ten or moremediations were held.
Required Actions
FFY 2013 Part C State Performance Plan (SPP)/Annual Performance Report (APR)
8/3/2017 Page 37 of 62
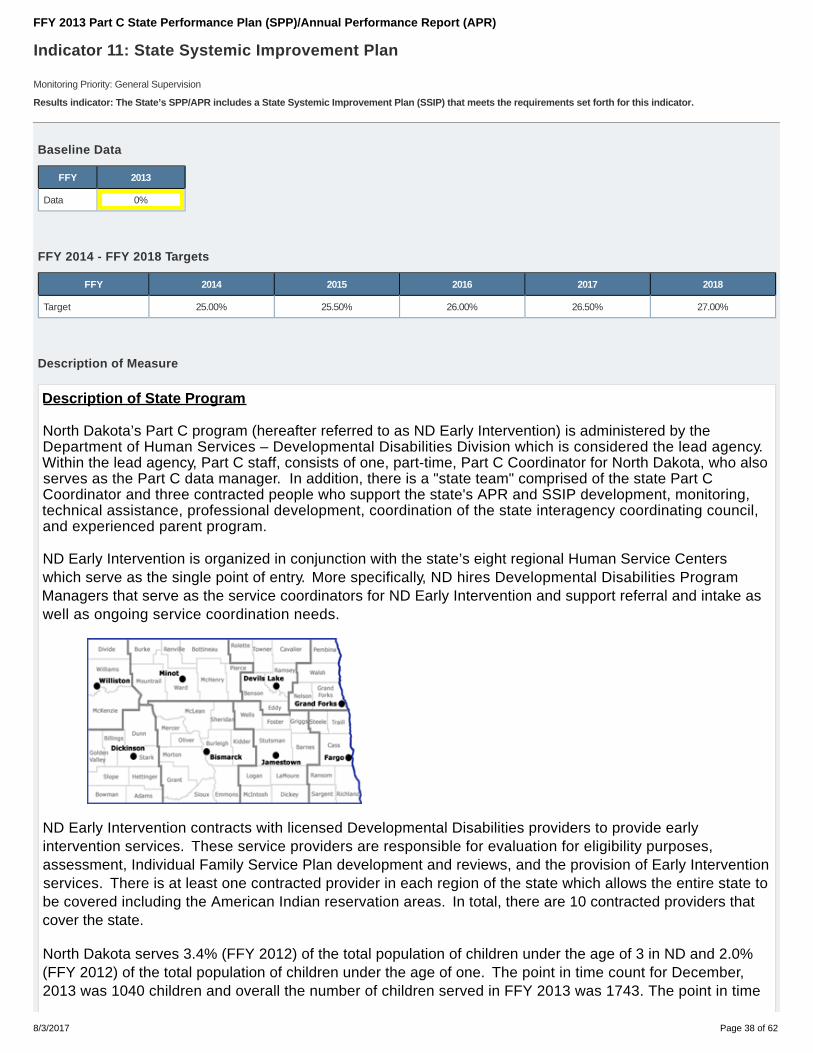
Indicator 11: State Systemic Improvement Plan
Monitoring Priority: General Supervision
Results indicator: The State’s SPP/APR includes a State Systemic Improvement Plan (SSIP) that meets the requirements set forth for this indicator.
Baseline Data
FFY 2013
Data 0%
FFY 2014 - FFY 2018 Targets
FFY 2014 2015 2016 2017 2018
Target 25.00% 25.50% 26.00% 26.50% 27.00%
Description of Measure
Description of State Program
North Dakota’s Part C program (hereafter referred to as ND Early Intervention) is administered by theDepartment of Human Services – Developmental Disabilities Division which is considered the lead agency. Within the lead agency, Part C staff, consists of one, part-time, Part C Coordinator for North Dakota, who alsoserves as the Part C data manager. In addition, there is a "state team" comprised of the state Part CCoordinator and three contracted people who support the state's APR and SSIP development, monitoring,technical assistance, professional development, coordination of the state interagency coordinating council,and experienced parent program.
ND Early Intervention is organized in conjunction with the state’s eight regional Human Service Centerswhich serve as the single point of entry. More specifically, ND hires Developmental Disabilities ProgramManagers that serve as the service coordinators for ND Early Intervention and support referral and intake aswell as ongoing service coordination needs.
ND Early Intervention contracts with licensed Developmental Disabilities providers to provide earlyintervention services. These service providers are responsible for evaluation for eligibility purposes,assessment, Individual Family Service Plan development and reviews, and the provision of Early Interventionservices. There is at least one contracted provider in each region of the state which allows the entire state tobe covered including the American Indian reservation areas. In total, there are 10 contracted providers thatcover the state.
North Dakota serves 3.4% (FFY 2012) of the total population of children under the age of 3 in ND and 2.0%(FFY 2012) of the total population of children under the age of one. The point in time count for December,2013 was 1040 children and overall the number of children served in FFY 2013 was 1743. The point in time
FFY 2013 Part C State Performance Plan (SPP)/Annual Performance Report (APR)
8/3/2017 Page 38 of 62

count for December 2014 was 1150 children and the cumulative number of children served in FFY 2014 was1933.
North Dakota is home to five tribal governments and so it’s no surprise that the state’s more prevalentminority is the American Indian population. In FFY 2012, 10.5% of the total ND Early Intervention populationwere children who were of American Indian descent. This compares to 0.82% in the US Early Interventionpopulations. 8% of ND’s total population of children under the age of three are American Indian.
North Dakota has seen an unprecedented 2% growth in population from 2010 to 2011 due to rapiddevelopment of oil extraction in the western side of the state. Nearly half of ND counties (24 of 53) had anincrease in their child population from 2010 to 2011.
As described in this report, based on broad stakeholder input, North Dakota has a State IdentifiedMeasurable Result (SiMR) that focuses on the results for children so that families can be supported inimproving children's social emotional development.
"Improved social emotional outcomes for children who come in below age expectation but makesubstantial gains while involved with one identified provider will be demonstrated as a result ofparticipation in Early Intervention."
For more information about the SiMR, please refer to section 4 of this indicator.
Targets: Description of Stakeholder Input
Multiple internal and external stakeholders were involved in the selection of the data used for the SiMR. Thisincluded the lead agency Part C Coordinator, state team members, state ICC, as well as a working group ofregional service coordinators, early intervention coordinators, and experienced parents covering thefollowing areas; fiscal support, provider support, family and community support including dispute resolution,and accountability, monitoring, and data (systems support). In addition, staff from the state's Parent Trainingand Information Center were involved in the stakeholder work.
A draft of this report will be posted on the North Dakota early intervention website www.nd.gov/dhs/services/disabilities/earlyintervention/ .
Data Analysis
A description of how the State identified and analyzed key data, including data from SPP/APR indicators, 618 data collections, and other available data as applicable, to: (1) select theState-identified Measurable Result(s) for Infants and Toddlers with Disabilities and their Families, and (2) identify root causes contributing to low performance. The description mustinclude information about how the data were disaggregated by multiple variables (e.g., EIS program and/or EIS provider, geographic region, race/ethnicity, socioeconomic status,gender, etc.) As part of its data analysis, the State should also consider compliance data and whether those data present potential barriers to improvement. In addition, if the Stateidentifies any concerns about the quality of the data, the description must include how the State will address these concerns. Finally, if additional data are needed, the descriptionshould include the methods and timelines to collect and analyze the additional data.
How Key Data were Identified and Analyzed
State team members have attended opportunities for Results Driven Accountability (RDA). The staterequested technical assistance from Mountain Plains Regional Resource Center (MPRRC,, and CarolEslinger aided in development of a plan to identify and analyze data to support the development of the SiMR. State team members (Part C Coordinator, Family Liaison, technical assistance) began meeting in April 2014to develop a plan for identifying key data. The meeting in Arizona helped the team determine the need forregional drill down of APR and other data sources. The team identified available data, possible data needs,
FFY 2013 Part C State Performance Plan (SPP)/Annual Performance Report (APR)
8/3/2017 Page 39 of 62

and questions that might lead to further data needs.
Through state meetings with Carolee Eslinger, the team worked to determine data needs from April to June2014. The team identified the need to develop data charts with regional breakdowns based on each APRindicator data for the past three years (FFY 2010 - FFY 2012) in order to review trends. Data team membersdeveloped data charts in two formats based on the indicator data. The team also identified the need toreview the FFY 2012 point in time client count, Part C report on percentages of eligibility levels by provider,and a North Dakota demographic profile. A plan was made to develop this data into a format for stakeholdermeetings planned for the summer of 2014. Decisions about what data would be presented to thestakeholders was made by state team members.
North Dakota’s web-based data system, which also serves as an electronic record, is easily accessible bythe state office, the service coordinators, and the providers. The system generates the majority of theinformation needed for the completion of the federal reporting requirements and assists with monitoring andfor purposes of closing regional program findings. The Individual Family Service Plan (IFSP) is generatedfrom the web-based system.
North Dakota Early Intervention is partnering on a data sharing initiative that originated with the state’s EarlyChildhood Committee. Partnership on this committee includes Head Start, Child Care, and Department ofPublic Instruction.
Presently, the North Dakota Early Intervention data system does not generate real-time child outcome data.This makes it difficult to use the child outcome data to use for progress monitoring. Presently, the tool that isbeing used is also not conducive to providing feedback that families and providers need to understand thechild’s development. Other real-time reports on both compliance and other results indicator data is alsodifficult for staff to access. There is no access for families who have children in ND Early Intervention andsome of the staff do not have access to the electronic record (i.e. Experienced Parents). At present, the NorthDakota Early Intervention data system does not interact with the state’s Part B partner, so any informationexchanged must be through more manual strategies.
The stakeholders’ input revealed that data entry into the system can be demanding. It was discussed thatadditional prompts, defaulted information, and anticipatory fields to decrease error in entry would be helpful.
Stakeholder Involvement in Data Analysis
On June 5, 2014, key stakeholders from the Interagency Coordinating Council (ICC) were given a reviewof the SSIP process with Carolee Eslinger leading the meeting. Then, the ICC was presented with state PartC data to review in small groups answering questions designed to aid in data analysis. After small andlarge group data analysis discussion, an infrastructure analysis was completed through a Strength-Weakness-Opportunity-Threat (SWOT) activity with a group gallery walk allowing different small groups todiscuss and share information. Before the group left the meeting, additional data questions weregenerated.
For the July 16, 2014 stakeholder meeting, which included North Dakota staff including administrators ofservice coordination units, early intervention providers, experienced parents, and ND state staff, a binderof data was given to each of the stakeholders. The binder data included the following:
Orientation PowerPoint of the SSIP planND Demographic profile including the following sources using the template developed at the ITCA fiscalinitiative:
Table 618 dataND and US Kids Count dataNational Children's Health Survey
Regional data bar and line graphs according to indicator
FFY 2013 Part C State Performance Plan (SPP)/Annual Performance Report (APR)
8/3/2017 Page 40 of 62

Indicator 1 & 7 family reason data per regionRaw regional dataChild count gridsBroad data analysis activity
Through these stakeholder activities and processes, the state was considering a family outcome centeredSiMR due to trending low performance in Indicator #4a, with significant concern in one region. In addition,there were concerns about the lack of diversity in the family survey return and significant increase in the useof family reason for the delay in service delivery.
In August, the state team met with OSEP for two days to review the process and progress of the SSIP inNorth Dakota. There was continued discussion about additional data needs in the state to determine aSiMR. It was determined that the state would continue to drill down in data, specifically the FFY 2013 data asit became available. The FFY 2013 data was important to review as the state had implemented newprocedures for family survey. On September 19, 2014, a follow-up meeting with Carolee Eslinger was heldwith ND state team members to discuss the OSEP meeting and state follow-up actions.
At the time the FFY 2013 data became available to the state team, it was disaggregated by region andreviewed alongside the federal performance 2012 data. Based on the FFY 2013 data the team determinedthat technical assistance was needed to discuss improved performance on Indicator 4.
How Data were Disaggregated
On December 31, 2014, the ND state team met with Sharon Walsh and Debbie Cate to discuss the FFY2013 Indicator 4 data. The state had been identifying the family outcome as a SiMR. However, the FFY 2013improvement in that area indicated a need to further drill down in Child Outcome indicators to determine thefinal direction of the SiMR based on data.
In February of 2015, the ND state team was able to view the disaggregation of Indicator 3 data by gender,race, length of service, eligibility levels and region. The state team reviewed federal performance levelsalong side regional trend data. Indicator 3a in general had a significant gap in relation to the federalperformance. The state had ongoing concerns regarding the use and availability of evidence basedinterventions in the social/emotional area due to an increasingly diverse population entering the state. Thestate previously had initiatives around infant mental health during 2009/2010 in early intervention.
It was determined through data analysis that performance on 3a Summary Statement 1 for a single regiondropped from 50% to 0% while the program doubled in size. This region continues to have growing diversepopulation. During data analysis of one provider, there were 7 children reported for Summary Statement 1A. There were a total of 13 children, with 6 of them entering at age-level in social-emotional (category e). Of the7 remaining children, all were boys, 4 Caucasian, 1 African American, 1 Alaskan Indian, 1 unable todetermine, and none of them made progress to same-age peers. There were 2 children in category a,making no progress, and 5 made progress not sufficient to move near same-age peers (category b). 4children entered at the early intervention system with 2 or more delays at 25%, and 3 entered with high riskcondition. In regards to length of service, two of the children entered service 13-18 months, one 19-24months, one over 24 months, one entered between 7 to 12 months, and two entered younger than sixmonths. Because we did not have any children in category c or d, the percentage reported for indicator 3A-1in this region was zero. In conclusion, the children that came into the system delayed in social-emotionalskills, did not show growth.
On March 4, 2015, the ICC met to review and give feedback on the SSIP plan. Stakeholders discussed therationale for the SiMR, strategies, and targets. There was considerable discussion regarding themeasurement process of child outcome summary statements, timely data, and valid and reliablemeasurement. Stakeholders considered the adoption of a new child outcome tool, the process of choosingthe tool, and the important components of the tool, and the urgency of moving forward. Strategies of
FFY 2013 Part C State Performance Plan (SPP)/Annual Performance Report (APR)
8/3/2017 Page 41 of 62

professional development, parent involvement, mentoring/coaching, evidence-based tools, evidence-basedintervention in the area of social emotional were discussed. Training around evidence-based assessment,positive behavioral supports, resiliency and mindfulness strategies for families, using the new tool forprogress monitoring, universal identification and Part C's role in leading this, children in foster care andsupporting social emotional skills. Stakeholders brainstormed local and statewide initiatives to partner within the area of social emotional.
Data Quality
The current child outcome tool, which was originally developed out of the state of Oregon, has not sustainedcontinued development. On December 8, 2011, North Dakota addressed the issue with the North DakotaInteragency Coordinator Council (NDICC) and the members endorsed the need to pursue newmeasurement tools. In October 2012, North Dakota’s Part C Coordinator met with Lynne Kahn of the ECOCenter to discuss the state’s transition to a new tool. The state has identified the need for a new tool as atop priority & will be taking the necessary steps to identify the best option & begin transitioning to a new tool. This will allow service providers to be trained to fidelity, and the state will have better access to timely, valid &reliable data.
There are concerns about the comparative peer issue on our current child outcome tool. However, theoutcome tool has been meeting quality indicators according to the ECO quality report. The state targets areunder the federal performance averages, and the state is not sure if this is due to the tool being used,training issues around the tool, or collection of data. There are concerns about the number of childrenreported in Indicator 3, and the state continues to investigate this.
Beginning in FFY 2011, the ND state team developed a Data Guidance document to assist servicecoordinators and service providers in understanding the procedures and importance of the data collectionfor compliance indicators. Specifics were given as to what the State team would be reviewing forcompliance, where it need to be located within the electronic data system and what was required. ND hasgiven and trained on a Data Guidance for every federal fiscal year since 2011. We have seen improvement inwhat is entered into our electronic data system, although still struggle with certain data elements, like IFSPmeeting date, being consistently entered into our electronic data system. The State continues to considerputting edits into the electronic data system to ensure more consistency in data entry.
We continually work with our electronic data system managing company to refine our query process andbecome more accurate in the data pulled. Due to numerous data elements needed to pull various indicatorreports, there are times that we must request reports to be pulled by the electronic data system managingcompany, which increases the timeline for delivery of the query, as well as additional manipulation by thedata support available to the Part C Coordinator. This additional "handling" of the data introduces increasedopportunity for data error, however, the State continues to work with the electronic data system managingcompany to reduce this as much as possible.
In FFY 2013, the survey methodology for collecting information for Indicator 4 - Family Outcomes wasupdated with the goal of increasing participation and demographic representation. While this wassuccessful in many ways, the State is continuing to refine the survey collection methodology.
The State will continue to explore our abilities to drill down on our Indicator 3 - Child Outcomes data, so thatwe can better understand how other factors affect performance, i.e. socioeconomic status, access to otherpublic supports, types of services accessed, frequency of service accessed, etc.
Considering Compliance Data
The relationships between compliance data and results data were analyzed to determine whether anynoncompliance was having an effect on improvement. ND is seeing an increase in the utilization of familyreason for delays in timely initiation of services (Indicator 1), as well as the 45-day timeline for IFSP
FFY 2013 Part C State Performance Plan (SPP)/Annual Performance Report (APR)
8/3/2017 Page 42 of 62

development (Indicator 7) and Transition (Indicator 8). In FFY 2010, the utilization of family reason to explainlateness was at 44% for the compliance indicators. This increased to 83% by FFY 2012. The increasedutilization of family reason is cause for concern, so the State is completing additional drill down to determinethe accuracy of that utilization, as well as ensuring families have been informed of their rights to timelyinitiation of service, IFSP development within 45 days and a timely and smooth transition.
Overall, the State has seen improvement in regards to our compliance data and feel this is, in part, due toconsistent data processes and procedures being developed since FFY 2011. Those processes andprocedures, along with the issuance of our Data Guidance document, assists service coordinators and earlyintervention providers in having a better understanding of the data, how it is used and impacts them and theimportance of their timely documentation.
Additional Data
In reviewing all of the data that is available to the State, there were several areas that were identified asneeding improvement. ND continues to have additional data needs that need to be addressed in the future,especially in the relation of data "experts." At this time, the Part C Coordinator also serves as the datamanager, as there's no dedicated time allocated specifically for Part C. There is a department within DHS,called Decision Support Services. Assistance from this unit has been available on a limited basis to Part C,due to the mining of data for Part C being low on the list of priorities for that unit. This will be addressed by ameeting between the State team & those from Decision Support Services who have assisted with Part Cdata, to take place by 5.31.15. The outcome of this meeting will be to design a plan to move forward withgetting timely data to the State.
A specific data element that the State is drilling down on is our exit data, as we feel that looking into thosewho leave services early, to better understand situations where there was no response from families or theywithdrew from services, will assist in better defining services, expectations and communicating withfamilies. Also, the ability to further disaggregate down to the provider level and determine if all ChildOutcome data that should be captured is being captured, will greatly assist the State in ensuring we'reproviding effective services. This will be addressed by a meeting between the State team & those fromDecision Support Services who have assisted with Part C data, to take place by 5.31.15. The outcome of thismeeting will be to design a plan to move forward with getting timely data to the State.
The State is working with the Section 619 Coordinator in the Department of Public Instruction to further refinedata sharing, specifically in relation to Indicator 8 for Part C and Indicator 12 for Part B. Part C would like toexplore the option of ascertaining those that participated in Section 619 services, however didn't participatein Part C services, to see where we may be missing serving those children, especially those who fall into theemotional disturbance and autism categories. A meeting is scheduled for the Part C Coordinator, theSection 619 Coordinator & the Part B Data Manager to meet on 4.2.15 to discuss the sharing of data. Theoutcome of this meeting will better align the needs of Part C & Part B in sharing data, as well as exploringother opportunities of partnership.
The State team will be developing a plan to look more broadly at available stakeholders who may have datathat will be beneficial in better understanding the social-emotional performance of infants and toddlersacross the state. This will be placed on the agenda for the June and/or September ICC meetings.
Analysis of State Infrastructure to Support Improvement and Build Capacity
A description of how the State analyzed the capacity of its current infrastructure to support improvement and build capacity in EIS programs and/or EIS providers to implement, scaleup, and sustain the use of evidence-based practices to improve results for infants and toddlers with disabilities and their families. State systems that make up its infrastructureinclude, at a minimum: governance, fiscal, quality standards, professional development, data, technical assistance, and accountability/monitoring. The description must includecurrent strengths of the systems, the extent the systems are coordinated, and areas for improvement of functioning within and across the systems. The State must also identify current
FFY 2013 Part C State Performance Plan (SPP)/Annual Performance Report (APR)
8/3/2017 Page 43 of 62

State-level improvement plans and other early learning initiatives, such as Race to the Top-Early Learning Challenge and the Home Visiting program and describe the extent thatthese new initiatives are aligned, and how they are, or could be, integrated with, the SSIP. Finally, the State should identify representatives (e.g., offices, agencies, positions,individuals, and other stakeholders) that were involved in developing Phase I of the SSIP and that will be involved in developing and implementing Phase II of the SSIP.
How Infrastructure Capacity was Analyzed
North Dakota has established a strong practice of reviewing the Annual Performance Report and StatePerformance Plan with the North Dakota Interagency Coordinating Council, the administrators of the servicedelivery system, and the core of parents that are hired in the system as Experienced Parents (at least oneparent per region). This practice has created a familiarization with Part C law, regulations, and requiredreporting elements. The review of the Improvement Activities has generated discussion about the broadsystem on an annual basis.
In 2014, North Dakota was accepted to participate in the ITCA Fiscal Initiative. Through this process, thestate engaged in developing a state demographic profile. This profile assisted the state in understandingthe trends in growth, the state progress compared to national trends, and possible unique qualities of thestate. This profile has been shared with the stakeholders that are described above as well as withrepresentatives from the state's Parent Training Information Center. Through an investigation of ND's fiscalsituation, it was noted that North Dakota has a minimal level of administration with only part-time staff in thestate office and that there is increasing burden on the Part C budget to pay for direct services. Presentlythere is no dedicated time from a data analyst at the state office specifically for Part C.
The state of North Dakota used the opportunity to develop the State Systemic Improvement Plan as a meansto conduct two separate broad stakeholder meetings. These meetings were described earlier and includedan analysis of the state infrastructure from a broad perspective using a SWOT analysis. National technicalassistance was used to design the group participation in the analysis and were present to assist in thefacilitation of both of these meetings.
The stakeholder meetings were structured so that a full review of the state data (as outlined in Section 1)had occurred prior to the Infrastructure Analysis. The data elements that appeared to influence theinfrastructure analysis included: the state's significant rate of growth in birth rate and eligible children, thestate's strong performance on Indicators 5 and 6, and the high performance of Indicator 2 and servicesdelivered in the natural environment.
Description of the State Systems
Governance- As noted earlier, the North Dakota Department of Human Services (DHS) - Division forDevelopmental Disabilities is the lead agency for North Dakota Early Intervention. DHS has served as thelead agency since the incorporation of IDEA in North Dakota. In North Dakota, the following offices are alsoincluded under DHS: State Medicaid, Early Childhood (management of the Child Care Block Grant), ChildWelfare, Head Start State Collaboration, Mental Health, and Developmental Disabilities.
Part C in North Dakota is administered through 50% FTE for a coordinator position and 15% FTE foradministrative support. The North Dakota Part C federal grant supports contracts for technical assistanceand these contracts assist the state in the work required to maintain Part C in North Dakota.
North Dakota's Early Intervention delivery system is managed through eight regional centers located acrossthe state. The single point of entry for intake and eligibility decision-making are the regional Human ServiceCenters. In addition to intake and eligibility, the staff out of the Developmental Disabilities ProgramManagement units also serve as service coordinators for the children that are eligible for North Dakota EarlyIntervention. The Developmental Disabilities Program Managers are state employees and receive oversightfrom the state DHS office for purposes of licensing and program support. The Part C Coordinator is anactive part of that oversight.
DHS currently contracts and licenses providers that provide a service that’s called “Infant Development” in
FFY 2013 Part C State Performance Plan (SPP)/Annual Performance Report (APR)
8/3/2017 Page 44 of 62

North Dakota. These providers are contracted to conduct the evaluations needed for eligibility purposes,conduct assessments for programming purposes, convene and develop the IFSP and reviews, provide therequired early intervention services, and conduct transition activities. In addition to these providers, the statealso issues contracts so that a parent who has had a child in Early Intervention can be hired in each regionof the state. Among other activities, these parents, referred to as Experienced Parents, assist in regionalgeneral supervision activities.
Fiscal- North Dakota has used a unique funding strategy for many years by funding the majority of theservice delivery through participation in the state Home and Community Based Medicaid waiver. Providersare paid with federal Medicaid dollars that are matched with 50% state general funds. Service coordinationis paid by state general funds and Medicaid dollars, when appropriate. Presently, the state is not collectingthird party insurance or assessing a parent fee.
Quality Standards– Following the issuance of the IDEA federal regulations, the state followed suit bypreparing state policies. These were approved by the Office of Special Education in 2013. Additional stateprocedures have been issued and continued to be developed. Presently, the state does not have any statestatute mandating participation in the federal Part C system. There are no state developed standards.However, the DEC Recommended Practices have been promoted to drive service delivery but not in astructured fashion.
Professional Development– North Dakota Early Intervention uses a combination of statewide distancemeetings, a biennial conference, and technical assistance to assure that the staff delivering services havethe needed tools. North Dakota Early Intervention also coordinates with other early childhood opportunitiessuch as the Home Visitation Coalition Conference and the state’s Parent Training Information Center’sannual conference for parents.
Data– The data system that is used by North Dakota is web-based and developed through coordination ofthe state office and an independent contractor, Therap. The system has been in use since 2010. Bothservice coordinators and providers have access for input and reporting purposes. The data system is usedfor the purposes of an electronic record and a repository of data that can be used for completing federalrequirements such as the APR/SPP, 618 data reports, assigning levels of determination to the regionalprograms, and completing regional program reports. An annual state data guidance document is releasedto the regional program staff on data requirements, timelines, and review activities.
Technical Assistance– Technical assistance in North Dakota is accomplished through two contracts, one toMilestones Technical Assistance Consulting and one for a state family liaison, a parent who had a child inEarly Intervention. Both contracts are involved in general supervision activities for the state as well asplanning staff in-service and training. Regional program staff are able to access the technical assistanceproviders directly for ongoing support needs.
Accountability & Monitoring– North Dakota has established a predictable approach to the generalsupervision system which has assisted the regional programs to know what to expect. Letters of finding areissued on an annual basis, with immediate follow-up on closing the findings through both Prong 1 andProng 2 reviews. Regional programs are then identified through this process for a Regional Action Plan(focused monitoring). State and regional level reporting information is maintained on the state website forpublic review. The North Dakota Interagency Coordinating Council has established a standing agenda itemto review updates on general supervision and monitoring.
Systems Strengths and Areas for Improvement
Governance
Strengths: North Dakota has a rich history of providing services to infants and toddlers with disabilities datingback prior to the passage of Part H. The service model, from its inception in the 1970’s, has always been
FFY 2013 Part C State Performance Plan (SPP)/Annual Performance Report (APR)
8/3/2017 Page 45 of 62

based on a home visitation model. Center-based services are a rarity and are viewed as acting out ofcompliance. Currently ND has a 99.7% performance on Indicator 2, services to infants and toddlers in theirnatural environment. In addition, the ND Early Intervention has had a long history with the Department ofHuman Services as the lead agency. This relationship links ND Early Intervention to state Medicaid, mentalhealth, child welfare, child care, and developmental disabilities. This history and performance creates asturdy background for improvement.
Issuance of the federal Part C regulations assisted the state in moving forward with policy and procedurerevisions and development.
The state has an active State Interagency Coordinating Council (SICC) that consists of 25 positions whenfully appointed. The membership requirements in the operating procedures state the Council is to functionwith 30% parent membership and 20% membership as well as an individual who will represent each of thefederally mandated positions. The SICC meets one time a year with the IDEA State Advisory Panel todiscuss any crossover topics.
Areas for improvement: Currently, ND Early Intervention is managed through a 50% FTE for administrationand a 15% FTE for administrative support in the state office. Presently there is no dedicated time from a dataanalyst at the state office specifically for Part C. The technical assistance contracts assist with generalsupervision and monitoring tasks, management of the SICC, coordination of the Experienced Parents, andprofessional development. A common theme through the stakeholders’ review of the infrastructure was thatthe current level of administration is inadequate in managing the state system with the growth ND’sexperienced and the increased data and reporting requirements.
Because North Dakota’s lead agency is not education, stakeholders felt that this presents a challenge in ourability to partner with Part B around data sharing, outcome measurement, childfind, professionaldevelopment, personnel qualifications, and seamless transition around eligibility for Part B. While aMemorandum of Agreement is in place between Part C and Part B in North Dakota, there continue to bebarriers in sharing data and having child and family outcome measurements that talk to each other.
Entrance into the ND Early Intervention system and maintenance of services can be confusing for familiesand other external partners because of the need to satisfy both the requirements of OSEP and the Centersfor Medicaid and Medicare. Separate applications are required for both ND Early Intervention and stateMedicaid and families often confuse how these activities. This is also true with maintaining eligibility forDevelopmental Disabilities, the Medicaid waiver, and IDEA supports upon transitioning out of EarlyIntervention. Coordination of systems of support can also be confusing and families can end up withdifferent plans of care from Early Intervention, child welfare, home visitation, Early Head Start, In-homesupport providers, or their medical home.
Fiscal
Strengths: North Dakota has been able to maximize state funding for service delivery by utilizing the federalMedicaid match by including infant development services under the Home and Community Based ServicesMedicaid waiver. While this is beneficial for the financing of the system, it is also helpful for families as theyhave access to a family income and asset disregard.
Areas of Improvement: North Dakota is facing a funding cliff over the next two years as more funds from thefederal Part C grant are being used to cover families that are not applying for Medicaid. North Dakota haswritten the service delivery into the Home and Community Based Waiver and so state general funds arecombined at a 50/50 match with Medicaid dollars. This stream of funding is only available if the child is onMedicaid (families have an income and asset disregard if child is eligible for the waiver). If families refuse toapply for Medicaid, then the state is using the federal Part C grant dollars. This is putting pressure on theability to maintain other components of the Part C system such as our childfind effort, technical assistance,and/or professional development.
FFY 2013 Part C State Performance Plan (SPP)/Annual Performance Report (APR)
8/3/2017 Page 46 of 62

According to stakeholders, one of the areas of needed improvement is timely reimbursement of servicesand contracts. This was discussed by stakeholders when a state work group addressed a definition ofNorth Dakota’s fee for service pay points as well as the personnel guidelines. Timely reimbursementassures that programs are not working at a deficit and are unable to meet their own expenses, such aspayroll.
Quality Standards
Strengths: As noted in the Governance section, North Dakota Early Intervention has a long history ofproviding services in children’s homes and community settings. Our ability to promote inclusion at an earlyage is strengthened by not having to address the setting that children receive the majority of their EarlyIntervention services. Clinics and classrooms have never been established so major change wasunnecessary. In 2009, the state invested in contracting with Juliann Woods to provide intensiveRoutine-Based Intervention training to our staff. In addition, trainers were sent to Dr. Robin McWilliam'sRoutine-Based Interview Iinstitute and came back to the state to train both service coordinators and InfantDevelopment staff. The Routine-Based Interview is still used as the main tool to gather family assessmentdata in the state. Both the Woods and the McWilliam training has help the state to work towards qualityfunctional outcomes for children and their families.
Areas of Improvement: Presently, North Dakota Early Intervention has not adopted the state early learningguidelines for infants and toddlers. Also, North Dakota Early Intervention is not using any statewide systemof positive behavioral supports and strategies. This systemic baseline knowledge of typical development aswell as the use of behavioral supports and strategies that are good for all children would assist the staff inthe field.
Because of the increasing pressure on the Part C federal budget to pay for direct services, there has been adecreasing opportunity for personnel development. This applies to pre-service collaboration as well asin-service training for currently employed staff.
While performance data on the compliance indicator (1) – timely initiation of services has remainedsomewhat constant, it continues to be below the national target of 100%. The question of statewide accessto qualified staff is often raised in discussing the performance on Indicator 1 and the common response isthat we struggle to attract speech and language pathologists to the field. In addition, we find that primarilythe Early Intervention services that are used include: physical therapy, occupational therapy, speech therapy,and specialized instruction. The other Early Intervention services such as psychology and social workservices are used more infrequently.
Data
Strengths: North Dakota’s web-based data system, which also serves as an electronic record, is easilyaccessible by the state office, the service coordinators, and the providers. The system generates themajority of the information needed for the completion of the federal reporting requirements and assists withmonitoring and for purposes of closing regional program findings. The Individual Family Service Plan (IFSP)is generated from the web-based system.
North Dakota Early Intervention is partnering on a data sharing initiative that originated with the state’s EarlyChildhood Committee. Partnership on this committee includes Head Start, Child Care, and Department ofPublic Instruction.
Areas of Improvement: Presently, the North Dakota Early Intervention data system does not generatereal-time child outcome data. This makes it difficult to use the child outcome data to use for progressmonitoring. Presently, the tool that is being used is also not conductive to providing feedback that familiesand providers need to understand the child’s development. Other real-time reports on both compliance andother results indicator data is also difficult for staff to access. There is no access for families who have
FFY 2013 Part C State Performance Plan (SPP)/Annual Performance Report (APR)
8/3/2017 Page 47 of 62
children in ND Early Intervention and some of the staff do not have access to the electronic record (i.e.Experienced Parents). At present, the North Dakota Early Intervention data system does not interact with thestate’s Part B partner, so any information exchanged must be through more manual strategies.
The stakeholders’ input revealed that data entry into the system can be demanding. It was discussed thatadditional prompts, defaulted information, and anticipatory fields to decrease error in entry would be helpful.
Accountability and Monitoring
Strengths: North Dakota Early Intervention received technical assistance from the Data Accountability Centerstarting in 2010 to improve their general supervision system. Several in-person meetings as well asconference calls were held to establish state procedures that would assure proper compliance with thefederal requirements as well as creating a feedback system for the regional programs that would driveimprovement. The North Dakota Interagency Coordinating Council maintains a standing agenda item toreceive a report on the status of our general supervision system throughout the year. Since theimprovements were implemented, North Dakota has filed federal reports, issued letters of findings, closedfindings, and implemented regional improvement plans timely. Having a web-based data system hasassisted the state to accomplish these needed tasks.
Experienced Parents are parents are hired to work in the regional programs. They must have a children inEarly Intervention or have had a child who has been eligible. These parents are involved in regional generalsupervision activities, but also act in a capacity to advise and assist regional programs to makeimprovements that assure compliance and are more family-friendly.
Areas of Improvement: The state continues to work towards improvements around the measurement ofchild and family outcomes. Both of these areas have been brought up through the state’s review of theAnnual Performance Report data as well as the stakeholder work that was completed in preparation of theState Systemic Improvement Plan. The state continues to explore options on improving the collection ofperformance around both child and family outcomes, so that the data proves more valuable for programchange for both the state and the regional program.
Additional work is required on state procedures to assure consistency in practices between regionalprograms. Stakeholders discussed differences in eligibility determination practices as well other areas ofpractice. Additional technical assistance and professional development is needed in addition to thedevelopment of state procedures.
State-level Improvement Plans and Initiatives
North Dakota Early Intervention’s improvement efforts over the past three years have been focused onestablishing structure to the general supervision system and establishing and implementing policies andprocedures to assure compliance with the federal rules and regulations. This has been primarily an internaleffort involving state office staff and the regional program staff. As noted earlier, North Dakota EarlyIntervention operates with limited amount of staff support at the state level. This affects the state’s ability tobe involved multiple improvement activities and initiatives.
The state of North Dakota has had no involvement in federal initiatives such as the Race to the TopChallenge grants, the Preschool Challenge grant, or the Maternal Infant and Early Childhood Home Visiting(MIECHV) grants. Presently, a private, non-profit entity, Prevent Child Abuse North Dakota (PCAND), is therecipient of the MIECHV and the Early Childhood Comprehensive Systems (ECCS) grant. PCAND hasformed a statewide home visitation coalition as well as a stakeholder group for the ECCS grant. NorthDakota’s Part C Coordinator is involved with both of these efforts. PCAND and the Home Visitation Coalitionhave been instrumental in bringing relevant topics on infant/toddler issues forward for professionaldevelopment purposes. This spring, a conference will be held regarding infants that are exposed tosubstances and the effects of substance abuse on families.
FFY 2013 Part C State Performance Plan (SPP)/Annual Performance Report (APR)
8/3/2017 Page 48 of 62

The ECCS grant is currently focused on developmental screening for children birth to three years of age, withan emphasis on social-emotional factors. The North Dakota chapter of the American Academy of Pediatricsis actively partnering with the grant to assure best practices are used in screenings across the state. Thiseffort fits well with the state’s need to increase the capacity of the North Dakota Early Intervention system tosuccessfully identify and serve children with social/emotional/behavioral needs.
An Early Childhood Education Committee (ECEC) was formed after the requirement was added to thefederal Head Start legislation. The state chose to maintain a separate North Dakota InteragencyCoordinating Council. Presently, the state director for the Department of Human Services is appointed to theECEC and represents North Dakota Early Intervention on the Committee. The Part C Coordinator and theState Family Liaison are involved with an Early Childhood Data Work Group of the ECEC. This work grouphas been working on a pilot project to tie an early childhood (i.e. Head Start) program into the Department ofPublic Instruction’s data system. The pilot project that is being considered is an entity that also houses aNorth Dakota Early Intervention regional program. It is unknown at this time how the regional program maybe involved, but this has increased the dialogue around how to involve a program in the Department ofHuman Services.
During the 2013 – 2015 biennium (North Dakota’s legislature meets every two years), an extensivelegislative study was completed on North Dakota’s ability to meet the needs of their citizens with behavioralhealth needs. Schulte Consulting, LLC was contracted and prepared a final report which can be found at: http://www.ndpanda.org/news/docs/20140722-behavioral-health.pdf. Because of this study, there is currently
legislature pending during the 64the session that may increase the capacity for the state to addresssocial/emotional/behavioral issues of infants and toddlers in our state. It is too early to know whatcollaboration will be required or will occur.
One of the pending pieces of legislation would expand developmental screening in medical clinic setting aswell as expand access to infant mental health specialists in the identified region. In addition, this region hasaccess to expanded supports in the area of autism supports, board certified behavioral analysts, marriageand family therapists, and home visitation supports. There is also pending legislation to expand the HealthFamilies Home Visitation model into the identified region with state funding.
Representatives Involved/Stakeholder Involvement in Infrastructure Analysis
North Dakota Early Intervention’s stakeholder work involved the state staff, including data analyst staff, theNorth Dakota Interagency Coordinating Council, the administrators for the regional programs (both servicecoordination and infant development), as well as the state’s Experienced Parent staff. Staff from the state’sparent training and information center, Pathfinder’s, were also present. Represented in this group were:
North Dakota Department of Public Instruction
Special Education/Section 619
Homeless Coordinator
Parents
North Dakota Insurance Commission
State Child Care Administrator
A North Dakota legislator
FFY 2013 Part C State Performance Plan (SPP)/Annual Performance Report (APR)
8/3/2017 Page 49 of 62

Parent Training and Information Center staff
Family to Family Health Information Center (federal grantee) staff – Family Voices of North Dakota
North Dakota Department of Health – Children Special Health Services (MCH-B grantee)
State Developmental Disabilities Administrator
Regional Developmental Disabilities Program Administrators (Service Coordination Units)
Infant Development Program Coordinators
Experienced Parents
The NDICC was apprised of the chosen SiMR during a regularly scheduled meeting. During this meeting,improvement activities were discussed and a rationale for setting a baseline and target was discussed andimplemented. At this meeting, the following entities were represented:
State Developmental Disabilities Administrator
A representative from the state’s Protection and Advocacy program
Infant Development Program coordinators
Parents
Regional Developmental Disabilities Program Administrators
North Dakota Department of Public Instruction – Special Education/Section 619
Parent Training and Information Center grantee
State Child Welfare
Family to Family Health Information Center (federal grantee) staff – Family Voices of North Dakota
Additional information was been sent to this group for further clarification on improvement strategies.
Communication has occurred with the regional program that is being highlighted for the SiMR. Both theservice coordination unit and the regional infant development provider are agreeable to the opportunity.
State-identified Measurable Result(s) for Infants and Toddlers with Disabilities and Their FamiliesA statement of the result(s) the State intends to achieve through the implementation of the SSIP. The State-identified Measurable Result(s) for Infants and Toddlers with Disabilitiesand their Families must be aligned to an SPP/APR indicator or a component of an SPP/APR indicator. The State-identified Measurable Result(s) for Infants and Toddlers withDisabilities and their Families must be clearly based on the Data and State Infrastructure Analyses and must be a child- or family-level outcome in contrast to a process outcome.The State may select a single result (e.g., increase the rate of growth in infants and toddlers demonstrating positive social-emotional skills) or a cluster of related results (e.g.,increase the percentage reported under child outcome B under Indicator 3 of the SPP/APR (knowledge and skills) and increase the percentage trend reported for families under
FFY 2013 Part C State Performance Plan (SPP)/Annual Performance Report (APR)
8/3/2017 Page 50 of 62

Indicator 4 (helping their child develop and learn)).
Statement
SiMR Statement
North Dakota's SiMR is aligned to SPP/APR indicator 3A
Percent of infants and toddlers with IFSPs who demonstrate improved positive social-emotional skills(including social relationships).
Stakeholders and the state Part C team chose the SiMR focused on child outcomes because it closelyaligns with family outcomes and supporting families in their ability...
Data and Infrastructure Analysis Substantiating the SiMR
Data - Through stakeholder activities and processes, the state was considering a family outcome centeredSiMR due to trending low performance in Indicator #4a. In addition there were concerns about the lack ofdiversity in the family survey return and significant increase in the use of family reason for the delay in servicedelivery; new procedureal methods for distributing the survey were initiated. In August, the state team metwith OSEP for two days to review the process and progress of the SSIP in North Dakota. There wascontinued discussion about additional data needs in the state to determine a SiMR. It was determined thatthe state would continue to drill down in data, specifically the FFY 2013 data as it became available forIndicator 4. At the time the FFY 2013 data became available to the state team, it was disaggregated byregion and reviewed alongside the federal performance 2012 data. Based on improvement of the FFY 2013Indicator 4 data, the team determined that there was improved performance that did not support a SiMR inthis area.
In February of 2015, the ND state team was able to view the disaggregation of Indication 3 data along sideregional trend data. Indicator 3a in general had a significant gap in relation to the federal performance. Thestate had ongoing concerns regarding the use and availability of evidence based interventions in the socialemotional area due to an increasingly diverse population entering the state. The state previously hadinitiatives around infant mental health during 2009/2010 in early intervention. Further data analysis wascompleted (see data analysis of this indicator).
Infrastructure - The state of North Dakota used the opportunity to develop the State Systemic ImprovementPlan as a means to conduct two separate broad stakeholder meetings. The stakeholder meetings werestructured so that a full review of the state data (as outlined in Section 1) had occurred prior to theInfrastructure Analysis.
The data elements that appeared to influence the infrastructure analysis included: the state's significant rateof growth in birth rate and eligible children, the state's strong performance on Indicators 5 and 6, and thehigh performance of Indicator 2 and services delivered in the natural environment.
In regards to Quality Standards, North Dakota Early Intervention has not adopted the state early learningguidelines for infants and toddlers. Also, North Dakota Early Intervention is not using any statewide systemof positive behavioral supports and strategies. This systemic baseline knowledge of typical development aswell as the use of behavioral supports and strategies that are good for all children would assist the staff inthe field, which is a concern for child outcomes. The state budget has been impacted due to fiscalconstraints to pay for direct services, there has been a decreasing opportunity for personnel development. This applies to pre-service collaboration as well as in-service training for currently employed staff.
Presently, the North Dakota Early Intervention data system does not generate real-time child outcome data. This makes it difficult to use the child outcome data to use for progress monitoring. Presently, the tool that isbeing used is also not conductive to providing feedback that families and providers need to understand thechild’s development. Other real-time reports on both compliance and other results indicator data is also
FFY 2013 Part C State Performance Plan (SPP)/Annual Performance Report (APR)
8/3/2017 Page 51 of 62

difficult for staff to access. There is no access for families who have children in ND Early Intervention andsome of the staff do not have access to the electronic record (i.e. Experienced Parents). At present, the NorthDakota Early Intervention data system does not interact with the state’s Part B partner, so any informationexchanged must be through more manual strategies.
In accountability and monitoring, the state continues to work towards improvements around themeasurement of child and family outcomes. Both of these areas have been brought up through the state’sreview of the Annual Performance Report data as well as the stakeholder work that was completed inpreparation of the State Systemic Improvement Plan. The state continues to explore options on improving thecollection of performance around both child and family outcomes, so that the data proves more valuable forprogram change for both the state and the regional program. Additional work is required on stateprocedures to assure consistency in practices between regional programs. Stakeholders discusseddifferences in eligibility determination practices as well other areas of practice. Additional technicalassistance and professional development is needed in addition to the development of state procedures.
Please refer to the data analysis and infrastructure sections of this indicator for more information.
SiMR as Child-Family-Level Outcome
Please refer to the data and infrastructure analysis sections of this indicator for more detail. The chosenSiMR is based on child outcomes. The specific program was chosen, based on the data analysis thatperformance on 3a summary statement 1 for a single region dropped from 50% to 0% while the programdoubled in size. This region continues to have growing diverse population. Because there were not have anychildren in category c or d, the percentage reported for indicator 3A-1 in this region was zero. In conclusion,the children that came into the system delayed in social-emotional skills, did not show growth. Working withthis specific program will allow the State to systemize their procedures, assessments & professionaldevelopment, which will facilitate scale-up in other regional programs and regions.
Stakeholder involvement in Selecting SiMR
On June 5, 2014, the Interagency Coordinating Council (ICC) was given a review of the SSIP process withCarolee Eslinger leading the meeting. Then, the ICC was presented with state Part C data to review in smallgroups answering questions designed to aid in data analysis. After small and large group data analysisdiscussion, an infrastructure analysis was completed through a Strength-Weakness-Opportunity-Threat(SWOT) activity with a group gallery walk allowing different small groups to discuss and shareinformation. Before the group left the meeting, additional data questions were generated.
For the July 16, 2014, stakeholder meeting, which included North Dakota staff including administrators ofservice coordination units, early intervention providers, experienced parents, and ND state staff, a binderof data was given to each of the stakeholders. Through these stakeholder activities and processes, thestate was considering a family outcome centered SiMR due to trending low performance in Indicator #4a,with significant concern in one region. In addition, there were concerns about the lack of diversity in thefamily survey return and significant increase in the use of family reason for the delay in service delivery. When the family survey data was analyzed for FFY 2013, significant improvement was noted, so childoutcome data was further analyzed by the state team and disaggregated.
At the January 15, 2015 ICC meeting, the Indicator 4 data was shared. The consultation with national TApartners from DaSy & IDC was relayed, along with their recommendation that the State move towards usinga Child Outcome, rather than a Family Outcome.
On February 17, 2015, a presentation was given to Regional Service Coordinators, EI Services Providers,and Experienced Parents, regarding the data for Indicator 4 as a SiMR topic & the need to consider using acomponent of Indicator 3a.
FFY 2013 Part C State Performance Plan (SPP)/Annual Performance Report (APR)
8/3/2017 Page 52 of 62

At the March 4, 2015 ICC meeting, the topic and potential strategies for improving Indicator 3a werediscussed. After reviewing all components of Indicator 3, the ICC agreed with the chosed SiMR, as well asprogram to begin the SSIP work.
Baseline Data and Targets
If evidence-based professional development, technical assistance, and assessment skills to increase theknowledge and skills of early intervention providers to support social emotional skill development in birth tothree year olds enrolled in early intervention is provided, then improved social emotional outcomes forchildren who come in below age expectation but make substantial gains while involved with one identifiedprovider will be demonstrated.
The chosen program will move their performance on Indicator 3A Summary Statement 1 from their baselineof 0% to 25% in FFY 2014 and to 27.5% by FFY 2018. The targets may need to be revised based on workbeing completed during the SSIP, including the implementation of a new child outcome tool.
Description
Selection of Coherent Improvement Strategies
An explanation of how the improvement strategies were selected, and why they are sound, logical and aligned, and will lead to a measurable improvement in the State-identifiedMeasurable Result(s) for Infants and Toddlers with Disabilities and their Families. The improvement strategies should include the strategies, identified through the Data and StateInfrastructure Analyses, that are needed to improve the State infrastructure and to support EIS program and/or EIS provider implementation of evidence-based practices to improvethe State-identified result(s) for infants and toddlers with disabilities and their families. The State must describe how implementation of the improvement strategies will addressidentified root causes for low performance and ultimately build EIS program and/or EIS provider capacity to achieve the State-identified Measurable Result(s) for Infants and Toddlerswith Disabilities and their Families.
How Improvement Strategies were Selected
Many of the improvement strategies were selected based on data from indicator 3 data and concerns in thefield discussion with stakeholders, which indicated concerns in the areas of the use and understanding ofthe child outcome tool in the area of social emotional development. The following two areas for improvementstrategies were chosen:
Promote Best-Practice Screening and Assessment PracticesPromote Knowledge of Social/Emotional Development
The process used to select improvement strategies included two stakeholder meetings, national technicalassistance discussions, state team meetings, a survey to the field, and data analysis with focused attentionon disaggregated data from the three child outcomes. The issues identified included a lack of consistentunderstanding and implementation of supporting families and their children in the area of social emotionaldevelopment (see data analysis section for specific information). Coaching is a primary strategy that is usedin the home visiting programs in North Dakota. However, the staff report that they have limited knowledge ofhow to support families and their children in understanding social emotional development. Furthermore,stakeholders indicated a concern that the current child outcome tool does not provide feedback for staff toreview with families and does not facilitate the family or staff's understanding of individual child progress inthe area of social emotional development. Overwhelmingly, stakeholders stressed the importance of obtaining a better way to garner child outcome data and give more accurate information relating to Indicator3. This has lead the State to prioritize the implementation of a new child outcome tool.
FFY 2013 Part C State Performance Plan (SPP)/Annual Performance Report (APR)
8/3/2017 Page 53 of 62

The broad improvement strategies listed below will be described in greater detail in Phase II of this SSIP.The implementation framework in that report (due February 2016) will include the reasons each strategy waschosen.
Proposed Coherent Improvement Strategies:
1. Promote Best-Practice Screening and Assessment Practices
Strategies to Improve Screening and Child Find Practices
Identify and create an inventory of evidence-based tools and practices for screening to supportimproved identification practices in the area of social/emotional/behavioral development.
Increase efforts to collaborate and identify screening opportunities for infants and toddlers inidentifying social/emotional/behavioral concerns.
Develop policies and procedures for promoting best-practices around identification of infants andtoddlers with social/emotional/behavioral concerns.
Provide training to Right Track and EI staff to effectively implement new policies and procedures.
Strategies to Improve Assessment Practices
Identify, create and disseminate an inventory of evidence-based tools and practices for assessingdevelopment in the area of social/emotional/behavioral development
Provide training to EI staff to effectively implement the use of informed clinical opinion in theeligibility process, including social/emotional/behavioral characteristics.
Strategies to Improve Child Outcome Measurement Practices
Implement the use of a new Child Outcome Tool for assessment, federal reporting, and progressmonitoring purposes
Establish a workgroup to review the new Child Outcome Tool data and progress reports to driveimprovement in the area of social/emotional/behavioral development.
2. Promote Knowledge of Social/Emotional Development
Strategies to Improve Parent Confidence and Competence
Develop and disseminate procedural safeguard materials that are culturally sensitive and parent-friendly
Provide timely feedback to parents regarding child’s development especially in the area ofsocial/emotional/behavior development through the use of a Child Outcome tool that hasaccessible parent reports
Develop and disseminate a statewide standardized job description for the Experienced Parentposition to better provide parent-to-parent information and emotional support across the state
Strategies to Improve EI Staff Confidence and Competence
Inventory and maximize opportunities to collaborate on existing efforts for professional developmentin the areas of social/emotional/behavioral developmen
Provide timely feedback to EI Staff regarding individual child’s development and overall regional
FFY 2013 Part C State Performance Plan (SPP)/Annual Performance Report (APR)
8/3/2017 Page 54 of 62

program performance, especially in the area of social/emotional/behavioral development throughthe use of a Child Outcome tool that has accessible reports
Require regional program orientation and use of the DEC Recommended Practices, especiallyrelated to the area of social/emotional/behavioral development through the redesign of the state’sservice contracts.
Provide training to EI staff to effectively implement the support of parent learning around ProceduralSafeguards and Access to Part C services.
Develop, distribute, and train on a state philosophy regarding parent involvement and the link to achild’s social/emotional wellness.
SSIP Phases: Year 1- Analysis FFY 2013, Year-2 FFY 2014 Plan, Phase 3 FFY 2015-2018 Implementationand Evaluation
Year 1FFY 2013
Phase 1: Analysis Data analysis Infrastructure Analysis
SiMR
Identify focus for improvement
Theory of ActionYear 2FFY 2014
Phase 2: Plan Steps to implement the SSIP
Improvement strategies with timelines
Plan for dissemination of timely data
Support for EI programs and providers,families, referral sources, childcareproviders
Aligning with local initiatives
Training of evidence-based practices
Plan for how lead agency will supportearly intervention providers in scaling upand sustaining implementation
Formative evaluation
Year 3FFY 2015-2018
Phase 3: Implementation& Evaluation
Results of ongoing evaluation andrevisions to the SSIP
Progress
Implementation
EvaluationHow Improvement Strategies are Sound, Logical and Aligned
North Dakota Part C believes that the strategies are sound, logical, and aligned with the SiMR. These will bemodified as necessary. It is felt that these coherent improvement strategies will target many different levels
FFY 2013 Part C State Performance Plan (SPP)/Annual Performance Report (APR)
8/3/2017 Page 55 of 62

that contribute to supporting infants and toddlers with social emotional challenges and theirfamilies. Promoting knowledge of social emotional development and assessment practices willsystematically support achieving the SiMR. These efforts are aimed at assuring that parents, providers, andreferral sources understand this content area and support parents in increasing their confidence andcompetence in social emotional development. The state will also create policies and procedures to ensureimplementation.
One of the pending pieces of legislation would expand developmental screening in medical clinic setting aswell as expand access to infant mental health specialists in the identified region. In addition, this region hasaccess to expanded supports in the area of autism supports, board certified behavioral analysts, marriageand family therapists, and home visitation supports. There is also pending legislation to expand the HealthyFamilies Home Visitation model into the identified region with state funding. A plan will be developed tofoster collaborations with these partners.
Strategies that Address Root Causes and Build Capacity
The lead agency, with broad stakeholder input, identified the root cause of concern as not understanding thecomponents to identify and support young children with social emotional challenges.One of the main areasof concern in the state of ND has been on the need to choose a new tool to measure child outcomes that willallow for systematic training for staff and provide for parent feedback. In addition the early intervention staffreport not understanding which items on the ND child outcome tool targets social emotional skills.Therefore, there is limited information shared with parents on the progress or lack of progress their child ismaking in this area and how to support social emotional skills.
The SiMR focuses on measuring results for families and their children in the area of positive socialemotional skills. It is highly likely that the strategies described above will address the root cause which hasled to low performance in the child outcomes.
Strategies Based on Data and Infrastructure Analysis
Data-In February of 2015, the ND state team was able to view the disaggregation of Indication 3 data alongside regional trend data. Indicator 3a in general had a significant gap in relation to the federal performance.The state had ongoing concerns regarding the use and availability of evidence based interventions in thesocial emotional area due to an increasingly diverse population entering the state. The state previously hadinitiatives around infant mental health during 2009/2010 in early intervention. Further data analysis wascompleted (see data analysis of this indicator).
It was evident throughout the stakeholder meetings that a new child outcome tool was critical todocumenting child outcome performance. The current child outcome tool, which was originally developedout of the state of Oregon, has not sustained continued development and is outdated. On December 8, 2011,North Dakota addressed the issue with the North Dakota Interagency Coordinator Council (NDICC) and themembers endorsed the need to pursue new measurement tools. In October 2012, North Dakota’s Part CCoordinator met with Lynne Kahn of the ECO Center to discuss the state’s transition to a new tool. The statehas identified the need for a new tool as a top priority & will be taking the necessary steps to identify the bestoption & begin transitioning to a new tool. This will allow service providers to be trained to fidelity, and thestate will have better access to timely, valid & reliable data.
There are concerns about the comparative peer issue on our current child outcome tool. However, theoutcome tool has been meeting quality indicators according to the ECO quality report. The state targets areunder the federal performance averages, and the state is not sure if this is due to the tool being used,training issues around the tool, or collection of data. There are concerns about the number of childrenreported in indicator 3, and the state continues to investigate this.
Infrastructure- The state of North Dakota used the opportunity to develop the State Systemic Improvement
FFY 2013 Part C State Performance Plan (SPP)/Annual Performance Report (APR)
8/3/2017 Page 56 of 62

Plan as a means to conduct two separate broad stakeholder meetings.
The stakeholder meetings were structured so that a full review of the state data (as outlined in Section 1)had occurred prior to the Infrastructure Analysis.
The data elements that appeared to influence the infrastructure analysis included: the state's significant rateof growth in birth rate and eligible children, the state's strong performance on Indicators 5 and 6, and thehigh performance of Indicator 2 and services delivered in the natural environment.
In regards to Quality Standards, North Dakota Early Intervention has not adopted the state early learningguidelines for infants and toddlers. Also, North Dakota Early Intervention is not using any statewide systemof positive behavioral supports and strategies. This systemic baseline knowledge of typical development aswell as the use of behavioral supports and strategies that are good for all children would assist the staff inthe field, which is a concern for child outcomes. The state budget has been impacted due to fiscalconstraints to pay for direct services, there has been a decreasing opportunity for personnel development.This applies to pre-service collaboration as well as in-service training for currently employed staff.
Presently, the North Dakota Early Intervention data system does not generate real-time child outcome data.This makes it difficult to use the child outcome data to use for progress monitoring. Presently, the tool that isbeing used is also not conductive to providing feedback that families and providers need to understand thechild’s development. Other real-time reports on both compliance and other results indicator data is alsodifficult for staff to access. There is no access for families who have children in ND Early Intervention andsome of the staff do not have access to the electronic record (i.e. Experienced Parents). At present, the NorthDakota Early Intervention data system does not interact with the state’s Part B partner, so any informationexchanged must be through more manual strategies.
In accountability and monitoring, the state continues to work towards improvements around themeasurement of child and family outcomes. Both of these areas have been brought up through the state’sreview of the Annual Performance Report data as well as the stakeholder work that was completed inpreparation of the State Systemic Improvement Plan. The state continues to explore options on improving thecollection of performance around both child and family outcomes, so that the data proves more valuable forprogram change for both the state and the regional program. Additional work is required on state proceduresto assure consistency in practices between regional programs. Stakeholders discussed differences ineligibility determination practices as well other areas of practice. Additional technical assistance andprofessional development is needed in addition to the development of state procedures.
Stakeholder Involvement in Selecting Improvement Strategies
North Dakota Early Intervention’s improvement efforts over the past three years have been focused onestablishing structure to the general supervision system and establishing and implementing policies andprocedures to assure compliance with the federal rules and regulations. This has been primarily an internaleffort involving state office staff and the regional program staff. As noted earlier, North Dakota EarlyIntervention operates with limited amount of staff support at the state level. This affects the state’s ability tobe involved multiple improvement activities and initiatives.
The NDICC was apprised of the chosen SiMR during a regularly scheduled meeting. During this meeting,improvement activities were discussed and a rationale for setting a baseline and target was discussed andimplemented. At this meeting, the following entities were represented:
State Developmental Disabilities Administrator
A representative from the state’s Protection and Advocacy program
FFY 2013 Part C State Performance Plan (SPP)/Annual Performance Report (APR)
8/3/2017 Page 57 of 62

Infant Development Program coordinators
Parents
Regional Developmental Disabilities Program Administrators
North Dakota Department of Public Instruction – Special Education/Section 619
Parent Training and Information Center grantee
State Child Welfare
Family to Family Health Information Center (federal grantee) staff – Family Voices of North Dakota
A survey was sent to the ICC members, service coordinators, regional EI providers, and ExperiencedParents to gather input on the improvement strategies in March, 2015. Two responses were returned. Thebiggest concern raised surrounded the building of ND's infrastructure and resources for children with mentalhealth concerns and increasing the collaborations and service delivery to those children and their families.
Theory of Action
A graphic illustration that shows the rationale of how implementing the coherent set of improvement strategies selected will increase the State’s capacity to lead meaningful changein EIS programs and/or EIS providers, and achieve improvement in the State-identified Measurable Result(s) for Infants and Toddlers with Disabilities and their Families.
ND Theory of ActionND Theory of Action
Provide a description of the provided graphic illustration (optional)
Description of Illustration
Description of Illustration
The Theory of Action is broken down in 2 key areas of needed improvement, with subcomponents:
Promoting Best-Practice Screening and Assessment PracticesStrategies to Improve Screening and Child Find Practices1.
Strategies to Improve Assessment Practices2.
Strategies to Improve Child Outcome Measurement Practices3.
1.
Promoting Knowledge of Social/Emotional/Behavioral DevelopmentStrategies to Improve Parent Confidence and Competence1.
Strategies to Improve EI Staff Confidence and Competence2.
2.
The key areas were derived from the data and infrastructure analyses, based on the root causes andincorporate the improvement strategies. The Theory of Action describes a flow of action steps based on theImprovement Strategies to increase the confidence and competence of EI staff and parents/familiesresulting in improvement of the State Identified Measurable Result.
How Improvement Strategies will Lead to Improve Results
FFY 2013 Part C State Performance Plan (SPP)/Annual Performance Report (APR)
8/3/2017 Page 58 of 62
North Dakota's Theory of Action outlines the improvement strategies, which will be implemented during thetimeline of the SSIP to improve positive social-emotional outcomes for infants and toddlers in the chosenprogram.
The following describes how each improvement strategy leads to improved results in the SiMR:
Strategies to ImproveScreening and ChildFind Practices
If ND EI staff are orientated to an inventory of evidence-based tools and practices, providers will be able to moreeffectively screen all areas of a child's development, including social/emotional/behavioral development, andidentify any areas of concern. If ND increases collaboration around identifying screening opportunity for infantsand toddlers, this should lead to increased idenificiation of children with social/emotional/behavioralconcerns. Developing policies and procedures will promote best practices regarding identification ofsocial/emotional/behavioral concerns, which will provide the forum to train Right Track, ND's EI ChildFind Program, and EI staff regarding social/emotional/behavioral development. These steps/tasks will lead to EIproviders being better equipped to screen and identify children with social/emotional/behavioral concerns. Betteridentification will ensure that children receive necessary services, which will positively impact theirsocial/emotional/behavioral development.
Strategies toImprove AssessmentPractices
If ND EI staff are ordientated to an inventory of evidence-based tools and practices, the EI staff willbe more effectively evaluate and assess all areas of a child's development, includingsocial/emotional/behavioral development, for the purpose of addressing any areas of concern. Thiswill lead to improved social/emotional/behavioral skills for children involved in ND EI Services.
If ND refines and effectively trains on the use of informed clinicial opinion, then EI staff will use a fullerarray of techniques to understand a child's functioning during the eligibility process. Improvedassessment practices will lead to more accurate eligibility determinations and service delivery forchildren with social/emotional/heavioral concerns.
Strategies toImprove ChildOutcomeMeasurementPractices
If ND implements a new Child Outcome Tool, EI staff will be able to more accurately assess all areasof development, including social/emotional/behavioral development. This will enable IFSP teams tobe better informed to address child and family needs. Better team planning and parents/familiesbeing informed of their child's progress in relation to the Child Outcome Tool, will lead to improvedresults for children, including social/emotional/behavioral skills.
If ND forms a workgroup to review the data and progress reports derived from the new tool, this willallow ND to explore how the Child Outcome data can be used to improve performance, policy andpractice.
Strategies to ImproveParent Confidence andCompetence
If ND develops and disseminates culturally sensitive and parent-friendly procedural safeguardmaterials, then parents/families will have a better understanding of their rights and the services theyare entitled to while participating in Part C service. We firmly believe that parents/families being fullinformed of their rights will directly impact their child's performance while involved with ND EIS.
If parents/families have timely feedback regarding their child's development, especially in the area ofsocial/emotional/behavioral skills, this will ensure better team planning and allow parents/families tobetter ascertain their priorities and develop more effective outcomes. This will lead to improvedperformance in all areas of development, including social/emotional/behavioral skills.
In ND, we provide an invaluable service, called Experienced Parent, to parents/families interested inparticipating. This affords parents/families the opportunity to work with someone who has movedthrough the ND EI System, and support parents/families as they navigate the system and services. IfND develops and disseminates a standardized job description for Experienced Parents,parents/families will receive more consistent services from their regional Experienced Parent, whichwill lead to parents being better informed of their rights and increase their ability to impact and
FFY 2013 Part C State Performance Plan (SPP)/Annual Performance Report (APR)
8/3/2017 Page 59 of 62

maximize ND EI service delivery.
Strategies to Improve EIStaff Confidence andCompetence
If ND maximizes existing efforts and collaborations for professional development in the area ofsocial/emotional/behavioral development, then EI staff will be better equipped to address concerns,which will lead to improved social/emotional/behavioral skills in children involved with ND EIS.
If ND provides more timely feedback to EI staff regarding individual children's development andprovides regional program performance, particularly in the area of social/emotional/behavioraldevelopment via the new Child Outcome Tool, EI staff will have a better idea of how their interventionsand team planning are impacting the children in ND EIS. This will lead to improved outcomes in allareas of development, including social/emotional/behavioral skills.
If ND revises the service contracts with EI providers and requires regional program orientation for EIstaff, including the use of the DEC Recommended Practices, especially in the area ofsocial/emotional/behavioral development, this will provide for a broader base of knowledge for EI staffto draw from in the team planning process.
If ND provides training on the importance of supporting parent learning around proceduralsafeguards and access to Part C services, as well as train on the State philosophy regarding parentinvolvement, then EI staff will be better able to inform and support parents regarding their rights andparticipation in ND Early Intervention.
Stakeholder Involvement in Developing the Theory of Action
In the summer of 2014, the Interagency Coordinating Council (ICC), North Dakota staff includingadministrators of service coordination units, early intervention providers, and experienced parents weregiven a review of the SSIP process and informed that a Theory of Action must be developed. Broadrecommendations were made, by the stakeholders involved, regarding issues surrounding state data andinfrastructure.
On February 17, 2015, a presentation was given to Regional Service Coordinators, EI Services Providers,and Experienced Parents, regarding the data for Indicator 4 as a SiMR topic & the need to consider using acomponent of Indicator 3a. This presented another opportunity for stakeholders to offer recommendationsregarding improvement strategies and influence the Theory of Action.
At the March 4, 2015 ICC meeting, the topic and potential strategies for improving Indicator 3a werediscussed. After reviewing all components of Indicator 3, the ICC agreed with the chosen SiMR, as well asengaged in a broad discussion about improvment strategies to affect the SiMR.
The State Team drafted the Theory of Action and incorporated the improvment activities suggested by the NDICC. The Theory of Action and corresponding improvement strategies were sent out to the stakeholder grouppreviously mentioned in other sections of the SSIP.
OSEP Response
Required Actions
FFY 2013 Part C State Performance Plan (SPP)/Annual Performance Report (APR)
8/3/2017 Page 60 of 62

FFY 2013 Part C State Performance Plan (SPP)/Annual Performance Report (APR)
8/3/2017 Page 61 of 62

Certify and Submit your SPP/APR
Name: Amanda Carlson
Title: Part C Coordinator
Email: [email protected]
Phone: 701-328-8936
I certify that I am the Director of the State's Lead Agency under Part C of the IDEA, or his or her designee, and that the State's submissionof its IDEA Part C State Performance Plan/Annual Performance Report is accurate.
Selected: Designated by the Lead Agency Director to certify
Name and title of the individual certifying the accuracy of the State's submission of its IDEA Part C State Performance Plan/AnnualPerformance Report.
IntroductionIndicator 1Indicator 2Indicator 3Indicator 4Indicator 5Indicator 6Indicator 7Indicator 8Indicator 8AIndicator 8BIndicator 8CIndicator 9Indicator 10Indicator 11
FFY 2013 Part C State Performance Plan (SPP)/Annual Performance Report (APR)
8/3/2017 Page 62 of 62