FEWS NET Scenario Development for Food Security Early ... · PDF fileFEWS NET Scenario...
50
Transcript of FEWS NET Scenario Development for Food Security Early ... · PDF fileFEWS NET Scenario...


FEWS NET Scenario Development for Food Security Early Warning January 2018
Famine Early Warning Systems Network ii
FEWS NET Guidance Document Series The Famine Early Warning Systems Network (FEWS NET) developed this series to provide guidance on scenario development – the core methodology used by FEWS NET to make food security projections – and the integration of advanced sectoral concepts and techniques into the scenario development process. Other guidance documents in the series include Building Rainfall Assumptions for Scenario Development, Developing Price Projections for Food Security Early Warning, Integrating Acute Malnutrition and Mortality into Scenario Development, Integrating Humanitarian Assistance into Scenario Development, and Integrating Livestock Herd Dynamics into Scenario Development.
About FEWS NET Created in response to the 1984 famines in East and West Africa, FEWS NET provides early warning and integrated, forward-looking analysis of the many factors that contribute to food insecurity. FEWS NET aims to inform decision makers and contribute to their emergency response planning; support partners in conducting early warning analysis and forecasting; and provide technical assistance to partner-led initiatives.
To learn more about the FEWS NET project, please visit www.fews.net.
Acknowledgements and Disclaimer This publication was prepared by Chris Hillbruner and Anne Speca under the United States Agency for International Development Famine Early Warning Systems Network (FEWS NET) Indefinite Quantity Contract, AID-OAA-I-12-00006, Task Order 1 (AID-OAA-TO-12-00003), TO4 (AID-OAA-TO-16-00015). The views expressed in this publication do not necessarily reflect the views of the United States Agency for International Development or the United States government.
Recommended Citation FEWS NET. 2018. Scenario Development for Food Security Early Warning. Washington, DC: FEWS NET.
©Cover photos: FEWS NET and Flickr Creative Commons.

FEWS NET Scenario Development for Food Security Early Warning January 2018
Famine Early Warning Systems Network iii
Table of Contents Acronyms and Abbreviations ........................................................................................................................................ iv Introduction ................................................................................................................................................................... 1 Scenario Development Steps ......................................................................................................................................... 2
STEP 1: Set Scenario Parameters ............................................................................................................................... 2 STEP 2: Describe and Classify Current Food Security ................................................................................................ 4 STEP 3: Develop Key Assumptions ............................................................................................................................. 9 Step 4: Describe Impacts on Household Income Sources ........................................................................................ 11 STEP 5: Describe Impacts on Household Food Sources ........................................................................................... 15 STEP 6: Describe and Classify Projected Household Food Security ......................................................................... 18 STEP 7: Describe and Classify Projected Area Food Security ................................................................................... 20 STEP 8: Identify Events that Could Change the Scenario ......................................................................................... 23
Guiding Principles for Scenario Development ............................................................................................................. 24 Annex I: Glossary of Key Terms ................................................................................................................................... 26 Annex II: Scenario Summary Table (SST) Template ..................................................................................................... 29 Annex III. SST Example ................................................................................................................................................. 35 Annex IV. Examples of Steps 4 and 5 ........................................................................................................................... 45
Figures Figure 1. Example of sources of cash income .............................................................................................................. 12
Tables Table 1. Type of livelihood change ................................................................................................................................ 6 Table 2. IPC phases and HEA categories ...................................................................................................................... 19

FEWS NET Scenario Development for Food Security Early Warning January 2018
Famine Early Warning Systems Network iv
Acronyms and Abbreviations CDR Crude Death Rate
CSI Coping Strategies Index
FCS Food Consumption Score
FEWS NET Famine Early Warning Systems Network
GAM Global Acute Malnutrition
HDDS Household Dietary Diversity Score
HEA Household Economy Approach
HH Household
HHS Household Hunger Scale
IPC Integrated Food Security Phase Classification
ML Most likely
mm Millimeter
MUAC Mid-Upper Arm Circumference
rCSI Reduced Coping Strategies Index
USAID United States Agency for International Development
U5DR Under Five Death Rate
WFP World Food Programme
FEWS NET Scenario Development for Food Security Early Warning January 2018
Famine Early Warning Systems Network 1
Introduction Food security early warning requires the estimation of future food security outcomes many months in advance, so that decision makers have adequate time to plan for and respond to potential humanitarian crises. However, the complex web of factors shaping food security makes it impossible to definitively predict future outcomes. Scenario development is a methodology that allows FEWS NET to reconcile these two issues by developing a “most likely” scenario of the future. This allows FEWS NET to fulfill its primary mandate to provide early warning on food security crises to decision makers. This paper is the first in a series of guidance documents developed by FEWS NET on integrating advanced sectoral concepts and techniques into the scenario development process.
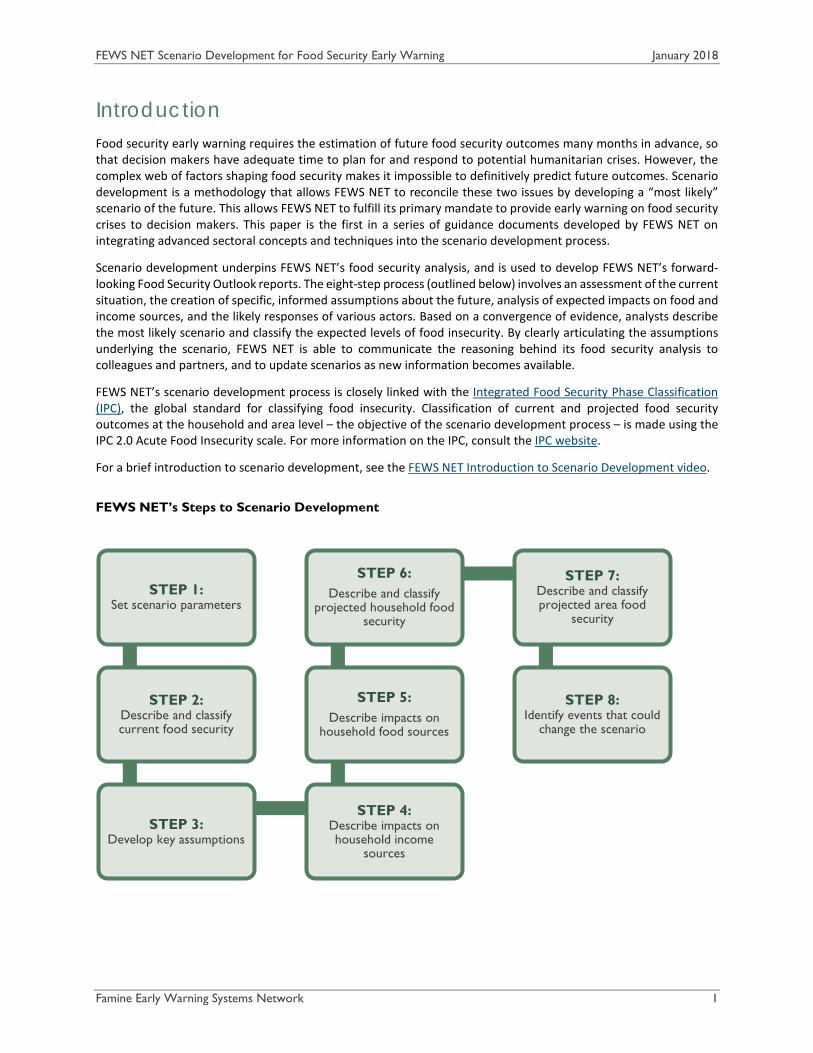
Scenario development underpins FEWS NET’s food security analysis, and is used to develop FEWS NET’s forward-looking Food Security Outlook reports. The eight-step process (outlined below) involves an assessment of the current situation, the creation of specific, informed assumptions about the future, analysis of expected impacts on food and income sources, and the likely responses of various actors. Based on a convergence of evidence, analysts describe the most likely scenario and classify the expected levels of food insecurity. By clearly articulating the assumptions underlying the scenario, FEWS NET is able to communicate the reasoning behind its food security analysis to colleagues and partners, and to update scenarios as new information becomes available.
FEWS NET’s scenario development process is closely linked with the Integrated Food Security Phase Classification (IPC), the global standard for classifying food insecurity. Classification of current and projected food security outcomes at the household and area level – the objective of the scenario development process – is made using the IPC 2.0 Acute Food Insecurity scale. For more information on the IPC, consult the IPC website.
For a brief introduction to scenario development, see the FEWS NET Introduction to Scenario Development video.
FEWS NET’s Steps to Scenario Development
STEP 1:Set scenario parameters
STEP 2:Describe and classify current food security
STEP 3:Develop key assumptions
STEP 4:Describe impacts on household income
sources
STEP 5:Describe impacts on
household food sources
STEP 6:Describe and classify
projected household food security
STEP 7:Describe and classify projected area food
security
STEP 8:Identify events that could
change the scenario
FEWS NET Scenario Development for Food Security Early Warning January 2018
Famine Early Warning Systems Network 2
Scenario Development Steps At its core, scenario development is little more than a sophisticated “if-then” statement. That is: given current conditions, if the assumptions underlying the scenario are accurate, then it is likely that the projected outcomes will occur. For the purpose of early warning, however, getting from “if” to “then” involves a multi-step process that requires analysis and assumptions at each stage.
FEWS NET uses Scenario Summary Tables (SSTs) to document the scenario development process. In the following descriptions of scenario development steps, the relevant portion of the SST is extracted. The full SST template is included in Annex II. An example of a completed SST is provided in Annex III.
STEP 1: Set Scenario Parameters
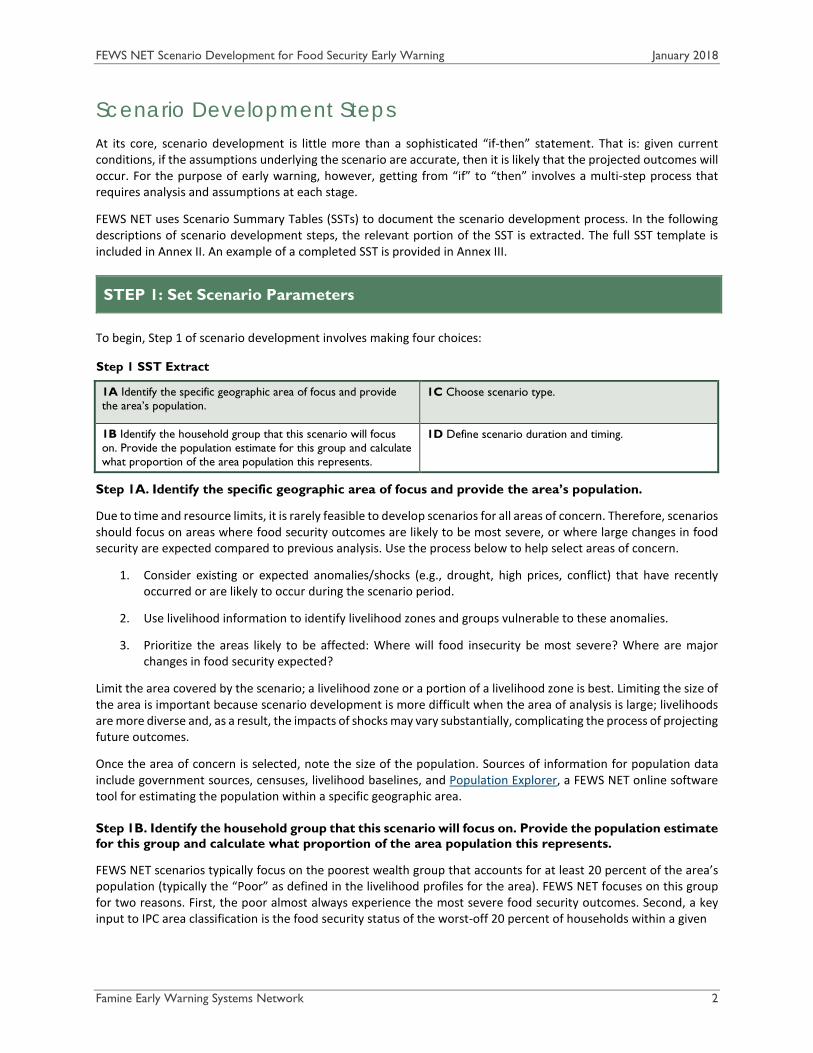
To begin, Step 1 of scenario development involves making four choices:
Step 1 SST Extract
1A Identify the specific geographic area of focus and provide the area’s population.
1C Choose scenario type.
1B Identify the household group that this scenario will focus on. Provide the population estimate for this group and calculate what proportion of the area population this represents.
1D Define scenario duration and timing.
Step 1A. Identify the specific geographic area of focus and provide the area’s population.
Due to time and resource limits, it is rarely feasible to develop scenarios for all areas of concern. Therefore, scenarios should focus on areas where food security outcomes are likely to be most severe, or where large changes in food security are expected compared to previous analysis. Use the process below to help select areas of concern.
1. Consider existing or expected anomalies/shocks (e.g., drought, high prices, conflict) that have recently occurred or are likely to occur during the scenario period.
2. Use livelihood information to identify livelihood zones and groups vulnerable to these anomalies.
3. Prioritize the areas likely to be affected: Where will food insecurity be most severe? Where are major changes in food security expected?
Limit the area covered by the scenario; a livelihood zone or a portion of a livelihood zone is best. Limiting the size of the area is important because scenario development is more difficult when the area of analysis is large; livelihoods are more diverse and, as a result, the impacts of shocks may vary substantially, complicating the process of projecting future outcomes.
Once the area of concern is selected, note the size of the population. Sources of information for population data include government sources, censuses, livelihood baselines, and Population Explorer, a FEWS NET online software tool for estimating the population within a specific geographic area.
Step 1B. Identify the household group that this scenario will focus on. Provide the population estimate for this group and calculate what proportion of the area population this represents.
FEWS NET scenarios typically focus on the poorest wealth group that accounts for at least 20 percent of the area’s population (typically the “Poor” as defined in the livelihood profiles for the area). FEWS NET focuses on this group for two reasons. First, the poor almost always experience the most severe food security outcomes. Second, a key input to IPC area classification is the food security status of the worst-off 20 percent of households within a given

FEWS NET Scenario Development for Food Security Early Warning January 2018
Famine Early Warning Systems Network 3
area. This rule is applied so that the analysis and mapping reflect the severity of food insecurity that is affecting a sizeable part of the population. Therefore, to construct an IPC-compatible map, analysis must cover this portion of the area’s population. Once the household group of focus is identified, calculate what proportion of the area’s population this group represents to ensure that the 20 percent rule is met.
Scenarios can also be built for specific groups, particularly if these groups are likely to face severe acute food insecurity (e.g., internally displaced persons (IDPs) or flood-affected populations), though this is less common.
Step 1C. Choose scenario type.
A “most likely (ML) scenario” is the default option for both FEWS NET and IPC 2.0 analysis. This type of scenario is often the most useful for decision makers. In situations where there has been great uncertainty regarding future food insecurity (e.g., uncertain election results with potentially major food security implications), FEWS NET has developed alternative scenarios to provide decision makers with greater information on a range of outcomes.
In rare cases, FEWS NET also develops “worst case” scenarios, particularly in situations where the risk of Famine (IPC Phase 5) is elevated. However, these types of scenarios should be developed carefully and should reflect a worst-case scenario that may actually occur rather than the absolute worst-case scenario, which has an extremely low probability of occurrence.
Step 1D. Define scenario duration and timing.
FEWS NET typically develops eight-month scenarios. Within that period, FEWS NET develops maps for three time periods: the current situation (the first month of the scenario period), the first projection period (the first four months, also called ML1), and the second projection period (the second four months, also called ML2). Having two projection periods helps to ensure that seasonality and the dynamic nature of acute food insecurity are captured and communicated in FEWS NET reports and maps.
TIP
FEWS NET has a modified SST specifically for scenarios focusing on internally displaced populations.

FEWS NET Scenario Development for Food Security Early Warning January 2018
Famine Early Warning Systems Network 4
STEP 2: Describe and Classify Current Food Security
In Step 2, analysts consider all available evidence to describe the current magnitude and severity of acute food insecurity. This step has four parts.
Step 2A. Summarize evidence of current food security conditions.
Current food security conditions might include food prices, progress of the current rainfall season, or ongoing humanitarian assistance programs (see additional examples on the right). The conditions described should be relevant for the household group and the current situation only (not the projection period). This section should also briefly touch on impacts at the household level. For example, rather than just stating, “reduced crop production levels,” analysts could state, “below-average harvests have reduced household stocks and caused earlier than normal market dependence.” However, note that household-level outcomes (food consumption, livelihood change) are not discussed until the next step.
Step 2B. Summarize evidence of current household food consumption and livelihood change.
This step focuses on household-level outcomes. As defined in the IPC manual, household-level outcomes refer to food consumption and livelihood change. To understand how food security outcomes are used to classify household- and area-level food insecurity, see the description on the next page.
Food Consumption Acute food insecurity analysis is primarily concerned with dietary quantity when assessing food consumption outcomes. Therefore, in this step, analysts should use available quantitative and qualitative evidence to evaluate whether households are currently able to access an adequate amount of food, roughly defined as, on average, 2,100/kcal/person/day. The quality of the diet is relatively less important when determining whether emergency response is needed. However, the quality of household food
Step 2 SST Extract
2A Summarize evidence of current food security conditions (e.g., seasonal progress, recent harvests, food prices, humanitarian assistance, etc.). (Current means beginning of the first month of the scenario period.)
2B Summarize evidence of current household food consumption and livelihood change. This could be direct evidence, like the result of a food security survey, or inferred evidence, like the outcome of livelihoods-based analysis.
Food consumption: Livelihood change:
2C Based on the response to 2A and 2B, classify the current food insecurity of the chosen household group (1B) using the IPC 2.0 Household Scale.
Household group (1B) classification:
2D Based on the household classification (2C), and available nutrition/mortality data, classify the overall area (1A) using the IPC 2.0 Area Scale.
Description of available nutrition information: Description of available mortality information: Area classification: In the absence of emergency assistance would this classification be at least one phase worse?
Examples of food security conditions
Staple food prices Market functioning
Cash crop prices Milk availability
Livestock prices Crop conditions
Wage levels Livestock or crop disease
Labor demand Security context
Fuel prices Household asset holdings
Regional/ international prices
Rainfall or snowfall performance
Trade context Political/policy context
Terms of trade Current assistance levels
Remittance flows Animal body conditions
Market supplies Recent crop production levels

FEWS NET Scenario Development for Food Security Early Warning January 2018
Famine Early Warning Systems Network 5
consumption can be used as a proxy to infer the degree to which household dietary quantity may be strained. For example, if households have stopped buying foods that are nutritionally important, this may be an indication that their ability to access enough food is threatened.
The following list summarizes the key questions analysts should strive to answer when describing food consumption outcomes:
Are households in the area of concern currently meeting basic food needs (on average 2,100/kcal/person/day)? Why or why not?
Are households meeting basic food needs through seasonally typical means, such as crop production or purchases? Or through less common means, such as atypical labor migration or wild food collection?
Have people switched to less preferred foods? Or stopped buying particular foods that are nutritionally important (oil, beans, milk, etc.)?
Is humanitarian assistance being delivered in the area of focus? To what degree is it reducing food and income deficits?1
Food consumption outcomes can be assessed using direct measurement or they can be inferred. Direct measurement refers to the use of food security outcome indicators. The four most commonly collected indicators are Food Consumption Score (FCS), Household Dietary Diversity Score (HDDS), Reduced Coping Strategies Index (rCSI), and Household Hunger Scale (HHS). Survey data on these indicators are proxies for household food consumption, as they do not measure caloric intake or availability of calories. Data on food security outcomes are most often representative of an area, and not a household group; this should be considered when using this information in classifying household group outcomes.
Food consumption outcomes can also be inferred by combining information on typical livelihood patterns and contributing factors with evidence of current conditions. For example, with good data on prices of key staples, food availability on markets, household incomes compared to average, and access to markets, analysts can make reliable inferences about food consumption. HEA outcome analysis is an advanced iteration of this type of inferred analysis. While HEA analysis does not provide survey data, the results of HEA analysis provide inferences about the availability of calories for household groups.
Livelihood Change In general, livelihood change is defined as any changes to the assets and/or strategies that households use to access food or income. Evidence of livelihood change is an important input to food security analysis. However, how this evidence is used in food security analysis depends on what caused the livelihood change to occur.
Evidence of livelihood change is used as a food security outcome when the changes to assets and/or strategies occur due to existing or anticipated difficulty in accessing an adequate quantity of food. For example, evidence that households are selling more livestock than usual to mitigate the impact of high food prices on household food access 1 Emergency assistance may affect household food consumption, labor opportunities, market supplies, prices, and/or levels of acute malnutrition. Therefore, it is extremely difficult to remove its impact from an assessment of food security outcomes. For example, simply removing direct food aid distribution from an assessment of household food sources does not provide an accurate picture of current conditions, as less direct impacts, such as those on prices and nutrition, have not been accounted for. For this reason, FEWS NET incorporates emergency assistance into its analysis of outcomes.
Understanding Food Security Outcomes at the Household and Area Level
Acute food insecurity classification using the IPC is based on four outcomes: food consumption, livelihood change, nutritional status, and mortality. These outcomes are classified using two different reference tables: the Household Reference Table and the Area Reference Table. These reference tables are used to reflect the different units of analysis represented by the outcomes.
While food consumption and livelihood change reflect household-level outcomes, nutritional status and mortality are monitored at the population level and capture area-level outcomes. Malnutrition is reported as a prevalence, meaning the proportion of cases in the population at a given time. Mortality is reported as a rate, meaning the frequency of occurrence within a population over a period of time.
For this reason, FEWS NET’s scenario development process first classifies household food insecurity, and then classifies area food insecurity. The household classification is one of the three inputs into the area classification, along with nutritional status and mortality outcomes.
FEWS NET Scenario Development for Food Security Early Warning January 2018
Famine Early Warning Systems Network 6
indicates a food security outcome and should be described in Step 2B. Considering this type of livelihood change is important to ensure that food insecure households are not overlooked because food consumption has been temporarily protected through the use of unsustainable coping strategies. For example, food consumption indicators collected from a pastoral household that has sold off its last female animals may suggest adequate food intake, despite the fact that in the medium term, the loss of its primary livelihood will result in severe food insecurity for this family.
For Step 2B, consider the following questions when evaluating livelihood change:
What key assets does the household group of interest rely on to access food and income?
What strategies do households typically use to gain income or access food?
Have households changed any of those livelihood strategies and/or asset holdings because of current or anticipated food gaps?
Alternatively, livelihood change driven by non-food security factors is not a food security outcome. For example, a significant loss of livestock due to cattle raiding or displacement due to conflict is not evidence of reduced food consumption. They are not actions taken by the household in response to actual or anticipated food shortages. Thus, Step 2B should not capture all possible changes to livelihoods, but shifts or changes to livelihoods made due to food security factors.
However, while evidence of this second type of livelihood changes does not fit in Step 2B, it remains critical to food security analysis and should be described as part of Step 2A. For example, if the household group of interest has been displaced from its homes into nearby swamps, this is not a food security outcome, but it is an essential piece of information about current conditions that will inform how food security evolves for this population.
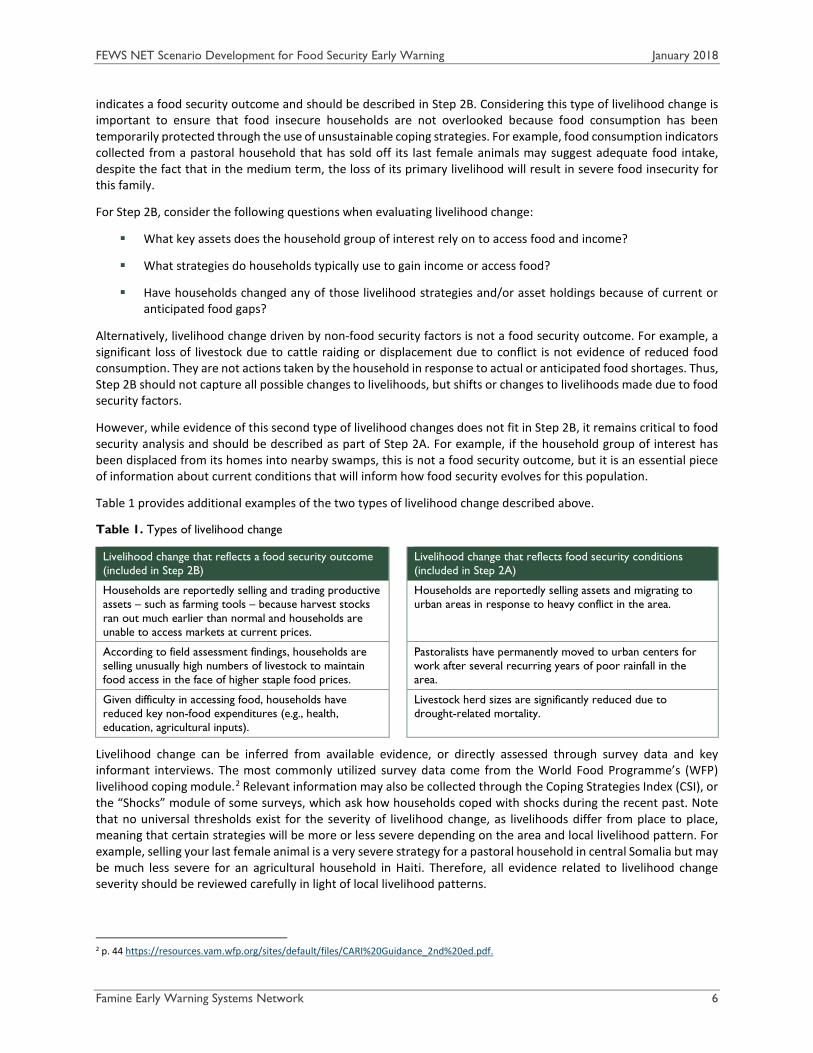
Table 1 provides additional examples of the two types of livelihood change described above.
Table 1. Types of livelihood change
Livelihood change that reflects a food security outcome (included in Step 2B)
Livelihood change that reflects food security conditions (included in Step 2A)
Households are reportedly selling and trading productive assets – such as farming tools – because harvest stocks ran out much earlier than normal and households are unable to access markets at current prices.
Households are reportedly selling assets and migrating to urban areas in response to heavy conflict in the area.
According to field assessment findings, households are selling unusually high numbers of livestock to maintain food access in the face of higher staple food prices.
Pastoralists have permanently moved to urban centers for work after several recurring years of poor rainfall in the area.
Given difficulty in accessing food, households have reduced key non-food expenditures (e.g., health, education, agricultural inputs).
Livestock herd sizes are significantly reduced due to drought-related mortality.
Livelihood change can be inferred from available evidence, or directly assessed through survey data and key informant interviews. The most commonly utilized survey data come from the World Food Programme’s (WFP) livelihood coping module.2 Relevant information may also be collected through the Coping Strategies Index (CSI), or the “Shocks” module of some surveys, which ask how households coped with shocks during the recent past. Note that no universal thresholds exist for the severity of livelihood change, as livelihoods differ from place to place, meaning that certain strategies will be more or less severe depending on the area and local livelihood pattern. For example, selling your last female animal is a very severe strategy for a pastoral household in central Somalia but may be much less severe for an agricultural household in Haiti. Therefore, all evidence related to livelihood change severity should be reviewed carefully in light of local livelihood patterns.
2 p. 44 https://resources.vam.wfp.org/sites/default/files/CARI%20Guidance_2nd%20ed.pdf.
FEWS NET Scenario Development for Food Security Early Warning January 2018
Famine Early Warning Systems Network 7
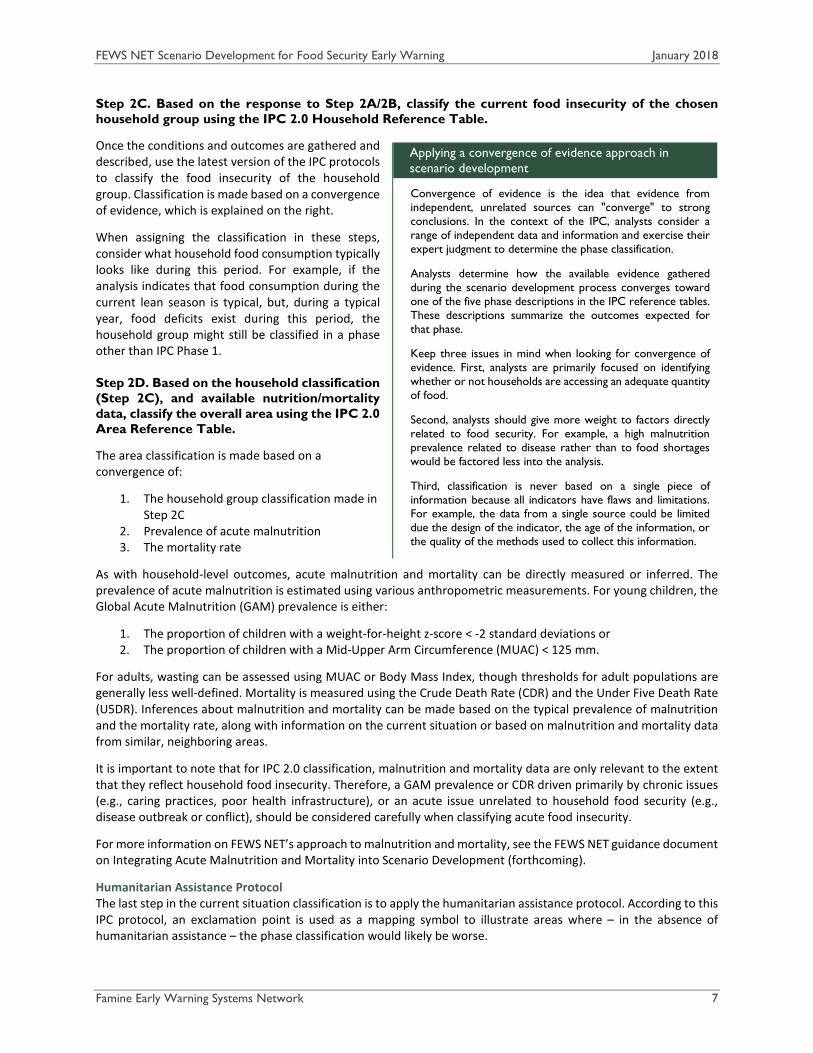
Step 2C. Based on the response to Step 2A/2B, classify the current food insecurity of the chosen household group using the IPC 2.0 Household Reference Table.
Once the conditions and outcomes are gathered and described, use the latest version of the IPC protocols to classify the food insecurity of the household group. Classification is made based on a convergence of evidence, which is explained on the right.
When assigning the classification in these steps, consider what household food consumption typically looks like during this period. For example, if the analysis indicates that food consumption during the current lean season is typical, but, during a typical year, food deficits exist during this period, the household group might still be classified in a phase other than IPC Phase 1.
Step 2D. Based on the household classification (Step 2C), and available nutrition/mortality data, classify the overall area using the IPC 2.0 Area Reference Table.
The area classification is made based on a convergence of:
1. The household group classification made in Step 2C
2. Prevalence of acute malnutrition 3. The mortality rate
As with household-level outcomes, acute malnutrition and mortality can be directly measured or inferred. The prevalence of acute malnutrition is estimated using various anthropometric measurements. For young children, the Global Acute Malnutrition (GAM) prevalence is either:
1. The proportion of children with a weight-for-height z-score < -2 standard deviations or 2. The proportion of children with a Mid-Upper Arm Circumference (MUAC) < 125 mm.
For adults, wasting can be assessed using MUAC or Body Mass Index, though thresholds for adult populations are generally less well-defined. Mortality is measured using the Crude Death Rate (CDR) and the Under Five Death Rate (U5DR). Inferences about malnutrition and mortality can be made based on the typical prevalence of malnutrition and the mortality rate, along with information on the current situation or based on malnutrition and mortality data from similar, neighboring areas.
It is important to note that for IPC 2.0 classification, malnutrition and mortality data are only relevant to the extent that they reflect household food insecurity. Therefore, a GAM prevalence or CDR driven primarily by chronic issues (e.g., caring practices, poor health infrastructure), or an acute issue unrelated to household food security (e.g., disease outbreak or conflict), should be considered carefully when classifying acute food insecurity.
For more information on FEWS NET’s approach to malnutrition and mortality, see the FEWS NET guidance document on Integrating Acute Malnutrition and Mortality into Scenario Development (forthcoming).
Humanitarian Assistance Protocol The last step in the current situation classification is to apply the humanitarian assistance protocol. According to this IPC protocol, an exclamation point is used as a mapping symbol to illustrate areas where – in the absence of humanitarian assistance – the phase classification would likely be worse.
Applying a convergence of evidence approach in scenario development
Convergence of evidence is the idea that evidence from independent, unrelated sources can "converge" to strong conclusions. In the context of the IPC, analysts consider a range of independent data and information and exercise their expert judgment to determine the phase classification.
Analysts determine how the available evidence gathered during the scenario development process converges toward one of the five phase descriptions in the IPC reference tables. These descriptions summarize the outcomes expected for that phase.
Keep three issues in mind when looking for convergence of evidence. First, analysts are primarily focused on identifying whether or not households are accessing an adequate quantity of food.
Second, analysts should give more weight to factors directly related to food security. For example, a high malnutrition prevalence related to disease rather than to food shortages would be factored less into the analysis.
Third, classification is never based on a single piece of information because all indicators have flaws and limitations. For example, the data from a single source could be limited due the design of the indicator, the age of the information, or the quality of the methods used to collect this information.

FEWS NET Scenario Development for Food Security Early Warning January 2018
Famine Early Warning Systems Network 8
It is important to note that the exclamation point does not show every place where humanitarian assistance is being provided or having an impact. Instead, it indicates areas where assistance has substantially changed food security outcomes. For example, a one-week ration that is widely distributed to many households after a flood may have a short-term impact but may not be sufficient to change the phase classification over the course of a four-month analysis period. In this situation, the map would not have an exclamation point, even though assistance has been provided.
Development programs, interannual assistance, and safety net programs should be considered when developing a current classification and described in Step 2A. However, the impact of this type of assistance is not represented with the exclamation point because these programs are part of typical food and income sources.
The following case study is a simplified example of applying a convergence of evidence approach to a range of household information, including humanitarian assistance data. Note that in a typical scenario analysis, more detailed information on context and contributing factors would be included.
Case Study: Kapoeta North County, South Sudan (August 2017)
Available Data In Kapoeta North, much of the outcome information came from the multi-partner Food Security and Nutrition Monitoring Survey (FSNMS) and a Save the Children SMART survey, both carried out in August 2017 (see table on the right). Results from the FCS, a weighted sum of food groups consumed in the last week, suggested Emergency (IPC Phase 4) outcomes for the worst-off households at the time of data collection.
Meanwhile, results from the HHS, which collects information on whether households have experienced severe hunger in the past 30 days, suggested that most households were experiencing Crisis (IPC Phase 3) during this period. At the area level, the prevalence of GAM was 17.3 percent, just over the IPC Phase 4 threshold of 15 percent. The CDR was 1.21/10,000/day, also indicative of IPC Phase 4.
Additional Contextual Factors Households in Kapoeta North identified sale of livestock and livestock products, hunting and gathering, and sale of
firewood as the three most important sources of food and income in the three months preceding the survey. Food aid was the fourth most important source.
Emergency Food Assistance: In Kapoeta North, between June and August, a half ration was delivered to approximately 27,353 beneficiaries/month, according to WFP distribution reports. This reached an estimated 73 percent of the population identified as in need of assistance during the May 2017 IPC analysis. This assistance was delivered both prior to and during FSNMS data collection. Households reported sharing less than half of the received assistance.
A serious cholera outbreak was ongoing during the months preceding data collection. Eighty percent of deaths recorded by the SMART survey resulted from the disease.
Phase Classification Conclusion Household food consumption in Kapoeta North relied on a number of sources in August 2017. However, given high food prices and low incomes, the diversity of food purchased by households was likely low. In addition, though high levels of humanitarian assistance were delivered to Kapoeta North, that assistance included only cereals and oil (or at times cereals, oil, and pulses). Therefore, given reduced purchasing power and a partial reliance on food aid, it is expected that many households were consuming only 2–3 food groups at the time of the FSNMS. This likely explains why a high percentage of households reported a Poor FCS. However, given the absence of households reporting Severe Hunger according to the HHS, it is unlikely that large food deficits were occurring at the household level in August. Meanwhile, though levels of acute malnutrition and mortality were indicative of IPC Phase 4, available evidence suggests that these indicators would have been lower in the absence of the ongoing cholera outbreak. Given the above, analysts concluded that Kapoeta North was in Crisis (IPC Phase 3!) in August 2017, with large-scale humanitarian assistance preventing more extreme outcomes.
Case study available data
Indicator Source Prevalence Indicative Phase
FCS FSNMS Round 20
Poor 57.9%, Borderline 8.4%
Phase 4
HHS FSNMS Round 20
Severe 0.0%, Moderate 99.0%
Phase 3
GAM SCI SMART Survey
17.3% (95% CI 13.9–21.4)
Phase 4
CDR SCI SMART Survey
1.21/10,000/day Phase 4

FEWS NET Scenario Development for Food Security Early Warning January 2018
Famine Early Warning Systems Network 9
STEP 3: Develop Key Assumptions
In Step 3 of scenario development, analysts develop a series of key assumptions about events that are expected to occur during the scenario period.
Step 3A. List the factors relevant to food security that are expected to behave normally during the scenario period.
The purpose of this step is to highlight key events – related to agroclimatology, market and trade patterns, access to employment, migration patterns, and other factors – that will play a role in food security during the scenario period and that are expected to behave normally. For example, if typical labor migration patterns or normal expenditures on agricultural inputs are anticipated, these should be noted here. To focus the analysis, analysts should concentrate on “factors that matter,” rather than listing all food security-related factors.
Information on local livelihoods, including seasonal activity and consumption calendars, should help direct which factors to include in this step. Depending on the season, assumptions might relate to any of the following:
Rainfall performance Wage levels Crop production Staple food prices Pasture/water availability Persistent insecurity Animal conceptions Safety net programs or interannual assistance Remittance flows Import levels Wage labor demand
External issues, such as international prices, should also be considered as appropriate.
Step 3B. List the key shocks or anomalies anticipated to occur during the scenario period and that will affect food security. These should be events that are relevant to the chosen household group.
Shocks are atypical events that are expected to occur during the scenario period and to have a significant impact on food security. Multiple shocks may occur during a scenario period. For example, a policy decision to stop input subsidies could occur shortly after poor rainfall is forecast and while conflict continues along a key border point.
Once likely shocks are identified, make assumptions about their timing, duration, and severity. To develop these assumptions, analysts should make use of existing guidance, sectoral experts, historical data, and their own expert judgment. While this may require additional analysis and/or technical support, specificity here makes it easier to accurately identify the impact of these shocks in later steps. Analysts will need to invest time and effort into developing detailed assumptions based on the best available evidence. The other documents in this series (forthcoming) are intended to provide more detailed guidance on making assumptions for key technical areas. The boxes below provide examples of weak and strong assumptions.
Step 3 SST Extract
3A List the key factors relevant to food security that are expected to behave normally during the scenario period.
3B List the key shocks or anomalies that are expected to occur during the scenario period and that will affect food security. These events should be relevant to the chosen household group (1B). For each event, describe level of severity and expected timing as specifically as possible.
3C Is humanitarian assistance during the scenario period planned, funded, and likely? If so, describe these assistance plans (location, planned number of beneficiaries, type of program, amount, duration, and frequency).
FEWS NET Scenario Development for Food Security Early Warning January 2018
Famine Early Warning Systems Network 10
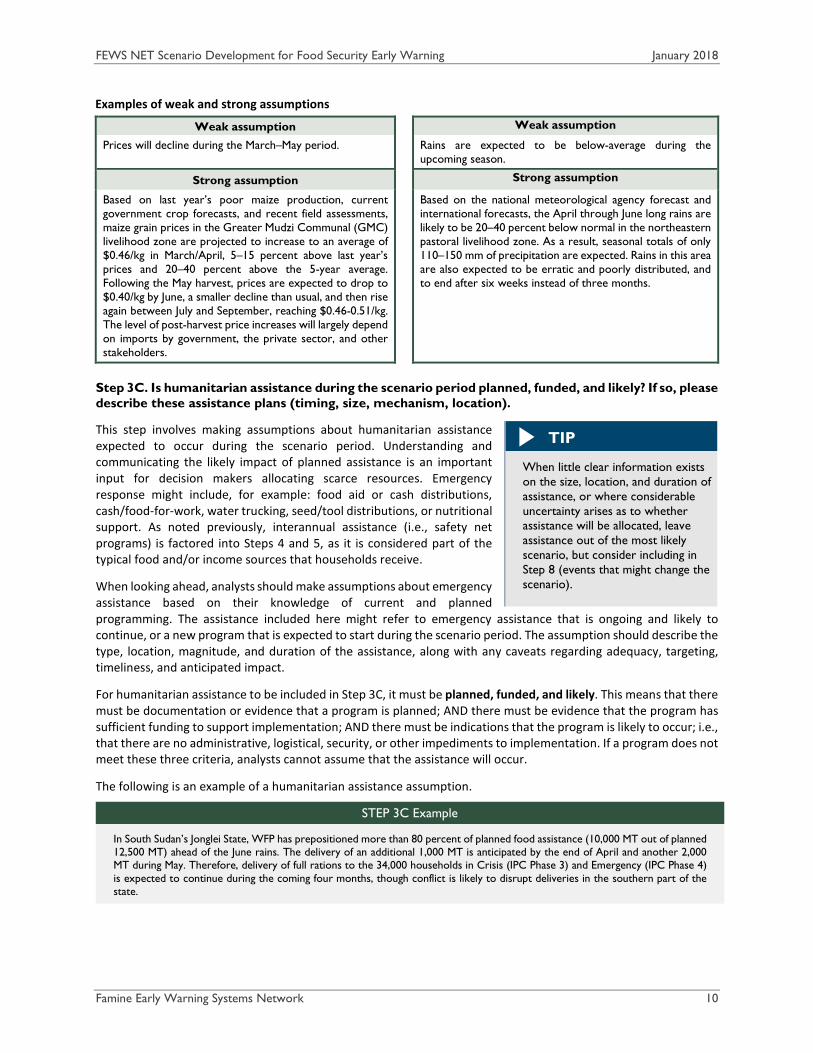
Examples of weak and strong assumptions
Weak assumption Weak assumption
Prices will decline during the March–May period. Rains are expected to be below-average during the upcoming season.
Strong assumption Strong assumption
Based on last year’s poor maize production, current government crop forecasts, and recent field assessments, maize grain prices in the Greater Mudzi Communal (GMC) livelihood zone are projected to increase to an average of $0.46/kg in March/April, 5–15 percent above last year’s prices and 20–40 percent above the 5-year average. Following the May harvest, prices are expected to drop to $0.40/kg by June, a smaller decline than usual, and then rise again between July and September, reaching $0.46-0.51/kg. The level of post-harvest price increases will largely depend on imports by government, the private sector, and other stakeholders.
Based on the national meteorological agency forecast and international forecasts, the April through June long rains are likely to be 20–40 percent below normal in the northeastern pastoral livelihood zone. As a result, seasonal totals of only 110–150 mm of precipitation are expected. Rains in this area are also expected to be erratic and poorly distributed, and to end after six weeks instead of three months.
Step 3C. Is humanitarian assistance during the scenario period planned, funded, and likely? If so, please describe these assistance plans (timing, size, mechanism, location).
This step involves making assumptions about humanitarian assistance expected to occur during the scenario period. Understanding and communicating the likely impact of planned assistance is an important input for decision makers allocating scarce resources. Emergency response might include, for example: food aid or cash distributions, cash/food-for-work, water trucking, seed/tool distributions, or nutritional support. As noted previously, interannual assistance (i.e., safety net programs) is factored into Steps 4 and 5, as it is considered part of the typical food and/or income sources that households receive.
When looking ahead, analysts should make assumptions about emergency assistance based on their knowledge of current and planned programming. The assistance included here might refer to emergency assistance that is ongoing and likely to continue, or a new program that is expected to start during the scenario period. The assumption should describe the type, location, magnitude, and duration of the assistance, along with any caveats regarding adequacy, targeting, timeliness, and anticipated impact.
For humanitarian assistance to be included in Step 3C, it must be planned, funded, and likely. This means that there must be documentation or evidence that a program is planned; AND there must be evidence that the program has sufficient funding to support implementation; AND there must be indications that the program is likely to occur; i.e., that there are no administrative, logistical, security, or other impediments to implementation. If a program does not meet these three criteria, analysts cannot assume that the assistance will occur.
The following is an example of a humanitarian assistance assumption.
STEP 3C Example
In South Sudan’s Jonglei State, WFP has prepositioned more than 80 percent of planned food assistance (10,000 MT out of planned 12,500 MT) ahead of the June rains. The delivery of an additional 1,000 MT is anticipated by the end of April and another 2,000 MT during May. Therefore, delivery of full rations to the 34,000 households in Crisis (IPC Phase 3) and Emergency (IPC Phase 4) is expected to continue during the coming four months, though conflict is likely to disrupt deliveries in the southern part of the state.
TIP
When little clear information exists on the size, location, and duration of assistance, or where considerable uncertainty arises as to whether assistance will be allocated, leave assistance out of the most likely scenario, but consider including in Step 8 (events that might change the scenario).
FEWS NET Scenario Development for Food Security Early Warning January 2018
Famine Early Warning Systems Network 11
Step 4: Describe Impacts on Household Income Sources
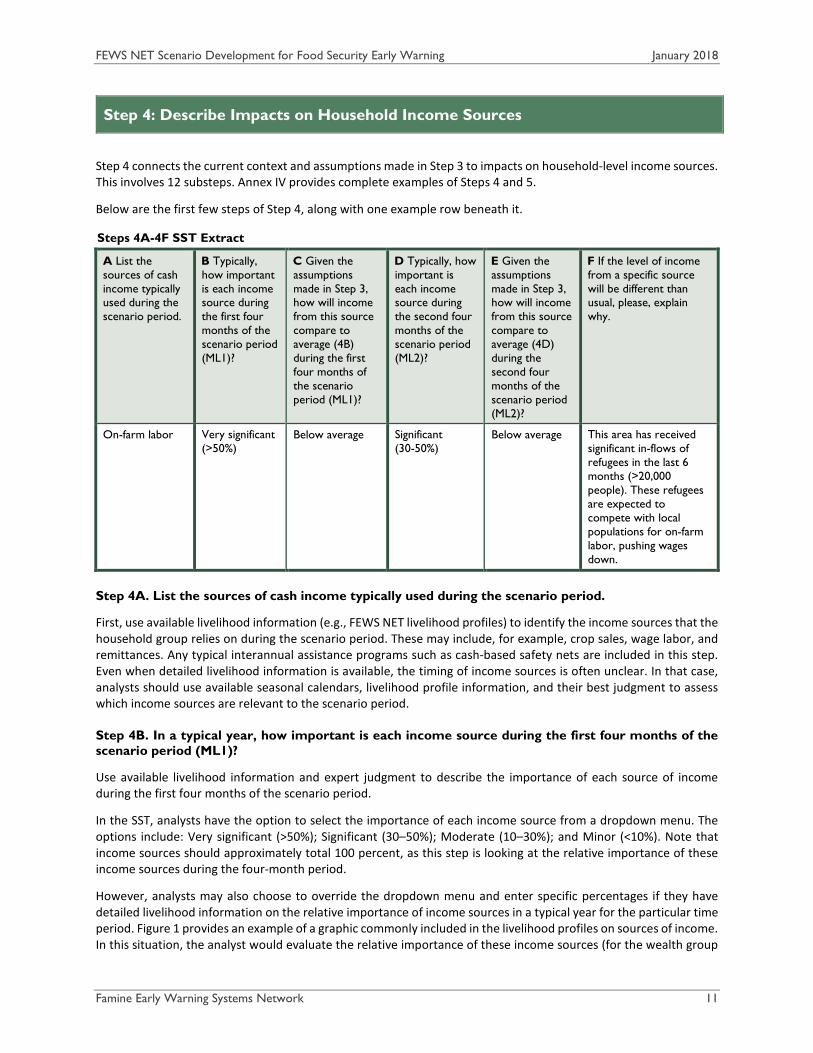
Step 4 connects the current context and assumptions made in Step 3 to impacts on household-level income sources. This involves 12 substeps. Annex IV provides complete examples of Steps 4 and 5.
Below are the first few steps of Step 4, along with one example row beneath it.
Steps 4A-4F SST Extract
A List the sources of cash income typically used during the scenario period.
B Typically, how important is each income source during the first four months of the scenario period (ML1)?
C Given the assumptions made in Step 3, how will income from this source compare to average (4B) during the first four months of the scenario period (ML1)?
D Typically, how important is each income source during the second four months of the scenario period (ML2)?
E Given the assumptions made in Step 3, how will income from this source compare to average (4D) during the second four months of the scenario period (ML2)?
F If the level of income from a specific source will be different than usual, please, explain why.
On-farm labor Very significant (>50%)
Below average Significant (30-50%)
Below average This area has received significant in-flows of refugees in the last 6 months (>20,000 people). These refugees are expected to compete with local populations for on-farm labor, pushing wages down.
Step 4A. List the sources of cash income typically used during the scenario period.
First, use available livelihood information (e.g., FEWS NET livelihood profiles) to identify the income sources that the household group relies on during the scenario period. These may include, for example, crop sales, wage labor, and remittances. Any typical interannual assistance programs such as cash-based safety nets are included in this step. Even when detailed livelihood information is available, the timing of income sources is often unclear. In that case, analysts should use available seasonal calendars, livelihood profile information, and their best judgment to assess which income sources are relevant to the scenario period.
Step 4B. In a typical year, how important is each income source during the first four months of the scenario period (ML1)?
Use available livelihood information and expert judgment to describe the importance of each source of income during the first four months of the scenario period.
In the SST, analysts have the option to select the importance of each income source from a dropdown menu. The options include: Very significant (>50%); Significant (30–50%); Moderate (10–30%); and Minor (<10%). Note that income sources should approximately total 100 percent, as this step is looking at the relative importance of these income sources during the four-month period.
However, analysts may also choose to override the dropdown menu and enter specific percentages if they have detailed livelihood information on the relative importance of income sources in a typical year for the particular time period. Figure 1 provides an example of a graphic commonly included in the livelihood profiles on sources of income. In this situation, the analyst would evaluate the relative importance of these income sources (for the wealth group

FEWS NET Scenario Development for Food Security Early Warning January 2018
Famine Early Warning Systems Network 12
of concern) within the context of seasonal fluctuations. Food crop sales, for example, are likely available only during certain months. The ~20 percent that this source contributes over the course of the year might actually be zero percent during the scenario period, or it might be relatively more important in the post-harvest period. If HEA baselines are available, the associated Livelihood Impact Analysis Spreadsheet (LIAS) will provide a detailed month-by-month accounting of income sources that can be used for this step.
Step 4C. Given the assumptions made in Step 3, how will income from this source compare to average (4B) during the first four months of the scenario period (ML1)?
Once typical income sources and their relative importance during ML1 are established, describe how income from each source will compare to the same time period during a normal year, given the typical and atypical events described in the previous step. Will income for each source be higher, lower, or the same? The analysis should consider the current conditions and outcomes described in Step 2, the assumptions made in Step 3, and historical information (i.e., what happened under similar circumstances in the past).
This section includes any livelihood expandability – i.e., increased reliance on a typical income source. For example, if households typically rely on construction labor, but this time of year they will double their construction labor income in response to an expected shock, this increase would be reflected in this step (and also potentially in Step 4E).
Again, analysts can choose a response from the dropdown menu in the SST, or they can enter a specific percentage if there is enough information and evidence to allow this level of precision.
Step 4D. Typically, how important is each income source during the second four months of the scenario period (ML2)?
Steps 4D and 4E mirror Steps 4B and 4C, but for the ML2 period. Again, use expert judgment and available livelihood information to determine the relative importance of this income source during the second four months.
Step 4E. Given the assumptions made in Step 3, how will income from this source compare to average (4D) during the second four months of the scenario period (ML2)?
In this step, analysts will again make projections of income sources based on the assumptions made in Step 3, compared to typical income sources during these four months of the year.
Step 4F. If the level of income from a specific source will be different than usual, please explain why.
Provide an explanation that fully details the reasons behind the expected changes (or lack of changes) in income sources in ML1 and ML2.
STEP 4F Examples
In Lower Shabelle, income from crop sales is expected to be significantly below average during ML1 and ML2, based on a recent crop assessment that found that production of maize (the major cash crop) had declined by 66 percent.
Income from hay sales is expected to be 35 percent below typical levels. Assuming that hay production in 2015/16 is correlated relatively closely with rainfall, hay production is expected to be 50 percent of average. FEWS NET’s interviews with hay middlemen indicate that prices are likely to be approximately 133 percent of average given reduced production and increased demand. Due to the drop in production, poorer households will sell less hay than average. And while prices will be higher, they are not expected to be high enough to offset lower sales.
Figure 1. Example of sources of cash income
Source: FEWS NET/ Food Economy Group
FEWS NET Scenario Development for Food Security Early Warning January 2018
Famine Early Warning Systems Network 13
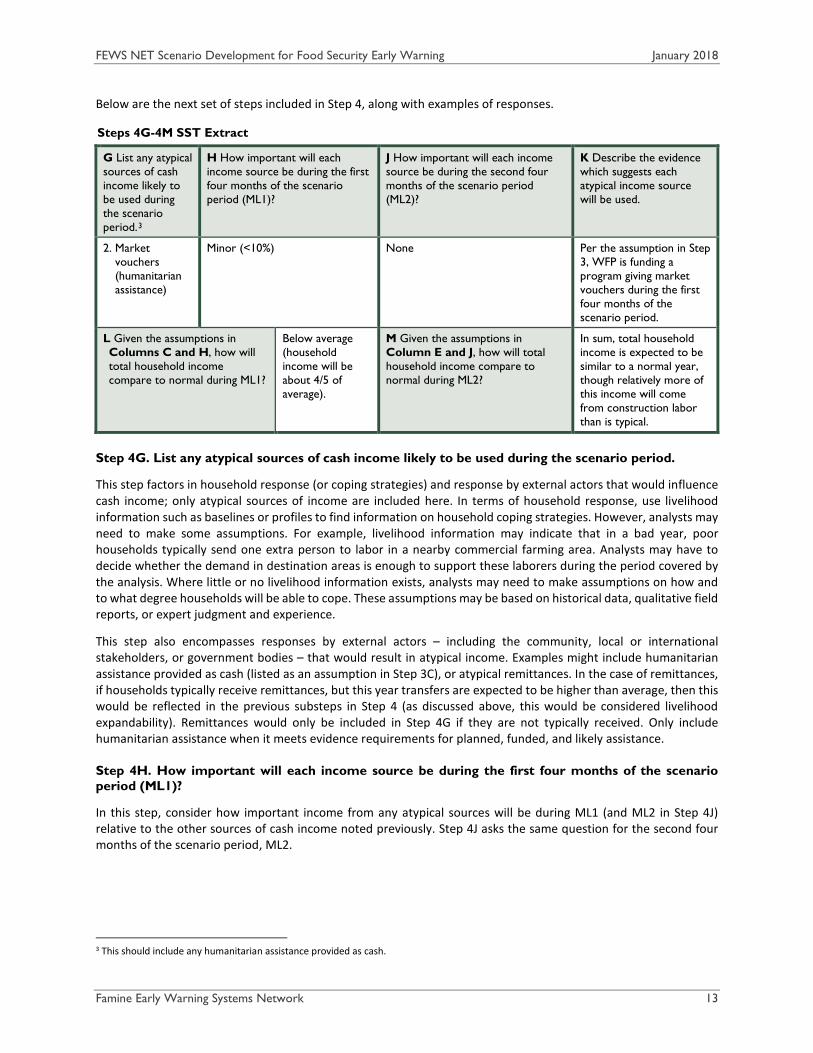
Below are the next set of steps included in Step 4, along with examples of responses.
Steps 4G-4M SST Extract
G List any atypical sources of cash income likely to be used during the scenario period.3
H How important will each income source be during the first four months of the scenario period (ML1)?
J How important will each income source be during the second four months of the scenario period (ML2)?
K Describe the evidence which suggests each atypical income source will be used.
2. Market vouchers (humanitarian assistance)
Minor (<10%) None Per the assumption in Step 3, WFP is funding a program giving market vouchers during the first four months of the scenario period.
L Given the assumptions in Columns C and H, how will total household income compare to normal during ML1?
Below average (household income will be about 4/5 of average).
M Given the assumptions in Column E and J, how will total household income compare to normal during ML2?
In sum, total household income is expected to be similar to a normal year, though relatively more of this income will come from construction labor than is typical.
Step 4G. List any atypical sources of cash income likely to be used during the scenario period.
This step factors in household response (or coping strategies) and response by external actors that would influence cash income; only atypical sources of income are included here. In terms of household response, use livelihood information such as baselines or profiles to find information on household coping strategies. However, analysts may need to make some assumptions. For example, livelihood information may indicate that in a bad year, poor households typically send one extra person to labor in a nearby commercial farming area. Analysts may have to decide whether the demand in destination areas is enough to support these laborers during the period covered by the analysis. Where little or no livelihood information exists, analysts may need to make assumptions on how and to what degree households will be able to cope. These assumptions may be based on historical data, qualitative field reports, or expert judgment and experience.
This step also encompasses responses by external actors – including the community, local or international stakeholders, or government bodies – that would result in atypical income. Examples might include humanitarian assistance provided as cash (listed as an assumption in Step 3C), or atypical remittances. In the case of remittances, if households typically receive remittances, but this year transfers are expected to be higher than average, then this would be reflected in the previous substeps in Step 4 (as discussed above, this would be considered livelihood expandability). Remittances would only be included in Step 4G if they are not typically received. Only include humanitarian assistance when it meets evidence requirements for planned, funded, and likely assistance.
Step 4H. How important will each income source be during the first four months of the scenario period (ML1)?
In this step, consider how important income from any atypical sources will be during ML1 (and ML2 in Step 4J) relative to the other sources of cash income noted previously. Step 4J asks the same question for the second four months of the scenario period, ML2.
3 This should include any humanitarian assistance provided as cash.
FEWS NET Scenario Development for Food Security Early Warning January 2018
Famine Early Warning Systems Network 14
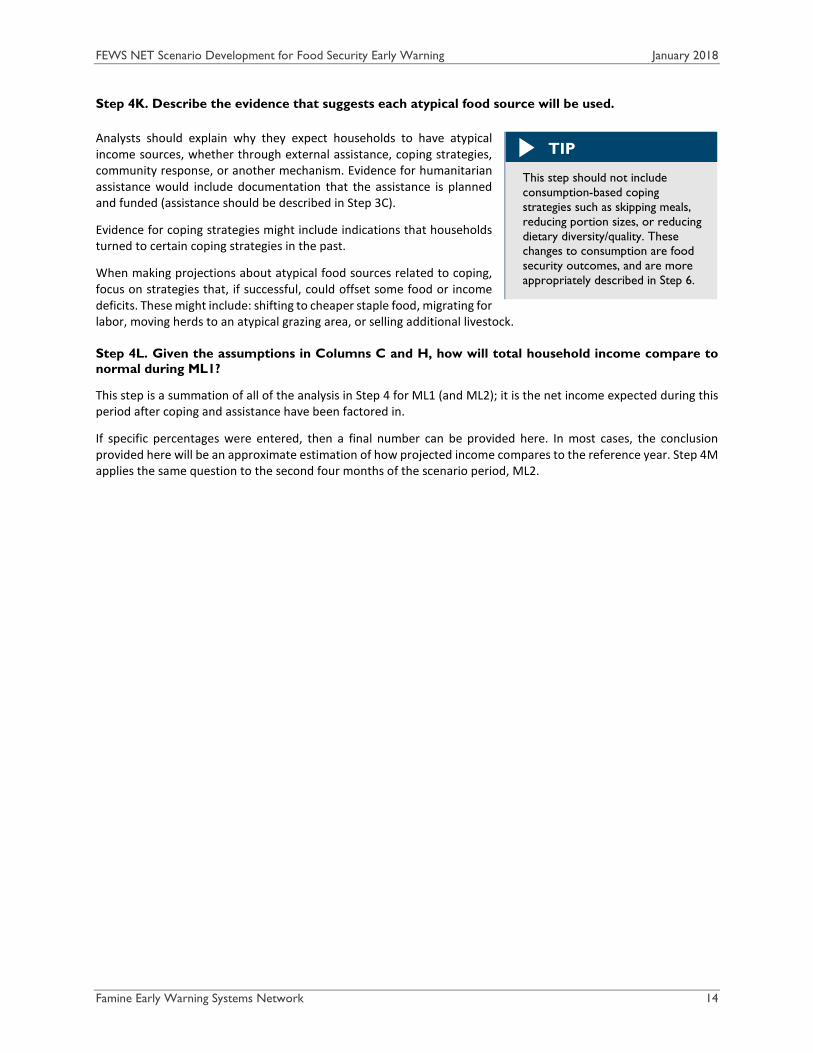
Step 4K. Describe the evidence that suggests each atypical food source will be used.
Analysts should explain why they expect households to have atypical income sources, whether through external assistance, coping strategies, community response, or another mechanism. Evidence for humanitarian assistance would include documentation that the assistance is planned and funded (assistance should be described in Step 3C).
Evidence for coping strategies might include indications that households turned to certain coping strategies in the past.
When making projections about atypical food sources related to coping, focus on strategies that, if successful, could offset some food or income deficits. These might include: shifting to cheaper staple food, migrating for labor, moving herds to an atypical grazing area, or selling additional livestock.
Step 4L. Given the assumptions in Columns C and H, how will total household income compare to normal during ML1?
This step is a summation of all of the analysis in Step 4 for ML1 (and ML2); it is the net income expected during this period after coping and assistance have been factored in.
If specific percentages were entered, then a final number can be provided here. In most cases, the conclusion provided here will be an approximate estimation of how projected income compares to the reference year. Step 4M applies the same question to the second four months of the scenario period, ML2.
TIP
This step should not include consumption-based coping strategies such as skipping meals, reducing portion sizes, or reducing dietary diversity/quality. These changes to consumption are food security outcomes, and are more appropriately described in Step 6.

FEWS NET Scenario Development for Food Security Early Warning January 2018
Famine Early Warning Systems Network 15
STEP 5: Describe Impacts on Household Food Sources
Step 5 is very similar in structure to Step 4 but it focuses on food sources. Income sources are analyzed before food sources because a major food source is often market purchases. Thus, to understand how much purchase is possible, the analyst must have determined how much cash households have earned or will earn. Annex IV provides a complete example of Step 5.
The table below shows the first few steps in Step 5, along with an example of responses.
Steps 5A-5F SST Extract
A List the sources of food typically used during the scenario period.
B Typically, how important is each food source during the first four months of the scenario period (ML1)?
C Given the assumptions made in Step 3, how will food from this source compare to average (4B) during the first four months of the scenario period (ML1)?
D Typically, how important is each food source during the second four months of the scenario period (ML2)?
E Given the assumptions made in Step 3, how will food from this source compare to average (4D) during the second four months of the scenario period (ML2)?
F If the level of food from a specific source will be different than usual, please, explain why.
1. Own crop production
Moderate (10-30%)
No change Significant (30-50%)
Below average Given expectations for average rainfall, food from own crop production will remain about average.
Step 5A. List the sources of food typically consumed during the scenario period.
These may include, for example: own crop/animal production, market purchases using cash or credit, safety net programs, or gifts. Market purchase – if relevant – should be included as the last food source in this step. The amount of food households will purchase and the income they have to purchase it (estimated in Step 4) will determine how purchases may change compared to usual. This step should include any typical interannual assistance programs such as food-based safety nets or purchase of government-subsidized food.
Step 5B. Typically, how important is each food source during the first four months of the scenario period (ML1)?
Use available livelihood information and expert judgment to describe the importance of each source of food during the first four months of the scenario period.
In the SST, analysts have the option to select the importance of each food source from a dropdown menu. The options include: Very significant (>50%); Significant (30–50%); Moderate (10–30%); Minor (<10%). Note that food sources should total approximately 100 percent, as this step is looking at the relative importance of these food sources during the four-month period. As with income sources, analysts may choose to override the dropdown menu and enter specific percentages if they have detailed livelihood information on the relative importance of food sources in a typical year.
Step 5C. Given the assumptions made in Step 3, how will food from this source compare to average during the first four months of the scenario period (ML1)?
Once typical food sources and their relative importance are established, indicate how access to food from each source will compare to a normal year. Will access be higher, lower, or the same? Take into account the current
FEWS NET Scenario Development for Food Security Early Warning January 2018
Famine Early Warning Systems Network 16
conditions and outcomes described in Step 2, the assumptions made in Step 3, the income context described in Step 4, and historical information (for example, what happened under similar circumstances in the past?).
When thinking about market purchase compared to normal, first consider:
1. Purchasing power
Income and how it compares to normal
Prices compared to normal
2. Reliance on the market in response to changes in other food sources
Then evaluate how much food households will access from the market compared to average. The conclusion in this step should not reflect how household reliance on the market differs from average; instead, it reflects how the amount of food accessed from this source will differ from a typical year.
Step 5D. Typically, how important is each food source during the second four months of the scenario period (ML2)?
As in Step 5B, this step describes the relative importance of food sources during a typical year for these particular four months.
Step 5E. Given the assumptions made in Step 3, how will food from this source compare to average during the second four months of the scenario period (ML2)?
In this step, analysts will again make projections of food sources based on the assumptions made in Step 3, compared to typical food sources during these four months of the year.
Step 5F. If the level of food from a specific source will be different than usual, please explain why.
See the example below for the type of response that may be provided in this box.
STEP 5F Example
The assumption of a 50 percent reduction in food from in-kind wage labor is based on preliminary crop production data that indicate significant local crop failure, an expectation that already-high maize prices will rise further (eroding in-kind wages), and increased border restrictions that raised the cost of labor migration to surplus-producing farms in Mozambique.
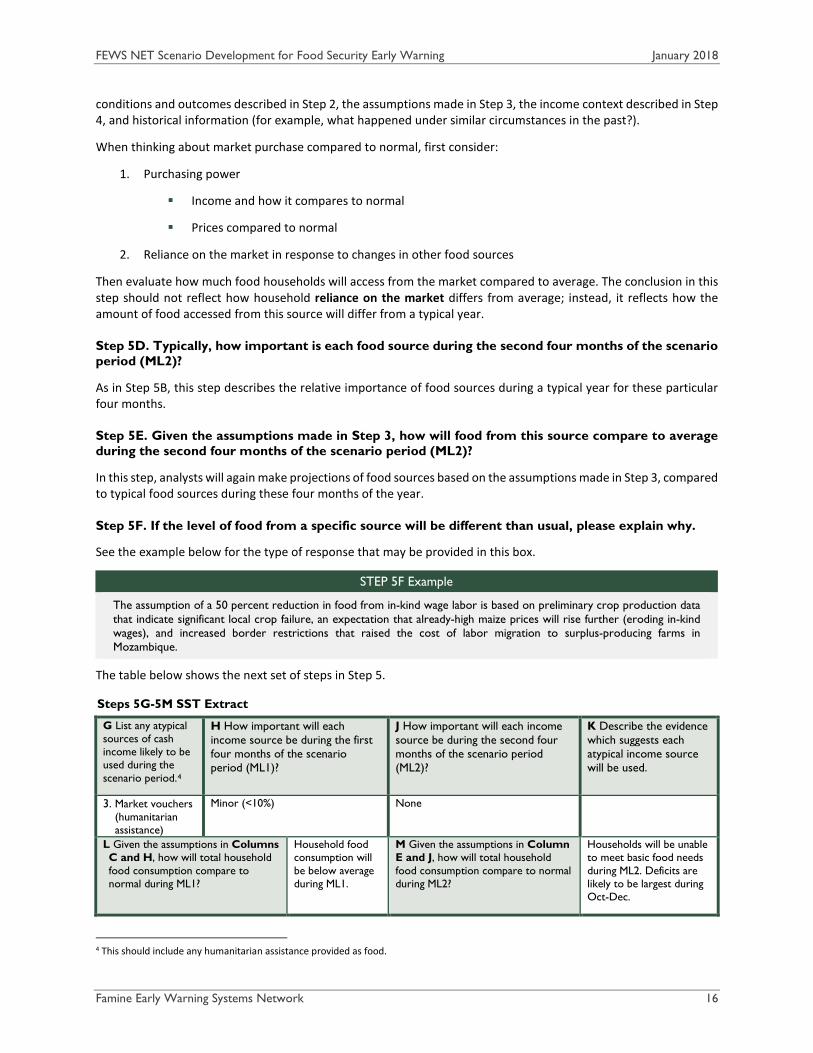
The table below shows the next set of steps in Step 5.
Steps 5G-5M SST Extract
G List any atypical sources of cash income likely to be used during the scenario period.4
H How important will each income source be during the first four months of the scenario period (ML1)?
J How important will each income source be during the second four months of the scenario period (ML2)?
K Describe the evidence which suggests each atypical income source will be used.
3. Market vouchers (humanitarian assistance)
Minor (<10%) None
L Given the assumptions in Columns C and H, how will total household food consumption compare to normal during ML1?
Household food consumption will be below average during ML1.
M Given the assumptions in Column E and J, how will total household food consumption compare to normal during ML2?
Households will be unable to meet basic food needs during ML2. Deficits are likely to be largest during Oct-Dec.
4 This should include any humanitarian assistance provided as food.
FEWS NET Scenario Development for Food Security Early Warning January 2018
Famine Early Warning Systems Network 17
Step 5G. List any atypical sources of food likely to be consumed during the scenario period.
This step factors in household responses (or coping strategies) and responses by external actors that would influence food sources, including humanitarian food assistance or gifts of food from the community. Only include planned, funded, and humanitarian assistance here when it meets evidence requirements for planned, funded, and likely.
Step 5H. How important will each atypical food source be during the first four months of the scenario period (ML1)?
In this step, consider how important food from any atypical sources will be during ML1 (and ML2 in Step 5J) relative to the other sources of food noted previously. Step 5 applies the same question to the second four months of the scenario period.
Step 5K. Describe the evidence that suggests each atypical food source will be used.
Explain why households are expected to have atypical food sources.
Step 5L. Given the assumptions in Columns C and H, how will total household food consumption compare to normal during ML1?
This step is a summation of all of the analysis in Step 5 for ML1 (and ML2); it is the net food consumption expected during this period after coping and assistance have been factored in. Step 5M applies this same question to the second four months of the scenario period.
FEWS NET Scenario Development for Food Security Early Warning January 2018
Famine Early Warning Systems Network 18
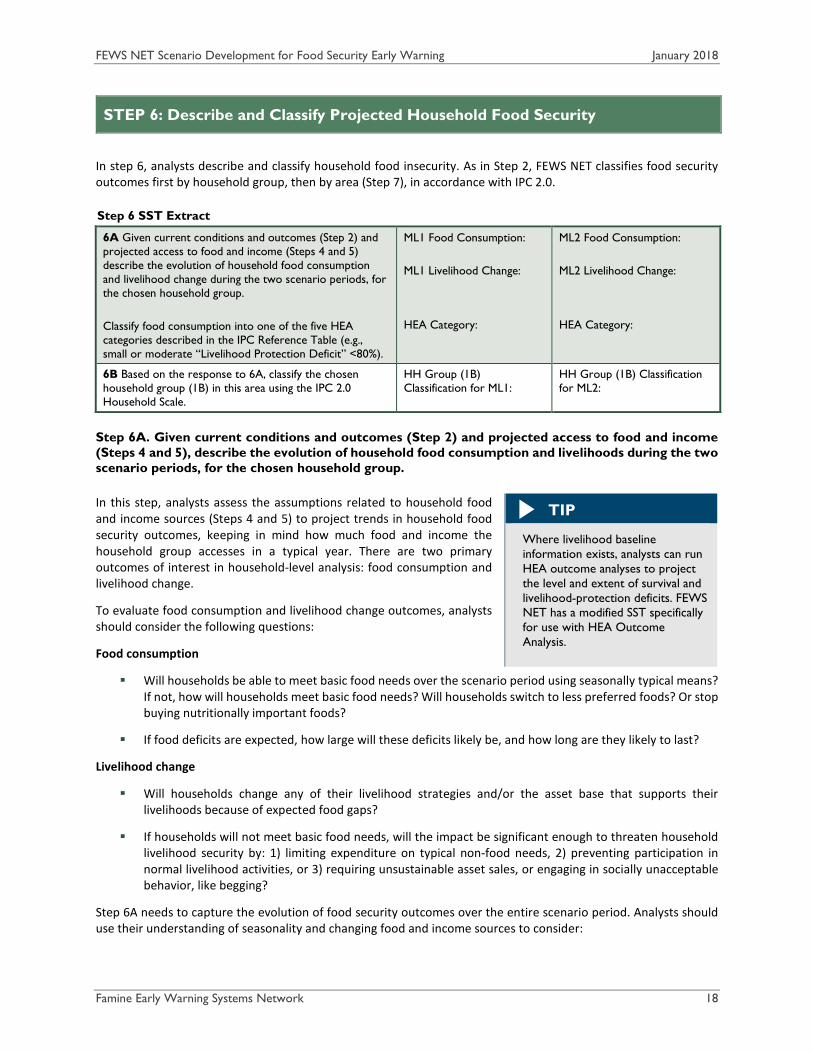
STEP 6: Describe and Classify Projected Household Food Security
In step 6, analysts describe and classify household food insecurity. As in Step 2, FEWS NET classifies food security outcomes first by household group, then by area (Step 7), in accordance with IPC 2.0.
Step 6A. Given current conditions and outcomes (Step 2) and projected access to food and income (Steps 4 and 5), describe the evolution of household food consumption and livelihoods during the two scenario periods, for the chosen household group.
In this step, analysts assess the assumptions related to household food and income sources (Steps 4 and 5) to project trends in household food security outcomes, keeping in mind how much food and income the household group accesses in a typical year. There are two primary outcomes of interest in household-level analysis: food consumption and livelihood change.
To evaluate food consumption and livelihood change outcomes, analysts should consider the following questions:
Food consumption
Will households be able to meet basic food needs over the scenario period using seasonally typical means? If not, how will households meet basic food needs? Will households switch to less preferred foods? Or stop buying nutritionally important foods?
If food deficits are expected, how large will these deficits likely be, and how long are they likely to last?
Livelihood change
Will households change any of their livelihood strategies and/or the asset base that supports their livelihoods because of expected food gaps?
If households will not meet basic food needs, will the impact be significant enough to threaten household livelihood security by: 1) limiting expenditure on typical non-food needs, 2) preventing participation in normal livelihood activities, or 3) requiring unsustainable asset sales, or engaging in socially unacceptable behavior, like begging?
Step 6A needs to capture the evolution of food security outcomes over the entire scenario period. Analysts should use their understanding of seasonality and changing food and income sources to consider:
Step 6 SST Extract
6A Given current conditions and outcomes (Step 2) and projected access to food and income (Steps 4 and 5) describe the evolution of household food consumption and livelihood change during the two scenario periods, for the chosen household group. Classify food consumption into one of the five HEA categories described in the IPC Reference Table (e.g., small or moderate “Livelihood Protection Deficit” <80%).
ML1 Food Consumption: ML1 Livelihood Change:
HEA Category:
ML2 Food Consumption: ML2 Livelihood Change:
HEA Category:
6B Based on the response to 6A, classify the chosen household group (1B) in this area using the IPC 2.0 Household Scale.
HH Group (1B) Classification for ML1:
HH Group (1B) Classification for ML2:
TIP
Where livelihood baseline information exists, analysts can run HEA outcome analyses to project the level and extent of survival and livelihood-protection deficits. FEWS NET has a modified SST specifically for use with HEA Outcome Analysis.

FEWS NET Scenario Development for Food Security Early Warning January 2018
Famine Early Warning Systems Network 19
How will access to food evolve over the eight-month period and to what degree will it be adequate?
What is the size of any expected deficit?
What is the duration of any expected deficit?
What is the timing of any expected deficit?
STEP 6A Examples
Maize reserves from the 2017 harvests have now been exhausted among the poorest households, three months earlier than usual. Accordingly, purchases will be the predominant source of food from July to October. Since sources of employment are scarce during this period and prices remain seasonally high (especially for grains), both the quality and quantity of the diet will deteriorate over the coming four months. Needs will be highest in September and October, when households are not expected to meet basic food needs, despite relying on coping strategies such as sale of firewood and fruits. The November crop harvest will allow households to restock their reserves of maize and beans, and income from on-farm labor will give households more access to markets during the second half of the scenario period.
Over the next eight months, food security among the poor wealth group will deteriorate. A reduction in income from July/August wage labor and August/September livestock sales will prevent households from purchasing adequate fodder during the July–December dry season. As a result, they are likely to lose additional small livestock, particularly lambs born in recent months. That will reduce below-normal herd sizes even further. These same income constraints, in combination with the poor sorghum harvest and high cereal prices, also mean that these households will be unable to access basic food needs using typical means. Even once significant coping has occurred – likely in the form of additional livestock sales and increased charcoal production – almost all poor households will face food deficits of up to 20 percent during the peak lean season (October–December), assuming that emergency food assistance programs are not initiated. Atypical migration from these areas toward the regional capital is possible by November.
Classify food consumption into one of the five HEA categories described in the IPC Reference Table (e.g., Small to Moderate Livelihoods Protection Deficit <80%).
In this step, analysts also classify food consumption during each scenario period into one of the five HEA categories (Table 2) described in the IPC Reference Table. This second step helps to link scenario analysis conclusions to the IPC classification.
Step 6B. Based on the response to Step 6A, classify the chosen household group in this area using the IPC 2.0 Household Scale.
In this step, analysts evaluate the projected food consumption and livelihood change outcomes for the household group of interest (Step 6A) to classify food insecurity for the household group, using the IPC 2.0 Acute Food Insecurity Reference Table for Household Group Classification. Analysts should focus on which of the qualitative phase descriptions in the IPC’s Household Reference Table best describe the outcomes suggested by their scenario analysis.
These conclusions should consider what is typical for this household group during this season in a typical year. For example, if the analysis indicates that food consumption during the lean season will be typical, but, during a typical year, food deficits exist during this period, the household group might still be classified in a phase other than IPC Phase 1.
Table 2. IPC phases and HEA categories IPC Phase HEA Categories
Phase 1 – None No Livelihoods Protection Deficit
Phase 2 – Stress Small to Moderate Livelihoods Protection Deficit (<80%)
Phase 3 – Crisis Large Livelihoods Protection Deficit (>80%) or Small Survival Deficit (<20%)
Phase 4 – Emergency Survival Deficit of 20–50%
Phase 5 – Catastrophe Survival Deficit >50%
FEWS NET Scenario Development for Food Security Early Warning January 2018
Famine Early Warning Systems Network 20
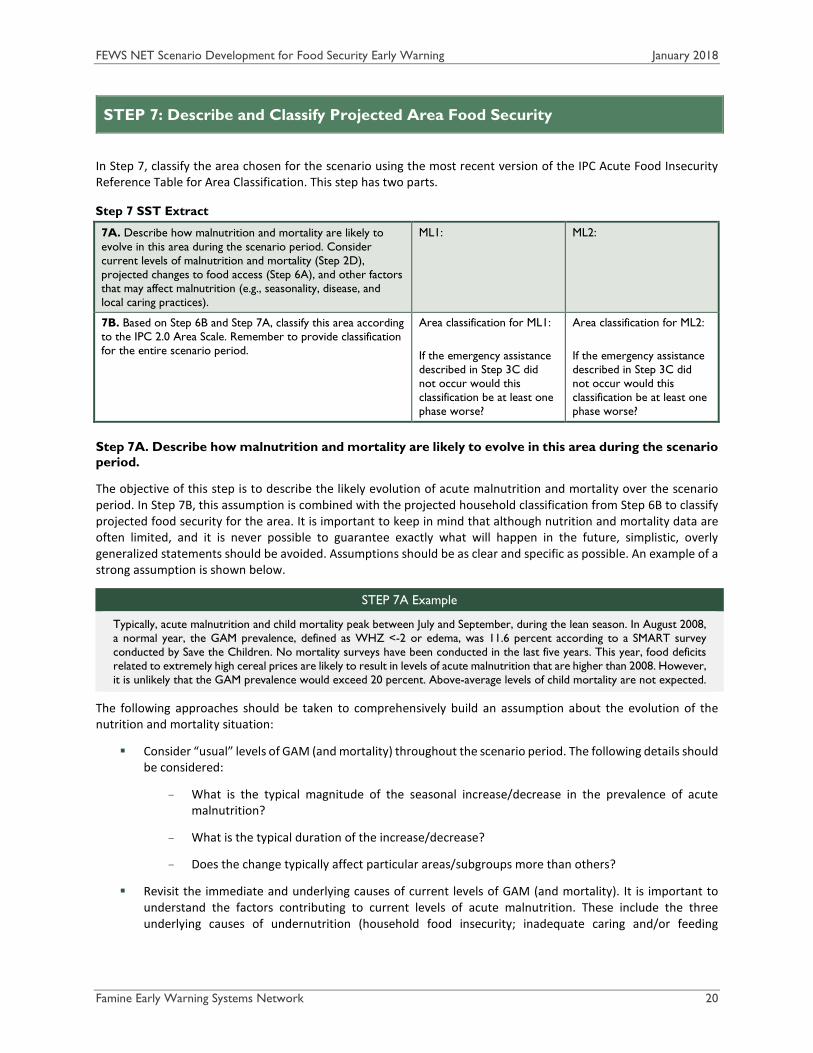
STEP 7: Describe and Classify Projected Area Food Security
In Step 7, classify the area chosen for the scenario using the most recent version of the IPC Acute Food Insecurity Reference Table for Area Classification. This step has two parts.
Step 7A. Describe how malnutrition and mortality are likely to evolve in this area during the scenario period.
The objective of this step is to describe the likely evolution of acute malnutrition and mortality over the scenario period. In Step 7B, this assumption is combined with the projected household classification from Step 6B to classify projected food security for the area. It is important to keep in mind that although nutrition and mortality data are often limited, and it is never possible to guarantee exactly what will happen in the future, simplistic, overly generalized statements should be avoided. Assumptions should be as clear and specific as possible. An example of a strong assumption is shown below.
STEP 7A Example
Typically, acute malnutrition and child mortality peak between July and September, during the lean season. In August 2008, a normal year, the GAM prevalence, defined as WHZ <-2 or edema, was 11.6 percent according to a SMART survey conducted by Save the Children. No mortality surveys have been conducted in the last five years. This year, food deficits related to extremely high cereal prices are likely to result in levels of acute malnutrition that are higher than 2008. However, it is unlikely that the GAM prevalence would exceed 20 percent. Above-average levels of child mortality are not expected.
The following approaches should be taken to comprehensively build an assumption about the evolution of the nutrition and mortality situation:
Consider “usual” levels of GAM (and mortality) throughout the scenario period. The following details should be considered:
- What is the typical magnitude of the seasonal increase/decrease in the prevalence of acute malnutrition?
- What is the typical duration of the increase/decrease?
- Does the change typically affect particular areas/subgroups more than others?
Revisit the immediate and underlying causes of current levels of GAM (and mortality). It is important to understand the factors contributing to current levels of acute malnutrition. These include the three underlying causes of undernutrition (household food insecurity; inadequate caring and/or feeding
Step 7 SST Extract
7A. Describe how malnutrition and mortality are likely to evolve in this area during the scenario period. Consider current levels of malnutrition and mortality (Step 2D), projected changes to food access (Step 6A), and other factors that may affect malnutrition (e.g., seasonality, disease, and local caring practices).
ML1:
ML2:
7B. Based on Step 6B and Step 7A, classify this area according to the IPC 2.0 Area Scale. Remember to provide classification for the entire scenario period.
Area classification for ML1: If the emergency assistance described in Step 3C did not occur would this classification be at least one phase worse?
Area classification for ML2: If the emergency assistance described in Step 3C did not occur would this classification be at least one phase worse?
FEWS NET Scenario Development for Food Security Early Warning January 2018
Famine Early Warning Systems Network 21
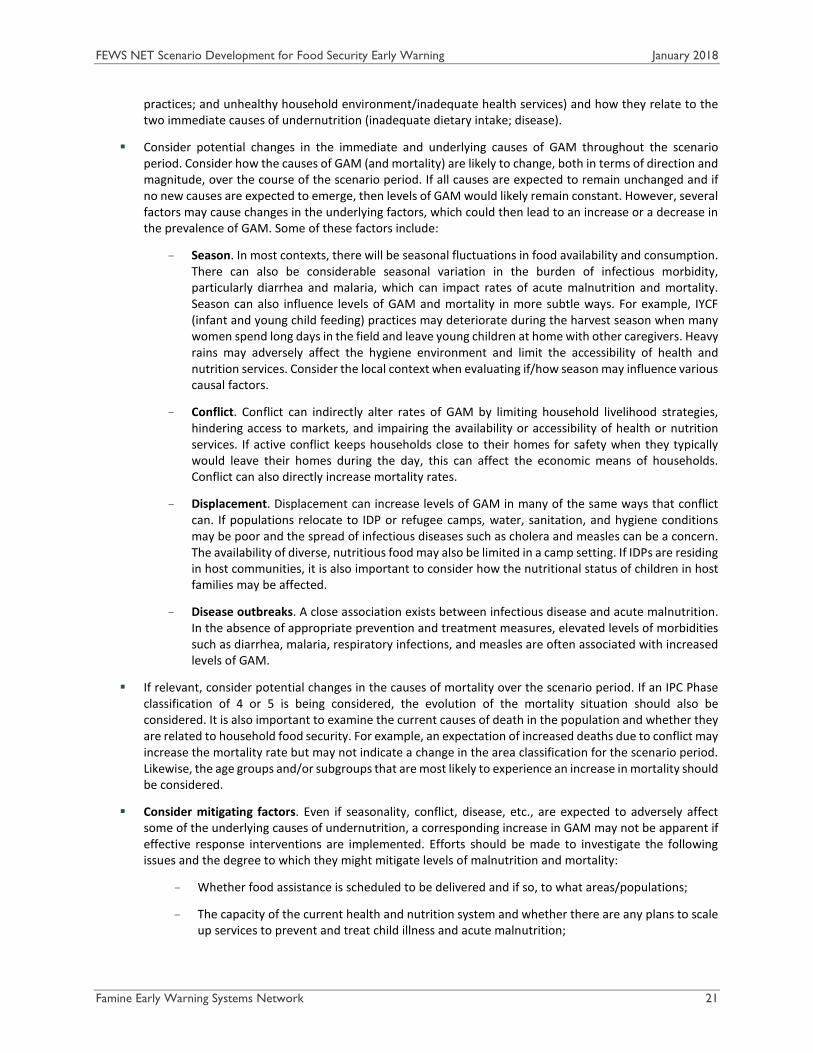
practices; and unhealthy household environment/inadequate health services) and how they relate to the two immediate causes of undernutrition (inadequate dietary intake; disease).
Consider potential changes in the immediate and underlying causes of GAM throughout the scenario period. Consider how the causes of GAM (and mortality) are likely to change, both in terms of direction and magnitude, over the course of the scenario period. If all causes are expected to remain unchanged and if no new causes are expected to emerge, then levels of GAM would likely remain constant. However, several factors may cause changes in the underlying factors, which could then lead to an increase or a decrease in the prevalence of GAM. Some of these factors include:
- Season. In most contexts, there will be seasonal fluctuations in food availability and consumption. There can also be considerable seasonal variation in the burden of infectious morbidity, particularly diarrhea and malaria, which can impact rates of acute malnutrition and mortality. Season can also influence levels of GAM and mortality in more subtle ways. For example, IYCF (infant and young child feeding) practices may deteriorate during the harvest season when many women spend long days in the field and leave young children at home with other caregivers. Heavy rains may adversely affect the hygiene environment and limit the accessibility of health and nutrition services. Consider the local context when evaluating if/how season may influence various causal factors.
- Conflict. Conflict can indirectly alter rates of GAM by limiting household livelihood strategies, hindering access to markets, and impairing the availability or accessibility of health or nutrition services. If active conflict keeps households close to their homes for safety when they typically would leave their homes during the day, this can affect the economic means of households. Conflict can also directly increase mortality rates.
- Displacement. Displacement can increase levels of GAM in many of the same ways that conflict can. If populations relocate to IDP or refugee camps, water, sanitation, and hygiene conditions may be poor and the spread of infectious diseases such as cholera and measles can be a concern. The availability of diverse, nutritious food may also be limited in a camp setting. If IDPs are residing in host communities, it is also important to consider how the nutritional status of children in host families may be affected.
- Disease outbreaks. A close association exists between infectious disease and acute malnutrition. In the absence of appropriate prevention and treatment measures, elevated levels of morbidities such as diarrhea, malaria, respiratory infections, and measles are often associated with increased levels of GAM.
If relevant, consider potential changes in the causes of mortality over the scenario period. If an IPC Phase classification of 4 or 5 is being considered, the evolution of the mortality situation should also be considered. It is also important to examine the current causes of death in the population and whether they are related to household food security. For example, an expectation of increased deaths due to conflict may increase the mortality rate but may not indicate a change in the area classification for the scenario period. Likewise, the age groups and/or subgroups that are most likely to experience an increase in mortality should be considered.
Consider mitigating factors. Even if seasonality, conflict, disease, etc., are expected to adversely affect some of the underlying causes of undernutrition, a corresponding increase in GAM may not be apparent if effective response interventions are implemented. Efforts should be made to investigate the following issues and the degree to which they might mitigate levels of malnutrition and mortality:
- Whether food assistance is scheduled to be delivered and if so, to what areas/populations;
- The capacity of the current health and nutrition system and whether there are any plans to scale up services to prevent and treat child illness and acute malnutrition;
FEWS NET Scenario Development for Food Security Early Warning January 2018
Famine Early Warning Systems Network 22
- If any outreach campaigns are planned to improve coverage of vaccinations, vitamin A supplementation, etc.
Step 7B. Based on Step 6B and Step 7A, classify this area according to the IPC 2.0 Area Scale.
Use the projected household classification from Step 6B5 and the projected nutrition and mortality outcomes from Step 7A to classify food insecurity for the area of concern using the most recent version of the IPC phase classification protocols, particularly the Acute Food Insecurity Reference Table for Area Classification. Be sure to provide classification for the entire scenario period.
Analysts also apply the humanitarian assistance protocol in this step, to assist if the IPC phase would be at least one phase higher in the absence of humanitarian assistance. Any planned, funded, and likely humanitarian assistance should be described in Step 3. In assessing the projected impact in ML1 and ML2, analysts need to evaluate if this assistance is likely to reach the household group of concern, and if the magnitude of this assistance will likely be significant enough in terms of kilocalories or livelihood assistance to lower the phase for the household group.
5 This assumes that the chosen household group includes at least 20 percent of the scenario area’s population. If this is not the case, an additional household group, or groups, should be analyzed and classified to inform area classification.

FEWS NET Scenario Development for Food Security Early Warning January 2018
Famine Early Warning Systems Network 23
STEP 8: Identify Events that Could Change the Scenario
In Step 8, identify events that might change the scenario outcomes and describe the impact of these alternative assumptions. This step communicates to decision makers the uncertainty that always exists when projecting future food security outcomes.
As discussed above, scenario development requires food security analysts to make many assumptions. The level of confidence in these assumptions will vary. For example, analysts may have high confidence in their assumption about crop production but relatively lower confidence in their assumption about how conflict will evolve. Additionally, certain unlikely events, were they to occur, might have a significant impact on food security outcomes (e.g., a major hurricane in Haiti). Along with the most likely scenario, decision makers need information reflecting this uncertainty and an explanation of why things might turn out differently. It is good practice to identify possible events that would result in different food security outcomes.
To accomplish this, review the various assumptions made during the scenario development process. Include both the assumptions about shocks in Step 3 (e.g., how will rainfall perform) as well as assumptions in other steps (e.g., level of income from wage labor or provision of humanitarian assistance). Analysts should consider the following questions:
Which one or two assumptions are most critical to their scenario?
In which assumptions do they have the least confidence?
Are there any events not described in the scenario that would significantly change their projected levels of food insecurity?
Consider if food security outcomes would be significantly different (i.e., at least one IPC Phase worse) if the assumptions underlying the scenario were incorrect. If so, develop an alternative assumption and describe its likely impact on food security. Similarly, if events not described in the scenario would significantly change the projections, they should also be listed, along with a description of how they would change the scenario.
STEP 8 Example
An analyst has a medium-term precipitation forecast that indicates a 65 percent chance of above-average rainfall. Based on an analysis of this forecast, and additional input from science partners, the analyst has assumed that in the most likely situation rainfall totals will be 20 percent above average. This assumption then informs other assumptions about crop production, labor demand, food prices, and, ultimately, food security outcomes. However, this forecast also suggests a 20 percent chance of average rainfall. Crop production and agricultural labor are very important for local livelihoods and a close relationship exists between these food/income sources and rainfall. Therefore, in Step 8, the analyst should identify an alternative assumption. For example, he/she could assume that rainfall would be average and then describe how this level of rainfall would change the outcomes presented in the most likely scenario. This way, if the assumption about above-normal rainfall turns out to be incorrect, decision makers will already have an idea about the ways in which projected food security outcomes might change.
Step 8 SST Extract
8. If the scenario developed above is a “most likely” scenario, list key events that would significantly change the projected outcomes described in Steps 6 and 7. In addition to local events, consider national, regional, and international events.
TIP
Include events that have a reasonable chance of occurring. For example, if the government has a history of implementing trade restrictions along a particular border point, this may be something to mention. However, extreme events with a small likelihood of occurring (e.g., a tsunami) should not be considered.

FEWS NET Scenario Development for Food Security Early Warning January 2018
Famine Early Warning Systems Network 24
Guiding Principles for Scenario Development Consider the following guiding principles when building food security scenarios.
A. Align scenario development with the Disaster Risk Reduction Framework
To maintain consistency, food security scenario development needs to use a common vocabulary. Because famine early warning is essentially a form of disaster risk analysis, it makes sense to adopt a vocabulary consistent with the internationally agreed upon Disaster Risk Reduction (DRR) framework. Disaster risk is typically understood as a function of some hazard and the vulnerability of a population to that hazard (and likewise, its ability to cope). This relationship can be expressed as follows:
The DRR framework, expressed in this way, is powerful because it helps to differentiate between cause and effect. “Risk” is the effect or outcome to be measured, specifically: the “risk of food insecurity.” Two factors cause this outcome: the external cause, which is the hazard, and the internal cause, which is a combination of people’s vulnerability to that hazard and their capacity to cope with it.
In food security analysis, a household may be “vulnerable” to a particular hazard, but not necessarily at “risk” of food insecurity. How can that be?
First, a household’s level of vulnerability to a particular hazard will vary depending on how the household meets its basic needs. That relates to its livelihood system—i.e., the assets or capital (social, natural, physical, financial, productive, and human) available to it. For instance, if a household meets these needs by relying primarily on crop production, then a staple price shock will not necessarily put this household at risk of food insecurity. A drought, on the other hand, may.
Second, the magnitude of the hazard is important to consider, as variations occur within each year, and from year to year.
Third, even if a household is vulnerable to a hazard, it may still be able to effectively respond, or cope, by increasing reliance on livelihood strategies not affected by that hazard, or by drawing down food stocks or savings.
So, the risk of food insecurity depends not only on the household’s vulnerability to a hazard, but also the magnitude of that hazard, and household’s coping capacity in the short and medium term.
B. Use historical data to inform assumptions
Making informed assumptions about future shocks, effects, and response will always require an assessment of current conditions and some level of expert judgment. However, historical data should also play an important role in informing the development of these assumptions. This information can include both quantitative data, such as historical price or production data, and qualitative information, such as an understanding of how households have coped with similar conditions in the past. For example, analysts might use information on typical patterns of acute malnutrition to inform estimates of the likely caseload for feeding centers over the coming months. Or, analogue years could help to estimate the likely impacts of forecast rainfall on cropping.
C. Consider the relevant regional and international context
Although food security scenarios are typically developed for a specific area of a country, regional and international factors may be relevant for the analysis. Events in a neighboring or even a distant country can raise important questions about how food security conditions and outcomes will develop. It is important to recognize when such
RISK = ƒ (Hazard, Vulnerability, Coping Capacity)

FEWS NET Scenario Development for Food Security Early Warning January 2018
Famine Early Warning Systems Network 25
events are likely to impact household food security and consider them when developing scenarios. Examples of such factors include:
Will trade policies in neighboring countries affect food supply and prices in the scenario?
Will conflict in a neighboring country affect access to markets, land, or social services?
Will above-average regional production offset localized production deficits?
Will drought in major cereal-exporting countries (e.g., Thailand, Australia, and the United States) affect the price of imported cereals?
D. Incorporate seasonality into scenario analysis
Just as shocks impact different households in different ways, they will impact households differently at different times during the scenario period. For example, a spike in staple food prices will have more impact if it occurs during a period when food stocks from own production are depleted and households are more reliant on purchases. Crop losses may affect agricultural laborers both during peak labor periods (loss of cash income and in-kind payment) as well as following the harvest (losses in own production for sale and consumption). Similarly, options for household response will change depending on the time of year. Households might typically rely on the collection of wild foods during the lean season. But, if the harvest is especially poor and food shortages begin earlier than normal, these foods may not yet be available. As such, scenarios should be sure to consider seasonality. Discussion of shocks, effects, and response should include information on timing. Scenarios should describe food security outcomes over the course of the scenario period, not just at the end.
E. Reliable information on livelihoods is a critical input for scenario building
Scenario analysis is livelihoods-based. Livelihoods are the means by which households obtain and maintain access to food and income sources. Livelihood information includes livelihood zone maps, livelihood profiles, seasonal calendars, and livelihood baselines. By understanding how people meet basic needs, analysts gain insight into households’ ability to cope with a shock. Without reliable livelihood information, it is very difficult, if not impossible, to estimate how expected shocks will impact households’ future access to food and income.
F. When livelihoods change, adjust analysis
Livelihoods can change and analysis based on out-of-date information can be misleading. Analysts should be aware of how livelihoods may be changing and incorporate this evolution, where possible, into scenario development. For example, in some areas of the Horn of Africa, members of poor households who were once pastoralists became poor urban residents after losing their livestock to drought. When these livestock losses first occur, it is reasonable to analyze these households and their food security status in the context of a pastoralist livelihood system. Yet once many years have passed, and these households have clearly left the pastoralist livelihood, the livelihoods analysis must also shift to reflect the new ways that these households access food and income.

FEWS NET Scenario Development for Food Security Early Warning January 2018
Famine Early Warning Systems Network 26
Annex I: Glossary of Key Terms Accessibility One of the four pillars of food security. A household's ability to physically, economically, and socially obtain a necessary amount of food on a regular basis by purchasing, bartering, borrowing, or receiving food aid or gifts. See also: availability.
Acute Food Insecurity Food security at a specific moment in time, regardless of causes, context, or duration. Severity is defined by assessing the degree to which households can meet basic survival needs and maintain their normal livelihoods.
Analogue Year A year in history that shares key characteristics with the current year and can therefore help to support assumptions about how the current year may progress. In food security analysis, analogue years are most commonly used in relation to climate and seasonal forecasts. Information about current atmospheric and oceanic conditions/patterns is used to identify similar years that may suggest likely precipitation and temperature behavior. Analogue years can also be used to look at other issues, such as market behavior and food prices.
Assumptions For the purpose of scenario development, assumptions are judgments about the anticipated type, magnitude, and timing of future events or conditions. Assumptions are the product of an analysis of current conditions (e.g., rainfall pattern to date), past experiences (a reference period, or how a similar series of events unfolded, such as a previous drought), official or unofficial estimates or projections, qualitative or quantitative data, and/or expert judgment. Assumptions can be made at any level of analysis (i.e., household, village, market, district, national, regional, or international). Assumptions form the basis of a scenario and support and reasonably limit its scope.
Availability One of the four pillars of food security. The total amount of food that is present in a country or given area by means of domestic production, imports, food stocks, and food aid. See also: accessibility
Chronic Food Insecurity Food insecurity that continues even in normal, non-crisis years when shocks do not occur.
Coping Contending with difficulties and acting to overcome them. In food security, we typically speak of coping capacity and coping strategies. Coping capacity refers to the ability of households to diversify and expand access to various sources of food, income, and other basic needs, and thus to cope with a specific stress. Coping strategies are the tactics used by households for this purpose. Coping strategies can be positive, neutral, or negative in terms of their impact on livelihood systems and individual well-being. For the purpose of scenario development, we distinguish between coping strategies that, if successful, help to mitigate acute food and income deficits (e.g., the sale of assets) and coping strategies that indicate reduced dietary quantity or quality (e.g., skipping meals). The former should be considered as a part of Steps 4 and 5. The latter should be considered as a part of Step 6A.
Food Security Conditions The context with regard to external circumstances and influences related to food security; includes the variables, causal factors, and drivers of food security. Food security conditions are different from food security outcomes. Outcomes refer to the final situation faced by households or areas once all conditions and responses have been analyzed. For example, food security conditions may describe seasonal progress, food prices, and labor demand, while food security outcomes describe whether households are able to access and utilize the food needed for a healthy life.
Food Security Outcomes The net result of changes in household incomes and food access plus the effect of response by households, governments, or other actors in terms of food consumption, livelihoods maintenance, nutritional status, and mortality risk. Outcomes can be positive or negative. A description of food security outcomes should explain who is

FEWS NET Scenario Development for Food Security Early Warning January 2018
Famine Early Warning Systems Network 27
food insecure (e.g., what population or wealth group; the size of the food insecure population), and the expected duration and severity of food insecurity.
Hazard Something that poses a potential threat to life, health, property, or the environment. Most hazards are dormant, with only a potential risk of harm. Once a hazard becomes "active,” it is called a shock (or in some cases, a hazard event). For example: a volcano is a hazard; its eruption is a shock. Hazards can be single, sequential, or combined in their origin and effects. They are characterized by their location, intensity, frequency, and probability. Hazard and vulnerability interact together to create risk. Hazards can have different origins: natural (geological, hydro-meteorological, and biological) or induced by human processes (environmental degradation and technological, political, economic, or social threats).
Lean season The time of year when a household’s access to food and/or cash income is typically most constrained. During this period, households tend to be at greater risk of food insecurity.
Livelihoods The means by which households obtain and maintain access to essential resources to ensure their immediate, medium-term, and long-term survival.
Normal Conditions The typical or average range of attributes, characteristics, or relationships (e.g., weather, market behavior, livelihoods, etc.). They provide a framework, baseline, or reference period that can be compared to current and/or projected conditions.
Projection period Months selected for scenario period (e.g., typically eight months for a FEWS NET Food Security Outlook scenario).
Purchasing Power Measurement of the relative value of money in terms of the quality and quantity of goods and services it can buy. It represents the ability of a household to acquire goods and services based on its access to money or other forms of wealth.
Response Any action taken before, during, or after a potential change in food security is identified, taken with the intention to prevent or mitigate food insecurity and/or to avoid loss of life or livelihoods. Response actors include: households, local governments, communities and civil society, the private sector (e.g., traders), nongovernmental organizations, multilateral organizations, and other regional and international sources.
Risk The probability of harmful consequences or expected losses (of lives, livelihoods, persons injured, property, economic activity disrupted, or environment damaged) due to a particular hazard for a given area and reference period resulting from interactions between natural or human-induced hazards and vulnerable conditions. Risk can be expressed as the product of hazard and vulnerability. It is mitigated by coping capacity: Risk = f (hazard × vulnerability/coping).
Scenario In the context of food security analysis, an informed “if/then” analysis that communicates shocks, their impacts on household food and income sources, response by both households and other actors, and the net food security outcomes for different households in specific geographic areas. Scenarios are rooted in a series of reasonable assumptions based on existing conditions, historical information, and expert judgment. Scenarios are used to project future food security outcomes and inform decision-making processes.

FEWS NET Scenario Development for Food Security Early Warning January 2018
Famine Early Warning Systems Network 28
Shock An atypical event or series of events (either rapid or slow-onset), that has a significant impact. Shocks can be positive (e.g., a significantly better-than-average harvest) or negative (e.g., a failed below-average harvest or an unseasonable increase in food prices).
Vulnerability The conditions determined by physical, social, economic, and environmental factors or processes that increase the susceptibility of a community or population group to hazards. Vulnerability is not a general state; people are only vulnerable to a specific hazard. For example: farmers cultivating along a riverbank may be vulnerable to floods (which are likely to wash away their crops), but may not be vulnerable to drought (since they can irrigate their crops using water from the river).
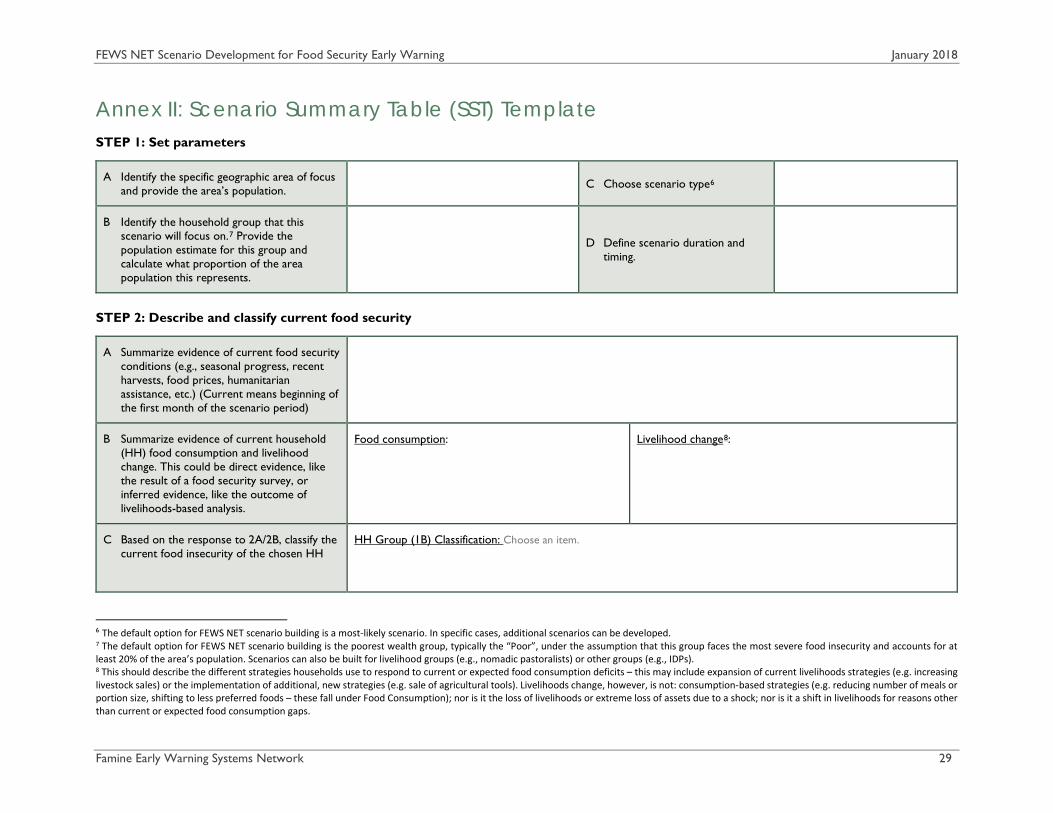
FEWS NET Scenario Development for Food Security Early Warning January 2018
Famine Early Warning Systems Network 29
Annex II: Scenario Summary Table (SST) Template STEP 1: Set parameters
A Identify the specific geographic area of focus and provide the area’s population. C Choose scenario type6
B Identify the household group that this scenario will focus on.7 Provide the population estimate for this group and calculate what proportion of the area population this represents.
D Define scenario duration and timing.
STEP 2: Describe and classify current food security
A Summarize evidence of current food security conditions (e.g., seasonal progress, recent harvests, food prices, humanitarian assistance, etc.) (Current means beginning of the first month of the scenario period)
B Summarize evidence of current household (HH) food consumption and livelihood change. This could be direct evidence, like the result of a food security survey, or inferred evidence, like the outcome of livelihoods-based analysis.
Food consumption: Livelihood change8:
C Based on the response to 2A/2B, classify the current food insecurity of the chosen HH
HH Group (1B) Classification: Choose an item.
6 The default option for FEWS NET scenario building is a most-likely scenario. In specific cases, additional scenarios can be developed. 7 The default option for FEWS NET scenario building is the poorest wealth group, typically the “Poor”, under the assumption that this group faces the most severe food insecurity and accounts for at least 20% of the area’s population. Scenarios can also be built for livelihood groups (e.g., nomadic pastoralists) or other groups (e.g., IDPs). 8 This should describe the different strategies households use to respond to current or expected food consumption deficits – this may include expansion of current livelihoods strategies (e.g. increasing livestock sales) or the implementation of additional, new strategies (e.g. sale of agricultural tools). Livelihoods change, however, is not: consumption-based strategies (e.g. reducing number of meals or portion size, shifting to less preferred foods – these fall under Food Consumption); nor is it the loss of livelihoods or extreme loss of assets due to a shock; nor is it a shift in livelihoods for reasons other than current or expected food consumption gaps.
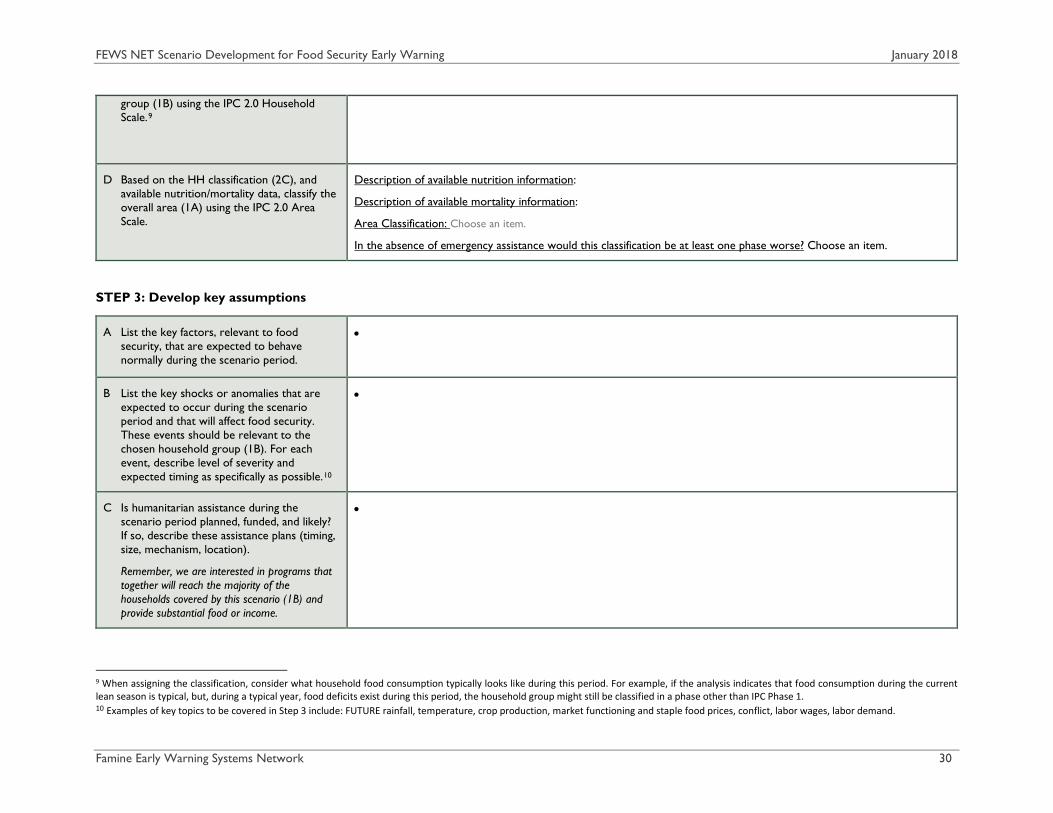
FEWS NET Scenario Development for Food Security Early Warning January 2018
Famine Early Warning Systems Network 30
group (1B) using the IPC 2.0 Household Scale.9
D Based on the HH classification (2C), and available nutrition/mortality data, classify the overall area (1A) using the IPC 2.0 Area Scale.
Description of available nutrition information:
Description of available mortality information:
Area Classification: Choose an item.
In the absence of emergency assistance would this classification be at least one phase worse? Choose an item.
STEP 3: Develop key assumptions
A List the key factors, relevant to food security, that are expected to behave normally during the scenario period.
•
B List the key shocks or anomalies that are expected to occur during the scenario period and that will affect food security. These events should be relevant to the chosen household group (1B). For each event, describe level of severity and expected timing as specifically as possible.10
•
C Is humanitarian assistance during the scenario period planned, funded, and likely? If so, describe these assistance plans (timing, size, mechanism, location).
Remember, we are interested in programs that together will reach the majority of the households covered by this scenario (1B) and provide substantial food or income.
•
9 When assigning the classification, consider what household food consumption typically looks like during this period. For example, if the analysis indicates that food consumption during the current lean season is typical, but, during a typical year, food deficits exist during this period, the household group might still be classified in a phase other than IPC Phase 1. 10 Examples of key topics to be covered in Step 3 include: FUTURE rainfall, temperature, crop production, market functioning and staple food prices, conflict, labor wages, labor demand.

FEWS NET Scenario Development for Food Security Early Warning January 2018
Famine Early Warning Systems Network 31
STEP 4: Describe impacts on HH income sources
A List the sources of cash income typically used during the scenario period.
B Typically, how important is each income source during the first four months of the scenario period (ML1)?
C Given the assumptions made in Step 3, how will income from this source compare to average (4B) during the first four months of the scenario period (ML1)?
D Typically, how important is each income source during the second four months of the scenario period (ML2)?
E Given the assumptions made in Step 3, how will income from this source compare to average (4B) during the second four months of the scenario period (ML2)?
F If the level of income from a specific source will be different than usual, please explain why.
1. Choose an item. Choose an item. Choose an item. Choose an item. Choose an item.
2. Choose an item. Choose an item. Choose an item. Choose an item. Choose an item.
3. Choose an item. Choose an item. Choose an item. Choose an item. Choose an item.
4. Choose an item. Choose an item. Choose an item. Choose an item. Choose an item.
5. Choose an item. Choose an item. Choose an item. Choose an item. Choose an item.
6. Choose an item. Choose an item. Choose an item. Choose an item.
7. Choose an item. Choose an item. Choose an item. Choose an item.
G List any atypical sources of cash income likely to be used during the scenario period.11
H How important will each income source be during the first four months of the scenario period (ML1)?
J How important will each income source be during the second four months of the scenario period (ML2)?
K Describe the evidence which suggests each atypical income source will be used.
1. Choose an item. Choose an item.
2. Choose an item. Choose an item.
3. Choose an item. Choose an item.
L Given the assumptions in Columns C and H, how will total household income compare to normal during ML1?
Choose an item. M Given the assumptions in Column E and J, how will total household income compare to normal during ML2?
Choose an item.
11 This should include any humanitarian assistance provided as cash or voucher.

FEWS NET Scenario Development for Food Security Early Warning January 2018
Famine Early Warning Systems Network 32
STEP 5: Describe impacts on HH Food sources
A List the sources of food typically consumed during the scenario period.
B Typically, how important is each food source during the first four months of the scenario period (ML1)?
C Given the assumptions made in Step 3, how will food from this source compare to average (5B) during the first four months of the scenario period (ML1)?
D Typically, how important is each food source during the second four months of the scenario period (ML2)?
E Given the assumptions made in Step 3, how will food from this source compare to average (5B) during the second four months of the scenario period (ML2)?
F If the level of food from a specific source will be different than usual, please explain why.
1. Choose an item. Choose an item. Choose an item. Choose an item. Choose an item.
2. Choose an item. Choose an item. Choose an item. Choose an item. Choose an item.
3. Choose an item. Choose an item. Choose an item. Choose an item. Choose an item.
4. Choose an item. Choose an item. Choose an item. Choose an item. Choose an item.
5. Choose an item. Choose an item. Choose an item. Choose an item. Choose an item.
6. Choose an item. Choose an item. Choose an item. Choose an item.
7. Choose an item. Choose an item. Choose an item. Choose an item.
G List any atypical sources of food likely to be consumed during the scenario period.12
H How important will each food source be during the first four months of the scenario period (ML1)?
J How important will each food source be during the second four months of the scenario period (ML2)?
K Describe the evidence which suggests each atypical food source will be used.
1. Choose an item. Choose an item.
2. Choose an item. Choose an item.
3. Choose an item. Choose an item.
L Given the assumptions in Columns C and H, how will total household food consumption compare to normal during ML1?
Choose an item. M Given the assumptions in Column E and J, how will total household food consumption compare to normal during ML2?
Choose an item.
12 This should include any humanitarian assistance provided as food.
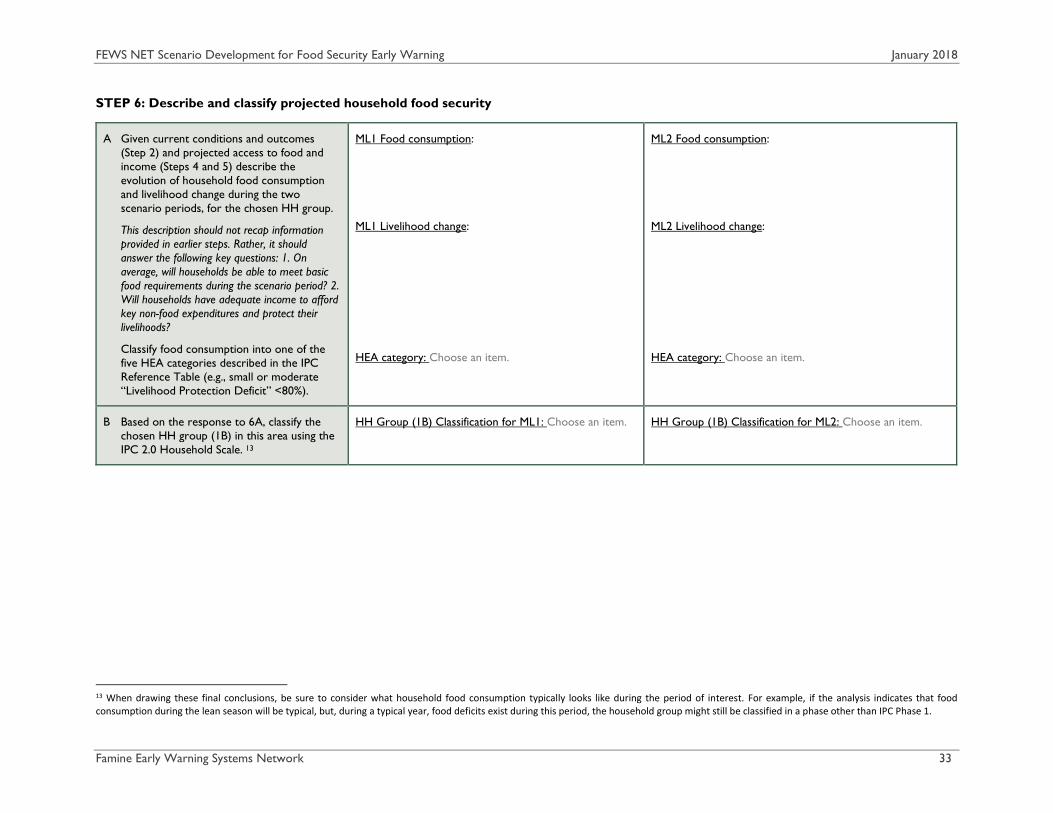
FEWS NET Scenario Development for Food Security Early Warning January 2018
Famine Early Warning Systems Network 33
STEP 6: Describe and classify projected household food security
A Given current conditions and outcomes (Step 2) and projected access to food and income (Steps 4 and 5) describe the evolution of household food consumption and livelihood change during the two scenario periods, for the chosen HH group.
This description should not recap information provided in earlier steps. Rather, it should answer the following key questions: 1. On average, will households be able to meet basic food requirements during the scenario period? 2. Will households have adequate income to afford key non-food expenditures and protect their livelihoods?
Classify food consumption into one of the five HEA categories described in the IPC Reference Table (e.g., small or moderate “Livelihood Protection Deficit” <80%).
ML1 Food consumption:
ML1 Livelihood change:
HEA category: Choose an item.
ML2 Food consumption:
ML2 Livelihood change:
HEA category: Choose an item.
B Based on the response to 6A, classify the chosen HH group (1B) in this area using the IPC 2.0 Household Scale. 13
HH Group (1B) Classification for ML1: Choose an item. HH Group (1B) Classification for ML2: Choose an item.
13 When drawing these final conclusions, be sure to consider what household food consumption typically looks like during the period of interest. For example, if the analysis indicates that food consumption during the lean season will be typical, but, during a typical year, food deficits exist during this period, the household group might still be classified in a phase other than IPC Phase 1.

FEWS NET Scenario Development for Food Security Early Warning January 2018
Famine Early Warning Systems Network 34
STEP 7: Describe and classify projected area food security
A Describe how malnutrition and mortality are likely to evolve in this area during the scenario period. Consider current levels of malnutrition and mortality (2D), projected changes to food access (Step 6A), and other factors that may affect malnutrition (e.g., seasonality, disease, and local caring practices).
B Based on Step 6B and Step 7A, classify this area according to the IPC 2.0 Area Scale. Remember to provide classification for the entire scenario period.
Note that malnutrition and mortality are relevant to IPC classification as supporting evidence of food access constraints.
Area classification for ML1: Choose an item.
If the emergency assistance described in Step 3C did not occur would this classification be at least one phase worse?
Choose an item.
Area classification for ML2: Choose an item.
If the emergency assistance described in Step 3C did not occur would this classification be at least one phase worse?
Choose an item.
STEP 8: Identify events that could change the scenario
If the scenario developed above is a “most likely” scenario, list key events that would significantly change the projected outcomes described in steps 6 and 7. In addition to local events, consider national, regional, and international events. Select events that:
Are possible, but are not included in the scenario. Extremely unlikely events should not be included here.
Would result in a change in the IPC classification for this area.

FEWS NET Scenario Development for Food Security Early Warning January 2018
Famine Early Warning Systems Network 35
Annex III. SST Example STEP 1: Set parameters
A Identify the specific geographic area of focus and provide the area’s population.
Central Sorghum Livestock livelihood zone in Moroto, Kaabong, and Napak districts, Uganda
C Choose scenario type14 Most likely scenario
B Identify the household group that this scenario will focus on.15 Provide the population estimate for this group and calculate what proportion of the area population this represents.
Very poor households Moroto: 19,119 people (19%) Napak: 25,736 people (19%) Kaabong: 37,920 people (22%)
D Define scenario duration and timing October 2017- May 2018
STEP 2: Describe and classify current food security
A Summarize your evidence of current food security conditions (e.g., seasonal progress, recent harvests, food prices, humanitarian assistance, etc.) (Current means beginning of the first month of the scenario period.)
Rainfall (Data sources: USGS, R2) • The April to September main rainy season in Karamoja started erratically, with below-average and poorly distributed rainfall in April. Rainfall amounts typically
reduce in June, but rainfall during these months was below average, resulting in a prolonged dry period. Dekadal rainfall remained below average from the start of season up to July. Most areas received above-average rainfall from July to September and, as a result, total seasonal rainfall was above average tending to average.
Kaabong District
Moroto District
Pasture and water resources; livestock conditions (USGS, R2; Key informant information, R1) • Livestock body conditions and production are average to above average. Likewise, milk production is near average at three liters per lactating cow per day and 0.5
liters per lactating shoat per day.
14 The default option for FEWS NET scenario building is a most-likely scenario. In specific cases, additional scenarios can be developed. 15 The default option for FEWS NET scenario building is the poorest wealth group, typically the “Poor”, under the assumption that this group faces the most severe food insecurity and accounts for at least 20% of the area’s population. Scenarios can also be built for livelihood groups (e.g., nomadic pastoralists) or other groups (e.g., IDPs).

FEWS NET Scenario Development for Food Security Early Warning January 2018
Famine Early Warning Systems Network 36
• Some very poor households who typically own 1–2 shoats are presently benefiting from milk as payment for herding livestock for well-off households whose livestock are currently grazed within the usual permanent grazing areas near homesteads.
Cropping conditions (Sources: Rapid assessments and key informant information, R1) • While rainfall was erratic at the start of the season, near average rainfall in May supported recovery and growth of sorghum crops that were planted in April and
May. Rainfall also permitted some households to carry out late planting in May, although the late planted sorghum in some areas was affected by the atypical dry spell. In other areas, though, sorghum crops were able to recover - above-average rainfall from July to September supported crop development among late-planted crops. The late-season rainfall also benefited the development of long-cycle sorghum, which is primarily planted in Kotido, Napak and Kaabong.
• Overall, crops were planted early or on time in southern areas of the livelihood zone, mostly in the wet belts of the zone bordering Napak district. As of October, harvesting is ongoing in all areas.
• Fall Armyworm reportedly destroyed some maize crops in Karamoja, with the greatest impact in Moroto.
Market supplies and prices (Sources: price data – Farmgain and WFP (FEWS NET analysis), R2) • The supply of staple foods, especially sorghum, millet, maize, and beans into Karamoja increased in July and August compared to the lean season of March-June,
from the harvest of first season crops in surrounding bimodal areas that typically supply Karamoja: Acholi, Teso and Sebei. As a result, retail prices of these commodities have decreased sharply in recent months. Furthermore, the start of the harvest in Moroto, Kotido, Napak and Nakapiripirit has increased the supply of sorghum on markets, contributing to price declines.
• The availability of sorghum from own production is also increasing household stocks, reducing household dependence on the market. This has further contributed to declining staple food prices.
• Staple food prices were well above average in these markets during much of 2016 and early 2017, and have now fallen to levels similar to the five-year average.
Retail price of sorghum in September 2017 compared to last year and the five-year average Moroto Nakapiripirit Kotido Napak Kaabong Average
5 Yr Average -18% 11% -25% -22 0% -8%
Last year -22% -20% -24% -11 -17% -21%
Last Month -8% -29% -38% -20 -8% -21%
eModis NDVI, Moroto
eModis NDVI as of Sept 1, 2017, Uganda

FEWS NET Scenario Development for Food Security Early Warning January 2018
Famine Early Warning Systems Network 37
Food access: Household purchasing capacity (Sources: price data – Farmgain and WFP, R2; sources of income – FSNA, WFP/UNHCR, June 2017 R1 due to date)
• Agriculture labor through harvesting, and sale of firewood and charcoal remain the most important income sources for households in the Central Sorghum Livestock livelihood zone.
• Firewood and charcoal prices increased by 19 and 12 percent respectively, from August to September, while sorghum prices were declining. This has led to increasing terms of trade of these commodities with respect to sorghum.
• With the end of the production season, agricultural wage labor is less available to very poor and poor households. However, non-agricultural casual labor, such as cleaning, fetching water, and sales of vegetables, is still available to poor and very poor households. Casual labor opportunities remain available at normal levels in trading centres and nearby urban centres.
• Charcoal prices increased by an average of 30 percent from September last year to September 2017 in Napak, Kaabong and Kotido, while it decreased by an average of 35 percent in Moroto and Nakapiripirit. Firewood prices declined but remained stable in Moroto but increased by average of 35 percent in the other 6 markets in Karamoja.
• Terms of trade changes are therefore driven by a combination of the decline in sorghum and increase in prices of firewood, charcoal and casual labour prices in some markets.
• Terms of trade for firewood/charcoal-to-sorghum and wage rate-to-sorghum have increased in the past months and are now at near normal levels in some markets and above normal in others like Kotido.
• Some households have also reported income-earning opportunities through gold mining.
Firewood to Sorghum TOT (Kotido) Charcoal to Sorghum TOT (Moroto)
Wage rate to sorghum TOT (Nakapiripirit) Wage rate to sorghum TOT (Kaabong)
0.01.02.03.04.05.06.07.0
Kgs o
f Sor
ghum
per
bu
ndle
of f
irew
ood
5Yr
0.05.0
10.015.020.025.030.0
Kgs o
f Sor
ghum
per
bag
of
Cha
rcoa
l
5Yr 2016 2017
0.01.02.03.04.05.06.07.0
Kgs o
f Sor
ghum
per
Day
s wag
e
5Yr 2016
0.010.020.030.040.050.060.070.0
Kgs o
f Sor
ghum
per
bag
of
Char
coal
5Yr 2016

FEWS NET Scenario Development for Food Security Early Warning January 2018
Famine Early Warning Systems Network 38
Ongoing, inter-annual assistance (Sources: WFP, GoU, R2)
• As of June, Food for Work and Cash for Work programs through WFP under the renewed NUSAF III project were ongoing and were important sources of food for very poor households in the livelihood zone. The June FSNA report estimates that 31 percent of households in the CSL zone received food and humanitarian assistance in the form of food aid (28 percent) and cash (3 percent), with most beneficiaries from Kaabong (49 percent) and Kotido (41 percent).
• However, the July 2017 country brief indicated that 381,000 people were assisted in July through WFP-supported nutrition and school feeding activities in Karamoja but the activities were facing funding shortfalls both for food assistance for vulnerable households and for health/nutrition and education systems support to address chronic issues linked to food security in the region.
B Summarize your evidence of current household food consumption and the status of household livelihoods. This could be direct evidence, like the result of a food security survey, or inferred evidence, like the outcome of livelihoods-based analysis.
Food consumption: Data from the June 2017 FSNA is given below.
Food Consumption Score by District, June 2017 versus June 2016
Food consumption outcomes in districts of concern
Food consumption score (FCS), June 2017: Moroto: Poor 17%, Borderline 32%, Acceptable 51%; Napak: Poor 26%, Borderline 35%, Acceptable 39%; Kaabong: Poor 4%, Borderline 33%, Acceptable 62%; Compared to the same time last year, in Moroto and Napak there has been a slight decline in food consumption, indicated by a higher percentage of households reporting poor food consumption rather than borderline. Conversely, in Kaabong, there has been a significant improvement in food consumption according to the FCS. WFP notes this is due to additional assistance in the area. At present, the harvest is now available for most households and prices have declined substantially. With this information, it is expected that the majority of very poor households have access to food to meet basic food needs. However, households in Rupa, Nadunget and Tapac subcounties did not harvest. In Moroto 27 percent of households do not have access to agricultural land to support their livelihoods. Over 60 percent of the households have no livestock to support food access. Also poor households need to pay off accumulated debts acquired during the long lean season; over 50% of households borrowed to purchase food, hence their ability to invest in restoring their livelihoods remains limited.
Livelihood Change16: No notable livelihood change.
16 This should describe the different strategies households use to respond to current or expected food consumption deficits – this may include expansion of current livelihoods strategies (e.g. increasing livestock sales) or the implementation of additional, new strategies (e.g. sale of agricultural tools). Livelihoods change, however, is not: consumption-based strategies (e.g. reducing number of meals or portion size, shifting to less preferred foods – these fall under Food Consumption); nor is it the loss of livelihoods or extreme loss of assets due to a shock; nor is it a shift in livelihoods for reasons other than current or expected food consumption gaps.

FEWS NET Scenario Development for Food Security Early Warning January 2018
Famine Early Warning Systems Network 39
C Based on your response to 2A/2B classify the current food insecurity of the chosen HH group (1B) using the IPC 2.0 Household Scale.17
HH Group (1B) Classification: Stressed (IPC Phase 2)
D Based on the HH classification (2C), and available nutrition/mortality data, classify the overall area (1A) using the IPC 2.0 Area Scale.
Description of available nutrition information:
GAM (WHZ), (Sources: FSNA, June 2017, R1): The FSNA survey conducted by UNICEF, FAO and WFP in June 2017 indicated that nutrition, according to GAM (WHZ) has improved slightly in Kaabong and Napak, although the improvement is not statistically significant. In Moroto, nutritional status deteriorated compared to the same time last year. In Kaabong and Moroto, GAM is ‘Serious’ according to WHO classification (GAM (WHZ) 10-14%). In Moroto, GAM is ‘Critical’ according to WHO classification (GAM (WHZ) >= 15%). Although the increase was not statistically significant, the percentage of children severely malnourished also increased in Moroto compared to June 2016. This level of malnutrition is not atypical to Moroto, though, where GAM (WHZ) above 15 percent was also observed in past years.
District N GAM (WHZ) (95% CI) SAM (WHZ) (95% CI) Underweight (95% CI) Stunting (95% CI)
June 2016 June 2017 June 2016 June 2017 June 2016 June 2017 June 2016 June 2017 June 2016 June 2017
Kaabong 821 874 12.8% (10.4-15.6)
11.8% (9.8-14.0)
1.7% (1.0-2.9)
2.1% (1.3-3.3%)
21.6% (18.9-24.5)
30.6% (26.7-34.7)
26.1% (23.1-29.3)
40.5% (36.6-44.5)
Moroto 533 851 13.7% (10.3-18.0)
18.5% (15.7-21.6)
3.4% (1.9-6.0)
4.5% (3.1-6.5)
26.6% (21.8-32.0)
35.9% (32.5-39.3)
34.1% (29.8-31.1)
40.9% (37.4-44.4)
Napak 609 830 13.6% (10.5-17.5)
12.7% (10.7-14.7%)
2.5% (1.5-4.0%)
1.8% (1.1-2.9)
31.4% (26.5-36.8)
29.6% (26.0-33.4)
39.9% (35.5-44.4)
31.9% (28.9-35.2)
The UNICEF humanitarian Situation Report for July-August reported a slight reduction in the number of severely malnourished children in July 2017 compared to the same time last year.
Area Classification: Stressed (IPC Phase 2)
In the absence of emergency assistance would this classification be at least one phase worse? No
17 When assigning the classification, consider what household food consumption typically looks like during this period. For example, if the analysis indicates that food consumption during the current lean season is typical, but, during a typical year, food deficits exist during this period, the household group might still be classified in a phase other than IPC Phase 1.
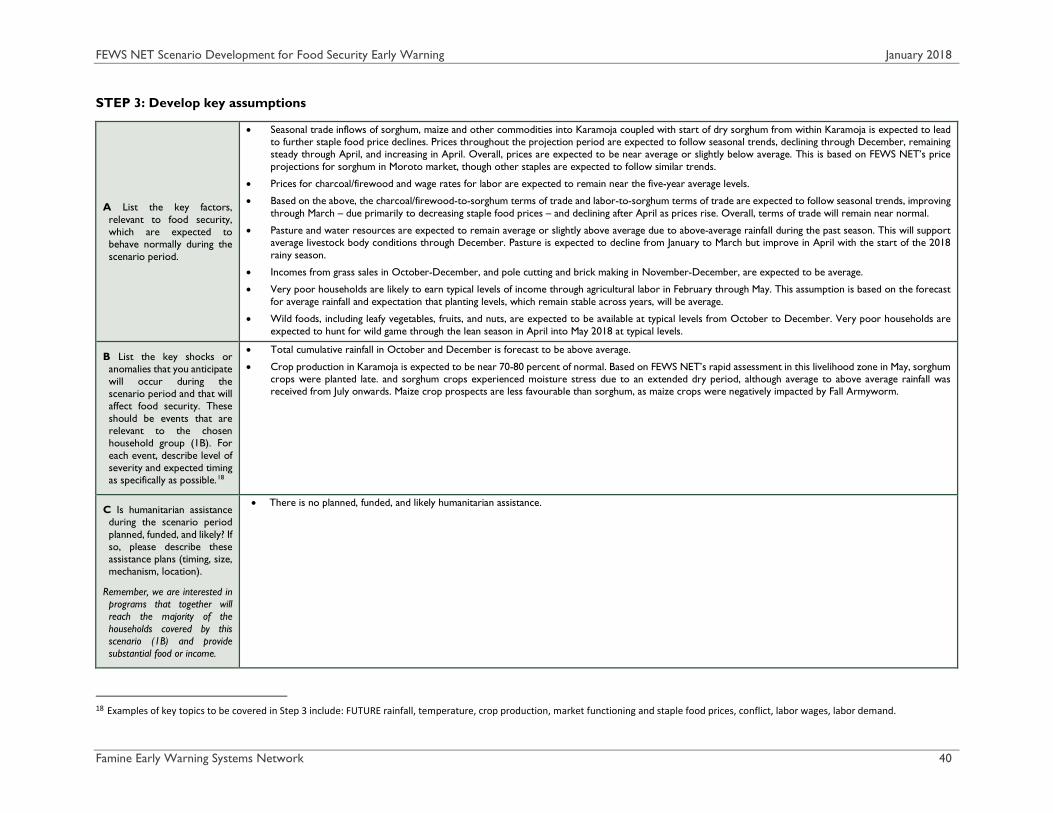
FEWS NET Scenario Development for Food Security Early Warning January 2018
Famine Early Warning Systems Network 40
STEP 3: Develop key assumptions
A List the key factors, relevant to food security, which are expected to behave normally during the scenario period.
• Seasonal trade inflows of sorghum, maize and other commodities into Karamoja coupled with start of dry sorghum from within Karamoja is expected to lead to further staple food price declines. Prices throughout the projection period are expected to follow seasonal trends, declining through December, remaining steady through April, and increasing in April. Overall, prices are expected to be near average or slightly below average. This is based on FEWS NET’s price projections for sorghum in Moroto market, though other staples are expected to follow similar trends.
• Prices for charcoal/firewood and wage rates for labor are expected to remain near the five-year average levels.
• Based on the above, the charcoal/firewood-to-sorghum terms of trade and labor-to-sorghum terms of trade are expected to follow seasonal trends, improving through March – due primarily to decreasing staple food prices – and declining after April as prices rise. Overall, terms of trade will remain near normal.
• Pasture and water resources are expected to remain average or slightly above average due to above-average rainfall during the past season. This will support average livestock body conditions through December. Pasture is expected to decline from January to March but improve in April with the start of the 2018 rainy season.
• Incomes from grass sales in October-December, and pole cutting and brick making in November-December, are expected to be average.
• Very poor households are likely to earn typical levels of income through agricultural labor in February through May. This assumption is based on the forecast for average rainfall and expectation that planting levels, which remain stable across years, will be average.
• Wild foods, including leafy vegetables, fruits, and nuts, are expected to be available at typical levels from October to December. Very poor households are expected to hunt for wild game through the lean season in April into May 2018 at typical levels.
B List the key shocks or anomalies that you anticipate will occur during the scenario period and that will affect food security. These should be events that are relevant to the chosen household group (1B). For each event, describe level of severity and expected timing as specifically as possible.18
• Total cumulative rainfall in October and December is forecast to be above average.
• Crop production in Karamoja is expected to be near 70-80 percent of normal. Based on FEWS NET’s rapid assessment in this livelihood zone in May, sorghum crops were planted late. and sorghum crops experienced moisture stress due to an extended dry period, although average to above average rainfall was received from July onwards. Maize crop prospects are less favourable than sorghum, as maize crops were negatively impacted by Fall Armyworm.
C Is humanitarian assistance during the scenario period planned, funded, and likely? If so, please describe these assistance plans (timing, size, mechanism, location).
Remember, we are interested in programs that together will reach the majority of the households covered by this scenario (1B) and provide substantial food or income.
• There is no planned, funded, and likely humanitarian assistance.
18 Examples of key topics to be covered in Step 3 include: FUTURE rainfall, temperature, crop production, market functioning and staple food prices, conflict, labor wages, labor demand.

FEWS NET Scenario Development for Food Security Early Warning January 2018
Famine Early Warning Systems Network 41
STEP 4: Describe impacts on HH income sources
A List the sources of cash income typically used during the scenario period.
B Typically, how important is each income source during the first four months of the scenario period (ML1)?
C Given the assumptions made in Step 3, how will income from this source compare to average (4B) during the first four months of the scenario period (ML1)?
D Typically, how important is each income source during the second four months of the scenario period (ML2)?
E Given the assumptions made in Step 3, how will income from this source compare to average (4B) during the second four months of the scenario period (ML2)?
F If the level of income from a specific source will be different than usual, please explain why.
1. Agricultural labor (cultivation)
Minor (<10%) Average Moderate (30-50%) Slightly below average
Given that the consumption year runs from July 2017 – June 2018, this labor applies to next year’s (2018) new production season that starts with land preparation as early as February through May. It is expected that cultivation labor will be slightly below average, though, due to increased use of oxen to plow fields. Agricultural labor is now around 3,500 UGX. Very poor households will likely earn around 192,500 from this source.
2. Agricultural labor (harvest)
Moderate (10-30%) Slightly below average Minor
<10% Slightly below average
It is assumed that a member of a very poor household is working around 7 days/month (total of 18-21 days during the harvest) at a rate of 3,500. It is likely two members of each very poor household are engaged in this work. Households are expected to earn around 70,000. Since the harvest period began late, opportunities will be available till December. Given the slightly below average harvest, agricultural labor opportunities will be slightly below average.
3. Self-employment Moderate (10-30%) Below average Moderate
(30-50%) Below average
Very poor households are engaged in brick laying and grass selling. It is assumed that households sell bricks or grass around 8 times a month for roughly four months out of the year. A very poor household is likely to earn about 148,000 UGX as the above sales and current prices. This is below average, driven by lower prices.
4. Domestic labor Minor 10% Slightly below average Minor
10% Slightly below average
According to key informants, employment opportunities in the towns are low due to higher labor supply; very poor households indicated having fewer opportunities than in past years. It is assumed that wage rates have increased similar to those of agricultural labor (at a greater rate than food price inflation), and therefore total income is only slightly below average.
5. Firewood/ Charcoal
Moderate (10-30%) Below average Moderate
(10-30%) Below average
It is expected that 1 household member will engage in this activity and sell 2 bags/month for 7 months/year. A bag of charcoal costs 15,000. Households will earn roughly 210,000 UGX during the outlook period. With firewood, it is expected

FEWS NET Scenario Development for Food Security Early Warning January 2018
Famine Early Warning Systems Network 42
that 1 person in the household will sell for 9 months/year, selling around 4 bundles/month. A bundle costs around 3,000, earning 108,000. Selling is now taking place outside of normal months because of improved roads that take this product outside of Karamoja. Many more households are engaged in this activity; as a result, overall income is below average.
G List any atypical sources of cash income likely to be used during the scenario period.19
H How important will each income source be during the first three months of the scenario period (ML1)?
J How important will each income source be during the second three months of the scenario period (ML2)?
K Describe the evidence which suggests each atypical income source will be used.
1. Choose an item. Choose an item.
2. Choose an item. Choose an item.
L Given your assumptions in Columns C and H, how will total household income compare to normal during ML1?
Significantly below average M Given your assumptions in Column E and J,
how will total household income compare to normal during ML2?
Significantly below average
STEP 5: Describe impacts on HH Food sources
A List the sources of food typically consumed during the scenario period.
B Typically, how important is each food source during the first four months of the scenario period (ML1)?
C Given the assumptions made in Step 3, how will food from this source compare to average (5B) during the first three months of the scenario period (ML1)?
D Typically, how important is each food source during the second four months of the scenario period (ML2)?
E Given the assumptions made in Step 3, how will food from this source compare to average (5B) during the second three months of the scenario period (ML2)?
F If the level of food from a specific source will be different than usual, please explain why.
1. Sorghum production Significant (30%-50%) Slightly below average Moderate
(10%-30%) Slightly below average
Production is expected to be below average due to the delayed start of rainfall, and longer dry spell in June-July that reduced crop vigor, as well as the above-average cost of seeds. Field crops dried from wilting and moisture stress and reduced area planted.
2. Maize production Significant (30%-50%) Below average Moderate
(10%-30%) Below average
Production is expected to be below average due to the delayed start of rainfall, as well as Fall Armyworm and the above-average cost of seeds. Some maize fields dried from wilting and moisture stress and reduced area planted.
19 This should include any humanitarian assistance provided as cash.
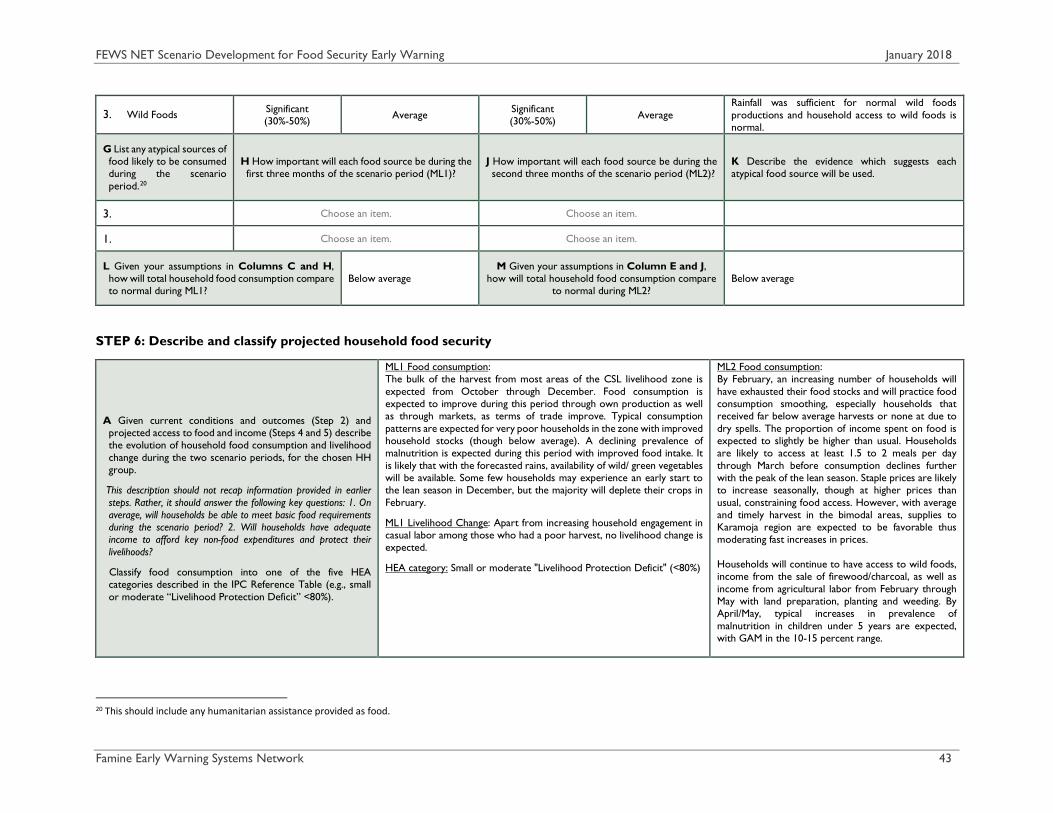
FEWS NET Scenario Development for Food Security Early Warning January 2018
Famine Early Warning Systems Network 43
3. Wild Foods Significant (30%-50%) Average Significant
(30%-50%) Average Rainfall was sufficient for normal wild foods productions and household access to wild foods is normal.
G List any atypical sources of food likely to be consumed during the scenario period.20
H How important will each food source be during the first three months of the scenario period (ML1)?
J How important will each food source be during the second three months of the scenario period (ML2)?
K Describe the evidence which suggests each atypical food source will be used.
3. Choose an item. Choose an item.
1. Choose an item. Choose an item.
L Given your assumptions in Columns C and H, how will total household food consumption compare to normal during ML1?
Below average M Given your assumptions in Column E and J,
how will total household food consumption compare to normal during ML2?
Below average
STEP 6: Describe and classify projected household food security
A Given current conditions and outcomes (Step 2) and projected access to food and income (Steps 4 and 5) describe the evolution of household food consumption and livelihood change during the two scenario periods, for the chosen HH group.
This description should not recap information provided in earlier steps. Rather, it should answer the following key questions: 1. On average, will households be able to meet basic food requirements during the scenario period? 2. Will households have adequate income to afford key non-food expenditures and protect their livelihoods?
Classify food consumption into one of the five HEA categories described in the IPC Reference Table (e.g., small or moderate “Livelihood Protection Deficit” <80%).
ML1 Food consumption: The bulk of the harvest from most areas of the CSL livelihood zone is expected from October through December. Food consumption is expected to improve during this period through own production as well as through markets, as terms of trade improve. Typical consumption patterns are expected for very poor households in the zone with improved household stocks (though below average). A declining prevalence of malnutrition is expected during this period with improved food intake. It is likely that with the forecasted rains, availability of wild/ green vegetables will be available. Some few households may experience an early start to the lean season in December, but the majority will deplete their crops in February.
ML1 Livelihood Change: Apart from increasing household engagement in casual labor among those who had a poor harvest, no livelihood change is expected.
HEA category: Small or moderate "Livelihood Protection Deficit" (<80%)
ML2 Food consumption: By February, an increasing number of households will have exhausted their food stocks and will practice food consumption smoothing, especially households that received far below average harvests or none at due to dry spells. The proportion of income spent on food is expected to slightly be higher than usual. Households are likely to access at least 1.5 to 2 meals per day through March before consumption declines further with the peak of the lean season. Staple prices are likely to increase seasonally, though at higher prices than usual, constraining food access. However, with average and timely harvest in the bimodal areas, supplies to Karamoja region are expected to be favorable thus moderating fast increases in prices. Households will continue to have access to wild foods, income from the sale of firewood/charcoal, as well as income from agricultural labor from February through May with land preparation, planting and weeding. By April/May, typical increases in prevalence of malnutrition in children under 5 years are expected, with GAM in the 10-15 percent range.
20 This should include any humanitarian assistance provided as food.

FEWS NET Scenario Development for Food Security Early Warning January 2018
Famine Early Warning Systems Network 44
ML2 Livelihood Change: Apart from increasing household engagement in casual labor among those who had a poor harvest, no livelihood change is expected.
HEA category: Small or moderate "Livelihood Protection Deficit" (<80%)
B Based on your response to 6A, classify the chosen HH group (1B) in this area using the IPC 2.0 Household Scale. HH Group (1B) Classification for ML1: Stressed (IPC Phase 2) HH Group (1B) Classification for ML2: Stressed (IPC
Phase 2)
STEP 7: DESCRIBE AND CLASSIFY PROJECTED AREA FOOD SECURITY
A Describe how malnutrition and mortality are likely to evolve in this area during the scenario period. Consider current levels of malnutrition and mortality (2D), projected changes to food access (Step 6A), and other factors that may affect malnutrition (e.g., seasonality, disease, and local caring practices).
• Levels of acute malnutrition in this livelihood zone are expected to decline through February with the availability of the harvest, but remain ‘Serious’ (10-15% per WHO classification). This is based on past GAM (WHZ) trends in Karamoja that show slight declines in GAM between June and December data collection periods, but with levels above 10 percent most years. Malnutrition is expected to again increase slightly from March, after the harvest is depleted, through the end of the projection period. However, these increases will be slight and are expected to be driven by other factors than food insecurity, including disease and feeding practices.
B Based on Step 6B and Step 7A, classify this area according to the IPC 2.0 Area Scale. Remember to provide classification for the entire scenario period.
Note that malnutrition and mortality are relevant to IPC classification as supporting evidence of food access constraints.
Area Classification for ML1: Stressed (IPC Phase 2)
If the emergency assistance described in Step 3C did not occur would this classification be at least one phase worse? No
Area Classification for ML2: Stressed (IPC Phase 2)
If the emergency assistance described in Step 3C did not occur would this classification be at least one
phase worse? No
STEP 8: IDENTIFY EVENTS THAT COULD CHANGE THE SCENARIO
If the scenario developed above is a “most likely” scenario, list key events that would significantly change the projected outcomes described in steps 6 and 7. In addition to local events, consider national, regional, and international events. Select events that:
• Are possible, but are not included in the scenario. Extremely unlikely events should not be included here.
• Would result in a change in the IPC classification for this area.
• Unanticipated sorghum demand from other areas of the country or the region that result in much higher prices than anticipated. At higher sorghum prices, household food access would be constrained.
• An early onset of seasonal rains in March 2018 would provide casual labor opportunities that would boost household incomes.
• An outbreak or increased incidence of livestock diseases such as foot and mouth disease, Contagious Bovine Pleural Pneumonia and strictly enforced quarantines could potentially aggravate the food insecurity faced by households that intend to sell livestock for food purchases.

FEWS NET Scenario Development for Food Security Early Warning January 2018
Famine Early Warning Systems Network 45
Annex IV. Examples of Steps 4 and 5 Example of STEP 4
A List the sources of cash income typically used during the scenario period.
B Typically, how important is each income source during the first four months of the scenario period (ML1)?
C Given the assumptions made in Step 3, how will income from this source compare to average (4B) during the first four months of the scenario period (ML1)?
D Typically, how important is each income source during the second four months of the scenario period (ML2)?
E Given the assumptions made in Step 3, how will income from this source compare to average (4D) during the second four months of the scenario period (ML2)?
F If the level of income from a specific source will be different than usual, please, explain why.
6. On-farm labor Very significant (>50%)
Below average Significant (30-50%)
Below average This area has received significant in-flows of refugees in the last 6 months (>20,000 people). These refugees are expected to compete with local populations for on-farm labor, pushing wages down.
7. Staple crop sales
Moderate (10-30%)
Above average (Increase by 20%)
Moderate (10-30%)
Above average Crop production is expected to be average but farmgate prices are expected to be higher than usual in part because the government has raised its purchase price to 45 pesos/bag.
8. Wild food sales Minor (<10%) No wild food sales this year
N/A N/A Overharvesting of wild foods during last year’s crisis means that these foods will be very scarce this year.
9. Remittances Minor (<10%) No change Minor (<10%) No change Remittance information from the national bank indicates average levels this year.
G List any atypical sources of cash income likely to be used during the scenario period.21
H How important will each income source be during the first four months of the scenario period (ML1)?
J How important will each income source be during the second four months of the scenario period (ML2)?
K Describe the evidence which suggests each atypical income source will be used.
1. Market vouchers (humanitarian assistance)
Minor (<10%) None Per the assumption in Step 3, WFP is funding a program giving market vouchers during the first four months of the scenario period
L Given the assumptions in Columns C and H, how will total household income compare to normal during ML1?
Below average (household income will be about 4/5 of average).
M Given the assumptions in Column E and J, how will total household income compare to normal during ML2?
Household income will be about average.
21 This should include any humanitarian assistance provided as cash.
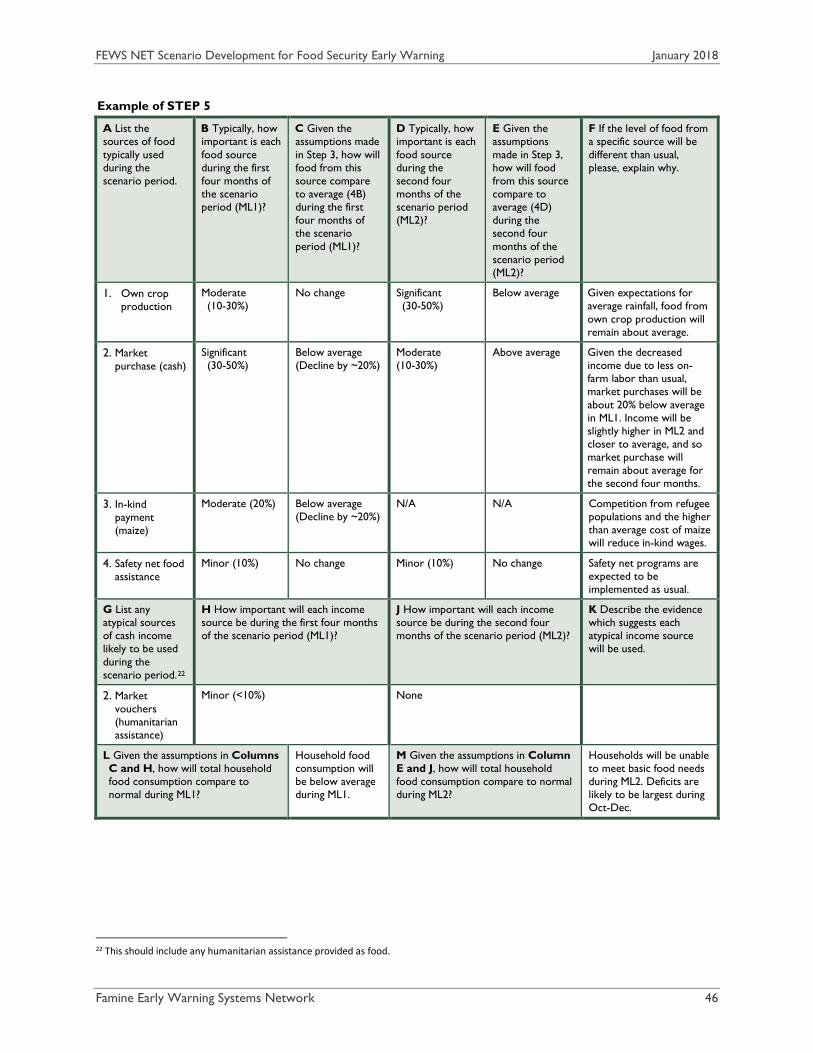
FEWS NET Scenario Development for Food Security Early Warning January 2018
Famine Early Warning Systems Network 46
Example of STEP 5
A List the sources of food typically used during the scenario period.
B Typically, how important is each food source during the first four months of the scenario period (ML1)?
C Given the assumptions made in Step 3, how will food from this source compare to average (4B) during the first four months of the scenario period (ML1)?
D Typically, how important is each food source during the second four months of the scenario period (ML2)?
E Given the assumptions made in Step 3, how will food from this source compare to average (4D) during the second four months of the scenario period (ML2)?
F If the level of food from a specific source will be different than usual, please, explain why.
1. Own crop production
Moderate (10-30%)
No change Significant (30-50%)
Below average Given expectations for average rainfall, food from own crop production will remain about average.
2. Market purchase (cash)
Significant (30-50%)
Below average (Decline by ~20%)
Moderate (10-30%)
Above average Given the decreased income due to less on-farm labor than usual, market purchases will be about 20% below average in ML1. Income will be slightly higher in ML2 and closer to average, and so market purchase will remain about average for the second four months.
3. In-kind payment (maize)
Moderate (20%) Below average (Decline by ~20%)
N/A N/A Competition from refugee populations and the higher than average cost of maize will reduce in-kind wages.
4. Safety net food assistance
Minor (10%) No change Minor (10%) No change Safety net programs are expected to be implemented as usual.
G List any atypical sources of cash income likely to be used during the scenario period.22
H How important will each income source be during the first four months of the scenario period (ML1)?
J How important will each income source be during the second four months of the scenario period (ML2)?
K Describe the evidence which suggests each atypical income source will be used.
2. Market vouchers (humanitarian assistance)
Minor (<10%) None
L Given the assumptions in Columns C and H, how will total household food consumption compare to normal during ML1?
Household food consumption will be below average during ML1.
M Given the assumptions in Column E and J, how will total household food consumption compare to normal during ML2?
Households will be unable to meet basic food needs during ML2. Deficits are likely to be largest during Oct-Dec.
22 This should include any humanitarian assistance provided as food.