Few important contents have been - aviseanalytics.com Tech Discussion -Why tesla home storage...
22
1 TRANSFORMING WORLD DAILY STOCKS REPORT 03 Market Comment - Did the market enter a losing game? 03 Technical Outlook – 7 Major Tech Indices | 10 S&P500 Sectors 12 Technical Call - BUY: Facebook, Inc (FB) 13 Transforming Tech - Daily Research on 240 Tech Stocks 14 Tech Discussion - Why tesla home storage battery is a big deal? 22 Transforming World Companies - Lululemon Athletica (LULU) Few important contents have been removed in this sample report for privacy purpose Nov 9 , 2015 Securities offered through Cantella & Co., Inc., member FINRA, SIPC. Cantella & Co and F&MSI are separate companies
Transcript of Few important contents have been - aviseanalytics.com Tech Discussion -Why tesla home storage...
1
TRANSFORMING WORLDDAILY STOCKS REPORT
03 MarketComment- Didthemarketenteralosinggame?
03 TechnicalOutlook– 7 MajorTechIndices|10S&P500Sectors
12 TechnicalCall- BUY:Facebook,Inc (FB)
13 TransformingTech- DailyResearchon240TechStocks
14 TechDiscussion-Whyteslahomestoragebatteryisabigdeal?
22 TransformingWorldCompanies- Lululemon Athletica (LULU)
Few important contents have been removed in this sample report for privacy
purpose
Nov9,2015
SecuritiesofferedthroughCantella &Co.,Inc.,memberFINRA,SIPC.Cantella &CoandF&MSIareseparatecompanies

2
DailyTransformingTechMarketComment
Thegreatestgameintownthesedayshastwoobjectives:Youeitherrunafterbetterthanexpectedeconomicdataandtheperceptionofaneconomicrecovery(youhavetocalculatetheriskthattheFedmightreallyraiseratesinSeptember),oryouplayweakerthanexpecteddata,tryingtoexhaustthe“low-rates-for-longer”investmentformula.Theriskwiththelatteristhatthecontinuedweaknessintheeconomy(aswellasrevenues,earningsandmargins)willreachapointatwhichthegapbetweenhopeandrealitycannotgetignoredanymore.
Yesterday,investorsgotalittledisturbedasa0.9%jumpinpersonalspendinginMayledtotheperceptionthattheFedmayquicklyrunoutofargumentsnottoraiserates.Sinceeveryexpertandnon-experttalkedaboutastrongreboundineconomicactivity,marketparticipantsliterallyknewthatitwouldhappen,andnobodyseemedsurprisedaboutsomeextraordinarilystrongnumbers.DidanybodyquestionthatpersonalspendingshowedthehighestmonthlygrowthratesinceAugust2009?Well,strongautomobilesalesandalmost5%higherpricesforenergygoodsandservicescertainlyexplainsomeofthegrowth.Bytheway,onealsowonders--didanybodyquestionthepowerfulreboundinhousingdataforMayandpartofApril,wheretheentire“recovery”inthehousingmarketcamefrom70-90%growthratesintheNortheastthatreportednumbersneverseensincesummer2008?
MorenegativedevelopmentsintheGreekdebtsagaalsocontributedtoanotherintradayreversaltothedownsideinequitiesthatpushedtheDowJonesTransportationIndextothelowestclosesinceOctober20,2014.Mostotherindicesremaininthistight4-monthtradingrange,whereindicescaneasilytestthetoporbottomtrend-lineswithintwoorthreetradingdaysandonlylessimportanttechnicalsupportlevelsgetbroken.
Theendofthemonthandthequarter,aswellastheannualrebalancingoftheRussellindices,willprobablyensurethattoday’ssessionmayofferafewunexpecteddevelopmentsand/orhighervolatility.Nomajoreconomicnumberonthecalendarmaytemporarilychangetherulesofthegreatestgameintown.However,theprofessionalversionofthisgameincludestheoptionthataseasonalandstatisticalreboundineconomicdatagetshighlyoverestimated,thatunderlyingeconomicstrengthremainsweak,andthattheFedwilleagerlystartraisingratesinthisenvironment,whichcoulddestroywhateverisleftintermsofeconomicstrength,andmaysetthecount-downfortheendofmostZIRPandQE-triggeredspeculativebehavior(inaddition,itwouldgodowninhistoryasoneofthemajormistakesmadebytheU.S.centralbank).
Tradewell.
Didthemarketenteralosinggame?
Dow Jones17,910.33 +0.26%
NYSE10,513.36 (-0.33%)
S&P5002,099.20 (-0.03%)
NASDAQ5,147.12 +0.38%
Russell20001,199.75 +0.76%
CrudeOil $44.29 (-2.05%) NaturalGas $2.37 +0.30% Gold $1,087.60 (-1.54%) Silver $14.70 (-1.99%) Copper $2.24 (-0.54%)
GlobalIndices Latest Change%
EuropeFTSE100 6,353.83 -0.17%DAX 10,988.03 +0.91%CAC40 4,984.15 +0.08%AsiaAsiaDow 2,807.76 -0.78%Nikkei225 19,642.74 +1.96%HangSeng 22,726.77 -0.61%Shanghai 3,646.88 +1.58%Sensex 26,190.22 -0.28%Singapore 2,997.72 -0.42%
TechIndices Latest Change%
QTEC 44.08 +1.05%NBI 3,454.59 -0.37%NQUSS9537T 2,055.38 +1.82%NQUSS9530 1,839.79 +1.97%SOXX 91.51 +2.65%QNET 478.46 +0.32%NYXBT 382.36 -2.78%
Sectors Last%Δ 1yr%Δ
ConsumerDiscretionary -0.02% +20.61%ConsumerStaples -1.07% +3.22%Energy -0.43% -18.22%Financials +1.05% +2.50%HealthCare -0.34% +6.53%Industrials +0.10% -0.03%InformationTechnology +0.41% +10.67%Materials +0.23% -5.67%TelecomServices -0.69% -8.79%Utilities -3.63% -9.45%
Source:YahooFinance
11/6/201
5
Nov Dec
Jan
Feb
Mar Apr
May Jun Jul
Aug
Sep
Oct
11/6/201
5
Nov Dec
Jan
Feb
Mar Apr
May Jun Jul
Aug
Sep
Oct 11/6/201
5
Nov Dec
Jan
Feb
Mar Apr
May Jun Jul
Aug
Sep
Oct
11/6/201
5
Nov Dec
Jan
Feb
Mar Apr
May Jun Jul
Aug
Sep
Oct
11/6/201
5
Nov Dec
Jan
Feb
Mar Apr
May Jun Jul
Aug
Sep
Oct
Volume AdjClose*
3
Symbol Latest Change%
%GainersQRVO 55.55 23.23%FARO 28.26 14.00%NVDA 31.55 13.86%CSOD 35.46 9.51%SPLK 60.17 8.71%%LosersNLNK 33.92 -24.47%INCY 100.21 -14.17%ADAP 11.67 -11.05%MDVN 39.53 -9.23%CREE 24.76 -8.36%
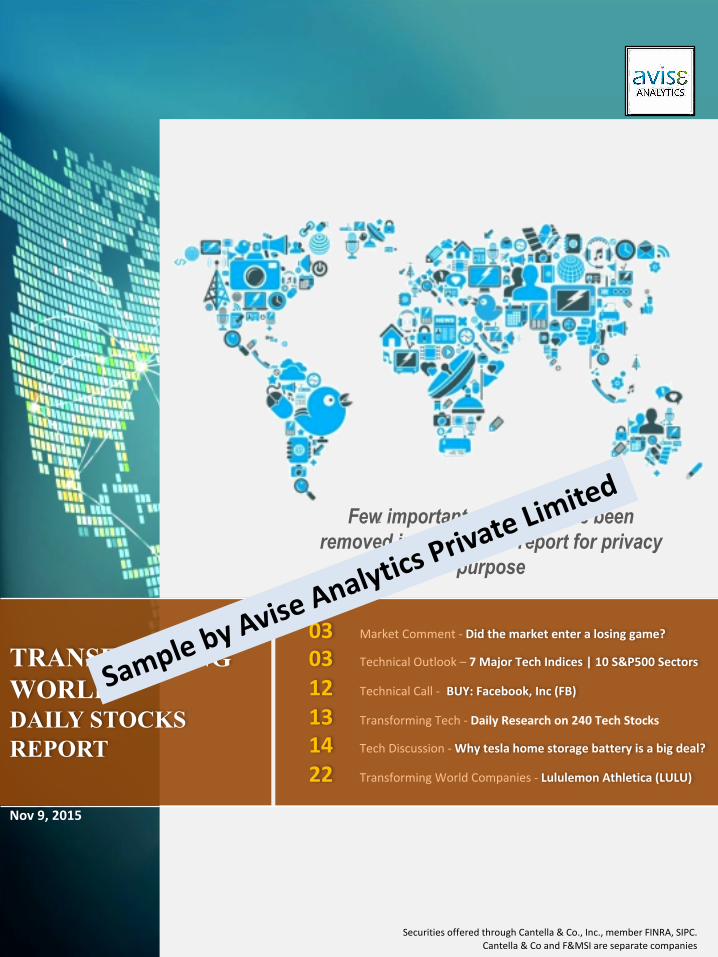
HeadlinesOnF&MSITransformingTechnologies
Mellanox:AHigh-GrowthCompanyWithGoodValueLilly'sixekizumab showspositiveeffectsinpatientswithpsoriaticarthritisinlate-stagestudyCytokinetics andAmgen'somecamtiv mecarbil showspromisingresultsinmid-stageheartfailurestudy
WhyIt'sNotTooLateToGoLongAmazonAcer:AShrinkingPCBusinessAndAShrinkingShareValuePatientsShowSignificantImprovementinSignsandSymptomsofPsoriaticArthritis,LessProgressionofStructuralJointDamageWhenTreatedwithIxekizumab for24Weeks
ShouldAmazonWorryAboutItsDebt?NotableearningsafterMonday’scloseFacebook:RunwayClear,ReadyForTakeoffNotableearningsbeforeMonday’sopenAppliedOptoelectronics'(AAOI)CEOThompsonLinonQ32015Results- EarningsCallTranscriptAlimera Sciences'(ALIM)CEODanMyersonQ32015Results- EarningsCallTranscriptWesternDigitalWorth$90FollowingRecentCatalystsIncomeInvestors- 2WaysYouCanCreateAJuicyIncomeStreamFromFacebookMedivation's (MDVN)CEODavidHungonQ32015Results- EarningsCallTranscriptIgnyta licensesoralcancerdrugcandidatefromEliLillyforupto~$53MWeekInReview:Korea'sHanmi Signs$4.2BillionDealWithSanofiAlibaba:GlobalShoppingDay- ThinkBIGAmgenAndCytokinetics AnnounceLate-BreakingPresentationOfCOSMIC-HFTrialAtAHAScientificSessions2015
bluebirdbio's(BLUE)CEONickLeschly onQ32015Results- EarningsCallTranscriptTroublesAheadForEnphase InAnIncreasinglyCompetitiveIndustryBINDPresentsDataDemonstratingAbilityofAccurins toImproveEfficacyandTolerabilityofMultipleAnti-CancerAgents
FireEye:GrowingCompetitionInSectorDimsFlameTerraForm GlobalOffersA14%DividendYieldAlongWithSignificantCapitalAppreciationPotential
IsisPharmaceuticalsReportsPositiveClinicalDataFromLp(a)LoweringDrugsCabela's:BuyoutBound?Agios AnnouncesDatafromDose-EscalationPhase1StudyofAG-120inPatientswithIDH1MutantPositiveAdvancedSolidTumors
Boeing:EvenWithAStrongQ3,GrowthCouldRemainInLimboForAWhileRegeneron andSanofi PresentResultsfromPivotalPhase3StudyofSarilumab atAmericanCollegeofRheumatologyAnnualMeeting
TeslaMotors:WhyItIsStillA'Barbell'StockCyberArk Software's(CYBR)CEOUdi Mokady onQ32015Results- EarningsCallTranscriptGE:WhyIAmPlanningToAddToMyPositionWithSharesCloseToThe52-WeekHighAlibaba CanBreakOut..IfAllGoesWellQualcommIsRisky,ButThereIsSomeHopeCornerstoneOnDemand (CSOD)AdamMilleronQ32015Results- EarningsCallTranscriptGEToDeliverAModestChristmasGiftToItsInvestorsThisYearAlderBiopharmaceuticals,Inc's(ALDR)CEORandallSchatzman onQ32015Results- EarningsCallTranscript
IsNowTheRightTimeToConsiderFirstSolar?JANAPartnersFeature:ActivistInvestingDailyElon Musk:Wewanttoproducemillionsofcarsayear ►FAROtopresentattheBaird2015IndustrialConferenceAlignTechnologytoPresentatUpcomingConferencesSalesGrowthGeneratesAlpha
Advance Decline
159 81
Disclosure:TheabovematricesarecalculatedbasedontheperformanceofTransformingWorldStockUniverse,startingfromPage:8

4
HeadlinesOnF&MSITransformingTechnologiesOrbitalATK:AStockReadyToExplodeIntoSpaceWholeFoods:TheWorstIsOverGilead- GoodNewsflowAccelerates;All-TimeHighsNowAchievableIntelIoT:ThirdWaveOfComputing20QualityStocksFoundUsingTheNewQualityScoringSystemLillyandMercksubjecttoinquiryintodrugpricingSamsung'sResultsHaveMajorImplicationsForTechAndMediaLaborMarketIsHeatingUp,SoIsPressureOnFedToRespondBehindDisney'smixedresults ►'Pull'Video,Boomerang,AndNotifyMakeFacebook AStrongBuyIBMGoesSoft:FewRealizeThat'sAGoodThingLyondellBasell hiresAebischer asnewCFOQualcommCrashes15%:WhyInvestorsShouldDefinitelyNotSellLexiconPharmaceuticalsProducesAnotherPositiveSurpriseQ42015InvestmentStyleRatingsForETFsAndMutualFundsPremarketBiotechDigest:GeneEditing,Gilead'sGenvoya Approved,Celgene MissesRealvalueinsportscontent:Pro ►EndooptsinfortwonewindicationsforXIAFLEXLyondellBasell NamesThomasAebischer ExecutiveVicePresidentandChiefFinancialOfficerREITsunderpressureasratessoarCree-9.8%;Goldmandowngrades,citesChineserivalsandslowerlightinggrowthSurveyingTheAerospaceArenaShouldAppleInvestorsTimeTheMarket?SolarCity:SmartEmphasisOnCostStructureRetirementFrontline:NoSocialSecurityCOLA,NoInterest,NowNoFileAndSuspendCyberArk tops$50afterQ3beat,above-consensusQ4guidanceNextEra EnergyandNextEra EnergyPartnerstoparticipateinEEIFinancialConferenceCramer:Disney'snarrativehasshifted ►HumanaQ3toplineup9%;EPSup13%;CFOpsup8%;GAAPearningsguidanceloweredDoYouSeriouslyOwnGroupon?Sirona toReportFourthQuarterandFullYearFiscal2015ResultsonNovember20thAmazonOrdersThreeOriginalKidsSeries—DinoDana,TheKicksandLostinOz—andOrdersHalf-HourSpecialShauntheSheep:TheFarmer’sLlamas
AtlasAirWorldwideCFOtoSpeakatStephensInc.FallInvestmentConferenceQorvo AnnouncesProposed$1BillionSeniorNotesOfferingLibertyGlobal(LBTYA)Q32015Results- EarningsCallWebcastBoeingprotestsbomberawardWellCare Gives$7,500inMicro-GrantstoCommunity-BasedOrganizationsthatSupportSocialServiceAgenciesinIowa
SecondQuickBooksConnectEngagesaSold-outAudienceEsperion TherapeuticstoPresentatNovemberHealthcareConferencesHumanabeatsby$0.03,missesonrevenueEMPA-REGOUTCOME®:Top-linerenaldatatobepresentedduringAmericanSocietyofNephrology(ASN)KidneyWeek2015
ShouldInvestorsBuyQualcommAfterTheDrop?Non-AlcoholicFattyLiverDisease:AnUpdateOnRecentClinicalTrials– InterceptFANGIsUnstoppable- Cramer'sMadMoney(11/5/15)CapacityincreasescontinueatAllegiantTravelAlibaba acquiresYouku TudouSunEdison CompletesConstructionofNewHampshire'sLargestSolarPowerPlant

5
HeadlinesOnF&MSITransformingTechnologiesIsisPharmaceuticalstoPresentatUpcomingInvestorConferencesUnitedHealthGroupBoardAuthorizesPaymentofQuarterlyDividendtoShareholders
WallStreetBreakfast:AllEyesOnJobsDisneyposts'balanced'quarter:Analyst ►TrinaSolartoAnnounceThirdQuarter2015ResultsonNovember23,20155BeatAndRaiseStocksToBuyNowValeantSuccumbs,KinderMorganSlides,NatGasPerky- Bezek's DailyBriefingPfizer-Allergan dealcouldseecompanysplitBiosensorsFallsToChinesePrivateEquityAndHintsAtATrendQorvo (QRVO)RobertA.Bruggeworth onQ22016Results- EarningsCallTranscriptShkreli IsCatalystAsJanaDumpsValeantAheadOfBigDropGeneralElectric:TheWormHasDefinitivelyTurnedTripAdvisor (TRIP)StephenKaufer onQ32015Results- EarningsCallTranscriptNVIDIA(NVDA)Jen-Hsun HuangonQ32016Results- EarningsCallTranscript

6
TechnicalOutlook: QTEC|NBI|NQUSS9537T|NQUSS9530
SHORTTERM(14DAYS)PIVOTTABLE
Classic Fibonacci
S2 41.1 41.9
S1 42.6 42.5
PivotPoint 43.3 43.3
R1 44.8 44.2
R2 45.6 44.7
MOVING AVERAGES(EMA)
10d 20d 30d 50d
43.5 42.9 42.4 41.9
MOVING AVERAGES(EMA)
10d 20d 30d 50d
3,445.2 3,398.5 3,397.2 3,443.1
SHORTTERM(14DAYS)PIVOTTABLE
Classic Fibonacci
S2 1,847.7 1,907.2
S1 1,951.5 1,944.0
PivotPoint 2,003.5 2,003.5
R1 2,107.4 2,063.1
R2 2,159.4 2,099.8
MOVING AVERAGES(EMA)
10d 20d 30d 50d
1,994.9 1,967.5 1,955.0 1,948.4
SHORTTERM(14DAYS)PIVOTTABLE
Classic Fibonacci
S2 1,656.98 1,709.38
S1 1,748.39 1,741.75
PivotPoint 1,794.14 1,794.14
R1 1,885.55 1,846.54
R2 1,931.30 1,878.91
MOVING AVERAGES(EMA)
10d 20d 30d 50d
1,761.20 1,749.71 1,745.51 1,740.70
SHORTTERM(14DAYS)PIVOTTABLE
Classic Fibonacci
S2 2,894.8 3,077.1
S1 3,174.7 3,189.8
PivotPoint 3,372.1 3,372.1
R1 3,651.9 3,554.4
R2 3,849.3 3,667.0
0.0
0.1
0.1
0.2
0.2
0.3
0.3
30.0
40.0
50.0
7-Nov-14
5-De
c-14
2-Jan-15
30-Ja
n-15
27-Feb
-15
27-M
ar-15
24-Apr-15
22-M
ay-15
19-Ju
n-15
17-Ju
l-15
14-Aug-15
11-Sep
-15
9-Oct-15
6-Nov-15
VolumeinM
illion
FirstTrustNASDAQ-100-TechSectorETF(QTEC)
Volume DailyClosingValue 200-daysEMA 50-daysEMA
Short-TermBULLISH
1,500.0
2,000.0
2,500.0
3,000.0
3,500.0
4,000.0
4,500.0
7-Nov-14
5-De
c-14
2-Jan-15
30-Ja
n-15
27-Feb
-15
27-M
ar-15
24-Apr-15
22-M
ay-15
19-Ju
n-15
17-Ju
l-15
14-Aug-15
11-Sep
-15
9-Oct-15
6-Nov-15
NASDAQBiotechnology(NBI)
Volume DailyClosingValue 200-daysEMA 50-daysEMA
Short-TermBULLISH
900.0
1,200.0
1,500.0
1,800.0
2,100.0
2,400.0
7-Nov-14
5-De
c-14
2-Jan-15
30-Ja
n-15
27-Feb
-15
27-M
ar-15
24-Apr-15
22-M
ay-15
19-Ju
n-15
17-Ju
l-15
14-Aug-15
11-Sep
-15
9-Oct-15
6-Nov-15
NQUSSmCapSoftwareTRIndex(NQUSS9537T)
Volume DailyClosingValue 200-daysEMA 50-daysEMAShort-TermBULLISH
1,200.0
1,400.0
1,600.0
1,800.0
2,000.0
7-Nov-14
5-De
c-14
2-Jan-15
30-Ja
n-15
27-Feb
-15
27-M
ar-15
24-Apr-15
22-M
ay-15
19-Ju
n-15
17-Ju
l-15
14-Aug-15
11-Sep
-15
9-Oct-15
6-Nov-15
NQUSSmCapSoftware&CompSvcsIndex(NQUSS9530)
DailyClosingPrice 200-daysEMA 50-daysEMA Short-TermBULLISH

7
TechnicalOutlook:SOXX|QNET|NYXBTMOVING AVERAGES(EMA)
10d 20d 30d 50d
90.2 89.0 88.0 87.1
MOVING AVERAGES(EMA)
10d 20d 30d 50d
455.5 448.5 441.3 425.9
MOVING AVERAGES(EMA)
10d 20d 30d 50d
329.58 301.14 286.42 272.11
SHORTTERM(14DAYS)PIVOTTABLE
Classic Fibonacci
S2 215.15 265.15
S1 298.76 296.03
PivotPoint 346.02 346.02
R1 429.63 396.02
R2 476.89 426.90
SHORTTERM(14DAYS)PIVOTTABLE
Classic Fibonacci
S2 414.9 433.7
S1 446.7 445.2
PivotPoint 464.0 464.0
R1 495.7 482.7
R2 513.0 494.3
SHORTTERM(14DAYS)PIVOTTABLE
Classic Fibonacci
S2 85.5 87.5
S1 88.5 88.7
PivotPoint 90.6 90.6
R1 93.6 92.5
R2 95.6 93.7
Source:YahooFinance,GoogleFinance,F&MSIResearch
0.0
0.5
1.0
1.5
2.0
0.0
20.0
40.0
60.0
80.0
100.0
120.0
7-Nov-14
5-De
c-14
2-Jan-15
30-Ja
n-15
27-Feb
-15
27-M
ar-15
24-Apr-15
22-M
ay-15
19-Ju
n-15
17-Ju
l-15
14-Aug-15
11-Sep
-15
9-Oct-15
6-Nov-15
VolumeinM
illion
iSharesS&PNATec.Semi.Idx.Fd.(ETF)(SOXX)
Volume DailyClosingValue 200-daysEMA 50-daysEMA
Short-TermBULLISH
300.0
350.0
400.0
450.0
500.0
7-Nov-14
5-De
c-14
2-Jan-15
30-Ja
n-15
27-Feb
-15
27-M
ar-15
24-Apr-15
22-M
ay-15
19-Ju
n-15
17-Ju
l-15
14-Aug-15
11-Sep
-15
9-Oct-15
6-Nov-15
NASDAQInternet(QNET)
DailyClosingPrice 200-daysEMA 50-daysEMA
Short-TermBULLISH
100.00150.00200.00250.00300.00350.00400.00
29-Ju
n-15
15-Ju
l-15
31-Ju
l-15
16-Aug-15
1-Sep-15
17-Sep
-15
3-Oct-15
19-Oct-15
4-Nov-15
TheNYSEBitcoinIndex(NYXBT)
DailyClosingPrice 20-DEMA 50-daysEMA
Short-TermBULLISH

8
650.0
750.0
850.0
7-Nov-14
5-De
c-14
2-Jan-15
30-Ja
n-15
27-Feb
-15
27-M
ar-15
24-Apr-15
22-M
ay-15
19-Ju
n-15
17-Ju
l-15
14-Aug-15
11-Sep
-15
9-Oct-15
6-Nov-15
S&P500ConsumerDiscretionary(Sector)(TR)(INDEXSP:SP500-25TR)
DailyClosingValue 20-daysEMA 50-daysEMA
OVERWEIGHT
750.0
850.0
7-Nov-14
5-De
c-14
2-Jan-15
30-Ja
n-15
27-Feb
-15
27-M
ar-15
24-Apr-15
22-M
ay-15
19-Ju
n-15
17-Ju
l-15
14-Aug-15
11-Sep
-15
9-Oct-15
6-Nov-15
S&P500ConsumerStaples(Sector)(TR)(INDEXSP:SP500-30TR)
DailyClosingValue 20-daysEMA 50-daysEMA
UNDERWEIGHT
600.0
700.0
800.0
900.0
1,000.0
1,100.0
7-Nov-14
5-De
c-14
2-Jan-15
30-Ja
n-15
27-Feb
-15
27-M
ar-15
24-Apr-15
22-M
ay-15
19-Ju
n-15
17-Ju
l-15
14-Aug-15
11-Sep
-15
9-Oct-15
6-Nov-15
S&P500Energy(Sector)(TR)(INDEXSP:SP500-10TR)
DailyClosingValue 20-daysEMA 50-daysEMA
OVERWEIGHT
450.0
475.0
500.0
525.0
550.0
7-Nov-14
5-De
c-14
2-Jan-15
30-Ja
n-15
27-Feb
-15
27-M
ar-15
24-Apr-15
22-M
ay-15
19-Ju
n-15
17-Ju
l-15
14-Aug-15
11-Sep
-15
9-Oct-15
6-Nov-15
S&P500Financials(Sector)(TR)(INDEXSP:SP500-40TR)
DailyClosingPrice 20-daysEMA 50-daysEMA
OVERWEIGHT
TechnicalOutlook:S&P500SECTORSOUTLOOK
Source:YahooFinance,GoogleFinance,F&MSIResearch
TOP PERFORMINGSTOCK
Ticker CompanyCABO CableONE,Inc.CNV Cnova N.V.CONN ConnsInc.HHS Harte-HanksInc.LITB LightInTheBoxHoldingCo.,Ltd.TPUB TribunePublishingCompanyMPAA Motorcar Parts ofAmerica,Inc.TWOU 2U,Inc.W WayfairInc.WTW WeightWatchersInternational,Inc.
MARKETWEIGHT 13.01%
TOP PERFORMINGSTOCK
Ticker CompanyBETR AmplifySnackBrands,Inc.DF DeanFoodsCompanyWWAV TheWhiteWave FoodsCompany
MARKETWEIGHT 09.46%
TOP PERFORMINGSTOCK
Ticker CompanyAPA ApacheCorp.ASPN AspenAerogels,Inc.BTE BaytexEnergyCorp.CPE CallonPetroleumCompanyCRC CaliforniaResourcesCorporationECR EclipseResourcesCorporationEVA EnvivaPartners,LPGPRK GeoParkLimitedLPI LaredoPetroleum,Inc.PWE PennWestPetroleumLtd.
MARKETWEIGHT 07.21%
TOP PERFORMINGSTOCK
Ticker CompanyABR ArborRealtyTrustInc.ARR ARMOURResidentialREIT,Inc.CHMG ChemungFinancialCorporationCMFN CMFinanceInc.CUNB CUBancorpEMCI EMCInsuranceGroupInc.MNRK MonarchFinancialHoldings,Inc.PCL PlumCreekTimberCo.Inc.SF StifelFinancialCorp.WAC WalterInvestManagementCorp.
MARKETWEIGHT 16.46%
9
1,000.0
1,100.0
1,200.0
1,300.0
7-Nov-14
5-De
c-14
2-Jan-15
30-Ja
n-15
27-Feb
-15
27-M
ar-15
24-Apr-15
22-M
ay-15
19-Ju
n-15
17-Ju
l-15
14-Aug-15
11-Sep
-15
9-Oct-15
6-Nov-15
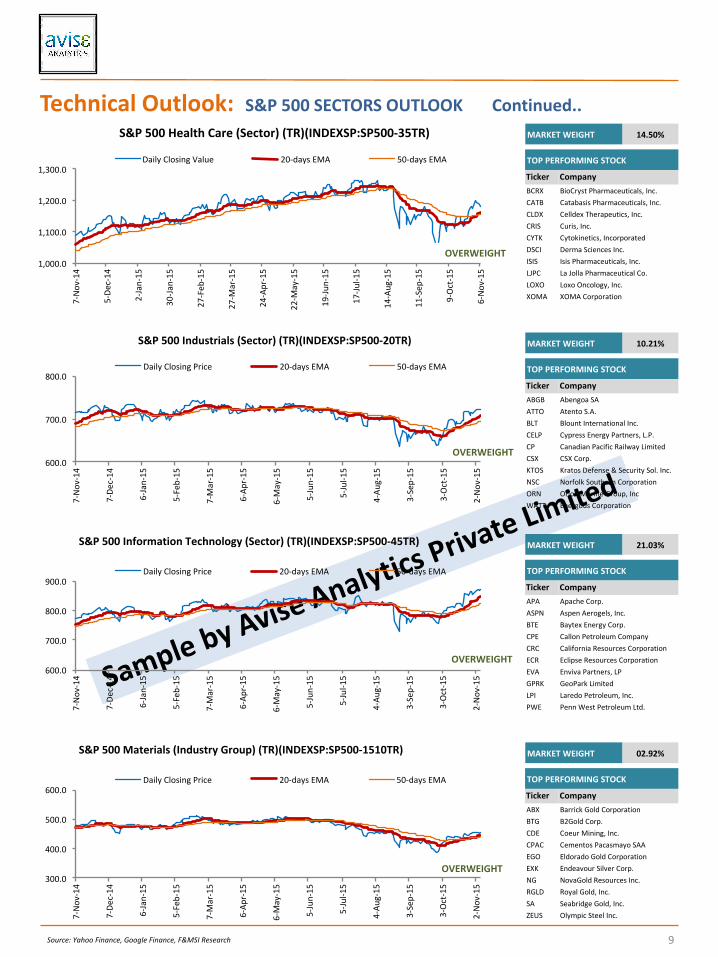
S&P500HealthCare(Sector)(TR)(INDEXSP:SP500-35TR)
DailyClosingValue 20-daysEMA 50-daysEMA
OVERWEIGHT
600.0
700.0
800.0
7-Nov-14
7-De
c-14
6-Jan-15
5-Feb-15
7-Mar-15
6-Ap
r-15
6-May-15
5-Jun-15
5-Jul-1
5
4-Au
g-15
3-Sep-15
3-Oct-15
2-Nov-15
S&P500Industrials(Sector)(TR)(INDEXSP:SP500-20TR)
DailyClosingPrice 20-daysEMA 50-daysEMA
OVERWEIGHT
600.0
700.0
800.0
900.0
7-Nov-14
7-De
c-14
6-Jan-15
5-Feb-15
7-Mar-15
6-Ap
r-15
6-May-15
5-Jun-15
5-Jul-1
5
4-Au
g-15
3-Sep-15
3-Oct-15
2-Nov-15
S&P500InformationTechnology(Sector)(TR)(INDEXSP:SP500-45TR)
DailyClosingPrice 20-daysEMA 50-daysEMA
OVERWEIGHT
300.0
400.0
500.0
600.0
7-Nov-14
7-De
c-14
6-Jan-15
5-Feb-15
7-Mar-15
6-Ap
r-15
6-May-15
5-Jun-15
5-Jul-1
5
4-Au
g-15
3-Sep-15
3-Oct-15
2-Nov-15
S&P500Materials(IndustryGroup)(TR)(INDEXSP:SP500-1510TR)
DailyClosingPrice 20-daysEMA 50-daysEMA
OVERWEIGHT
TechnicalOutlook:S&P500SECTORSOUTLOOK Continued..
Source:YahooFinance,GoogleFinance,F&MSIResearch
TOP PERFORMINGSTOCK
Ticker CompanyBCRX BioCrystPharmaceuticals,Inc.CATB CatabasisPharmaceuticals,Inc.CLDX CelldexTherapeutics,Inc.CRIS Curis,Inc.CYTK Cytokinetics,IncorporatedDSCI DermaSciencesInc.ISIS IsisPharmaceuticals,Inc.LJPC LaJollaPharmaceuticalCo.LOXO LoxoOncology,Inc.XOMA XOMACorporation
MARKETWEIGHT 14.50%
TOP PERFORMINGSTOCK
Ticker CompanyABGB AbengoaSAATTO AtentoS.A.BLT BlountInternationalInc.CELP CypressEnergyPartners,L.P.CP CanadianPacificRailwayLimitedCSX CSXCorp.KTOS Kratos Defense&SecuritySol.Inc.NSC NorfolkSouthernCorporationORN OrionMarineGroup,IncWATT Energous Corporation
MARKETWEIGHT 10.21%
TOP PERFORMINGSTOCK
Ticker CompanyAPA ApacheCorp.ASPN AspenAerogels,Inc.BTE BaytexEnergyCorp.CPE CallonPetroleumCompanyCRC CaliforniaResourcesCorporationECR EclipseResourcesCorporationEVA EnvivaPartners,LPGPRK GeoParkLimitedLPI LaredoPetroleum,Inc.PWE PennWestPetroleumLtd.
MARKETWEIGHT 21.03%
TOP PERFORMINGSTOCK
Ticker CompanyABX BarrickGoldCorporationBTG B2GoldCorp.CDE CoeurMining,Inc.CPAC CementosPacasmayoSAAEGO EldoradoGoldCorporationEXK EndeavourSilverCorp.NG NovaGoldResourcesInc.RGLD RoyalGold,Inc.SA SeabridgeGold,Inc.ZEUS OlympicSteelInc.
MARKETWEIGHT 02.92%

10
TechnicalOutlook:S&P500SECTORSOUTLOOK Continued..
200.0
300.0
400.0
7-Nov-14
7-De
c-14
6-Jan-15
5-Feb-15
7-Mar-15
6-Ap
r-15
6-May-15
5-Jun-15
5-Jul-1
5
4-Au
g-15
3-Sep-15
3-Oct-15
2-Nov-15
S&P500TelecommunicationServices(Sector)(TR)(INDEXSP:SP500-50TR)
DailyClosingPrice 20-daysEMA 50-daysEMA
NEUTRAL
400.0
500.0
600.0
7-Nov-14
7-De
c-14
6-Jan-15
5-Feb-15
7-Mar-15
6-Ap
r-15
6-May-15
5-Jun-15
5-Jul-1
5
4-Au
g-15
3-Sep-15
3-Oct-15
2-Nov-15
S&P500Utilities(Sector)(TR)(INDEXSP:SP500-55TR
DailyClosingPrice 20-daysEMA 50-daysEMA
UNDERWEIGHT
Source:YahooFinance,GoogleFinance,F&MSIResearch
TOP PERFORMINGSTOCK
Ticker CompanyCNSL ConsolidatedComm. HoldingsInc.FTR FrontierCommunicationsCorp.HCOM HawaiianTelcomHoldco,Inc.STRP StraightPathCommunicationsInc.WIN WindstreamHoldings,Inc.
MARKETWEIGHT 02.31%
TOP PERFORMINGSTOCK
Ticker CompanyCPK ChesapeakeUtilitiesCorporationEXC ExelonCorporationITC ITCHoldingsCorp.
MARKETWEIGHT 02.80%

11
TechnicalCall
FBUS
AsperourTechnicalAnalysis,werecommendaBUYcallwithatargetpriceof$115.78/sh andastoplossof$102.69/sh
BUY:Facebook,Inc.LTP:$107.1/sh
Source:YahooFinance,F&MSIResearch
0.0
20.0
40.0
60.0
80.0
100.0
120.0
140.0
160.0
180.0
200.0
20.00
30.00
40.00
50.00
60.00
70.00
80.00
90.00
100.00
110.00
120.00
9-Mar-15
6-Ap
r-15
4-May-15
1-Jun-15
29-Ju
n-15
27-Ju
l-15
24-Aug-15
21-Sep
-15
19-Oct-15
VolumeinM
illion
Pricein$
Volume ClosingPrice UpperBand MiddleBand
LowerBand EMA(50) Linear(ClosingPrice)
-2.00
-1.00
0.00
1.00
2.00
3.00
4.00 MACDHistogram(12,26,9) MACD(12,26) SignalLine=9daysEMA
MOVINGAVERAGESEMA(5) EMA(10) EMA(20) EMA(50) Summary105.75 104.10 101.39 97.00 BUYBUY BUY BUY BUYMOMENTUMOSCILLATORS&INDICATORSRSI(7) %KStoch William%R(7) MACD(12,26,9) Summary60.74 62.51 -37.49 3.33 NEUTRALNEUTRAL NEUTRAL NEUTRAL NEUTRALVOLATILITY VOLUMEANALYSISATR(14) Summary Current 3,48,98,000
0.02 LessVolatile 7-daysAverage 3,06,11,58614-daysAverage 3,35,67,429
SHORTTERM(7DAYS)PIVOTTABLES2 S1 PivotPoint R1 R2
Classic 96.84 101.97 106.31 111.44 115.78FibonacciLevels 100.46 102.69 106.31 109.93 112.16
Disclosure:Theabovetechnicalanalysishasbeenconductedbasedonhistoricaldailypricedataandthechartwasgeneratedusing"Aviware2014"software,proprietarilydevelopedbyAvi Surana,Avise Analytics(P)Ltd.
Definations: Therelativestrengthindex(RSI)isatechnicalindicatorusedtoidentifygeneralpricetrend.RSIvaluerangesfrom0to100.RSI valueabove70indicates'overboughtzone'andbelow30as'oversoldzone'.MovingAverageConvergenceDivergence(MACD)isatrend-followingmomentumindicatorthatshowstherelationshipbetweentwomovingaveragesofprices.MACDiscalculatedbysubtractingthe26-dayexponentialmovingaverage(EMA)fromthe12-dayEMA.MACDLineoscillatesaboveandbelowthezeroline,whichisalsoknownasthecenterline.Signallineisthenine-dayEMAoftheMACD.PositiveMACDindicatesthatthe12-dayEMAisabovethe26-dayEMA.ThePositivevaluesincreaseastheshorterEMAdivergesfurtherfromthelongerEMA.Thismeansupsidemomentumisincreasing.NegativeMACDvaluesindicatesthatthe12-dayEMAisbelowthe26-dayEMA.NegativevaluesincreaseastheshorterEMAdiverges furtherbelowthelongerEMA.Thismeansdownsidemomentumisincreasing.PivotsPointsaresignificantlevelschartistscanusetodeterminedirectionalmovement,supportandresistance.PivotPointsusethepriorperiod'shigh,lowandclosetoformulatefuturesupportandresistance.Inthisregard,PivotPointsarepredictiveorleadingindicators.OurmethodologytakesintoaccountClassicversionandFibonacciversionofcalculatingpivotpoints.OurTargetPricesandStopLosssuggestionsarebasedonlevelsderivedfromPivotPointscalculations.

12
Ticker Company Industry MarketCap P/E P/S Oper M PerfYear
PerfYTD
Recom Price Change TargetPrice
AAOI AppliedOptoelectronics,Inc. Semiconductor- IntegratedCircuits 266.57M 36.7 1.7 5.0% 10.5% 57.1% 1.8 17.6 -0.6% 24.8AAPL AppleInc. ElectronicEquipment 674.95B 13.2 2.9 30.5% 13.3% 11.5% 1.9 121.1 0.1% 148.9AAWW AtlasAirWorldwideHoldings,Inc. AirServices,Other 1.02B 12.0 0.6 8.7% 1.0% -16.2% 2.4 41.3 4.9% 55.4ABB ABBLtd. DiversifiedMachinery 44.61B 18.1 1.2 10.3% -10.5% -6.1% 3.2 19.2 0.3% 19.3ABBV AbbVieInc. DrugManufacturers- Major 106.15B 37.5 4.8 22.9% 5.6% 1.2% 2.1 64.1 2.2% 75.4ACLS AxcelisTechnologiesInc. SemiconductorEquipment&Materials 283.49M 20.4 1.0 1.9% 14.5% -4.3% 1.8 2.5 2.9% 4.2ACW AccurideCorp. AutoParts 124.19M 64.8 0.2 5.3% -47.8% -40.3% 2.5 2.6 -0.4% 4.0ADAP AdaptimmuneTherapeuticsplc Biotechnology 817.48M - 79.4 - - -27.1% 1.8 11.7 -11.1% 22.0ADBE AdobeSystemsIncorporated ApplicationSoftware 45.24B 92.5 9.9 16.2% 25.8% 24.8% 1.9 90.7 0.2% 92.5ADI AnalogDevices,Inc. Semiconductor- IntegratedCircuits 19.35B 27.5 5.9 26.7% 26.3% 13.5% 2.2 61.7 2.2% 67.6ADSK Autodesk,Inc. Technical&SystemSoftware 14.45B - 5.7 2.1% 7.9% 6.4% 2.1 63.9 0.6% 63.3AGIO AgiosPharmaceuticals,Inc. Biotechnology 2.84B - 42.1 -90.4% -8.7% -32.3% 2.5 75.8 0.8% 97.7AGN Allerganplc Drugs- Generic 118.71B - 6.7 -12.3% 20.4% 17.2% 1.6 301.6 -2.5% 362.4AJRD AerojetRocketdyneHoldings,Inc. Aerospace/Defense- MajorDiversified 1.11B - 0.7 2.5% 2.9% -5.6% 1.7 17.3 0.5% 26.0AKAM AkamaiTechnologies,Inc. InternetInformationProviders 11.14B 33.9 5.3 23.0% 4.6% -0.9% 2.4 62.4 1.1% 70.6ALDR AlderBiopharmaceuticalsInc. Biotechnology 1.58B - 246.4 - 115.0% 24.3% 1.3 36.2 -3.1% 56.7ALGN AlignTechnologyInc. MedicalAppliances&Equipment 5.34B 40.7 6.6 22.2% 27.6% 20.1% 1.4 67.2 1.2% 74.1ALGT AllegiantTravelCompany RegionalAirlines 3.42B 20.5 2.8 32.6% 52.6% 35.5% 2.3 202.9 2.0% 231.0ALIM AlimeraSciences,Inc. DrugManufacturers- Major 143.89M - 10.4 - -36.5% -41.5% 2 3.2 6.6% 11.0ALNY AlnylamPharmaceuticals,Inc. Biotechnology 8.59B - 138.1 - 9.3% 4.7% 1.9 101.5 2.8% 142.5ALTR AlteraCorp. Semiconductor- Specialized 15.92B 47.4 9.2 22.4% 51.5% 44.2% 3.1 52.6 -0.3% 50.9ALXN AlexionPharmaceuticals,Inc. Biotechnology 38.79B 140.0 15.5 25.7% -10.9% -7.0% 1.8 172.2 -0.7% 218.1AMAT AppliedMaterials,Inc. SemiconductorEquipment&Materials 20.47B 16.2 2.1 17.6% -23.0% -30.6% 2.1 17.1 1.4% 20.9AMBA Ambarella,Inc. SemiconductorEquipment&Materials 1.72B 23.2 6.0 28.4% 18.0% 7.1% 2.2 54.3 -0.9% 96.8AMCX AMCNetworksInc. Entertainment- Diversified 5.52B 15.8 2.2 28.2% 24.7% 19.7% 2.2 76.3 3.3% 84.2AMGN AmgenInc. Biotechnology 121.04B 19.2 5.6 36.8% 2.0% 2.2% 2.4 160.5 -0.5% 185.6AMOT AlliedMotionTechnologiesInc. IndustrialElectricalEquipment 190.63M 12.4 0.8 10.4% 30.0% -13.4% 3 20.5 4.7% 2.9AMSWA AmericanSoftware,Inc. ApplicationSoftware 298.90M 32.6 2.8 10.3% 12.0% 18.4% 1.5 10.4 0.6% 11.9AMZN Amazon.com,Inc. Catalog&MailOrderHouses 309.09B 955.6 3.1 1.7% 122.3% 112.5% 1.8 659.4 0.6% 721.5ANIP ANIPharmaceuticals,Inc. Biotechnology 490.28M 14.8 6.2 46.9% -4.7% -24.3% 1.3 42.7 4.1% 61.7ARAY AccurayIncorporated MedicalAppliances&Equipment 564.68M - 1.5 -2.8% 2.5% -6.4% 1.9 7.1 1.3% 10.3ARMH ARMHoldingsplc Semiconductor- Specialized 22.73B 47.3 16.3 42.4% 14.7% 5.0% 1.8 48.3 0.8% 56.7ASML ASMLHoldingNV SemiconductorEquipment&Materials 41.95B 27.8 6.2 25.5% -4.7% -10.0% 2.6 96.3 1.2% 100.3ATHN athenahealth,Inc. HealthcareInformationServices 6.36B 430.8 7.2 0.5% 30.2% 12.4% 2.4 163.7 1.7% 164.2ATRO AstronicsCorporation Aerospace/DefenseProducts&Services 1.07B 17.3 1.6 14.2% -9.9% -12.1% 1.6 42.3 2.9% 65.2AVAV AeroVironment,Inc. Aerospace/DefenseProducts&Services 558.37M - 2.2 -0.2% -22.1% -13.0% 2.6 23.7 0.9% 29.0AVGO AvagoTechnologiesLimited Semiconductor- BroadLine 35.71B 34.5 5.4 21.6% 49.8% 30.1% 1.7 129.7 7.1% 162.8BA TheBoeingCompany Aerospace/DefenseProducts&Services 99.12B 18.6 1.0 8.6% 21.8% 16.7% 2.1 147.9 0.0% 162.8BABA AlibabaGroupHoldingLimited SpecialtyRetail,Other 210.06B 32.0 16.5 26.1% -25.1% -19.6% 1.8 83.6 -2.1% 94.6BAX BaxterInternationalInc. MedicalInstruments&Supplies 20.71B 28.3 1.8 12.7% 0.2% -2.8% 2.9 38.0 1.1% 39.7BIDU Baidu,Inc. InternetInformationProviders 69.23B 36.9 7.1 18.0% -15.5% -12.1% 2.1 200.3 0.7% 210.7BIIB BiogenInc. Biotechnology 65.83B 19.3 6.2 46.2% -8.7% -13.0% 2.1 295.4 0.8% 368.8BIND BINDTherapeutics,Inc. Biotechnology 100.62M - 8.4 - -44.6% -10.4% 1.5 4.8 5.2% 17.3BKD BrookdaleSeniorLivingInc. Long-TermCareFacilities 4.28B - 0.9 -4.8% -29.5% -36.7% 1.9 23.2 1.0% 33.9BLUE bluebirdbio,Inc. Biotechnology 2.70B - 112.6 - 76.6% -19.7% 1.6 73.6 4.7% 160.0BMY Bristol-MyersSquibbCompany DrugManufacturers- Major 109.19B 61.8 6.6 12.4% 14.7% 12.9% 2.2 65.5 -0.2% 71.3BRCM BroadcomCorp. Semiconductor- IntegratedCircuits 32.76B 23.4 3.9 17.2% 31.2% 25.3% 2.6 53.8 3.1% 54.6BSX BostonScientificCorporation MedicalAppliances&Equipment 25.26B - 3.4 -7.4% 40.6% 41.7% 1.9 18.8 -0.8% 20.8CAMP CalAmpCorp. WirelessCommunications 701.59M 39.2 2.6 11.3% -1.2% 4.9% 1.5 19.2 -0.3% 25.8CAVM Cavium,Inc. Semiconductor- BroadLine 4.11B - 9.9 -6.0% 40.4% 18.7% 1.9 73.4 5.6% 72.8
CCUR ConcurrentComputerCorporation
ComputerBasedSystems 46.08M - 0.7 1.4% -27.6% -28.8% 3 4.8 -5.9% 8.0
CELG CelgeneCorporation Biotechnology 91.72B 58.7 10.5 23.9% 9.0% 4.4% 1.8 116.7 -3.1% 145.0CGEN CompugenLtd. Biotechnology 343.76M - 38.2 - -4.1% -18.1% 1.4 6.8 2.3% 12.7
TransformingWorldStockUniverse

13
Ticker Company Industry MarketCap P/E P/S Oper M PerfYear
PerfYTD
Recom Price Change TargetPrice
CHKP CheckPointSoftwareTechnologiesLtd.
SecuritySoftware&Services 15.13B 23.0 9.5 52.1% 12.3% 6.5% 2.1 83.7 2.3% 92.7
CHTR CharterCommunications,Inc. CATVSystems 21.36B - 2.2 9.8% 20.0% 14.2% - 190.3 0.5% -
CNIT ChinaInformationTechnology,Inc.
ApplicationSoftware 30.90M - 0.6 - -75.9% -76.4% 3 0.9 2.2% 9.0
COST CostcoWholesaleCorporation Discount,VarietyStores 68.91B 29.3 0.6 3.1% 20.0% 15.7% 2.1 157.6 0.8% 161.7CPL CPFLEnergiaS.A. ForeignUtilities 4.18B 17.4 0.8 12.5% -38.8% -36.4% 1 8.4 -0.4% 19.4CREE Cree,Inc. SemiconductorEquipment&Materials 2.55B - 1.6 -5.7% -23.8% -23.2% 2.7 24.8 -8.4% 28.3CRM salesforce.com,inc. ApplicationSoftware 52.89B - 8.9 -0.1% 25.9% 33.9% 1.9 79.4 0.9% 81.4CRUS CirrusLogicInc. Semiconductor- Specialized 2.05B 18.9 1.8 14.8% 62.4% 36.5% 2 32.2 1.1% 44.0CRY CryoLifeInc. MedicalAppliances&Equipment 312.67M 99.9 2.2 0.6% 8.0% -2.2% 1.3 11.0 2.1% 14.5CSCO CiscoSystems,Inc. Networking&CommunicationDevices 144.73B 16.3 2.9 21.9% 16.1% 5.4% 2.3 28.5 0.1% 31.1CSII CardiovascularSystemsInc. MedicalAppliances&Equipment 495.03M - 2.7 -20.4% -48.9% -49.3% 2.1 15.3 1.5% 19.5CSLT CastlightHealth,Inc. ApplicationSoftware 365.31M - 5.3 - -67.7% -67.0% 2.4 3.9 6.6% 5.9CSOD CornerstoneOnDemand,Inc. ApplicationSoftware 1.92B - 6.4 -20.2% 28.7% 0.7% 1.9 35.5 9.5% 44.6CSU CapitalSeniorLivingCorp. Long-TermCareFacilities 709.66M - 1.8 5.5% 1.8% -3.5% 1.4 24.0 1.5% 29.2CTRP Ctrip.comInternationalLtd. Lodging 14.69B - 10.5 -4.9% 90.4% 127.2% 1.7 103.4 4.6% 98.2
CTSH CognizantTechnologySolutionsCorporation
BusinessSoftware&Services 41.99B 27.1 3.5 17.3% 31.2% 31.1% 1.7 69.1 2.8% 75.8
CTXS CitrixSystems,Inc. BusinessSoftware&Services 12.62B 46.9 3.9 11.0% 24.3% 28.6% 2.4 82.0 -0.1% 79.5CUDA BarracudaNetworks,Inc. CommunicationEquipment 1.13B - 3.8 -1.3% -33.8% -40.9% 1.9 21.2 7.0% 28.1CYBR CyberArkSoftware,Ltd. BusinessSoftware&Services 1.50B 84.3 11.2 23.4% 43.0% 19.1% 2.1 47.2 -4.1% 64.2DIS TheWaltDisneyCompany Entertainment- Diversified 195.23B 23.6 3.7 25.1% 28.1% 23.5% 2.2 115.7 2.4% 118.6DVA DaVitaHealthCarePartnersInc. SpecializedHealthServices 16.30B 34.8 1.2 10.1% -1.0% 2.0% 2.3 77.3 -0.6% 84.3DWRE Demandware,Inc. ApplicationSoftware 1.95B - 9.1 -22.9% -6.5% -9.9% 1.5 51.8 4.4% 67.9EA ElectronicArtsInc. Multimedia&GraphicsSoftware 22.56B 24.5 5.0 24.4% 77.4% 53.9% 2.1 72.4 -2.3% 82.3EBAY eBayInc. SpecialtyRetail,Other 35.30B 14.9 3.2 29.7% 31.2% 24.5% 2.5 29.4 0.3% 30.0ECL EcolabInc. CleaningProducts 34.67B 31.5 2.5 12.7% 6.1% 13.3% 2.1 117.4 -0.2% 125.3ELNK EarthLinkHoldingsCorp. TelecomServices- Domestic 991.77M - 0.9 0.2% 133.4% 122.7% 2 9.6 1.8% 9.6EMC EMCCorporation DataStorageDevices 49.95B 22.0 2.0 13.4% -9.9% -11.5% 2.3 26.0 -0.4% 29.8ENDP EndoInternationalplc DrugManufacturers- Other 12.52B - 4.2 -12.5% -21.2% -23.3% 2 55.3 7.0% 87.6EQIX Equinix,Inc. InternetSoftware&Services 17.05B - 6.5 17.2% 43.4% 35.9% 2.1 290.4 -1.8% 316.9ESLT ElbitSystemsLtd. Aerospace/DefenseProducts&Services 3.49B 20.4 1.2 8.2% 38.0% 34.8% 3 80.7 -0.2% 47.0ESPR EsperionTherapeutics,Inc. Biotechnology 625.38M - - - 0.8% -31.3% 2 27.8 1.0% 74.6ESRX ExpressScriptsHoldingCompany HealthCarePlans 60.28B 27.5 0.6 4.0% 14.4% 5.3% 2.3 89.1 0.6% 97.8ETN EatonCorporationplc DiversifiedMachinery 26.48B 13.3 1.2 11.4% -13.6% -12.8% 2.5 57.2 0.2% 60.0EVGN EvogeneLtd. Biotechnology 185.09M - 15.5 - -30.6% -20.9% 2.3 7.3 -1.2% 17.0EW EdwardsLifesciencesCorp. MedicalAppliances&Equipment 16.95B 37.3 7.0 24.1% 27.2% 23.4% 1.9 157.2 -0.9% 174.7EXPE ExpediaInc. Lodging 17.31B 21.0 2.7 15.6% 59.9% 57.1% 2.3 133.3 -2.9% 148.8FARO FAROTechnologiesInc. Scientific&TechnicalInstruments 491.72M 32.9 1.5 8.8% -49.7% -54.9% 2.9 28.3 14.0% 38.7FB Facebook,Inc. InternetInformationProviders 302.86B 107.1 19.0 30.1% 42.3% 37.3% 1.7 107.1 -1.5% 123.4FEYE FireEye,Inc. ApplicationSoftware 3.83B - 6.6 -87.0% -20.7% -24.5% 2.6 23.8 6.1% 33.9FFIV F5Networks,Inc. BusinessSoftware&Services 7.69B 22.2 4.1 29.3% -12.4% -15.9% 2.5 109.7 0.1% 125.6FLIR FLIRSystems,Inc. Scientific&TechnicalInstruments 3.87B 16.0 2.5 19.3% -18.5% -13.7% 2.2 27.6 0.9% 34.4FMI FoundationMedicine,Inc. MedicalLaboratories&Research 607.70M - 7.1 -99.1% -28.8% -20.6% 2.8 17.6 -2.7% 24.4FSLR FirstSolar,Inc. Semiconductor- Specialized 6.02B 19.4 1.9 8.3% 5.8% 33.8% 2.3 59.7 2.3% 64.3FTNT FortinetInc. ApplicationSoftware 5.83B 340.5 6.2 2.3% 28.2% 11.1% 2.1 34.1 2.2% 48.1GE GeneralElectricCompany DiversifiedMachinery 302.47B 96.5 2.2 9.5% 17.7% 21.6% 2.1 29.9 0.9% 30.6GILD GileadSciencesInc. Biotechnology 156.14B 9.9 5.0 66.5% 2.1% 15.8% 2.1 108.3 0.5% 124.7GOOG AlphabetInc. InternetInformationProviders 499.63B 30.9 7.0 - 35.4% 39.4% 1.6 733.8 0.3% 853.7GPRO GoPro,Inc. PhotographicEquipment&Supplies 3.46B 20.9 1.9 14.8% -68.1% -60.3% 2.3 25.1 1.3% 38.5GRMN GarminLtd. Scientific&TechnicalInstruments 7.13B 13.5 2.5 20.4% -29.5% -27.3% 2.7 37.4 0.7% 38.2GRPN Groupon,Inc. InternetInformationProviders 1.68B - 0.5 -1.8% -63.7% -67.0% 2.9 2.7 -6.2% 3.8GWPH GWPharmaceuticalsplc DrugManufacturers- Major 1.77B - 38.7 - 10.1% 21.0% 1.6 81.9 1.5% 143.4HCA HCAHoldings,Inc. Hospitals 28.52B 14.6 0.7 14.1% 1.5% -4.7% 1.8 70.0 2.0% 88.8HOLX HologicInc. MedicalAppliances&Equipment 11.35B 85.7 4.3 18.5% 51.5% 50.6% 2.1 40.3 0.8% 41.9HON HoneywellInternationalInc. DiversifiedMachinery 80.15B 18.2 2.1 16.0% 9.7% 5.6% 2 104.0 0.4% 112.5

14
Ticker Company Industry MarketCap P/E P/S Oper M PerfYear
PerfYTD
Recom Price Change TargetPrice
HUM HumanaInc. HealthCarePlans 26.27B 20.4 0.5 5.1% 27.6% 24.0% 2.5 177.2 -1.0% 205.1HXL HexcelCorp. Aerospace/DefenseProducts&Services 4.46B 19.5 2.4 17.6% 11.4% 14.6% 2.3 47.2 -0.4% 51.6IACI IAC/InterActiveCorp InternetInformationProviders 5.51B 19.2 1.7 9.8% 2.9% 10.9% 2.4 66.4 2.3% 81.2
IBM InternationalBusinessMachinesCorporation
InformationTechnologyServices 134.12B 9.5 1.6 21.4% -12.4% -11.8% 3 138.3 -1.2% 149.2
ICPT InterceptPharmaceuticals,Inc. Biotechnology 4.30B - 1535.4 - -28.5% 13.3% 2.1 176.7 -2.1% 366.8ILMN IlluminaInc. Biotechnology 22.81B 45.4 10.7 31.4% -17.9% -15.6% 2.1 155.8 0.7% 185.0INCY IncyteCorporation Biotechnology 18.64B - 29.4 -6.3% 46.5% 37.1% 1.5 100.2 -14.2% 131.4INTC IntelCorporation Semiconductor- BroadLine 159.69B 14.5 2.9 25.4% 3.1% -4.0% 2.4 33.8 -0.5% 35.0INTU IntuitInc. ApplicationSoftware 27.25B 66.0 6.5 17.6% 11.5% 7.8% 2.5 98.3 0.5% 99.6INVN InvenSense,Inc. Semiconductor- IntegratedCircuits 1.15B 113.9 2.7 3.7% -20.0% -22.9% 2.5 12.5 1.3% 14.0IPGP IPGPhotonicsCorporation SemiconductorEquipment&Materials 4.66B 19.7 5.3 38.3% 19.9% 17.7% 1.7 88.2 1.7% 100.7IRBT iRobotCorporation Appliances 914.25M 27.8 1.6 8.8% -9.7% -9.4% 2.4 31.5 0.1% 37.9ISIS IsisPharmaceuticals,Inc. DrugManufacturers- Other 6.70B 310.4 21.5 5.0% 23.5% -9.5% 2.8 55.9 3.6% 64.8ISRG IntuitiveSurgical,Inc. MedicalAppliances&Equipment 18.72B 34.6 8.1 29.4% -1.5% -5.3% 1.9 501.0 0.3% 589.9JD JD.com,Inc. InternetInformationProviders 41.08B - 1.8 -1.9% 21.1% 28.4% 2 29.7 3.1% 37.7
JMEI JumeiInternationalHoldingLimited
SpecialtyRetail,Other 1.48B 21.3 1.7 5.6% -58.5% -25.1% 2 10.2 2.3% 18.4
JUNO JunoTherapeuticsInc. Biotechnology 5.00B - 399.8 - - -4.8% 2.1 49.7 -4.1% 62.0KITE KitePharma,Inc. Biotechnology 3.23B - 441.9 - 69.0% 27.9% 1.6 73.8 3.0% 83.6KLAC KLA-TencorCorporation SemiconductorEquipment&Materials 10.43B 27.4 3.7 20.7% 6.3% -2.4% 2.8 66.9 -0.2% 65.7KNDI KandiTechnologiesGroup,Inc. AutoManufacturers- Major 506.59M 18.3 2.7 5.0% -37.1% -23.0% - 10.8 0.9% 4.6LBTYA LibertyGlobalplc CATVSystems 40.81B - 2.2 9.3% 0.6% -8.1% 1.8 46.1 1.0% 59.1LLTC LinearTechnologyCorporation Semiconductor- Specialized 10.76B 21.9 7.4 45.5% 6.3% 0.6% 2.9 45.0 1.5% 42.4LLY EliLillyandCompany DrugManufacturers- Major 89.16B 36.2 4.5 12.7% 23.5% 19.0% 2 80.5 -0.2% 95.8LNC LincolnNationalCorporation LifeInsurance 14.09B 12.1 1.0 12.7% 3.3% 0.2% 2.2 57.0 3.3% 61.6LNKD LinkedInCorporation InternetInformationProviders 32.86B - 11.9 -4.4% 11.6% 9.1% 1.9 250.6 0.4% 275.9LOCK LifeLock,Inc. ApplicationSoftware 1.38B - 2.5 -17.0% -14.9% -22.0% 2.1 14.4 -0.1% 18.3LRCX LamResearchCorporation SemiconductorEquipment&Materials 12.18B 16.9 2.1 16.7% -2.2% -2.1% 1.9 76.9 -0.2% 92.2LULU LululemonAthleticaInc. Textile- ApparelClothing 7.18B 27.3 3.8 19.6% 19.4% -8.5% 2.3 51.1 -2.0% 65.0LUX LuxotticaGroupSpA ApparelStores 33.46B 40.4 3.7 16.4% 39.1% 28.5% 2.5 68.3 -0.8% 69.5LYB LyondellBasellIndustriesN.V. SpecialtyChemicals 43.23B 10.2 1.2 16.9% 14.3% 23.3% 2.3 96.2 1.3% 104.9MANH ManhattanAssociates,Inc. ApplicationSoftware 5.58B 58.3 10.2 27.7% 88.4% 87.6% 1.8 76.4 4.0% 78.3MCHP MicrochipTechnologyInc. Semiconductor- Specialized 10.10B 27.5 4.7 18.8% 13.4% 8.5% 2.2 47.9 -0.1% 52.2MCK McKessonCorporation DrugsWholesale 42.28B 20.7 0.2 1.8% -8.9% -11.2% 1.8 183.8 -1.2% 231.2MDT Medtronicplc MedicalAppliances&Equipment 107.52B 31.8 4.6 17.4% 12.7% 6.9% 2 76.1 -0.1% 86.0MDVN Medivation,Inc. Biotechnology 6.46B 25.2 8.3 36.1% -24.7% -20.6% 2.1 39.5 -9.2% 62.9MDXG MiMedxGroup,Inc. MedicalAppliances&Equipment 854.87M 52.3 5.4 11.5% -22.5% -32.0% 1.6 7.8 4.5% 12.0MELI Mercadolibre,Inc. Catalog&MailOrderHouses 5.24B 59.1 8.6 24.9% -11.5% -6.8% 3.1 118.7 1.9% 114.9MRK Merck&Co.Inc. DrugManufacturers- Major 152.56B 14.6 3.8 16.0% -4.9% -1.5% 2.4 54.6 -0.8% 62.4MRVL MarvellTechnologyGroupLtd. Semiconductor- IntegratedCircuits 4.61B - 1.4 -6.0% -32.2% -37.7% 3.1 8.9 2.3% 9.7MSFT MicrosoftCorporation BusinessSoftware&Services 438.70B 36.9 4.8 19.7% 15.8% 20.6% 2.4 54.9 1.0% 54.5MTLS MaterialiseNV ApplicationSoftware 403.88M - 4.1 -4.7% -13.2% -8.8% 2.3 8.7 0.9% 9.4MU MicronTechnology,Inc. Semiconductor- MemoryChips 17.86B 6.7 1.1 18.2% -50.7% -53.0% 2.4 16.5 -0.4% 21.3MYL MylanN.V. Drugs- Generic 22.11B 25.6 2.5 15.7% -16.0% -20.2% 2.1 45.0 0.4% 63.9MZOR MazorRoboticsLtd. MedicalInstruments&Supplies 224.18M - 9.3 -59.3% -3.8% -15.3% 2.1 10.5 0.8% 18.1NEE NextEraEnergy,Inc. ElectricUtilities 45.52B 14.2 2.5 29.2% -2.1% -4.9% 1.8 98.8 -3.2% 117.8NFLX Netflix,Inc. CATVSystems 48.75B 300.2 7.6 4.8% 108.3% 133.7% 2.4 114.1 0.5% 123.1NLNK NewLinkGeneticsCorporation Biotechnology 975.88M 14.0 4.2 57.8% -2.2% -14.7% 2 33.9 -24.5% 58.0NRG NRGEnergy,Inc. DiversifiedUtilities 4.24B - 0.3 7.1% -57.4% -48.4% 2 13.5 -0.5% 23.4NTAP NetApp,Inc. DataStorageDevices 10.14B 24.8 1.7 8.9% -18.7% -15.3% 3.1 34.4 0.6% 33.7NTES NetEase,Inc. InternetSoftware&Services 19.32B 24.0 8.3 35.2% 60.4% 49.6% 1.8 146.8 1.4% 158.0NVDA NVIDIACorporation Semiconductor- Specialized 17.01B 33.6 3.6 14.6% 58.7% 59.4% 2.6 31.6 13.9% 30.0NVO NovoNordiskA/S DrugManufacturers- Other 114.40B 31.8 8.0 45.0% 27.4% 31.8% 1 54.9 -0.7% 71.1NXPI NXPSemiconductorsNV Semiconductor- BroadLine 20.36B 43.0 3.4 20.6% 10.1% 5.9% 1.7 80.9 1.8% 103.7OA OrbitalATK,Inc. Aerospace/DefenseProducts&Services 4.97B 119.0 1.6 24.8% 66.0% 55.7% 1.9 84.5 -1.2% 101.2

15
Ticker Company Industry MarketCap P/E P/S Oper M PerfYear
PerfYTD
Recom Price Change TargetPrice
ONVO OrganovoHoldings,Inc. MedicalLaboratories&Research 304.09M - 380.1 - -51.9% -54.6% 2.3 3.3 2.8% 4.2OPHT OphthotechCorporation Biotechnology 1.91B - 39.5 - 34.0% 22.8% 1.9 55.1 2.5% 85.9ORCL OracleCorporation ApplicationSoftware 173.23B 19.1 4.6 43.4% 3.5% -8.4% 2.4 40.6 0.7% 44.1OSTK Overstock.comInc. Catalog&MailOrderHouses 429.67M 58.9 0.3 0.6% -25.6% -27.2% 2 17.7 3.0% 30.0PBYI PumaBiotechnology,Inc. Biotechnology 2.88B - - - -62.8% -52.8% 2.3 89.3 -0.7% 192.8PCLN ThePricelineGroupInc. BusinessServices 73.51B 32.3 8.4 34.3% 32.1% 27.2% 2 1449.9 -0.9% 1489.4PCRX PaciraPharmaceuticals,Inc. Drugs- Generic 2.09B 210.7 8.7 7.5% -36.9% -35.8% 1.8 56.9 1.7% 79.4PDCO PattersonCompanies,Inc. MedicalEquipmentWholesale 4.98B 24.8 1.1 7.9% 11.4% 2.0% 2.7 48.2 0.2% 51.4PFE PfizerInc. DrugManufacturers- Major 209.26B 25.5 4.4 24.3% 16.7% 12.6% 2.2 33.9 -0.6% 40.3PFG PrincipalFinancialGroupInc. LifeInsurance 15.21B 12.6 1.3 11.9% 2.0% 2.3% 2.8 52.0 2.0% 54.4PHG KoninklijkePhilipsN.V ElectronicEquipment 26.20B 48.6 1.1 3.8% 0.4% -3.1% 1 27.2 0.4% 31.5
PRXL PAREXELInternationalCorporation
MedicalLaboratories&Research 3.59B 27.8 1.5 7.8% 26.1% 21.5% 2.2 67.5 1.1% 71.9
QCOM QUALCOMMIncorporated CommunicationEquipment 80.30B 16.6 3.2 22.2% -22.3% -26.6% 2.2 53.4 4.6% 67.2QIHU Qihoo360TechnologyCo.Ltd. InformationTechnologyServices 7.93B 30.7 4.9 20.4% -13.5% 7.4% 1.8 61.5 2.8% 73.8QLIK QlikTechnologies,Inc. BusinessSoftware&Services 3.06B - 5.2 -2.0% 13.5% 6.6% 1.9 32.9 8.1% 42.9QLYS Qualys,Inc. ApplicationSoftware 1.28B 39.0 8.2 13.6% 7.6% -0.7% 2.3 37.5 3.0% 42.8QRVO Qorvo,Inc. Semiconductor- BroadLine 8.31B 26.6 4.0 3.6% - -21.1% 1.9 55.6 23.2% 71.3QVCA LibertyInteractiveCorporation Catalog&MailOrderHouses 19.26B 20.0 2.2 14.1% -4.0% -9.1% 1.6 26.8 0.4% 35.8RAX RackspaceHosting,Inc. InformationTechnologyServices 4.03B 34.1 2.1 9.4% -24.1% -39.6% 2.2 28.3 3.6% 39.5REGN RegeneronPharmaceuticals,Inc. Biotechnology 58.49B 109.6 15.4 32.3% 49.1% 37.0% 2 562.0 -0.4% 625.8RHT RedHat,Inc. ApplicationSoftware 14.81B 77.9 7.8 14.8% 33.4% 17.2% 2 81.0 -0.7% 84.2RMD ResMedInc. MedicalAppliances&Equipment 8.15B 23.8 4.8 29.7% 15.5% 5.7% 2.6 58.4 -0.2% 59.4ROSG RosettaGenomics,Ltd. MedicalLaboratories&Research 40.20M - 30.9 - -18.2% -2.2% 1.5 2.2 -0.5% 5.0SAP SAPSE ApplicationSoftware 97.77B 28.4 4.6 22.0% 18.6% 14.9% 2.1 78.8 -1.5% 76.1SBAC SBACommunicationsCorp. DiversifiedCommunicationServices 13.85B - 8.6 22.1% -2.9% -2.1% 1.9 108.5 -1.2% 130.7SCI ServiceCorporationInternational PersonalServices 5.32B 22.6 1.8 20.2% 26.4% 20.6% 1.5 27.1 0.6% 34.3SCTY SolarCityCorporation Semiconductor- Specialized 2.83B - 8.0 - -43.6% -45.7% 2 29.1 -2.3% 60.0SEDG SolarEdgeTechnologies,Inc. Semiconductor- Specialized 806.44M 25.3 2.2 10.9% - -0.9% 1.9 20.5 -6.8% 31.5SGMO SangamoBiosciencesInc. Biotechnology 556.90M - 12.3 -78.2% -31.7% -47.7% 1.7 8.0 3.1% 19.3SIMO SiliconMotionTechnologyCorp. DiversifiedElectronics 1.10B 18.3 3.3 22.3% 35.2% 38.6% 2 32.1 2.0% 35.4SINA SINACorporation InternetSoftware&Services 3.01B 18.8 3.7 -7.3% 26.9% 37.9% 2 51.6 0.7% 53.2SIRO SironaDentalSystemsInc. MedicalAppliances&Equipment 6.10B 33.5 5.3 21.9% 33.7% 25.0% 2.4 109.2 0.3% 101.3SMTC SemtechCorporation Semiconductor- IntegratedCircuits 1.25B 956.0 2.3 3.2% -26.0% -30.7% 2.4 19.1 5.4% 20.3SNDK SanDiskCorp. DataStorageDevices 15.47B 37.4 2.7 12.6% -16.5% -20.3% 2.7 77.1 0.4% 81.5SOHU Sohu.comInc. InternetInformationProviders 2.03B - 1.0 1.5% 6.9% -1.2% 2.5 52.6 -0.1% 62.0SPLK Splunk,Inc. ApplicationSoftware 7.73B - 14.4 -45.0% -7.2% 2.1% 1.8 60.2 8.7% 79.4SPWR SunPowerCorporation Semiconductor- Specialized 3.93B 79.8 1.7 2.6% -5.2% 11.3% 2 28.7 4.7% 35.5SRCL Stericycle,Inc. WasteManagement 10.69B 36.1 3.9 18.9% -1.3% -4.0% 2.1 125.9 1.4% 145.8
SRPT SareptaTherapeutics,Inc. Biotechnology 1.13B - 41715.5
- 53.0% 71.9% 1.9 24.9 2.5% 45.2
SSNI SilverSpringNetworks,Inc. ComputerBasedSystems 732.95M 40.4 2.0 5.1% 90.6% 72.7% 2.2 14.6 0.6% 14.2SSYS StratasysLtd. ComputerPeripherals 1.44B - 1.9 -51.3% -74.1% -66.8% 2.7 27.6 1.0% 28.9STJ St.JudeMedicalInc. MedicalAppliances&Equipment 18.26B 18.4 3.3 21.9% -0.2% 1.0% 2.2 64.8 0.3% 75.6
STX SeagateTechnologyPublicLimitedCompany
DataStorageDevices 11.61B 9.3 0.9 13.1% -35.1% -39.0% 2.7 38.8 -0.2% 43.9
SUNE SunEdison,Inc. Semiconductor- IntegratedCircuits 2.39B - 1.2 -39.3% -58.7% -61.2% 1.9 7.6 1.3% 20.5SWKS SkyworksSolutionsInc. Semiconductor- IntegratedCircuits 16.40B 22.5 5.3 29.8% 39.5% 18.9% 1.8 86.0 7.1% 113.0SYK StrykerCorporation MedicalAppliances&Equipment 36.65B 31.7 3.7 17.1% 11.8% 4.6% 2 97.6 0.0% 108.7SYMC SymantecCorporation SecuritySoftware&Services 13.97B 21.2 2.3 16.7% -15.9% -18.3% 2.9 20.6 -1.5% 23.6SYNA SynapticsInc. ApplicationSoftware 3.41B 33.8 1.8 10.4% 48.2% 36.8% 1.9 94.2 6.1% 98.8
TEVA TevaPharmaceuticalIndustriesLimited
DrugManufacturers- Other 58.04B 29.2 2.9 16.9% 4.8% 6.4% 2 60.2 -1.2% 77.4
TNDM TandemDiabetesCare,Inc. MedicalInstruments&Supplies 320.35M - 5.2 - -27.9% -16.1% 1.6 10.7 4.4% 16.8TRIP TripAdvisorInc. InternetInformationProviders 11.16B 49.0 7.6 21.6% 4.6% 3.7% 2.9 77.4 -6.9% 80.3TSL TrinaSolarLimited Semiconductor- Specialized 969.63M 13.7 0.4 6.0% 1.6% 13.6% 2.3 10.5 0.5% 15.5

16
Ticker Company Industry MarketCap P/E P/S Oper M PerfYear
PerfYTD
Recom Price Change TargetPrice
TSLA TeslaMotors,Inc. AutoManufacturers- Major 30.16B - 8.0 -14.0% -3.7% 4.5% 2.7 232.4 0.3% 286.5
TSM TaiwanSemiconductorManufacturingCompanyLimited
Semiconductor- IntegratedCircuits 118.35B 12.3 4.5 39.6% 8.0% 5.2% 3.3 22.8 -0.7% 23.1
TTWO Take-TwoInteractiveSoftwareInc.
Multimedia&GraphicsSoftware 2.92B - 2.0 -11.9% 30.9% 22.0% 2.1 34.2 3.5% 37.6
TWTR Twitter,Inc. InternetInformationProviders 19.13B - 9.6 -24.2% -30.8% -21.2% 2.5 28.3 -1.3% 34.6TXN TexasInstrumentsInc. Semiconductor- BroadLine 58.46B 20.7 4.5 32.4% 16.2% 10.6% 2.5 57.6 0.4% 58.2
ULTI TheUltimateSoftwareGroup,Inc.
InternetSoftware&Services 6.05B 245.3 10.4 7.9% 38.2% 43.7% 2.1 210.9 3.4% 210.1
UNFI UnitedNaturalFoods,Inc. FoodWholesale 2.46B 17.8 0.3 3.0% -30.6% -36.6% 2.5 49.0 2.2% 55.0UNH UnitedHealthGroupIncorporated HealthCarePlans 109.43B 18.4 0.7 7.7% 21.2% 14.9% 1.7 114.8 -1.2% 146.5UTHR UnitedTherapeuticsCorporation DrugManufacturers- Other 7.01B 11.9 5.0 51.4% 22.6% 18.6% 2.2 153.6 1.0% 174.3VBTX VeritexHoldings,Inc. Regional- SouthwestBanks 185.82M 22.2 5.7 88.3% 24.8% 22.4% 1.5 17.4 0.5% 19.0
VDSI VASCODataSecurityInternationalInc.
SecuritySoftware&Services 808.95M 16.3 3.2 22.9% -23.3% -28.0% 1.4 20.3 0.8% 34.0
VEEV VeevaSystemsInc. HealthcareInformationServices 3.59B 75.3 10.0 23.3% -2.2% 2.7% 2.1 27.1 3.3% 36.3VIPS VipshopHoldingsLimited Catalog&MailOrderHouses 12.35B 60.8 2.4 4.6% -8.9% 9.0% 1.7 21.3 0.7% 26.6VMW VMware,Inc. Technical&SystemSoftware 25.09B 26.8 3.9 20.5% -28.8% -27.9% 2.6 59.5 0.7% 77.0
VRTX VertexPharmaceuticalsIncorporated
Biotechnology 28.99B - 38.2 -74.7% 5.7% -0.7% 2.1 118.0 -3.2% 145.7
VSLR VivintSolar,Inc. Semiconductor- Specialized 1.17B - 28.7 - -22.4% 19.4% 2.5 11.0 -1.0% 17.4VTR Ventas,Inc. REIT- HealthcareFacilities 16.92B 44.2 5.2 29.0% -21.5% -26.5% 2.6 50.8 -6.2% 60.6VZ VerizonCommunicationsInc. TelecomServices- Domestic 186.27B 18.2 1.4 16.2% -4.5% 2.6% 2.3 45.8 -0.9% 50.4WCG WellCareHealthPlans,Inc. HealthCarePlans 3.68B 32.6 0.3 2.6% 17.4% 1.6% 2.6 83.3 0.4% 92.7WDC WesternDigitalCorporation DataStorageDevices 15.70B 12.1 1.1 10.5% -29.1% -37.5% 1.8 67.9 0.1% 97.6WETF WisdomTreeInvestments,Inc. AssetManagement 2.88B 51.0 12.1 41.5% 33.0% 33.3% 2.5 20.9 3.3% 21.1WFM WholeFoodsMarket,Inc. GroceryStores 11.13B 18.5 0.7 8.2% -29.8% -37.5% 3 31.1 3.3% 30.7XLNX XilinxInc. Semiconductor- IntegratedCircuits 12.24B 22.3 5.5 30.4% 11.4% 13.2% 2.5 47.6 0.9% 46.8XONE TheExOneCompany DiversifiedMachinery 166.69M - 4.1 -64.6% -46.3% -31.7% 2.7 11.5 6.2% 11.8XRAY DENTSPLYInternationalInc. MedicalInstruments&Supplies 8.62B 31.8 3.2 14.2% 18.9% 16.2% 2 61.7 0.2% 63.8YHOO Yahoo!Inc. InternetInformationProviders 32.30B 136.8 6.5 -3.8% -28.7% -32.3% 2.2 34.2 -2.6% 42.1Z ZillowGroup,Inc. PropertyManagement 3.01B - 5.3 - - -8.2% 1 25.5 -1.2% 38.0

17
CompanyName Ticker Weights Price No.ofShares Investment PriceNow ValueNow Return%
EarthLinkHoldingsCorp ELNK 10.00% $7.42 13,477 $100,000 $7.89 $106,334 6.33%
SolarEdge TechnologiesInc SEDG 10.00% $36.09 2,771 $100,000 $31.60 $87,559 (12.44%)
lululemon athletica Inc LULU 10.00% $65.18 1,534 $100,000 $62.82 $96,387 (3.61%)
EdwardsLifesciencesCorp EW 10.00% $142.45 702 $100,000 $154.13 $108,199 8.20%
ElbitSystemsLtd ESLT 10.00% $79.37 1,260 $100,000 $79.86 $100,617 0.62%
Amazon.comInc AMZN 9.90% $437.71 226 $98,959 $465.58 $105,260 6.37%
AdventSoftwareInc ADVS 8.04% $44.23 1,818 $80,391 $44.24 $80,409 0.02%
KitePharmaInc KITE 6.46% $65.07 993 $64,618 $74.50 $73,982 14.49%
MiMedxGroupInc MDXG 6.17% $10.87 5,673 $61,670 $12.47 $70,747 14.72%
SkyworksSolutionsInc SWKS 6.03% $104.85 576 $60,345 $101.71 $58,538 (2.99%)
ReceptosInc RCPT 4.66% $194.91 239 $46,598 $230.58 $55,126 18.30%
AmbarellaInc AMBA 4.62% $101.21 456 $46,161 $109.15 $49,782 7.85%
VertexPharmaceuticalsInc VRTX 3.64% $131.26 277 $36,404 $133.96 $37,153 2.06%
TotalInvestments 100.00% $1,000,000 $1,030,093 3.01%
**PriceNowisonJuly162015
F&MSIModelEquityPortfolio(MSquared proprietory Efficientfrontiermodel)
Please Note:
Model Portfolio will be redistributed at the beginning of every week.
Basis Of Selection
F&MSI Model Equity Portfolio created at the beginning of 2015 with the goal of beating the Market consistently.That can be achieved through the Efficient Frontier (Markowitz Model), which selects a portfolio of securities with agiven expected return and a lower than their average standard deviation (volatility or risk).
In addition the Msquared Model uses the Complexity Theory to determine a securities expected return, improvingconsiderably the portfolio performance of the portfolio

18
Since it introduction, Tesla’s flagship Model S, has been expensive (it ranges from $70,000 to over $100,000), but its range is 265miles, more than tripled that of Nissan’s Leaf (75 miles). In the next future, Tesla hopes to produce much more affordablevehicles—including one that costs $30,000 to $35,000—with a range similar to that of the Model S.
Since the beginning of the company, the biggest technological issues were high costs and less-than-optimal batteries. That’s whereTesla hopes to make a difference. The company’s innovative battery and charging technology has given it a substantial lead inmaking batteries cheaper and recharging quicker, and it’s also helping Tesla lower costs faster.
Tesla’s choice of these small lithium-ion batteries is, arguably, one of its most important strategic gambles. By choosing smaller,cylindrical cells, Tesla saved on manufacturing costs—their costs have been driven down by economies of scale for the laptopindustry, for which the cells were developed. Tesla could also use the most energy-dense battery materials available, in partbecause smaller cells are inherently less dangerous. And better energy density reduces materials costs. This approach meant Teslahad to develop a way to wire together many thousands of separate cells, compared to several hundred of the larger cells.
Batterypacking:ThebatterypackintheModelSisflatandpartoftheframethatsupportsthecar—themetalcaseprovidesstructuralsupport.
JusttwoyearsagothebatteryfortheModelShasbeencostingbetween$42,500and$55,250,orhalfthecostofthecar.Theimprovementsincehasbeendramatic,thecostofthebatteryisnowjustafractionofthetotalcostofthecar.Andtheautonomy(therange)hasbeenimprovingalot.
TeslabatteriestechnologicaladvancesandcostreductionsledTeslatoexpandapplicationbeyondautomotive.InmidMay,thecompanyannouncedtheintroductionoftwonewhomestoragebatteriesforbusinessandhomes:The Powerpack andthePowerwall .
TheTeslaPowerpack isthecompany’sutility-scalerechargeablebattery,designedtostoreenergyforoff-gridandsupplementalpowersystems,includinglargefacilitiesandthe electricgrid. ThePowerpack,isboughtbyutilitiesorlargeindustrialcompaniesforheavyindustrialwork.So,typicallyit’slikeatleast10Powerpacks perinstallation.Teslareported2,500reservations,whichisactually25,000Powerpacks.LikePowerwall,Tesla’sbatteryforhomeandsmallbusinessuse,Powerpack isbasedonlithionion technology.Thebatteries’modulardesignisadaptedfromthetechnologyusedinthoseforTesla'selectriccars.Powerwallaveragereservationitisprobably1.5to2perinstallation.So,38,000reservationsismore,like50,000or60,000actualPowerwalls.Notsurprisingly,theTeslaPowerwall isalreadysoldoutthroughmid-2016 andtheanticipatedrevenues forthetwobatteriesisestimatedtobe$800,000.
TechnologyDiscussion:WHYTESLAHOMESTORAGEBATTERYISABIGDEAL?
TESLAPOWERWALL(left)
TESLAPOWERPACK(Right)

19
WhichwerethemarketcomponentsthatledTeslatodevelopingstoragebatteriesforhomeandbusiness?
Thebiggrid – alwayson,highlyreliablepowerwhichisexpensiveduringpeakdemandhours,i.e.whenafamilyactuallywantstousethepower.Butusuallytheelectricityischeapatnightwhennoonewantstouseitandthosebigbaseload plantsthatarehard(orveryhardinthecaseofnuclear)toslowdownarestillpumpingoutpower.Andsometimesthatpowerisprovidedbystrongnightwinds.
Homesolar – TeslaownsSolarCity whichprovideszerodownleasing.Homesolarisoftenpoorlyalignedtopeakusage,withinstallerslookingformaximumgenerationwithsouth-facingsolarpanelsratherthanmaximumgenerationduringpeakwithsouth-westfacingpanels.Thentherearethehomeswithroofsthatarepoorlyalignedtothesunregardless,soimperfectgenerationisallthatispossible.Andthatpeakgenerationisn’tnecessarilyperfectlyalignedwithpeakcostofgridelectricityeither,but merelyoverlapswithit.Homestorage – Maximumgenerationalignmentofhomesolarmatterslesswhenyoucancarryforwardtheunconsumedelectricityfromsolarpanelstoyoureveningofcooking,washingdishes,washingclothes,andstreamingNetflixonyour40ʺtv.Andcheapelectricityyoucanstoreatnightandconsumewhenelectricityisreallyexpensiveisvaluableaswell.Thesecomponentsexist,andtheyexistedbeforeTeslagotintothehomestoragebusiness.AndTesla’sofferingcostsabouttwiceasmuchasmoretypicallead-acidbatteriescommonlyusedforthepurpose.
Sowhyistheseparticularhomestoragebatteriesgettinghadacrazy“offtheblocks”start?
1. Netmetering – Rightnow,thereisalotofconflictbetweenutilitiesandhomesolarusersandinstallationcompanies.Netmeteringistherequirementthathomesolargeneratorsgetpaidforelectricitythattheyproduceandpumpintothegrid,andonlypayfortheelectricitythattheydrawfromthegrid.Outputvs inputisthenet.Homesolarusedtobeanadvantagetoutilities— reducedpeakdemand— buthasbecomealiability— reducedorevennegativerevenuefromusersofthegrid.Basically,utilitiesstillhavetopayforthegridwhichhomesolargeneratorsuse,thentheyloserevenueoroutrightpaythehomesolargeneratorwhoisgettinguseofthegridforfree.Sinceutilitiespayforthegridoutofelectricityrevenue,theyarestartingtodemandthatpeoplewithhomesolarwhoaren’tpayingmuchforelectricitystartpayingforgridusagetomakeupforit.Thisisgettingmixedreviews,asyoucanunderstand,butintheUSAespeciallyisleadingtoadesirebymanytobecompletelygridfree,adubiousvalueproposition.Tesla’shypefellintoanemergingmarketopportunityofpeoplewhohadsolarontheirroof,didn’thavebatteriesbutareworriedthatthey’llbeforcedtopaymore.
2. Time-of-usebilling – Combinedwithsmartmeters,time-of-usebillingisbecomingmuchmorecommoninutilitiesinthedevelopedworld.Thismodelissimple:reducedemandduringpeakperiodsbyincreasingtheprice,typicallycombinedwithincentingshiftofdemandtooff-peaktimesbyloweringtheprice.Flatteningdemandcurves,especiallypeaks,isveryadvantageousforgridmanagersbecausetheyhavetohavecapacityforthepeak.Thisenablesstoragetotime-shiftconsumptionandsaveatleastsomemoney.
3. Design – Previousstorageunitsarecollectionsofleadacidbatteries,basicallythesamethingyouhaveinyourcar,butscaledverticallyandhorizontally.Theyaren’tpretty,theyareheavy,theytakeupfloorspace,theyrequiremaintenance,andtheyareprettymuchatoxicadditiontohomesifbreachedorevenifthetopsareremoved.Tesla’smodelissleek,hangsonawallandismuchmorechemicallyinertwithnoliquids.It’sabenignhomeapplianceasopposedtoanindustrialobject(muchassomepeopleliketheindustrialaestheticathome,it’slesscommon).
4. TheGigafactory – WhatTeslahasgoingforitisthatitisbuildingtheworld’slargestbatteryfactory,andlikelyexpandingitnowthatthestoragelinehastakenoffsobrilliantly.PrettymucheveryonepayingattentionknowsthatTeslaisalreadyproducingbatteriesmuchmorecheaplyonaperKWHcapacityatgreatervolume,andtheGigafactory isgoingtorampthatup.BatterystoragehasbeendroppinginpriceperKWHofcapacityforalongtime,butit’sclosinginonacusppointwhereit’sgoingtobeworthitforaverageconsumerstostoreatleastsomeelectricity.
WHYTESLAHOMESTORAGEBATTERYISABIGDEAL?
PictureofTeslaGigafactory (Right)

20
Whatallofthisaddsuptoisthathomebatterystorageismarginallyeconomicalatthebesttoday,butit’sviablefora subsetofthehigh-consumingmarket,it’sdesirableforitsgreencredentials,it’sdesirableduetothehypefactoranditwilldefrayitscosts.Andthatthehomestoragemarkettomorrowwillbeviableforamuchlargerpercentageofthemarketwithincreasingsystemicpressuresandpricingthatwillmakeit substantiallymoreprofitable.Tesla’shomestoragebatteryisgettingattention(andreservations)becausetheyarestakingamajorclaim toamarketwhichisexpectedtoincreasedramatically.

21
Transforming World Companies
Lululemon Athletica10-Nov-2015
BBERGRating: 3.85**Theaboveratingisanaveragerating,derivedastotalratingdividedbythenumberofanalystscoveringthestock.Ratingof1 isStrongSelland5isStrongBuy.
Overview: Lululemon Athletica, Inc. (LULU), founded in 1998, is engaged in thedesign, distribution, and retail of healthy lifestyle inspired athletic apparel. TheCompany conducts its business through a chain of company-operated stores,direct to consumer through e-commerce, showrooms, a network of wholesaleaccounts, outlets and warehouse sales. The Company markets its fit attireunderneath the lululemon athletica and ivivva athletica brand names. As ofAugust 2, 2015, the organization ‘s retail footprint contained 238 stores in UnitedStates, 60 stores in Canada, 26 stores in Australia, five in New Zealand, four inthe United Kingdom, two in Singapore and one in Hong Kong.
Catalysts: Nike rival Lululemon is constantly introducing new products whichincorporate technological advanced fabrics, some of which are protected bypatents and innovative functional features that differentiate it in the market.Collaborating with leading fabric manufacturers, it has jointly developed andtrademarked names for innovative fabrics such as Luon and Silverescent. TheCompany describes the “Silverescent” technology as “anti-stink” which it claimsthat materials in the thread kill odor-causing bacteria in the garment itself. Itspatented fabric, “Invista”, is a chlorine-resistant additive aimed at makingswimsuits last longer. Among their ongoing efforts, the company is developingfabrics to provide advanced performance features such as UV protection andinherent reflectivity. In addition, the company plans to continue to developdifferentiated manufacturing techniques that provide greater support,protection, and comfort.Recently, the Company also announced the strategic changes to itsorganizational structure that further elevate and reinforce the Company's designand innovation-driven brand focus.Interestingly, Lululemon’s stores are credited for the online traffic they generate,meaning in the end the customers win, the business wins and each channel isintegral to that success and experience.
Hurdles: Although, the Company progressing very well with its high-tech fabricproducts but its key rivals such as Nike (NYSE:NKE) and Under Armour (NYSE:UA)keeps an eagle eye on the company and may not loose any chance to bring abetter product in its segment in case Lululemon fails to attract its customer base.
Analyst Note: We agree with Anne-Charlotte Windal, Senior Analyst at SanfordC. Bernstein on her investment outlook for LULU, expecting the stock toOutperform with a target price of $76/share. She believes that the Company is asmall player with a strong brand in the fast growing global sportswear marketand possess significant room to grow brand awareness and trial. She alsobelieves LULU is a fixable growth story, with positive top-line and bottom-linecatalysts on the horizon.In my view, although the company is growing well in its target market, but is notchanging the world for making outfits for the rich U.S. fat women. Hence, wegive it a rating of 3.1 out of 5.
CORPORATESUMMARY
Price(inUSD)(closing10/11/15) 50.17Dilutedshares(inM) 130.711Marketcap(USD inM) 7051NetAdjustedDebt(USD inM) -664.5EV(USD inM) 6386.5Exchange NASDAQIndustry RetailISIN US5500211090Bloomberg LULU:USReuters LULU.OQ
USDinM FY15 FY16e FY17e FY18e
SALES 1,797 2,069 2,345 2,676%growth 12.94% 15.14% 13.34% 14.12%
Adj.EBIT 376 382 458 537%margin 20.9% 18.5% 19.5% 20.1%
Adj.PAT 239 271 329 404%margin 13.3% 13.1% 14.0% 15.1%
MANAGEMENT
CEO LaurentPotdevinCFO StuartHaselden
SHAREHOLDINGS
Top10Institutions(%)AdventInternationalCorp. 15.40%
FidelityManagement&ResearchCo. 15.10%
DennisJ.Wilson 7.90%
Manning&NapierAdvisorsLLC 6.49%
CapitalResearch&ManagementCo. 6.43%
TheVanguardGroup,Inc. 4.99%
BlackRockFundAdvisors 2.89%
ArtisanPartnersLP 2.15%
MorganStanleyInvtManagement,Inc. 1.94%
Voya InvestmentManagementCo.LLC 1.89%
DETA
ILED
REPORT
CAN
BEPR
ODU
CEDONREQ
UEST
WeeklyUpdated
CONSENSUSESTIMATES

22
TechnicalAnalysis
LULUUS
Lululemon AthleticaInc.LTP:$47.57/sh
Source:YahooFinance,F&MSIResearch
0.0
10.0
20.0
30.0
40.0
50.0
0.00
10.00
20.00
30.00
40.00
50.00
60.00
70.00
80.00
12-M
ar-15
11-Apr-15
11-M
ay-15
10-Ju
n-15
10-Ju
l-15
9-Au
g-15
8-Sep-15
8-Oct-15
7-Nov-15
VolumeinM
illion
Pricein$
Volume ClosingPrice UpperBand MiddleBand
LowerBand EMA(50) Linear(ClosingPrice)
0
20
40
60
80
100
12-
Mar-15
11-
Apr-15
11-
May-
15
10-Ju
n-15
10-Ju
l-15
9-Au
g-15
8-Sep-
15
8-Oct-
15
7-Nov-
15
RSI(7)
MOVINGAVERAGESEMA(5) EMA(10) EMA(20) EMA(50) Summary49.60 50.13 50.74 53.26 SELLSELL SELL SELL SELLMOMENTUMOSCILLATORS&INDICATORSRSI(7) %KStoch William%R(7) MACD(12,26,9) Summary22.27 1.93 -98.07 -0.94 OVERSOLDOVERSOLD OVERSOLD OVERSOLD SELLVOLATILITY VOLUMEANALYSISATR(14) Summary Current 3,627,200
0.04 SlightlyMoreVolatile 7-daysAverage 2,929,59314-daysAverage 2,195,129
SHORTTERM(7DAYS)PIVOTTABLES2 S1 PivotPoint R1 R2
Classic 43.70 45.64 49.39 51.33 55.08FibonacciLevels 45.88 47.22 49.39 51.57 52.91
Disclosure:Theabovetechnicalanalysishasbeenconductedbasedonhistoricaldailypricedataandthechartwasgeneratedusing"Aviware2014"software,proprietarilydevelopedbyAvi Surana,Avise Analytics(P)Ltd.
Definations: Therelativestrengthindex(RSI)isatechnicalindicatorusedtoidentifygeneralpricetrend.RSIvaluerangesfrom0to100.RSI valueabove70indicates'overboughtzone'andbelow30as'oversoldzone'.MovingAverageConvergenceDivergence(MACD)isatrend-followingmomentumindicatorthatshowstherelationshipbetweentwomovingaveragesofprices.MACDiscalculatedbysubtractingthe26-dayexponentialmovingaverage(EMA)fromthe12-dayEMA.MACDLineoscillatesaboveandbelowthezeroline,whichisalsoknownasthecenterline.Signallineisthenine-dayEMAoftheMACD.PositiveMACDindicatesthatthe12-dayEMAisabovethe26-dayEMA.ThePositivevaluesincreaseastheshorterEMAdivergesfurtherfromthelongerEMA.Thismeansupsidemomentumisincreasing.NegativeMACDvaluesindicatesthatthe12-dayEMAisbelowthe26-dayEMA.NegativevaluesincreaseastheshorterEMAdiverges furtherbelowthelongerEMA.Thismeansdownsidemomentumisincreasing.PivotsPointsaresignificantlevelschartistscanusetodeterminedirectionalmovement,supportandresistance.PivotPointsusethepriorperiod'shigh,lowandclosetoformulatefuturesupportandresistance.Inthisregard,PivotPointsarepredictiveorleadingindicators.OurmethodologytakesintoaccountClassicversionandFibonacciversionofcalculatingpivotpoints.OurTargetPricesandStopLosssuggestionsarebasedonlevelsderivedfromPivotPointscalculations.