FEUTURE Online Paper No
43
Online Paper No. 8 “Understanding the EU-Turkey sectoral trade flows during 1990-2016: a trade gravity approach” This project has received funding from the European Union’s Horizon 2020 research and innovation programme under grant agreement No 692976. FEUTURE Online Paper No.8 Understanding the EU-Turkey Sectoral Trade Flows During 1990-2016: a Trade Gravity Approach Charilaos Mertzanis November 2017
Transcript of FEUTURE Online Paper No

Online Paper No. 8 “Understanding the EU-Turkey sectoral trade flows during
1990-2016: a trade gravity approach”
This project has received funding from the European Union’s Horizon 2020 research and
innovation programme under grant agreement No 692976.
FEUTURE Online Paper No.8
Understanding the EU-Turkey
Sectoral Trade Flows During
1990-2016: a Trade Gravity
Approach
Charilaos Mertzanis
November 2017

Online Paper No. 8 “Understanding the EU-Turkey sectoral trade flows during
1990-2016: a trade gravity approach”
This project has received funding from the European Union’s Horizon 2020 research and
innovation programme under grant agreement No 692976.
Abstract
This paper explores the determinants of bilateral trade flows between Turkey and the EU coun-
tries. A trade gravity model is used to analyze annual bilateral trade in general and in five different
sectors of trade activity between Turkey, 15 EU countries and 5 non-EU countries during 1990-
2016. The model is augmented with non-economic control variables that are relevant in deter-
mining the volume and direction of international trade. A dynamic panel GMM method is used
for the estimation. The results reveal that the influence of the EU customs agreement on trade
has been positive but moderate. The rise in trade volume is primarily driven by the increase in
income levels in both Turkey and its trading partners, slightly affected by transport costs and only
conditionally affected by average income levels depending on a number of country-level factors.
As a whole, Turkey seem to have realized positive gains from trade with the EU, which provides
evidence that the bilateral customs agreement has been effective in fostering trade integration
and the deepening of the EU-Turkey trade relations. The results imply that policy reform must be
committed to raising the trading partners’ income growth in both absolute and relative terms; to
encourage adjustments in Turkey’s productive structures that will speed up alignment in eco-
nomic development levels; and most importantly to consider the long-term unobservable influ-
ence of institutions that mitigate economic relations through their impact on consumer and pro-
ducer preferences for European and Turkish products.
Özet
Bu çalışma Türkiye ve AB ülkeleri arasındaki karşılıklı ticaret akışının bileşenlerini araştırmaktadır.
1990-2015 yılları süresince Türkiye ile 15 AB ülkesi ve beş üye olmayan AB ülkesi arasındaki
karşılıklı yıllık ticareti ve beş farklı sektördeki ticari faaliyetleri incelemek için ticari çekim modeli
kullanılmıştır. Model, uluslararası ticaretin hacmini ve yönünü belirlemede bağlantılı olan ekonomi
dışı kontrol değişkenleri ile genişletilmiştir. Hesaplama için sabit- etkili dinamik panel GMM
yöntemi kullanılmıştır. Sonuçlar, AB gümrük anlaşmasının ticarete etkisinin olumlu ancak orta
seviyede olduğunu ortaya koymuştur. Ticaret hacmindeki artış en çok, Türkiye’deki ve Türkiye’nin
ticari ortaklarındaki gelir seviyesi artışı tarafından tetiklenmiş, taşımacılık maliyetlerinden az
seviyede etkilenmiş ve yalnızca belli koşullarda bir kaç ülkesel faktöre bağlı olarak ortalama gelir
seviyelerinden etkilenmiştir. Genel olarak Türkiye, AB ile olan ticaretten olumlu kazançlar elde
etmiş görünmekte, bu da karşılıklı gümrük anlaşmasının ticari entegrasyonu geliştirmede etkili
olduğuna ve AB-Türkiye ticari ilişkilerini derinleştirdiğine dair kanıt sağlamaktadır. Çalışmanın
bulguları, birbiriyle ticaret yapan ortakların mutlak ve göreli gelir büyümesinin arttırılmasının,
Türkiye’de iktisadi kalkınmayı hızlandıracak üretimsel yapılarda uyumun teşvik edilmesinin
politika reformlarında üzerinde durulması gereken hususlar olduğuna ve ekonomik ilişkileri
yavaşlatan kurumların uzun dönemli gözlemlenemeyen etkilerinin dikkate alınması gerektiğine
işaret etmektedir.

Online Paper No. 8 “Understanding the EU-Turkey sectoral trade flows during
1990-2016: a trade gravity approach”
This project has received funding from the European Union’s Horizon 2020 research and
innovation programme under grant agreement No 692976.
Content
1. Introduction ................................................................................................................................... 1
2. A brief history of EU-Turkish trade relations ................................................................................. 2
3. Trade integration and the gravity model ....................................................................................... 5
4. Data and methodology ................................................................................................................... 8
5. Empirical results ........................................................................................................................... 15
6. Conclusions and the future of EU-Turkish relations .................................................................... 24
7. References .................................................................................................................................... 27
Appendices ............................................................................................................................................ 31
About the Author .................................................................................................................................. 39
Online Paper No. 8 “Understanding the EU-Turkey sectoral trade flows during
1990-2016: a trade gravity approach”
This project has received funding from the European Union’s Horizon 2020 research and
innovation programme under grant agreement No 692976.
1
1. Introduction
The effect of belonging to a regional trade agreement (RTA hereafter) has been largely debated
in the economic literature. New projects of commercial integration throughout the world are in-
creasingly observed; improvements in information and communications technology, reductions
in transport costs and the existence of economies of scale and scope have all contributed to the
integration process and the further globalization of economic activity. The 29-member strong Eu-
ropean Union (EU hereafter) has emerged as one of the most important commercial blocks sup-
plemented by a common currency for 19 of its members. Since its creation in 1993, commercial
links amongst the Member-States have been reinforced and new contacts with third countries
have been established.
In parallel, there has been a notable increase in the number of studies analyzing the consequences
of these integration processes. The gravity model, derived from Newton’s equation, has been an
important tool of analysis and has produced results of considerable precision. It has helped verify
empirically certain patterns of trade specialization and explain why neighboring economies show
closest trading links. Shorter distances, proximity, a common language, cultural patterns, and rel-
atively similar stages of economic development account for much of the relative intensity of trade
among neighbors. The integration process is observed not only among the EU Member-States but
also between the EU and third countries, with which it has enacted trade-enhancing agreements.
One such important trade agreement is that between the EU and Turkey.
This article analyzes the pattern of Turkey’s sectoral trade flows with the EU based on OECD panel
data during the period 1990 to 2016. The main contribution of the analysis includes, first, the
application of the trade gravity model on a new data set covering a longer 27-year period; second,
the analysis of trade flows both in aggregate and by sector using a different classification between
intermediate goods, consumption goods, capital goods, mixed-end goods, miscellaneous goods;
and, third, the use of a dynamic panel estimation methodology to produce unbiased estimates.
To our knowledge, there is no other analysis available based on this sectoral classification, which
is very useful for policy decisions. Further, non-economic qualitative country-level control varia-
bles are used to account for unobservable country effects and produce more robust estimates.
The empirical model used is an extended version of the gravity model. This study is also a contri-
bution to the current discussion of whether Turkey should be granted full EU membership or a
privileged partnership with the EU, which for Turkey would mean improved access to the EU mar-
ket for its products, among other benefits. The analysis focuses specifically on the likely impact of
deepening the customs union between Turkey and the EU and subsequently of having the com-
mon EU policy applied to Turkish trade flows. To this end, the impact of the 1996 EU-Turkey cus-
toms union covering most industrial goods and processed agricultural goods is evaluated in gen-
eral and on a sectoral level.
The results show a considerable and increasing diversification of Turkey’s foreign trade between
the EU and non-EU countries. They also show that the trade gravity model is a good predictor of
bilateral trade between Turkey and its EU and non-EU trading partners. In particular, the levels of

Online Paper No. 8 “Understanding the EU-Turkey sectoral trade flows during
1990-2016: a trade gravity approach”
This project has received funding from the European Union’s Horizon 2020 research and
innovation programme under grant agreement No 692976.
2
income in Turkey and its trading partners are robust drivers of bilateral trade flows. Distance is
also a robust predictor of transport costs but with a low quantitative impact. Further, non-eco-
nomic and qualitative control factors often turn out to be significant predictors of the volume of
bilateral trade in general and in each of the five sectors considered. These factors mitigate the
robustness of the gravity model variables and particularly that of the average income levels of the
countries involved.
From a policy perspective, the results show that emphasis must be given to raising the trading
partners’ income growth both in absolute (growth) and relative (distribution) terms in the me-
dium- to long-term; to encourage proper adjustments in Turkey’s productive structures that will
speed up alignment in economic development levels; and tentatively to consider the unobserva-
ble effects of social and legal institutions that mitigate economic relations on a long-term basis.
It is conceivable that the course of institutional evolution and other path-dependent processes
driven by political and other exogenous causes will affect, along cost/price factors, the formation
of consumer and producer preferences in all partners, thereby affecting the composition of de-
mand and hence the pattern of trade flows in the future. Such developments may be associated
with a higher probability of emergence of scenario other than ongoing EU-Turkey integration,
which may plausibly characterize the historically uneasy EU-Turkey relationship. However, policy
could be counterfactual in this respect driven by pragmatism on both sides and a commitment to
keep all parties on the existing trade integration path.
The rest of the article is organized as follows. Section 2 presents a brief overview of the history of
the EU-Turkish trade relationship; Section 3 provides an analysis of the gravity model including
the most important related literature; Section 4 outlines the data and model specification; Section
5 presents the empirical results and section 6 concludes the paper.
2. A brief history of EU-Turkish trade relations
In 1963, an Association Agreement was signed between the then European Economic Community
(EEC) and Turkey to create a Customs Union (CU) (Ankara Agreement). In November 1970, the
EEC and Turkey signed an Additional Protocol that prescribed a timetable for the gradual abolition
of tariffs and quotas on goods traded between the parties. In 1996, the EEC introduced the EU-
Turkey Association Council Decision 1/95, which established the final phase of the CU and is cur-
rently in force. In 1999, Turkey was officially recognized as a candidate country and in October
2005, accession negotiations began.
Turkey did not qualify for EU accession during the EU eastern enlargement in 2004 even though
promises of a CU and common market between the EU and Turkey had been made as long ago.
Based on the recommendation of the European Commission (EC), in December 2004 the EU heads
of state decided to initiate accession negotiations with Turkey, emphasizing that the country’s
chances for potential EU accession would depend rather on political factors (fulfilment of Copen-
hagen criteria) than on economic ones. This was stated in the EU Commissioner of Enlargement
Günter Verheugen’s Progress Report (see Presidency Conclusions of Brussels European Council
16–17 December 2004). Further, the European Council of 17 December 2004 decided to open

Online Paper No. 8 “Understanding the EU-Turkey sectoral trade flows during
1990-2016: a trade gravity approach”
This project has received funding from the European Union’s Horizon 2020 research and
innovation programme under grant agreement No 692976.
3
negotiations with Turkey on 3 October 2005 conditional upon the enlargement of the customs
union to include Cyprus.
By 2005, the EU and Turkey had already made substantial progress in integrating their economies
regarding trade of goods. In January 1996 an incomplete CU between the EU-15 and Turkey was
created, which allowed for the free circulation of industrial goods and processed agricultural
products. Quotas were not allowed in the CU with the EU. Further, any voluntary restraint agree-
ments (VRA) about trade in textiles were abolished. Turkey’s commercial and competition policies
would have to be harmonized with those of the EU and a level of intellectual property protection
similar to that in the EU was agreed upon.
The CU with the EU-15 focused mainly on manufactured products and ignored agriculture or ser-
vices. Exemptions applied for iron, steel, and their byproducts, whilst textile trade was controlled
by the EU’s antidumping policies. However, a commitment on the part of both the EU and Turkey
was established to expand and strengthen the CU. It was conceived that agriculture would be
included later through ongoing negotiations aiming at establishing a free trade area (FTA). Since
then, Turkey and the EU have been moving to extend the CU into services and public procure-
ment.
In preparing for EU accession, Turkey has concluded bilateral free trade agreements with the
many EU countries that joined the 2004 enlargement (Ülgen & Zahariadis, 2004). However, based
on statements by the then EU Commissioner for Enlargement, Günter Verheugen, and Germany’s
former Foreign Minister, Joschka Fischer, Turkey would be expected to enter the EU no earlier
than 15 years from that time point onwards (Fischer, 2004).
The negotiations over the accession process opened up trade-related issues to be dealt with: first,
in the context of the CU (market access, tariff, customs legislation, trade policy and related align-
ment) and, second, through bilateral trade agreements. Specifically, the EEC Decision 1/98 of the
EU-Turkey Association Council focused, within the relevant economic chapters of the accession
process (i.e. legislative alignment), on agricultural products and the FTA on coal and steel prod-
ucts, respectively.
Based on the EU Global Trade Negotiations website information, Turkey’s principal exports to the
EU are textiles and clothing, followed by agricultural products, iron, steel and machinery. Its larg-
est trading partner worldwide has traditionally been Germany, followed by Italy. Turkey’s agricul-
tural sector is the largest among the OECD countries, accounting for about 17 per cent of GDP, 20
per cent of exports and 40 per cent of its labor force. Its agricultural production includes tobacco,
cotton, grain, olives, sugar beets, pulses, citrus and livestock. More recently, cotton, fruit and
vegetable production has increased considerably due to irrigation efforts and government sup-
port. The government has provided multiple incentives to promote exports, including output and
input subsidies, tax credits, guarantees and insurance programs. With respect to primary produc-
tion, Greece, Spain and Italy are important competitors of Turkey in edible vegetables (olives,
pulses), fruit (citrus) and processed agricultural products. Greece has proved to be one of the
most significant competitors of Turkey both in terms of agricultural and industrial products (ICAP,
2004). With respect to steel and iron, the main competition for Turkey comes from China, India,

Online Paper No. 8 “Understanding the EU-Turkey sectoral trade flows during
1990-2016: a trade gravity approach”
This project has received funding from the European Union’s Horizon 2020 research and
innovation programme under grant agreement No 692976.
4
Russia, Ukraine, Brazil and Australia. Due to lower domestic scale of output, competition in those
sectors was quite intense with non-EU countries. As regards textiles and clothing, Turkey has had
to cope with the challenges following the expiration of quotas on textiles and clothing in 2005,
which benefited non-EU low-cost producers, such as China, whose textile exports represent about
a third of global trade in the sector. With respect to the production of machinery, mechanical
appliances and vehicles, Turkey’s principal competitors outside the EU are the Central and Eastern
European countries (CEECs). Turkey also faces stiff competition from Poland in the trade of vehi-
cles.
Based on the EU-Turkey Impact Assessment Unit Report (2015), twenty years later the framework
of EU-Turkey bilateral trade relations has become outdated for it has been limited to industrial
and certain processed agricultural products, and included some complementary legislative align-
ment and ad hoc preferential concessions on certain products. The Turkish strategy has been to
link the advancement of bilateral trade relations to the accession process. Efforts to extend the
scope of the bilateral framework into other sectors of activity failed. Over the last decade, Tur-
key’s position has gradually evolved to further enhancement of bilateral trade relations, subject
to EU and Turkish concerns relating to the impact of the current CU functioning on Turkey’s posi-
tion with respect to the FTAs concluded between the EU and third countries and to the absence
of an efficient and operational dispute settlement mechanism.
A senior level working group was formed to explore the possibility to address these concerns. The
working group recommended that the enhancement of the bilateral trade relations should cover
other sectors (i.e. services, public procurement, and further liberalization in agricultural products)
and modernize the CU Agreement.
Given the framework of free trade agreements between the EU and third countries and notably
the EU-US TTIP negotiations, it is conceived that the modernization of the CU and the subsequent
enhancement of the EU-Turkey bilateral trade relations will incentivize Turkey to make progress
on its economic reforms, improve its competitiveness and acquire a better standing that will fa-
cilitate its integration in the TTIP.
The recommendation to enhance bilateral trade relations and to modernize the CU was already
part of the 2014 Enlargement Strategy adopted on 8 October 2014, preparing the ground for pur-
suing this initiative now. This initiative is also connected to the expected Policy Communication
on “Trade and Investment Strategy for Jobs and Growth” (2015/TRADE/008) that would provide
an overall policy orientation, priorities and identify proposed initiatives.
To achieve the goal, several ad hoc assessments were carried out on the impact of the CU, focus-
ing on the agreement’s economic benefits. In April 2014, a further evaluation of the trade ar-
rangements was carried out by the World Bank, which highlighted the rapid increase in the vol-
ume of trade over the recent years, the deeper economic integration between EU and Turkey and
the emergence of the EU as the largest foreign direct investor in Turkey. The evaluation also
stressed that the economic integration, while irreversible, has been limited and more trade op-
portunities need to be explored.

Online Paper No. 8 “Understanding the EU-Turkey sectoral trade flows during
1990-2016: a trade gravity approach”
This project has received funding from the European Union’s Horizon 2020 research and
innovation programme under grant agreement No 692976.
5
Based on EU accounts, Turkey is the sixth largest EU trading partner and accounts for nearly 4%
of its total trade, with bilateral exchange reaching €120 billion. The EU has provided about 75%
of FDI inflows to Turkey in mainly the greenfield and services sectors as well as capital injections
to more than 16.000 companies in Turkey, some of which aiming at accessing third markets in the
region and beyond.
The future EU-Turkey policy challenge requires the addressing of two main issues. First, the deep-
ening of the ongoing economic integration process by enhancing, in line with current liberaliza-
tion efforts between the EU and third countries, the trade relations to other sectors of economic
activity. Second, the modernization of the current functioning of the CU by allowing Turkey to
express its view, through wider consultation, on trade policy formulation regarding its legislative
and technical alignment with EU rules on customs, external tariffs, the generalized system of pref-
erences and preferential agreements. This will improve the functioning of the CU regarding the
effectiveness of surveillance measures, external tariff changes, safeguard measures and other
regulatory restrictions. Finally, the establishment of a dispute resolution mechanism is expected
to improve the functioning of the CU.
These policy initiatives are envisaged to apply to the entire range of EU-Turkish trade relations,
including private sector business (corporate entities, small and medium enterprises, agricultural
producers, service providers, traders and intermediaries) and consumers. Turkish private and
public institutions will be further encouraged to participate in interdependent institutional and
administrative arrangements with the EU, such as those dealing with regulatory alignment, mar-
ket access, and institutional cooperation.
More specifically, the further deepening of the EU-Turkey relations in a changing economic envi-
ronment requires concrete policy steps properly sequenced (Erdil and Akçomak, 2016). Based on
prevalent patterns of change, these must focus on the trading partners’ income growth, both in
absolute (output level) and relative terms (income distribution), as important medium- to long-
term drivers of trade growth and integration; the role of adjustment in productive structures and
capacity that underlie differences in economic development levels; and the role of institutions
that mitigate bilateral economic relations on a long-term basis in a largely unobservable way and
create some of the causes of uncertainty. This study shows that these factors are conditionally
important for predicting trade flows and should be part of policy steps.
3. Trade integration and the gravity model
The study of regional economic integration has become especially important in recent years. From
a methodological point of view, there are two alternative methods to estimating its impact on
trade. First, ex-ante studies, based on models of partial or general equilibrium, study direct infer-
ence into country welfare and provide predictions of the impact of integration subject to various
assumptions. Second, ex-post studies make use of econometric techniques that permit the esti-
mation of the real effects (not simulated) of the integration agreements. Among the second group
of studies, the trade gravity model is widely acknowledged to be a useful tool for explaining in-
ternational trade flows.
Online Paper No. 8 “Understanding the EU-Turkey sectoral trade flows during
1990-2016: a trade gravity approach”
This project has received funding from the European Union’s Horizon 2020 research and
innovation programme under grant agreement No 692976.
6
The theoretical foundations of the gravity model were introduced by Tinbergen (1962), Pöyhönen
(1963) and Linnemann (1966). Subsequent theoretical and empirical work during the 1970s made
them more refined and widely applied. Anderson (1979) made the first attempt to derive the
gravity equation from a model that assumed product differentiation. His model was based on the
use of Armington’s (1972) assumption of specialization in the production of only one good in each
nation. Bergstrand (1985, 1989) further explored the theoretical determination of bilateral trade
flows based on the use of gravity equations associated with monopolistic competition assump-
tions and the trade prices in the equation. Helpman and Krugman (1985) introduced a differenti-
ated product framework in the gravity model. Deardorff (1998) showed that the gravity equation
could be justified by standard trade theories. More recently, Anderson and van Wincoop (2003)
developed a gravity model based on the manipulation of the constant elasticity of substitution
function. They used their model to solve the so-called “border puzzle.” One of their main contri-
butions was the inclusion of the multilateral resistance terms in the equation as a proxy for the
existence of unobserved barriers to trade.
The different approaches to the trade gravity model have since been associated with various spec-
ifications and diversity in the results of the empirical applications of the standard model. A large
number of studies have contributed to the functional and predictive improvement of the gravity
equation. For instance, Mátyás (1997, 1998), Chen and Wall (2005), Breuss and Egger (1999), and
Egger (2000) have introduced econometric specifications of the gravity equation that reduced
misspecification bias and unobserved heterogeneity. Bergstrand (1985), Helpman (1987), Wei
(1996), Soloaga and Winters (1999), Limao and Venables (1999), and Bougheas, Demetriades and
Morgenroth (1999), among others, contributed to the refinement of the model’s predictors and
added new predictors relating to the infrastructure of a country and transport costs. Finally,
Jimenez and Narbona (2010) introduced institutional predictors to the gravity equation used to
analyze bilateral trade patterns.
Based on these developments, the generalized gravity model proposes that the volume of trade
between pairs of countries is a function of their size and income, their population, their geograph-
ical distance, and a set of dummy variables that capture other quantitative or qualitative factors.
In simpler specifications of the gravity model, bilateral trade flows are found to depend positively
on the size of both economies and negatively on the distance between them. In more complex
specifications, bilateral trade flows are found to depend in addition to other factors, such as the
existence of a common language or colonial links, the proximity of countries, the volatility of the
exchange rate, or the existence of monetary agreements, among others.
The impact of the EU-Turkey customs agreement on the Turkish economy is analyzed based on
various methodologies. For instance, Mercenier and Yeldan (1997) use a computable general
equilibrium model to analyze EU-Turkey trade in an intertemporal setting and observe that the
removal of custom tariffs due to the CU Agreement could worsen the terms of trade for Turkey.
However, they further argue that the removal of non-tariff barriers along with custom tariffs that
will follow Turkey’s accession to the EU will benefit its economy. Likewise, Harrison et al. (1997)
used a computable general equilibrium model to quantify the impact of the CU between Turkey

Online Paper No. 8 “Understanding the EU-Turkey sectoral trade flows during
1990-2016: a trade gravity approach”
This project has received funding from the European Union’s Horizon 2020 research and
innovation programme under grant agreement No 692976.
7
and the EU. They find low trade diversion costs due to the low average tariff rate on non-agricul-
tural imports. They argue that improved access of third country markets, through reciprocal pref-
erential EU access agreements, would result in larger gains from the CU. For Turkey, the latter are
estimated to be about 1 to 1.5 percent of Turkish GDP. They also find that applying the value-
added tax uniformly rather than raising its level to compensate for the tariff revenue loss, would
increase the welfare gain from joining the EU. More recently, Neyapt et al. (2007) use a conjec-
tural variables methodology to analyze EU-Turkey trade over the period 1980-2001 and conclude
that the CU Agreement has been beneficial for Turkey. Aytug et al. (2015) used a nonparametric
approach to analyze Turkey’s performance after the CU Agreement and conclude that post-CU
exports and GDP per capita have increased considerably. Focusing on trade competition, Ekmen-
Özçelik and Erlat (2013) use extensive and intensive margins analysis to evaluate Turkey’s export
diversification relative to its main competitors in the EU-15 market. They find that a much larger
portion of export growth is generally due to the intensive margin (rather than extensive margin)
for Turkey and other countries. Ekmen-Özçelik and Erlat (2015) use the RCA index to evaluate
Turkey’s competitive position relative to its non-EU competitors in the EU-15 market from both
static and dynamic perspectives. They find that the trading partners are more heterogeneous in
terms of the variety of products in which they have comparative advantage, whilst they are more
homogeneous in terms of the contribution of exports to their total export earnings. Lejour and
de Mooij (2005) explore the economic implications of the potential Turkish accession to the EU
and documented small but positive macroeconomic implications for EU countries and considera-
ble and positive effects Turkey.
Further, several studies use the gravity model of trade to analyze the impact of the CU on Turkey’s
export performance. Antonucci and Manzocchi (2006) argue that, given the dynamics of the EU
regarding the trade potential of EU enlargement as well as Turkey’s near-accession dynamics, a
trade gravity model is an appropriate methodology for studying the impact of the CU Agreement
on Turkey’s economy. They subsequently apply a gravity model to Turkey’s trade flows during
1967–2001. They find that the gravity model provides a good fit of Turkey’s trade patterns and,
despite the 1963 Association Agreement as well as the 1996 CU, there is no evidence of increased
trade between Turkey and the EU. Around the same period, Atici and Guloglu (2006) analyze the
factors that determined Turkey’s fresh and processed fruit and vegetable exports to the EU using
a trade gravity model and panel data during 1995-2001 for 13 EU countries. They document that
the size of the economy, EU population, Turkish population in the EU, and the consumer prefer-
ences of non-Mediterranean countries are significant predictors of Turkish fruit and vegetable
exports. They subsequently argue that developing marketing strategies to target the population
of Turkish people in EU countries and non-Mediterranean member countries would enhance the
export performance of fruit and vegetable exports. Moreover, Nowak-Lehmann et al. (2007) an-
alyze Turkey’s sectoral trade flows to the EU based on panel data during 1988-2002. They find
that improvements in Turkish price competitiveness has led to a significant enhancement of Turk-
ish exports in almost all sectors. On the other hand, improvement in price competitiveness of
Turkey’s competitors hampered its export performance in most sectors, except for plastics and
rubber. Differences in transport costs between trade competitors influence Turkish exports in

Online Paper No. 8 “Understanding the EU-Turkey sectoral trade flows during
1990-2016: a trade gravity approach”
This project has received funding from the European Union’s Horizon 2020 research and
innovation programme under grant agreement No 692976.
8
certain sectors but not others. They conclude that strengthening and expanding the CU between
Turkey and the EU to other products would lead to a noticeable increase in export levels in the
agricultural sector, which is still suffering from EU tariffs or tariff-like protection. Bilici et al. (2008)
use a trade gravity model to analyze EU-Turkey trade flows during 1992-2006 and conclude that
the EU countries have always been important partners for Turkey’s trade flows and that the CU
has marginally increased the importance of the EU in determining those flows. More recently,
Ülengin et al. (2015) use panel data from 18 EU countries during 2005-2012 and apply a trade
gravity model to estimate road transport costs of Turkey’s exports to the EU. They find that quotas
have exerted significant negative effects on Turkish total exports via road transport particularly
in the textile sector. Finally, Bektasoglu et al. (2016) focus on the importance of non-tariff barriers
and regional trade agreements on trade costs in Turkey’s agro-food sector. They use both aggre-
gated and disaggregated data and a trade gravity model to document an aggregation bias in econ-
ometric estimates that affects the results of policy simulations analyzing Turkey’s membership to
the EU.
Broadly speaking, the trade gravity model has been widely used for analyzing Turkey’s overall
export performance rather than the performance of the main sectors comprising the broader
economy. In what follows, the trade gravity model is applied on panel data during 1990-2016
containing information on bilateral sectoral trade flows between Turkey and most of the EU coun-
tries as well as some important non-EU trading partners, to explain overall and sectoral trade
performance. Apart from the use of a large time period, the main contribution of the analysis is
the use of a broader and more policy-useful classification of sectors relative to those used in other
relevant studies. This classification comprises the following five sectors of activity: intermediate
goods, consumption goods, capital goods, mix-end goods and miscellaneous goods. Given the
different potential for value-added, competition intensity, technological innovation and produc-
tivity gains in each sector, this classification is more useful in terms of making policy decisions.
4. Data and methodology
The data used for this study contains information on bilateral annual trade flows between Turkey
and 15 different EU countries (Austria, Belgium, Bulgaria, Denmark, France, Germany, Greece,
Hungary, Ireland, Italy, Netherlands, Poland, Spain, Sweden, and UK). These are the most im-
portant EU trading partners of Turkey. Further, the data contains trade flow information for ad-
ditional five non-EU countries with substantial trade relations with Turkey (USA, China, Japan,
Russia, and Iran). All data cover a period of 27 years (1990-2016), thus allowing for both cross-
section and time series analysis covering all the important periods marking the EU-Turkey agree-
ments. Importantly, the data on trade flows is classified into five economic sectors: intermediate
goods, consumption goods, capital goods, mix-end goods and miscellaneous goods, thus allowing
for separate analysis of the sectoral effects along important policy area considerations. All data is
extracted from the OECD database on Bilateral Trade in Goods by Industry and End-use (BTDIxE)
(ISIC Rev.4), and it is uniformly denominated in current US dollars.
Online Paper No. 8 “Understanding the EU-Turkey sectoral trade flows during
1990-2016: a trade gravity approach”
This project has received funding from the European Union’s Horizon 2020 research and
innovation programme under grant agreement No 692976.
9
Table 1 provides information on the pattern and relative size of trade among the different sectors
between Turkey and its sample EU partners. Further, Table A in the Appendix provides infor-
mation on the rate of annual change in trade in total and per sector. During the 27-year period,
Turkey’s global trade volume reached USD 4.88 trillion with an average trade volume of USD
181.01 billion. This represents a 10.4% annual increase in the country’s global trade on average
and a min-max range of 65.8%. Thus, Turkish exports and imports with the rest of the world have
increased year-on-year but with considerable variation. Further, on average over the 27-year pe-
riod, the total volume of trade between Turkey and the 15 EU sample countries increased to USD
1.95 trillion with a country average trade volume of USD 4.79 billion. This also represents a 12.2%
annual increase in the EU-15 trade on average and a large min-max range of 465.0%. Moreover,
during the same period, the total volume of trade between Turkey and its five non-EU trading
partners was USD 1.11 trillion with a country average trade volume of USD 8.32 billion. This rep-
resents a 27.5% annual increase in trade on average and a larger min-max range of 1879.9%. Thus,
the value of Turkish imports and exports with the EU-15 is on average lower (almost half) relative
to that of the non-EU-5 average; it increased faster than the global average but much more slowly
than the non-EU average; but it exhibited considerable less instability than the non-EU average.
From this prima facie evidence, the volume of trade between Turkey and the EU appears to have
evolved in less dynamic but more stable fashion relative to trade between Turkey and the non-
EU sample countries.
As regards the EU-15 trade patterns, Turkeys’ larger trading partners have been successively Ger-
many, Italy, UK and France. Further, trade in intermediate goods dominates EU-Turkey exchange,
since it represents roughly a half of total trade value. Trade on consumption goods comes second,
followed by trade in capital goods. Among the sample non-EU countries, Russia has been the larg-
est trading partner of Turkey followed by the USA and China. Interestingly, the share of interme-
diate goods traded between Turkey and its non-EU partners is relatively higher as compared with
that of its EU partners. On the other hand, the share of trade on consumption and capital goods
between Turkey and non-EU partners is relatively lower as compared with that of EU partners. It
seems that Turkey trades relatively more with the EU on final consumption and capital goods and
relatively less on intermediate goods as compared with its non-EU partners. Finally, trade on
mixed-end and miscellaneous goods is relatively smaller and concentrated into specific EU coun-
tries (France, Germany).
Figure A in the appendix presents the 27-year evolution of both total and sectoral trade patterns
of Turkey with each of the sample trading partners. The individual country figures show that in
almost all cases trade flows started to rise in 2000-2002, decreased during the 2007-8 crisis and
subsequently exhibiting considerable volatility until today. Among the EU-15 countries, the vola-
tility has been less pronounced for Germany and the Nordic countries and more so for Greece
and the UK. Among the non-EU-5 countries, the volatility has been relatively higher than that in
the EU countries, more pronounced for Iran and Russia and less so for Japan and the US. Remark-
ably, Turkish-Chinese trade growth while exhibited a start delay is progressing in dynamic and
stable manner. This evidence shows that Turkish trade flows with non-EU countries increases
faster and exhibits a more dynamic trend relative to that with the EU.

Online Paper No. 8 “Understanding the EU-Turkey sectoral trade flows during
1990-2016: a trade gravity approach”
This project has received funding from the European Union’s Horizon 2020 research and
innovation programme under grant agreement No 692976.
10
In order to provide an explanation of these trade developments, econometric analysis is de-
ployed. The specification of the gravity model used to estimate the effect of integration on Tur-
key’s trade with the EU and non-EU countries draws on Anderson and van Wincoop (2003) and it
is expressed in the following form:
lnXTjt = b0 + b1 lnYit + b2 lnYjt + b3 lnDij + OTHERTj b4T + ηij + kt + eijt (1)
The dependent variable, Xijt, is the logarithm of the annual bilateral trade value between Turkey
and country j in year t, measured in current USD, from the OECD. The first and second independ-
ent variables, Yit and Yjt, are the logarithms of GDP (in current USD) in Turkey and each trading
partner, respectively; they are obtained from the CHELEM database (CEPII). These variables cap-
ture the effect of the size of the economy on trade. They are expected to have positive coefficient
signs for larger countries are expected to trade more. The third independent variable, DTj, repre-
sents the population-weighted distance between Turkey and trading country j, and is obtained
from the CEPII database. It is a proxy for transport costs and it is expected to have a negative
influence on trade. The vector OTHERTj includes other T exogenous variables (obtained from the
CEPII database), designed to capture factors that may influence the volume of trade between
Turkey and trading country j. They are meant to capture other observable and unobservable coun-
try effects between Turkey and its trading patterns. All variables are detailed in the appendix.
Finally, ηij is a country-pair fixed effect that captures those unobservable and time-invariant char-
acteristics that are specific to each pair of countries, and kt is a time effect that captures the un-
observable characteristics that vary over time. Finally, εijt is the error term, which is taken to be
independent and identically distributed.
Table 2 provides descriptive statistics of the variables. The average annual value of total trade
between Turkey and both its EU and non-EU partners is USD 5.5 bn with a considerable dispersion
of USD 7.4 bn. Most of Turkey’s total trade value with its trading partners concentrates on inter-
mediate goods with a mean value of USD 3 bn and USD 4.4 bn dispersion. Trade in consumption
goods comes next with a lower mean value and dispersion, followed by trade on capital goods
with a large dispersion among its trading partners. Further, Table 3 provides the correlation ma-
trix between the independent variables. Since pair-wise correlations are not very severe (less than
0.50), they can all be included in the regression analysis. However, correction for collinearity
among certain variables will be performed.

Online Paper No. 8 “Understanding the EU-Turkey sectoral trade flows during
1990-2016: a trade gravity approach”
This project has received funding from the European Union’s Horizon 2020 research and
innovation programme under grant agreement No 692976.
11
Table 1: Bilateral trade of Turkey, by sector, 1990-2015 (million USD)
Country 1990-2016
Total Trade Intermediate Goods
Consumption Goods
Capital Goods Mixed-End Goods
Miscellaneous Goods
Austria Mean 1,503.4 802.9 292.3 317.6 84.6 5.9
Sum 40,600.0 21,700.0 7,893.2 8,575.7 2,284.3 160.6
Belgium Mean 3,209.5 1,947.8 515.9 424.8 262.8 58.2
Sum 86,700.0 52,600.0 13,900.0 11,500.0 7,096.6 1,570.8
Bulgaria Mean 1,364.0 1,001.9 175.6 70.5 25.5 150.6
Sum 36,800.0 27,100.0 4,742.1 1,903.8 689.0 4,067.4
Denmark Mean 948.6 305.8 350.8 177.1 103.9 11.1
Sum 25,600.0 8,255.5 9,470.6 4,780.9 2,805.3 299.1
France Mean 8,438.6 3,921.0 1,714.5 1,581.5 1,100.9 120.7
Sum 228,000.0 106,000.0 46,300.0 42,700.0 29,700.0 3,257.9
Germany Mean 20,400.0 9,124.8 5,072.6 4,010.0 2,025.6 148.3
Sum 550,000.0 246,000.0 137,000.0 108,000.0 54,700.0 4,004.9
Greece Mean 1,968.5 941.9 286.3 100.0 47.4 591.7
Sum 53,200.0 25,400.0 7,730.0 2,699.7 1,279.7 16,000.0
Hungary Mean 997.3 463.1 156.2 139.2 235.3 3.5
Sum 26,900.0 12,500.0 4,218.3 3,757.6 6,351.8 94.3
Ireland Mean 787.5 370.0 138.4 97.1 177.6 4.5
Sum 21,300.0 9,989.3 3,735.7 2,621.1 4,795.6 120.7
Italy Mean 10,800.0 5,419.1 1,677.0 2,371.3 619.3 679.1
Sum 291,000.0 146,000.0 45,300.0 64,000.0 16,700.0 18,300.0
Netherlands Mean 3,818.5 1,930.0 1,066.1 548.5 142.0 131.8
Sum 103,000.0 52,100.0 28,800.0 14,800.0 3,835.2 3,559.3
Poland Mean 2,137.9 1,033.0 543.4 296.3 260.8 4.4
Sum 57,700.0 27,900.0 14,700.0 7,999.4 7,042.8 118.0
Spain Mean 5,056.0 2,522.7 1,048.4 593.0 778.8 113.1
Sum 137,000.0 68,100.0 28,300.0 16,000.0 21,000.0 3,052.5
Sweden Mean 1,752.9 844.4 306.6 350.5 228.4 22.9
Sum 47,300.0 22,800.0 8,278.5 9,463.9 6,166.4 619.0
UK Mean 8,946.0 4,098.8 2,523.9 1,310.8 856.7 155.8
Sum 242,000.0 111,000.0 68,100.0 35,400.0 23,100.0 4,206.8
Total I Mean 4,796.6 2,310.9 1,055.6 824.9 462.7 146.4
Sum 1,950,000.0 938,000.0 429,000.0 335,000.0 188,000.0 59,400.0
China Mean 9,076.3 4,482.2 1,641.4 1,856.9 1,085.9 9.9
Sum 245,000.0 121,000.0 44,300.0 50,100.0 29,300.0 267.1
Iran Mean 5,500.5 4,906.7 360.8 142.7 63.2 27.1
Sum 149,000.0 132,000.0 9,741.9 3,852.9 1,705.3 731.0
Japan Mean 2,681.7 1,176.3 206.5 1,070.9 221.7 6.2
Sum 69,700.0 30,600.0 5,370.3 27,800.0 5,764.3 160.7
Russia Mean 14,000.0 10,600.0 1,070.6 276.3 185.0 1,800.6
Sum 377,000.0 287,000.0 28,900.0 7,460.4 4,993.8 48,600.0
USA Mean 10,200.0 5,972.9 1,712.9 1,663.6 432.6 375.0
Sum 274,000.0 161,000.0 46,200.0 44,900.0 11,700.0 10,100.0
Total II Mean 8,317.4 5,465.4 1,004.4 1,001.6 399.0 447.0
Sum 1,110,000.0 732,000.0 135,000.0 134,000.0 53,500.0 59,900.0
World Mean 181,000.0 105,000.0 31,700.0 23,700.0 12,100.0 8,245.0
Sum 4,880,000.0 2,840,000.0 856,000.0 641,000.0 326,000.0 223,000.0
Source: OECD statistics

Online Paper No. 8 “Understanding the EU-Turkey sectoral trade flows during
1990-2016: a trade gravity approach”
This project has received funding from the European Union’s Horizon 2020 research and
innovation programme under grant agreement No 692976.
12
Table 2: Descriptive statistics of variables Variable N Mean S.D. Min 0.25% Mdn 0.75% Max
TXM 515 5,500,000.0 7,400,000.0 20,430.7 900,000.0 2,400,000.0 6,500,000.0 38,000,000.0
IXM 515 3,000,000.0 4,400,000.0 19,319.2 500,000.0 1,400,000.0 3,500,000.0 29,000,000.0
HXM 515 1,000,000.0 1,400,000.0 261.9 150,000.0 440,000.0 1,300,000.0 7,800,000.0
CXM 515 840,000.0 1,300,000.0 71.8 94,179.9 320,000.0 960,000.0 7,700,000.0
XXM 515 420,000.0 720,000.0 0.0 21,434.7 160,000.0 430,000.0 4,800,000.0
MXM 515 220,000.0 670,000.0 0.0 2,896.4 24,770.1 120,000.0 6,200,000.0
GDP_O 520 26.6 0.7 25.6 25.9 26.4 27.3 27.4
GDP_D 519 27.0 1.6 23.0 26.0 26.8 28.2 30.5
GDPCAP_O 520 8.6 0.5 7.7 8.0 8.4 9.1 9.3
GDPCAP_D 519 9.7 1.2 5.8 9.2 10.1 10.5 11.1
DIST 520 3,071.7 2,426.0 712.0 1,709.1 2,437.7 2,941.0 9,705.8
COMBRD 520 0.2 0.4 0.0 0.0 0.0 0.0 1.0
POP_D 520 116.2 274.1 3.5 9.8 38.8 79.3 1,371.2
TDIFF 520 2.2 2.5 0.0 1.0 1.0 2.0 9.5
COMLNG 520 0.1 0.2 0.0 0.0 0.0 0.0 1.0
CONFLICT 520 0.3 0.5 0.0 0.0 0.0 1.0 1.0
COMRELIG 520 0.1 0.2 0.0 0.0 0.0 0.0 1.0
COMLR_PR 520 0.4 0.5 0.0 0.0 0.0 1.0 1.0
COMLR_PS 520 0.4 0.5 0.0 0.0 0.0 1.0 1.0
GATT_D 520 0.9 0.3 0.0 1.0 1.0 1.0 1.0
FTA_MBR 340 0.5 0.5 0.0 0.0 0.0 1.0 1.0
GSP_D 520 0.8 0.4 0.0 0.5 1.0 1.0 1.0
EU_D 520 0.8 0.4 0.0 0.5 1.0 1.0 1.0
Source: Own compilation

Online Paper No. 8 “Understanding the EU-Turkey sectoral trade flows during
1990-2016: a trade gravity approach”
This project has received funding from the European Union’s Horizon 2020 research and
innovation programme under grant agreement No 692976.
13
Table 3: Correlation matrix1
Panel A (1) (2) (3) (4) (5) (6) (7) (8) (9) (10)
TXM (1) 1
COMBRD (2)
-0.142** 1
COMLNG (3)
-0.112* 0.511** 1
DIST (4) 0.109* -0.327** -0.203** 1
POP_O (5) 0.505** -0.0255 -0.0316 0.00843 1
POP_D (6) 0.193** -0.129** -0.082+ 0.556** 0.0226 1
GDP_O (7) 0.538** -0.0280 -0.0431 0.0100 0.934** 0.0219 1
GDP_D (8) 0.443** -0.210** -0.117** 0.774** 0.203** 0.342** 0.207** 1
GDP-CAP_O (9)
0.536** -0.0289 -0.0470 0.0106 0.917** 0.022 0.997** 0.204** 1
GDP-CAP_D (10)
0.186** -0.405** -0.273** 0.189** 0.436** -0.29** 0.462** 0.294** 0.46** 1
N 514
Panel B (1) (2) (3) (4) (5) (6) (7) (8) (9)
TDIFF (1) 1
CONFLICT (2)
-0.24** 1
COM-RELIG (3)
-0.057 -0.0650 1
COMLR_PR (4)
-0.36** -0.0229 0.290** 1
COMLR_PS (5)
-0.24** 0.134* 0.304** 0.899** 1
GATT_D (6)
-0.21** -0.138* -0.63** 0.0147 -0.23** 1
FTA_MBR (7)
-0.45** 0.0565 -0.25** 0.115* 0.0144 0.401** 1
GSP_D (8) -0.110* -0.38** -0.49** 0.182** 0.0023 0.728** 0.320** 1
EU_D (9) -0.83** 0.126* -0.43** 0.182** 0.0012 0.613** 0.551** 0.467** 1
N 340
Source: Own compilation
Given their advantages, dynamic panel estimation methods have dominated the relevant litera-
ture. The specific estimation technique depends on the hypothesis made prior to the analysis of
the data. One option would be to ignore the panel structure and run a pooled least square regres-
sion in which each observation is independent of the rest. In this case, the regression is made over
520 pairwise observations assuming that they are independent from each other, without identi-
fying the variation resulting from spatial and temporal factors. In other words, it is assumed that
1 Note: pairwise correlation between exogenous variables; t statistics in parentheses; + p < 0.1, * p < 0.05, ** p < 0.01.

Online Paper No. 8 “Understanding the EU-Turkey sectoral trade flows during
1990-2016: a trade gravity approach”
This project has received funding from the European Union’s Horizon 2020 research and
innovation programme under grant agreement No 692976.
14
the coefficients of each variable are identical for all countries and years (imposing homogeneity
on the parameters of the model). Although this assumption could be realistic in some cases, it is
generally too restrictive. For that reason, we use a panel data method, which allow the analysis
of both cross-section and temporal effects on trade flows. Depending on the assumptions estab-
lished, two different models on fixed and random effects are defined. The fixed effects model
assumes the existence of some unobservable characteristics specific to each unit of the sample,
which are not captured by any of the variables. This is known as unobserved heterogeneity and,
if present, there are two ways to account for it. The first, known as least square dummy variable
(LSDV), consists of including a dummy variable for each country to capture its specific character-
istics. The main disadvantage of this method is that the number of dummy variables may be very
high, thereby causing a loss of degrees of freedom. The second alternative, known as within-group
estimation, consists of subtracting from each variable its temporal mean. This procedure elimi-
nates the unobserved heterogeneity by transforming the model with variables differentiated with
respect to the temporal means, so all of the variation related to time is eliminated. This method
is easier to apply and has lower computational costs. However, it has the disadvantage that all of
those variables that do not vary over time would be eliminated from the model, which would
prevent their effects from being accounted for. The importance of this problem would vary de-
pending on which variables we want to account for. In our case, the analysis is focused on the
effect of EU trade agreements on EU-Turkey trade flows, and since these related variables are
time varying, this disadvantage does not represent a significant drawback.
On the other hand, the random effects model assumes that the constant terms and the slope do
not vary for any of the observations. In this case, the differences between the units or periods are
attributed to the variance of the error term and not to the constant term. Consequently, the
changes only affect the variance–covariance matrix, and the estimation can be performed using
a generalized least squares method. Therefore, if it were assumed that the unobserved heteroge-
neity is correlated to the independent variables, then it would be more appropriate to use the
fixed effects model. However, if this type of correlation does not exist, it is more efficient to use
a random effects model. As previously mentioned, our sample contains 20 countries and there
are some quantitative and qualitative factors with considerable variation among countries. Con-
sequently, it is reasonable to assume the existence of unobserved heterogeneity. In order to apply
the most suitable model, the Hausman test was performed. The chi-squared statistic was 30.25
associated with a p-value of 0.000. Hence, the null is rejected and the fixed effects estimator is
preferred to the random effects estimator.
Further, the estimation analysis must deal with a number of potential econometric problems.
First, there is a possibility that trade flows may endogenously influence national macroeconomic
variables (e.g. GDP, GDP per capita, etc.) giving rise to a problem of reverse causation. This, in
turn, may cause regressors to be correlated with the error term. Second, time-invariant country
characteristics, such as geography and demographics, may be correlated with the regressors. The
associated fixed effects are contained in the error term that includes both unobserved country-

Online Paper No. 8 “Understanding the EU-Turkey sectoral trade flows during
1990-2016: a trade gravity approach”
This project has received funding from the European Union’s Horizon 2020 research and
innovation programme under grant agreement No 692976.
15
specific effects and observation-specific errors. Third, the panel dataset has a short time dimen-
sion (T =27) and a larger country dimension (N =20). These problems may be solved with the use
of a fixed-effects instrumental variables estimation. In large-T panel data, a shock to the country’s
fixed effect would decline with time and hence the correlation of the lagged dependent variable
with the error term would be insignificant (Roodman, 2006). Thus, we use the Arellano & Bond
(1991) difference GMM estimator for dynamic panel data with robust standard errors and fixed
effects for the estimation. Lagged values of the main gravity variables are used as instruments.
This makes a potentially endogenous regressor pre-determined and therefore not correlated with
the error term. This method overcomes several potential problems of endogeneity and unobserv-
able influences but at the cost of estimation efficiency, especially given the rather small sample
size.
5. Empirical results
Tables 4 to 9 present the results of the regression analysis of the gravity model for the total vol-
ume of bilateral trade between Turkey and its EU and non-EU trading partners, as well as for each
of the five sectors: intermediate goods, consumption goods, capital goods, mix-end goods and
miscellaneous goods. Table 4 reports the results of Equation (1) for the total volume of bilateral
trade (models A.1 to A.5). The first model (A.1) is the standard gravity model. As expected the
levels of income in both Turkey and its trading partners are positive and significant predictors of
the volume of trade. The result implies that trading with higher GDP countries may offer Turkey
higher external demand for its products and more chances to import. On the other hand, the
result shows that an increase in Turkey’s foreign trade volume is conditional upon its production
capacity. The magnitude of the effect is large: a 1 percent increase in GDP of Turkey will cause a
1.18 percent increase in bilateral trade, whilst a 1 percent increase in GDP of its trading partners
will cause a 0.92 percent increase in bilateral trade. Further, the effect of GDP per capita is found
to be positive and significant for Turkey but not for its trading partners. Its positive sign suggests
that bilateral trade flows between Turkey and its trading partners are directly related to inter-
country differences in the level of technological progress. This suggests that Turkey’s domestic
demand structure differs from that of its trading partners. Therefore, the Linder hypothesis is not
supported and the result differs from those found in other setting, such as the new industrial
countries in East Asia (Chow et al., 1999). In effect, this implies if Turkey is to benefit more from
trade it must aim to increase its overall economic development level. Moreover, distance is also
a significant negative predictor, but it only exercises a small effect: an increase of 1% in distance
entails a small decline in trade of approximately 0.01%.
The second model (A.2) extends the baseline model to account for the impact of non-economic
factors, such as the existence of a common border (COMBRD), the population of the trading part-
ner (POP_D), the difference in the timing of exports and imports (TDIFF), the existence of a com-
mon ethnic language (COMLNG), the existence of past CONFLICTs between Turkey and its trading

Online Paper No. 8 “Understanding the EU-Turkey sectoral trade flows during
1990-2016: a trade gravity approach”
This project has received funding from the European Union’s Horizon 2020 research and
innovation programme under grant agreement No 692976.
16
partners (CONFLICT) and the existence of common religion (COMRELIG). The basic gravity varia-
bles remain robust predictors and all control factors are shown to be significant predictors of the
total bilateral volume of trade, except for the existence of common border and the size of popu-
lation. Among the controls, only the import-export timing difference and the common language
turn out to be significant. The third model (A.3) extends the baseline model to account for the
impact of legal factors, such as the existence of a common legal origin before (COMLR_PR) and
after (COMLR_PS) the economic transition phases of the Turkey. Surprisingly, the legal origin
seems to affect the robustness of the gravity variables. In this case, the post-transition legal origin
becomes a significant predictor of Turkey’s bilateral trade flows but the exporter and importers’
level of economic development turn insignificant. Indeed, Jones and Martin (2012) argue that
trade flows are affected by the rules of the country of origin of a product, such as tariffs, trade
remedies enforcement (e.g., antidumping and countervailing duties) or quantitative restrictions
(tariff quotas) as well as labeling origin and government procurement regulation. This result might
be also interpreted as implying a significant change in Turkish trade legislation brought about by
EU technical assistance programs designed to advance regulatory alignment. The fourth model
(A.4) extends the baseline model to account for the impact of institutional factors, such as the
existence of membership in GATT/WTO (GATT_D), membership in FTA agreements (FTA_MBR),
offering donor funding (GSP_D) or being a member of the EU (EU_D). The gravity variables remain
robust predictors of the total trade volume. On the other hand, engaging in donor funding, and
getting membership in GATT/WTO and FTA agreements does not seem to matter. However, when
all control variables are included in the analysis, only the size of the economy among the gravity
model variables remains robust, as well as the common language, the legal origin and the mem-
bership in FTA agreements. Overall, the analysis shows a robust role for the level of income of
Turkey and its trading partners, whereas the impact of the remaining gravity model variables
seems to be significantly mitigated by non-economic and other institutional factors. The latter
deserves a separate analysis.
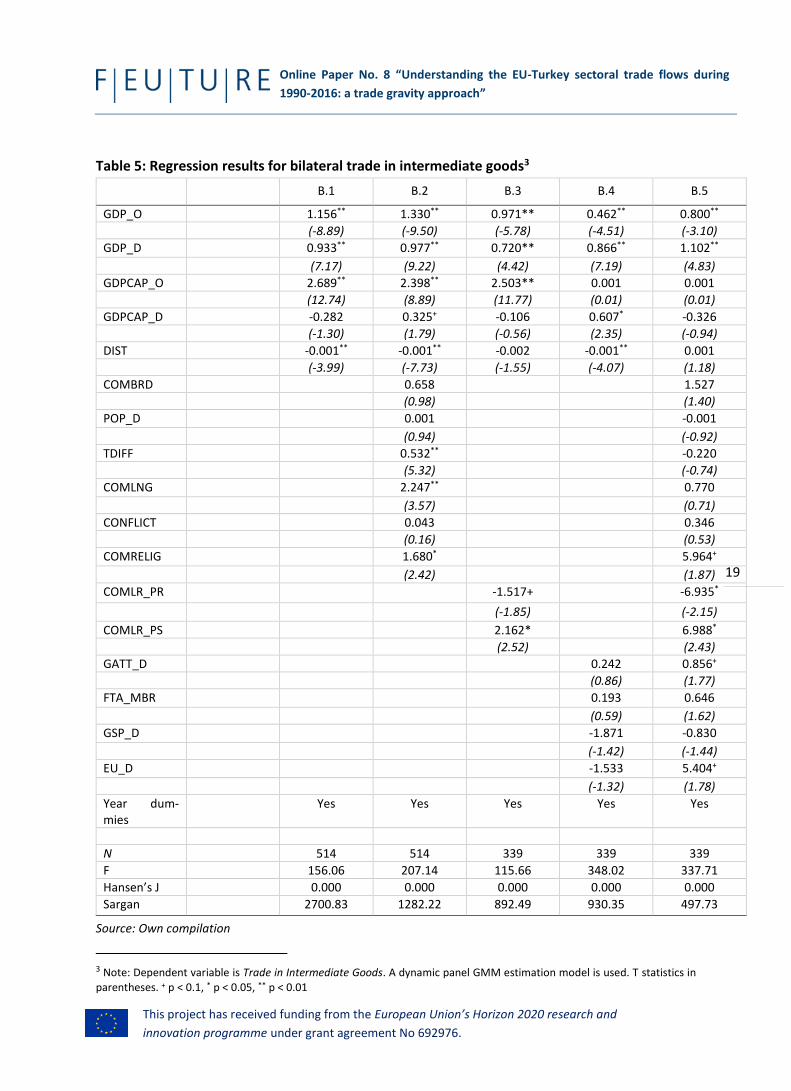
Further, Tables 5 to 9 report the results for each of the five separate sectors of foreign trade
activity: intermediate goods, consumption goods, capital goods, mixed-end goods and miscella-
neous goods, respectively. Table 5 reports the results for the intermediate goods sector (models
B.1 to B.5). Similarly, as expected, the levels of income in both Turkey and its trading partners are
positive and significant predictors of the total volume of trade (B.1). The magnitude of the effect
is large: a 1 percent increase in GDP of Turkey will cause a 1.33 percent increase in bilateral trade,
whilst a 1 percent increase in GDP of its trading partners will cause a 0.98 percent increase in
bilateral trade. GDP per capital of Turkey matters but that of its trading partners. Distance is also
a significant negative predictor, but it only exercises a small effect: an increase of 1% in distance
entails a small decline in trade of approximately 0.01%. The expanded models (B.2 to B.5) broadly
confirm similar findings for the intermediate goods sector. When all control variables are included
in the analysis, gravity model variables remains partly robust and the majority of control factors
turn out to be significant. Among the gravity model variables, the levels of income for Turkey and

Online Paper No. 8 “Understanding the EU-Turkey sectoral trade flows during
1990-2016: a trade gravity approach”
This project has received funding from the European Union’s Horizon 2020 research and
innovation programme under grant agreement No 692976.
17
its trading partners as well as the distance between them are broadly robust predictors of the
volume of trade. However, the predictive power of the levels of economic development of both
depends on the model used and the choice of controls.
Tables 6 to 9 report the results of Equation (1) for bilateral trade in consumption goods, capital
goods, mix-end and miscellaneous goods sectors, respectively, (models C.1 to C.5, D.1 to D.5, E.1
to E.5 and F.1 to F.5, respectively). In all these sectors, the robustness of the standard gravity
model is confirmed as regards the levels of incomes and geographical distance. The levels of in-
come in both Turkey and its trading partners are positive and significant predictors of the volume
of trade; distance is a significant negative small-size predictor. Similarly, economic development
in each trading partner matters sometimes positively sometimes negatively. The inclusion of con-
trol factors does not significantly affect the sign of the gravity model variables, but it often affects
their magnitude.
In summary, the results for the total volume of trade and the trade in the five different sectors
between Turkey and its trading partners show the following: first, the standard gravity model is a
fair predictor of bilateral trade volume between Turkey and its trading partners. Second, there
are few differences in trading patterns between the different sectors. Perhaps the sectors of cap-
ital goods, mix-end and miscellaneous goods are those where the potential impact of expanded
trade may be relatively greater. Third, among the gravity model trading variables, those that are
robust include the level of income and the population-weighted distance between Turkey and its
trading partners. However, the latter’s effect is very small and it would be expected that transport
costs may not prohibit trade opportunities. Fourth, the level of economic development may or
may not be a significant predictor of the volume of trade. It depends on the model used and the
various controls included in the analysis. Further, when it is a significant predictor it concerns
relatively more Turkey than its trading partners do. This implies that Turkey is facing a challenge
of catching up with the productive structures of its trading partners, which is different among the
different sectors of trade activity considered. Fifth, non-economic factors, especially legal institu-
tions directly or indirectly affecting the incentive and the volume of trade, may be significant pre-
dictors of trade flows between Turkey and its trading partners and should be given due consider-
ation.

Online Paper No. 8 “Understanding the EU-Turkey sectoral trade flows during
1990-2016: a trade gravity approach”
This project has received funding from the European Union’s Horizon 2020 research and
innovation programme under grant agreement No 692976.
18
Table 4: Regression results for the total bilateral volume of trade2
Variables / models A.1 A.2 A.3 A.4 A.5
GDP_O 1.175** 1.303** 1.054** 0.516** 0.412+
(-10.08) (-10.50) (-7.42) (-4.83) (-1.78)
GDP_D 0.917** 0.960** 0.775** 0.888** 0.854**
(7.94) (10.49) (5.68) (8.83) (3.69)
GDPCAP_O 2.693** 2.478** 2.548** 0.002 0.002
(13.33) (9.56) (12.21) (0.005) (0.001)
GDPCAP_D -0.126 0.311 0.021 0.696* -0.130
(-0.68) (1.33) (0.12) (2.12) (-0.64)
DIST -0.001** -0.001** -0.001* -0.001** -0.001
(-4.56) (-5.21) (-2.35) (-3.28) (-0.21)
COMBRD 0.881 -0.170
(1.33) (-0.16)
POP_D 0.001 -0.001
(0.35) (-1.57)
TDIFF 0.529** 0.158
(3.77) (0.64)
COMLNG 1.724* 2.345*
(2.41) (2.46)
CONFLICT -0.251 -0.061
(-0.76) (-0.13)
COMRELIG 0.453 2.710
(0.67) (1.51)
COMLR_PR -1.508 -2.557+
(-1.66) (-1.80)
COMLR_PS 2.169* 3.350*
(2.11) (2.33)
GATT_D 0.235 1.028+
(0.69) (1.94)
FTA_MBR 0.204 0.635+
(0.60) (1.81)
GSP_D -2.038 -0.022
(-1.50) (-0.04)
EU_D -0.928 1.246
(-0.76) (0.75)
Year dummies Yes Yes Yes Yes Yes
N 514 514 339 339 339
F-stat 262.27 156.68 133.37 203.26 55.29
Hansen’s J 0.000 0.000 0.000 2.320 0.000
Sargan test 1996.12 1429.91 664.75 706.24 483.96
Source: Own compilation
2 Note: Dependent variable is Total volume of trade (total imports plus total exports). A dynamic panel GMM estimation
model is used. T statistics in parentheses. + p < 0.1, * p < 0.05, ** p < 0.01.
Online Paper No. 8 “Understanding the EU-Turkey sectoral trade flows during
1990-2016: a trade gravity approach”
This project has received funding from the European Union’s Horizon 2020 research and
innovation programme under grant agreement No 692976.
19
Table 5: Regression results for bilateral trade in intermediate goods3
B.1 B.2 B.3 B.4 B.5
GDP_O 1.156** 1.330** 0.971** 0.462** 0.800**
(-8.89) (-9.50) (-5.78) (-4.51) (-3.10)
GDP_D 0.933** 0.977** 0.720** 0.866** 1.102**
(7.17) (9.22) (4.42) (7.19) (4.83)
GDPCAP_O 2.689** 2.398** 2.503** 0.001 0.001
(12.74) (8.89) (11.77) (0.01) (0.01)
GDPCAP_D -0.282 0.325+ -0.106 0.607* -0.326
(-1.30) (1.79) (-0.56) (2.35) (-0.94)
DIST -0.001** -0.001** -0.002 -0.001** 0.001
(-3.99) (-7.73) (-1.55) (-4.07) (1.18)
COMBRD 0.658 1.527
(0.98) (1.40)
POP_D 0.001 -0.001
(0.94) (-0.92)
TDIFF 0.532** -0.220
(5.32) (-0.74)
COMLNG 2.247** 0.770
(3.57) (0.71)
CONFLICT 0.043 0.346
(0.16) (0.53)
COMRELIG 1.680* 5.964+
(2.42) (1.87)
COMLR_PR -1.517+ -6.935*
(-1.85) (-2.15)
COMLR_PS 2.162* 6.988*
(2.52) (2.43)
GATT_D 0.242 0.856+
(0.86) (1.77)
FTA_MBR 0.193 0.646
(0.59) (1.62)
GSP_D -1.871 -0.830
(-1.42) (-1.44)
EU_D -1.533 5.404+
(-1.32) (1.78)
Year dum-mies
Yes Yes Yes Yes Yes
N 514 514 339 339 339
F 156.06 207.14 115.66 348.02 337.71
Hansen’s J 0.000 0.000 0.000 0.000 0.000
Sargan 2700.83 1282.22 892.49 930.35 497.73
Source: Own compilation
3 Note: Dependent variable is Trade in Intermediate Goods. A dynamic panel GMM estimation model is used. T statistics in parentheses. + p < 0.1, * p < 0.05, ** p < 0.01

Online Paper No. 8 “Understanding the EU-Turkey sectoral trade flows during
1990-2016: a trade gravity approach”
This project has received funding from the European Union’s Horizon 2020 research and
innovation programme under grant agreement No 692976.
20
Table 6: Regression results for bilateral trade in consumption goods4
C.1 C.2 C.3 C.4 C.5
GDP_O 1.315** 1.425** 1.380** 0.717** 0.493+
(-8.67) (-8.55) (-9.65) (-4.75) (-1.79)
GDP_D 0.943** 0.955** 1.012** 0.956** 0.782*
(6.97) (7.40) (10.88) (7.21) (2.64)
GDPCAP_O 2.522** 2.166** 2.522** 0.001 0.001
(10.22) (5.89) (8.61) (0.01) (0.01)
GDPCAP_D 0.178 0.794 0.208 0.775 0.267
(1.03) (1.36) (1.02) (1.65) (0.74)
DIST -0.001** -0.001** -0.001** -0.001** -0.001+
(-4.09) (-2.96) (-4.05) (-2.88) (-1.99)
COMBRD 0.176 -1.239
(0.23) (-1.37)
POP_D 0.001 -0.001
(0.70) (-0.09)
TDIFF 0.593+ 1.230*
(1.96) (2.74)
COMLNG 3.008** 3.582**
(2.88) (2.94)
CONFLICT -0.261 0.061
(-0.37) (0.06)
COMRELIG 0.972 2.439
(0.63) (1.02)
COMLR_PR -1.485** 1.636
(-3.66) (0.58)
COMLR_PS 1.391* -0.756
(2.28) (-0.33)
GATT_D 1.074 1.461*
(1.56) (2.37)
FTA_MBR -0.637 -0.302
(-1.16) (-0.81)
GSP_D -1.859 0.816
(-1.29) (0.86)
EU_D -0.337 0.608
(-0.23) (0.25)
Year dummies Yes Yes Yes Yes Yes
N 514 514 339 339 339
F 84.88 198.36 133.69 357.93 159.54
Hansen’s J 0.670 0.000 0.000 0.000 0.000
Sargan 2104.40 2041.30 786.13 825.04 551.08
Source: Own compilation
4 Note: Dependent variable is Trade in Consumption Goods. A dynamic panel GMM estimation model is used. T statistics in
parentheses. + p < 0.1, * p < 0.05, ** p < 0.01.

Online Paper No. 8 “Understanding the EU-Turkey sectoral trade flows during
1990-2016: a trade gravity approach”
This project has received funding from the European Union’s Horizon 2020 research and
innovation programme under grant agreement No 692976.
21
Table 7: Regression results for bilateral trade in capital goods5
D.1 D.2 D.3 D.4 D.5
GDP_O 1.505** 1.765** 1.564** 0.945** 0.608*
(-9.72) (-10.20) (-10.76) (-5.20) (-2.74)
GDP_D 0.912** 1.036** 0.973** 0.979** 0.886**
(5.97) (7.95) (6.76) (8.57) (3.60)
GDPCAP_O 2.790** 2.640** 2.770** 0.001 0.001
(13.11) (6.22) (11.51) (0.01) (0.01)
GDPCAP_D 0.454** 0.924 0.510* 1.295* 0.771+
(3.37) (1.64) (2.63) (2.41) (1.96)
DIST -0.001** -0.001 -0.001** -0.001 -0.001
(-3.78) (-1.15) (-3.95) (-1.20) (-1.13)
COMBRD -0.499 -1.982
(-0.48) (-1.24)
POP_D 0.001 -0.001
(0.47) (-1.69)
TDIFF 0.201 0.108
(0.55) (0.27)
COMLNG 3.580** 4.183*
(3.12) (2.82)
CONFLICT 0.584 -0.123
(0.94) (-0.14)
COMRELIG 1.712 -0.838
(1.10) (-0.36)
COMLR_PR -1.341 1.833
(-1.57) (0.83)
COMLR_PS 1.195 -1.030
(1.41) (-0.57)
GATT_D 1.111 0.966
(0.87) (1.28)
FTA_MBR 0.107 0.371
(0.19) (0.96)
GSP_D -3.162 -0.646
(-1.63) (-0.66)
EU_D -0.076 -3.131
(-0.03) (-1.68)
Year dummies Yes Yes Yes Yes Yes
N 514 514 339 339 339
F 154.96 138.53 131.00 159.50 59.81
Hansen’s J 0.000 0.000 0.000 0.000 0.000
Sargan 984.95 804.09 326.83 346.06 236.06
Source: Own compilation
5 Note: Dependent variable is Trade in Capital Goods. A dynamic panel GMM estimation model is used. T statistics in paren-
theses. + p < 0.1, * p < 0.05, ** p < 0.01

Online Paper No. 8 “Understanding the EU-Turkey sectoral trade flows during
1990-2016: a trade gravity approach”
This project has received funding from the European Union’s Horizon 2020 research and
innovation programme under grant agreement No 692976.
22
Table 8: Regression results for bilateral trade in mixed-end goods6
E.1 E.2 E.3 E.4 E.5
GDP_O 1.930** 2.008** 2.144** 1.477** 1.532*
(-9.20) (-7.62) (-7.78) (-4.16) (-2.30)
GDP_D 0.815** 0.804** 1.030** 1.153** 1.324*
(4.38) (3.37) (4.47) (4.62) (2.53)
GDPCAP_O 4.028** 3.755** 4.065** 0.001 0.001
(8.89) (6.23) (7.73) (0.01) (0.01)
GDPCAP_D 0.655* 1.180+ 0.743** 2.099* 0.621+
(2.72) (1.97) (3.39) (2.67) (1.98)
DIST -0.001* -0.001 -0.001** -0.001 0.001
(-2.68) (-1.46) (-3.17) (-0.27) (1.04)
COMBRD -1.239 1.124
(-0.61) (0.45)
POP_D 0.001 -0.002
(0.78) (-1.39)
TDIFF 0.594 -0.294
(1.10) (-0.43)
COMLNG 3.997* 0.450
(2.54) (0.19)
CONFLICT 0.363 -1.046
(0.27) (-1.08)
COMRELIG -0.090 5.117
(-0.04) (0.99)
COMLR_PR -3.042+ -10.581
(-2.01) (-1.68)
COMLR_PS 1.003 9.778+
(0.66) (2.06)
GATT_D 1.400 2.142
(0.73) (1.07)
FTA_MBR 0.208 1.379*
(0.29) (2.76)
GSP_D -6.606* -4.650*
(-2.62) (-2.79)
EU_D 1.973 8.429
(0.83) (1.50)
Year dummies Yes Yes Yes Yes Yes
N 508 508 333 333 333
F 32.20 93.08 35.16 259.81 12.95
Hansen’s J 0.000 0.000 0.000 0.040 0.000
Sargan 1184.63 815.43 351.41 441.37 309.01 Source: Own compilation
6 Note: Dependent variable is Trade in Mixed-end Goods. A dynamic panel GMM estimation model is used. T statistics in
parentheses. + p < 0.1, * p < 0.05, ** p < 0.01.

Online Paper No. 8 “Understanding the EU-Turkey sectoral trade flows during
1990-2016: a trade gravity approach”
This project has received funding from the European Union’s Horizon 2020 research and
innovation programme under grant agreement No 692976.
23
Table 9: Regression results for bilateral trade in miscellaneous goods7
F.1 F.2 F.3 F.4 F.5
GDP_O 2.977** 3.711** 2.493** 1.572** 0.709
(-4.55) (-7.75) (-4.01) (-3.22) (-0.55)
GDP_D 1.546** 1.816** 0.949* 1.646** 0.506
(3.31) (5.17) (2.10) (3.70) (0.47)
GDPCAP_O 6.042** 5.820** 5.562** 0.001 0.001
(5.63) (5.53) (5.20) (0.01) (0.01)
GDPCAP_D -0.296 1.226+ 0.249 1.193 1.788
(-0.53) (1.87) (0.46) (1.00) (1.62)
DIST -0.001* -0.003** 0.001 -0.001 -0.005
(-2.53) (-6.55) (-1.13) (-1.55) (-1.64)
COMBRD 7.248* 0.786
(2.46) (0.14)
POP_D 0.001 0.006+
(0.68) (2.06)
TDIFF 1.828** 4.138*
(5.02) (2.54)
COMLNG 2.608 12.079*
(0.89) (2.26)
CONFLICT -1.176 -0.760
(-0.91) (-0.25)
COMRELIG -4.774 -5.391
(-1.27) (-0.40)
COMLR_PR -5.609+ 11.327
(-1.95) (0.76)
COMLR_PS 10.257* -5.505
(2.72) (-0.43)
GATT_D -2.522 0.117
(-0.91) (0.16)
FTA_MBR -0.533 -0.298
(-0.64) (-0.41)
GSP_D -2.670 4.878
(-0.58) (1.36)
EU_D -0.094 -5.752
(-0.02) (-0.45)
Year dummies Yes Yes Yes Yes Yes
N 499 499 324 324 324
F 25.80 178.68 108.61 42.70 95.36
Hansen’s J 1.630 0.000 0.000 0.040 0.000
Sargan 659.75 443.17 505.63 549.49 228.79
Source: Own compilation
7 Note: Dependent variable is Trade in Miscellaneous Goods. A GMM estimation model is used. T statistics in parentheses. +
p < 0.1, * p < 0.05, ** p < 0.01.

Online Paper No. 8 “Understanding the EU-Turkey sectoral trade flows during
1990-2016: a trade gravity approach”
This project has received funding from the European Union’s Horizon 2020 research and
innovation programme under grant agreement No 692976.
24
6. Conclusions and the future of EU-Turkish relations
This article analyzes the impact of the EU-Turkey trade agreements on the bilateral trade between
Turkey and its main EU and non-EU trading partners for the period 1990-2016. This effectively
includes 15 EU and 5 non-EU countries, which are important trading partners to Turkey. The data
on trade flows used for the analysis is drawn from the OECD trade database. The analysis is carried
out for the total volume of bilateral trade as well as for the trade in each of the five different
sectors: intermediate goods, consumption goods, capital goods, mixed-end goods and miscella-
neous goods. A trade gravity equation is estimated using a dynamic panel GMM estimation
method with lagged variables as instruments, country fixed effects and robust standard errors.
This method overcomes several potential problems of endogeneity but at the cost of efficiency
of estimations.
The results for the total volume of trade and the trade in the five different sectors between Turkey
and its trading partners show that the standard gravity model is a conditional predictor of bilateral
trade flows between Turkey and its trading partners. There are few differences in trading patterns
between the different sectors. Perhaps the sectors of capital goods, mix-end and miscellaneous
goods are those where the potential impact of expanded trade may be relatively greater. The
level of income and the population-weighted distance between Turkey and its trading partners
are robust predictors of trade volume in all sectors. The role of economic development may or
may not be important, depending on several economic and non-economic conditions in Turley
and its trading partners. This implies that Turkey is facing a challenge of catching up with the
productive structures of its trading partners, which differ among the sectors of trade activity con-
sidered. It also implies that Turkey is facing the challenge of dealing with non-economic influences
on the volume of foreign trade, institutional, social or otherwise.
A process of broadening EU-Turkey trade relations is under way. Negotiations on free-trade
agreements between Turkey and its trading partners are on track. Concerning the effect of EU-
Turkey trade agreements, there is evidence of a positive effect of this agreement on trade flows,
driven primarily from the rise in the general level of income and less from the average level of
income. This raises the issue of income distribution in Turkey and its trading partners. However,
the positive effect is not as strong as it would be expected if compared with other integration
processes of similar nature. Since the EU-Turkey trade relations are progressing, further analysis
is warranted that takes into consideration the role of income distribution, structural change and
the role of institutions in affecting foreign trade performance. Further, more work is needed on
the differential impact of EU trade relations of Turkey vis-à-vis other new members in the EU that
will shed more light on the nature and pace of the integration process and the ability of the trade
gravity model in capturing it. The results of this paper imply that the emphasis of policy reform
must be given to raising the trading partners’ income growth both in absolute and relative terms,
encourage adjustments in Turkey’s productive structures that will speed up alignment in eco-
nomic development levels; and consider the long-term unobservable influence of institutions that
mitigate economic relations.

Online Paper No. 8 “Understanding the EU-Turkey sectoral trade flows during
1990-2016: a trade gravity approach”
This project has received funding from the European Union’s Horizon 2020 research and
innovation programme under grant agreement No 692976.
25
More specifically, as regards the future course of the EU-Turkey trade relation, the following ar-
guments cum scenarios may be tentatively contemplated. The value of trade flows between Tur-
key and the EU appears to have evolved in less dynamic but more stable fashion relative to that
between Turkey and the non-EU sample countries. This implies that any factors that may disrupt
the trade process, including political instability, are expected to more likely influence non-EU ra-
ther EU trade in either direction. Further, the fact that bilateral trade flows have become increas-
ingly volatile implies that causes of uncertainty, including political uncertainty, exert a persistent
and just a transient influence on trade flows. This shows that the EU remains a more stabilizing,
albeit less dynamic, factor for Turkish trade flows. Thus, given that EU-Turkish trade flows are
already high enough both partners would have a lot to lose by any future decrease in those flows.
Further, to the extent that Turkish trade policy is committed to maintaining higher but also stable
levels of foreign trade, a scenario of (voluntary or merely pragmatic) cooperation between EU
and Turkey is more likely to occur in the coming years.
Further, most of Turkey’s trade volume concentrates on intermediate goods. However, given that
the share of intermediate goods traded between Turkey and its non-EU partners is higher relative
to that with its EU partners, semi-processed materials are increasingly obtained from non-EU
countries, which implies that either the latter have a significant cost-advantage. On the other
hand, given that the share of trade on consumption and capital goods between Turkey and non-
EU partners is lower relative to that with EU partners, consumer preferences in Turkey seem to
favor European quality goods and businesses seem to meet their capital needs with European
technological products. To the extent that Turkish trade flows are driven mainly by cost/price
factors a diversion of trade against the EU may be expected, which would make a scenario of
potential confrontation more likely as EU exporters, facing a loss of business, would tend to lend
support to stricter EU membership policy. If, however, Turkish consumers and businesses remain
strong supporters of European quality consumer and capital goods, a scenario of overall mild co-
operation may actually prevail.
Moreover, it appears that the value of EU-Turkey trade will benefit more by raising income levels
in Turkey than its EU trading partners. Further, trade will benefit more by implementing policies
that will bring faster technological progress in Turkey, facilitate the adjustment of the composi-
tion of overall demand and help further align institutional and legal infrastructure relevant to
trade. To the extent that domestic Turkish policy is committed to raising income levels and estab-
lishing more equitable income distribution in Turkey, a scenario of cooperation is more likely to
occur as Turkish consumers and businesses will be better able financially to stand by their prefer-
ences for European quality goods.
Finally, the predictions of the gravity model are conditional upon a significant mitigating role of
institutional factors in both the EU and Turkey. It should be expected that the role of non-eco-
nomic and other institutional factors would be more pronounced over the coming years. Their
overall impact on trade flows in general and between EU and Turkey in particular, will be deter-
mined by their specific effect on consumer and producer preferences and the overall composition
of domestic demand. For example, while foreign direct investment is mainly EU funded, foreign

Online Paper No. 8 “Understanding the EU-Turkey sectoral trade flows during
1990-2016: a trade gravity approach”
This project has received funding from the European Union’s Horizon 2020 research and
innovation programme under grant agreement No 692976.
26
portfolio investment is recently more strongly based on Islamic funds driven by religious and po-
litical affinity. Accounting for the institutional evolution in Turkey and its role for the level and
composition of demand is a key element in the future scenario development that warrants further
analysis.

Online Paper No. 8 “Understanding the EU-Turkey sectoral trade flows during
1990-2016: a trade gravity approach”
This project has received funding from the European Union’s Horizon 2020 research and
innovation programme under grant agreement No 692976.
27
7. References
Anderson, James E. (1979): “A Theoretical Foundation for the Gravity Equation”, in: American
Economic Review, Vol 69, No. 1 (March 1979), p. 106–116.
Anderson, James E. (2011): “The Gravity Model”, in: Annual Review of Economics, Vol 3, Issue 1,
p. 133–160.
Anderson, James E. and Eric van Wincoop (2003): “Gravity with Gravitas: A Solution to the Border
Puzzle”, in: American Economic Review, Vol 93, No. 1 (March 2003), p. 170–192.
Antonucci, Daniel and Stefano Manzocchi (2006): “Does Turkey have a special trade relation with
the EU? A gravity model approach”, in: Economic Systems, Vol 30 issue 2, p. 157–169.
Atici, Cemal and Bulent Guloglu (2006): “Gravity Model of Turkey's Fresh and Processed Fruit and
Vegetable Export to the EU”, in: Journal of International Food & Agribusiness Marketing,
Vol 18, Issue 3-4, p. 7-21.
Arellano, M. and S. Bond. (April 1991). Some tests of specification for panel data: Monte Carlo
evidence and an application to employment equations. The Review of Economic Studies, 58.
pp. 277 – 297.
Aytug, Hussein et al. (2015) “Do countries really benefit from customs unions? a nonparametric
approach”, presented in: ETSG Paris Conference Papers, 10-12 September.
Bektasoglu, Beyhan et al. (2016): “The Effect of Aggregation Bias: An NTB-modelling Analysis of
Turkey’s Agro-food Trade with the EU”, in: The World Economy.
Bergstrand, Jeffrey H. (1985): “The Gravity Equation in International Trade: Some Microeconomic
Foundations and Empirical Evidence”, in: The Review of Economics and Statistics, Vol 67,
No. 3 (August 1985), p. 474–481.
Bergstrand, Jeffrey H. (1989): “The Generalized Gravity Equation, Monopolistic Competition, and
the Factor-Proportions Theory in International Trade”, in: The Review of Economics and Sta-
tistics Vol 71, No. 1 (February 1989), p. 143–153.
Bilici, Ö. Et al. (2011) “The determinants of Turkey’s Trade Flows: A Gravity Model Approach”, in:
Actual Problems of Economics, Vol. 118, p. 265-79.
Bougheas, Spiros et al. (1999): “Infrastructure, Transport Costs and Trade”, in: Journal of Interna-
tional Economics, Vol 47, No. 1 (February 1999), p. 169–189.
Breuss, Fritz, and Peter Egger (1999): “How Reliable Are Estimations of East-West Trade Potentials
Based on Cross-Section Gravity Analyses?” in: Empirica, Vol 26, Issue 2 (June 1999) p. 81–
95.
Cheng, I-Hui, and Howard J. Wall (2005): “Controlling for Heterogeneity in Gravity Models of
Trade”, in: Federal Reserve Bank of St. Louis Review, Vol 97, No. 1, p. 49–63.
Online Paper No. 8 “Understanding the EU-Turkey sectoral trade flows during
1990-2016: a trade gravity approach”
This project has received funding from the European Union’s Horizon 2020 research and
innovation programme under grant agreement No 692976.
28
Chow, P. & Yochanan, M.K. (1999). A test of the Linder hypothesis in Pacific NIC Trade 1965-1990.
Applied Economics, 31(2), 175-82.
Deardorff, Alan V. (1998): “Determinants of Bilateral Trade: Does Gravity Work in a Neo-Classic
World?”, in: Frankel, Jeffrey A. (ed.), The Regionalization of the World Economy, Cambridge,
MA: University of Chicago/National Bureau of Economic Research, p. 7–32.
Egger, Peter (2000): “A Note on the Proper Econometric Specification of the Gravity Equation”,
in: Economics Letters, Vol 66, Issue 1, p. 25–31.
Ekmen-Özçelik, Seda and Guzin Erlat (2013) “What Can We Say About Turkey and its Competitors
in the EU Market? An Analysis by Extensive and Intensive Margins”, Topics in Middle Eastern
and African Economies Vol. 15, 186-211.
Ekmen-Özçelik, Seda and Guzin Erlat (2014), “Turkey's Comparative Advantages and Dynamic
Market Positioning in the EU Market”, in: Emerging Markets Finance and Trade, Vol. 50, p.
18-41.
Ekmen-Özçelik, Seda (2016) “Turkey’s Competition with the EU in the US Market in the Context
of TTIP”, International Journal of Trade, Economics and Finance, 7, 198-201.
Erdil, Erkan and Semih I. Akçomak (2016). “The Future of EU-Turkey Relations in Changing Eco-
nomic Environment - Guideline paper”, Working Paper No 3, FEUTUR, Europe.
Gil-Pareja, Salvador et al. (2008): “Trade Effects of Monetary Agreements: Evidence for OECD
Countries”, in: European Economic Review, Vol 52, Issue 4 (May 2008), p. 733–755.
Gomez-Herrera, Estrella, and Juliette Milgram Baleix (2012): EMU Impact of on Third countries’
Exports: A Gravity Approach, University of Granada: Department of Economic Theory and
Economic History, University of Granada (The Working Papers 10/26.)
Harrison, Glenn W. et al. (1997): “Turkey’s Customs Union with the EU Economic implications for
Turkey of a Customs Union with the European Union”, in: European Economic Review, Vol
41, Issues 3-5 (April 1997), p. 861-870.
Head, Keith et al. (2011): “The erosion of colonial trade linkages after independence”, in: Journal
of International Economics, Vol 81, Issue 1 (May 2010), p. 1-14.
Helpman, Elhanan (1987): “Imperfect Competition and International Trade: Evidence from Four-
teen Industrial Countries”, in: Journal of the Japanese and International Economies 1, p. 62–
81.
Helpman, Elhanan, and Paul R. Krugman (1985): Market Structure and Foreign Trade: Increasing
Returns, Imperfect Competition, and the International Economy, Cambridge: The MIT
Press.
Jiménez, Juan Carlos, and Aranzazu Narbona (2010): “Los Factores Institucionales Como Deter-
minantes De Los Flujos Comerciales Internacionales [Institutional Factors as Determinants
of International Trade Flows]”, in: Revista De Economía Mundial, Vol 24, p. 23–48.

Online Paper No. 8 “Understanding the EU-Turkey sectoral trade flows during
1990-2016: a trade gravity approach”
This project has received funding from the European Union’s Horizon 2020 research and
innovation programme under grant agreement No 692976.
29
Jones C. Vivian and Michael F. Martin (2012) “International Trade: Rules of Origin”, Specialist in
International Trade and Finance, Congressional Research Services, US Congress, January 5.
Knapp, Thijs (2004): Models of Economic Geography: Dynamics, Estimation and Policy Evaluation,
Ridderkerk: Labyrint Publications.
Lejour, A. M. and R. A. de Mooij (2005), “Turkish Delight: Does Turkey's Accession to the EU Bring
Economic Benefits?”, in: Kyklos, Vol. 58, p. 87-120.
Limao, Nuno, and Anthony Venables (1999): Infrastructure, Geographical Disadvantage and
Transport Costs, The World Bank, mimeo.
Linnemann, Hans (1966): An Econometric Study of International Trade Flows, Amsterdam: North-
Holland Publishing.
Mátyás, László (1997): “Proper Econometric Specification of the Gravity Model”, in: The World
Economy, Vol 20, Issue 3 (May 1997), p. 363–368.
Mátyás, László (1998): “The Gravity Model: Some Econometric Considerations”, in: The World
Economy, Vol 21, Issue 3 (May 1998), p. 397–401.
Mercenier, Jean and Erinc Yeldan (1997): “On Turkey’s trade policy: Is a customs union with Eu-
rope enough?”, in: European Economic Review, Vol. 41, Issue 3, p. 871–880.
Micco, Alejandro et al. (2003): “The Currency Union Effect on Trade: Early Evidence from EMU”,
in: Economic Policy, Vol 18, Issue 37 (October 2003), p. 315–356.
Neyapt, Bilin et al. (2007): “Has the European Customs Union Agreement really affected Turkey’s
trade?”, in: Applied Economics, Vol. 39, Issue 16, p. 2121–2132.
Nowak-Lehmann, Felicitas et al. (2007): “The Impact of a Customs Union between Turkey and the
EU on Turkey’s Exports to the EU”, in: Journal of Common Market Studies, Vol 45, Issue 3
(September 2007), pp. 719–743.
Pöyhönen, Pentti (1963): “A Tentative Model for the Volume of Trade between Countries”, in:
Weltwirtschaftliches Archiv 90, p. 93–99.
Roodman, D. (2006). How to do xtabond2: an introduction to “Difference” and “System” GMM in
Stata. The Stata Journal, Vol 9 No 1, pp. 86-136.
Soloaga, Isidro, and Alan Winters (1999): “Regionalism in the Nineties: What Effects on Trade?”
in: North American Journal of Economics and Finance 12, p. 1–29.
The Center for Research and Expertise in the World Economy (CEPII),
http://www.cepii.fr/CEPII/en/welcome.asp.
The European Commission (2015): Enhancement of EU-Turkey bilateral trade relations and mod-
ernisation of the EU-Turkey Customs Union, Lead DG: Responsible Unit, Trade E2/A5, Au-
gust, http://ec.europa.eu/smartregulation/roadmaps/docs/2015_trade_035_tur-
key_en.pdf.
Online Paper No. 8 “Understanding the EU-Turkey sectoral trade flows during
1990-2016: a trade gravity approach”
This project has received funding from the European Union’s Horizon 2020 research and
innovation programme under grant agreement No 692976.
30
The OECD (2015). The Bilateral Trade in Goods by Industry and End-use database (TDIxE), (ISIC
Rev.4), www.oecd.org.
Tinbergen, Jan (1962): Shaping the World Economy; Suggestions for an International Economic
Policy, New York: Twentieth Century Fund.
Ülengin, Füsun et al. (2015): “Effects of quotas on Turkish foreign trade: A gravity model”, in:
Transport Policy, Vol 38 (February 2015), p. 1–7.
Ülgen, Sinan and Yiannis Zahariadis (2004): The Future of Turkish-EU Trade Relations: Deepening
vs Widening, Brussels: Centre for European Policy Studies (EU-Turkey Working Papers, No
5, August).
Wei, S. J. 1996. Intra-National versus International Trade: How Stubborn Are Nations in Global
Integration? Working Paper, 5531. Cambridge, MA: National Bureau of Economics Research
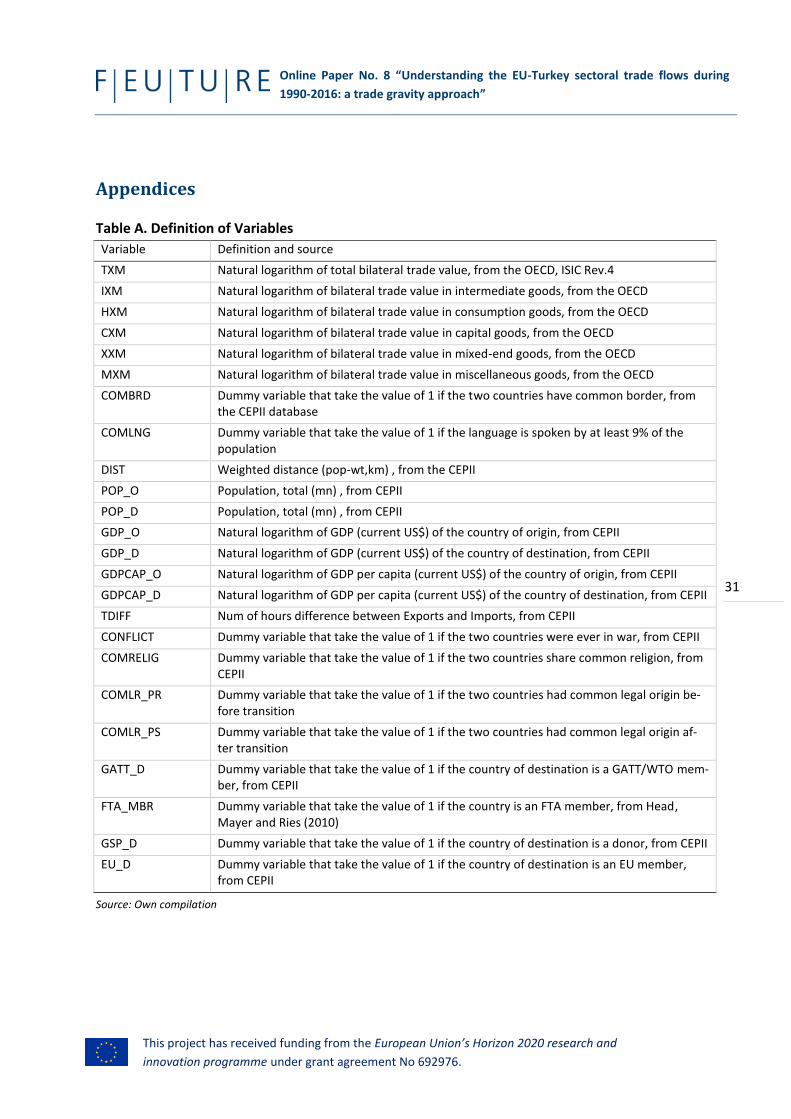
Online Paper No. 8 “Understanding the EU-Turkey sectoral trade flows during
1990-2016: a trade gravity approach”
This project has received funding from the European Union’s Horizon 2020 research and
innovation programme under grant agreement No 692976.
31
Appendices
Table A. Definition of Variables
Variable Definition and source
TXM Natural logarithm of total bilateral trade value, from the OECD, ISIC Rev.4
IXM Natural logarithm of bilateral trade value in intermediate goods, from the OECD
HXM Natural logarithm of bilateral trade value in consumption goods, from the OECD
CXM Natural logarithm of bilateral trade value in capital goods, from the OECD
XXM Natural logarithm of bilateral trade value in mixed-end goods, from the OECD
MXM Natural logarithm of bilateral trade value in miscellaneous goods, from the OECD
COMBRD Dummy variable that take the value of 1 if the two countries have common border, from the CEPII database
COMLNG Dummy variable that take the value of 1 if the language is spoken by at least 9% of the population
DIST Weighted distance (pop-wt,km) , from the CEPII
POP_O Population, total (mn) , from CEPII
POP_D Population, total (mn) , from CEPII
GDP_O Natural logarithm of GDP (current US$) of the country of origin, from CEPII
GDP_D Natural logarithm of GDP (current US$) of the country of destination, from CEPII
GDPCAP_O Natural logarithm of GDP per capita (current US$) of the country of origin, from CEPII
GDPCAP_D Natural logarithm of GDP per capita (current US$) of the country of destination, from CEPII
TDIFF Num of hours difference between Exports and Imports, from CEPII
CONFLICT Dummy variable that take the value of 1 if the two countries were ever in war, from CEPII
COMRELIG Dummy variable that take the value of 1 if the two countries share common religion, from CEPII
COMLR_PR Dummy variable that take the value of 1 if the two countries had common legal origin be-fore transition
COMLR_PS Dummy variable that take the value of 1 if the two countries had common legal origin af-ter transition
GATT_D Dummy variable that take the value of 1 if the country of destination is a GATT/WTO mem-ber, from CEPII
FTA_MBR Dummy variable that take the value of 1 if the country is an FTA member, from Head, Mayer and Ries (2010)
GSP_D Dummy variable that take the value of 1 if the country of destination is a donor, from CEPII
EU_D Dummy variable that take the value of 1 if the country of destination is an EU member, from CEPII
Source: Own compilation

Online Paper No. 8 “Understanding the EU-Turkey sectoral trade flows during
1990-2016: a trade gravity approach”
This project has received funding from the European Union’s Horizon 2020 research and
innovation programme under grant agreement No 692976.
32
Table B. Bilateral trade of Turkey by sector, 1990-2015 (annual percent change)
Country 1990-2016
Total trade (Δ%)
Intermediate goods trade (Δ%)
Consumption goods trade (Δ%)
Capital goods trade (Δ%)
Mixed-end goods trade
(Δ%)
Miscella-neous goods
trade (Δ%)
Austria Mean 8.4% 8.3% 5.1% 15.7% 40.0% 72.6%
Range 66.9% 69.1% 34.3% 201.1% 362.2% 1225.0%
Belgium Mean 9.4% 9.1% 7.1% 15.2% 26.4% 40.0%
Range 76.7% 67.9% 47.2% 174.8% 222.3% 445.9%
Bulgaria Mean 39.6% 31.6% 41.9% 172.0% 37.8% 120.4%
Range 430.8% 288.4% 516.3% 3131.1% 211.5% 1614.9%
Den-mark
Mean 10.8% 11.1% 10.0% 16.3% 19.0% 1492.6%
Range 103.3% 92.7% 77.0% 195.7% 220.2% 19477.9%
France Mean 8.6% 8.0% 6.1% 14.3% 19.3% 31.8%
Range 60.6% 51.7% 56.3% 167.7% 142.9% 470.3%
Ger-many
Mean 7.7% 8.5% 4.2% 10.0% 18.3% 90.7%
Range 64.1% 72.5% 42.0% 94.2% 188.2% 2109.9%
Greece Mean 11.7% 10.6% 12.4% 24.4% 107.1% 23.8%
Range 91.5% 103.9% 91.9% 300.2% 1137.9% 244.5%
Hungary Mean 10.7% 9.7% 9.0% 36.0% 265.9% 3075.9%
Range 77.7% 125.2% 142.2% 351.7% 4727.0% 39663.0%
Ireland Mean 15.0% 13.3% 13.7% 44.4% 21.2% 996.8%
Range 112.3% 134.9% 112.5% 378.1% 132.6% 12996.4%
Italy Mean 8.7% 7.8% 9.6% 10.8% 26.4% 13.4%
Range 80.8% 85.6% 65.4% 86.2% 355.9% 177.8%
Nether-lands
Mean 8.6% 8.0% 7.8% 12.5% 20.5% 127.5%
Range 60.0% 54.7% 59.8% 119.1% 253.4% 2036.2%
Poland Mean 13.7% 13.5% 14.1% 36.6% 97.9% 24535.2%
Range 107.2% 109.8% 87.3% 293.4% 912.9% 293983.3%
Spain Mean 13.8% 11.3% 16.6% 20.1% 48.8% 33.5%
Range 78.5% 90.0% 99.6% 216.7% 521.4% 287.4%
Sweden Mean 12.2% 10.6% 9.4% 18.3% 26.2% 29.0%
Range 122.6% 78.4% 68.4% 275.1% 325.1% 218.9%
UK Mean 10.7% 9.8% 9.4% 14.6% 23.0% 59.1%
Range 76.0% 114.3% 46.9% 161.2% 211.4% 896.4%
Total I Mean 12.2% 11.1% 11.3% 28.3% 52.8% 1906.9%
Range 465.0% 305.7% 524.4% 3165.2% 4769.8% 293983.3%
China Mean 130.1% 79.4% 563.1% 591.1% 29882.0% 955.8%
Range 1879.9% 962.7% 9289.9% 9789.9% 487660.8% 14662.1%
Iran Mean 15.2% 14.8% 29.5% 34.2% 1429.2% 744.8%
Range 143.7% 155.8% 235.1% 542.1% 26338.1% 5089.2%
Japan Mean 6.8% 6.7% 5.3% 8.9% 11.8% 4722.7%
Range 74.7% 73.4% 75.5% 106.4% 232.4% 65077.5%
Russia Mean 12.8% 13.7% 10.7% 16.2% 16.3% 39.7%
Range 121.1% 136.1% 127.8% 180.2% 224.0% 393.5%
USA Mean 8.0% 8.0% 5.1% 17.8% 10.2% 43.7%
Range 63.8% 71.6% 43.0% 150.4% 134.0% 530.0%
Total II Mean 27.5% 20.4% 90.0% 99.6% 4513.6% 1327.0%
Range 1879.9% 962.7% 9336.5% 9829.5% 487688.9% 65078.3%
World Mean 10.4% 10.0% 8.9% 12.0% 19.1% 19.3%
Range 65.8% 69.9% 44.3% 79.4% 115.7% 212.4%
Source: OECD statistics. Trade volumes are the sum of bilateral exports and imports in total and per sector.

Online Paper No. 8 “ Understanding the EU-Turkey sectoral trade flows during 1990-2016: a trade gravity approach”
This project has received funding from the European Union’s Horizon 2020 research and
innovation programme under grant agreement No 692976.
33
Figure A. Bilateral trade of Turkey, by country and sector, 1990-2015 (million USD)
0
500000
1000000
1500000
2000000
2500000
3000000
3500000
1 2 3 4 5 6 7 8 9 10 11 12 13 14 15 16 17 18 19 20 21 22 23 24 25 26 27
Austria
year Total trade (X+M) Intermediate goods
Consumption goods Capital goods Mixed-end goods
Miscellaneous goods
0
1000000
2000000
3000000
4000000
5000000
6000000
7000000
8000000
1 2 3 4 5 6 7 8 9 10 11 12 13 14 15 16 17 18 19 20 21 22 23 24 25 26 27
Belgium
year Total trade (X+M) Intermediate goods
Consumption goods Capital goods Mixed-end goods
Miscellaneous goods
0
1000000
2000000
3000000
4000000
5000000
6000000
1 2 3 4 5 6 7 8 9 10 11 12 13 14 15 16 17 18 19 20 21 22 23 24 25 26 27
Bulgaria
year Total trade (X+M) Intermediate goods
Consumption goods Capital goods Mixed-end goods
Miscellaneous goods
0
500000
1000000
1500000
2000000
2500000
1 2 3 4 5 6 7 8 9 10 11 12 13 14 15 16 17 18 19 20 21 22 23 24 25 26 27
Denmark
year Total trade (X+M) Intermediate goods
Consumption goods Capital goods Mixed-end goods
Miscellaneous goods

Online Paper No. 8 “Understanding the EU-Turkey sectoral trade flows during 1990-2016: a trade gravity approach”
This project has received funding from the European Union’s Horizon 2020 research and
innovation programme under grant agreement No 692976.
34
0
5000000
10000000
15000000
20000000
1 2 3 4 5 6 7 8 9 10 11 12 13 14 15 16 17 18 19 20 21 22 23 24 25 26 27
France
year Total trade (X+M) Intermediate goods
Consumption goods Capital goods Mixed-end goods
Miscellaneous goods
0
5000000
10000000
15000000
20000000
25000000
30000000
35000000
40000000
1 2 3 4 5 6 7 8 9 10 11 12 13 14 15 16 17 18 19 20 21 22 23 24 25 26 27
Germany
year Total trade (X+M)
Intermediate goods Consumption goods
Capital goods Mixed-end goods
0
1000000
2000000
3000000
4000000
5000000
6000000
1 2 3 4 5 6 7 8 9 10 11 12 13 14 15 16 17 18 19 20 21 22 23 24 25 26 27
Greece
year Total trade (X+M) Intermediate goods
Consumption goods Capital goods Mixed-end goods
Miscellaneous goods
0
500000
1000000
1500000
2000000
2500000
1 2 3 4 5 6 7 8 9 10 11 12 13 14 15 16 17 18 19 20 21 22 23 24 25 26 27
Hungary
year Total trade (X+M) Intermediate goods
Consumption goods Capital goods Mixed-end goods
Miscellaneous goods

Online Paper No. 8 “Understanding the EU-Turkey sectoral trade flows during 1990-2016: a trade gravity approach”
This project has received funding from the European Union’s Horizon 2020 research and
innovation programme under grant agreement No 692976.
35
0
500000
1000000
1500000
2000000
1 2 3 4 5 6 7 8 9 10 11 12 13 14 15 16 17 18 19 20 21 22 23 24 25 26 27
Ireland
year Total trade (X+M) Intermediate goods
Consumption goods Capital goods Mixed-end goods
Miscellaneous goods
0
5000000
10000000
15000000
20000000
25000000
1 2 3 4 5 6 7 8 9 10 11 12 13 14 15 16 17 18 19 20 21 22 23 24 25 26 27
Italy
year Total trade (X+M) Intermediate goods
Consumption goods Capital goods Mixed-end goods
Miscellaneous goods
0
1000000
2000000
3000000
4000000
5000000
6000000
7000000
8000000
1 2 3 4 5 6 7 8 9 10 11 12 13 14 15 16 17 18 19 20 21 22 23 24 25 26 27
The Netherlands
year Total trade (X+M) Intermediate goods
Consumption goods Capital goods Mixed-end goods
Miscellaneous goods
0
1000000
2000000
3000000
4000000
5000000
6000000
7000000
1 2 3 4 5 6 7 8 9 10 11 12 13 14 15 16 17 18 19 20 21 22 23 24 25 26 27
Poland
year Total trade (X+M) Intermediate goods
Consumption goods Capital goods Mixed-end goods
Miscellaneous goods
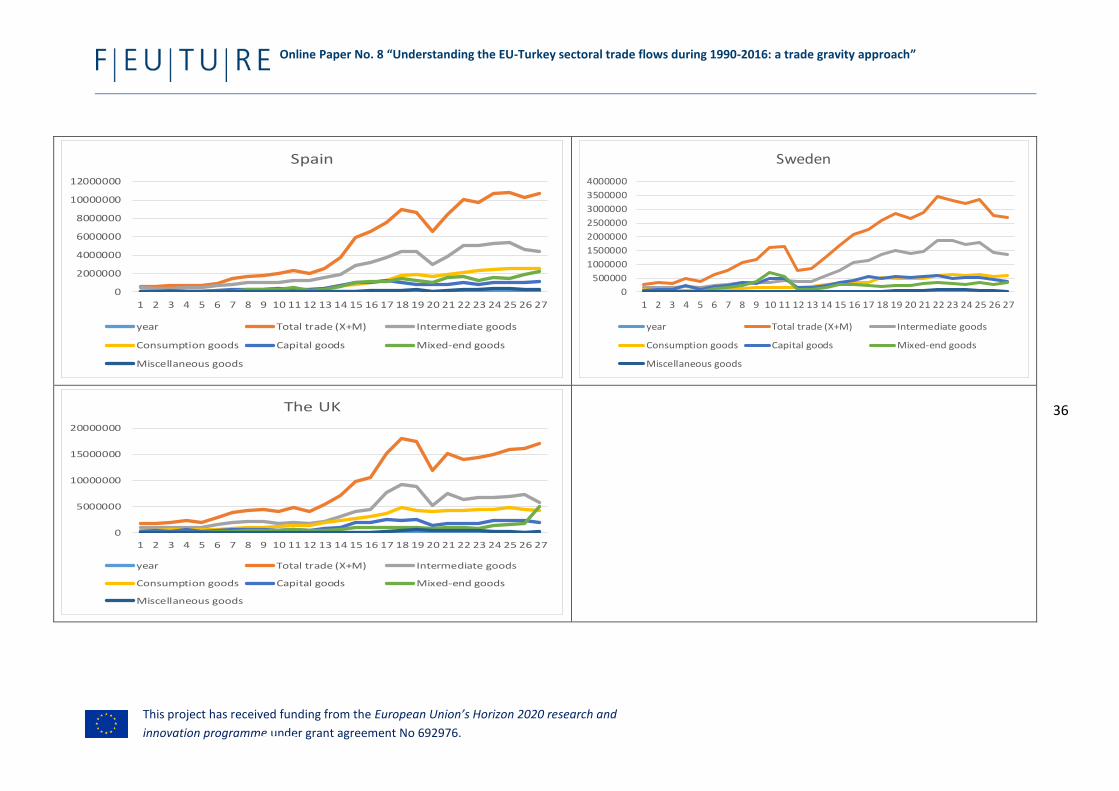
Online Paper No. 8 “Understanding the EU-Turkey sectoral trade flows during 1990-2016: a trade gravity approach”
This project has received funding from the European Union’s Horizon 2020 research and
innovation programme under grant agreement No 692976.
36
0
2000000
4000000
6000000
8000000
10000000
12000000
1 2 3 4 5 6 7 8 9 10 11 12 13 14 15 16 17 18 19 20 21 22 23 24 25 26 27
Spain
year Total trade (X+M) Intermediate goods
Consumption goods Capital goods Mixed-end goods
Miscellaneous goods
0
500000
1000000
1500000
2000000
2500000
3000000
3500000
4000000
1 2 3 4 5 6 7 8 9 10 11 12 13 14 15 16 17 18 19 20 21 22 23 24 25 26 27
Sweden
year Total trade (X+M) Intermediate goods
Consumption goods Capital goods Mixed-end goods
Miscellaneous goods
0
5000000
10000000
15000000
20000000
1 2 3 4 5 6 7 8 9 10 11 12 13 14 15 16 17 18 19 20 21 22 23 24 25 26 27
The UK
year Total trade (X+M) Intermediate goods
Consumption goods Capital goods Mixed-end goods
Miscellaneous goods

Online Paper No. 8 “Understanding the EU-Turkey sectoral trade flows during 1990-2016: a trade gravity approach”
This project has received funding from the European Union’s Horizon 2020 research and
innovation programme under grant agreement No 692976.
37
0
5000000
10000000
15000000
20000000
25000000
30000000
1 2 3 4 5 6 7 8 9 10 11 12 13 14 15 16 17 18 19 20 21 22 23 24 25 26 27
China
year Total trade (X+M) Intermediate goods
Consumption goods Capital goods Mixed-end goods
Miscellaneous goods
0
5000000
10000000
15000000
20000000
25000000
1 2 3 4 5 6 7 8 9 10 11 12 13 14 15 16 17 18 19 20 21 22 23 24 25 26 27
Iran
year Total trade (X+M) Intermediate goods
Consumption goods Capital goods Mixed-end goods
Miscellaneous goods
0
1000000
2000000
3000000
4000000
5000000
1 2 3 4 5 6 7 8 9 10 11 12 13 14 15 16 17 18 19 20 21 22 23 24 25 26 27
Japan
year Total trade (X+M) Intermediate goods
Consumption goods Capital goods Mixed-end goods
Miscellaneous goods
0
5000000
10000000
15000000
20000000
25000000
30000000
35000000
40000000
1 2 3 4 5 6 7 8 9 10 11 12 13 14 15 16 17 18 19 20 21 22 23 24 25 26 27
Russia
year Total trade (X+M) Intermediate goods
Consumption goods Capital goods Mixed-end goods
Miscellaneous goods
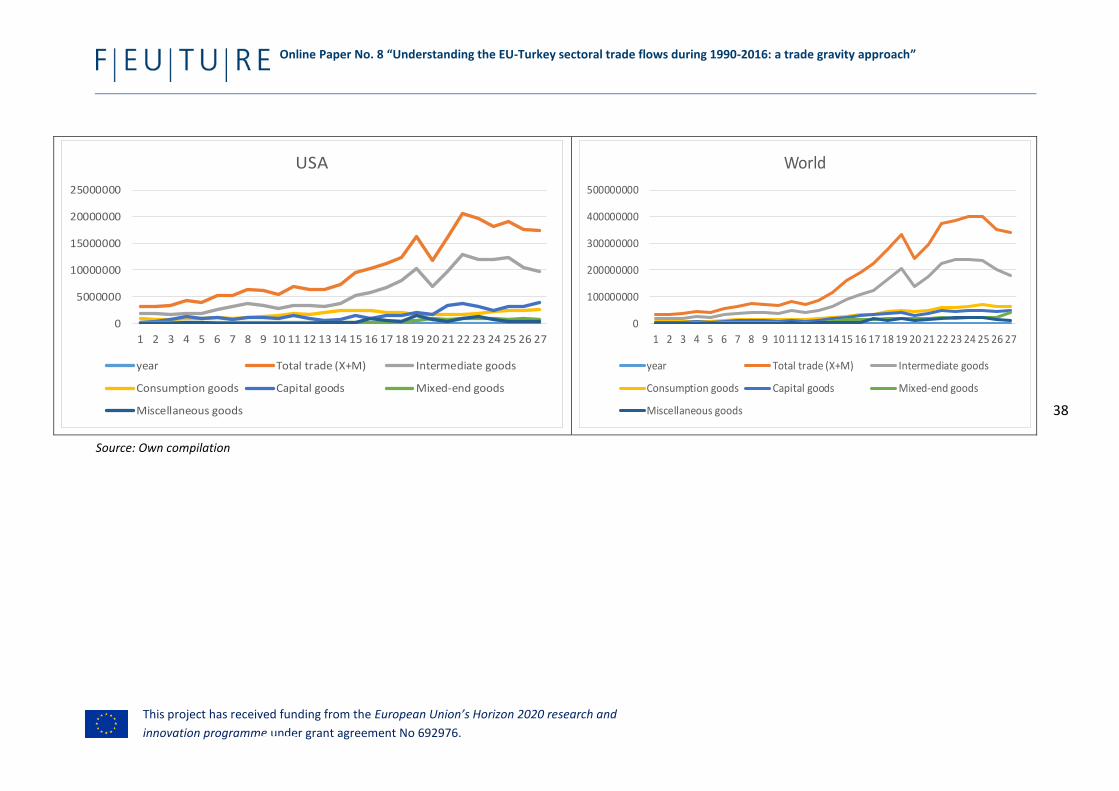
Online Paper No. 8 “Understanding the EU-Turkey sectoral trade flows during 1990-2016: a trade gravity approach”
This project has received funding from the European Union’s Horizon 2020 research and
innovation programme under grant agreement No 692976.
38
Source: Own compilation
0
5000000
10000000
15000000
20000000
25000000
1 2 3 4 5 6 7 8 9 10 11 12 13 14 15 16 17 18 19 20 21 22 23 24 25 26 27
USA
year Total trade (X+M) Intermediate goods
Consumption goods Capital goods Mixed-end goods
Miscellaneous goods
0
100000000
200000000
300000000
400000000
500000000
1 2 3 4 5 6 7 8 9 10 11 12 13 14 15 16 17 18 19 20 21 22 23 24 25 26 27
World
year Total trade (X+M) Intermediate goods
Consumption goods Capital goods Mixed-end goods
Miscellaneous goods
Online Paper No. 8 “Understanding the EU-Turkey sectoral trade flows during
1990-2016: a trade gravity approach”
This project has received funding from the European Union’s Horizon 2020 research and
innovation programme under grant agreement No 692976.
37
About the Author
Dr. Charilaos Mertzanis, Associate Professor of Financial Economics, The Amer-
ican University in Cairo
His general research focuses on macroeconomics, finance and corporate gov-
ernance, financial regulation and financial stability. He is involved in FEUTURE’s
research on Economic Drivers (Work Package 3).
Disclaimer: This publication reflects the views only of the author, and the Commission cannot
be held responsible for any use which may be made of the information contained therein.

Online Paper No. 8 “Understanding the EU-Turkey sectoral trade flows during
1990-2016: a trade gravity approach”
This project has received funding from the European Union’s Horizon 2020 research and
innovation programme under grant agreement No 692976.
ABOUT FEUTURE FEUTURE sets out to explore fully different options for further EU-Turkey cooperation
in the next decade, including analysis of the challenges and opportunities connected
with further integration of Turkey with the EU.
To do so, FEUTURE applies a comprehensive research approach with the following
three main objectives:
1. Mapping the dynamics of the EU-Turkey relationship in terms of their under-lying historical narratives and thematic key drivers.
2. Testing and substantiating the most likely scenario(s) for the future and as-sessing the implications (challenges and opportunities) these may have on the EU and Turkey, as well as the neighbourhood and the global scene.
3. Drawing policy recommendations for the EU and Turkey on the basis of a strong evidence-based foundation in the future trajectory of EU-Turkey rela-tions.
FEUTURE is coordinated by Prof. Dr. Wolfgang Wessels, Director of the Centre for Tur-
key and European Union Studies at the University of Cologne and Dr. Nathalie Tocci,
Director of Istituto Affari Internazionali, Rome.
The FEUTURE consortium consists of 15 renowned universities and think tanks from
the EU, Turkey and the neighbourhood.
Coordination Office at University of Cologne: Project Director: Dr. Funda Tekin Project and Financial Manager: Hanna-Lisa Hauge Email: [email protected]
facebook.com/feuture.eu
@FEUTURE_EU
Website: www.feuture.eu