Fertility and Poverty in less developed countries: a ......Fertility and Poverty in less developed...
37
Fertility and Poverty in less developed countries: a comparative analysis Arnstein Aassve 1 Henriette Engelhardt 2 Francesca Francavilla 3 Abbi Kedir 4 Jungho Kim 2 Fabrizia Mealli 3 Letizia Mencarini 3 Stephen Pudney 1 Alexia Prskawetz 2 June 2005 Abstract: Poverty analysis has a central part in Development Economics, whereas studies of fertility behaviour have an equally important standing in the Demography literature. Poverty and fertility are two important aspects of welfare that are closely related. In this paper we use unique longitudinal data sources to study the relationship between poverty and fertility at household level over a two to five year period. In particular we compare the relationship between fertility and poverty in four countries: Ethiopia, Vietnam, Indonesia and Albania. These countries differ greatly in their history, average income, social structure, economic institutions and demographic features. Given such differences, the paper aims to discern the extent of commonalities and differences in the poverty fertility relationship and to what extent these can be explained by the differences in economic and demographic development. Keywords: Panel data, fertility, poverty, poverty dynamics. Address for correspondence: Arnstein Aassve, ISER, University of Essex, Wivenhoe Park, Colchester CO4 3SQ. E-mail: [email protected]. 1 Institute for Social and Economic Research, University of Essex; 2 Vienna Institute of Demography; 3 Department of Statistics, University of Florence; 4 Department of Economics, University of Leicester; The project is funded under the framework of the European Science Foundation (ESF) - European Research Collaborative Program (ERCPS) in the Social Science, by Economic and Social Research Council (award no. RES-000-23-0462), the Italian National Research Council (Posiz. 117.14), and the Austrian Science Foundation (contract no. P16903-605). We are grateful for useful comments from participants at the PAA 2005 conference and the ISER seminar. Particular thanks to John Ermisch for his insightful comments on this work. 1
Transcript of Fertility and Poverty in less developed countries: a ......Fertility and Poverty in less developed...

Fertility and Poverty in less developed countries: a comparative analysis
Arnstein Aassve 1
Henriette Engelhardt 2
Francesca Francavilla 3
Abbi Kedir 4Jungho Kim 2
Fabrizia Mealli 3Letizia Mencarini 3Stephen Pudney 1
Alexia Prskawetz 2
June 2005
Abstract: Poverty analysis has a central part in Development Economics, whereas studies of fertility behaviour have an equally important standing in the Demography literature. Poverty and fertility are two important aspects of welfare that are closely related. In this paper we use unique longitudinal data sources to study the relationship between poverty and fertility at household level over a two to five year period. In particular we compare the relationship between fertility and poverty in four countries: Ethiopia, Vietnam, Indonesia and Albania. These countries differ greatly in their history, average income, social structure, economic institutions and demographic features. Given such differences, the paper aims to discern the extent of commonalities and differences in the poverty fertility relationship and to what extent these can be explained by the differences in economic and demographic development. Keywords: Panel data, fertility, poverty, poverty dynamics. Address for correspondence: Arnstein Aassve, ISER, University of Essex, Wivenhoe Park, Colchester CO4 3SQ. E-mail: [email protected]. 1 Institute for Social and Economic Research, University of Essex; 2 Vienna Institute of Demography; 3 Department of Statistics, University of Florence; 4 Department of Economics, University of Leicester; The project is funded under the framework of the European Science Foundation (ESF) - European Research Collaborative Program (ERCPS) in the Social Science, by Economic and Social Research Council (award no. RES-000-23-0462), the Italian National Research Council (Posiz. 117.14), and the Austrian Science Foundation (contract no. P16903-605). We are grateful for useful comments from participants at the PAA 2005 conference and the ISER seminar. Particular thanks to John Ermisch for his insightful comments on this work.
1

1 Introduction
The relationship between poverty and fertility is a long contested issue among
demographers and economists. The general empirical observation that poorer countries
tend to have higher population growth rates and that larger households tend to be poorer,
underlies the presumption of a positive causal relation between poverty and fertility at the
national and household levels respectively. The macro level argument relies on the neo-
classical paradigm that a higher population growth rate depresses capital accumulation
and wages. Poverty in turn is considered as a key factor in driving high fertility and
therefore high rates of population growth, consequently delaying the demographic
transition. The standard micro explanation is that households, which rely on primitive
farming technologies, have a greater need for cheap labour, and therefore a higher
demand for children. Moreover, given lack of state benefits and pensions, it is frequently
argued that increasing demand for children is a means of insurance or security in old age.
Developing countries are at different stages both in terms of the fertility transition
and economic progress, and the poverty/fertility relationship is likely to vary accordingly.
Moreover, the nature of the poverty/fertility relationship is likely to be an institutionally
contingent relationship, and any generalisation that neglects those institutional settings is
likely to fail. Individual level fertility behaviour adjusts to changes in perceived and
actual costs and benefits of children. Economic forces, social organisations and cultural
patterns in turn influence prices that determine costs and benefits of children. Not only
will the poverty and fertility link be dependent on the social and institutional
environment, there will also exist policy instruments that impinge on both processes.
These include education, health services and family planning policies.
There is now a substantial literature on the poverty/fertility relationship (see section
2). A drawback of these studies is that they differ with respect to data and methodology,
which makes it is difficult to discern clear cut results on poverty and fertility dynamics
across countries and time. Moreover, all of the studies rely on either cross sectional or
aggregate level data. Cross sectional surveys cannot provide reliable poverty measures at
different points in time, and is therefore unable to say much about the extent to which
poverty might drive fertility and/or vice versa. Though there is an emerging literature on
poverty dynamics in developing countries (see section 2), none of these consider the link
between poverty and fertility explicitly. In this paper we follow up on these studies by
considering the fertility issue in greater depth. We use longitudinal data from four
2

countries (Ethiopia, Indonesia, Vietnam and Albania), all of which differs in economic
and demographic development, to assess commonalities and differences of the various
channels for which poverty and fertility interacts, emphasising how these relate to the
country specific characteristics. By applying the same methodologies to each longitudinal
survey, we are able to present a more coherent picture on fertility and poverty dynamics
compared to previous studies.
The selected countries should obviously be considered as case studies rather than
a representative sample of developing countries. Ethiopia is the only country where
fertility levels are still very high, and poverty is still extremely severe. For the other three
countries, the demographic transition has clearly taken place, though perhaps not
completed in all three cases. At the same time they have experienced strong economic
growth, followed by a significant reduction in poverty. Of course, the countries differ in
many other respects, such as religion, culture and political situation. Given these
differences, the aim of our analysis is to establish commonalities and differences in the
poverty – fertility relationship. In particular we put focus on the various channels through
which poverty and fertility interact in different circumstances.
We find that in a cross sectional perspective there is always a positive association
between poverty and number of children. However, our dynamic analysis shows that poor
households do not necessarily have a higher rate of fertility, but households with many
children (i.e. high fertility) tend to have a higher rate of entering poverty and lower rate of
exiting poverty. We also find that for the countries considered, there is a substantial
difference in the relative importance of the determinants of poverty dynamics and
fertility; the persistence of high levels of fertility and poverty in Ethiopia is driven by lack
of economic growth and poor access to family planning; education and health provision
are crucial elements in reducing poverty and fertility, as is clear from Vietnam, Indonesia
and Albania.
The paper is outlined as follows: section 2 gives an outline of the literature
emphasising the poverty/fertility relationship; section 3 gives a brief outline of the
theoretical perspective and how it is related to the four countries; section 4 presents the
data; section 5 the econometric analysis, whereas section 6 provides a discussion.
3

2 Previous research
Existing empirical studies concerning the relationship between poverty and fertility
based at the micro-level rely on cross sectional data. They show mixed results, indicating
that the relationship does not appear to be unidirectional. Some studies suggest a positive
relationship, others find it to be negative, and yet others find it to have an inverse J-
shaped relationship. Yet other studies find very little evidence of any relationship at all.
The literature has tried to reconcile these discrepancies by differentiating countries by
their level of economic development and demographic transition. Within the poorest
countries, the relationship between poverty and fertility is often negative. Fertility appears
higher among “wealthier” households, which is a result of low reproduction capability
and general higher rates of infertility among the poor (Lipton 1998; Livi-Bacci and di
Santis 1998). Studies from the 60s and the 70s pointed to such patterns in rural areas of
Bangladesh, India, Indonesia, Pakistan and Sierra Leone. The most common relationship
between poverty and fertility in contemporary less developed countries is however
positive. For instance countries with low fertility levels during the eighties and the
nineties (TFR less than 3.5 – including Vietnam, Costa Rica, urban Paraguay, and urban
South Africa) and with high fertility levels (TFR above 4.5, e.g. Guatemala, Cameroon,
Bolivia, Calcutta in India, Belize), as well as medium level fertility (TFR between 3.5 and
4.5, e.g. Mexico, rural India, rural South Africa, Brazil, El Salvador, Ecuador, Paraguay),
all show a positive relationship. Shoumaker (2003) using DHS surveys from sub-Saharan
countries supports a general positive relationship.
There are however many cases where the positive relationship between poverty and
fertility is rather weak. Examples include countries in demographic pre-transitional
phases with very high TFR (e.g. Costa Rica, urban Sudan, Iran, Burkina Faso, Pakistan,
urban India, rural Philippines) and also during the 90s in countries with relatively low
fertility (TFR less than 3.5, such as in Maurice and urban Morocco). In some cases, such
as rural areas of India and Cameroon where fertility rates are very high, the relationship
takes an inverse “J shape”, implying that both low and high-income households have
lower rates of fertility, whereas medium level income households have higher fertility. It
is argued that very low income households tend to be landless farmers, hence less reliant
on children as cheap labour, whereas those with the highest income has lower fertility due
to higher investment in child quality. The middle income families are landholding farms
which depend on cheap labour, and therefore have a higher demand for child quantity,
4

which explains the apparent inverse J-shape. (see Schoumaker & Tabutin 1999 for further
details).
Of course all of the studies referred to above are based on cross-sectional data, and
provide therefore only a static view on the poverty/fertility relationship. Though still
rather limited, research on poverty dynamics for developing countries is now emerging.
Examples include Jalan and Ravallion (2000) using a panel from rural China focussing on
the issue of transient and chronic poverty; Mculloch and Baulch (2000) using a five-year
panel of 686 households from rural Pakistan showing that large reductions in poverty can
be achieved through policies aiming at smoothing household incomes – simply because a
large part of poverty is indeed transitory; Dercon and Krishnan (2000) using three waves
of the Ethiopian Rural Household Panel (ERHP) shows that individual consumption
levels varies widely by year and season, and indicate that a much larger proportion of
households are vulnerable to poverty than what cross sectional poverty statistics may
suggest1. Other examples of detailed analysis of poverty dynamics include Kedir and
McKay (2004), using the Ethiopian Urban Household Panel (EUHP), Bigsten et al (2004)
using both the ERHP and the EUHP, and Justino and Litchfield (2001) analysing poverty
dynamics in Vietnam.
3 Theoretical considerations and description of the countries
A positive relationship between fertility and poverty is frequently explained in a
micro-economic framework: children are considered as the work force of the household
to generate household income, and as insurance against old age. The demand for children
is therefore higher among the poorest. In rural underdeveloped regions, which largely rely
on primitive farming technology and with no or little access to state benefits, this
argument makes a great deal of sense. A high number of children and their participation
in household production imply that parents are less able to invest in their children’s
human capital (i.e. education), maintaining the low-income status of the household, and
thereby creating or perpetuating a poverty - fertility trap. In the short run, childbearing
may reduce a woman’s working time or decrease her productivity by taking more
resources away from her. As households gain higher income and wealth they tend to have
1 Baulch and Hoddinott (2000) summarises these findings by suggesting that the pool of poor households consist of both chronic poor and transitory poor, where the latter is surprisingly large, and this is the case independent of whether poverty is measured in relative or absolute terms.
5

fewer children either through quantity-quality trade-off suggested by Becker and Lewis
(1973) or by higher opportunity cost of women associated with higher income suggested
by Willis (1973). An equally plausible explanation behind high fertility rates concern
availability and provision of family planning. In so far family planning is lacking, women
will not be able to plan their fertility career and not able to avoid unintended pregnancies
(Easterlin and Crimmins 1985).. There is solid evidence for a negative relationship
between provision of fertility control and observed fertility rates, though there is equally
hard evidence to suggest important differentials by income and human capital, poorer
households, often found in rural areas, have in general a much lower contraceptive
prevalence rate.
Acquiring children certainly decreases the share of household resources available
for each member. In addition, newly born children may decrease the productivity of the
mother either by taking more resources (such as food) from her or by taking her away
from work, when she is a primary earner in a household. On the other hand, children may
bring more resources to a household by working for wage or by a transfer from other
relatives. Therefore, the net effect of childbearing on poverty is not clear. As the review
in the previous section suggests, the poverty/fertility relationship is hardly homogenous
across countries, even if they are at similar levels in demographic and economic
development – suggesting that it is hard to establish a universal causal link between
fertility and poverty.
It is useful to assess to what extent the simple theoretical predictions fit into the
countries that we are presenting in our present study. Table 1 gives summary data on the
demographic and economic conditions prevailing in the four countries since 19802. It is
immediately clear that they have experienced rather different development paths over the
last two decades, and that they are at very different levels in terms economic
development. The country that stands out is Ethiopia where poverty is more severe than
in the other three countries and more than two-thirds of the population live on less than $2
per day. Despite a series of economic reforms gradually being introduced in the late
eighties, leading to a more mixed economy, the Ethiopian economy remains heavily
agriculture-centred with around 85% of households being classified as farmers and by any
2 All figures quoted in this section come from the World Development Indicators database (see http://www.worldbank.org/data/wdi2004/)
6

measure the mode of production is primitive and labour intensive3. Provision of family
planning services is also poor, especially in rural areas. By 2000 the contraceptive
prevalence rate (CPR) in rural Ethiopia was only six percent, whereas it was around 45
percent in urban areas. The political history of Ethiopia has obviously hindered progress
in health provision and promoting economic reforms. After the traditional monarchy was
replaced in 1974 by the provisional military government, much of the Ethiopian economy
was nationalised. The 1980s followed with political unrest and upheavals, and the country
was plagued by a series of famines, all with devastating effects.
The fertility rates during this period, as depicted in Figure 1, remained high. The
pattern is in stark contrast to the other countries, all of which have experienced the
demographic transition, here highlighted by dramatically declining fertility levels. At the
same time they have experienced impressive rates of economic growth and development.
Table 1 shows other interesting factors that are correlated both with fertility levels and
economic development. One issue concerns child labour which has steadily declined in
Vietnam and Indonesia and is now close to non-existent in Albania. But it is still high in
Ethiopia and remains critically important in a heavily agricultural based economy
(Admassie, 2002). Moreover, school enrolment and literacy rates, especially in rural
areas, are extremely low in Ethiopia, whereas they have been on the increase in the other
countries.
Though it seems clear from these simple statistics that as countries progress in
their economic development – fertility rates also tend to decline, one should not make
sweeping generalisations of the fertility/poverty relationship. An important issue concerns
urban/rural differentials. Periods of strong economic growth is often followed by a
decline in the rural population due to migration (Table 1). In Indonesia the rural to urban
migration has been dramatic, reflecting important structural changes of the economy that
has reduced the dependency on rural economic activities. At the same time the migration
has made access to family planning easier. Consequently poverty and fertility has also
declined, whereas participation in education has increased. The agricultural sector has
seen significant reforms, most importantly in terms of private ownership, which now
stands at over 90%, and this might explain the fact that poverty in rural areas is only
3 One important problem of the Ethiopian agricultural sector concerns land tenure arrangements. Farmed land is owned by the state, and though farmers have claims on the land through lease contracts, a substantial proportion of farmers feel uncertain about future land redistribution schemes. This has been debated by the various political parties for several years. It has been argued that uncertainty of future land tenure contract produces a disincentive for farmers’ own investment in enhancing productivity.
7

marginally higher than in urban areas, and there is little difference between urban and
rural fertility levels.
In contrast Ethiopia has experienced only a very modest growth in GDP and rural
to urban migration has been less pronounced. There have been few economic reforms in
the Ethiopian agricultural sector, and the current system is still characterised by state
control, with very limited private ownership. Though there is little difference between
poverty in rural and urban areas (it is high everywhere), there is a dramatic difference in
fertility levels. The TFR in urban areas is around 3.4, whereas in Addis Ababa, by far the
largest urban concentration in Ethiopia, the TFR is as low as 1.9, which is below
replacement level. In rural areas, in contrast, the TFR is as high as 6.5 (Kinfu, 2000). A
corollary of this of course, is that fertility decline is not necessarily followed by a
reduction on poverty. In fact our data indicates that urban poverty increased slightly
between 1994 and 1997, whereas it declined somewhat in rural areas of Ethiopia.
Vietnam can be considered at a stage in between Ethiopia and Indonesia. The
country was one of the worlds’ poorest countries in the beginning of the 1980s, but has
since the beginning of the nineties experienced strong economic growth followed by
substantially reduced poverty (Glewwe et. al. 2001). Much of this improvement has been
attributed to the “Doi Moi” policy4. This was initiated in the late 1980s and roughly
coincided with the collapse of the Soviet Union, on which Vietnam had been heavily
dependent. The main elements of Doi Moi were: replacement of collective farms by
allocation of land to individual households; legalisation of many forms of private
economic activity; removal of price controls; and legalisation and encouragement of
Foreign Development Investment (FDI). Substantial progress has been achieved, reducing
poverty rates from around 56 percent in 1992 to 36 percent in 1997, reaching a level
around 29 percent in 2004. Despite this substantial reduction, there are still significant
differences between urban and rural areas, both in terms of fertility and poverty.
Albania is somewhat different in our analysis, given its rather modest population
of 3.4 million in 2001 and close proximity to Europe. However, it shares many
similarities in demographic and economic development as Vietnam and Indonesia. The
country has experienced rapid political, social and economic changes since 1992, when
democracy was re-installed. Between 1993 and 1996 GDP grew by about 9 percent
4 Ttranslated in English as “renovation”.
8
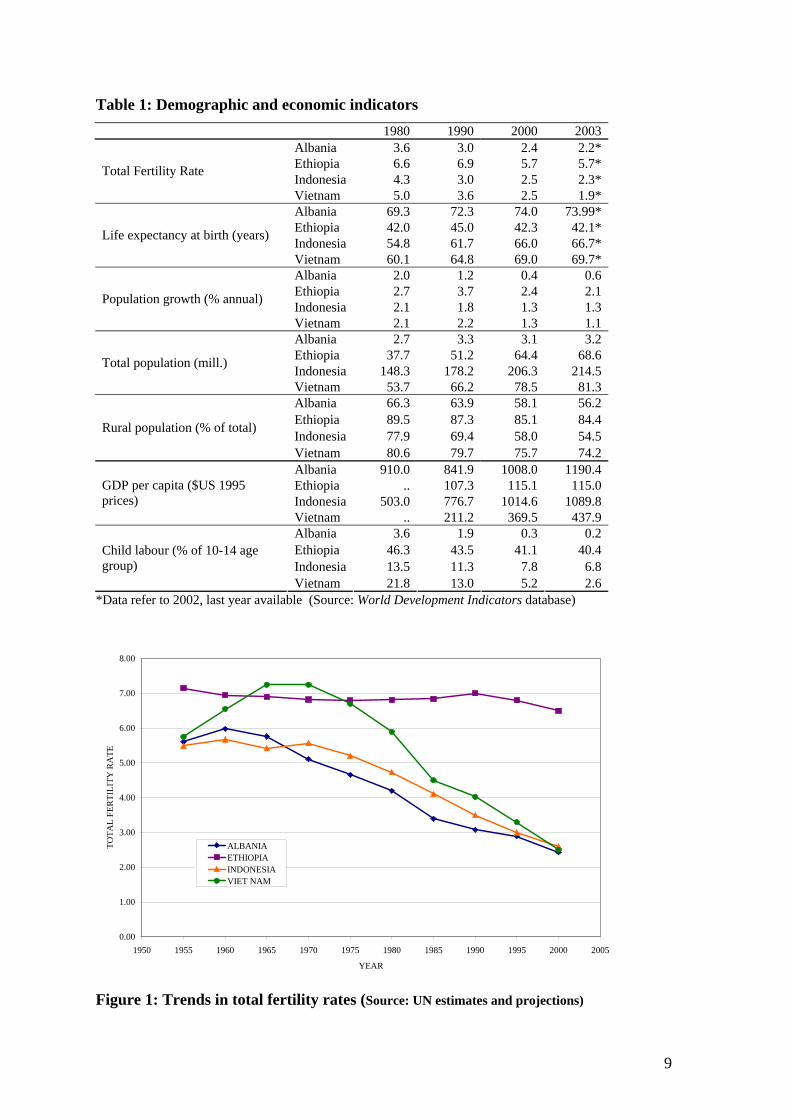
Table 1: Demographic and economic indicators 1980 1990 2000 2003
Albania 3.6 3.0 2.4 2.2* Ethiopia 6.6 6.9 5.7 5.7* Indonesia 4.3 3.0 2.5 2.3* Total Fertility Rate
Vietnam 5.0 3.6 2.5 1.9* Albania 69.3 72.3 74.0 73.99* Ethiopia 42.0 45.0 42.3 42.1* Indonesia 54.8 61.7 66.0 66.7* Life expectancy at birth (years)
Vietnam 60.1 64.8 69.0 69.7* Albania 2.0 1.2 0.4 0.6 Ethiopia 2.7 3.7 2.4 2.1 Indonesia 2.1 1.8 1.3 1.3 Population growth (% annual)
Vietnam 2.1 2.2 1.3 1.1 Albania 2.7 3.3 3.1 3.2 Ethiopia 37.7 51.2 64.4 68.6 Indonesia 148.3 178.2 206.3 214.5 Total population (mill.)
Vietnam 53.7 66.2 78.5 81.3 Albania 66.3 63.9 58.1 56.2 Ethiopia 89.5 87.3 85.1 84.4 Indonesia 77.9 69.4 58.0 54.5 Rural population (% of total)
Vietnam 80.6 79.7 75.7 74.2 Albania 910.0 841.9 1008.0 1190.4 Ethiopia .. 107.3 115.1 115.0 Indonesia 503.0 776.7 1014.6 1089.8
GDP per capita ($US 1995 prices)
Vietnam .. 211.2 369.5 437.9 Albania 3.6 1.9 0.3 0.2 Ethiopia 46.3 43.5 41.1 40.4 Indonesia 13.5 11.3 7.8 6.8
Child labour (% of 10-14 age group)
Vietnam 21.8 13.0 5.2 2.6 *Data refer to 2002, last year available (Source: World Development Indicators database)
0.00
1.00
2.00
3.00
4.00
5.00
6.00
7.00
8.00
1950 1955 1960 1965 1970 1975 1980 1985 1990 1995 2000 2005
YEAR
TOTA
L FE
RTI
LITY
RA
TE
ALBANIAETHIOPIAINDONESIAVIET NAM
Figure 1: Trends in total fertility rates (Source: UN estimates and projections)
9

annually, followed by slightly lower growth thereafter, though the growth has been
sustained. There has also been important structural adjustment following the collapse of
the communist regime, involving banking, land market, and privatization of strategic
sectors like telecommunications but also of small and medium enterprises. However,
Albania is by far the poorest country in Europe and is ranked only 65th of 177 countries
by the human development indicator of 2002 (Human Development Report 2003). Figure
1 indicates the decline in fertility which stood at 2.2 in 2003 (Human Development
Report 2003 on data of 2002), whereas the high life expectancy at birth (currently 74
years) is comparable with European countries. An important feature of Albania is the very
high level of emigration. Migration is the most common livelihood against poverty and an
important escape valve for unemployment. Albania has experienced a high internal
migration from rural to urban areas. Since 1990 about one fifth of the total population has
left the country and is living abroad mainly in Italy or Greece. As a result remittances are
estimated to account for about 13 percent of total income among Albanian households
(INSTAT, 2002). Despite the economic benefits of remittances, migration also implied
high social costs. According to INSTAT 2002 emigration was particularly evident among
males, whose population dropped over 20 percent between 1989 and 2001. In the last
decade emigration has deprived the country of the most active labour force5.
4 Data
Longitudinal surveys for less developed countries are still rare and certainly less
extensive than typical panel studies from developed countries. A particular challenge in
the study of fertility and poverty from a longitudinal perspective is that the surveys do
need adequate information on both. Demographic and Health Surveys (DHS) normally
contain extremely good information on fertility histories but little information to assess
poverty. For expenditure surveys, the problem is the opposite, in that demographic
information is often limited. The surveys selected for our studies contain information on
both aspects. In our dynamic analysis we concentrate on two selected waves. Some of the
surveys selected here have more than two waves. There is for instance one additional
wave for urban Ethiopia surveyed in 2000, and another wave surveyed for Indonesia in
5 Carletto, G., B. Devis, M. Stampini, Trento S. and Zezza A. (2004) and Uruçi, E. and I.Gedeshi,. (2003) for an analysis on internal mobility, international migration and remittances management in Albania. See
10

2000. However, Ethiopia was at war with neighbouring Eritrea from 1998 – 2000 and
Indonesia was rocked by the East-Asian financial crisis in mid 1997 (after the field work
of the second wave). Both events represent important shocks to the economies, and as a
result we have refrained from using these waves for our analysis. See Appendix 2 for
further details.
4.1.Poverty measurement
Since we are primarily interested in analysing fertility and household welfare for
households with subsistence level of income, we compare poor households with non-poor
households rather than treat expenditure as a continuous variable. Poverty status is
specified as a discrete state, and is derived from the more general FGT family of poverty
measures (Foster, Greer and Thorbecke, 1984). Let ν be the number of household
members, y be the household’s welfare indicator (per capita consumption) and let τ be the
poverty line. In population terms, the FGT index is defined as follows:
( )( )ν
νδαα E
yEFGT
)(= (1)
where E is the expectations operator and δα(y) is the function:
( )⎩⎨⎧
≥<−
=τττδ
α
α yyyy
if0 if/1)( (2)
and α ≥ 0 is the coefficient of poverty aversion. α = 0 gives the poverty headcount (the
proportion of individuals living in households below the poverty line) and α = 1 gives one
form of the poverty gap. It is the cost of making good the consumption shortfall of all
poor households, expressed as a proportion of aggregate “subsistence” income, τ E(ν).
The choice α = 2 is a common choice for a measure more strongly targeted on those in
deep poverty. For simplicity we focus here on the head count ratio.
The distribution of consumption expenditure within the household is unlikely to
be uniform across household members, and it is probable that children consume less than
adults. The standard solution is to impose an assumption on intra-household resources
allocation, and adjustment is done by applying an equivalence scale that is consistent with
World Bank report No. 36313-AL (2003) and Betti, G. (2003) for a detailed discussion on Albania poverty assessment.
11

the assumption made – producing a measure of expenditure per adult equivalent.
Unfortunately, there is limited consensus on the appropriate choice of equivalence scales,
and this is perhaps not surprising, since household allocation patterns may vary between
countries, regions and cultures. As a result of this official poverty statistics are frequently
based on per capita household income or expenditure, which in effect means that in terms
of household allocation, each household member is given equal weight. An implication of
this approach is that households with a large number of dependent children are more
likely to be recorded as being poor. In the present paper we maintain consistency with
official poverty statistics, and define poverty over per capita consumption expenditure6.
Clearly this assumption needs to be taken into account in interpreting the estimates.
We specify the poverty line τ using a ‘cost of basic needs’ approach following
Ravallion and Bidani (1994). In brief this involves estimating the cost of a certain
expenditure level which corresponds to a minimum calorie requirement. A food poverty
threshold is defined as the expenditure needed to purchase a basket of goods that will give
the required minimum calorie intake. Following FAO recommendations this threshold is
set 2288 calories for Albania, and 2100 calories for the other three countries7. The
general poverty line combines the food poverty threshold with an average non-food
consumption expenditure of those households whose food consumption level represents
the food poverty threshold. A quantitative comparison on the magnitude of poverty across
four countries is difficult due to the difference in the details regarding the adjustment for
food basket, reference group, and regional prices.8 Nevertheless, we use a poverty
measure consistent within each country so that we can compare the poverty dynamics in
the four countries at a qualitative level.
6 Equivalent scales can be estimated by using Engel coefficient as in Lanjouw and Ravallion (1995). Although estimating the effect of household size on Engel coefficient requires a range of assumptions on the consumption behaviour of household, the theoretical foundation is certainly an advantage. Another avenue for future research is to examine how sensitive the correlation between fertility and poverty is to the choice of equivalent scale. The weight on a child’s consumption relative to that on an adult and the scale of economy are two dimensions to be considered. 7 This is an average amount, and obviously the minimum amount depends on age, gender, and physical work of the individual. In other words, correct poverty thresholds should strictly speaking take this issue into account. However, in official poverty estimates this issue is often ignored, and the poverty threshold is instead based on an average calorie intake. 8 The poverty lines in ALSMS and VLSMS are constructed by the World Bank. The poverty line for Ethiopia is based on the World Bank Approach and controls for regional prices, including controls for urban and rural areas. The poverty line in IFLS is constructed so that the provincial poverty rates in IFLS2(1997) replicate those in Strauss et al (2004). Strauss et al (2004) construct provincial poverty lines adjusted for regional prices and change in food basket of the reference group.
12

4.2. Comparability issues
We take the household as the unit of analysis. Consequently fertility decisions are
implicitly assumed to be made at the household level, and as a result we concentrate on
the characteristics of the household and the household head in explaining poverty and
fertility patterns. The approach has a direct impact on the way the dependent variable is
defined in the econometric framework detailed in section 5 below. For the static analysis
this is taken to be the number of children living in the household. Thus it does not capture
the number of children that might have died or left the household. For the dynamic
analysis, the dependent variable is defined as the number of births occurring between the
two waves, controlling for household composition in the first wave.
Another issue concerns the time span between waves, which differs for the four
countries: in Vietnam the interval is five years apart, for Indonesia fours years, for
Ethiopia three years, and for Albania only two years. The implication is that the number
of recorded births and poverty transitions (i.e. number of births and poverty transitions)
will differ between countries. This affects the accuracy of the estimates, especially for
Albania where the interval between waves is only two years9, and this needs to be taken
into account when making the cross national comparison.
Some variables cannot be easily compared. This includes regions, religion and
ethnicity. Another difficulty concerns the activity status of the household head. In the
Ethiopian samples we have information about the activity status (i.e. farmer, civil servant
skilled worker and so on). In Vietnam and Albania, which follows the LSMS format we
have instead the occupational status. Despite our attempts in harmonizing the categories
in the four surveys, caution is needed when making interpretations of these variables. In
contrast, variables measuring the household’s human capital and potential income and
expenditure are similar.
5 Empirical analysis
Given the interaction between fertility and poverty, we first examine the effect of
poverty on fertility and second the effect of fertility on poverty. We do so by analysing
9 A fourth wave is planned for Albania, and is expected to be implemented in 2006.
13

both static and dynamic perspectives. Our econometric strategy consists of first
estimating a poisson model of children and a probit regression of poverty, respectively, in
the initial wave. These regressions provide a snapshot or a cross sectional view of the
pattern of poverty and fertility for the four countries. We then implement dynamic models
by estimating a poisson regression of the number of newborn children10 recorded between
waves. In contrast to the cross sectional regression this informs us about how the rate of
childbearing differs by background characteristics. Finally we estimate the rates of
poverty entry and exit. In order to avoid endogeneity issues, we control for background
variables that are recorded in the initial wave only.
Of interest for us is to capture the impact of those variables which reflects the
resources, or lack thereof, available to the household. We include detailed control for
educational attainment for which high levels normally reflects higher household income.
Educational attainment is captured by the years of schooling of the household head. In
addition we include control for the educational level of remaining household members.
These are implemented by simply counting the number of individuals who had more than
compulsory education, the number having just compulsory education, and the number of
individuals having less than the compulsory level. We also make control for the
profession of the household head, which is also likely to reflect household income. Farm
household is one of the activity status categories, and in so far the mode of farming is at a
primitive level, we would expect unambiguously higher demand for children among farm
households11.
5.1. Fertility: the static perspective
The cross sectional pattern of childbearing presented in Table 3 show no major
surprises. In all four countries poor households tend to have more children. The
correlation is strongest for Vietnam in terms of both magnitude and significance.
However, the magnitudes of the poverty status coefficients in the four countries do not
necessarily resemble the differences in average per capita income or total fertility rate as
depicted by the aggregate figures provided by Table 1, suggesting that cross-country
10 Newborn children refer to new children of the Household Head. 11 There is a literature considering the relationship between fertility and mode of farming. The argument is that if the farm is owned by the household head, and farming technology is primitive, generates an incentive for having more children since they provide cheap labour. However, in a system where the agricultural sector is owned by the state, and where farmers are merely employees, the demand for children will be reduced (See Bigsten et al 2004)
14

variation of income and fertility do not explain the differences in the correlation between
poverty incidents and number of children within each country.
Education and human capital accumulation is also important, though the estimates
are somewhat mixed. The strongest impact of education is for Vietnam, where high
education of the household head is associated with higher fertility. Of course, the
reference group includes here individuals with no education, and in Vietnam with an
extensive educational system, this is possibly a quite selected group. Indonesia shows
more of non-linear effect of education, whereas in Albania and Ethiopia the educational
level of the household head does not have a strong impact on the cross sectional pattern of
childbearing. Accumulated human capital of remaining household members shows a
negative trend. The higher education of the spouse or children, the lower is the overall
fertility. The Ethiopian pattern is in contrast to Vietnam and Albania, where investment
in children’s education seems to be negatively associated with the number of children.
Activity and occupational status of the household head are also important. Here
the reference group constitute the most vulnerable of households, which includes those
out of the labour force, single mothers, disabled and casual workers. In Ethiopia
households heads classified as managers, self-employed (running their own business),
civil servants, and farmers, all have higher number of children. There are of course
important rural/urban differences here, since farmers are prevalent in the rural areas, and
all the other activity statuses are associated with households living in urban areas. For
Vietnam and Albania only farm household have significantly higher fertility, whereas in
Indonesia we find little effect of activity status.
5.2. Childbearing: the dynamic perspective
Next we estimate the Poisson regression of number of newly born children
between two waves using household observable characteristics in the first wave as
regressors12. In contrast to the static perspective, this regression reflects differences in the
childbearing intensity. The results, presented in Table 4, tell us a different story from that
in the static framework. At a conventional level of significance, poor households in the
12 A potential problem concerns the identity of household head, which may change across waves, which will in turn have a direct impact on the recording of childbearing events. Fortunately this problem only applies to few households; these households are excluded from the analysis.
15

Table 3: Poisson regression of number of children in first wave (t-statistics in parenthesis) Albania Ethiopia Indonesia Vietnam Poverty status 0.155 0.246 0.247 0.331 (2.65) (7.72) (7.63) (11.33) Age of HH head 0.348 0.206 0.26 0.307 (12.24) (18.34) (24.91) (29.20) Age of HH head squared -0.005 -0.002 -0.003 -0.004 (-13.94) (19.09) (-26.87) (31.32) # adults -0.134 -0.024 -0.086 -0.008 (-2.88) (1.83) (-4.43) (0.47) HHH low education -0.042 0.043 0.096 0.126 (-0.2) (1.02) (2.54) (2.10) HHH medium education 0.253 0.015 0.074 0.204 (1.15) (0.29) (1.42) (3.47) HHH high education 0.228 -0.067 0.034 0.105 (0.94) (1.01) (0.61) (1.47) #post compulsory ed. -0.252 -0.023 -0.025 -0.078 (-4.39) (1.40) (-1.19) (4.74) #compulsory ed. 0.005 0.018 -0.021 -0.025 (0.1) (0.56) (-0.88) (1.05) HH head married 1.182 0.727 1.111 1.048 (6.32) (15.16) (15.76) (17.90) # generations 0.297 0.209 0.327 0.086 (4.0) (6.23) (10.65) (2.57) Activity status 1 0.198 0.099 -0.263 -0.020 (1.27) (1.88) (-1.99) (0.29) Activity status 2 0.134 0.474 0.073 -0.098 (0.81) (2.77) (1.49) (0.95) Activity status 3 0.16 0.251 0.091 -0.241 (0.92) (3.92) (1.73) (1.33) Activity status 4 0.256 -0.071 0.037 0.006 (0.89) (1.13) (0.82) (0.11) Activity status 5 0.066 0.246 -0.033 -0.153 (0.6) (2.71) (-1.05) (1.64) Activity status 6 0.177 0.088 0.104 (2.25) (0.75) (1.87) Farm household 0.138 0.146 -0.279 0.151 (1.9) (2.58) (-1.41) (4.44) Constant -7.461 -4.778 -5.716 -6.570 (-10.72) (17.33) (-24.23) (26.39) Observations 1503 2251 4497 4020
Regression includes control for ethnicity, religion and region.
16

first wave do not have more newborn children between two waves than non-poor
households in each of four countries. The result suggests that poor and non-poor
households tend to have similar spacing between birth events. The fact that wealthier
households have fewer children in general, which is clear from the static analysis, means
that childbearing careers for these women are on average shorter. Hotz et al (1997) argue
that in the absence of credit markets, households with a steeper income profile have an
incentive to space birth more widely. According to this argument, our estimates suggest
that the slopes of the income profiles for non-poor and poor households are similar13. But
a more plausible explanation concerns the issue of cost of fertility control. For instance,
non-poor households are more likely to have access to modern contraceptives than poor
households. But women in poor households may breastfeed for longer durations. Overall,
this may explain the similarity of birth hazards between poor and non-poor households.
Although this hypothesis needs more scrutiny in looking at the level of family planning
program and pattern of breastfeeding in four countries, the results in Table 4 together
with those in static framework suggest that poor households give births over a longer
period of time, favouring the hypothesis that poor households tend to have more children
due to imperfect birth control in the four countries under our study.
Though poverty status itself has little impact on the birth hazard, other variables
which certainly reflect the resource level of the household do. We consider first the work
ratios for men and women in Ethiopia. A high work ratio among men reflects an income
effect, and should be positively associated with childbearing. For women, a high work
ratio also reflects a higher opportunity cost of having children, and the negative impact
(though not significant) found for Ethiopia is consistent with this view. The fact that the
male work ratio does not have any impact on childbearing is somewhat unexpected.
Households where the head has very high educational level are less likely to have
children. Likewise, a high number of household members with post compulsory
education tend to have fewer children, and these estimates are all consistent with the
theoretical perspective. Thus, households with high human levels of human capital have a
lower birth hazard, and which reflects wider birth spacing. Of course, the proportion of
highly educated individuals is in general low in Ethiopia, and as such education cannot be
13 However, the different signs of the coefficients on poverty in Table 4 also suggest more investigation into income profile, composition of income, and access to credit market among poor and non-poor households in four countries.
17

considered an important factor in limiting fertility levels14. Nevertheless, these findings
do suggest that improving education and employment opportunities for women is a route
to control fertility. The activity status of the household head is also important, and here
we find that higher professional status is associated with higher fertility. We also find that
farm households are one of the groups with the highest propensity of having children.
Again the reference group is here those who are considered disadvantaged, such as those
without work or disabled.
To what extent are these estimates different in the other countries? For Indonesia
we find that the impact of the stock of children present in the household in the first wave
shows a similar pattern to that of Ethiopia. The work ratio of household members shows
however, a different pattern. In Indonesia, a high male work ratio is positively associated
with childbearing, which reflects an income effect, insignificant female work ratio, but a
strong negative impact of the child work ratio. This latter effect, which is not actually
significant for Ethiopia, is more complicated to explain. There are two important effects
at work here. First, if the level of investment on human capital of existing children
reflects the investment in all children, working children imply a lower investment on
children, and thereby a lower cost of having another child15. On the other hand,
households in which a large number of the children work, reflects a higher cost of having
further children in that older children may be less available for the caring of younger
children.
We find that farm households do not have a higher rate of childbearing compared
to the other household types, which is contrast to Ethiopia where farm households has one
of the highest propensities of childbearing. Another difference concerns the activity
statuses, which in Indonesia are negatively associated with childbearing. As for education
variables we find similarities with Ethiopia in that only those households with very high
levels are less likely to have children. In contrast, there is little impact of the human
capital accumulation of remaining household members.
Moving onto Albania and Vietnam we find poverty status to have more of a
positive impact on fertility, though only for Albania is the estimate found to be strong and
significant (at the 10 percent level). But for Albania the regression is in general poorly
defined, which is partly due to the interval between the waves (here only two years), and
the sample size is 1503 households, which limits the number of recorded birth events. The
14 Only about 20 percent of the population in Ethiopia are considered literate.
18

Table 4: Poisson regression of number of newborn children between waves (t-statistics in parenthesis) Albania Ethiopia Indonesia Vietnam Poverty status in wave 1 0.581 -0.013 -0.122 0.117 (1.8) (0.14) (-1.62) (1.50) Age of HH head -0.148 -0.043 -0.027 -0.055 (-7.18) (8.59) (-9.73) (14.34) #children 0 - 4 -0.035 0.329 0.116 0.071 (-0.16) (5.98) (2.67) (1.50) #children 5 - 9 0.036 0.079 -0.019 -0.191 (0.17) (1.63) (-0.47) (4.52) #children 10 - 14 -0.637 -0.042 -0.192 -0.219 (-2.01) (0.69) (-4.86) (3.91) Other children -0.044 0.025 0.047 0.113 (-0.06) (0.37) (1.00) (1.77) # adults -0.003 0.034 0.052 -0.053 (-0.01) (0.84) (1.32) (1.12) Male work ratio 0.909 0.008 0.377 0.776 (2.02) (0.04) (3.77) (5.14) Female work ratio 0.006 -0.309 -0.018 0.007 (0.02) (1.55) (-0.27) (0.06) Child work ratio -1.646 -0.103 -0.699 -0.908 (-0.89) (0.55) (-1.91) (4.48) HHH low education 0.431 -0.138 -0.007 -0.080 (0.4) (1.17) (-0.09) (0.62) HHH medium education 0.398 0.138 -0.107 -0.296 (0.35) (0.91) (-0.99) (2.25) HHH high education 1.26 0.417 -0.184 -0.280 (1.0) (1.95) (-1.62) (1.67) #post compulsory ed. -0.202 -0.289 0.051 -0.146 (-0.55) (4.02) (1.22) (3.02) #compulsory ed. 0.013 0.010 0.034 -0.007 (0.04) (0.10) (0.70) (0.10) HHH married 1.077 0.509 -0.007 0.074 (1.02) (3.03) (-0.07) (0.58) # generations -0.256 0.081 0.168 -0.082 (-0.67) (0.78) (2.65) (0.94) Activity status 1 -0.142 -0.089 0.008 0.343 (-0.16) (0.54) (0.04) (2.11) Activity status 2 -0.171 1.034 -0.392 0.121 (-0.21) (1.66) (-3.31) (0.39) Activity status 3 -0.598 0.247 -0.271 -0.216 (-0.53) (0.85) (-2.15) (0.43) Activity status 4 -13.138 0.093 -0.35 -0.160 (-0.01) (0.35) (-3.06) (0.91) Activity status 5 0.009 0.609 0.021 0.040 (0.02) (1.71) (0.30) (0.16) Activity status 6 0.063 0.711 0.020 (0.15) (2.39) (0.13) Farm household -0.428 0.698 -0.304 0.171 (-0.94) (3.78) (-1.02) (1.88) Constant -11.365 -1.134 -0.22 0.815 (-0.02) (2.22) (-0.97) (2.14) Observations 1503 2251 4497 4020
Regression includes control for ethnicity, religion and region.
15 Working children may have a direct income effect, but it seems here negligible.
19
only other variables which have a significant impact are the age of the household head,
the number of children aged between 10 and 14, which has a negative impact, and the
strong positive effect associated with the work ratio of men. Vietnam resembles Indonesia
in many respects. This includes the stock and age of the children present in the household,
the education variables, and also the work ratio variables. Overall these variables have
more explanatory power in the Vietnam sample. As for education we find that for
households in Vietnam, a high number of For instance we find that farm households in
Vietnam have a higher rate of childbearing, though one should bear in mind that the
classification of the activity statuses are somewhat different form Indonesia.
5.3. Poverty: the static perspective
We now focus on the effect of childbearing on poverty. The results of the probit estimates
of poverty status in the initial wave are given in Table 5. We start by considering the
effect of children, and their age distribution, on the likelihood of falling under the poverty
threshold. In the cross-sectional view, there are clearly positive correlations between
number of children and poverty incidents in all four countries. In addition, the results
suggest that age distribution of children matters. In Albania, Indonesia, and Vietnam, the
number of young children (age 0-4) is associated with higher poverty incidents, and the
correlation becomes smaller monotonically for a number of older children (age 5-9,
age10-14). In Ethiopia, however, the correlation is not monotonic although it is
significant for all age groups of children. The higher the ratio of working adults to the
total number of adults, the lower is the probability of being poor. Vietnam represents here
an exception in that these ratios have a positive sign (though not significant). This is
explained by the very high rates of work participation in Vietnam, which is close to 90
percent for both men and women. Thus, there are very few households that have low
work ratios, which are here reflected by the insignificance of the estimates. In contrast,
unemployment in Albania and urban Ethiopia is rife, and as a result the covariates
reflecting the work ratios distinguish the poor from the non-poor to a much greater extent.
For Ethiopia the child work ratio is negatively associated with poverty (though not
significant at the 5% level). Given that 40 percent of children in Ethiopia are recorded as
20
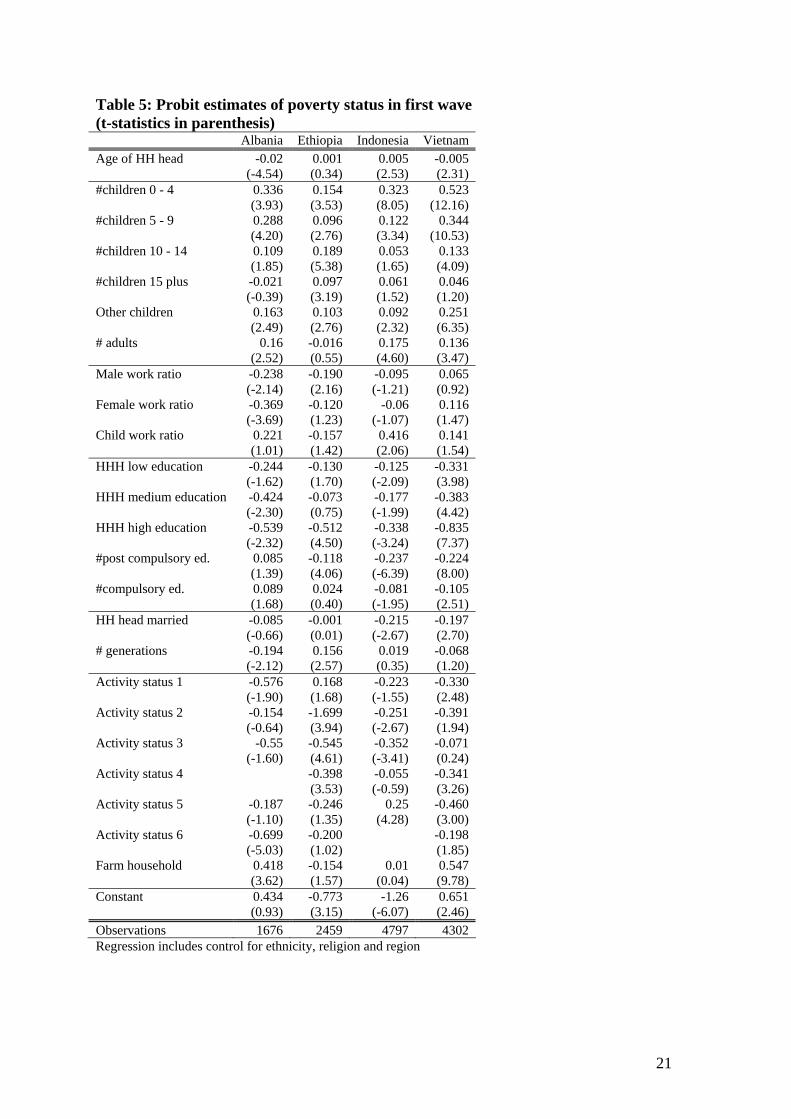
Table 5: Probit estimates of poverty status in first wave (t-statistics in parenthesis) Albania Ethiopia Indonesia Vietnam Age of HH head -0.02 0.001 0.005 -0.005 (-4.54) (0.34) (2.53) (2.31) #children 0 - 4 0.336 0.154 0.323 0.523 (3.93) (3.53) (8.05) (12.16) #children 5 - 9 0.288 0.096 0.122 0.344 (4.20) (2.76) (3.34) (10.53) #children 10 - 14 0.109 0.189 0.053 0.133 (1.85) (5.38) (1.65) (4.09) #children 15 plus -0.021 0.097 0.061 0.046 (-0.39) (3.19) (1.52) (1.20) Other children 0.163 0.103 0.092 0.251 (2.49) (2.76) (2.32) (6.35) # adults 0.16 -0.016 0.175 0.136 (2.52) (0.55) (4.60) (3.47) Male work ratio -0.238 -0.190 -0.095 0.065 (-2.14) (2.16) (-1.21) (0.92) Female work ratio -0.369 -0.120 -0.06 0.116 (-3.69) (1.23) (-1.07) (1.47) Child work ratio 0.221 -0.157 0.416 0.141 (1.01) (1.42) (2.06) (1.54) HHH low education -0.244 -0.130 -0.125 -0.331 (-1.62) (1.70) (-2.09) (3.98) HHH medium education -0.424 -0.073 -0.177 -0.383 (-2.30) (0.75) (-1.99) (4.42) HHH high education -0.539 -0.512 -0.338 -0.835 (-2.32) (4.50) (-3.24) (7.37) #post compulsory ed. 0.085 -0.118 -0.237 -0.224 (1.39) (4.06) (-6.39) (8.00) #compulsory ed. 0.089 0.024 -0.081 -0.105 (1.68) (0.40) (-1.95) (2.51) HH head married -0.085 -0.001 -0.215 -0.197 (-0.66) (0.01) (-2.67) (2.70) # generations -0.194 0.156 0.019 -0.068 (-2.12) (2.57) (0.35) (1.20) Activity status 1 -0.576 0.168 -0.223 -0.330 (-1.90) (1.68) (-1.55) (2.48) Activity status 2 -0.154 -1.699 -0.251 -0.391 (-0.64) (3.94) (-2.67) (1.94) Activity status 3 -0.55 -0.545 -0.352 -0.071 (-1.60) (4.61) (-3.41) (0.24) Activity status 4 -0.398 -0.055 -0.341 (3.53) (-0.59) (3.26) Activity status 5 -0.187 -0.246 0.25 -0.460 (-1.10) (1.35) (4.28) (3.00) Activity status 6 -0.699 -0.200 -0.198 (-5.03) (1.02) (1.85) Farm household 0.418 -0.154 0.01 0.547 (3.62) (1.57) (0.04) (9.78) Constant 0.434 -0.773 -1.26 0.651 (0.93) (3.15) (-6.07) (2.46) Observations 1676 2459 4797 4302 Regression includes control for ethnicity, religion and region
21

working (see Table 1), this indicates that child labour is indeed an important economic
resource for the households and is likely to be important in preventing poverty. Of course,
it is not necessarily the case that child labour should have a negative sign with respect to
poverty. It can be the case that households are forced to make their children work if they
face extreme poverty. If this is the case, then the child work ratio may in fact be
positively associated with poverty. This seems to be the case for Indonesia, where the
coefficient is positive and significant. We also know that during the nineties, child labour
has been on the decline in Indonesia, and is considerably lower than in Ethiopia. This
suggests that children tend to work because they are poor in Indonesia (less than 3% of
children are working).
Another very important predictor for poverty is accumulated human capital. The
overall picture is that high education is associated with a lower probability of being poor,
and in most cases there is monotonic gradient: the higher the level, the lower the poverty.
The only discrepancy to this pattern is in Ethiopia, where we find those with medium
level education not to have a lower poverty rate than those without any education.
However, those with high education have a significant lower rate of poverty. As for
human capital accumulation of remaining household members, we also find a negative
association. In particular, high proportions of individuals with post-compulsory education
are strongly associated with lower poverty. The variables do not distinguish poor from
non-poor in Albania. The reason is that the level of individuals completing compulsory
education is very high. Moreover, a considerable amount of these individuals tend to go
beyond the 8 years of compulsory education.
Finally we move on to the role of activity and occupational status. Households
where the head is either classified as a manager, self employed, skilled manual workers,
or other types of professionals, tend to have a lower chance of poverty. For farm
households the picture is somewhat more complex. For Vietnam and Albania we find that
farmers are significantly poorer than the other categories. The effect is particularly
pronounced in Vietnam. In Indonesia, in contrast we find no differential effects for farm
households. A possible explanation for this is that the great majority of farm households
in Indonesia hold a higher share of ownership (average household share of ownership is
92%.), and over the last two decades farming in Indonesia has seen steady reforms that
has increased productivity and efficiency. Though the raw data indicates that poverty is
slightly higher among farmers (20%) than non-farmers (17%), other regressions (not
shown here) also indicate that poor farmers tend to be less educated and are
22
geographically concentrated. Thus, net of education and regional dummies, we cannot
find that farmers are poorer than non-farmers.
More interesting is perhaps the negative (though not significant) effect for farm
households in Ethiopia. This might at first seem surprising and non-intuitive, but it is
important to bear in mind that the reference group includes casual workers, female headed
household, and those out of the labour force, or disabled. A large part of those households
in the reference group are located in urban areas, where we know poverty is almost as
high as in rural areas. Comparing farm households with those of the other activity
statuses, we do find that they tend to be poorer. Especially those classified as managers or
running a self employed business (activity status 1 and 2 respectively) tends to have much
lower rates of poverty.
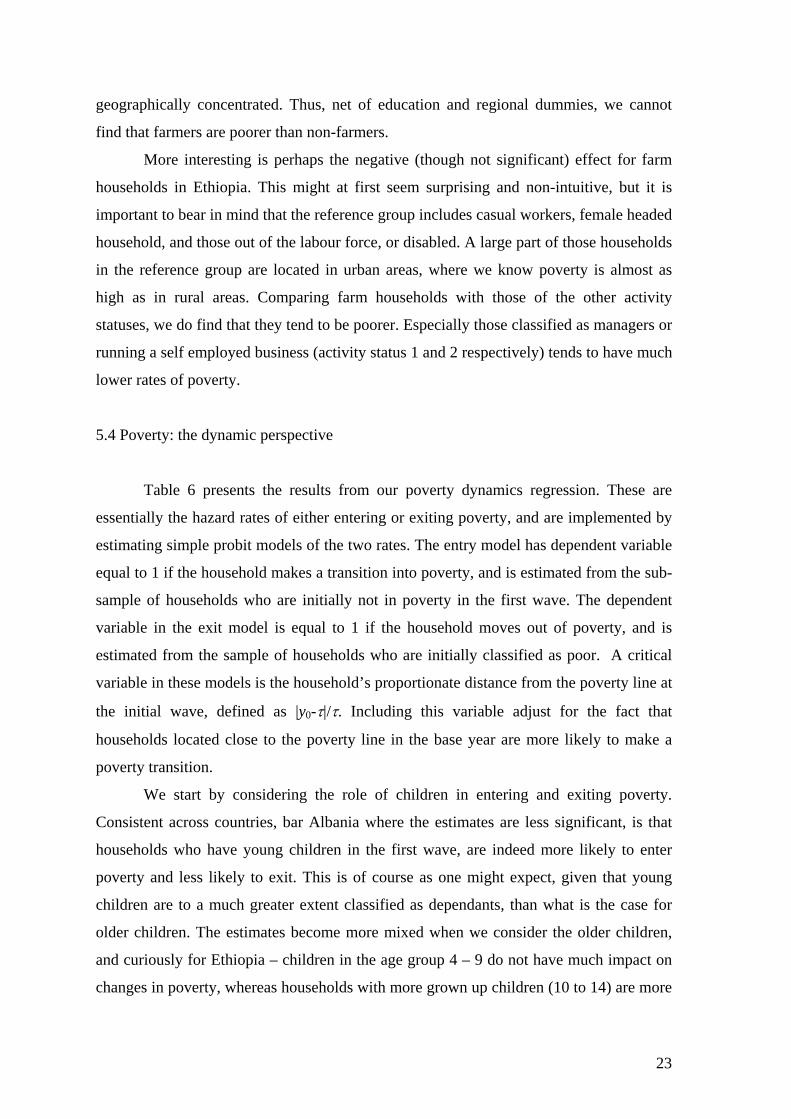
5.4 Poverty: the dynamic perspective
Table 6 presents the results from our poverty dynamics regression. These are
essentially the hazard rates of either entering or exiting poverty, and are implemented by
estimating simple probit models of the two rates. The entry model has dependent variable
equal to 1 if the household makes a transition into poverty, and is estimated from the sub-
sample of households who are initially not in poverty in the first wave. The dependent
variable in the exit model is equal to 1 if the household moves out of poverty, and is
estimated from the sample of households who are initially classified as poor. A critical
variable in these models is the household’s proportionate distance from the poverty line at
the initial wave, defined as |y0-τ|/τ. Including this variable adjust for the fact that
households located close to the poverty line in the base year are more likely to make a
poverty transition.
We start by considering the role of children in entering and exiting poverty.
Consistent across countries, bar Albania where the estimates are less significant, is that
households who have young children in the first wave, are indeed more likely to enter
poverty and less likely to exit. This is of course as one might expect, given that young
children are to a much greater extent classified as dependants, than what is the case for
older children. The estimates become more mixed when we consider the older children,
and curiously for Ethiopia – children in the age group 4 – 9 do not have much impact on
changes in poverty, whereas households with more grown up children (10 to 14) are more
23

likely to experience poverty than the middle group. Interestingly a similar pattern seems
evident for Albania, where households with many older children have significantly lower
exit rates. A possible explanation behind this is that many of these older children are in
the school leaving age and therefore entering the labour market. Unemployment is high
both in Albania and Ethiopia (especially in urban areas) and youth wages are in any case
very low. Unemployment is lower both in Vietnam and Indonesia. Overall the results
suggest that women’s productivity, working time and childcare arrangement associated
with young children may play an important role in explaining the relationship between
fertility and poverty in Indonesia and Vietnam. On the other hand, the lack of child labour
market or a low wage for child labour (opportunity cost of schooling) seems to be related
to the causal links between poverty and fertility in Albania and Ethiopia.
We consider next the work ratios of men, women and children, all of which
representing measures of the extent household members contribute to the overall level of
resources in the household. As the estimates for Vietnam suggests - a high male work
ratio does not always reflect lower poverty. We would of course expect the opposite
effects in so far an increase in the ratio of working men implies an increase in the
disposable household income. A simple tabulation of poverty rates for households with
different numbers of working men (not shown here) reveals indeed that households with
one or more non-working male household members have lower poverty. These
households are characterised by a higher age of the household head, and a higher
educational attainment. It seems though that in Vietnam, male household members might
retire from work if they consider that the household can afford such an arrangement.
We also find interesting results for the child work ratios. In Ethiopia child labour
significantly reduces poverty entry as well as increasing the exit rate. Given that the rate
of child labour in Ethiopia is around 40 percent, it is clear that this is an important
contribution to the household resources, and thereby reducing the likelihood of poverty.
There are similar effects for Vietnam, though the magnitude of the estimates is more
modest. In Indonesia, the estimates are not significant, whereas for Albania child labour is
associated with a lower exit rate. Of course, child labour in Albania is generally very low,
but the estimate suggests that some household may encourage child labour as a result of
economic hardship, which is reflected by the lower exit rates. Overall it seems clear that
child labour is an important source of income for Ethiopia and Vietnam, but not for
Albania and Indonesia given that Albania and Indonesia have a higher income per person
on average (see Table 1). This, in turn, suggests a possibility of poverty trap in Ethiopia
24

and Vietnam where poor household tend to have more children, and lack of investment on
human capital lead to poverty (Moav 2005).
Education and human capital accumulation of household members are important
predictors for poverty dynamics. In general high educational level of the household head
is associated with lower transition into poverty, but if entering poverty, they have a higher
exit rate. The same relationship is evident when considering the number of household
members with post compulsory and compulsory education: the higher the number the
lower is the transition rate into poverty and the higher is the exit rate. The education
variables are particularly important for Indonesia and Vietnam, whereas they appear less
important for Ethiopia.
Finally we consider the role of activity status and farming. As can be seen from
Table 6 many of the estimates relating to the activity statuses are missing. This is
especially the case for Albania where we have a relatively small number of observations.
Moreover, the missing observations are most prevalent for those variables measuring a
high professional status, and in practice none of these household heads are defined as
being in poverty in the first wave. As a result we are unable to estimate the transition
rates. However, looking across the estimates for the various waves we find rather mixed
results, and it is difficult to discern a common pattern.
Moving onto farm households, we see rather differing results across countries.
Interestingly we find that farm households Ethiopia are more likely to exit poverty
compared to many of the other categories. This is explained by the fact that poverty in
rural Ethiopia fell between 1994 and 199716, whereas in urban areas the poverty rates
increased slightly. Though poverty fell sharply in Vietnam from 1993 to 1997, it did so in
a disproportionate fashion by benefiting urban areas more than rural areas.
This is reflected in the poverty transition regression, where we see that farm household
have a higher entry and lower exit rate. In Indonesia, in contrast, there is no significant
difference in poverty transitions for farm households compared to other groups.
16 This decline in poverty among farmers during the period has been attributed to particularly good harvests (see Bigsten et al and Dercon et al)
25

Table 6: Poverty dynamics - entry into and exit from poverty - probit estimation (t-statistics in parenthesis) Albania Ethiopia Indonesia Vietnam Enter Exit Enter Exit Enter Exit Enter Exit Age of HH head -0.014 -0.016 0.002 -0.002 0.005 -0.008 -0.012 0.001 (-2.41) (-1.59) (0.47) (0.63) (2.02) (-1.74) (2.90) (0.39) #children 0 - 4 0.045 -0.193 0.124 -0.093 0.194 -0.173 0.178 -0.259 (0.34) (-1.24) (1.81) (1.50) (3.73) (-2.22) (1.95) (5.35) #children 5 - 9 0.018 -0.194 0.013 -0.031 0.062 -0.193 -0.189 -0.040 (0.17) (-1.6) (0.24) (0.62) (1.32) (-2.71) (2.41) (1.06) #children 10 - 14 0.105 -0.24 0.151 -0.095 -0.05 0.037 -0.126 0.025 (1.27) (-2.06) (2.83) (1.90) (-1.20) (0.59) (1.83) (0.60) Other children -0.02 0.035 0.112 -0.042 0.057 -0.002 0.010 -0.057 (-0.2) (0.27) (1.96) (0.83) (1.11) (-0.03) (0.13) (1.23) #men 0.13 0.012 0.006 -0.053 0.100 -0.057 0.098 -0.083 (1.39) (0.1) (0.14) (1.21) (1.99) (-0.78) (1.48) (1.83) #women -0.011 -0.197 -0.094 -0.056 0.063 -0.122 0.139 -0.031 (-0.11) (-1.67) (1.97) (1.33) (1.13) (-1.59) (2.13) (0.69) Male work ratio -0.068 -0.643 -0.111 0.074 -0.245 -0.024 0.315 0.172 (-0.44) (-2.7) (0.83) (0.59) (-2.48) (-0.15) (2.20) (1.65) Female work ratio 0.105 -0.189 0.008 -0.211 -0.052 0.107 -0.086 -0.078 (0.8) (-0.84) (0.06) (1.46) (-0.71) (0.93) (0.58) (0.72) Child work ratio -0.259 -0.903 -0.310 0.486 0.038 -0.334 -0.266 0.231 (-0.76) (-2.27) (1.84) (3.15) (0.13) (-0.92) (1.41) (1.98) HHH low education -0.137 0.144 -0.096 -0.172 -0.100 -0.014 -0.199 0.232 (-0.69) (0.47) (0.86) (1.60) (-1.31) (-0.12) (1.28) (2.20) HHH medium edu. -0.011 0.147 0.176 -0.136 -0.195 0.381 -0.340 0.334 (-0.04) (0.38) (1.19) (0.98) (-1.72) (2.11) (2.07) (3.05) HHH high education -0.29 1.152 -0.456 -0.046 -0.268 0.52 -0.963 0.415 (-0.83) (1.5) (2.83) (0.26) (-2.07) (2.08) (3.95) (2.68) #post compulsory ed. -0.217 0.086 -0.007 0.025 -0.152 0.083 -0.179 0.235 (-2.21) (0.69) (0.15) (0.59) (-3.19) (1.11) (3.36) (6.50) #compulsory ed. 0.064 -0.003 -0.101 0.052 -0.028 0.04 -0.071 0.171 (0.87) (-0.03) (1.04) (0.62) (-0.53) (0.50) (0.94) (3.22) HHH married -0.424 -0.22 -0.075 -0.289 -0.27 -0.026 -0.031 0.204 (-2.46) (-0.74) (0.68) (2.50) (-2.76) (-0.15) (0.23) (2.11) # generations -0.004 0.112 0.072 0.055 0.108 0.028 -0.096 0.143 (-0.04) (0.51) (0.81) (0.60) (1.57) (0.26) (0.90) (1.85) Activity status 1 0.188 -0.108 0.361 0.141 0.145 (0.44) (-0.61) (1.09) (0.54) (0.71) Activity status 2 0.023 -0.363 0.148 0.028 -0.202 0.301 (0.06) (1.06) (1.23) (0.15) (0.53) (0.95) Activity status 3 -0.448 -0.200 0.322 0.008 -0.097 0.022 (-0.86) (1.23) (1.72) (0.06) (-0.469 (0.04) Activity status 4 -0.101 -0.617 0.060 0.161 -0.002 -0.065 0.234 (-0.16) (3.71) (0.33) (1.31) (-0.01) (0.34) (1.39) Activity status 5 -0.284 1.022 0.087 0.336 0.239 0.063 -0.577 0.428 (-1.0) (2.31) (0.34) (1.25) (3.22) (0.53) (1.56) (1.31) Activity status 6 -0.331 1.229 0.396 0.893 -0.233 0.122 (-1.79) (2.91) (1.49) (3.14) (0.93) (0.76) Farm household 0.281 -0.128 0.033 0.495 0.153 0.2 0.522 -0.186 (1.82) (-0.52) (0.23) (3.75) (0.50) (0.42) (4.61) (2.23) Distance to poverty line 0.00 -0.005 -0.001 -0.011 -0.002 -0.01 0.000 -0.025 (2.02) (-1.78) (2.95) (6.72) (-7.85) (-3.72) (0.36) (6.34) Constant -0.985 2.75 0.698 -0.585 -1.155 1.788 -0.143 0.994 (-1.5) (2.5) (2.24) (1.36) (-4.389 (4.01) (0.29) (2.53) Observations 1286 384 1164 1293 3937 860 1890 2404
Regression includes control for ethnicity, religion and region.
26

6 Discussion and concluding remarks
The existence of longitudinal information at household level for these countries
facilitates highly interesting case studies, in which poverty dynamics can be studied in
conjunction with demographic changes at the household level. The great majority of past
studies have considered poverty from a static perspective. Studies concerned with the
dynamic side of poverty are few, and none of these have explicitly considered the link
with fertility behaviour. Our analysis shows that the relationship between fertility and
poverty is a complex one and certainly not uniform across countries. The four countries
included in this study vary greatly in terms of the demographic and economic transition.
Ethiopia is by far the poorest country and has still low economic growth and a persistent
degree of poverty. Indonesia and Vietnam have made great strides in boosting economic
activity and thereby reducing poverty. At the same time these countries have experienced
sharp declines in fertility rates. Though economic growth undoubtedly had an important
contributing factor to this fertility decline, it is also the case that during the same period
these countries have experienced great improvements in access to family planning. It is
useful at this point to summarise what we can infer from our estimation results.
For Ethiopia most of the results are consistent with economic development theory.
The number of children, both very young ones and older ones, is positively associated
with poverty. However, an important finding is that the number of working children plays
an important role in alleviating poverty. Interestingly, the dynamic analysis of fertility
showed that poor households in Ethiopia do not have a higher birth hazard than non-poor
households. Rather, the birth hazard seems to be driven by human capital variables, and
occupation – in particular whether the household was in the agriculture sector or not. As
such, high fertility in Ethiopia is largely a phenomenon related to rural communities,
which constitutes around 85 percent of the population. There are two important
characterising factors of the agriculture sector: 1) farming technology is highly primitive
and therefore labour intensive, and 2) access to family planning is extremely poor17. Both
are crucial factors in maintaining the high fertility rate, and several studies have reported
that the problem of unmet need is substantial in rural Ethiopia. However, given the central
role of child labour in reducing poverty, it is clear that there are also important demand
side incentives in place. Overall, our analysis shows that both improved labour market
27

and educational opportunities and improvements in family planning – preferably both –
should have a substantial impact on reducing poverty in Ethiopia.
From being a very poor country back in the seventies and the early eighties,
Indonesia has seen tremendous economic growth, followed by important structural
changes of the economy, which is reflected by the massive rural/urban migration –
reducing the numbers of households being involved in labour intensive farming and
giving farmers private ownership. School enrolment has been steadily increasing, child
labour declining, and family planning substantially improved. These changes have
obvious implications for the role of children and parents’ fertility choices, and are
reflected in our analysis. In contrast to Ethiopia we found that farm households do not
have more children than non-farm households and that child labour is positively related to
poverty, suggesting that only very poor households use child labour a “last resort” to cope
with financial distress. As a result, there is little to suggest from our results that
Indonesian households choose to have a high quantity of children as a means to boost
household resources, and thereby reducing poverty risk. If anything, the trend seems to be
the opposite.
Many of the features relevant for Indonesia are also present for Albania, whereas
Vietnam is at a stage between Indonesia and Ethiopia. Though economic growth has also
been strong in Vietnam over recent years, it is clear the country lags behind Indonesia
significantly, and there is not a similar level of urban migration, implying a continued
importance of the agricultural sector.
Though there is still a significant difference between farmers and non-farmers in terms of
poverty, it is also clear that farm households benefited significantly from the economic
boom. Is this then the main cause behind the fertility decline? On the basis of our analysis
of Indonesia, Vietnam and Albania one might be tempted to make such a conclusion.
However, one important distinguishing implemented starting already back in the sixties.
For Vietnam in particular, it is clear that
feature of these countries is the role of family planning, which were gradually fertility had
been on the decline for several years prior to the economic boom that started in the late
nineties.
17 The contraceptive prevalence rate in rural Ethiopia is as low as 4 percent, whereas in urban areas it is round 45 percent.
28

Though our analysis reveals that the poverty/fertility relationships tend to be
complex, it is also the case that there are certain important commonalities. Perhaps the
most important one is the role of human capital. In particular we find that the educational
level of the household head is almost always negatively associated with poverty. Often,
though not always, do we find accumulation of educational levels of household members
to have a similar effect. But there are differences in magnitude, and we find that
education has the lowest impact on fertility and poverty in Ethiopia. This is either because
there is generally low return to education in Ethiopia, or, it is due to the fact that the
majority has very low education – rendering the educational variables to distinguish
differences in poverty and fertility. We also find that presence of young children is
associated with higher poverty rates, which is the case for all countries.
Based on the insight of Indonesia, Vietnam, and Albania – to what extent can we
expect poverty and fertility decline in Ethiopia in the future? Unfortunately there are
several elements of Ethiopian society that is likely to impede a similar development. The
all important difference is that the other countries have a long history of investment in
education and family planning, both of which were a result of communist policies.
Together with recent market reforms and improving land tenure rights, Indonesia,
Vietnam and Albania seems to have had the appropriate foundations for reducing poverty
and fertility. It seems clear that a similar replication in Ethiopia is going to be more
difficult, and will certainly require long term commitments in more than one area of
societal developments.
29

References
Aassve, A., Burgess, S. and C. Propper (2003a) Modelling poverty transitions as the outcome of employment, family unions, and childbearing decisions in the United Kingdom, Department of Economics, University of Leicester, mimeo.
Aassve, A., Mazzuco, S., Mencarini, L. (2005), Childbearing and wellbeing: A comparative Analysis of Welfare Regimes in Europe, Journal of European Social Policy, vol.15, n.3, 2005.
Admassie, A. (2002), Explaining the High Incidence of Child Labour in Sub-Saharan Africa, African Development Review, 14(2):251 – 275.
Bane, M. J. and D. Ellwood (1986). Slipping into and out of Poverty: The Dynamics of Spells. Journal of Human Resources 21:1-23.
Baulch, B. and Hoddinott, J. (Eds.) (2000) Economic mobility and poverty dynamics in developing countries, Journal of Development Studies, Vol 36(6).
Becker, G. and H. G. Lewis (1973), "On the Interaction between the Quantity and Quality of Children," Journal of Political Economy, 81(2), Part 2, Mar-Apr, S279-S288.
Betti, G. (2003). Poverty and Inequality Mapping in Albania: Final Report, Washington, DC and Tirana, World Bank and INSTAT (mimeo).
Bigsten, A., B. Kebede, and A. Shimeles, (2003), “Growth and Poverty Reduction in Ethiopia: Evidence from household Panel Surveys”, World Development, 31(1): 87 – 106.
Birdsall, N. M. and C. C. Griffin (1988) Fertility and Poverty in Developing Countries, Journal of Policy Modeling, Vol. 10(1), 29-55.
Birdsall, N.A.C. Kelley and S. W. Sinding (2001) Population Matters: Demographic Change, Economic Growth, and Poverty in the Developing World, Oxford University Press, Oxford, Part III. Fertility, Poverty, and the Family.
Carletto, G., B. Devis, M. Stampini, Trento S. and Zezza A. (2004), “Internal Mobility and International Migration in Albania”, ESA Working Paper No. 03-13, Agriculture and Development Economics Division, FAO
Cerioli, A. and S. Zani, (1990), “A fuzzy approach to the measurement of poverty”, In C. Dagum and M. Zenga (eds), Income and Wealth Distribution, Inequality and Poverty, Studies in Contemporary Economics, Springer Verlag, Berlin.
Cheli, B. and G. Betti, (1999) Fuzzy analysis of poverty dynamics on an Italian pseudo panel 1984 – 1994, Metron 57:83-103.
Dercon, s. (2004) Growth and Shocks: evidence from Rural Ethiopia, Journal of Development Economics, vol 74 (2): 309-29.Dercon, S. and P. Krishnan (2000) Vulnerability, Seasonality and Poverty in Ethiopia, Journal of Development Studies, Vol.:36(6).
Easterlin, Richard A., and Eileen M. Crimmins (1985). The Fertility Revolution, Chicago, the United States, The University of Chicago Press.
Falaris, E.M. (2003) The effect of survey attrition in longitudinal surveys: evidence from Peru, Côte d’Ivoire and Vietnam, Journal of Development Economics, 70:133-157.
30

Foster, James, Greer, Joel and Thorbecke, Erik, (1984) "A Class of Decomposable Poverty Measures," Econometrica, Econometric Society, vol. 52(3), 761-66.
Glewwe, P., M. Gragnolati, and H. Zaman, (2001), “Who gained from Vietnam’s boom in the 1990s? An analysis of poverty and inequality trends, World Bank working paper.
Hotz, V. J., J. Klerman, and R. Willis (1997), "The Economics of Fertility in Developed Countries," in Handbook of Population and Family Economics, M. Rosenzweig and O. Stark, eds., Elsevier Science, 276-348.
Huff Stevens, A. (1999). Climbing out of poverty, falling back in: measuring the persistence of poverty over multiple spells. Journal of Human Resources 34(3):557-588.
INSTAT, 2002. The Population of Albania in (2001): Main Results of the Population and Housing Census. Tirana, INSTAT.
Jalan, J. and M. Ravallion, (2000), Is transient poverty different? Evidence for rural China, Journal of Development Studies, Vol.: 36(6)
Jenkins, S (2000) Modelling Household Income Dynamics. Journal of Population Economics 13 (4).
Justino, P. and J. Litchfield, (2003), “Welfare in Vietnam during the 1990s: Poverty, Inequality and Poverty Dynamics, PRUS Working paper No. 8.
Kedir, A. and A. McKay (2004) Chronic Poverty in Urban Ethiopia: Panel Data , Evidence, mimeo, University of Leicester, UK.
Kinfu, Y. (2000) Below-Replacement Fertility in Tropical Africa? Some Evidence from Addis Ababa, Journal of Population Research, 17(1): 63-82.
Lanjouw, P. and M. Ravallion, (1995), “Poverty and Household Size”, The Economic Journal, 105(433): 1415 – 1434.
Lillard, L., (1993), Simultaneous Equations for Hazards, Journal of Econometrics, Vol:56 (189 – 217).
Lindstrom, D. and B. Berhanu, (1999), “The impact of war, famine, and economic decline on marital fertility in Ethiopia, Demography, 36(2):247 - 261
Lipton, M. (1998), Successes in Anti Poverty, International Labor Organization, Geneva.
Livi-Bacci, M. and G. de Santis (1998) Population and Poverty in the Developing World, Clarendon Press, Oxford.
Mcculloch, N. and Baulch, B., (2000), Stimulating the impact of policy upon chronic and transitory poverty in rural Pakistan, Journal of Development Studies, Vol.: 36(6)
McNicoll, G. 1997. "Population and poverty: A review and restatement." Policy Research Division Working Paper No. 105. New York: Population Council.
Mencarini, L (1999), "An Analysis of Fertility and Infant Mortality in South Africa based on 1993 LSDS data", in Pre-conference proceedings of Third African Population Conference, African Population in the 21st Century, Durban, Sudafrica il 6-10 Dicembre 1999, UAPS, Dakar, Senegal, 1999, pp.109-128.
Moav, Omer (2005). “Cheap Children and the Persistence of Poverty”, The Economic Journal, 115, 88-110.
31

Muffels RJA (2000) “Dynamics of poverty and determinants of poverty transitions: results from the Dutch socioeconomic panel” in Rose D. (ed.), Researching social and economic change. The use of household panel studies, Routledge, London and New York.
Panis, C. and Lillard, L. (1995) “Child mortality in Malaysia: Explaining Ethnic Differences and the recent decline”, Population Studies, 49:463 – 478.
Ravallion M. (1996), Issues in measuring and modelling poverty, The Economic Journal, v.106, n.438, 1328-1343.
Ravallion, M. and Bidani, B. (1994) "How Robust Is a Poverty Profile?", World Bank Economic Review, Oxford University Press, vol. 8(1), 75-102.
Rose D. (ed.). Researching social and economic change. The use of household panel studies, Routledge, New York.
Rosenbaum, Paul T. and Donald B. Rubin (1983) The Central Role of the Propensity Score in Observational Studies for Causal Effects. Biometrika, 70(1): 41-55.
Schoumaker, B and D. Tabutin, (1999), Relationship between poverty and fertility in Southern countries. Knowledge, methodology and cases, WP.2, Dept of science of population and development, Université catholique de Louvain.
Shoumaker, B. (2003) Paper presented at the Population Association of America Meeting.
Sibanda, A. Z. Woubalem, D. P. Hogan, and D. P. Lindstrom, (2003), “The proximate determinants of the decline to below-replacement fertility in Addis Ababa, Ethiopia, Studies in Family Planning, 34(1):1 – 7.
Strauss, J., Beegle, K., Dwiyanto, A., Herawati, Y., Pattinasarany, D., Satriawan, E., Sikoki, B., and Witoelar , F. (2004). Indonesian Living Standards Before and After the Financial Crisis: Evidence from the Indonesia Family Life Survey, RAND Corporation, Santa Monica, U.S.A.
Uruçi E. and Gedeshi, I. (2003). Remittances management in Albania, Working Papers 5/2003,CeSPI, Rome.
UNDP (2003) Human Development Report 2003 Millennium Development Goals: A compact among nations to end human poverty
United States National Research Council. (1986) Rapid Population Growth and Economic Development: Policy Questions. Washington DC: National Academy Press.
Willis, Robert J. (1973). ``A New Approach to to the Economic Theory of Fertility Behavior", Journal of Political Economy, 81(2), part 2, Mar.-Apr., S14-S64.
World Bank (2003). “Albania: Poverty Assessment”, Report No. 26213-AL, Washington, DC
32

Appendix I: The surveys A1.I The Ethiopian Urban and Rural Household Surveys
The EUHS and the ERHS are two distinct panel surveys, but designed with the
aim of comparability between them. As a result the questionnaires were almost identical.
The urban surveys have been collected in collaboration with Michigan State University
and University of Gothenburg; the rural surveys were conducted in cooperation with the
Centre for the Study of African Economies (CSAE) at Oxford and the International Food
Policy Research Institute (IFPRI). We use information from the waves starting in 1994 up
to 1997, which implies three waves of urban sample and four waves from the rural
sample. Both surveys interviewed 1500 households in each wave. The panel includes
useful information concerning demographics (household composition, religion, ethnicity,
migration), employment and income (wages, hours worked, sector of employment and
occupation), business income (own account worker, income from female business
activity, income from child labour activities), assets and remittances and pension income
(see further information in Kedir and McKay, 2004; Bigsten et al 2003). An important
drawback of the surveys is that they do not include complete fertility histories. This has
important implications for the way we implement our fertility analysis.
A1.II The Albanian Living Standards Measurement Survey (ALSMS)
The ALSMS is made up of three waves (2002, 2003 and 2004). The first survey
was conducted in 2002, using a sample of 3,600 households. The panel component,
however, includes less than 1,800 households. The sample is drawn from 450
enumeration areas, and in each of them eight households was selected. Household
membership is defined as not having been away from the household for more than six
months. The survey is of the standard LSMS format. It includes information on
consumption expenditure, income, migration, health, education, employment, and fertility
histories. However, the survey does not include consumption expenditure in the waves 2
and 3, which impacts the way we define poverty status in this sample. The first wave
contains complete fertility histories, whereas waves 2 and 3 provide additional
information on any new births (through a household roster).
33

A1.III The Indonesian Family Life Survey (IFLS)
The IFLS consists of three waves in total, IFLS1 conducted in 1993/94, IFLS2
and IFLS2+ in 1997 and 1998, respectively, whereas IFLS3 in 2000. IFLS2+ included a
25% sub-sample of IFLS2 and was specifically aimed at capturing the effects of the
financial crisis in Indonesia at the end of 1997. The survey has been conducted by RAND
Corporation in collaboration with UCLA and Lembaga Demografi, University of
Indonesia. The sample is representative of about 83% of the Indonesian population and
contains over 30,000 individuals living in 13 of the 27 provinces in the country. IFLS1
has 7,224 households, and subsequent waves targeted all the split-off households as well
as all the original households previously interviewed. Over 90 percent of original sample
from 1993 has been re-interviewed in the second and third waves of IFLS. The survey
contains a wealth of information collected at the individual and household levels,
including multiple indicators of economic well-being such as consumption, income, and
assets. It also includes information on education, migration, labour market outcomes,
marriage, fertility, and contraceptive use. It also contains information about health,
relationships among co-residents and non-co-resident family members and inter-
generational mobility.
A1.IV The Vietnam Living Standards Measurement Survey (VLSMS)
The first Living Standard Measurement Survey in Vietnam was conducted in
1992/93 and included 4800 households. The second survey was conducted in 1997/98,
and included 6000 households, whereas more than 4300 household from the first survey
were re-interviewed. Both surveys are nationally representative. The attrition rate is low
and the overall quality is very good (see Falaris 2003, for details). The survey follows the
LSMS format and just like the Albanian LSMS, includes rich information on education,
employment, fertility and marital histories, together with rich information on household
income and consumption expenditure. Community questionnaires were administered to
rural regions only.
34
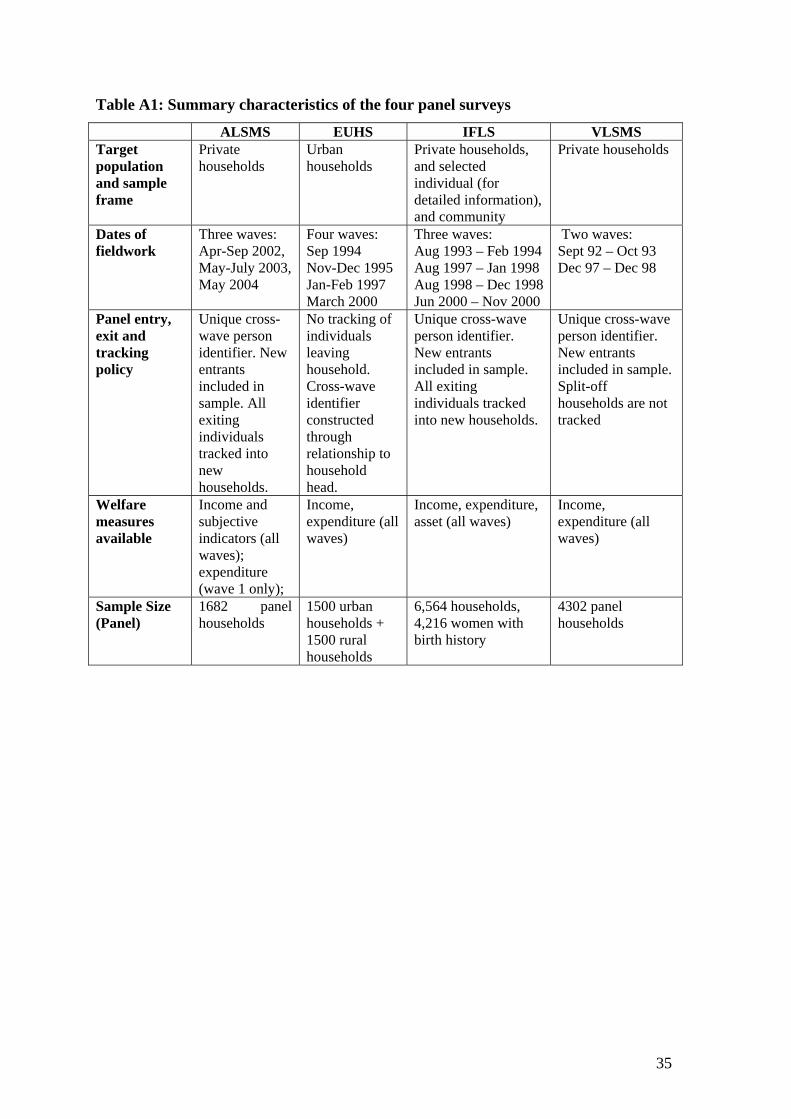
Table A1: Summary characteristics of the four panel surveys
ALSMS EUHS IFLS VLSMS Target population and sample frame
Private households
Urban households
Private households, and selected individual (for detailed information), and community
Private households
Dates of fieldwork
Three waves: Apr-Sep 2002, May-July 2003, May 2004
Four waves: Sep 1994 Nov-Dec 1995 Jan-Feb 1997 March 2000
Three waves: Aug 1993 – Feb 1994 Aug 1997 – Jan 1998 Aug 1998 – Dec 1998 Jun 2000 – Nov 2000
Two waves: Sept 92 – Oct 93 Dec 97 – Dec 98
Panel entry, exit and tracking policy
Unique cross-wave person identifier. New entrants included in sample. All exiting individuals tracked into new households.
No tracking of individuals leaving household. Cross-wave identifier constructed through relationship to household head.
Unique cross-wave person identifier. New entrants included in sample. All exiting individuals tracked into new households.
Unique cross-wave person identifier. New entrants included in sample. Split-off households are not tracked
Welfare measures available
Income and subjective indicators (all waves); expenditure (wave 1 only);
Income, expenditure (all waves)
Income, expenditure, asset (all waves)
Income, expenditure (all waves)
Sample Size (Panel)
1682 panel households
1500 urban households + 1500 rural households
6,564 households, 4,216 women with birth history
4302 panel households
35

36
Appendix 2: Data quality assessments
There are always serious concerns about data quality and the four surveys vary
considerably in this respect. For example, although they all include information on
household composition that can be used to track birth events, the Ethiopian survey does
not have separate fertility histories. Another issue concerns the reporting of the timing of
childbearing events. For the Ethiopian sample fertility events have to be constructed on
the basis of the reported age of the children (and the age of the mother). In the other
surveys, date of births are given, though it is clear that when asked for the month of the
birth a substantial fraction of the sample is unable to provide reliable answers. All four
surveys give some reason for concern over reported ages and year of births.
Many respondents are unable to report their year of birth but are able to give their age.
However, the distributions of reported age suggest some measurement error, in the form
of ‘heaping’: age is often reported only to the nearest five years. The four panels of
Figure A1 give an indication of the varying degrees of age misreporting (for household
heads at wave 1) in the four countries. It is apparent that high degrees of misreporting are
particularly evident in Ethiopia, which has a relatively weak system of birth registration,
and in Indonesia.
One of the advantages of longitudinal surveys is that they give an opportunity to
assess the accuracy of responses, by comparing answers to questions which are repeated
across waves and which should, in principle, generate the same answer. Date of birth is a
critical example. The question on year of birth is not repeated in the Ethiopian survey but
Table A2 reports the frequency of between-wave discrepancies in the year of birth in
different waves for Albania, Indonesia and Vietnam. Discrepancies of more than one year
are rare for Albania (1%), more serious for Vietnam (2.6%) and still more serious for
Indonesia (7.5%). Accurate timing of events is important for demographic research, so it
is important to bear in mind this source of measurement error.
Table A2: Internal consistency of repeat responses on year of birth
Albania Indonesia Vietnam Proportion with no discrepancy 90.1% 80.1% 90.7% Proportion with 1-year discrepancy 9.0% 12.4% 6.5% Proportion with 2-year discrepancy 0.4% 3.7% 1.6% Proportion with discrepancy of 3+ years 0.6% 3.8% 1.1%

37
01
23
4P
erce
nt
15 20 25 30 35 40 45 50 55 60 65 70 75 80 85 90 95Age of the household head
02
46
8P
erce
nt
15 20 25 30 35 40 45 50 55 60 65 70 75 80 85 90 95Age of the HHH
Ethiopia 1994 Albania 2002
01
23
4P
erce
nt
15 20 25 30 35 40 45 50 55 60 65 70 75 80 85 90 95Age of HHH93 in 1993
01
23
4Pe
rcen
t
15 20 25 30 35 40 45 50 55 60 65 70 75 80 85 90 95Age of the household head
Vietnam 1992-3
Indonesia 1993-4
Figure A1 Heaping in the age distributions