Ferrovial, S.A. and Subsidiaries · Balance at 31/12/10 147 3,022 -679 2,705 5,195 1,434 6,629 2009...
108
Free translation of the Consolidated Financial Statements for 2010 and 2009 and explanatory notes originally issued in Spanish. In the event of a discrepancy, the Spanish language version prevails. Ferrovial, S.A. and Subsidiaries Board of Directors 22 February 2011 Consolidated Financial Statements 2010
Transcript of Ferrovial, S.A. and Subsidiaries · Balance at 31/12/10 147 3,022 -679 2,705 5,195 1,434 6,629 2009...

Free translation of the Consolidated Financial Statements for 2010 and 2009 and explanatory notes originally issued in Spanish. In the event of a discrepancy, the Spanish language version prevails.
Ferrovial, S.A. and Subsidiaries
Board of Directors 22 February 2011
Consolidated Financial Statements 2010

Consolidated financial statements for 2010 and 2009 Ferrovial S.A. and Subsidiaries
Ferrovial, S.A. Consolidated financial statements at 31 December 2010 2
CONSOLIDATED STATEMENTS OF FINANCIAL POSITION FOR 2010, 2009 AND 2008....................................................... 3
CONSOLIDATED INCOME STATEMENTS FOR 2010 AND 2009......................................................................................... 4
CONSOLIDATED STATEMENTS OF COMPREHENSIVE INCOME FOR 2010 AND 2009 ........................................................ 5
CONSOLIDATED STATEMENTS OF CHANGES IN EQUITY FOR 2010 AND 2009 ................................................................ 5
CONSOLIDATED CASH FLOW STATEMENTS FOR 2010 AND 2009 .................................................................................. 6
NOTES TO THE CONSOLIDATED FINANCIAL STATEMENTS FOR 2010............................................................................. 7
1 COMPANY ACTIVITIES AND SCOPE OF CONSOLIDATION ........................................................................................ 7
2 SUMMARY OF THE MAIN ACCOUNTING POLICIES .................................................................................................. 8
3 MANAGEMENT OF FINANCIAL RISKS AND CAPITAL .............................................................................................. 17
4 SEGMENT REPORTING ....................................................................................................................................... 23
5 GOODWILL AND ACQUISITIONS ......................................................................................................................... 28
6 INTANGIBLE ASSETS.......................................................................................................................................... 31
7 INVESTMENTS IN INFRASTRUCTURE PROJECTS................................................................................................... 33
8 PROPERTY, PLANT AND EQUIPMENT................................................................................................................... 38
9 INVESTMENTS IN COMPANIES ACCOUNTED FOR USING THE EQUITY METHOD...................................................... 39
10 NON-CURRENT FINANCIAL ASSETS..................................................................................................................... 41
11 DERIVATIVE FINANCIAL INSTRUMENTS AT FAIR VALUE ....................................................................................... 42
12 NON-CURRENT ASSETS AND LIABILITIES CLASSIFIED AS HELD FOR SALE............................................................. 46
13 INVENTORIES.................................................................................................................................................... 47
14 TRADE AND OTHER RECEIVABLES ...................................................................................................................... 48
15 EQUITY............................................................................................................................................................. 49
16 DEFERRED INCOME ........................................................................................................................................... 53
17 PROVISIONS AND PENSION SURPLUS ................................................................................................................. 53
18 OTHER PROVISIONS .......................................................................................................................................... 57
19 NET CASH POSITION ......................................................................................................................................... 58
20 OTHER NON-CURRENT LIABILITIES .................................................................................................................... 74
21 TRADE AND OTHER PAYABLES............................................................................................................................ 74
22 TAX MATTERS ................................................................................................................................................... 75
23 CONTINGENT LIABILITIES, CONTINGENT ASSETS AND OBLIGATIONS................................................................... 79
24 FAIR VALUE ADJUSTMENTS................................................................................................................................ 82
25 IMPAIRMENT AND DISPOSALS OF NON-CURRENT ASSETS AND OTHER NON-RECURRING EFFECTS......................... 82
26 OPERATING REVENUE........................................................................................................................................ 84
27 STAFF COSTS .................................................................................................................................................... 84
28 FINANCIAL RESULTS.......................................................................................................................................... 85
29 NET PROFIT OR LOSS FROM DISCONTINUED OPERATIONS .................................................................................. 86
30 EARNINGS PER SHARE ....................................................................................................................................... 86
31 CASH FLOW ...................................................................................................................................................... 86
32 REMUNERATION OF THE BOARD OF DIRECTORS ................................................................................................. 87
33 SHARE OPTION PLANS ....................................................................................................................................... 92
34 INFORMATION ON TRANSACTIONS WITH RELATED PARTIES ............................................................................... 93
35 DIRECTORS’ OWNERSHIP INTERESTS IN, POSITIONS OR FUNCTIONS AT IN COMPANIES ENGAGING IN AN ACTIVITY THAT IS SIMILAR OR COMPLEMENTARY TO THAT OF FERROVIAL .......................................................... 96
36 AUDITORS’ FEES ............................................................................................................................................... 97
37 EVENTS AFTER THE REPORTING PERIOD ............................................................................................................ 97
38 COMMENTARIES ON APPENDICES....................................................................................................................... 98

Consolidated financial statements for 2010 and 2009 Ferrovial S.A. and Subsidiaries
Ferrovial, S.A. Consolidated financial statements at 31 December 2010 3
CONSOLIDATED STATEMENTS OF FINANCIAL POSITION FOR 2010, 2009 AND 2008 Million euro
Assets Note 2010 2009 2008
Non-current assets 35,465 36,048 32,900
Goodwill 5 5,032 6,952 5,400
Intangible assets (1) 6 97 45 63
Investments in Infrastructure Projects 7 21,512 23,621 21,839
Investment in infrastructure projects (1) 64 77 92
Property, plant and equipment (1) 8 552 669 620
Investments in companies accounted for using the equity method 9 3,110 262 286
Non-current financial assets 10 2,184 1,935 1,524
Infrastructure project receivables 1,344 874 827
Available-for-sale financial assets 34 33 4
Restricted cash and other non-current financial assets 551 554 290
Other receivables 255 474 402
Pension surplus 17 0 22 76
Deferred tax assets 22 2,068 1,604 1,859
Derivative financial instruments at fair value 11 847 861 1,139
Assets classified as held for sale 12 1,515 1,802 4,278
Current assets 6,306 6,150 6,626
Inventories 13 445 489 498
Trade and other receivables 14 3,161 3,181 3,626
Trade receivables for sales and services 2,558 2,844 3,226
Other receivables 755 604 617
Current tax assets 58 22 25
Provisions -210 -290 -242
Cash and cash equivalents 19 2,701 2,480 2,502
Infrastructure project companies 694 1,050 892
Restricted cash 44 351 204
Other cash and cash equivalents 649 699 689
Other companies 2,007 1,430 1,610
Total Assets 43,287 43,999 43,804
Equity and Liabilities Note
Equity 15 6,628 4,719 4,098
Equity attributable to the equity holders 5,194 3,102 1,801
Equity attributable to non-controlling interests 1,434 1,617 2,296
Deferred income 16 196 232 250
Non-current liabilities 28,596 29,751 29,146
Provisions for pensions 17 153 503 131
Other long-term provisions 18 860 954 708
Bank borrowings 19 21,511 23,368 22,413
Debt securities and borrowings of infrastructure projects 19,566 21,115 19,741
Bank borrowings of other companies 1,944 2,253 2,672
Other payables 20 154 136 118
Deferred tax liabilities 22 3,951 3,454 3,458
Derivative financial instruments at fair value 11 1,968 1,336 2,319
Liabilities classified as held for sale 12 891 1,647 3,163
Current liabilities 6,975 7,650 7,147
Bank borrowings 19 1,530 1,937 1,552
Debt securities and borrowings of infrastructure projects 1,415 1,540 845
Bank borrowings of other companies 116 397 708
Trade and other payables 21 4,889 5,194 5,142
Trade payables 3,906 4,121 4,183
Current tax liabilities 264 216 167
Other non-trade payables 720 858 792
Operating provisions 18 556 519 452
Total Equity and Liabilities 43,287 43,999 43,804
The intangible assets, property, plant and equipment and investment property used in infrastructure projects are included under “Investments in Infrastructure Projects”. The accompanying Notes 1 to 38 are an integral part of the consolidated financial statements at 31 December 2010.

Consolidated financial statements for 2010 and 2009 Ferrovial S.A. and Subsidiaries
Ferrovial, S.A. Consolidated financial statements at 31 December 2010 4
CONSOLIDATED INCOME STATEMENTS FOR 2010 AND 2009 2010 2009
Note Before fair value
adjustments
Fair value adjustments
(*)
Total 2010
Before fair value
adjustments
Fair value adjustments
(*)
Total 2009
Revenue 12,169 0 12,169 12,232 0 12,232
Other operating revenue 17 0 17 30 0 30
Total operating revenue 26 12,186 0 12,186 12,262 0
12,262
Materials consumed 1,486 0 1,486 1,487 0 1,487
Other external expenses 1,596 0 1,596 1,645 0 1,645
Staff costs 27 3,422 0 3,422 3,423 0 3,423
Change in operating provisions 174 1 175 172 1 174
Other operating expenses 2,992 0 2,992 2,939 2 2,941
Total operating expenses 9,671 1 9,672 9,667 3 9,670
GROSS PROFIT FROM OPERATIONS 2,516 -1 2,514 2,595 -3 2,591
Depreciation and amortisation charge 1,000 0 1,000 1,005 0 1,005
Profit from operations before impairment and non-current asset disposals
1,516 -1 1,514 1,590 -3 1,587
Impairment and disposals of non-current assets 25 740 1,139 1,879 -620 -90 -710
Profit from operations 2,256 1,138 3,393 969 -93 876
Finance income of infrastructure projects 19 0 19 45 0 45
Finance expenses of infrastructure projects -1,543 0 -1,543 -1,446 0 -1,446
Gains and losses on derivative financial instruments and other fair value adjustments
0 -48 -48 0 -148 -148
Financial result of infrastructure projects -1,524 -48 -1,572 -1,402 -148 -1,550
Finance income of other companies 153 0 153 122 0 122
Finance expenses of other companies -275 0 -275 -226 0 -226
Gains and losses on derivative financial instruments and other fair value adjustments
0 -31 -31 0 98 98
Financial result of other companies -122 -31 -153 -103 98 -5
Financial result 28 -1,646 -79 -1,725 -1,505 -50 -1,555
Share of profits of companies accounted for using the equity method
53 8 62 69 16 85
Consolidated profit or loss before tax 663 1,067 1,730 -467 -127 -594
Income tax 22 -44 129 85 84 41 125
Consolidated profit or loss from continuing operations
619 1,196 1,815 -383 -86 -469
Net profit or loss from discontinued operations 29 0 0 0 0 0 0
Consolidated profit or loss for the year 619 1,196 1,815 -383 -86 -469
Loss for the year attributable to non-controlling interests
38 310 348 334 61 395
Profit or loss for the year attributable to the Parent 657 1,506 2,163 -48 -25 -74
Net earnings per share attributable to the Parent 30
Basic 3.67 -0.12
Diluted 3.67 -0.12 (*) Relating to gains and losses arising from changes in the fair value of derivatives, other financial assets and liabilities, and asset and liability impairment (see Note 24). The accompanying Notes 1 to 38 are an integral part of the consolidated financial statements at 31 December 2010.

Consolidated financial statements for 2010 and 2009 Ferrovial S.A. and Subsidiaries
Ferrovial, S.A. Consolidated financial statements at 31 December 2010 5
CONSOLIDATED STATEMENTS OF COMPREHENSIVE INCOME FOR 2010 AND 2009
Million Euro Note 2010 2009
Attributable to the Parent 15 2,163 -74
Attributable to non-controlling interests 15 -348 -395
Consolidated comprehensive income for the year 1,815 -469
Income and expense recognised directly in equity before tax: 234 350
Hedges -218 690
Other companies -199 698 Held for sale 4 -67 Companies accounted for using the equity method -23 59
Defined benefit plans 63 -544
Translation differences 389 204
Taxes 17 -348
Attributable to the Parent 240 135 Attributable to non-controlling interests 11 -132 Income and expense recognised directly in equity 250 2
Attributable to the Parent 2,403 61 Attributable to non-controlling interests -338 -528 Total income and expense recognised in the year 2,066 -466
CONSOLIDATED STATEMENTS OF CHANGES IN EQUITY FOR 2010 AND 2009
2010
(Million Euro) Share capital
Share premium
Treasury shares
Other reserves
Accumulated profit/loss
Attributable to equity holders
Attributable to non-
controlling interests
Total equity
Balance at 01/01/10 147 3,022 -1,028 845 2,986 1,570 4,556
Changes in accounting policies -4 119 116 48 164
Restated balance at 01/01/10 147 3,022 -1,032 965 3,102 1,617 4,719
Consolidated profit or loss for the year 2,163 2,163 -348 1,815
Income and expense recognised in equity 240 240 11 250 Income and expense recognised in the year 240 2,163 2,403 -338 2,066
Dividends paid -308 -308 -76 -385
Capital increases/reductions 130 130
Transactions with owners -308 -308 53 -255
Changes in the scope of consolidation and other changes
113 -115 -2 101 99
Balance at 31/12/10 147 3,022 -679 2,705 5,195 1,434 6,629
2009
(Million Euro) Share capital
Share premium
Treasury shares
Other reserves
Accumulated profit/loss
Attributable to equity holders
Attributable to non-
controlling interests
Total equity
Balance at 01/01/09 140 193 -72 -1,190 2,684 1,756 2,206 3,962
Changes in accounting policies 47 47 90 137
Restated balance at 01/01/09 140 193 -72 -1,190 2,731 1,803 2,296 4,099
Consolidated profit or loss for the year -74 -74 -395 -469 Income and expense recognised in equity 135 135 -132 2
Income and expense recognised in the year 135 -74 61 -528 -466
Dividends paid -281 -281 -103 -384
Capital increases/reductions 166 166
Impact of merger 7 2,829 72 -1,464 1,443 -160 1,283
Transactions with owners 7 2,829 72 -1,746 1,162 -96 1,065 Changes in the scope of consolidation and other changes
0 23 53 76 -55 21
Balance at 31.12.09 147 3,022 -1,032 965 3,102 1,618 4,719
The accompanying Notes 1 to 38 are an integral part of the consolidated financial statements at 31 December 2010.

Consolidated financial statements for 2010 and 2009 Ferrovial S.A. and Subsidiaries
Ferrovial, S.A. Consolidated financial statements at 31 December 2010 6
CONSOLIDATED CASH FLOW STATEMENTS FOR 2010 AND 2009
Note
2010
2009
Profit or loss for the year attributable to the Parent 2,163 -74
Adjustments for: 495 2,790
Non-controlling interests -348 -395
Depreciation and amortisation charge and provisions 1,175 1,179
Results of companies accounted for using the equity method -62 -85
Results on financing 1,711 1,536
Tax -85 -125
Work on non-current assets -17 -30
Fair value adjustment less costs to sell -1,879 710
Other losses and gains
Income taxes paid -81 -49
Change in receivables, payables and other -116 -145
Dividends from infrastructure project companies received 44 10
Cash flows from operating activities 31 2,505 2,534
Investments in property, plant and equipment and intangible assets -127 -205
Investments in infrastructure projects -1,972 -1,626
Investments in non-current financial assets -69 -6
Divestment of infrastructure projects 148 1,561
Divestment of non-current financial assets 1,124 473
Cash flows from investing activities 31 -895 197
Cash flows before financing activities 1,609 2,730
Proceeds from capital and non-controlling interests 134 178
Payment of dividends to shareholders of the Parent -315 -284
Payment of dividends to non-controlling interests of investees -82 -105
Other changes in shareholders’ equity 0
Cash flows from shareholders and non-controlling interests -263 -211
Interest paid -1,344 -1,398
Interest received 45 55
Increase in bank borrowings 4,435 5,426
Decrease in bank borrowings -4,100 -6,720
Change in borrowings held for sale 189 -16
Cash flows from financing activities 31 -1,038 -2,864
Change in cash and cash equivalents 19 571 -133
Cash and cash equivalents at beginning of year 2,480 2,502
Cash and cash equivalents at end of year 2,699 2,480
Effect of foreign exchange rate changes on cash and cash equivalents -170 -112
Change in cash and cash equivalents held for sale 522 1
Note: The changes in restricted cash at long term, which in prior years was included as a cash flow from investments in non-current assets, was netted of from “Increase in bank borrowings”, as it is cash that is restricted to secure a debt, and not an investing activity in the true sense.
The accompanying Notes 1 to 38 are an integral part of the consolidated financial statements at 31 December 2010.

Consolidated financial statements for 2010 and 2009 Ferrovial S.A. and Subsidiaries
NOTES TO THE CONSOLIDATED FINANCIAL STATEMENTS FOR 2010 1. Company activities and scope of consolidation 1.1 Company activities The consolidated Ferrovial Group (“Ferrovial”) comprises the Parent Ferrovial, S.A. and its subsidiaries, which are detailed in Appendix I. Its registered office is at calle Príncipe de Vergara 135, Madrid. Through these companies, Ferrovial engages in the following lines of business, which are its primary reporting segments pursuant to IAS 14.
a. Construction and execution of all types of public and private works in Spain and abroad, operating basically through Ferrovial Agromán, S.A., the company that heads this business division. Notable are the international business carried on in Poland through Budimex, S.A. and its investees, the leading construction group in that market, which is listed on the Warsaw stock market and in which the Group holds a 59.06% ownership interest and the business carried on in the United States (Texas) through the Webber Group, which is wholly owned by Ferrovial.
b. Toll roads. This activity consists of the development,
financing, construction and operation of toll road projects through Cintra Infraestructuras, S.A., in which Ferrovial, S.A. holds a 100% ownership interest.
c. Airports. This activity consists of the development,
financing and operation of airports, basically through BAA plc, a UK company that operates −through its investees− six airports in the United Kingdom and other airport assets; Ferrovial, S.A. has an ownership interest of 55.87% in BAA plc.
d. Services. This division is headed by Ferrovial Servicios,
S.A. and is divided into the following activities: a) Upkeep and maintenance of infrastructure, buildings and facilities (through Amey, Plc in the UK and Ferroser Infraestructuras, S.A. and Ferrovial Servicios, S.A. in Spain); b) Urban services and waste treatment (basically through Cespa, S.A.).
In addition to the description of Ferrovial’s activities and for the purposes of understanding these financial statements, it should be noted that a significant part of the business carried on by the Toll roads, Airports and Services Divisions consists of the development of infrastructure projects. These projects are conducted mainly in the Toll roads and Services areas under long-term contracts where the concession holder, in which the Group generally has interest together with other partners, finances the construction or upgrade of public
infrastructure and which fall within the scope of application of IFRIC 12 “Service Concession Arrangements”. Unlike the above, in most cases involving airports, licenses are of an indefinite nature which is why, although IFRIC 12 is not applicable, the arrangements are very similar to concession arrangements. Accordingly, and in order to aid understanding of the Group’s financial performance, these financial statements present separately the impact of projects of this nature on both non-financial non-current assets ( “Investments in Infrastructure Projects” includes the property, plant and equipment, intangible assets and investment property assigned to these projects) and non-current financial assets, borrowings and cash flows.
1.2 Other changes in the scope of consolidation
The main changes in the scope of consolidation in 2010 were
as follows:
Toll road business: on 5 October Cintra Infraestructuras
reached an agreement to sell 10% of its interest in the share
capital of the toll road concession holder 407 ETR in Toronto,
Canada, for CAD 894 million (approximately EUR 640 million).
The retained ownership interest, 43.23% of that company’s
share capital, is initially measured at fair value as stipulated in
IAS 27 in relation to the loss of control of a subsidiary and was
subsequently accounted for using the equity method. Additionally, on 15 September 2010 Cintra Infraestructuras
completed the sale of 60% of its equity interest in Cintra Chile,
a company that operates five stretches of Chilean toll roads,
for EUR 229 million. The ownership interest retained, 40% of
the shares of Cintra Chile, is accounted for using the equity
method and is initially measured at fair value as set forth in
IAS 27 in relation to the loss of control of a subsidiary.
Furthermore, the buyer and seller established cross call and
put option on that percentage of ownership retained. Services business: on 28 June Amey plc, a Ferrovial subsidiary,
completed the sale of its 66.6% holding in Tube Lines Limited,
the concession holder in the concession for the maintenance
and renovation of certain London underground lines. The
transaction price was GBP 207 million.
Amey continues to provide support services for the
management of the maintenance of the above-mentioned lines
to Tube Lines Limited, under terms that are very similar those
existing previously.
In order to operate in the United Kingdom, Ferrovial Servicios,
through the joint venture formed by its subsidiaries Cespa and
Amey −namely AmeyCespa− completed the purchase of

Consolidated financial statements for 2010 and 2009 Ferrovial S.A. and Subsidiaries
Ferrovial, S.A. Consolidated financial statements at 31 December 2010 8
Dickerson Group and its investee Donarbon, specialising in
waste treatment and management. The transaction totalled
GBP 49 million (EUR 59 million). Airports business: during the year, BAA sold certain non-
strategic assets, specifically, its interest in Naples airport, the
retail business in the United States and the 50% ownership
interest in APP, which manages various investment properties
in the United Kingdom. Ferrovial has also initiated the process
to sell 10% of its ownership interest in its subsidiary, BAA. This
process is at the initial stage, and at the date of preparation of
these financial statements there was no significant information
in this connection. 2. Summary of the main accounting policies
2.1 Basis of presentation
The accompanying financial statements were obtained from the Company’s accounting records and are presented in compliance with the regulatory financial reporting framework applicable to the Company and, accordingly, present fairly the Company’s equity, financial position and results of operations. The regulatory framework is that provided for in International Financial Reporting Standards (IFRSs) approved by Regulation (EC) no. 1606/2002 of the European Parliament and of the Council of 19 July 2002. 2.1.a) Restatement and changes in accounting policies Ferrovial has started to apply IFRIC 12 “Service Concession Arrangements”, which came into force in 2009 and which is mandatory for years beginning on or after 1 January 2010.
Under IFRIC 12, concessions may be accounted for using
either the intangible asset model or the financial asset model
(or a combination of the two). In Ferrovial’s case, the majority
of the concessions relate to intangible assets. The impact of
the transition to IFRIC 12 for these assets is not significant.
The most significant financial assets concession is the
Autopista Terrasa Manresa toll road, as the rest of the main
projects to which that model applied (in the UK) had already
been applying it previously. Given the application of IFRIC 12 and in compliance with IAS 1, financial information restated at the beginning of the comparative period is presented, in addition to the statement of financial position at the end of the current year and at the end comparative period (i.e. three statements of financial position are presented). The main effects of the restatement at December 2008 are analysed below:
ASSETS
Investments in Infrastructure Projects -388
Property, plant and equipment -29
Investments in associates -50
Infrastructure project receivables 717
Trade and other receivables -23
TOTAL ASSETS 227
Equity 137
Equity attributable to the equity holders 47
Non-controlling interests 90
Deferred income -3
Deferred tax liabilities 79
Trade and other payables 14
TOTAL EQUITY AND LIABILITIES 227
Differential impact on the income statement for 2009: INCOME STATEMENT
Revenue 54
Other operating revenue 0
Depreciation and amortisation charge -4
PROFIT FROM OPERATIONS 56
FINANCIAL RESULT -14
CONSOLIDATED PROFIT BEFORE TAX 40
Share of results of companies accounted for using the equity method
-1
Income tax -10
CONSOLIDATED PROFIT FOR THE YEAR 30
Profit or loss for the year attributable to non-controlling interests
-12
INCOME OR LOSS FOR THE YEAR ATTRIBUTABLE TO THE PARENT
19
Changes in accounting regulations, new standards, amendments and interpretations mandatorily applicable
New standards and amendments
Mandatory application in
annual reporting periods
beginning on or after
Revision of IFRS 3 Business Combination 1 July 2009
Amendments to IAS 27 Consolidated and Separate Financial Statements 1 July 2009
Amendment to IAS 39
Financial Instruments: Recognition and Measurement – Eligible Hedged Items 1 July 2009
Amendments to IFRS 2 Group Cash-settled Share-based Payment 1 January 2010

Consolidated financial statements for 2010 and 2009 Ferrovial S.A. and Subsidiaries
Ferrovial, S.A. Consolidated financial statements at 31 December 2010 9
New interpretations
Mandatory application in the EU for annual reporting periods
beginning on or after:
IFRIC 12 Service Concession Arrangements 1 April 2009
IFRIC 15 Agreements for the Construction of Real Estate 1 January 2010
IFRIC 16 Hedges of a Net Investment in a Foreign Operation 1 July 2009
IFRIC 17 Distributions of Non-cash Assets to Owners 1 November 2009
IFRIC 18 Transfers of Assets from Customers 1 November 2009
New standards and amendments
Mandatory application in annual reporting periods
beginning on or after
Approved for use in the EU
Amendment to IAS 32
Financial Instruments: Presentation - Classification of Rights Issues 1 February 2010
Revision of IAS 24 Related Party Disclosures 1 January 2011 Amendment to IFRIC 14
Prepayments of a Minimum Funding Requirement 1 January 2011
IFRIC 19 Extinguishing Financial Liabilities with Equity 1 July 2010
Not yet approved for use in the EU
IFRS 9 Financial Instruments: Classification and Measurement 1 January 2013
Amendment to IFRS 7
Financial Instruments: Disclosures - Transfers of Financial Assets 1 July 2011
Amendment to IAS 12
Income tax – Deferred Taxes on Investment Property 1 January 2012
Set out below is a brief reference to the contents of the standards and interpretations that have had an impact on the preparation of these financial statements:
- IFRS 3 (Revision) “Business Combinations”: it substantially changes the accounting for business combinations; it changes the scope, the calculation of goodwill and the treatment of contingent consideration and introduces the option of measuring non-controlling interests at fair value.
- NIC 27 (Amendments) “Consolidated and Separate Financial Statements”: it substantially modifies the recognition of changes in interests in group companies and also in non-controlling interests with a deficit balance.
- IFRS 2 (Amendments) “Share-based Payment”: it provides clarification on how to treat group cash-settled share-based payments.
-
- IFRIC 12 “Service Concession Arrangements”: IFRIC 12
identifies two types of service concession arrangements: a) those in which the operator has an unconditional contractual right to receive cash or another financial asset from the grantor. In this case, where the operator does not bear the demand risk, a financial asset will be recognised for the total amount receivable from the grantor; and b) those in which the operator obtains a right to charge users of the public service it provides. In this case, the operator bears the demand risk and recognises an intangible asset for the amount of the investment in the infrastructure it uses to provide the service.
New standards, amendments and interpretations mandatory applicable for years subsequent to 2010: Set out below is a brief reference to the contents of the standard that may have an impact on the preparation of the Group’s financial statements:
- IAS 24 (Revision) “Related Party Disclosures”: It amends the definition of “related party” and provides a partial exemption from the disclosure requirements for entities that are related parties only because they are under the control, joint control or significant influence of the same government.
2.2 Basis of consolidation In 2010 and 2009 all the separate financial statements of all the companies included in the scope of consolidation either referred to the same reporting date or were temporarily brought into line with those of the Parent. Moreover, in order to present uniformly the items included in these consolidated financial statements, uniformity adjustments were made on the basis of the Parent’s accounting policies. The consolidated financial statements were prepared using the following methods: a. Full consolidation method: all the subsidiaries are fully
consolidated. Subsidiaries are companies over whose management Ferrovial, S.A. exercises effective control because it holds more than 50% of the voting power, directly or indirectly through agreements with other shareholders. When assessing whether Ferrovial controls a company, the existence and effects of potential voting rights which may be currently exercised or converted are taken into account. A subsidiary is included in the scope of consolidation when the Group formally obtains effective control.
b. Equity method: the equity method is used to account for all the companies over which Ferrovial S.A. has a significant influence. Also accounted for using this method, pursuant to the alternative provided for in IAS 31, are the other companies over which Ferrovial, S.A. exercises joint control. In the latter case, the Company considers that the equity method is the method that best ensures fair presentation, since in these cases of joint control, the Company does not control the assets or have any present obligation with respect to the liabilities of the investee, but rather only effectively controls the ownership interest in the entity. The new standard that will shortly be published by the IASB will be along these same lines.

Consolidated financial statements for 2010 and 2009 Ferrovial S.A. and Subsidiaries
Ferrovial, S.A. Consolidated financial statements at 31 December 2010 10
c. Proportionate consolidation method: The projects
that are undertaken through unincorporated temporary joint ventures (UTEs) or similar entities are proportionately consolidated. Unlike the previous case, it is considered that in these cases of joint control, the venturers have a direct involvement in the assets, liabilities, income, expenses and joint and several liability in these entities. This type of business contributed to the consolidated Group assets, profits and sales of EUR 917 million; EUR 60 million and EUR 1,280 million in 2010 (2009: EUR 903 million; EUR 90 million and EUR 1,273 million).
d. Balances and transactions with Group companies:
balances and transactions between Group companies are eliminated on consolidation. Nonetheless, the transactions registered in the income statement relating to construction projects performed by the Construction division for infrastructure project concession holders are not eliminated on consolidation, since contracts of this kind are treated as construction contracts under which the Group performs work for the concession grantor or regulator in exchange for the right to operate the infrastructure under the terms pre-established by the grantor or regulator. The grantor or regulator thus has control over the asset from inception and grants the above-mentioned right in exchange for the work performed, such that the conclusion may be reached that at Group level the work is performed for third parties.
e. Translation of financial statements in currencies
other than the euro: the financial statements of consolidated subsidiaries and joint ventures whose accounting records are denominated in a currency other than the euro are translated to euros by applying the year-end exchange rates to all assets and liabilities, except for equity and investments in Group companies, which are translated at the exchange rates prevailing when they joined the Group. Income and expenses are translated at the average exchange rates for the year. Differences arising during the aforementioned translation process are recognised in equity under "Translation Differences".
Appendix I contains a list of subsidiaries, associates and joint ventures.
2.3 Accounting policies applied to each item in the consolidated statement of financial position and consolidated income statement
2.3.1 Intangible assets “Intangible assets” in the accompanying consolidated statement of financial position are initially carried at acquisition price or production cost, including capitalisable borrowing costs, and are subsequently measured at cost less accumulated amortisation and any impairment losses. Intangible assets with a finite useful life are amortised on a straight-line basis, or based on estimated traffic in the case of administrative concessions, during the concession term, and over their useful lives (between 5 and 50 years) in all other cases. Intangible assets with an indefinite useful life are not amortised and are tested annually for impairment. 2.3.2 Investments in Infrastructure Projects This caption includes the investments made by infrastructure concession operators in the scope of IFRIC 12 (mainly toll roads), as well as those which, while not subject to the aforementioned standard as the licences are indefinite, have characteristics that are very similar to a concession arrangement (mainly airports), as indicated in Note 1.1 above. It also includes intangible assets and investment property used in projects of this nature. The assets acquired by the concession operator to provide the concession services but which do not form part of the infrastructure (vehicles, furniture, computer hardware, etc.) are not included under this caption. Assets of this nature are classified on the basis of their nature and are depreciated over their useful life, using a method that reflects their economic use. Amortisation and depreciation methods: IFRIC 12 – Intangible asset model All initial investments relating to the infrastructure that is subsequently returned to the government, including compulsory purchase costs and borrowing costs capitalised during construction are amortised on the basis of the pattern of consumption applicable in each case (e.g., forecast traffic in the case of toll roads) throughout the term of the concession. The investments contractually agreed on the star of the concession on a final and irrevocable basis for being made at a later date during the term of the concession, and provided they are not investments made to upgrade infrastructure, are considered to be the initial investment. For this type of investment, an asset and an initial provision are recognised for the present value of the future investment, applying a discount rate to calculate the foregoing present value that is equal to the cost of the debt related to the project. The asset is amortised based on the pattern of consumption during the whole term of the concession and the provision is increased by the related interest cost during the period until the investment is made.

Consolidated financial statements for 2010 and 2009 Ferrovial S.A. and Subsidiaries
Ferrovial, S.A. Consolidated financial statements at 31 December 2010 11
Where a payment is made to the government to obtain the right to operate the concession, this amount is also amortised based on the pattern of consumption over the concession term. A provision is recognised for replacement investments, which must have been set up in full by the time the investment becomes operational. The provision is recognised on the basis of the pattern of consumption over the period in which the obligation accrues, on a time proportion basis. Infrastructure upgrade investments which are recovered over the concession term are amortised as from the date on which they come into service based on the difference in the pattern of consumption arising from the increase in capacity. However, if these investments will not be offset by the possibility of obtaining increased revenue from the date on which they are made, a provision will be recognised for the best estimate of the present value of the cash outflow required to settle the obligations related to the investment that will not be offset. The balancing item is a higher acquisition cost of the intangible asset.
Other Investments in Infrastructure Projects Assets used in infrastructure projects under indefinite licences (relating basically to airports) are depreciated on a straight-line basis over the useful lives of the related assets, as follows: Years of estimated
useful life Terminal assets Terminal buildings 20-60 Terminal plant 5-20 Tunnels, bridges and underground railway 50-100 Runways Structures 100 Surfacing 10-15 Other related assets 50 Conveyor belts and moving staircases Transit systems 20-50 Other related assets 8-100 Equipment and machinery 3-10 Other leased land and buildings Lease term As indicated previously, this caption also includes intangible assets used in infrastructure projects as a result of the business combination arising from the acquisition of the BAA Group, described in Note 5, specifically: - The BAA Group’s right to operate in non-regulated airports
(this right is not amortised due to the aforementioned unlimited duration of these licenses).
- Rights to operate commercial spaces (average useful life of seven years).
Internally generated intangible assets, relating mainly to BAA, consisting of computer software developed in-house and websites, are amortised on a straight-line basis over useful lives of between three and seven years.
Set out below are details of the main toll road concessions in force, showing their duration, together with a list of regulated and non-regulated airports:
Toll road concessions:
Concession Operator
Country Concession
term First year of concession
Skyway Concession Co.
USA 99 2005
SH 130 Concession Co.
USA 50 (1) 2008
North Tarrant Express USA 52 (2) 2010
LBJ Express USA 52 (2) 2010
Spanish toll roads Spain 30-65(3) 1986-2005
Portuguese toll roads Portugal 30 2000-2006
407 ETR Internacional Inc.
Canada 99 1999
Indiana Toll Roads USA 75 2006-2081
Other toll roads Ireland/ Greece
30-45 2003-2008
(1) Concession term of 50 years as from completion of the construction work, estimated at five years. (2) Concession term of the shorter of 50 years of operation and 52 years as from the contract execution date. (3) The main Spanish toll road concessions are Autopista del Sol, Autopista Terrasa-Manresa, Autopista Madrid Sur and Autopista Madrid-Levante.
Airports:
Airport Regulated/ Non-
regulated Licence duration
Heathrow Regulated Indefinite
Stansted Regulated Indefinite
Edinburgh Non-regulated Indefinite
Glasgow Non-regulated Indefinite
Aberdeen Non-regulated Indefinite
Southampton Non-regulated Indefinite
Antofagasta Non-regulated 2000-2011
2.3.3 Property, plant and equipment The assets included in “Plant, Property and Equipment” in the accompanying consolidated statement of financial position are carried at acquisition or production cost, less the related accumulated depreciation and any accumulated impairment losses. In-house work on property, plant and equipment is valued, for each investment, by adding the direct or indirect costs allocable to the investment to the cost of the materials used. Borrowing costs incurred during the construction or production period, before the assets are ready to come into operation, are capitalised, whether they derive from borrowings arranged specifically to acquire the assets or from general-purpose financing sources subject to the provisions for qualifying assets contained in IAS 23.

Consolidated financial statements for 2010 and 2009 Ferrovial S.A. and Subsidiaries
Ferrovial, S.A. Consolidated financial statements at 31 December 2010 12
The Group companies calculate the impairment losses on property, plant and equipment using the method that best approximates the effective technical decline in value and the estimated years of useful life of each asset. The straight-line method is generally employed, with the exception of certain construction business machinery that is depreciated using the declining balance method. The useful lives and residual values of these assets are reviewed annually. The consolidated companies depreciate their property, plant and equipment basically over the following years of useful life: Years of estimated
useful life Buildings and other structures 10-50 Machinery, fixtures and tools 2-25 Furniture 2-15 Transport equipment 3-20 Other items of property, plant and equipment
2-20
2.3.4. Investment property “Investment Property” includes the net values of land, buildings and other structures that fulfil the requirements of IAS 40. Investment property is carried at acquisition cost less accumulated depreciation and any impairment losses. The Group does not apply the fair value model permitted by IAS 40. The Group companies depreciate investment property on a straight-line basis over the estimated useful life of the property (between 5 and 50 years). The subgroup that owns the most investment properties is BAA. As all this subgroup’s non-current assets are recognised in “Investments in Infrastructure Projects”, the relevant Note contains a breakdown of the assets classified as investment property. 2.3.5 Impairment losses The Group tests goodwill and intangible assets with indefinite useful lives and intangible assets not yet available for use for impairment annually. At each reporting date the Group tests assets for permanent impairment that might make it necessary to write-down the assets. Should evidence of impairment be detected, the asset’s recoverable amount is calculated in order to identify the scope of the impairment loss if the recoverable amount is lower than the asset’s carrying amount, and the difference is recognised in profit or loss. Impairment losses must be assessed for each individual asset. If this is not possible, the impairment loss is determined for the smallest identifiable group of assets that generates cash inflows that are largely independent of the cash inflows from other assets (cash-generating units).
Recoverable amount is the higher of fair value less costs to sell and value in use. Value in use is calculated on the basis of estimated future cash flows discounted at a rate that reflects current market assessments of the time value of money and the risks specific to the asset. Where an impairment loss subsequently reverses, the carrying amount of the asset is increased up to the limit of the original amount at which the asset had been carried before the impairment loss was recognised. An impairment loss recognised for goodwill must not be reversed in a subsequent period. 2.3.6 Leases Leases are classified as finance leases whenever the terms of the lease transfer substantially all the risks and rewards of ownership to the Group, which generally has the option of acquiring the asset at the end of the lease term under the terms agreed on when the lease was arranged. All other leases are classified as operating leases. The Group recognises finance leases as assets and liabilities in the statement of financial position at the commencement of the lease term, at the lower of the market value of the leased asset and the present value of the minimum lease payments. The interest rate implicit in the lease agreement is used to calculate the present value of the lease payments. The cost of the assets held under finance leases is presented in the consolidated statement of financial position on the basis of the nature of the leased asset. When the Group acts as the lessee in an operating lease, lease costs are taken to the income statement on a straight-line basis over the lease term, irrespective of the payment periods stipulated in the lease. If that the lessor has established incentives in the lease consisting of payments corresponding to the lessee but made by the lessor, the income deriving from these incentives is taken to the income statement as a reduction of the costs of the lease on the same straight-line basis as that used to recognise the costs in profit or loss. 2.3.7 Financial assets a. Financial assets at fair value through profit or loss:
these are assets acquired mainly to generate a profit as a result of fluctuations in their value. They are stated at their fair value on acquisition and at subsequent measurement dates, and any changes are recognised directly in the consolidated income statement. The assets in this category are classified as current assets if they are expected to be realised within 12 months from the reporting date. There are no assets at fair value through profit or loss other than the derivative financial instruments described in Note 2.3.8.

Consolidated financial statements for 2010 and 2009 Ferrovial S.A. and Subsidiaries
Ferrovial, S.A. Consolidated financial statements at 31 December 2010 13
b. Available-for-sale financial assets: this caption
includes securities acquired that are not held for immediate trading and have no fixed maturity and relate mainly to investments in companies not included in the Group’s scope of consolidation. They are carried at their underlying carrying amount, unless there is better evidence to the contrary, in which case they are carried at their fair value.
c. Held-to-maturity investments and accounts
receivable: Financial asset model provided for in IFRIC 12 This line item includes the service concession arrangements related to infrastructure in which the consideration consists of an unconditional contractual right to receive cash or another financial asset, either because the grantor guarantees to pay the operators specified or determinable amounts or because it guarantees to pay the operator the shortfall between amounts received from users of the public service and specified or determinable amounts. Therefore, these are concession arrangements in which demand risk is borne in full by the grantor. In these cases, the amount payable by the grantor is recognised in assets in the statements of financial position as a loan or a receivable. To calculate the amount payable by the grantor, the value of the construction, operation and/or maintenance services provided and the interest implicit in arrangements of this nature are taken into consideration. Revenue from the services provided in each period increase the amount of the related accounts receivable with a balancing item in sales. The interests on the services provided increase the amount of accounts receivable with a balancing item in other operating income. Amounts received from the grantor reduce the total receivable with a balancing item in cash.
Other receivables Held-to-maturity investments, loans granted and
receivables are initially recognised at fair value and are subsequently measured at amortised cost, and any accrued interest is recognised on the basis of the effective interest rate. The effective interest rate is the discount rate that exactly matches the carrying amount of a financial instrument to all its estimated cash flows of all kinds through its residual life. If at year-end there is objective evidence that not all amounts receivable will be collected, the necessary impairment losses are recognised. The amount of the impairment loss is the difference between the carrying amount of the asset and the present value of the estimated future cash flows, discounted at the effective interest rate. Financial assets are derecognised when the risks and rewards of ownership of the financial asset are substantially transferred. In the specific case of
.receivables, this is deemed to occur when the default and delinquency risks have been transferred.
2.3.8 Derivative financial instruments Derivative financial instruments are initially recognised at fair value on the date they are arranged. Subsequent changes in fair value are also recognised at each reporting date. The method used to recognise gains or losses on derivatives depends on whether the instrument has been designated as a hedging instrument and, as the case may be, on the type of hedge involved. The Group uses the following types of hedge: i. Cash flow hedge: a cash flow hedge hedges exposure to
highly probable future transactions and changes in cash flows. The gain or loss on the ineffective portion of the hedging instrument is taken to the consolidated income statement and the gain or loss on the effective portion is recognised directly in equity in the consolidated statement of financial position. The amount deferred in equity is not recognised in the income statement until the gains or losses on the hedged transactions are recognised in profit or loss or until the transactions mature. That amount is recognised in the same line item as the gain or loss on the hedged item. Lastly, should the hedge become ineffective, the amount recognised in equity until then is taken to profit or loss proportionately over the term of the derivative arranged.
ii. Fair value hedge: a fair value hedge hedges exposure to
changes in the value of a recognised asset or liability or a firm commitment relating to a future transaction. The gain or loss on the hedging instrument and the gain or loss on the hedged asset or liability are recognised in the consolidated income statement.
iii. Hedge of net investments in foreign operations: Hedges of
this nature hedge exposure to changes in the value of net investments in foreign operations attributable to foreign exchange fluctuations. Gains or losses are recognised in equity and taken to the income statement when the investment is sold or matures.
Gains or losses on derivatives not qualifying for hedge accounting are recognised in the consolidated income statement. 2.3.9 Business combinations and goodwill Business combinations are accounted for using the acquisition cost method, whereby the identifiable assets and liabilities of the business acquired are recognised at fair value. Goodwill is the positive difference between the cost of the investment and the fair value of the above-mentioned assets and liabilities. In acquisitions of associates, goodwill generated is treated as an addition to the value of the investment. Goodwill on consolidation is not amortised and is tested for impairment (see Note 2.3.5).

Consolidated financial statements for 2010 and 2009 Ferrovial S.A. and Subsidiaries
Ferrovial, S.A. Consolidated financial statements at 31 December 2010 14
2.3.10 Inventories Inventories are initially recognised at acquisition or production cost. Borrowing costs relating to inventories are capitalised during the construction or production period. Inventories are subsequently measured at the lower of weighted average cost and net realisable value. The Group determines the net realisable value of inventories and recognises all the necessary write-downs where cost exceeds net realisable value. 2.3.11 Cash and cash equivalents Cash and cash equivalents include cash on hand, demand deposits at banks and other short-term, highly liquid investments with an initial maturity of three months or less.
“Cash and Cash Equivalents” includes investments of the same nature and with the same maturity assigned to the financing of certain infrastructure projects, where the availability of the cash is restricted by the financing contracts as security for certain payment obligations relating to interest or principal repayments as well as infrastructure maintenance and operation.
2.3.12 Non-current assets classified as held for sale and discontinued operations a. Non-current assets classified as held for sale: non-
current assets are classified as held for sale when it is considered that their carrying amount will be recovered through a sale transaction rather than through continuing use. This condition is regarded as met only when the sale is highly probable, the asset is available for immediate sale in its present condition and the sale is expected to be completed within one year from the date of classification. The total figure for these assets is presented in a single line item and is measured at the lower of the carrying amount of the assets and their fair value less costs to sell. The assets are no longer depreciated once they have been classified as held for sale. Gains and losses on these assets are recognised in the income statement based on the basis of the nature of the related items.
b. Discontinued operations: Discontinued operations are
those that have been sold, disposed of by another means or classified as held for sale, and represent a complete segment for the consolidated Group, or form part of a one-off plan or constitute a subsidiary acquired solely for resale. Gains and losses on discontinued operations are presented in a single specific line item in the income statement, net of taxes.
2.3.13 Equity Ordinary shares are classified as equity. Incremental costs directly attributable to the issue of new shares are deducted, net of taxes, from equity. Acquisitions of the Parent’s treasury shares are deducted from equity for the amount of the consideration paid, including the attributable costs associated with the acquisitions. When treasury shares are sold or reissued, any amount received is taken, net of costs, to equity. 2.3.14 Grants Grants are recognised at their fair value when there is reasonable assurance that the grant will be received and the Group fulfils all the conditions attaching to them. Grants related to assets are recognised as non-current liabilities under “Deferred Income”, and are credited to the consolidated income statement on a straight-line basis over the estimated useful lives of the related assets. 2.3.15 Provisions and contingent liabilities The Group recognises a provision for a commitment or obligation vis-à-vis a third party that meets the following requirements: It is a present obligation arising from past events, the settlement of which is expected to result in an outflow of funds and the amount or timing of which are not known for certain but can be estimated sufficiently reliably. The provisions include most notably the following: • Provisions for budgeted losses in the Construction business
covering a probable loss identified before completion of the project.
• Provisions for the closure and post-closure of landfills in
the Services business, since the Company is required to close the landfill when it reaches maximum capacity due to environmental risks. These provisions cover estimated closure costs and waste treatment costs during the post-closure period, in accordance with technical estimates based on the landfill’s capacity, average density and other parameters.
A contingent liability is a possible obligation arising from past events whose existence will be confirmed only by the occurrence or non-occurrence of one or more future events not wholly within the control of the consolidated companies. Contingent liabilities are not recognised, but the most significant are disclosed in these notes (see Note 23).

Consolidated financial statements for 2010 and 2009 Ferrovial S.A. and Subsidiaries
Ferrovial, S.A. Consolidated financial statements at 31 December 2010 15
2.3.16 Pension obligations
a. Defined contribution plans: contributions are recognised each year as an expense.
b. Defined benefit plans: the liability recognised in the statement of financial position for defined benefit plans is the present value of the defined benefit obligation at the end of the reporting period, minus the fair value of plan assets and any past service cost not yet recognised. The defined benefit obligation is measured annually by independent actuaries using the projected unit credit method. The defined benefit obligation is measured by discounting estimated future cash outflows on the basis of market yields on high quality corporate bonds of a currency and term consistent with the currency and term of the defined benefit obligations. Actuarial gains and losses comprise experience adjustments (measuring the effects of differences between the previous actuarial assumptions and what has actually occurred) and the effect of changes in actuarial assumptions. As a result of the amendments to IAS 19, in 2006 the Group availed itself of the alternative contained in the new wording of IAS 19 whereby the entire actuarial gain or loss may be recognised directly in equity in the period in which it arises. In the event of changes in the characteristics of the plan, if as a result of changes in the obligations the rights arising therefrom vest automatically, the past service cost is recognised immediately in the consolidated income statement. Where, however the rights may be cancelled or do not vest, the cost is recognised on a straight-line basis over the average period until the benefits become vested. In the event of a reduction in or the settlement of the plan, any gains or losses arising from changes in the value of the defined benefit obligation, changes in the value of the plan assets and past service costs not yet recognised are recognised immediately. 2.3.17 Share-based payment
a. Stock option plans: stock option plans are measured at fair value when the options are initially granted using a financial method, based on an improved binomial model, taking into account the exercise price, expected volatility, option life, expected dividends, the risk-free interest rate and the assumptions made to incorporate the effects of expected early exercise. The initial fair value is not subsequently revised. This fair value is recognised under “Staff Costs” in proportion to the stipulated period of time during which the employee must remain at the company, with a balancing entry in equity.
b. Equity-settled share-based payment: these
transactions are measured at the grant date at the market price of the shares at that time, deducting therefrom the present value of expected dividends during the established vesting period. This fair value is recognised under “Staff Costs” in proportion to the stipulated period of time during which the employee must remain at the company, with a balancing entry in equity.
c. Swaps arranged on share-based payments:
Ferrovial arranges swaps exclusively to hedge the impact on equity of settlement of the stock option plans. Changes in the fair value of the swaps are taken to the income statement as they do not qualify for hedge accounting, as mentioned in Note 24 on fair value adjustments.
2.3.18 Financial liabilities These liabilities are initially recognised at fair value net of transaction costs and are subsequently measured at amortised cost using the effective interest method. The effective interest rate is the rate that exactly discounts estimated future cash payments through the expected life of the financial instrument to the net carrying amount of the financial liability. If the effective interest rate is initially considered to differ from the market interest rate, the liability is measured based on the present value of future cash flows at the market rate in the case of interest-bearing loans. Where no effective interest rate is specified, the cash flows are also measured using the market interest rate. If existing debts are renegotiated, the financial liability is not deemed to change significantly when the lender of the new loan is the same as the initial lender and the present value of the cash flows, including origination and arrangement costs, applying the effective interest method is not more than 10% higher or lower than the present value of the future cash flows payable on the original liability calculated using this same method. 2.3.19 Income tax and deferred taxes The term “consolidated income tax” covers all domestic and foreign taxes applicable to taxable income. Income tax also includes other taxes, such as taxes on repatriated profits, and any other tax calculated on the basis of the accounting profit. The income tax expense recognised in the consolidated financial statements is calculated by aggregating the expense recognised by each of the consolidated companies, increased or decreased, as appropriate, by the tax effect of accounting consolidation adjustments and by temporary differences between the tax bases of the assets and liabilities and their carrying amounts in the consolidated financial statements (balance sheet liability method).

Consolidated financial statements for 2010 and 2009 Ferrovial S.A. and Subsidiaries
Ferrovial, S.A. Consolidated financial statements at 31 December 2010 16
Deferred taxes are not recognised when the transaction has no effect on the accounting profit or loss or tax base of the related assets and liabilities. In the case of business combinations, deferred tax is recognised as a result of the allocation of the price and the amortisation for tax purposes of any goodwill generated. Deferred tax assets and liabilities are calculated using the tax rates in force at the reporting date and that are expected to apply in the period in which the asset is realised or the liability is settled. They are charged or credited to the income statement, except when they relate to items that are recognised directly in equity, in which case they are charged or credited to equity. A deferred tax liability is not recognised for undistributed profits of subsidiaries when the Group is able to control the timing of the reversal of the temporary difference and it is probable that the temporary differences will not reverse in the foreseeable future. Deferred tax assets and tax loss carryforwards are recognised when it is probable that the Company will recover them in the future, regardless of when they will be recovered, provided this is within the maximum period provided by law. Deferred tax assets and liabilities are not discounted and are classified as a non-current asset or liability respectively. Deferred taxes recognised are reviewed at the end of each reporting period. The difference between the income tax expense recognised at the previous year end and the income tax expense reported in the final tax returns filed constitutes a change in accounting estimates and is recognised as current-year income or expense. 2.3.20 Translation of foreign currency transactions Foreign currency transactions performed by Group companies are translated into the functional currency using the year-end exchange rates for assets and liabilities and the average exchange rates for income statement items. 2.3.21 Revenue recognition Revenue is measured at the fair value of the consideration receivable and represents the amounts receivable for the goods and services provided in the normal course of business, net of discounts, refunds, VAT and other sales-related taxes. Revenue is recognised when the risks and rewards are deemed to have been transferred. Set out below are details of the methods applied to recognise revenue in each segment in which Ferrovial operates.
2.3.21.1 Construction business Construction business revenue is recognised in accordance with IAS 11, whereby revenue and associated costs are recognised in the income statement by reference to the stage of completion of the contract activity at the end of the reporting period, provided that the outcome of the construction contract can be estimated reliably. An expected loss on the construction contract is recognised as an expense immediately. The Company habitually examines the work performed, which is made possible in practice by the existence in all the contracts of a definition of all the units of output and the price at which each unit is to be billed. There are budgeting tools for monitoring variances. At the end of each month, the units executed in each contract are measured and the output for the month is recognised as revenue. Contract costs are recognised on an accrual basis, and the costs actually incurred in completing of the units of output are recognised as an expenses and those that might be incurred in the future have to be allocated to the project units completed. In exceptional cases, where it is not possible to estimate the margin for the entire contract, the total costs incurred are recognised and sales that are reasonably assured with respect to the completed work are recognised as contract revenue, subject to the limit of the total contract costs. Changes to the initial contract require the customer’s technical and financial approval prior to the issue of billings and collection of the amounts relating to additional work. The Group does not recognise revenue from such additional work until approval is reasonably assured and the revenue can be measured reliably. The costs associated with these additional assets are recognised when incurred. Initial contract costs incurred in the formalisation of the principal contract, costs of moving plant to the contract site, costs incurred in design, assistance and studies, building insurance costs, perimeter financing costs and other initial contract costs are recognised as prepaid expenses. These costs are initially recognised as assets provided that it is probable that they will be recovered in the future and they are recognised in profit or loss based on actual production with respect to estimated production under each contract. Otherwise, the costs are taken directly to the income statement. Late-payment interest arising from delays in the collection of billings is recognised when it is probable that the interest will be collected and the amount may be measured reliably. 2.3.21.2 Toll road business
The contracts included in this line of business are accounted
for in accordance with IFRIC 12, used as a basis for classifying
the assets used in such contracts on the basis of the intangible
asset model and the financial asset model (mixed models can
also exist).

Consolidated financial statements for 2010 and 2009 Ferrovial S.A. and Subsidiaries
Ferrovial, S.A. Consolidated financial statements at 31 December 2010 17
2.3.21.3 Airport business Revenue may be divided into: 1) airport revenue, which accrues in different ways and includes most notably revenue that accrues on the basis of the number of passengers, landing charges based on the tonnage of the aircraft that land at the airport, and aircraft parking charges, which are calculated on the basis of a combination of the number of parking hours and aircraft tonnage, and 2) retail-related revenue from the assignment of commercial space to third parties, which is recognised as a percentage of the sales generated by the third party. 2.3.21.4 Service businesses In general, revenue from services of this nature is recognised in the income statement on a straight-line basis over the term of the contract. In the case of contracts for a number of different services and prices, revenue and costs are recognised with reference to the stage of completion, applying the same methods and conditions as those described for the Construction business. Where this is not possible, the percentage of completion method is used, based on the costs incurred as a percentage of total estimated costs. Lastly, it should be noted that certain contracts performed by Amey in the United Kingdom are accounted for using the financial asset model provided for in IFRIC 12. 2.3.21.5 Operating results
The operating results in the income statement include the results of the Group companies’ ordinary activities, excluding financial results (see Note 28) and the share in the results of companies accounted for using the equity method, presented under “Profit from Operations” a specific line item which includes sales revenue and gains and losses on disposals of non-current assets. 2.4 Accounting estimates and judgements In the consolidated financial statements for 2010 estimates were made to measure certain assets, liabilities, income, expenses and obligations. These estimates relate basically to the following: • The assessment of possible impairment losses on certain
assets. • The assumptions used in the actuarial calculation of
pension liabilities and other obligations to employees. • The useful life of the property, plant and equipment and
intangible assets. • The measurement of stock options. • The budget-related estimates taken into consideration
when recognising the results of contracts with a reference to the stage of completion in the Construction and Services segments.
• Estimates relating to the fair value of assets acquired in business combinations and goodwill.
• The assessment of possible legal and tax contingencies. •
• Estimates relating to the valuation of derivatives and the
related expected flows in cash flow hedges. Although, these estimates were made using the best information available at 31 December 2010 and 2009 on the events analysed, events that take place in the future might make it necessary to change this estimates. Changes in accounting estimates would be applied in accordance with IAS 8.
3. Management of financial risks and capital The Group’s activities are exposed to a variety of financial risks, particularly interest rate risk, foreign currency risk, credit risk, liquidity risk and equity risk. 3.1 Interest rate risk The Ferrovial Group’s business requires financing that can be borrowings indexed to fixed or floating interest rates. Interest rate risk management optimises the cost of financing to guarantee fulfilment of the business plans. Accordingly, in managing interest rates, the Ferrovial Group tends to keep a percentage of the debt tied to fixed rates, either arranged at inception or hedged by means of derivative financial instruments. Ferrovial applies a proactive management approach to the portion of the debt that is tied to floating, paying particular attention to the evolution of market rates in order to obtain the lowest rates wherever possible. As regards infrastructure project financing, each project is analysed and criteria are identified to minimise exposure to interest rate fluctuations, resulting in the establishment of ceilings on the volume of debt tied to floating rates, which is usually between 15% and 35% of the total project financing. This avoids potential changes in expected project returns due to changes in market interest rate curves. This objective of establishing pre-set rates for projects is often achieved by arranging hedging derivatives, an analysis of which is provided in Note 11 on derivative financial instruments at fair value. Occasionally, in certain infrastructure projects the revenue from which is tied to inflation through a contractual formula, an attempt is made to structure their financing through borrowings, the cost of which is indexed to the changes in inflation observed in the period, obtaining a natural hedge between income and expenses. This structuring and hedge can be set up directly with the debt or through derivative financial instruments. In the case of long-term borrowings not linked to specific projects, there are no predetermined formulae with respect to the distribution of fixed rates and floating rates, although the decisions in this connection are taken from perspective of the management of the Group as a whole; however, it is usually attempted to hold between 50% and 80% of the borrowings at a pre-set rate for the Group as a whole.
Consolidated financial statements for 2010 and 2009 Ferrovial S.A. and Subsidiaries
Ferrovial, S.A. Consolidated financial statements at 31 December 2010 18
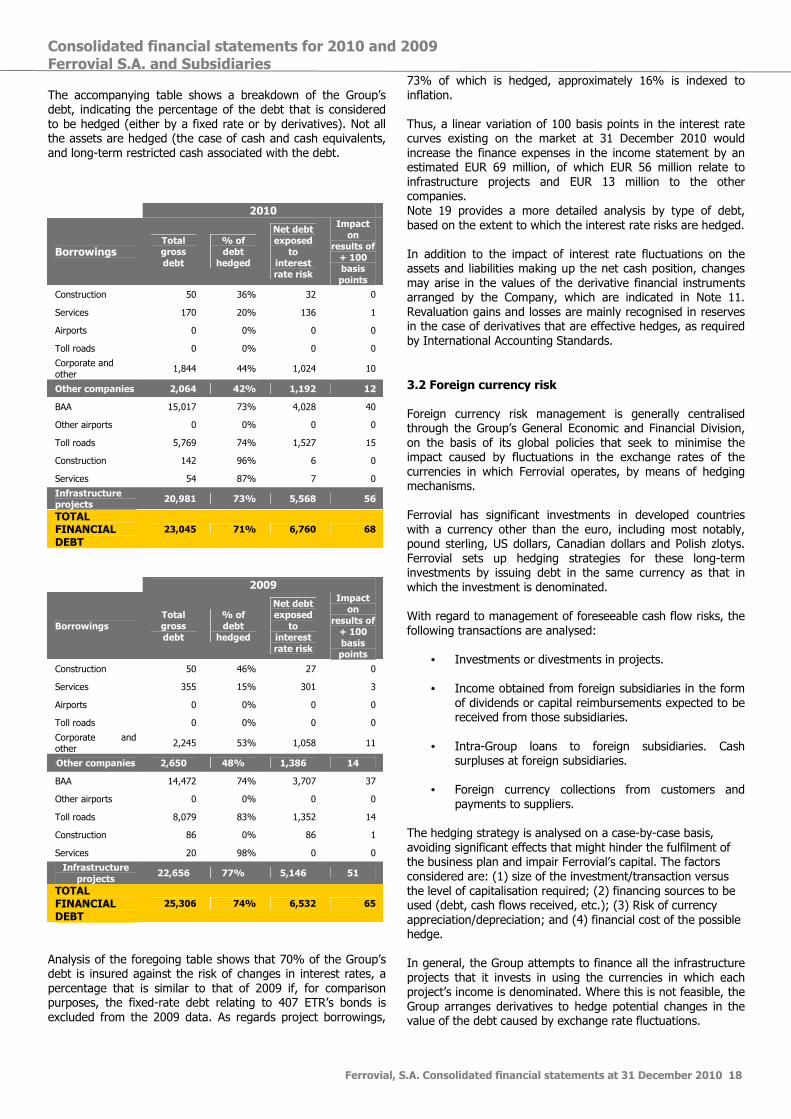
The accompanying table shows a breakdown of the Group’s debt, indicating the percentage of the debt that is considered to be hedged (either by a fixed rate or by derivatives). Not all the assets are hedged (the case of cash and cash equivalents, and long-term restricted cash associated with the debt. 2010
Borrowings Total gross debt
% of debt hedged
Net debt exposed
to interest rate risk
Impact on
results of + 100 basis points
Construction 50 36% 32 0
Services 170 20% 136 1
Airports 0 0% 0 0
Toll roads 0 0% 0 0
Corporate and other 1,844 44% 1,024 10
Other companies 2,064 42% 1,192 12
BAA 15,017 73% 4,028 40
Other airports 0 0% 0 0
Toll roads 5,769 74% 1,527 15
Construction 142 96% 6 0
Services 54 87% 7 0
Infrastructure projects
20,981 73% 5,568 56
TOTAL FINANCIAL DEBT
23,045 71% 6,760 68
2009
Borrowings Total gross debt
% of debt hedged
Net debt exposed
to interest rate risk
Impact on
results of + 100 basis points
Construction 50 46% 27 0
Services 355 15% 301 3
Airports 0 0% 0 0
Toll roads 0 0% 0 0
Corporate and other 2,245 53% 1,058 11
Other companies 2,650 48% 1,386 14
BAA 14,472 74% 3,707 37
Other airports 0 0% 0 0
Toll roads 8,079 83% 1,352 14
Construction 86 0% 86 1
Services 20 98% 0 0
Infrastructure projects
22,656 77% 5,146 51
TOTAL FINANCIAL DEBT
25,306 74% 6,532 65
Analysis of the foregoing table shows that 70% of the Group’s debt is insured against the risk of changes in interest rates, a percentage that is similar to that of 2009 if, for comparison purposes, the fixed-rate debt relating to 407 ETR’s bonds is excluded from the 2009 data. As regards project borrowings,
73% of which is hedged, approximately 16% is indexed to inflation. Thus, a linear variation of 100 basis points in the interest rate curves existing on the market at 31 December 2010 would increase the finance expenses in the income statement by an estimated EUR 69 million, of which EUR 56 million relate to infrastructure projects and EUR 13 million to the other companies. Note 19 provides a more detailed analysis by type of debt, based on the extent to which the interest rate risks are hedged. In addition to the impact of interest rate fluctuations on the assets and liabilities making up the net cash position, changes may arise in the values of the derivative financial instruments arranged by the Company, which are indicated in Note 11. Revaluation gains and losses are mainly recognised in reserves in the case of derivatives that are effective hedges, as required by International Accounting Standards.
3.2 Foreign currency risk Foreign currency risk management is generally centralised through the Group’s General Economic and Financial Division, on the basis of its global policies that seek to minimise the impact caused by fluctuations in the exchange rates of the currencies in which Ferrovial operates, by means of hedging mechanisms. Ferrovial has significant investments in developed countries with a currency other than the euro, including most notably, pound sterling, US dollars, Canadian dollars and Polish zlotys. Ferrovial sets up hedging strategies for these long-term investments by issuing debt in the same currency as that in which the investment is denominated. With regard to management of foreseeable cash flow risks, the following transactions are analysed:
• Investments or divestments in projects.
• Income obtained from foreign subsidiaries in the form of dividends or capital reimbursements expected to be received from those subsidiaries.
• Intra-Group loans to foreign subsidiaries. Cash
surpluses at foreign subsidiaries.
• Foreign currency collections from customers and payments to suppliers.
The hedging strategy is analysed on a case-by-case basis, avoiding significant effects that might hinder the fulfilment of the business plan and impair Ferrovial’s capital. The factors considered are: (1) size of the investment/transaction versus the level of capitalisation required; (2) financing sources to be used (debt, cash flows received, etc.); (3) Risk of currency appreciation/depreciation; and (4) financial cost of the possible hedge. In general, the Group attempts to finance all the infrastructure projects that it invests in using the currencies in which each project’s income is denominated. Where this is not feasible, the Group arranges derivatives to hedge potential changes in the value of the debt caused by exchange rate fluctuations.

Consolidated financial statements for 2010 and 2009 Ferrovial S.A. and Subsidiaries
Ferrovial, S.A. Consolidated financial statements at 31 December 2010 19
In construction or services contracts in which the price is received in a currency other than that in which the related costs are paid, hedges are arranged to avoid changes in the profit margin caused by exchange rate fluctuations. The following table shows the values of assets, liabilities, non-controlling interests and equity attributable to the Parent by type of currency at December 2010 and 2009: Millions of euros
2010
Currency Assets Liabilities Equity of the Parent
Non-controlling interests
Euro 11,101 10,831 37 233
Pound sterling 22,942 20,372 1,442 1,128
US dollar 3,894 3,467 438 -11
Canadian dollar
2,938 8 2,929 0
Polish zloty 1,186 961 159 66
Chilean peso 39 -117 157 0
Swiss franc 1,026 1,031 -23 18
Other 162 107 55 0
Total Group 43,287 36,659 5,194 1,434
Millions of euros
2009
Currency Assets Liabilities Equity of the Parent
Non-controllin
g interests
Euro 11,154 12,091 -1,130 193
Pound sterling 23,458 19,701 2,318 1,438
US dollar 2,608 2,192 390 26
Canadian dollar
3,263 2,571 808 -116
Polish zloty 982 784 120 78
Chilean peso 1,663 1,610 66 -13
Swiss franc 710 220 479 10
Other 161 111 50 0
Total Group 43,999 39,280 3,102 1,617
An analysis of the table above shows that the Group's equity is particularly exposed to the Canadian dollar and to the pound sterling. Exposure to the Canadian dollar has increased considerably compared to 2009 due to the adjustment to fair value of the interest in 407 ETR in Canada after selling 10% of the ownership interest. For investments of this type (in which no specific debt is associates with the financing of the investment), the Group specific hedges for the amounts to be recovered, in the form or dividends or capital reimbursements, with a time horizon of up to three years.
In general, they are treated as long-term investments denominated in strong currencies that historically have not fluctuated significantly. On the basis of all the data provided above, a 10% appreciation of the euro at year-end, against the main currencies in which the Group has investments would have an impact on the Parent’s equity of EUR -510 million, of which 57% would relate to the impact of the Canadian dollar. This fluctuation in the value of the euro would have an impact on total assets of EUR -3,202 million, of which 72% would relate to the investments in pounds sterling. The detail of the net profit attributable to the Parent by type of currency for 2010 and 2009 is as follows: 2010
Currency Profit or loss
Euro -265
Pound sterling -403
US dollar -15
Canadian dollar 2,499
Polish zloty 28
Chilean peso 278
Swiss franc 39 Other 2
Total Group 2,163
In this regard, the impact of a 10% appreciation of the euro on the income statement would have amounted to EUR -169 million.
2009
Currency Profit or loss
Euro 289
Pound sterling -436
US dollar -14
Canadian dollar 16
Polish zloty 27
Chilean peso 14
Swiss franc 27
Other 3
Total Group -74
Changes in the main exchange rates vis-à-vis the euro are shown in the following table; in general the main currencies appreciated against the euro, particularly the Chilean peso +14% and the Canadian dollar +11.3%:

Consolidated financial statements for 2010 and 2009 Ferrovial S.A. and Subsidiaries
Ferrovial, S.A. Consolidated financial statements at 31 December 2010 20
Exchange rate at year-end
2010 2009 CHANGE 10/09
Pound sterling 0.8574 0.8876 -3.40%
US dollar 1.3366 1.4331 -6.73%
Canadian dollar 1.3291 1.4989 -11.33%
Polish zloty 3.9557 4.1048 -3.63%
Chilean peso 625.6500 727.6300 -14.02%
Average exchange rate
2010 2009 CHANGE 10/09
Pound sterling 0.8561 0.8888 -3.68%
US dollar 1.3211 1.3952 -5.31%
Canadian dollar 1.3674 1.5810 -13.51%
Polish zloty 3.9915 4.3448 -8.13%
Chilean peso 673.8300 771.7983 -12.69%
3.3 Credit and counterparty risk
The Group’s main financial assets exposed to credit risk or counterparty risk are as follows: a) Investments in financial assets included in cash and cash equivalents (short term) (Note 19)
b) Non-current financial assets (Note 10) c) Derivative financial instruments (Note 11) d) Trade and other receivables (Note 14)
The Group’s overall exposure to credit risk is equal to the balance of the above-mentioned items, as the Group has not granted any credit lines to third parties. As regards the risk incurred by investing in financial products or arranging derivative financial instruments (included in letters a, b and c), Ferrovial has established internal criteria to minimise credit risk, stipulating that counterparties must always have high credit ratings received from prestigious international rating agencies. Ferrovial also imposes maximum limits on amounts invested or arranged, which are periodically reviewed. In the case of transactions in countries whose economic and socio-political circumstances preclude high credit quality, the Group mainly selects branches and subsidiaries of foreign entities that met or nearly meet the stipulated credit requirements, or the largest local entities. In the specific case of restricted cash linked to infrastructure project financing, the financing contracts that provide for the amounts that must be set aside as restricted cash usually also stipulate the conditions that must be fulfilled by the financial products in which these obligations must be instrumented.
With respect to risks related to trade receivables (included in letter d) and non-current receivables (letter b), there are a wide variety of customers, a large proportion of which are public-sector entities. 72% of all the Group’s non-current and current receivables relate to public-sector agencies.
3.4 Liquidity risk In the current market environment, in which a major financial crisis caused a widespread credit crunch in 2010 (as in 2009), Ferrovial adopted a proactive approach to liquidity risk management, focusing basically on the preservation of the Company’s liquidity and on settling financial transactions before they mature. This policy is based on four main pillars: 1.- Efficient working capital management to ensure timely
fulfilment of payment obligations by customers. 2.- Monetisation of financial assets, where this can be done
under reasonable market conditions, through the factoring and discounting of future collection rights.
3.- Integral cash management, in order to optimise daily
liquidity positions at the various companies by setting up a global cash management system.
4.- Setting up short-term credit lines that guarantee the
availability of cash and the payment of obligations in the event of periods of difficulty in relation to collections and available balances.
The Group has also sought to always utilise available cash to settle payment obligations and liabilities in advance. Infrastructure projects: Liquidity risk must be analysed separately for each individual infrastructure project since there is specific financing for each project and the projects are independent units for liquidity purposes. In general, debt maturities are monitored carefully for each project. Note 19 contains a breakdown showing that 56% of the project financing falls due after more than five years. The fact that these are long-term projects with foreseeable flows generally allows for the arrangement of financing structures linked to estimated project flows. Also, during the performance of the projects, the Group seeks to apply an active refinancing policy to maximise cash generation.

Consolidated financial statements for 2010 and 2009 Ferrovial S.A. and Subsidiaries
Ferrovial, S.A. Consolidated financial statements at 31 December 2010 21
The refinancing processes include most notably the subordinated debt and part of BAA’s refinancing facility, which are addressed in more detail in Note 19. As indicated above, certain infrastructure project financing contracts stipulate the need to hold accounts (restricted cash) the availability of which is restricted under the financing contracts as security for certain short-term obligations, related to interest or principal repayments, as well as infrastructure maintenance and operation. These accounts are an additional guarantee with respect to liquidity risk (see breakdown in Note 19). The borrowings falling due in 2011 relating to infrastructure projects total EUR 1,147 million, relating mainly to the Ausol and Inversora Autopista del Sur toll road projects. A breakdown of these maturities is provided in Note 19. The Group seeks to cover all obligations to make new investments by means of specific-purpose financing before the investment is made. Note 19 contains a breakdown of the balances available to fulfil these requirements. To conclude on all the preceding sections, the liquidity position of the infrastructure projects in 2010 is explained below: - At 31 December 2010, cash and cash equivalents (including short-term restricted cash) amounted to EUR 700 million.
- Also, at that date, undrawn credit lines amounted to EUR 4,453 million, which were arranged mainly to cover committed investment needs.
- The projects have the capacity to generate significant and recurring cash flows from operating activities (cash flows obtained from these projects in 2010 totalled EUR 1,828 million; see Note 31 on cash flows).
- The capacity to increase the volume of debt in certain projects, based on growth in operating variables.
Other Group activities Unlike in the case of infrastructure projects, liquidity risk is managed on an overall basis for the rest of the Group’s activities, particularly for activities carried on in Spain. Liquidity risk management also focuses on closely monitoring debt maturities (also explained in Note 19) and on proactive management and maintenance of credit lines to cover forecast cash needs.
The borrowings for other activities falling due in 2011 total EUR 59 million. A breakdown of these maturities is provided in Note 19. The liquidity position of the Group’s other activities in 2010 is based on the following factors: - At 31 December 2010, cash and cash equivalents (including short-term restricted cash) amounted to EUR 2,005 million.
- Also, at that date, undrawn credit lines totalled EUR 919 million.
- The Group’s business areas have the capacity to generate significant and recurring cash flows from operating activities (cash flows from operating activities obtained in 2010 totalled EUR 811 million; see Note 31 on cash flows).
- The capacity to increase debt volumes based on the current moderate level of debt and on the Group’s capacity to generate recurring cash flows.
Lastly, as regards liquidity risk management, at both Group level and in each business area and project, systematic forecasts are prepared on cash generation and needs in order to determine and monitor the Group’s liquidity position on an ongoing basis. 3.5 Equity risk Ferrovial is also exposed to risk relating to the evolution of the share prices of listed companies. This exposure arises specifically in equity swaps linked to share-based payment: As indicated in Note 11 on derivative financial instruments and Note 33 on share-based payment, Ferrovial has arranged equity swaps to hedge possible disbursements that may be required in relation to executive remuneration systems linked to the price of Ferrovial shares. The equity swaps eliminate uncertainty with respect to the exercise price of the remuneration systems; however, as they are not deemed to be hedging derivatives under International Accounting Standards, their market value has an impact on the income statement, which is positive if the share price rises and negative if the share price falls. Specifically, in 2010 Ferrovial’s closing share price was EUR 7.44, and Ferrovial recognised an expense of EUR 39 million (see Note 11) which had an impact of EUR 24 million on the net profit.

Consolidated financial statements for 2010 and 2009 Ferrovial S.A. and Subsidiaries
Ferrovial, S.A. Consolidated financial statements at 31 December 2010 22
3.6. Inflation risk The Company has contracted derivative financial instruments linked to the evolution of the CPI, as explained in Note on fair value adjustments, in relation to the measurement of index-linked swaps. These instruments have mainly been arranged by BAA and are measured based on the inflation rate forecast for the periods covered by the derivatives (see Note 11 on derivative financial instruments for more details). A 1% rise in the inflation rate during the term of the derivative, without any change in the interest rate, would have an impact of EUR -478 million on the fair value of these derivatives and of EUR -277 million on the net profit. 3.7. Management of capital The Group’s objective in equity management is to safeguard its capacity to continue managing its recurring activities and the capacity to continue to grow through new projects, by optimising the debt-equity ratio to create shareholder value. Since the Group was listed on the stock exchange in 1999, capitalisation has remained steady, except for the effect generated in the merger with Cintra in 2009, and there have been no new equity issues. Growth has been financed in three ways: - Internal cash flows generated from the Group’s recurring businesses.
- Capacity to grow through investments in new infrastructure projects financed largely by borrowings secured by project flows, thereby feeding back funds to boost the Group’s capacity for growth in its recurring activities.
- Asset turnover policy focused on the sale of mature projects in order to continue financing investments in new projects. The Group’s optimum leverage ratio is not determined on the basis of its overall debt-equity ratio but it is based rather on the different levels on which the debt is structured, as follows:
- In the case of infrastructure projects, each project is assigned a leverage ratio linked to its operating variables or forecast future cash flows. A high leverage ratio is justified by the existence of long-term projects with recurring and predictable flows. In the case of regulated airports, the leverage ratio is based on the debt-to-RAB ratio (as indicated earlier, the RAB is used to calculate prices and is therefore a key element when determining future flows).
- For the Group’s other companies (excluding infrastructure projects, which mainly involve corporate debt), the aim is to maintain a moderate leverage ratio based on the general reference levels determined by rating agencies for “investment grade” companies; in Ferrovial’s case, this is usually determined based on a ratio combining the gross profit from operations (indicator linked to recurring cash flows) and net borrowings in those areas.

Consolidated financial statements for 2010 and 2009 Ferrovial S.A. and Subsidiaries
4. Segment reporting
The “Other” column in the balance sheet and income statement by segment includes the assets and/or liabilities and income and/or expenses of the companies not assigned to any of the business segments, including most notably the Parent Ferrovial, S.A. and its smaller subsidiaries, the Polish real estate business, and inter-segment adjustments. Set out below are the segment balance sheets for 2010, 2009, 2008 and the segment income statements for 2010 and 2009:
Segment balance sheet: 2010 (Million Euro) Assets Construction Toll roads Airports Services Other Total
Non-current assets 722 11,411 20,871 1,913 549 35,465
Goodwill 178 390 3,575 889 0 5,032
Intangible assets 7 0 0 90 1 97
Investments in Infrastructure Projects 0 5,021 16,561 145 -215 21,512
Investment property 0 0 0 0 64 64
Property, plant and equipment 109 2 0 384 57 552
Investments in associates 15 3,054 0 41 0 3,110
Non-current financial assets 208 1,680 81 219 -4 2,184
Receivable from Group companies 0 0 31 0 -31 0
Other 208 1,680 50 219 27 2,184
Pension surplus 0 0 0 0 0 0
Deferred tax assets 203 1,075 0 146 643 2,068
Derivative financial instruments at fair value 1 190 653 0 3 847
Assets classified as held for sale and discontinued operations
1 28 0 1,486 0 1,515
Current assets 4,536 1,212 906 1,292 -1,639 6,306 Inventories 204 14 8 16 204 445 Trade and other receivables 1,631 406 406 1,110 -392 3,161
Cash and cash equivalents 2,702 792 492 167 -1,451 2,701
Receivable from Group companies 1,637 398 0 33 -2,067 0
Other 1,065 394 492 134 616 2,701
TOTAL ASSETS 5,259 12,650 21,777 4,691 -1,091 43,287
Equity and Liabilities Construction Toll roads Airports Services Other Total
Equity 362 4,227 2,557 1,142 -1,659 6,628
Equity attributable to the equity holders 292 4,024 1,430 1,120 -1,672 5,194
Non-controlling interests 69 203 1,127 22 12 1,434
Deferred income 9 170 4 14 0 196
Non-current liabilities 699 6,891 18,148 1,467 1,391 28,596
Provisions for pensions 1 0 77 74 0 153
Other long-term provisions 74 595 9 122 60 860
Bank borrowings 539 4,633 14,737 1,009 591 21,511
Payable to Group companies 369 0 0 855 -1,224 0
Other 170 4,633 14,737 154 1,815 21,511
Other payables 11 114 0 17 13 154
Deferred tax liabilities 71 801 2,418 213 448 3,951
Derivative financial instruments at fair value 2 747 908 32 278 1,968
Liabilities classified as held for sale and discontinued operations
0 0 0 891 0 891
Current liabilities 4,190 1,362 1,068 1,177 -822 6,975
Bank borrowings 15 1,169 292 466 -412 1,530
Payable to Group companies 0 33 12 395 -441 0
Other 15 1,136 280 71 29 1,530
Trade and other payables 3,679 193 731 696 -411 4,889
Operating provisions 495 0 46 14 1 556
TOTAL EQUITY AND LIABILITIES 5,259 12,650 21,777 4,691 -1,091 43,287

Consolidated financial statements for 2010 and 2009 Ferrovial S.A. and Subsidiaries
Ferrovial, S.A. Consolidated financial statements at 31 December 2010 24
Segment balance sheet: 2009 (Million Euro) Assets Construction Toll roads Airports Services Other Total
Non-current assets 638 10,975 21,429 2,758 249 36,048
Goodwill 169 1,559 3,813 1,411 0 6,952
Intangible assets 7 0 0 38 0 45
Investments in Infrastructure Projects 0 7,269 16,253 166 -68 23,621
Investment property 0 0 0 0 77 77
Property, plant and equipment 119 1 0 510 39 669
Investments in associates 16 62 0 183 0 262
Non-current financial assets 147 1,319 182 214 72 1,935
Receivable from Group companies 0 0 0 0 0 0
Other 147 1,319 182 214 72 1,935
Pension surplus 0 0 0 22 0 22
Deferred tax assets 178 708 398 213 108 1,604
Derivative financial instruments at fair value 2 56 781 0 22 861
Assets classified as held for sale and discontinued operations
1 1,641 116 44 0 1,802
Current assets 4,048 823 957 1,519 -1,197 6,150 Inventories 185 11 7 21 265 489 Trade and other receivables 1,505 355 312 1,244 -236 3,181
Cash and cash equivalents 2,357 458 638 254 -1,227 2,480
Receivable from Group companies 1,368 6 2 0 -1,375 0
Other 990 452 636 253 149 2,480
TOTAL ASSETS 4,686 13,439 22,502 4,321 -949 43,999
Equity and Liabilities Construction Toll roads Airports Services Other Total
Equity 215 1,647 3,207 1,050 -1,399 4,719
Equity attributable to the equity holders 152 1,552 1,769 1,036 -1,409 3,102
Non-controlling interests 63 95 1,437 14 9 1,617
Deferred income 10 194 5 24 -1 232
Non-current liabilities 596 8,512 17,909 1,119 1,615 29,751
Provisions for pensions 1 -1 313 190 0 503
Other long-term provisions 50 697 29 148 30 954
Bank borrowings 459 6,981 14,028 626 1,274 23,368
Payable to Group companies 356 0 0 339 -695 0
Other 103 6,981 14,028 287 1,969 23,368
Other payables 9 113 0 10 3 136
Deferred tax liabilities 71 226 2,882 132 142 3,454
Derivative financial instruments at fair value 5 496 656 13 166 1,336
Liabilities classified as held for sale and discontinued operations
0 1,608 5 34 0 1,647
Current liabilities 3,865 1,478 1,377 2,094 -1,164 7,650
Bank borrowings 38 1,101 538 1,225 -966 1,937
Payable to Group companies 5 4 94 1,137 -1,240 0
Other 33 1,097 444 88 274 1,937
Trade and other payables 3,401 376 775 840 -198 5,194
Operating provisions 426 0 63 29 1 519
TOTAL EQUITY AND LIABILITIES 4,686 13,439 22,502 4,321 -949 43,999

Consolidated financial statements for 2010 and 2009 Ferrovial S.A. and Subsidiaries
Ferrovial, S.A. Consolidated financial statements at 31 December 2010 25
Segment balance sheet: 2008 (Million Euro) Assets Construction Toll roads Airports Services Other Total
Non-current assets 662 8,988 20,430 2,667 153 32,900
Goodwill 171 321 3,527 1,382 0 5,400
Intangible assets 7 0 0 56 0 63
Investments in Infrastructure Projects 1 6,817 14,966 133 -77 21,839
Investment property 0 0 0 0 92 92
Property, plant and equipment 138 0 0 465 17 620
Investments in associates 16 40 65 166 0 286
Non-current financial assets 156 974 142 258 -6 1,524
Receivable from Group companies 39 0 0 0 -39 0
Other 117 974 142 258 32 1,524
Pension surplus 0 0 76 0 0 76
Deferred tax assets 175 738 640 206 100 1,859
Derivative financial instruments at fair value 0 98 1,013 0 28 1,139
Assets classified as held for sale and discontinued operations
5 1,708 2,563 2 0 4,278
Current assets 4,390 1,034 1,025 1,469 -1,292 6,626 Inventories 203 4 6 17 268 498 Trade and other receivables 1,929 283 366 1,252 -203 3,626
Cash and cash equivalents 2,259 748 653 200 -1,357 2,502
Receivable from Group companies 1,329 0 69 2 -1,400 0
Other 930 747 584 198 43 2,502
TOTAL ASSETS 5,058 11,730 24,017 4,138 -1,139 43,804
Equity and Liabilities Construction Toll roads Airports Services Other Total
Equity 373 954 1,182 914 675 4,098
Equity attributable to the equity holders 307 679 -747 897 664 1,801
Non-controlling interests 66 274 1,929 16 11 2,296
Deferred income 13 201 8 28 0 250
Non-current liabilities 542 8,575 19,683 1,083 -737 29,146
Provisions for pensions 1 0 0 131 0 132
Other long-term provisions 45 371 115 151 27 708
Bank borrowings 331 6,765 15,708 598 -990 22,413
Payable to Group companies 220 0 1,300 339 -1,858 0
Other 112 6,765 14,408 259 868 22,413
Other payables 9 96 0 13 1 119
Deferred tax liabilities 57 328 2,850 126 97 3,458
Derivative financial instruments at fair value 98 1,016 1,011 64 129 2,319
Liabilities classified as held for sale and discontinued operations
1 1,484 1,679 0 0 3,163
Current liabilities 4,130 517 1,465 2,112 -1,077 7,147
Bank borrowings 66 422 626 1,237 -799 1,552
Payable to Group companies 0 6 198 1,035 -1,239 0
Other 66 416 428 201 441 1,552
Trade and other payables 3,745 94 772 810 -279 5,142
Operating provisions 319 0 67 66 0 452
TOTAL EQUITY AND LIABILITIES 5,058 11,730 24,017 4,138 -1,139 43,804
The detail, by segment, of the acquisitions made, as required by IFRS 8, is as follows:
Million Euro
Additions to infrastructure projects
Additions to property, plant and equipment
Additions to intangible assets and goodwill
Additions of associates
2010 2009 2010 2009 2010 2009 2010 2009
Construction 0 0 31 30 1 0 1 0
Airports 1,085 983 0 0 0 10 0 0
Toll roads 788 333 0 0 6 0 3,082 7
Services 69 32 74 144 21 7 5 0
Other 0 0 4 6 0 0 0 0
Total 1,942 1,348 108 180 28 17 3,088 7
The additions to infrastructure projects are broken down by business segment in Note 7.

Consolidated financial statements for 2010 and 2009 Ferrovial S.A. and Subsidiaries
Segment income statement: 2010
Construction Toll roads Airports Services Other Total
(Million Euro) Before fair value adj.
Fair value adj.
Total Before fair value adj.
Fair value adj.
Total
Before fair value adj.
Fair value adj.
Total
Before fair value adj.
Fair value adj.
Total
Before fair value adj.
Fair value adj.
Total Before fair value adj.
Fair value adj.
Total
Revenue 4,525 0 4,525 869 0 869 2,799 0 2,799 3,896 0 3,896 80 0 80 12,169 0 12,169
Other operating revenue 6 0 6 0 0 0 0 0 0 11 0 11 0 0 0 17 0 17
Total operating revenue 4,531 0 4,531 869 0 869 2,799 0 2,799 3,907 0 3,907 80 0 80 12,186 0 12,186
Materials consumed 940 0 940 3 0 3 54 0 54 419 0 419 70 0 70 1,486 0 1,486
Other external expenses 1,477 0 1,477 9 0 9 1 0 1 124 0 124 -15 0 -15 1,596 0 1,596
Staff costs 642 0 642 73 0 73 611 0 611 2,036 0 2,036 60 0 60 3,422 0 3,422
Change in operating provisions 111 0 111 14 0 14 0 0 0 25 0 25 24 1 25 174 1 175
Other operating expenses 1,129 0 1,129 140 0 140 861 0 861 894 0 894 -32 0 -32 2,992 0 2,992
Total operating expenses 4,300 0 4,300 239 0 239 1,527 0 1,527 3,498 0 3,498 107 1 108 9,671 1 9,672
GROSS PROFIT OR LOSS FROM OPERATIONS 231 0 231 630 0 630 1,272 0 1,272 410 0 410 -27 -1 -28 2,516 -1 2,514
Depreciation and amortisation charge 40 0 40 113 0 113 716 0 716 129 0 129 3 0 3 1,000 0 1,000
Profit or loss from operations before impairment and non-current asset disposals 191 0 191 517 0 517 556 0 556 281 0 281 -29 -1 -31 1,516 -1 1,514
Impairment and disposals of non-current assets 0 0 0 680 1,886 2,567 56 -734 -678 4 0 4 0 -13 -13 740 1,139 1,879
Profit or loss from operations 191 0 191 1,197 1,886 3,084 612 -734 -122 284 0 284 -30 -14 -44 2,256 1,138 3,393
Finance income of infrastructure projects 0 0 0 18 0 18 0 0 0 1 0 1 0 0 0 19 0 19
Finance expenses of infrastructure projects -4 0 -4 -544 0 -544 -984 0 -984 -12 0 -12 2 0 2 -1,543 0 -1,543
Gains and losses on derivative financial instruments and other fair value adjustments 0 0 0 0 5 5 0 -51 -51 0 -2 -2 0 0 0 0 -48 -48
Financial result of infrastructure projects -4 0 -4 -526 5 -521 -984 -51 -1,035 -11 -2 -13 1 0 1 -1,524 -48 -1,572
Finance income of other companies 96 0 96 17 0 17 1 0 1 64 0 64 -25 0 -25 153 0 153
Finance expenses of other companies -56 0 -56 -20 0 -20 0 0 0 -113 0 -113 -86 0 -86 -275 0 -275
Gains and losses on derivative financial instruments and other fair value adjustments 0 0 0 0 0 0 0 0 0 0 0 0 0 -30 -30 0 -31 -31
Financial result of other companies 40 0 40 -4 0 -4 1 0 1 -49 0 -49 -111 -30 -141 -122 -31 -153
Financial result 36 0 36 -530 5 -525 -983 -51 -1,034 -61 -2 -62 -109 -30 -140 -1,646 -79 -1,725
Share of profits of companies accounted for using the equity method -1 0 -1 17 3 20 6 6 12 31 0 31 0 0 0 53 8 62
Consolidated profit or loss before tax 226 0 226 685 1,894 2,579 -364 -780 -1,144 255 -2 253 -139 -45 -184 663 1,067 1,730
Income tax -71 0 -71 -136 27 -108 215 88 303 -105 1 -104 52 13 66 -44 129 85
Consolidated profit or loss from continuing operations 156 0 156 549 1,921 2,470 -149 -692 -841 150 -2 149 -87 -31 -118 619 1,196 1,815
Net profit or loss from discontinued operations 0 0 0 0 0 0 0 0 0 0 0 0 0 0 0 0 0 0
Consolidated profit or loss for the year 156 0 156 549 1,921 2,470 -149 -692 -841 150 -2 149 -87 -31 -118 619 1,196 1,815
Profit or loss for the year attributable to non-controlling interest -21 0 -21 6 4 10 62 305 367 -5 0 -5 -4 0 -4 38 310 348
Profit or loss for the year attributable to the Parent 135 0 135 555 1,925 2,480 -87 -387 -474 146 -2 144 -91 -31 -122 657 1,506 2,163
(*) Relating to gains and losses arising from changes in the fair value of derivatives, other financial assets and liabilities and assets and liability impairment (see Note 24).

Consolidated financial statements for 2010 and 2009 Ferrovial S.A. and Subsidiaries
Segment income statement: 2009
Construction Toll roads Airports Services Other Total
(Million Euro) Before fair value adj.
Fair value adj.
Total
Before fair value adj.
Fair value adj.
Total
Before fair value adj.
Fair value adj.
Total
Before fair value adj.
Fair value adj.
Total
Before fair value adj.
Fair value adj.
Total
Before fair value adj.
Fair value adj.
Total
Revenue 4,475 0 4,475 990 0 990 3,070 0 3,070 3,763 0 3,763 -66 0 -66 12,232 0 12,232
Other operating revenue 19 0 19 0 0 0 0 0 0 11 0 11 0 0 0 30 0 30
Total operating revenue 4,494 0 4,494 990 0 990 3,070 0 3,070 3,774 0 3,774 -66 0 -66 12,262 0 12,262
Materials consumed 936 0 936 6 0 6 73 0 73 464 0 464 8 0 8 1,487 0 1,487
Other external expenses 1,606 0 1,606 -8 0 -8 6 0 6 149 0 149 -107 0 -107 1,645 0 1,645
Staff costs 655 0 655 106 0 106 652 0 652 1,947 0 1,947 62 0 62 3,423 0 3,423
Change in operating provisions 127 0 127 24 0 24 0 0 0 19 0 19 1 1 3 172 1 174
Other operating expenses 942 0 942 197 0 197 1,000 2 1,002 828 0 828 -28 0 -28 2,939 2 2,941
Total operating expenses 4,266 0 4,266 326 0 326 1,732 2 1,733 3,408 0 3,408 -64 1 -63 9,667 3 9,670
GROSS PROFIT OR LOSS FROM OPERATIONS 228 0 228 664 0 664 1,339 -2 1,337 366 0 366 -2 -1 -4 2,595 -3 2,591
Depreciation and amortisation charge 45 0 45 106 0 106 726 0 726 124 0 124 3 0 3 1,005 0 1,005
Profit or loss from operations before impairment and non-current asset disposals 183 0 183 558 0 558 613 -2 611 241 0 241 -5 -1 -7 1,590 -3 1,587
Impairment and disposals of non-current assets 0 0 0 95 0 95 -747 -53 -800 1 0 1 31 -37 -6 -620 -90 -710
Profit or loss from operations 183 0 183 653 0 653 -134 -55 -189 242 0 242 26 -39 -13 969 -93 876
Finance income of infrastructure projects 0 0 0 36 0 36 0 0 0 9 0 9 0 0 0 45 0 45
Finance expenses of infrastructure projects -4 0 -4 -539 0 -539 -894 0 -894 -10 0 -10 1 0 1 -1,446 0 -1,446
Gains and losses on derivative financial instruments and other fair value adjustments 0 0 0 0 -47 -47 0 -100 -100 0 -1 -1 0 0 0 0 -148 -148
Financial result of infrastructure projects -4 0 -4 -503 -47 -550 -894 -100 -994 -2 -1 -3 1 0 1 -1,402 -148 -1,550
Finance income of other companies 78 0 78 7 0 7 -2 0 -2 51 0 51 -12 0 -12 122 0 122
Finance expenses of other companies -34 0 -34 -25 0 -25 0 0 0 -103 0 -103 -64 0 -64 -226 0 -226
Gains and losses on derivative financial instruments and other fair value adjustments 0 0 0 0 9 9 0 0 0 0 0 0 0 89 89 0 98 98
Financial result of other companies 44 0 44 -18 9 -9 -2 0 -2 -52 0 -52 -76 89 13 -103 98 -5
Financial result 41 0 41 -521 -38 -559 -896 -100 -996 -54 -1 -55 -75 89 14 -1,505 -50 -1,555
Share of profits of companies accounted for using the equity method 0 0 0 16 0 16 14 14 27 39 2 41 0 0 0 69 16 85
Consolidated profit or loss before tax 224 0 224 148 -38 111 -1,016 -141 -1,157 227 1 227 -50 51 1 -467 -127 -594
Income tax -66 0 -66 25 13 38 92 43 135 0 0 0 33 -15 18 84 41 125 Consolidated profit or loss from continuing operations 158 0 158 174 -25 149 -924 -98 -1,022 226 1 227 -16 35 19 -383 -86 -469
Net profit or loss from discontinued operations 0 0 0 0 0 0 0 0 0 0 0 0 0 0 0 0 0 0
Consolidated profit or loss for the year 158 0 158 174 -25 149 -924 -98 -1,022 226 1 227 -16 35 19 -383 -86 -469
Profit or loss for the year attributable to non-controlling interest -13 0 -13 -46 18 -28 402 43 445 -6 0 -6 -2 0 -2 334 61 395
Profit or loss for the year attributable to the Parent 144 0 144 128 -7 121 -522 -55 -577 220 1 221 -19 36 17 -48 -25 -74
(*) R Relating to gains and losses arising from changes in the fair value of derivatives, other financial assets and liabilities and assets and liability impairment (see Note 24).

Consolidated Financial Statements for 2010 and 2009 Ferrovial, S.A. and Subsidiaries
The detail, by segment, of revenue in 2010 and 2009 is as follows:
Million Euro 2010 2009
External sales
Inter-segment sales
Total External sales Inter-segment sales
Total
Construction 4,310 215 4,525 4,357 119 4,476 Airports 2,794 5 2,799 3,070 0 3,070 BAA 2,790 0 2,790 3,067 0 3,067 Other airports 4 5 9 3 0 3 Toll roads 815 54 869 989 1 990 Services 3,823 73 3,896 3,754 9 3,763 Other and adjustments -11 91 80 -153 86 -67 Total 11,731 438 12,169 12,017 215 12,232
Geographical areas
The breakdown of assets, additions and revenue by geographical area is as follows:
Million Euro
Total assets
Additions to infrastructure projects, property, plant and equipment, intangible assets, goodwill and companies accounted for using the
equity method
Revenue
2010 2009 2008 2010 2009 2010 2009
Spain 9,116 9,035 9,187 206 185 3,765 4,350 United Kingdom 22,942 23,458 24,269 1,126 1,018 4,203 4,432 USA 3,894 2,608 2,300 633 164 1,024 797 Canada 2,938 3,263 2,817 2,923 49 384 391 Poland 1,186 982 953 10 5 1,170 779 Chile 39 1,663 1,282 159 0 202 238 Portugal 1,042 1,006 931 89 102 253 222 Rest of Europe 1,969 1,823 1,876 9 19 888 785 Other 162 161 188 13 11 281 237 Total 43,287 43,999 43,804 5,167 1,552 12,169 12,232
In addition to the information by geographical area included in this Note, further information is provided in the following notes:
• Note 7 contains an detail of infrastructure projects by business segment and, for the main groups of separate projects, by geographical segment.
• Note 19 contains a detail of the net cash position, distinguishing between infrastructure projects and other companies, including a breakdown by segment for the two areas.
• Note 31 contains a detail of cash flows, distinguishing between infrastructure projects and other companies, including a breakdown by segment for the two areas.
5. Goodwill and acquisitions
The changes in “Goodwill”, by segment, in 2010 were as follows:
Million Euro
MOVEMENTS DURING 2010
Balances at
01/01/10
Exchange rate
Investment Disposal / Other
Impairment Balance at 31/12/10
Airports 3,813 131 -75 -294 3,575 Heathrow 3,102 109 0 0 3,211 Other airports 711 21 -75 -293 364
Services 1,411 116 -638 0 889 Amey 426 15 0 0 441 Cespa 421 0 0 0 421 Swissport 545 101 -646 0 0 Other services 19 0 8 0 27
Construction 169 10 0 0 179 Webber 97 7 0 0 104 Budimex 72 3 0 0 75
Toll roads 1,559 6 -1,176 0 389
Total 6,952 263 -1,889 -294 5,032

Consolidated Financial Statements for 2010 and 2009 Ferrovial, S.A. and Subsidiaries
Ferrovial, S.A. Consolidated financial statements at 31 December 2010 29
The most significant change is in the Airports Division (BAA) due to the impairment of “other airports” amounting to EUR 293 million (impact on Ferrovial’s net profit of EUR -162 million) and to the sale of Naples airport, as a result of which goodwill amounting EUR 75 million was derecognised. In the Services Division the main change related to the transfer of Swissport to “held for sale”, as a result of which goodwill totalling EUR 646 million was derecognised. In the Toll Roads Division, the main changes were due to the reclassification of the goodwill of Trados 45 (EUR 6 million) to “assets held for sale” and to the derecognition of the goodwill associated with the 407-ETR toll road, (EUR 1,081 million), a company that started to be accounted for using the equity method, as described in Notes 2, Changes in the scope of consolidation, and 9, Investments in associates. The following section describes the methodology and assumptions used in the impairment tests. A. Goodwill of BAA: The goodwill is the excess amount paid to acquire BAA over the value of the assets at the acquisition date (June 2006), representing the long-term growth potential of the business, based on expectations of significant additional investments that will allow considerable traffic growth in the coming years. The recoverable amount of the airports was calculated as the higher of fair value less estimated costs to sell and value in use. Value in use was calculated by discounting projected cash flows, based on the business plan for each airport until 2056, using the Adjusted Present Value (APV) method. The Company considers that this is the minimum period necessary for a discounted cash flow model to reflect the huge growth potential of this infrastructure, involving major investments, and that this is the methodology that best reflects the value in use of this business. The cash flows were discounted to the middle of the period and the residual value applied in the final year modelled was calculated using the Gordon Shapiro formula and a perpetuity growth rate of 1.5%. The business plan calculations for Heathrow airport were obtained by applying the Building Blocks methodology used by the UK airport regulator CAA (Civil Aviation Authority) and the UK’s Competition Commission. Under this methodology, the profitability of these regulated assets is determined by the Regulated Asset Base (RAB), the future Capital Investment Programme and the return on assets. The regulator stipulated in its decision of March 2008 (Heathrow) the aeronautical charges for the following five-year period, based on a return on assets (before taxes and inflation) of 6.2% for Heathrow. Return on assets increases from the sixth five-year period onwards, in line with the latest decisions in regulated sectors in the United Kingdom. As a result of the position of the new government in the United Kingdom with regard to development of the third runway at Heathrow, the business plans were updated, assuming a five year delay in the construction of Heathrow’s third runway, with respect to the assumptions used in the December 2009 impairment tests. The Company considers this to be reasonable for Heathrow because, in its opinion, long-term demand projections for the south east of England support the need for new runways or making significant alternative investments, and there are currently no feasible alternatives at Heathrow for satisfying the above-mentioned increased demand. At any rate, if a scenario were chosen in which the third runway were not built, the goodwill relating to Heathrow would not become impaired. In the Company’s opinion, there are no reasonable changes in the main assumptions that would eliminate the excess recoverable amount of Heathrow or the need to recognise an additional impairment loss for the other airports. The deleveraged discount rates (Ku) used to value Heathrow airport are consistent with the return on RAB used to project the cash flows, and was adjusted on the basis of recent short-term inflation estimates. From 2015 onwards, the deleveraged discount rate is 8.14%, with an inflation of 2.75%. The tax shield of the debt was discounted using the cost of the debt. The projections for the other airports reflect the best estimates in terms of the evolution of passenger traffic and charges, taking into account the negative evolution of passengers witnessed in 2010, and in terms of investments, where the investment volume was considerably reduced with respect to 2009, including most notably the discontinuation of investments in Stansted’s second runway, based on the position announced by the British government. The deleveraged discount rates (Ku) used to value the other airports range from 8.6% to 9.6%. After calculating various different sensitivities and scenarios, an impairment loss of EUR 293 million was recognised for the other airports (EUR 162 million reduction in the net profit).

Consolidated Financial Statements for 2010 and 2009 Ferrovial, S.A. and Subsidiaries
Ferrovial, S.A. Consolidated financial statements at 31 December 2010 30
B. Services Division goodwill (Amey and Cespa): Goodwill is tested for impairment in these two business areas by using cash flow projections for a five-year period. The residual value is based on the cash flow for the last year projected, provided this represents a cash flow with no exceptional factors, and the growth rate applied in no case exceeds the estimated long-term growth rate for the market in which the Company operates. Cash flows are discounted using a rate based on the weighted average cost of capital (WACC) for this type of assets. Ferrovial used a market premium of 5.5%, based on recent studies of long-term premiums. Additionally, in order to reflect each company’s exposure, backlogs of comparable companies were selected to carry out regression analyses and obtain deleveraged betas. The betas obtained were compared with other sources habitually used by analysts and investment banks (Barra Beta, Bloomberg, etc.). The projected flows are based on the latest estimates approved by the Company, which take into account recent historical data. The discount rates (WACC) used to test for impairment range from 6.7% to 7.6% (compared with the rates of the prior year that ranged from 6.8% to 7.2%) and perpetuity growth rates (g) ranged from 2.0% to 3.0% Sensitivity analyses are performed on this goodwill, particularly in relation to the gross profit from operations, the discount rate and the perpetuity growth rate, so as to ensure that possible changes in the estimate do not have an impact on the possible recovery of the goodwill recognised. The Company’s consider that there are no reasonable changes in the main assumptions that would eliminate the excess recoverable amount. C. Construction Division goodwill (Budimex and Webber): As Budimex is listed on the Warsaw Stock Exchange, its possible impairment was analysed by verifying that the closing share price was higher than the carrying amount plus the goodwill allocated to it. At 2010 year-end there was a considerable excess. The market value of Ferrovial’s interest in Budimex (59.1%) was EUR 379 million at 31 December 2010. In the case of Webber, the method used was similar to the method applied for the services companies, consisting of a discount rate (WACC) of 8.5% (compared with 8.6% for December 2009) and a perpetuity growth rate of 2.0%. The projected cash flows are based on the latest estimates approved by the Company, which take into account recent historical data. Growth in sales and the other operating variables were projected on the basis of the backlog. Sensitivity analyses are performed on Webber’s goodwill, particularly in relation to the gross profit from operations, the discount rate and the perpetuity growth rate, so as to ensure that possible changes in the estimate do not have an impact on the possible recovery of the goodwill recognised. The Company considers that there are no reasonable changes to the main assumptions that would eliminate the excess recoverable value. D. Toll Roads Division goodwill: The recoverable amount of the toll roads was calculated as the higher of fair value less estimated costs to sell and value in use. The value in use of concession operators with an independent financial structure and limited duration was calculated by discounting projected cash flows for the shareholder to the end of the concession term. The Company considers that value in use must be obtained using models that cover the entire concession term, as the assets are in different phases of investment and growth and there is sufficient visibility to use a specific economic and financial plan for each phase during the concession term. No residual value is considered to exist in these valuations. The projections were updated based on the historical evolution and specific features of each asset, using sophisticated, long-term modelling tools to estimate traffic, extraordinary maintenance, etc. These models or tools for traffic estimation use variables obtained largely from public sources (evolution of GDP, inflation, population, car ownership, status of alternative roads, etc.), and there are also specific models for estimating extraordinary maintenance based on various different variables (road surface condition, expected traffic, etc.). The forecast cash flows for the shareholder are discounted at an estimated cost of capital (ranging from 8.90% to 11.87%) based on a risk-free rate referenced to a 30-year bond, taking into account the location of each concession operator, a beta coefficient reflecting the company’s leverage and asset risk, and an estimated market premium of 5.5%. For toll roads where there is goodwill, mainly Autema, Chicago, the possible impairment was calculated by comparing the company’s carrying amount (equity plus net goodwill) with its value in use obtained by discounting cash flows, as described above. No evidence of the impairment of this goodwill was identified. The Company considers that are no reasonable changes in the main assumptions that would eliminate the excess recoverable amount.

Consolidated Financial Statements for 2010 and 2009 Ferrovial, S.A. and Subsidiaries
Ferrovial, S.A. Consolidated financial statements at 31 December 2010 31
6. Intangible assets It should be noted that “Intangible Assets” does not include the intangible assets assigned to infrastructure projects, which are included under “Investments in Infrastructure Projects” (see Note 7). The rights on concessions included under this caption are not assigned to any specific debt relating to these projects. The changes in “Intangible Assets” in the consolidated balance sheet in 2010 were as follows:
Million Euro
CHANGES IN 2010
Rights on Concession
Other intangible assets
TOTAL
Investment: Balance at 01/01/10 98 39 137
Additions 12 2 14
Disposals -8 0 -8 Changes in the scope of consolidation and transfers
117 0 117
Reclassification to “held for sale” -90 -10 -100
Exchange rate effect 15 2 17
Balance at 31/12/10 144 33 177
Accumulated amortisation: Balance at 01/01/10 -67 -25 -92
Charge for the year -12 -2 -14
Disposals 0 0 0 Changes in the scope of consolidation and transfers
-31 0 -31
Reclassification to “held for sale” 61 9 70
Exchange rate effect -11 -2 -13
Balance at 31/12/10 -60 -20 -80
Carrying amount at 31/12/10 84 13 97
The main change in this caption relates to the “Changes in the Scope of Consolidation”. The additions include the intangible assets of Amey-Cespa amounting to EUR 27 million arising from the acquisition of Donarbon (see Note 1.2) and the disposals include the assets of Tube Lines, which had a net carrying amount of EUR 30 million due to the sale of this Company. In the framework of the sale of Tube Lines, Amey will continue to provide Tube Lines with support services for maintenance management under the Opex Secondment Agreement, under very similar terms to the current terms. Noteworthy, in this regard, is the reclassification to this heading of intangible assets associated with these services for a net amount of EUR 83 million, which had previously been recognised under “Investments in Infrastructure Projects”. Also the intangible assets of Swissport amounting to EUR 31 million were transferred to “Assets Classified as Held for Sale” (see Note 12).

Consolidated Financial Statements for 2010 and 2009 Ferrovial, S.A. and Subsidiaries
Ferrovial, S.A. Consolidated financial statements at 31 December 2010 32
The changes in “Intangible Assets” in the consolidated balance sheet in 2009 were as follows:
Millions of euros
CHANGES IN 2009
Rights on Concession
Other intangible assets
TOTAL
Investment:
Balance at 01/01/09 101 39 140
Additions 4 4 8
Disposals 0 -5 -5 Changes in the scope of consolidation and transfers
Reclassification to “held for sale” -7 0 -7
Exchange rate effect 0 1 1
Balance at 31/12/09 98 39 137
Accumulated amortisation:
Balance at 01/01/09 -53 -24 -77
Charge for the year -15 -3 -18
Disposals 0 3 3 Changes in the scope of consolidation and transfers
0 0
Reclassification to “held for sale” 1 0 1
Exchange rate effect 0 -1 -1
Balance at 31/12/09 -67 -25 -92
Carrying amount at 31/12/09 31 14 45
• The only significant intangible asset with an indefinite useful life is the BAA Group’s right to operate certain non-regulated
airports, which arose in the business combination relating to the acquisition of that Group. As indicated in Note 7, this asset is not recognised under “Intangible Assets” but rather under “Investments in Infrastructure Projects”.
• At 31 December 2010, there were no significant intangible assets subject to ownership restrictions or pledged to secure
liabilities. • No. impairment losses on intangible assets were recognised or reversed in 2010. The internally generated intangible assets of BAA are disclosed separately in Note 7.

Consolidated Financial Statements for 2010 and 2009 Ferrovial, S.A. and Subsidiaries
Ferrovial, S.A. Consolidated financial statements at 31 December 2010 33
7. Investments in Infrastructure Projects 7.1 Overall information on Investments in Infrastructure Projects The detail, by project, of “Investments in Infrastructure Projects” and of the changes therein in 2010 and 2009 is as follows: (Million Euro)
CHANGES IN 2010
Balance at 01/01/10
Changes in the scope of consolidation
Additions Disposals and
transfers
Exchange rate effect
Balance at 31/12/10
Intangible asset model IFRIC 12
TOLL ROADS
407 ETR International 2,936 -3,311 375 0
Spanish toll roads 2,408 74 -1 0 2,481
US toll roads 1,606 626 -177 108 2,163
Other toll roads 1,181 87 -383 0 885
Investment in toll roads 8,131 -3,311 787 -561 483 5,529
Amortisation/Impairment -914 71 -245 478 -59 -669
Net investment in toll roads 7,217 -3,240 542 -83 424 4,860
SERVICES
Amey 117 -122 4 -1
Autovía de Aragón 40 46 -14 0 72
Other services 35 23 1 0 59
Investment in services 192 69 -135 4 130
Amortisation/Impairment -37 0 39 -1 1
Net investment in services 155 69 -96 3 131
Total investment 8,323 -3,311 856 -696 487 5,659
Total amortisation/impairment -951 71 -245 517 -60 -668
Total net investment 7,372 -3,240 611 -179 427 4,991
Other infrastructure projects
AIRPORTS
BAA 21,079 1,085 -232 738 22,670
Other airports 8 0 0 1 9
Total investment 21,087 1,085 -232 739 22,679
Amortisation/Impairment – BAA -4,830 -1,262 109 -166 -6,149
Amortisation/Impairment – Other airports
-8 -1 -9
Total amortisation/impairment -4,838 -1,262 109 -167 -6,158
Total net investment 16,249 -177 -123 572 16,521
TOTAL INVESTMENT 29,410 -3,311 1,941 -928 1,226 28,338 TOTAL AMORTISATION/ IMPAIRMENT
-5,789 71 -1,507 626 -227 -6,826
TOTAL INVESTMENT 23,621 -3,240 434 -302 999 21,512
The evolution of the euro exchange rate against the currencies of the countries in which there are significant investments in Investments in Infrastructure Projects (mainly the pound sterling) in 2010 gave rise to a net increase of EUR 999 million in these balances (EUR 1,366 million at 31 December 2009). The most significant changes in 2010 were as follows:
- Toll Roads Division: the main change relates to the derecognition from this heading of the assets in the Canadian 407 ETR toll road, as a result of the sale of 10% of that company, as described in Note 1.2, which started to be accounted for using the equity method.
As regards the toll roads in the United States, there were significant increases in the assets of the SH 130 (EUR 298 million), North Tarrant Express (EUR 173 million) and LBJ (EUR 126 million) toll roads, currently under construction. The main changes in relation to the other toll roads arose in Portugal, with additional investments totalling EUR 80 million in Euroscut Azores, a toll road under construction. Auto-Estradas Norte was reclassified to “Other Non-current Financial Assets” for a net amount of EUR 325 million, after the renegotiation of its concession contract with the Portuguese government in July 2010. Under the new agreement, the concession is now a payment for an availability model and the financial asset model provided for in IFRIC 12 is applied.

Consolidated Financial Statements for 2010 and 2009 Ferrovial, S.A. and Subsidiaries
Ferrovial, S.A. Consolidated financial statements at 31 December 2010 34
Additionally, applying the method described in Note 5.D, an impairment loss was recognised on for investments in toll roads amounting to EUR 186 million (with an impact of EUR -137 million on the net profit,) relating essentially to the portfolio of Spanish toll roads and other European toll roads, due to the negative evolution of traffic in 2010 and the updating of the long-term assumptions for these toll roads.
- Airports Division: the most significant additions relate to the BAA Group, amounting to EUR 1,085 million, of which EUR
958 million relate to additions of non-current assets in the course of construction, as analysed later. The changes in these assets in 2009 were as follows: (Million Euro)
MOVEMENTS DURING 2009
Balance at 01/01/09
Changes in the scope of consolidation
Additions Disposals and
transfers
Exchange rate effect
Balance at 31/12/09
Intangible asset model IFRIC 12
TOLL ROADS
407 ETR International 2,545 48 343 2,936
Spanish toll roads 2,377 34 -3 2,408
US toll roads 1,495 155 -44 1,606
Other toll roads 1,096 93 -8 1,181
Investment in toll roads 7,513 0 330 -11 299 8,131
Amortisation/Impairment -761 -106 43 -90 -914
Net investment in toll roads 6,752 0 224 32 209 7,217
SERVICES 0
Amey 109 8 117
Autovía de Aragón 0 28 12 40
Other services 39 -4 35
Investment in services 148 32 12 192
Amortisation/Impairment -28 -9 -37
Net investment in services 120 23 12 155
Total investment 7,661 0 362 1 299 8,323
Total amortisation/impairment -789 0 -115 43 -90 -951
Total net investment 6,872 0 247 44 209 7,372
Other infrastructure projects
AIRPORTS
BAA 18,842 7 984 -209 1,455 21,079
Other airports 6 1 1 8
Total investment 18,848 8 984 -209 1,456 21,087
Amortisation/Impairment – BAA -3,875 -724 67 -298 -4,830
Amortisation/Impairment – Other airports
-6 -1 -1 -8
Total amortisation/impairment -3,881 -1 -724 67 -299 -4,838
Total net investment 14,967 7 260 -141 1,157 16,249
TOTAL INVESTMENT 26,509 8 1,346 -208 1,755 29,410 TOTAL AMORTISATION/ IMPAIRMENT
-4,670 -1 -839 110 -389 -5,789
TOTAL INVESTMENT 21,839 7 507 -98 1,366 23,621
With the exception of BAA, which is owned, the other assets are held under concessions. The changes relating to BAA are explained in more detail below. • In the case of the infrastructure projects, all the assets secure the company’s debt, as explained in Note 19. • The interest capitalised during the year is detailed in Note 28. 7.2 Detail of investments in BAA infrastructure projects The detail of the BAA Group’s project assets by nature is as follows:
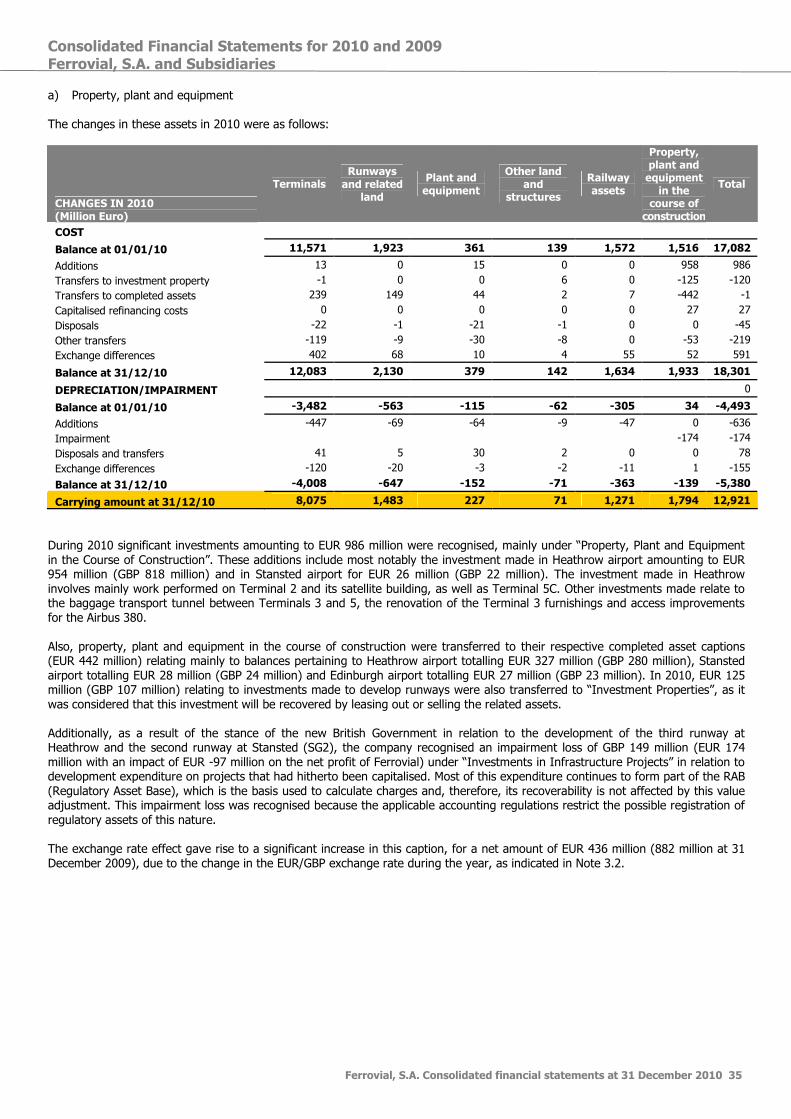
Consolidated Financial Statements for 2010 and 2009 Ferrovial, S.A. and Subsidiaries
Ferrovial, S.A. Consolidated financial statements at 31 December 2010 35
a) Property, plant and equipment The changes in these assets in 2010 were as follows:
CHANGES IN 2010 (Million Euro)
Terminals Runways and related
land
Plant and equipment
Other land and
structures
Railway assets
Property, plant and equipment in the
course of construction
Total
COST
Balance at 01/01/10 11,571 1,923 361 139 1,572 1,516 17,082
Additions 13 0 15 0 0 958 986
Transfers to investment property -1 0 0 6 0 -125 -120
Transfers to completed assets 239 149 44 2 7 -442 -1
Capitalised refinancing costs 0 0 0 0 0 27 27
Disposals -22 -1 -21 -1 0 0 -45
Other transfers -119 -9 -30 -8 0 -53 -219
Exchange differences 402 68 10 4 55 52 591
Balance at 31/12/10 12,083 2,130 379 142 1,634 1,933 18,301
DEPRECIATION/IMPAIRMENT 0
Balance at 01/01/10 -3,482 -563 -115 -62 -305 34 -4,493
Additions -447 -69 -64 -9 -47 0 -636
Impairment -174 -174
Disposals and transfers 41 5 30 2 0 0 78
Exchange differences -120 -20 -3 -2 -11 1 -155
Balance at 31/12/10 -4,008 -647 -152 -71 -363 -139 -5,380
Carrying amount at 31/12/10 8,075 1,483 227 71 1,271 1,794 12,921
During 2010 significant investments amounting to EUR 986 million were recognised, mainly under “Property, Plant and Equipment in the Course of Construction”. These additions include most notably the investment made in Heathrow airport amounting to EUR 954 million (GBP 818 million) and in Stansted airport for EUR 26 million (GBP 22 million). The investment made in Heathrow involves mainly work performed on Terminal 2 and its satellite building, as well as Terminal 5C. Other investments made relate to the baggage transport tunnel between Terminals 3 and 5, the renovation of the Terminal 3 furnishings and access improvements for the Airbus 380. Also, property, plant and equipment in the course of construction were transferred to their respective completed asset captions (EUR 442 million) relating mainly to balances pertaining to Heathrow airport totalling EUR 327 million (GBP 280 million), Stansted airport totalling EUR 28 million (GBP 24 million) and Edinburgh airport totalling EUR 27 million (GBP 23 million). In 2010, EUR 125 million (GBP 107 million) relating to investments made to develop runways were also transferred to “Investment Properties”, as it was considered that this investment will be recovered by leasing out or selling the related assets. Additionally, as a result of the stance of the new British Government in relation to the development of the third runway at Heathrow and the second runway at Stansted (SG2), the company recognised an impairment loss of GBP 149 million (EUR 174 million with an impact of EUR -97 million on the net profit of Ferrovial) under “Investments in Infrastructure Projects” in relation to development expenditure on projects that had hitherto been capitalised. Most of this expenditure continues to form part of the RAB (Regulatory Asset Base), which is the basis used to calculate charges and, therefore, its recoverability is not affected by this value adjustment. This impairment loss was recognised because the applicable accounting regulations restrict the possible registration of regulatory assets of this nature. The exchange rate effect gave rise to a significant increase in this caption, for a net amount of EUR 436 million (882 million at 31 December 2009), due to the change in the EUR/GBP exchange rate during the year, as indicated in Note 3.2.

Consolidated Financial Statements for 2010 and 2009 Ferrovial, S.A. and Subsidiaries
Ferrovial, S.A. Consolidated financial statements at 31 December 2010 36
The changes in these assets in 2009 were as follows:
CHANGES IN 2009
Terminals
Runways and
related land
Plant and equipment
Other land and
structures
Railway assets
Property, plant and equipment in the
course of construction
Total
COST
Balance at 01/01/09 9,903 1,751 248 115 1,453 1,653 15,123
Changes in the scope of consolidation 0 0 0 0 0 1 1 Additions 8 0 11 0 0 902 921 Transfers to investment property 3 0 0 21 0 -24 0 Transfers to completed assets 988 38 113 7 6 -1,151 1 Capitalised refinancing costs 0 0 0 0 0 25 25 Disposals -101 -3 -5 -12 0 -1 -122 Exchange differences 770 137 14 8 113 121 1163 Transfers to “assets held for sale” 0 0 -20 0 0 -10 -30
Balance at 31/12/09 11,571 1,923 361 139 1,572 1,516 17,082
DEPRECIATION/IMPAIRMENT
Balance at 01/01/09 -2,900 -467 -65 -56 -240 28 -3,700
Additions -455 -63 -59 -7 -46 0 -630
Disposals and transfers 98 3 4 5 0 3 113
Exchange differences -225 -36 -3 -4 -19 3 -284
Transfers to “assets held for sale” 0 0 8 0 0 0 8
Balance at 31/12/09 -3,482 -563 -115 -62 -305 34 -4,493
Carrying amount at 31/12/09 8,089 1,360 246 77 1,267 1,550 12,589
b) Investment property The changes in these assets in 2010 were as follows:
CHANGES IN 2010 Airports
Assets in progress
Total
COST
Balance at 1 January 2010 2,981 10 2,991
Additions 86 0 86 Transfers of completed assets 3 -3 0 Other transfers 121 121 Exchange differences 112 112
Balance at 31 December 2010 3,303 7 3,310
DEPRECIATION/ IMPAIRMENT 0
Balance at 1 January 2010 -190 0 -190
Additions -120 -120 Exchange differences -7 -7 Impairment 22 22
Balance at 31 December 2010 -295 -295
Carrying amount at 31 December 2010 3,008 7 3,015
The main changes in 2010 arose from exchange differences, amounting to a net total of EUR 105 million. Additionally, as described in Note 5, the impairment loss of EUR 22 million recognised for investment property was reversed under “Impairment and disposals of Non-Current Assets” (see Notes 24 and 25) (with an effect of EUR 8 million on the net profit). These assets, though classified as investment property, form part of the Regulated Asset Base (RAB) of the regulated airports and, therefore, their fair value is in line with their carrying amount, which is in turn in the basis used to calculate the RAB.

Consolidated Financial Statements for 2010 and 2009 Ferrovial, S.A. and Subsidiaries
Ferrovial, S.A. Consolidated financial statements at 31 December 2010 37
The changes in these assets in 2009 were as follows:
CHANGES IN 2009 Airports
Assets in progress
Total
COST
Balance at 1 January 2009 2,781 16 2,797
Additions 0 20 20 Transfers of completed assets 27 -27 0
Disposals -43 0 -43
Other transfers -1 1 0 Exchange differences 217 0 217
Balance at 31 December 2009 2,981 10 2,991
DEPRECIATION/IMPAIRMENT 0
Balance at 1 January 2009 -82 0 -82
Additions -50 0 -50 Exchange differences -6 0 -6 Impairment -53 0 -53
Balance at 31 December 2009 -191 0 -191
Carrying amount at 31 December 2009 2,790 10 2,800
c) Intangible assets
CHANGES IN 2010
Operating rights
Computer software
Concessions
Contracts to operate
commercial space
Other
Total
Balance at 1 January 2010 703 149 0 149 6 1,007
Additions 22 22 Disposals -6 -6
Exchange differences 25 5 0 5 0 35
Balance at 31 December 2010 728 170 0 154 6 1,058
AMORTISATION/IMPAIRMENT 0
Balance at 1 January 2010 0 -87 0 -57 0 -144
Additions 0 -27 -16 -43 Disposals 6 0 0 0 6 Exchange differences -2 0 -2 0 -4 Impairment -289 -289
Balance at 31 December 2010 -289 -110 0 -75 0 -474
Carrying amount at 31 December 2010 439 60 0 79 6 584
The two main intangible assets recognised at December 2010 are the BAA Group’s right to operate certain non-regulated airports (indefinite right) and rights to operate commercial space, which are amortised on a straight-line basis over the term of the concession up to a maximum of 15 years. The Company recognised an impairment loss of GBP 248 million in relation to the intangible asset consisting of the right to operate the other airports (EUR 289 million, with a negative impact on Ferrovial’s net profit of EUR 118 million). This impairment loss was determined using the measurement basis described in Note 5.

Consolidated Financial Statements for 2010 and 2009 Ferrovial, S.A. and Subsidiaries
Ferrovial, S.A. Consolidated financial statements at 31 December 2010 38
The changes in these assets in 2009 were as follows:
CHANGES IN 2009
Operating rights
Computer software
Concessions
Contracts to operate commercial space
Other
Total
Balance at 1 January 2009 653 123 0 138 8 922
Additions 0 20 0 0 0 20 Disposals 0 -5 0 0 -2 -7 Changes in the scope 0 0 0 0 6 6
Exchange differences 50 11 0 11 0 72
Transfers to “assets held for sale” 0 0 0 0 -6 -6
Balance at 31 December 2009 703 149 0 149 6 1,007
AMORTISATION/IMPAIRMENT 0
Balance at 1 January 2009 0 -55 0 -38 0 -93
Additions 0 -30 0 -16 0 -46 Disposals 0 3 0 0 0 3 Exchange differences 0 -4 0 -3 0 -7 Transfers to “assets held for sale” 0 0 0 0 0 0
Balance at 31 December 2009 0 -86 0 -57 0 -143
Carrying amount at 31 December 2009 703 63 0 92 6 864
8. Property, plant and equipment
“Property, Plant and Equipment” does not include tangible fixed assets assigned to infrastructure projects, which are classified under “Investments in Infrastructure Projects”.
Movements in Property, plant and equipment in the consolidated balance sheet are as follows:
Million Euro
CHANGES IN 2010
Land and buildings
Plant and machinery
Other fixtures, tools and furniture
TOTAL
Investment: Balance at 01/01/10 137 805 801 1,743 Additions 4 36 99 139 Disposals -19 -67 -79 -165 Changes in the scope of consolidation and transfers 12 2 -298 -284 Exchange rate effect 5 7 50 62 Balance at 31/12/10 139 783 573 1,495 Accumulated depreciation: Balance at 01/01/10 -27 -496 -551 -1,074 Charge for the year -2 -55 -71 -128 Disposals 2 58 54 114 Changes in the scope of consolidation and transfers 10 -59 230 181 Exchange rate effect -1 -5 -30 -36 Balance at 31/12/10 -18 -557 -368 -943 Carrying amount at 31/12/10 121 226 205 552
Changes in the scope of consolidation and transfers In 2010 the main change arose from the transfer of Swissport to assets held for sale (EUR 123 million) and the inclusion in the scope of consolidation of AmeyCespa (EUR 26 million). Additions • The additions in the Construction Division related mainly, as in the prior year, to the acquisition of specific site machinery by
Ferrovial Agromán.

Consolidated Financial Statements for 2010 and 2009 Ferrovial, S.A. and Subsidiaries
Ferrovial, S.A. Consolidated financial statements at 31 December 2010 39
Disposals The disposals related basically to the Services segment, amounting to EUR 14 million, due to the write-off of fully depreciated assets. Additionally, Cespa disposed of a building valued at EUR 15 million.
Million Euro
CHANGES IN 2009
Land and buildings
Plant and machinery
Other fixtures, tools and furniture
TOTAL
Investment: Balance at 01/01/09 131 747 707 1,585 Additions 4 82 122 208 Disposals -9 -46 -18 -73 Changes in the scope of consolidation and transfers 9 1 -15 -5 Exchange rate effect 3 21 5 29 Balance at 31/12/09 138 805 801 1,744 Accumulated depreciation: Balance at 01/01/09 -24 -439 -501 -964 Charge for the year -2 -47 -77 -126 Disposals 5 30 7 42 Changes in the scope of consolidation and transfers -2 -10 19 7 Exchange rate effect -4 -31 1 -34 Balance at 31/12/09 -27 -497 -551 -1,075 Carrying amount at 31/12/09 111 308 250 669
• The property, plant and equipment not used in operations are not material with respect to the ending consolidated balances. • No impairment losses were recognised or reversed during the year.
• The Group has taken out insurance policies to cover the possible risks to which its property, plant and equipment are subject and possible claims that could be brought against it in the ordinary course of its business. The Group considers that the insurance policies provide adequate coverage for such risks.
• The property, plant and equipment in the course of construction amounts to EUR 55.2 million (EUR 58.8 million in 2009). This is due mainly to the increase of property, plant and equipment in the course of construction of Budimex.
• At 31 December 2010, no significant property, plant and equipment were subject to ownership restrictions or pledged to
secure liabilities.
9. Investments in companies accounted for using the equity method
The breakdown of the main investments in companies accounted for using the equity method at 31 December 2010 and 2009 is as follows:
2010 2009 Beginning balance 262 285 Changes in the scope of consolidation 2,776 -3 Share of results 62 85 Dividends received and equity reimbursed -23 -32 Transfers to “ assets held for sale” -32 -81 Impairment -80 0 Other 3 -10 Exchange differences 142 18 Ending balance 3,110 262
Following is a description of the main changes in the scope of consolidation in the year: - In the Toll Road Division, the main inclusion relates to the shareholding in the 407 ETR toll road, which after a 10% divestment carried out during the year and described in Note 1.2, stands at 43.23% of this company’s share capital and is accounted for using the equity method. Its carrying amount totals EUR 2,919 million at 31 December 2010, an amount which includes the fair value of the remaining interest held by the parent, Cintra Infraestructuras, in the toll road. As a result of this revaluation and solely for the purpose of calculating the results of future years, the difference between the prior carrying amount of its assets and its fair value was added to the carrying amount of the administrative concession and is being

Consolidated Financial Statements for 2010 and 2009 Ferrovial, S.A. and Subsidiaries
Ferrovial, S.A. Consolidated financial statements at 31 December 2010 40
amortised over the concession term based on toll road traffic. The main figures of this company at 31 December 2010, based on the percentage of ownership, are as follows: 2010 Million Euro / % of ownership 43.23% Total assets 2,050 Equity 810 Borrowings 1,733 Revenue 197 EBITDA 158 Net profit 24
Also included under this heading is the remaining 40% shareholding in Cintra Chile, after the sale of 60% of that company, as
described in Note 1.2, which continues to be held by the Group and which is accounted for using the equity method. The value
of this shareholding at 2010 year-end was EUR 159 million. - Additionally, in the Services Division Tube Lines was excluded from the scope of consolidation, giving rise to a reduction of EUR 131 million.
The transfers to assets held for sale reflects the reclassification to that heading of Trados 45 and Swissport for EUR 21 million and EUR 11 million, respectively, as described in Note 12. Lastly, using the methodology described in Note 5d, an impairment loss was recognised, with a negative impact of EUR 56 million on the profit for the year, relating mainly to the portfolio of Spanish toll roads and other European toll roads, due to the negative evolution of traffic during 2010 and to the update of long-term assumptions for these toll roads. Following is a description of the other most significant shareholdings included under this heading: - The 10% indirect shareholding acquired in Madrid Calle 30, S.A., which holds a 35-year concession to refurbish and maintain the M30 urban ring road in Madrid, entailing an investment of EUR 54 million at 31 December 2010 (EUR 72 million at 31 December 2009).
- Also noteworthy is the 50% shareholding in Indiana Toll Road. Indiana Toll Road’s main figures at 31 December 2010 and the percentage of ownership are as follows:
2010 Million Euro / % of ownership 50% Total assets 1,559 Equity -244 Bank borrowings 1,347 Revenue 66 EBITDA 53 Net loss -72
- Lastly, the Group exercises significant influence over certain companies in which it has an ownership interests of less than 20% and does not exercise significant influence over certain companies in which its ownership interest exceeds 20%.
There are no significant restrictions on the capacity of associates to transfer funds to the Parent in the form of dividends, debt repayments or advances other than such restrictions as might arise from this financing agreements of those associates or from their own financial situation, and there are no contingent liabilities relating to associates that might ultimately be assumed by the Group. Appendix I shows a list of the main investments of companies accounted for using the equity method, indicating their name, the country in which they were incorporated, the business segment to which they belong, the Group’s percentage of ownership and their most significant financial information, such as aggregate assets and liabilities, revenue and profit or loss for the year.

Consolidated Financial Statements for 2010 and 2009 Ferrovial, S.A. and Subsidiaries
Ferrovial, S.A. Consolidated financial statements at 31 December 2010 41
10. Non-current financial assets The detail of the changes in and maturities of the non-current financial assets at 31 December 2010 and 2009 is as follows:
Million Euro
MOVEMENTS DURING 2010 Available-for-sale financial
assets
Infrastructure project
receivables
Restricted cash and other non-current financial assets
Other receivables TOTAL
Investment: Balance at 1 January 2010 33 874 554 474 1,935 Additions 534 331 96 961 Disposals 0 -147 -227 -374 Scope changes and transfers -1 -62 -205 -88 -356 Provision 0 Effect of exchange rate 2 -2 18 18 Balance at 31 December 2010 34 1,344 551 255 2,184
Note: balances presented net of allowances.
• “Infrastructure Project Receivables” includes financial assets arising from the application of IFRIC 12 and relates mainly to amounts receivable from the government in return for services rendered or investments made under a concession agreement. The existing financial assets relate to the concession operators Autopista Terrasa Manresa, Auto-Estradas Norte and Eurolink M3, amounting to EUR 479 million, EUR 325 million and EUR 307 million, respectively, (EUR 451 million, EUR 0 and EUR 307 million in 2009). Also included are the accounts receivable relating to Concesionaria de Prisiones Lledoners, EUR 76 million (EUR 85 million in 2009), Concesionaria de Prisiones Figueras, EUR 111 million (EUR 40 million in 2009), and Cespa, EUR 46 million (32 million in 2009).
The increase in 2010 was due mainly to Auto-Estradas Norte (EUR 325 million), which started to renegotiate its concession arrangement with the Portuguese government on 1 July, which became a payment for availability arrangement, giving rise to the application of the financial asset model provided for in IFRIC 12. The remaining increase related to the accrual of the remaining accounts receivable in the year.
The changes in the scope of consolidation and transfers were due mainly to the settlement of the subordinated debt between Amey and Tube Lines totalling EUR 70 million, after its sale in June 2010, which was considered a cost to sell.
• “Restricted Cash and Other Non-Current Financial Assets” includes guarantee deposits for bond issues, relating mainly to NTE Mobility Partners LLC (EUR 130 million -EUR 264 million in 2009-) and Chicago Skyway (EUR 44 million -EUR 36 million in 2009-). The main increase in this line item relates to the inclusion in the scope of consolidation of the amounts relating to LBJ Infrastructure Group, the concession operator for the construction, maintenance and management of 21.2 kilometres (13.3 miles) of the LBJ toll road, for EUR 326 million. Also noteworthy was the decrease of EUR 205 million due to a change in the scope of consolidation relating to 407 ETR, which was accounted for using the equity method in 2010 after the divestment of 10% of the shares of that company, as described in Note 1.2.
The decreases in this line item were due mainly to the concession operator North Tarrant Express (EUR 133 million) due to the start-up of the toll road construction work. Lastly “Other Receivables” includes the following items: 1. Noteworthy in relation to the loans to associates is the long-term loan of EUR 50 million (EUR 50 million at December 2009) granted by Ferrovial Servicios to its subsidiary Emesa.
2. Long-term receivables from various municipal councils renegotiated by Cespa amounting to EUR 97 million.

Consolidated Financial Statements for 2010 and 2009 Ferrovial, S.A. and Subsidiaries
Ferrovial, S.A. Consolidated financial statements at 31 December 2010 42
Fair values of the assets It is considered that the discounted cash flows of the assets using a market discount rate approximate the carrying amount of the assets. The difference between the carrying amount and fair value of the assets is therefore not significant.
The changes in these items in 2009, for information purposes, were as follows:
Million Euro
CHANGES IN 2009 Available-for-sale financial
assets
Infrastructure project
receivables
Restricted cash and other non-current financial assets
Other receivables TOTAL
Investment: Balance at 01/01/09 4 828 290 402 1,524 Additions 17 104 71 0 192 Disposals 0 0 -65 -9 -74 Changes in the scope and transfers 0 -58 271 91 304 Provision 12 0 0 1 13 Effect of exchange rate 0 0 -13 -11 -24 Balance at 31/12/09 33 874 554 474 1,935
11. Derivative financial instruments at fair value a) Description of the main derivative financial instruments The detail of the derivatives arranged and fair value thereof at 31 December 2010 and 2009, as well as the maturities of the notional amounts to which the derivatives relate (notional maturities are shown as positive figures and future increases already arranged as negative figures) are as follows:
(*) The items indicated are the main derivatives arranged by the Group that are not considered hedges for accounting purposes, as explained in this note.
Million Euro
Fair value Notional maturities
Type of instrument
Balances at
31/12/10
Balances at
31/12/09 31/12/11 31/12/12 31/12/13 31/12/14
31/12/2015 and
subsequent years
TOTAL NOTIONAL AMOUNTS
ASSET BALANCES 847 861 20 999 -3 760 1,317 3,093
Index-linked swaps BAA (*) 2 32 0 0 0 0 518 518
Interest rate swaps BAA 0 4 0 0 0 0 0 0
Cross currency swaps BAA 641 734 0 1,000 0 750 750 2,500
Index-linked swaps Cintra 190 56 -1 -1 -3 -2 49 42
Equity swaps (*) 13 19 21 0 0 12 0 33
Other derivatives 1 16 0 0 0 0 0 0
Cintra forwards 0 0 0 0 0 0 0 0
Other derivatives 1 16 0 0 0 0 0 0
LIABILITY BALANCES 1,968 1,336 1,354 320 508 1,933 11,066 15,181
Index-linked swaps BAA (*) 345 194 0 0 0 462 3,818 4,280
Interest rate swaps BAA 443 284 0 0 0 1,385 3,120 4,505
Cross currency swaps BAA 22 0 0 0 0 0 500 500
Equity swaps (*) 294 261 111 103 211 0 172 597
Interest rate swaps Cintra 736 486 -87 -5 -7 14 3,229 3,144
Other derivatives 128 111 1,330 222 304 72 227 2,155
Cintra forwards 11 3 187 0 0 0 0 187
Other derivatives 117 108 1,143 222 304 72 227 1,968
NET AND NOTIONAL BALANCES -1,121 -475 1,374 1,319 505 2,693 12,382 18,274

Consolidated Financial Statements for 2010 and 2009 Ferrovial, S.A. and Subsidiaries
Ferrovial, S.A. Consolidated financial statements at 31 December 2010 43
b) Main effects on profit or loss and equity The changes for accounting purposes in the main derivatives arranged by fully-consolidated companies, detailing the fair values thereof at 31 December 2010 and 2009, and the impact on reserves, profit or loss and other balance sheet items are as follows: Fair value Breakdown of movements
Instrument type
Balance at 31/12/10
Balance at 31/12/09 Variation
Impact on
reserves (I)
Impact on profit or loss, fair value (II)
Impact on financial profit/loss (III)
Cash (IV)
Exchange rate (V)
Other impacts on
the balance sheet or income statement (VI)
TOTAL
Index linked Swaps BAA -343 -162 -181 0 -42 -63 -71 -5 0 -181
Interest Rate Swaps BAA -443 -280 -163 -146 -7 -184 183 -9 0 -163 Cross Currency Swaps BAA 619 734 -115 6 -16 32 -69 26 -94 -115
Index linked Swaps Cintra 190 56 134 133 1 1 -1 0 0 134
Interest rate swaps Cintra -736 -486 -250 -214 0 -94 100 -22 -20 -250
Equity swaps -281 -242 -39 12 -39 -9 9 0 -12 -39
Other derivatives -127 -95 -32 -16 19 -25 32 -19 -23 -32
Cintra forwards -11 -3 -8 -7 0 0 0 0 -1 -8
Other derivatives -116 -92 -24 -9 19 -25 32 -19 -22 -24 TOTAL -1,121 -475 -646 -225 -84 -342 183 -29 -149 -646
As discussed in Note 2.3.8, derivatives are recognised at market value at the arrangement date and at fair value at subsequent dates. Changes in the value of these derivatives are recognised for accounting purposes as follows:
- The changes in fair value of the derivatives that qualify for hedge accounting during the year are recognised with a balancing item in reserves (column I).
- The changes in fair value of the derivatives that do not qualify for hedge accounting or that are considered to be held for speculative purposes are recognised as a fair value adjustment in the Group’s income statement (column II) and are separately reflected in the income statement (see detail in Note 25).
- “Impacts on Financial Profit/(Loss)” (column III) reflects the impact of financing on financial profit or loss in respect of interest accrued during the year.
- “Cash” (column IV) indicates net payments and collections during the year. - The impact of the difference between closing exchange rates at December 2010 and 2009 is also presented
separately (column V). - Lastly, the “Other Impacts” shows the impacts on profit or loss from operations or, in the case of Cross Currency
Swaps, the changes in the debt with regard to the hedged exchange rate (column VI).
BAA derivatives Index Linked Swaps BAA BAA has arranged index linked swaps tied to fixed-rate bonds and, therefore, the Company has debt synthetically indexed to inflation for a total notional amount of GBP 4,114 million (EUR 4,978 million), of which GBP 1,908 million were arranged in 2010. These derivatives do not qualify for hedge accounting. The fair value thereof decreased from EUR -162 million in December 2009 to EUR -343 million in December 2010, which had an impact of EUR -42 million on Ferrovial’s financial result, as a fair value adjustment. Additionally, there were net collections amounting to EUR of 71 million, which included advances on payment flows amounting to EUR 43 million and EUR 114 million of ordinary settlements. Lastly, period finance expenses amounted to EUR 63 million. Interest Rate Swaps BAA In order to hedge interest rate risk, BAA contracted interest rate swaps for a total notional amount of GBP 3,863 million (EUR 4,505 million). These derivatives are mostly considered to be of cash flow hedges/of from bank borrowings, as explained in Note 24. Only the ineffective portions of the hedges or fair value changes in derivatives that do not qualify for hedge accounting are recognised as fair value adjustments in financial profit or loss. The fair value of these derivatives decreased from EUR -280 million at December 2009 to EUR -443 million at December 2010, having an impact on reserves of EUR -146 million due to the decrease in UK long-term interest rates during the year. The expected increase in liabilities arising solely from the evolution in interest rate curves was partly offset by the decrease in liabilities resulting from advance payments made during the year amounting to GBP 74 million (EUR 86 million). Also, ordinary settlements were made

Consolidated Financial Statements for 2010 and 2009 Ferrovial, S.A. and Subsidiaries
Ferrovial, S.A. Consolidated financial statements at 31 December 2010 44
totalling GBP 83 million (EUR 98 million), which entailed an impact on total cash of EUR -184 million and finance expenses on financing of EUR -184 million (EUR -75 million on the net gain or loss attributed to the Parent) due to the allocation of closed rates for swaps, higher than market rates, to results. Lastly, the portion of these derivatives not qualifying for hedge accounting had an impact of EUR -7 million recognised as a fair value adjustment in Ferrovial’s financial profit or loss. Cross Currency Swaps BAA BAA has arranged a number of cross currency swaps to hedge the pound sterling/euro foreign exchange risk on euro bonds issued (see Note 19), for a total notional amount of GBP 2,137 million, (EUR 3,000 million), with maturities between 2012 and 2018. The fluctuations in the exchange rates between December 2009 and December 2010 on the total notional amount gave rise to an impact on the balance sheet of EUR -94 million (“Other Impacts”), which offsets the change in value of the eurobonds that constitute the underlying. The inclusion of these CCS denominated in pound sterling in Ferrovial’s consolidated balance sheet gave rise to an impact as a result of the exchange rate of EUR +26 million. Furthermore, net collections amounting to EUR 69 million were recognised (“Cash”), and there was an impact on financial profit or loss from financing totalling EUR 32 million, due mainly to the foreign currency hedges on the interest accrued from the bonds. Other hedges arranged by BAA BAA has equity swaps relating to Ferrovial’s share-based payment (see Note 34). These swaps do not qualify for hedge accounting and, therefore, the fair value thereof is recognised as a fair value adjustment in Ferrovial’s finance income (see Note 24). The measurement of the equity swaps held by BAA at fair value gave rise to finance expenses of EUR 9 million (EUR -4 million in the net profit or loss), recognised as a fair value adjustment. Toll Road division derivatives Index linked swaps Cintra In 2009 Autema arranged an index linked swap to hedge income variability, for which an annual CPI of 2.50% was established. This hedge is deemed to be effective and had a gross impact on reserves of EUR 133 million. Interest rate swaps Cintra In order to hedge the interest rate risk in its infrastructure projects, Cintra arranged interest rate hedges on the projects’ debt, establishing a fixed or increasing interest rate for a total notional amount of EUR 3,143 million at 31 December 2010. Taken as a whole, measurement at fair value of these hedges fell from EUR -486 million in December 2009 to EUR -736 million, due to the overall drop in long-term interest rates. This effect is clearly evident in the derivative instruments arranged to hedge the project debt in the US (mainly Chicago and SH130), where derivative instrument valuations have decreased from EUR -334 million in December 2009 to EUR -531 million in December 2010. The other derivative instruments of this kind (mainly to hedge the interest rate risk in Spanish toll roads) arranged by Cintra suffered change in fair value of EUR -151 million in December 2009 to EUR -205 million in December 2010. Since these derivatives are considered to be totally effective, the changes in fair value had negative impact on reserves of EUR 214 million, while the changes in settlements and accruals had an impact of EUR -94 million on the financial profit or loss and a net outflow of cash totalling EUR 100 million. ITR Concession Company -a company accounted for using the equity method- has an interest rate hedge for a notional amount of EUR 1,368 million maturing in 2026, in relation to which an increasing interest rate between 3.4% at 31 December 2010 and 11.29% at maturity was established. The changes in long-term interest rates in the US gave rise to changes in the fair value of this derivative from EUR -313 million at 31 December 2009 to EUR -454 million at 31 December 2010. Cintra forwards
Of particular note in this section are the hedges based on forward contracts −in relation to the Canadian dollar− of a portion of the amount of the dividends expected to be received in 2011, and the amount of the sale of 10% of Cintra's ownership interest in the ETR-407 amounting to CAD 114 million.

Consolidated Financial Statements for 2010 and 2009 Ferrovial, S.A. and Subsidiaries
Ferrovial, S.A. Consolidated financial statements at 31 December 2010 45
Equity swaps The derivatives include equity swaps arranged by the Group solely to hedge the impact on equity of its stock option plans, as described in Note 3.5 on market risk. These equity swaps do not qualify for hedge accounting. Related gains or losses are recognised as a fair value adjustment (see Note 24) in financial profit or loss, which at 31 December 2010 represented an expense of EUR 39 million for the consolidated Group, of which EUR 9 million relate to BAA. Note 33 on “Share-Based Payment” contains a breakdown and description of these equity swaps. Other derivatives “Other derivatives” primarily relates to the following instruments: - Ferrovial interest rate swaps, with a fair value of EUR -76 million at 31 December 2010 (EUR -88 million at 31 December 2009)
and a notional amount of EUR 787 million and a fixed interest rate of 5.2525%. These derivatives were arranged to hedge possible fluctuations in interest rates on the syndicated loan obtained by Ferrovial Infraestructuras to finance the acquisition of the BAA shares. With the merger transactions of Ferrovial Infraestructuras and Grupo Ferrovial S.A. and the refinancing transaction to refinance the corporate debt in 2009 one of the three derivative instruments around which this hedge is structured in, for a total notional amount of GBP 225 million, no longer qualifies for accounting, and al changes in the fair value thereof are recognised in the consolidated Group income statement as a fair value adjustment. In order to hedge this impact, during the first quarter of 2010 the Group arranged a derivative instrument to “mirror” the previous one for the same notional amount and with the same maturities, also considered to be for speculative purposes. Both derivative instruments gave rise to a loss of EUR -6 million in the consolidated Group income statement as a fair value adjustment. Additionally, the accrual of ordinary settlements of the portion of this hedge qualifying for hedge accounting gave rise to a finance cost on financing totalling EUR 36 million, and a cash outflow of EUR 47 million.
- Services Division Interest rate swaps, consisting mainly of the contract relating to the Nacional II (Autovía de Aragón) road.
This hedge was arranged in 2009 in relation to interest rates on debt, representing a notional amount of EUR 102 million and with a fixed interest rate of 4.7640%.
- Services Division Currency forwards, the Group arranged Euro / Swiss franc currency forwards at fair value of EUR 15 million,
and a notional amount of EUR 466 million, to hedge the foreign currency risk relating to the sale price of Swissport. This transaction that was completed in early 2011, as described in Note 37.
c) Hedge measurement methods On 1 July 2009, Ferrovial S.A. decided to adopt the amendments to IFRS 7 pursuant to which the significance of each of the Company’s derivatives must be described in accordance with a fair value measurement hierarchy. This hierarchy establishes three categories, based on the items used to calculate fair value:
- LEVEL 1.- Quoted prices (unadjusted) in active markets for identical assets or liabilities. - LEVEL 2.- Inputs other than quoted prices included within Level 1 that are observable for the asset or liability, either
directly (i.e. as prices) or indirectly (i.e. derived from prices); and - LEVEL 3.- Inputs for the asset or liability that are not based on observable market data (unobservable inputs).
All Ferrovial S.A.’s derivative financial instruments and other financial instruments carried at fair value are included in LEVEL 2 of the fair value measurement hierarchy. The valuations performed by the company are in any event compared against the valuations received from the counterparty banks, on a monthly basis. Equity swaps are measured as the sum of the difference between the market price thereof on the calculation date and the unit settlement price agreed at inception, multiplied by the number of swaps, and the present value of the finance cost agreed upon in the contract. The other instruments were measured by quantifying the net future payment and collection flows, discounted to the present value, with the following specific features:

Consolidated Financial Statements for 2010 and 2009 Ferrovial, S.A. and Subsidiaries
Ferrovial, S.A. Consolidated financial statements at 31 December 2010 46
- Interest rate swaps: these future cash flows with floating reference rates are estimated by using current market assessments of the time value of money; and each flow is updated using the market zero-coupon rate in accordance with the settlement period and currency in question at the measurement date.
- Cross currency swaps: discount curves existing on the market at the measurement date for each period, currency and credit profile are used to project cash flows. Those flows with a floating reference rate are estimated by using implicit curves that reflect the future behaviour as perceived by the market at the measurement date; and the present value of flows from collections and payments is calculated using the discount exchange rate existing at the measurement date based on the period and currency.
- Index linked swaps: these future cash flows are estimated by projecting the future implicit behaviour of the curves as perceived by the market on the measurement date, for both reference interest rate and for reference inflation rates. As in the cases described above, discount rates are used for each settlement period of the flows and currencies, obtained at the measurement date.
d) Net investment in foreign operations As indicated in Note 3.2, where the decision is taken to finance a portion of an investment in the share capital of foreign operation using specific debt arranged by the Group companies that invest in the share capital of projects, the debt is usually obtained in the same currency as the project and acts as a natural hedge of foreign currency. Net investments in foreign operations include exchange differences arising from the monetary item that forms part of the investment and are recognised in equity as translation differences. In order to achieve a natural hedge of its investment in BAA, in the first quarter of 2010 the Parent Ferrovial S.A. redenominated a portion of its new euro borrowings into pound sterling. At 31 December 2010 this portion amounted to GBP 699 million (EUR 815 million) (see Note 19).
12. Non-current assets and liabilities classified as held for sale The changes in the assets and liabilities classified as held for sale in the year ended 31 December 2010 were as follows:
ASSETS LIABILITIES
CHANGES 2010 Balance 31/12/09
Reductions due to sale
Transfers of non-current assets
Exchange rate effect
Balance 31/12/10
Balance 31/12/09
Reductions due to sale
Transfers of non-current assets
Exchange rate effect
Balance 31/12/10
Airports 116 -121 0 5 0 5 -5 0 0 0
APP 81 -84 3 0 0 0
BAA USA 35 -37 2 0 5 -5 0 0
Toll Roads 1,640 -
1,641 28 1 28 1,608
-1,608
0 0 0
Trados 45 0 28 28 0 0
Chilean toll roads 1,640 -1,641 1 0 1,607 -1,608 0 0
Services 44 -3 1,444 0 1,485 34 0 857 0 891
Cespa Portugal 41 -41 0 34 -34 0
Swissport 0 1,378 1,378 797 797
Donarbon PFI 107 107 0 94 94
Other 3 -3 0 0 0
Other 2 0 2 0
Held for sale 1,802 -
1,765 1,472 6 1,515 1,647
-1,613
857 0 891
Assets and liabilities classified as held for sale include assets or liabilities that will foreseeably be sold within one year, as described in Note 2.3.12. At 31 December 2010, assets and liabilities classified as held for sale relate mainly to the Services Division, specifically to Swissport. Also included is the ownership interest held in the concession operator Trados 45 in the Toll Roads Division. Following is a description of the main changes in assets and liabilities classified as held for sale. Airports Division:

Consolidated Financial Statements for 2010 and 2009 Ferrovial, S.A. and Subsidiaries
Ferrovial, S.A. Consolidated financial statements at 31 December 2010 47
- On 22 June a sale transaction was completed in which BBA’s ownership interest in Airport Property Partnership (APP) was sold for GBP 244 million (EUR 298 million), giving rise to a net gain of GBP 11 million (EUR 12 million).
- On 30 July BAA USA was sold for a USD 50 million (EUR 38 million), giving rise to a gross gain of EUR 7 million (net gain
of EUR 1 million). Toll Roads Division:
- At 31 December 2010, this heading include the 50% interest that Cintra Infraestructuras held in Trados 45, a concession holder operating the shadow toll on a stretch of the Madrid M-45 toll ring road; this sale was completed on 21 January 2011. The transaction totalled EUR 68 million and gave rise to a net gain of EUR 27 million.
- Lastly, on 15 September 2010 Cintra Infraestructuras entered into an agreement to sell a 60% ownership interest in Cintra Concesiones de Infraestructuras de Transporte de Chile Limitada (Cintra Chile). The transaction totalled approximately CLF 7 million development units (EUR 220 million).
Services Division:
- In November 2010 Ferrovial Servicios, S.A. entered into an agreement to sell all of the shares held in the share capital of Swissport International AG, the Parent of the Swissport Group. The transaction totalled CHF 900 million (EUR 695 million). As stated in Note 37 “Events after the Reporting Period”, the transaction was completed in February 2011.
- Also of note was the reclassification of the assets and liabilities associated with Cespa Portugal to the corresponding
headings, as the Company interrupted the sale process involving this company.
- Amey-Cespa classified its ownership interest in Donarbon Waste Management Ltd., amounting to EUR 13 million net, as held for sale. This company is a non-strategic part of Donarbon Group’s total assets that were acquired in 2010.
13. Inventories The detail of “Inventories” at 31 December 2010 is as follows: Million Euro Balance at
31/12/10 Balance at 31/12/09
Balance at 31/12/08
Change 2010-2009
Change 2009-2008
Land and building plots 149 145 159 4 -14 Raw materials and other supplies 150 136 148 14 -12 Property developments in progress and other 148 210 192 -62 18 Write-downs -2 -2 -1 0 -1 Total 445 489 498 -44 -9
Out of total inventories, EUR 204 million relates to the Real Estate Division. Of the EUR 131 million, a total of EUR 5 million are
subject to ownership restrictions or pledged to secure liabilities.

Consolidated Financial Statements for 2010 and 2009 Ferrovial, S.A. and Subsidiaries
Ferrovial, S.A. Consolidated financial statements at 31 December 2010 48
14. Trade and other receivables
a) Trade receivables The detail of the balance of “Trade Receivables” at 31 December 2010, 2009 and 2008 is as follows:
Million Euro
Balance at 31/12/10
Balance at 31/12/09
Balance at 31/12/08
Change 2010-2009
Change 2009-2008
Trade receivables 2,096 2,270 2,556 -174 -286
Retentions for guarantees 120 148 170 -28 -22
Amounts to be billed for work performed 342 426 500 -84 -74
Total trade receivables for sales and services 2,558 2,844 3,226 -286 -382
Advances -154 -189 -181 35 -8
Amounts billed in advance for construction work -602 -592 -399 -10 -193
Total net trade receivables 1,802 2,063 2,646 -260 -584
For a fuller understanding of trade receivables, the above table shows the amounts net of advances and amounts billed in advance for construction work, in which they are registered under liabilities, under “Trade Payables” (see Note 21). This balance includes:
- Contract-stipulated advances which will be discounted from future billings for work performed; - Amounts billed in advance for construction work, which occurs when the billings are issued prior to the work being completed, without giving rise to cash flows.
At 31 December 2010, a total of EUR 300 million (EUR 280 million at 31 December 2009) had been deducted from “Trade Receivables” relating to receivables factored without recourse prior to their due date. These assets were removed from the balance sheet since it was considered that they met the conditions stipulated in paragraph 20 of IAS 39 regarding the derecognition of financial assets. The detail of trade receivables for sales and services, by business segment, distinguishing between public authorities and private customers is as follows:
Million Euro
Balances 2010 Public authorities Private customers TOTAL Construction 969 76.75% 293 23.25% 1,262 Services 865 81.45% 197 18.55% 1,062 Airports 6 2.94% 198 97.06% 204
Toll Roads and Car Parks 13 65.00% 7 35.00% 20 Other and adjustments 0 0.00% 10 100.00% 10 Closing balance 1,853 72.44% 705 27.56% 2,558
As it can be seen from the foregoing table, 72.44% of the Group’s customers are public authorities. The most significant balances receivable from private customers relate to the Construction Division. In order to manage credit risk relating to private customers, the Construction division has implemented pre- and post-contracting measures. Pre-contracting measures include the consultation of debtor registers, ratings and solvency studies, while post-contracting measures during the execution of construction work include the follow-up of contractual incidents and non-payment events.
b) Other accounts receivable The detail of “Other Accounts Receivable” at 31 December 2010, 2009 and 2008 is as follows: Million Euro
Balance at 31/12/10
Balance at 31/12/09
Balance at 31/12/08
Change 2010-2009
Change 2009-2008
Other receivables 604 418 424 186 -6 Receivable from public authorities 151 186 192 -35 -6 Total other non-trade receivables 755 604 616 151 -12
“Other Receivables” includes balances receivable arising outside the ordinary course of business carried on by each segment and advances to suppliers amounting to EUR 50 million (EUR 69 million at 31 December 2009, EUR 72 million at 31 December 2008). “Receivable from Public Authorities” includes balances receivable from public authorities other than income tax.

Consolidated Financial Statements for 2010 and 2009 Ferrovial, S.A. and Subsidiaries
Ferrovial, S.A. Consolidated financial statements at 31 December 2010 49
EUR 131 million were deducted from “Other Current Receivables” corresponding to 50% of the sale price of TubeLines, since that amount was factored without recourse to a bank. These assets were removed from the balance sheet since it was considered that they met the conditions stipulated in paragraph 20 of IAS 39 regarding the derecognition of financial assets.
c) Provisions Operating provisions are recognised as described in Note 2.3.7-c. The change in operating provisions is as follows: Million Euro Changes in provision
2010 2009 2008 Change
2010-2009 Change
2009-2008
Opening balance -290 -242 -173 -48 -69
Amounts charged to the income statement -15 -137 -60 122 -77
Reductions/Amounts used 1 100 -24 -99 124
Effect of exchange rate -3 -11 14 8 -25
Changes in the scope of consolidation and transfers 97 0
1 97 -1
Closing balance -210 -290 -242 80 -48
Group management considers that the carrying amount of trade receivables approximates their fair values.
15. Equity
The detail of the main impacts net of taxes that affected the changes in equity in 2010 is as follows:
2010
Attributable to equity holders
Attributable to non-controlling interests
Total equity
Equity at 1 January 2,986 1,570 4,556 Changes in accounting policies 116 48 164 Equity at 1 January restated 3,102 1,617 4,719 Consolidated profit for the year 2,163 -348 1,815 Impact on reserves of hedging instruments -96 -61 -157 Impact on reserves of defined benefit plans 20 23 42 Translation differences 316 49 365
Net income/expense recognised directly in equity 240 11 250 Total income and expense recognised directly in equity 2,403 -338 2,066 Dividends paid -308 -76 -385 Capital increases/reductions 130 130
Transactions with owners -308 53 -255 Changes in the scope of consolidation and other changes -2 101 99 Equity at 31 December 5,195 1,434 6,629
Following is a description of the main changes in shareholders’ equity in 2010, the positive evolution of which gave rise to an increase of EUR 1,910 million. Consolidated profit for the year totalled EUR 2,163 million for the Parent. Hedging instruments: recognition of the revaluation of the effective portion of derivatives qualifying for hedge accounting (see Note 11), the negative impact of which was EUR 96 million net of taxes for the Parent. The main changes in the fair value of hedges relate to interest rate swaps, caused by fluctuating market reference rates. The main changes involved BAA, with a negative impact of EUR 51 million, the Toll Roads division EUR 29 million, especially at Chicago Skyway and SH-130 Concession Company and the Services Division with an impact of EUR -34 million. Defined benefit plans: these include the impact on equity of actuarial gains and losses arising from adjustments and changes to the Group’s defined benefit plan assumptions, as described in Note 17, which have an impact for the Parent of EUR 20 million net of taxes. Translation differences: most of the currencies in which Ferrovial has investments (see Note 3) have increased in value against the euro, particularly the Canadian dollar and the pound sterling, currencies to which the Group is most exposed in terms of equity. This had a positive impact of EUR 316 million for the Parent. Dividends: dividend payments reduced the Group’s total equity by EUR 308 million, of which EUR 220 million relates to the dividend approved by the shareholders at the Annual General Meeting and EUR 88 million relate to the interim dividend approved by the Board of Directors on 28 October 2010.

Consolidated Financial Statements for 2010 and 2009 Ferrovial, S.A. and Subsidiaries
Ferrovial, S.A. Consolidated financial statements at 31 December 2010 50
Changes in the scope of consolidation: the impact of changes in the scope of consolidation and other changes related to non-controlling interest is significant due mainly to the sale of 10% of 407 ETR toll road and the accounting of the remaining 43.23% using the equity method discussed in Note 1.2. For information purposes, the detail of the main changes in equity in 2009 is as follows: 2009
Attributable to equity holders
Attributable non-controlling
interests Total equity
Equity at 1 January 1,756 2,206 3,962 Changes in accounting policies 45 90 136 Equity at 1 January restated 1,802 2,296 4,098 Consolidated profit for the year -74 -395 -469 Impact on reserves of hedging instruments 260 194 453 Impact on reserves of defined benefit plans -246 -144 -390 Translation differences 120 -182 -61
Income and expense recognised directly in equity 135 -132 2 Total income and expense recognised directly in equity 61 -528 -466 Dividends paid -281 -103 -384 Capital increases/reductions 166 166 Merger 1,443 -160 1,283
Transactions with owners 1,162 -96 1,065 Changes in the scope of consolidation and other changes 77 -55 22 Equity at 31 December 3,101 1,618 4,719
a) Share capital and share premium At 31 December 2010 the share capital amounted to EUR 147 million and was fully subscribed and paid. Share capital is represented by 733,510,255 ordinary shares of a single class and a par value of twenty euro cents (EUR 0.20) per share. There have been no changes with respect to 31 December 2009. At 31 December 2008, the share capital amounted to EUR 140 million. In 2009 the share premium increased from EUR 193 million at 31 December 2008 to EUR 3,022 million as a result of the share premium relating to the merger between Cintra, S.A. and Grupo Ferrovial, S.A. In 2010 the share premium remained unchanged. At 31 December 2010, the shareholder holding more than 10% of the share capital of Grupo Ferrovial, S.A. was Portman Baela, S.L., with 44.607%, a percentage reduced to 44.268% at the beginning of 2011. The shares of the Parent are listed on the continuous market of the Spanish stock exchanges and they all carry the same voting and dividend rights. b) Treasury shares There were no treasury shares at 31 December 2010. The decrease in the balance of EUR 72 million at 31 December 2008 arose from the merger process between Cintra, S.A. and Ferrovial Group. c) Other reserves

Consolidated Financial Statements for 2010 and 2009 Ferrovial, S.A. and Subsidiaries
Ferrovial, S.A. Consolidated financial statements at 31 December 2010 51
The changes in “Other Reserves” in 2010 and 2009 were as follows:
Changes in 2010 Translation differences
Hedges Defined
benefit plans Other
Total other reserves
Balance at 01/01/10 -391 -357 -134 -147 -1,028 Changes in accounting policies -4 -4 Balance at 01/01/10 restated -394 -357 -134 -147 -1,032 Change 316 -96 20 113 353
Balance at 01/01/10 -84 -453 -114 -28 -679
Changes in 2009 Translation differences
Hedges Defined
benefit plans Other
Total other reserves
Balance at 01/01/09 -514 -617 112 -170 -1,190 Change 120 260 -246 23 158
Balance at 01/01/09 -394 -357 -134 -147 -1,032
d) Retained earnings
The detail of “Retained Earnings” for 2010 and 2009 is as follows: Million Euro
Retained earnings
Balance at
31/12/10
Balance at
31/12/09
Change
Profit or loss attributable to the Parent 2,163 -74 2,237
Unrestricted reserves 512 1,015 -503
Restricted reserves 29 23 7
Total 2,704 964 1,740
The detail of “Restricted Reserves” is as follows:
Million Euro
Restricted reserves
Balance at 31/12/10
Balance at 31/12/09
Change
Legal reserve 29 23 7
Restricted reserves of the Parent 29 23 7
e) Income and expense recognised during the year, by item: The detail of the changes in equity in respect of income and expense recognised in 2010 and 2009 is as follows:
2010 2009
(Million Euro) Attributable to equity holders
Attributable to non-controlling interest
Total equity Attributable to equity holders
Attributable to non-controlling interest
Total equity
Profit and loss
Hedging instruments -96 -61 -157 260 194 453
Defined benefit plans 20 23 42 -246 -144 -390
Translation differences 316 49 365 120 -182 -61
Recognised income and expense 240 11 250 135 -132 2
Consolidated comprehensive income for the year
2,163 -348 1,815 -74 -395 -469
Total income and expense recognised 2,403 -338 2,066 61 -528 -466
f) Non-Group companies with significant ownership interests in subsidiaries

Consolidated Financial Statements for 2010 and 2009 Ferrovial, S.A. and Subsidiaries
Ferrovial, S.A. Consolidated financial statements at 31 December 2010 52
At 31 December 2010, the non-controlling interests with 10% or more of the share capital of Group companies, were as follows:
FERROVIAL GROUP SUBSIDIARY NON-GROUP % NON-GROUP EQUITY HOLDER
Construction Budimex S.A. 41% Listed company Concessions Autopista del Sol 20% Unicaja Autopista Terrassa-Manresa 23.73% Acesa (Autopista Concesionaria Española, S.A.) Eurolink Motorway Operation N4/N6 34% SIAC Inversora de Autopistas de Levante 40% Sacyr Concesiones, S.L. Inversora de Autopistas del Sur, S.L. 35% - 10% Sacyr Concesiones, S.L. - Caja Castilla-La Mancha LBJ Infrastructure Group Holding LLC 42.40% Meridiam NTE Mobility Partners Holding LLC 33.33% - 10% Meridiam - Dallas Police and Fire Pension System Serranopark 30% - 20% Iridium Concesiones de Infraestructuras - Iridium Aparcamientos SH 130 Concession Company, LLC 35% Zachry Toll Road 56 LLP Skyway Concession Company Holding 45% MIG Chicago Holdings LLc Statewide Mobility Partners LLC 50% MIG Indiana Holdings Llc
Airports
FGP Topco Ltd 17.6504% - 26.4756% Britannia Airport Partners L.P. - Baker Street Investment Pte Ltd
g) Proposed distribution of profit: Propose to the shareholders at the Company’s Annual General Meeting that the profit of FERROVIAL, S.A. should be distributed as follows:
Profit of FERROVIAL, S.A. (euro) 93,975,358.91
Appropriation (euros)
To voluntary reserves (euros) 5,954,128.31
Dividends (euros) 88,021,230.60
The legal reserve has reached the stipulated level.
The proposal to be submitted to the shareholders at the Annual General Meeting will be to distribute the portion of profit of
FERROVIAL, S.A. earmarked to dividend to pay an interim dividend of EUR 0.12 per share. Liquidity statement and interim dividend: On 28 October 2010, the Board of Directors resolved to:
- Pay to the equity holders an interim dividend for 2011 of EUR 0.12 per share, equal to a total interim dividend of EUR 88 million. - Prepare a statement supporting the Company’s estimated liquidity, pursuant to Article 277 of the Spanish Limited Liability Companies Law, evidencing sufficient liquidity (available balances and credit lines).
Liquidity summary 2010
(Million Euro)
Available cash (Corporate + FA + FS + Cintra) 433
Available credit Ferrovial S.A. 566
Available credit Ferrovial Agroman, S.A. 66
Other credit lines of subsidiaries 8
Total liquidity available for distribution 1,075
On 18 November 2010, the interim dividend was paid amounting to EUR 88 million net. Pursuant to Article 277 of the Spanish Limited Liability Companies Law, the amounts to be distributed did not exceed the profit earned since the end of the previous financial year, after deducting estimated income tax payable on such profit and the amount that must be appropriated to legal reserves.

Consolidated Financial Statements for 2010 and 2009 Ferrovial, S.A. and Subsidiaries
Ferrovial, S.A. Consolidated financial statements at 31 December 2010 53
16. Deferred income
The changes in “Deferred Income” in 2010 and 2009 are as follows:
(Million Euro) Changes in 2010
Balance at 01/01/10
Transfers and other
Additions
Disposals
Effect of exchange rate
Balance at 31/12/10
Grants 179 -8 10 -17 1 164
Other deferred income 53 1 -22 32
Total 232 -8 11 -39 1 196
(Million Euro) Changes in 2009
Balance at 01/01/09
Transfers and other
Additions
Disposals
Effect of exchange rate
Balance at 31/12/09
Grants 188 111 114 -234 0 179
Other deferred income 62 2 -12 1 53
Total 250 111 116 -245 1 232
Grants are carried at fair value when it is reasonably certain that the relevant amount will be collected (see Note 2.3.14). 17. Provisions and pension surplus This item reflects the provisions and/or pension plan surplus and other employee retirement bonuses, including both defined benefit and defined contribution plans. The detail of the provisions and/or surplus recognised in the balance sheet in this connection is as follows:
2010 2009 Change
Million Euro Provision Surplus Net
balance Provision Surplus
Net balance
Provision Surplus Net
balance
Defined benefit plans -151 0 -151 -476 22 -454 325 -22 303 BAA -77 0 -77 -313 0 -313 236 0 236 Amey -74 0 -74 -162 0 -162 88 0 88 Swissport 0 0 0 -1 22 21 1 -22 -21 Other plans 0 0 0 -27 0 -27 27 0 27 Swissport 0 0 0 -27 0 -27 27 0 27
Total -151 0 -151 -503 22 -481 352 -22 330

Consolidated Financial Statements for 2010 and 2009 Ferrovial, S.A. and Subsidiaries
Ferrovial, S.A. Consolidated financial statements at 31 December 2010 54
Defined benefit plans: The changes in pension plan obligations and plan assets in 2010 and 2009 were as follows:
Million Euro 2010 Million Euro 2009
DEFINED BENEFIT PLANS Amey Ltd Group BAA
Swissport Group
Amey Ltd Group BAA
Changes in pension obligations Obligations at beginning of year 571 2,599 361 407 2,097
Exchange differences 20 91 1 -11 165
Liabilities acquired 0 0 0 0 0
Current service cost 13 57 15 9 60
Past service cost -53 0 0 0 14
Borrowing costs 34 151 13 28 136
Actuarial gains/losses 19 39 -2 106 204
Other impacts on equity 28 -22
Benefits paid and other -29 -87 -15 32 -77
Obligations at end of year 603 2,829 374 571 2,599
Changes in plan assets Fair value at beginning of year 406 2,286 357 305 2,177
Exchange differences 14 80 2 24 168
Expected return on assets 33 161 17 23 163
Actuarial gains/losses 16 89 20 38 -251
Other impacts on equity 21 0
Employee contributions 4 13 9 4 17
Employer’s contributions 53 223 0 27 107
Benefits paid and other -19 -100 -10 -14 -97
Fair value at end of year 529 2,752 395 406 2,286
Recognised liability in balance sheet
Obligation at end of year -603 -2,829 -374 -571 -2,599
Fair value of plan assets at end of year 529 2,752 395 406 2,286
Subtotal -74 -77 21 -165 -313
Other 0 0 0 3 0
Total -74 -77 21 -162 -313
BAA Group has 3 defined benefit plans covering a total of 21,228 employees, while Amey Group has 10 defined benefit plans covering a total of 6,919 employees. In 2010 the most significant event at the BAA Group and at the Amey Group was the decrease in the pension shortfall which decreased from EUR 313 million in 2009 to EUR 77 million in 2010 (at the BAA Group) and from EUR 162 million in 2009 to EUR 74 million (at the Amey Group).
a) Actuarial gains and losses:
The detail of the impact of the defined benefit pension plans recognised directly in equity is as follows:
Million Euro 2010 Million Euro 2009
Million Euro Amey Ltd Group
BAA Total Swissport Group
Amey Ltd Group
BAA Total
Actuarial gains/losses on obligations -19 -39 -58 2 -106 -204 -309
Actuarial gains/losses on assets 16 89 105 20 38 -251 -193
Other impacts on equity -7 22 15 0 -43 0 -43
Actuarial gains/losses recognised (*) -9 72 63 21 -111 -455 -544

Consolidated Financial Statements for 2010 and 2009 Ferrovial, S.A. and Subsidiaries
Ferrovial, S.A. Consolidated financial statements at 31 December 2010 55
- There were actuarial gains and losses on obligations amounting to EUR 19 million at the Amey Group and EUR 39 million at BAA. - Actuarial gains and losses on assets (EUR 89 million) arising from the difference between expected returns at the beginning of the year (EUR 161 million) and actual returns (EUR 250 million) on assets at BAA, and actuarial gains and losses on assets at Amey (EUR 16 million) due to the difference between expected returns at the beginning of the year (EUR 33 million) and actual returns (EUR 49 million) thereon. The summary of the main actuarial assumptions used to calculate the defined benefit pension plan obligations is as follows:
2010 2009
Main assumptions
Amey Ltd Group
BAA Swissport Group
Amey Ltd Group
BAA
Salary increase 2.5%- 5% 5.10% 1.0% - 5.0% 4.01% 5.20%
Discount rate 5.50% 5.50% 3.5% - 9.0% 5.70% 5.70%
Expected inflation rate 2.60% 3.60% 1.30% 3.50% 3.70%
Expected returns on assets 4.0%-8.2% 6.30% 2.8% - 6.8% 4.5%-8.5% 5.70%
Mortality (years) 84.5-89.1 85.9-87.9 83.1-87 84.5-87.9 84.8-85.9
The mortality assumptions used by the BAA Group to calculate its pension obligations are based on the actuarial mortality tables, entailing an estimated life expectancy of between 85.9 and 87.9 years. In case of the Amey Group, this life expectancy for its pension plans is estimated to range between 84.5 and 89.1 years. There are also other impacts on equity due mainly to corporate transactions, of particular note being the EUR -22 million of the BAA Group as a result of the sale of Gatwick Airport.
b) Employer’s contributions: In 2010, contributions were made at the BAA Group amounting to EUR 223 million, of which EUR 93 million relate to the regular annual contributions agreed upon with the beneficiaries and EUR 130 million which relate mainly to the contributions made to redress the balance in the plan after the sale of Gatwick Airport discussed earlier. In 2010 contributions at the Amey Group totalled EUR 53 million, EUR 22 million to rebalance the plan as a result of the sale of Tube Lines in the year, EUR 20 million to rebalance the rest of the plan, with the remainder involving ordinary contributions. The projected contributions agreed upon with the beneficiaries for 2011 at both BAA and Amey total EUR 93 million and EUR 11 million, respectively. Additionally, the Amey Group agreed on special contributions amounting to EUR 21 million for the coming year.
c) Return on assets:
The summary of the defined benefit pension plan assets by type stated at their fair value and including the expected percentage return thereon for 2010 and 2009 is as follows: Million Euro 2010 Million Euro 2009
Amey Ltd Group BAA Swissport Group Amey Ltd Group BAA Plan assets (fair value) Eur % Eur % Eur % Eur % Eur % Equity instruments 361 8.20% 608 7.88% 111 6.10 - 6.40% 263 8.50% 715 8.20% Debt instruments 109 4.2%-5.5% 1,141 5.16% 117 n/a 98 4.5%-5.7% 1,274 5.50% Buildings 15 8.10% 0 n/a 91 3.90% 13 8.50% 0 n/a Cash and other 44 4.00% 1,003 0.50% 77 1.20 - 4.2% 32 4.50% 297 0.50%
Total plan assets 529 2,752 396 406 2,286
To assess expected returns on assets, the actuaries used the following criteria: At the BAA Group: Equity instruments: equal to annualised FTSE actuaries share indices 15-year returns plus a risk premium of 3.7%.

Consolidated Financial Statements for 2010 and 2009 Ferrovial, S.A. and Subsidiaries
Ferrovial, S.A. Consolidated financial statements at 31 December 2010 56
Debt instruments: performance composed of 20% of returns on long-term UK gilts and 80% of returns on corporate bonds. Cash and other: returns on 3-month deposits. At the Amey Group: Equity instruments: expected returns of between 7.2% and 8.5%. Debt instruments: the returns on sovereign debt and the performance of the corporate bonds debt making up the plan are used to calculate the returns on these instruments. Buildings: forecast returns 0.1% below returns on equity instruments. Cash and other: long-term returns available for Swaps. Actual returns: The BAA Group had actual returns on its plan assets totalling EUR 250 million in 2010 and EUR 86 million in 2009. The returns at the Amey Group totalled EUR 49 million in 2010 and EUR 61 million in 2009. The difference between forecast and actual returns is recognised in equity. Neither the BAA nor Amey Groups’ plans include financial assets issued by the company itself or buildings occupied by it.
d) Impact on the income statement: The detail of the impact of the defined benefit pension plans on the income statement is as follows:
2010
2009
DEFINED BENEFIT PLANS
Amey Ltd Group
BAA Swissport Group
Amey Ltd Group
BAA
Impact on profit before tax (*) Current service cost 13 57 15 9 60 Borrowing costs 34 151 13 28 136 Expected return on assets -33 -161 -17 -23 -163 Past service cost -53 0,5 0 0 0 Other -10 -14 0 0 17 Total recognised in the income statement -49 35 11 14 50
(*) Expenses are positive and income is negative. The most significant impact on the Amey Group’s income statement involves the legislative change relating to estimates of projected inflation; whereas in 2009 the RPI (Retail Price Index) was used as the reference rate, in 2010 the CPI (Consumer Price
Index) was used, which led to an impact of EUR 53 million on the income statement.
e) Complete actuarial reviews: Both the Amey Group and the BAA Group perform complete actuarial valuations every three years. The most recent review at the BAA Group in September 2010 and is still in process at the reporting date. The next valuation at the Amey Group will begin in April 2011 for the Amey PS and Amey OS PS plans. For Amey Rail and Owen Williams Rail, the valuation began in December 2010.
f) Sensitivity analysis: Set out below is a sensitivity analysis showing the impact on the income statement and on shareholders’ equity of a change of 50 basis points in the discount rate.

Consolidated Financial Statements for 2010 and 2009 Ferrovial, S.A. and Subsidiaries
Ferrovial, S.A. Consolidated financial statements at 31 December 2010 57
Annual impact on the income statement
Annual impact on shareholders’ equity
Sensitivity analysis discount rate (+ / - 50 b.p.)
Before tax After tax Before tax After tax + 50 b.p. 10 7 325 234 - 50 b.p. -11 -8 -364 -262
Defined contribution plans The BAA Group has 3 defined contribution plans with an impact on the income statement of EUR 4 million, covering a total of 822 employees. The Amey Group has 24 defined contribution plans with an impact on the income statement of EUR 10 million, covering a total of 3,752 employees. Additionally, the Cespa Group has certain retirement and length-of-service bonuses instrumented trough a single, fixed annual premium for services rendered amounting to EUR 0.2 million in 2010. 18. Other provisions
The detail of other long- and short-term provisions for 2010 and 2009 is as follows:
Million Euro
Changes Provision for landfills
Provision for liabilities
Other provisions Total
At 1 January 2010 66 889 519 1,473 Charged/(credited) to the income statement:
Period provisions 6 122 270 398
Provisions reversed -17 -195 -212
Discount addition 0 0 0
Transfers and other -150 -150
Provisions used during the year -17 -28 -45
Exchange differences 9 12 21
Changes in the scope of consolidation (*) -48 -21 -70
At 31 December 2010 71 788 557 1,416
Analysis of total provisions by classification: 31/12/10
Non-current 860
Current 557
1,416
Provision for landfills “Provisions for Landfills” contains the estimated cost of landfill closure and post-closure activities relating to the Cespa Group. The provision is calculated based on a technical estimate of the consumption to date of the total capacity of landfills. At 31 December 2010, a provision of EUR 6 million had been recognised (EUR 7 million at 31 December 2009). Provision for liabilities “Provision for Liabilities” relates mainly to the provision for expropriations recognised by the Spanish toll roads amounting to EUR 418 million (primarily the R4, amounting to EUR 372 million), as explained in Note 23.
Other provisions These relate mainly to the Construction Division, consisting of provisions for construction work completion, site removals and losses amounting to EUR 443 million (EUR 384 million in 2009).

Consolidated Financial Statements for 2010 and 2009 Ferrovial, S.A. and Subsidiaries
Ferrovial, S.A. Consolidated financial statements at 31 December 2010 58
Also included in this item are provisions related to other risks associated with the valuation of Spanish toll roads and the other European toll roads.
Million Euro
Movements Provision for landfills
Provision for liabilities
Other provisions Total
At 1 January 2009 60 648 452 1,161
Charged/(credited) to the income statement:
Period provisions 7 146 155 309
Provisions reversed -143 -40 -183
Discount addition 0 0
Transfers and other 257 -46 211
Provisions used during the year -1 -30 -13 -44
Exchange differences 10 10 20
At 31 December 2009 66 889 519 1,473
Analysis of total provisions by classification: 31/12/09
Non-current 954
Current 519
1,473
19. Net cash position
The following table contains a breakdown, by segment, of the net cash position in order to reflect the Group’s net borrowing situation. The net cash position is understood to be the balance of items included in cash and cash equivalents (including current restricted cash) and non-current restricted cash, less current and non-current borrowings (bank borrowings and bonds). The breakdown of the net cash position also makes a distinction between infrastructure projects and other Group companies: Million Euro
Balance 31/12/10
Balance 31/12/09
Balance 31/12/08
Change 2010-2009
Change 2009-2008
Construction 2,274 1,955 1,948 320 7 Services -832 -1,212 -1,228 380 16 Airports 22 -75 -1,916 97 1,841 Toll Roads 572 30 390 542 -360 Corporate and other -2,005 -1,870 -740 -135 -1,130 Net cash position excluding infrastructure projects
31 -1,172 -1,546 1,203 374
BAA -14,529 -13,855 -12,906 -674 -949 Other airports 2 3 8 -1 -5 Toll Roads -5,026 -7,104 -6,574 2,078 -530 Construction -129 -96 -86 -33 -10 Services -138 -47 -68 -91 21 Net cash position of infrastructure projects -19,820 -21,099 -19,626 1,279 -1,473
TOTAL NET CASH -19,789 -22,271 -21,172 2,482 -1,099
In 2010, the euro fell sharply against the main foreign currencies in which Ferrovial Group denominates its net cash position, primarily in pound sterling (BAA) and US dollars (US toll roads). This had a negative impact on the net cash position of EUR -676 million in infrastructure projects and EUR -25 million at other companies. An overall explanation of the evolution in the net cash position for 2010 is included in Note 31 “Cash Flow” and in the additional disclosures presented in the directors’ report.

Consolidated Financial Statements for 2010 and 2009 Ferrovial, S.A. and Subsidiaries
Ferrovial, S.A. Consolidated financial statements at 31 December 2010 59
19.1. Infrastructure projects A) Analysis of the net cash position of infrastructure projects The detail of the net cash position of infrastructure projects in 2010 is as follows: 2010
Million Euro
Non-current restricted cash
Non-current investments
Current restricted cash
Other cash and cash equivalents
Borrowings Intra-group transactions
Total net cash
position BAA 43 444 15,017 -14,530 Other airports 2 2 Toll roads 551 6 1 191 5,769 -5 -5,025 Construction 5 141 8 -129 Services 8 54 -92 -138 Net cash position of infrastructure projects
551 6 44 649 20,981 -89 -19,820
B) Cash and cash equivalents and restricted cash As indicated in the note on financial risks, infrastructure project financing agreements occasionally impose the obligation to arrange certain restricted accounts to cover short-term or long-term obligations relating to the repayment of the principal or interest on the borrowings and to infrastructure maintenance and operation. Restricted cash is classified as current or non-current depending on whether it must remain restricted for less than or more than one year. In any event, these funds are invested in highly-liquid financial products bearing floating interest. The type of financial product in which the funds may be invested is also restricted by the financing agreements or, where no restrictions are stipulated, the decision is made on the basis of the Group’s policy for the placement of cash surpluses. Current balances are recognised under “Cash and cash equivalents” in the balance sheet whereas non-current balances are included in “Financial Assets”. The detail of current and non-current restricted cash balances, by project, is as follows: Million Euro
Balance 31/12/10
Balance 31/12/09
Balance 31/12/08
NTE Mobility Partners 130 264
LBJ Infrastructure Group 326
407 ETR 132 128
Chicago Skyway 44 36 35
EuroScut Algarve 19 18 19
EuroScut Norte 30 22 14
Other 2 1 1
Non-current restricted cash 551 473 197
BAA 43 205 85
407 ETR 146 110
Chicago Skyway
Services 9
Other 1
Current restricted cash 44 351 204
Total restricted cash 595 824 401
The main changes in restricted cash arose from the pledge of funds from bonds issued by LBJ Infrastructure Group which will be used to finance construction. Conversely, the decrease arising from changing the consolidation method of 407 ETR should be mentioned, which after the 10% divestment in this company began to be accounted for using by the equity method (see Note 1.2). There is also a significant decrease in the restricted cash of NTE Mobility Partners due to the beginning of construction works on the toll road and the application of the funds to this purpose.

Consolidated Financial Statements for 2010 and 2009 Ferrovial, S.A. and Subsidiaries
Ferrovial, S.A. Consolidated financial statements at 31 December 2010 60
As regards BAA, at 31 December 2009 a restricted amount of EUR 161 million (GBP 143 million) was recognised relating to the gain on the sale of Gatwick to meet the payment of the pension plan deficit amounting to EUR 130 million that arose in 2010 (see Note 17) and which accounts for most of the decrease in current restricted cash. The heading “Other Cash and Cash Equivalents” relates to bank accounts and highly-liquid investments subject to interest rate risk. C) Breakdown of infrastructure project borrowings C.1) Analysis of short-term and long-term balances by project Million Euro 2010 2009 Change 2010-2009
Bonds Bank
borrowings Total Bonds
Bank borrowings
Total Bonds Bank
borrowings Total
LONG TERM 10,022 9,544 19,566 10,523 10,591 21,11
4 -501 -1,047 -1,548
BAA 8,185 6,552 14,737 6,485 7,543 14,028 1,700 -991 709
407 ETR 2,738 2,738 -2,738 -2,738 Skyway Concession Co. LLC 1,019 112 1,131 930 103 1,033 89 9 98 NTE Mobility Partners 291 291 272 272 19 19 LBJ Infrastructure Group 428 428 428 Spanish toll roads 1,148 1,148 1,661 1,661 -513 -513 Other toll roads 99 1,536 1,635 98 1,178 1,276 1 358 359 Construction 142 142 86 86 56 56 Services 54 54 20 20 34 34 SHORT TERM 11 1,404 1,415 591 950 1,541 -580 454 -126 BAA 280 280 444 444 -164 -164 407 ETR 582 582 -582 -582 Skyway Concession Co. LLC 6 6 4 4 2 2 NTE Mobility Partners 1 1 -1 -1 LBJ Infrastructure Group Spanish toll roads 1,042 1,042 486 486 556 556 Other toll roads 11 76 87 9 14 23 2 62 64
TOTAL 10,033 10,948 20,981 11,114 11,542 22,65
5 -1,081 -594 -1,674
Changes in exchange rates between 2010 and 2009 increased the indebtedness, which totalled EUR 746 million. Thus, if a constant exchange rate is applied, the net change in the debt would be EUR -2,429 million.

Consolidated Financial Statements for 2010 and 2009 Ferrovial, S.A. and Subsidiaries
Ferrovial, S.A. Consolidated financial statements at 31 December 2010 61
C.2) Maturities by currency and fair value of infrastructure project debt
Fair value Maturities
Borrowings Currency 2010 2009 2008
Carrying amount 2010 2011 2012 2013 2014 2015
2016 and after
Total maturities
Bonds of infrastructure projects
10,088 11,704 7,266 10,032 0 793 462 598 1 7,413 9,268
BAA 8,201 6,687 3,596 8,185 793 462 598 0 5,506 7,359
GBP 5,177 4,281 2,284 5,267 0 462 0 0 4,405 4,867
EUR 3,024 2,406 1,312 2,918 793 0 598 0 1,101 2,492
Toll Roads 1,887 5,017 3,670 1,847 1 1,907 1,909
CAD 3,685 2,591
USD 1,770 1,202 961 1,738 1,807 1,807
EUR 117 130 118 109 1 101 102
Bank borrowings of infrastructure projects
11,239 11,749 11,830 10,949 1.147 1,206 2,491 823 1,533 3,979 11,179
Airports 7,088 8,167 8,375 6,832 46 664 2,458 776 1,480 1,614 7,038
GBP 7,088 8,158 8,361 6,832 46 664 2,458 776 1,480 1,614 7,038
EUR 9 14
Toll Roads 3,955 3,476 3,305 3,921 1,102 541 29 38 47 2,205 3,963
USD 633 331 223 633 653 653
EUR 3,322 3,145 3,082 3,288 1,102 541 29 38 47 1,553 3,310
Construction EUR 142 86 90 142 126 126
Services 54 20 60 54 1 4 8 6 34 53
GBP 60
EUR 54 20 54 1 4 8 6 34 53
Total borrowings of infrastructure projects
21,327 23,453 19,096 20,981 1,147 1,999 2,954 1,421 1,534 11,392 20,447
The variations between the total maturities of bank borrowings and the carrying amounts of the debt at 31 December 2010 is explained mainly by the difference between the nominal values and carrying amounts of the debts, as certain adjustments are made in accordance with applicable accounting regulations (especially unpaid accrued interest and the application of the amortised cost method). Maturities of BAA bonds include the maturities of the cross currency swaps hedging foreign exchange fluctuations that affect the debt (see Note 11 on “Derivative Financial Instruments”). The debt maturities do not include interest. The fair value reflected in the table above is calculated as follows:
1. Bonds listed in active markets: market value. 2. Fixed-interest bank borrowings: future cash flows are discounted at an equivalent market interest rate. 3. Floating-interest bank borrowings: no significant differences are deemed to exist between the fair value of the borrowings
and their carrying amount and, therefore, the carrying amount is used. Maturities in 2011 relate to:
o Autopista Madrid Sur, with maturities amounting to EUR 554 million. The original maturity of the debt was January 2011, but was extended to July 2011.
o Autopista del Sol, maturity in March 2011 of the syndicated loan which totals EUR 492 million. o BAA, maturity of EIB debt amounting to EUR 46 million in December 2011. o Autopista Eurolink M-3, maturity in June 2011 totalling EUR 37 million of the syndicated loan. o Algarve internacional, maturity of EIB loan of EUR 10 million in December 2011. o Autopista Euroscut Norte, maturities of EUR 6 million in July 2011. o Autopista Eurolink M4M6, maturities of EUR 2 million in December 2011.

Consolidated Financial Statements for 2010 and 2009 Ferrovial, S.A. and Subsidiaries
Ferrovial, S.A. Consolidated financial statements at 31 December 2010 62
C.3) Exposure to interest rate risk of infrastructure project borrowings With the aim of completing the information on exposure to interest rate risk presented in Note 3, below is the detail of debt components indicating the portion subject to fixed interest rates, the portion hedged by derivatives and floating-rate debt:
Type of debt
Balance 31/12/10
% Balance 31/12/09
% Balance 31/12/08
%
Airports 15,017 14,471 13,253
Fixed 2,455 16% 3,955 27% 2,938 22%
Inflation-index fixed 4,995 33% 2,725 19% 2,316 17%
Hedged (IRS) 3,539 24% 4,085 28% 4,765 37%
Floating 4,028 27% 3,706 26% 3,235 24%
Toll Roads 5,768 8,079 7,182
Fixed 1,189 21% 2,837 35% 1,892 26%
Inflation-index fixed 0% 1,071 13% 850 12%
Hedged (IRS) 3,053 53% 2,819 35% 3,270 46%
Floating 1,526 26% 1,352 17% 1,170 16%
Construction 142 86 90
Fixed 78 55%
Hedged (IRS) 58 41%
Floating 6 4% 86 100% 90 100%
Services 54 19 60
Fixed 0% 0% 21 35%
Hedged (IRS) 47 87% 19 98% 39 65%
Floating 7 13% 2% 0%
Total borrowings of infrastructure projects
20,981 22,655 20,586
Fixed 3,723 18% 6,792 30% 4,851 24%
Inflation-index fixed 4,994 24% 3,796 17% 3,167 15%
Hedged (IRS) 6,697 32% 6,923 30% 8,074 39%
Floating 5,567 26% 5,144 23% 4,494 22%
Debt hedged by IRS (interest rate swaps) relates to derivatives that convert floating-rate bank borrowings to fixed interest rates (see details in Note 11). C.4) Information on credit limits and credit drawable for infrastructure projects Set out below is a comparative analysis of borrowings not drawn down at year end: Balances at 31/12/10
Debt limit Amount drawn
down Amount drawable
Debt per books
Airports 16,946 14,398 2,548 15,017
BAA 16,946 14,398 2,548 15,017
Toll Roads 7,590 5,871 1,719 5,768
US toll roads 3,940 2,459 1,481 2,371
Spanish toll roads 2,279 2,210 69 2,191
Other toll roads 1,371 1,202 169 1,206
Construction 153 126 27 142
Services 212 53 159 54
Total borrowings of infrastructure projects 24,901 20,448 4,453 20,981

Consolidated Financial Statements for 2010 and 2009 Ferrovial, S.A. and Subsidiaries
Ferrovial, S.A. Consolidated financial statements at 31 December 2010 63
Balances at 31.12.2009
Debt limit Amount drawn
down Amount drawable
Debt per books
Airports 17,834 14,604 3,230 14,472
BAA 17,834 14,604 3,230 14,472
Toll Roads 9,581 8,170 1,411 8,077
407 ETR 3,274 3,274 3,320
US toll roads 2,639 1,611 1,028 1,535
Spanish toll roads 2,273 2,178 95 2,146
Other toll roads 1,395 1,107 288 1,076
Construction 10 10 86
Services 194 22 172 20
Total borrowings of infrastructure projects 27,619 22,806 4,813 22,655
The variations between the total bank borrowings and the debt per books at 31 December 2010 are due mainly to the difference between the nominal values and carrying amounts of the debts, as certain adjustments are made in accordance with applicable accounting regulations (especially in regard of unpaid accrued interest and the application of the amortised cost method). The drawable balance of EUR 4,453 million (EUR 4,814 million at 31 December 2009) includes EUR 2,548 million relating to BAA (EUR 3,320 million at 31 December 2009), which consists basically of credit lines obtained to finance investments. The main balance in the Toll Roads segment also relates to amounts not drawn down that were obtained to finance toll roads under construction. Following is a more detailed description of interest rates, maturities and covenants for the main infrastructure project borrowings. C.5) BAA’s borrowings: Changes in 2010 and 2009 and main interest rate and covenant terms The detail of the BAA Group’s borrowings for 2010 and 2009 and the most significant changes therein are as follows: Million Euro
2010 2009 Change
2010-2009 1
Bonds 8,185 6,485 1,700 Refinancing facility 1,507 2,539 -1,032 Senior capex facility 1,476 735 741 European Investment Bank 386 419 -33 Subtotal designated airports 11,554 10,178 1,376 Subordinated debt 199 1,752 -1,553 Not designated airports 1,209 1,155 54 Toggle facility 1,055 941 114 Repo facility 170 -170 Class B1 Loan 718 718 Other liabilities 282 275 7
TOTAL 15,017 14,472 545
In 2010 the positive evolution of the pound sterling against the euro had a foreign exchange impact of EUR 510 million on BAA’s borrowings (1 pound sterling = 0.887 euros at 31 December 2009; against 1 pound sterling = 0.857 euro at 31 December 2009). Had the exchange rate not changed, debt would have increased by EUR 35 million (GBP 30 million). C.5 a) Designated airports
Bonds The carrying amount of the bonds is EUR 8,185 million (GBP 7,018 million), including transaction costs, redemption, premiums and discounts. The difference between the nominal value of such bonds and the carrying amount thereof arose from the recognition at fair value made upon BAA’s acquisition (2006) thereof. The total bond balance includes EUR 5,267 million issued in pounds sterling and EUR 2,918 million issued in euros, related exchange risks having been hedged at fair value, as explained in Note 11 on derivative financial instruments. The bonds mature from 2012 to 2039. The changes were due to:

Consolidated Financial Statements for 2010 and 2009 Ferrovial, S.A. and Subsidiaries
Ferrovial, S.A. Consolidated financial statements at 31 December 2010 64
Million Euro Bonds at 31 December 2009 6,485 Issue: 4.125% EUR 500 maturing in 2016 476 Issue: 7.125% GBP 325 maturing in 2017 370 Issue: 6.250% GBP 400 maturing in 2018 457 Sale existing bond: 6.450% EUR 900 maturing in 2031 258 Impact of exchange rate 152 Other -9 Bonds at 31 December 2010 8,185
1. Performance of pound sterling against the euro, giving rise to an increase of EUR 152 million in borrowings. 2. Issuance of new bonds with a carrying amount of EUR 1,303 million (GBP EUR 1,117 million):
a. Bonds issued in euro for a nominal amount of EUR 500 million maturing in 2016. b. Bonds issued in pound sterling for a nominal amount of GBP 325 million and GBP 400 million with maturities in
2017 and 2018, respectively. Refinancing facility
These borrowings were granted to BAA as part of the 2008 refinancing process, with a carrying amount of EUR 1,507 million (GBP 1,292 million). This debt has some maturities falling between 2011 and 2013 and interest tied to LIBOR plus a spread. The main changes were due to:
1. Performance of the pound sterling against the euro, giving rise to an increase of EUR 89 million in borrowings. 2. In 2010 debt amounting to EUR 1,122 million (GBP 962 million) was repaid, the funds for which came from the bonds
issued during the year.
Senior capex facility These borrowings amounting to EUR 1,476 million (GBP 1,266 million), were obtained to finance the Group’s capex programme and mature in 2013. These borrowings are tied to LIBOR plus a spread. The changes are due basically to the performance of the pound sterling against the euro, giving rise to an increase of EUR 26 million in borrowings and an increase of EUR 715 million (GBP 613 million) in drawdowns to finance capex in 2010 and refinance a portion of the subordinated debt.
European Investment Bank loan The loan from the European Investment Bank (EIB) has a carrying amount of EUR 386 million (GBP 331 million), excluding the cost of capitalised borrowings. The EIB loan is repayable up to 2022 and it is recognised at amortised cost. The changes are explained by:
- Changes in the exchange rate, giving rise to an increase of EUR 12 million in this debt. - Repayment of a nominal amount of EUR 46 million (GBP 39 million).
C.5.b) Subordinated debt In 2010 the subordinated debt, which at December 2009 totalled EUR 1,752 million (GBP 1,555 million) was refinanced. This transaction was completed using funds as indicated below: 1. In September a new class B1 loan was arranged for a nominal amount of GBP 625 million and maturing in 4 years. 2. Capex lines of credit of regulated airports amounting to GBP 375 million. 3. Funds from the divestment in associate APP (see Note 25 “Impairment and Disposal of Fixed Assets”) amounting to
GBP 100 million. 4. New subordinated loan amounting to GBP 175 million. 5. The remaining refinancing was completed by bond issues carried out during the year.

Consolidated Financial Statements for 2010 and 2009 Ferrovial, S.A. and Subsidiaries
Ferrovial, S.A. Consolidated financial statements at 31 December 2010 65
Millions of pound sterling Millions of pound sterling
2009 2010
1. Class B1 Loan 616 2. Capex credit lines 375 Subordinated debt 1,555 3. Proceeds from sale of APP 100 4. New subordinated loan 171 5. New bond issue 294
Total 1,555 Total 1,555
At 31 December 2010, the carrying amount of the subordinated debt of the new class B loan maturing in 5 years totalled EUR 199 million (GBP 171 million). C.5.c) Non-designated airports The borrowings allocated to the unregulated airports (see Note 2) amounting to EUR 1,209 million (GBP 1,037 million) mature in 2015. The changes are due to the changes in the exchange rate which increased the debt by EUR 41 million plus accrued interest payable. C.5.d) Toggle facility This debt was arranged to finance the acquisition of BAA. It is a super-subordinated debt and is therefore below the subordinated debt for debt seniority purposes. The debt amounts to EUR 1,055 million (GBP 905 million), matures on a perpetual basis and bears interest at the LIBOR plus a spread. The balance of this debt increased by the amount of accrued interest payable in 2010 and also increased by EUR 33 million due to exchange rate fluctuations. C.5.e) New class B1 loan In September 2010, BAA arranged a new 4-year class B1 loan for a nominal amount of GBP 625 million. This loan has a carrying amount of EUR 718 million (GBP 616 million) and was used to refinance the subordinated debt as discussed above.
C.5.f) Other borrowings In 2010 this item relates mainly to accrued interest payable. C.5. g) BAA’s debt covenants Most financing agreements include certain conditions the infringement of which gives rise to obligations for the borrower. These covenants are used by credit institutions to ensure that the concession operators fulfil the debt commitments acquired.
• Bonds and Refinancing Facility: require compliance with certain covenants under the Common Terms Agreement (CTA). • Non-regulated airports: a minimum debt service coverage ratio must be maintained. • The company must achieve certain ratios such as leverage (net debt/RAB) of 0.70x for senior debt and 0.85x for junior
debt. At 31 December 2009, all of the current ratios were being achieved.
C.5. h) Collateral and guarantees The assets of Heathrow and Stansted airports secure the refinancing facility, the aforementioned credit lines, the bond issues and, lastly, the subordinated debt. The assets of the non-regulated airports secure the related borrowings.

Consolidated Financial Statements for 2010 and 2009 Ferrovial, S.A. and Subsidiaries
Ferrovial, S.A. Consolidated financial statements at 31 December 2010 66
C.6) Toll Road division borrowings The breakdown of toll road borrowings, by project, showing the main characteristics and changes therein, is as follows: Million Euro Borrowings 2010 2009 2008
407 ETR – Canada 3,320 2,801 US toll roads 2,371 1,535 1,184 Chicago Skyway 1,137 1,038 1,071 North Tarrant Express Managed Lanes − NTE 291 274 LBJ Infrastructure Group 428 SH-130 515 223 113 Spanish toll roads 2,191 2,147 2,147 Ausol I and II 491 485 490
Inversora Autopistas de Cataluña / A. Terrasa Manresa 641 627 620
Inversora A. Sur / A. R-4 Madrid Sur 552 547 559 Inversora A. Levante / A. Madrid Levante 507 488 478 Irish toll roads 413 393 396 Eurolink M4-M6 138 138 143 Eurolink M3 275 255 253 Portuguese toll roads 793 684 654 Euroscut Algarve 225 233 245 Euroscut Azores 254 147 93 Euroscut Norte Litoral 314 304 316
Total toll roads 5,768 8,079 7,182
The table below shows the main changes in toll road borrowings: Million Euro 407 ETR – Canada US toll roads Portuguese toll roads Other Total toll roads 2009 borrowings 3,320 1,535 685 2,539 8,079 Changes: Exchange rate -424 102 -322 New bond issue 459 459 Extension of existing debt 276 104 64 444 Other -2,896 4 -2,892 2010 borrowings 0 2,372 793 2,603 5,768
C.6. a) 407 ETR – Canada The decrease arising from change in the consolidation method of 407 ETR should be mentioned, which, after the 10% divestment in this company, began to be accounted for using the equity method (see Note 1.2). At the end of 2009, this company’s debt totalled EUR 3,320 million. C.6. b) Chicago Skyway This concession operator is financed by a senior bond issue underwritten by F.S.A., structured as follows: (i) Series A of USD 439 million maturing in 2017, and; (ii) Series B of USD 961 million with final maturity in 2026. It also has syndicated subordinated bank financing drawn down by USD 155 million, maturing in 2035. C.6.c) SH −−−− 130 Syndicated bank financing in two tranches: Tranche A to finance part of the construction work amounting to USD 686 million, of which USD 424 million had been drawn down at 31 December 2010, and Tranche B to ensure liquidity (not drawn down), during the first five years of business amounting to USD 35 million, both with final maturity in 2038. There is also a TIFIA debt tranche of USD 430 million to finance part of the construction work, maturing in 2047, of which USD 293 million had been drawn down at 31 December 2010.

Consolidated Financial Statements for 2010 and 2009 Ferrovial, S.A. and Subsidiaries
Ferrovial, S.A. Consolidated financial statements at 31 December 2010 67
C.6. d) North Tarrant Express Managed Lanes −−−− NTE The project is financed through the issue of PAB (Private Activity Bonds) amounting to USD 400 million maturing in 30 years. There is also a TIFIA loan granted by the US Federal Government of USD 650 million with a repayment profile of 35 years from operation start-up, with no amounts having been drawn down at year-end. The drawdown amount relates to the bonds issued. C.6.e) LBJ This concession operator is financed through the issue of PAB (Private Activity Bonds) amounting to USD 615 million maturing in 30 years. There is also a TIFIA loan granted by the US Federal Government amounting to USD 850 million with a repayment profile of 35 years from operation start up, with no amounts having been drawn down at year-end. The drawdown amount relates to the bonds issued. C.6. f) Ausol I and II Ausol toll road refinanced EUR 492 million in April with a bridge loan maturing in March 2011, currently being refinanced. C.6. g) Inversora Autopistas de Cataluña / A. Terrasa Manresa It refinanced its debt in 2008 through a syndicated structure, replacing its short-term financing for other long-term financing amounting to EUR 392 million, maturing in 2035. C.6. h) Inversora A. Sur / A. R-4 Madrid Sur The Radial 4 toll road had syndicated borrowings of EUR 557 million outstanding at 31 December 2010. Tranche A amounts to EUR 97 million and matures in 2011; Tranche B amounts to EUR 100 million and matures in 2011; and the EIB tranche amounts to EUR 357 million and has final maturity in 2033, although the guarantee expires in 2011. The syndicated loan of this toll road originally matured in January 2011, but was extended an additional six months until July 2011, and is currently undergoing a long-term refinancing process. C.6. i) Inversora A. Levante / A. Madrid Levante The Ocaña − La Roda toll road has syndicated bank financing with an outstanding amount of EUR 512 million maturing in 2012. This is a mini-perm structured loan that will be refinanced on a long-term basis. C.6. j) Eurolink M4-M6 Financing consists of an EIB loan of EUR 94 million in 2027 and bank financing of EUR 49 million with final maturity in 2027. C.6. k) Eurolink M3 Syndicated bank loan drawn down at 31 December 2010 by EUR 280 million, comprising a bridge loan of an outstanding amount of EUR 15 million and forward financing of EUR 265 million, the final maturity dates being 2011 and 2025, respectively. C.6. l) Euroscut Algarve This company has structured debt in two tranches secured by Syncora Guarantee Inc, one of which is composed by bonds totalling EUR 101 million maturing in 2027 and the other by EIB borrowings of EUR 130 million maturing in 2025. C.6. m) Euroscut Azores Syndicated bank financing for a drawn down amount at 31 December 2010 of EUR 258 million until 2033. C.6. n) Euroscut Norte Litoral Financing structure based on a syndicated loan for an outstanding amount of EUR 300 million, with final maturity in 2026.

Consolidated Financial Statements for 2010 and 2009 Ferrovial, S.A. and Subsidiaries
Ferrovial, S.A. Consolidated financial statements at 31 December 2010 68
C.6. o) Guarantees and covenants for toll road borrowings The financial conditions (applicable interest rates) of the toll road debts are subject to the achievement of certain ratios based on financial aggregates such as gross profit from operations (EBITDA), net debt and consolidated shareholders’ equity. In general, the aforementioned financing arrangements are subject to pledges of concession operator assets (insurance policies receivables, current accounts, concession receivables, etc.), forming a package of guarantees for lenders. In certain cases there is also a pledge on the concession operator’s shares. Most agreements include certain conditions the infringement of which gives rise to obligations for the borrower. These covenants are used by credit institutions to ensure that the concession operators achieve the debt commitments acquired. The most common covenants included in the majority of infrastructure project financing agreements are as follows: - Restrictions on the availability of cash balances, the most common being reserve accounts for debt servicing and for
extraordinary maintenance. - Payment of dividends to shareholders subordinated, for example, to the maintenance of required levels of restricted cash. - Material adverse change or effect (MAC or MAE) clauses regulating cases in which a number of circumstances or events have
or could have a relevant adverse effect on the value, business, operations, assets or liabilities of the concession operators. - Limit on the maximum volume of borrowings that may be obtained by the concession operator. - Limit on the level of default by the concession operator, above which the debt repayment could be demanded (cross-default
threshold). - Periodic disclosure obligations during the debt period. - Achievement of financial ratios for borrowings and liquidity. At 31 December 2010, none of the applicable covenants in force had been breached. C.7) Services division borrowings: The bank borrowings of the Services Division infrastructure projects relate to the Cespa Group totalling EUR 54 million at 31 December 2010. These borrowings were arranged in 2009 and 2010 to finance the Ecoparc Can Mata (EUR 43 million) and Gestión Medioambiental de Toledo (EUR 11 million) concession projects. 19.2. Net cash position excluding infrastructure projects A) Breakdown of the net cash position excluding infrastructure projects The detail of the net cash position excluding infrastructure projects in 2010 is as follows: Million Euro
Non-current restricted cash
Current restricted cash
Other cash and cash equivalents
Bank
borrowings
Intra-group transactions
Total net cash
position Construction 1,057 49 1,266 2,275 Services 0 4 117 170 -784 -833 Airports 3 19 22 Toll Roads and Car Parks 2 201 369 572 Corporate and other 8 613 1,844 -781 -2,005 Net cash position excluding infrastructure projects
0 14 1,991 2,063 89 31
The main changes in the net cash position excluding infrastructure projects are discussed in Note 31 on “Cash Flows”.

Consolidated Financial Statements for 2010 and 2009 Ferrovial, S.A. and Subsidiaries
Ferrovial, S.A. Consolidated financial statements at 31 December 2010 69
B) Breakdown of borrowings excluding infrastructure projects B.1) Analysis of current and non-current balances by business division The distribution of bank borrowings is as follows:
Million Euro 2010 2009 2008
Non-current
Current TOTAL Non-current
Current TOTAL Non-current
Current TOTAL
Change 2010-2009
Change 2009-2008
Construction 28 21 49 17 32 49 21 65 86 -37 Services 99 71 170 266 89 355 198 200 398 -185 -43 Airports 0 0 0 1,583 1,583 -1,583 Corporate and other
1,815 29 1,844 1,970 276 2,246 870 441 1,311 -402 935
Total bank borrowings excluding infrastructure projects
1,943 120 2,063 2,253 397 2,650 2,672 706 3,378 -587 -728
B.2) Maturities by currency and fair value of borrowings excluding infrastructure projects
Maturities
Currency
Fair value 2010
Carrying amount 2010
2011 2012 2013 2014 2015 2016 and after
Total maturities
Construction 49 49 1 13 0 0 3 13 30
EUR 32 32 13 13
USD 11 11 11 11
PLZ 6 6 1 2 3 6
Services 170 170 58 42 9 8 9 14 140
EUR 116 116 40 6 9 8 9 14 86
GBP 46 46 11 35 46
CHF 6 6 6 6
OTHER 2 2 1 1 2
Corporate and other 1,844 1,844 0 1,834 0 0 0 0 1,834
EUR 883 883 873 873
GBP 815 815 815 815
CHF 146 146 146 146
Total bank borrowings excluding infrastructure projects
2,063 2,063 59 1,889 9 8 12 27 2,004
The differences between the total maturities of bank borrowings and the carrying amounts of the debt at 31 December 2010 are explained mainly by the difference between the nominal values and carrying amounts of the debts, as certain adjustments are made in accordance with applicable accounting regulations (especially unpaid accrued interest and the application of the amortised cost method). The debt maturities do not include interest. The total fair value of bank borrowings excluding infrastructure projects at 31 December 2010 was EUR 2,063 million (EUR 2,650 million at 31 December 2009). The 2011 maturities total EUR 59 million and relate mainly to the Services Division, particularly Inagra (EUR 17 million), Cespa Portugal (EUR 13 million), Donarbon (EUR 11 million), Sopovico (EUR 5 million), Recogida de Residuos de Barcelona (EUR 4 million) and other (EUR 9 million).

Consolidated Financial Statements for 2010 and 2009 Ferrovial, S.A. and Subsidiaries
Ferrovial, S.A. Consolidated financial statements at 31 December 2010 70
B.3) Exposure to interest rate risk excluding infrastructure projects In order to complete the information on exposure to interest rate risk presented in Note 3, following is the detail of the various debt components indicating the portion subject to fixed interest rates, the portion hedged by derivatives and floating-rate debt.
Million Euro
Type of debt
Balance at
31/12/10 %
Balance at
31/12/09 %
Balance at
31/12/08 %
Construction 49 50 86
Fixed 0 0% 0 0% 22 26%
Hedged (IRS) 18 36% 23 46% 0 0%
Floating 31 64% 27 54% 64 74%
Services 170 354 398
Fixed 4 2% 3 1% 7 2%
Inflation-index fixed
0 0% 23 6% 20 5%
Hedged (IRS) 30 18% 27 8% 0 0%
Floating 136 80% 301 85% 371 93%
Airports 0 0 1,583
Fixed 0 0% 0 0%
Hedged (IRS) 0 0% 1.583 100%
Floating 0 0% 0 0%
Corporate and other 1,844 2,246 1,311
Hedged (IRS) 820 44% 1,188 53% 60 5%
Floating 1,024 56% 1,058 47% 1,252 95%
Total bank borrowings excluding infrastructure projects
2,063 2,650 3,379
Fixed 4 0% 3 0% 29 1%
Inflation-index fixed
0% 23 1% 20 1%
Hedged (IRS) 868 42% 1,237 47% 1,643 48%
Floating 1,191 58% 1,386 52% 1,687 50%
The debt balances hedged by IRSs (interest rate swaps) relates to derivatives that convert floating-rate bank borrowings to fixed interest rates (see Note 11).
B.4) Information on credit limits and drawable credit
Set out below is a comparative analysis of borrowings not drawn down at year end:
Balances at 31/12/10
Borrowings Debt limit Amount drawn down Amount drawable Consolidated
debt
Construction 111 30 81 49
Services 273 140 133 170
Corporate and other 2,539 1,834 705 1,844
Total bank borrowings excluding infrastructure projects
2,923 2,004 919 2,063

Consolidated Financial Statements for 2010 and 2009 Ferrovial, S.A. and Subsidiaries
Ferrovial, S.A. Consolidated financial statements at 31 December 2010 71
Balances at 31/12/09
Borrowings Debt limit Amount drawn down Amount drawable Consolidated
debt
Construction 99 23 76 50
Services 459 311 148 355
Corporate and other 2,889 2,245 644 2,245
Total bank borrowings excluding infrastructure projects
3,447 2,579 868 2,650
The differences between total bank borrowings and the carrying amount thereof at 31 December 2010 are explained mainly by the difference between the nominal values and carrying amounts of the debts, as certain adjustments are made in accordance with applicable accounting regulations. Set out below is a more detailed description of interest rates, maturities and covenants for the main borrowings excluding infrastructure projects: B.5) Corporate: Borrowings of Ferrovial, S.A. B.5.1) Changes in borrowings The changes in Ferrovial, S.A.’s borrowings in 2010 were as follows:
Million Euro
Balance at 01/01/10
Increase Decrease Transfers Interest Effect of exch. rate
Balance at 31/12/10
Non-current bank borrowings 1,911 0 -183 0 24 58 1,810
Tranche A1 1,788 0 -110 -854 16 0 840
Tranche A2 123 0 0 0 0 23 146
Tranche A3 0 0 -73 854 8 35 824
Current bank borrowings 251 0 -251 0 0 0 0
Tranche B 251 0 -251 0 0 0 0
Finance leases 0 3 0 0 0 0 3
Total 2,162 3 -434 0 24 57 1,813
The main changes during the year include:
a) Redenomination or transfer of EUR 854 million of tranche A1 denominated in euro to a new tranche A3 denominated in pound sterling.
b) Early repayment of a portion of the nominal amount of the existing debt amounting to EUR 152 million relating to EUR 79 million of tranche A1 and EUR 73 million of tranche A3.
c) Total repayment of tranche B amounting to EUR 251 million. d) The fall in value of the euro vis-à-vis the Swiss franc and pound sterling led to increased indebtedness of EUR 23 million and EUR 35 million, respectively.

Consolidated Financial Statements for 2010 and 2009 Ferrovial, S.A. and Subsidiaries
Ferrovial, S.A. Consolidated financial statements at 31 December 2010 72
B.5.2) Main features of the bank borrowings
a. Structure The borrowings at 31 December 2010 are structured in a single tranche maturing in December 2012, which, in turn, is subdivided into three sub-tranches, based on the currency in which the related amounts are drawn down. The amounts drawn down are as follows: Million Euro Principal Interest (i) Total Tranche A1 824 16 841 Tranche A2 146 0 146 Tranche A3 815 8 823 Total bank borrowings 1,785 24 1,810 (i) Accounted for using the amortised cost method.
- Tranche A1, denominated in euros.
- Tranche A2, denominated in Swiss francs. The amount drawn down against this tranche may be converted to euros at the
end of any interest period, provided that the amount is converted only once during the life of the tranche for the total amount drawn down in Swiss francs.
- Tranche A3, available in pounds sterling.
There are also undrawn credit lines: - a tranche C, forming part of the corporate debt, consisting of a revolving working capital facility of EUR 541 million, which has a maximum duration of three years; and
- a bilateral credit line of EUR 120 million maturing in 2013.
b. Applicable interest rates and credit limits The interest rate applicable to the principle of financing is EURIBOR (for amounts drawn down in euros) / LIBOR (for amounts drawn down in Swiss francs and pounds sterling) plus a spread. For the purposes of the accrual and settlement of interest on amounts drawn down, each drawdown will be divided into interest periods of three or six months (at Ferrovial’s discretion). For the same purposes, each Tranche C drawdown will have a duration of 15 days or one, two, three or six months (at Ferrovial’s discretion), while in the bilateral credit facility the drawdowns can be made every 15 days. As regards exposure to interest rate risk, set forth below is a detail of debt components indicating the portion tied to fixed interest rates, the portion hedged by derivatives and portion tied to floating rates. Type of borrowing Million Euro Balance at
31/12/10 %
Balance at 31/12/09
%
Fixed 0 0% 0 0% Hedged 793 44% 793 42% Floating 992 56% 1,111 58%
Total 1,785 1,904
As regards Ferrovial, S.A.’s exposed borrowings, a fluctuation of 100 basis points in the interest rate would have an impact of EUR 10 million on the income statement (EUR 7 million on the net profit).

Consolidated Financial Statements for 2010 and 2009 Ferrovial, S.A. and Subsidiaries
Ferrovial, S.A. Consolidated financial statements at 31 December 2010 73
c. Maturities
The detail of the nominal maturities of the bank borrowings is as follows: Million Euro 2011 2012 2013 2014 2015 Total
Tranche A1 869 869
Tranche A2 146 146
Tranche A3 815 815
Total 0 1,830 0 0 0 1,830
The differences between the nominal amount reflected in the table above and the Tranche A1 principal amount is due to the accounting adjustment of the fees on the transaction using the amortised cost method, as mentioned previously.
d. Financial obligations and guarantees Ferrovial S.A. must fulfil the following financial obligations during the term of the financing, which will be assessed every six months: i. The Group’s Net Financial Debt/EBITDA ratio must not exceed certain pre-established levels. ii. The Group’s EBITDA/Net Finance expenses ratio must not fall below certain pre-established levels.
For the purposes of fulfilling the above-mentioned ratios, the Group is deemed to include the consolidated Group companies, excluding infrastructure projects, and other companies (mainly Amey, Budimex, Webber, BAA and BNI). The company was achieving both ratios at 31 December 2010. B.6) Services The bank borrowings relate basically to: � Long-term bank loans and debt (EUR 99 million). The main features of these borrowings are presented below by company, which include mainly:
� Cespa (EUR 40 million). Bank loan hedged by an interest rate swap, as described in Note 11 on derivative financial instruments.
� Amey (EUR 34 million). Floating-interest bank loan tied to LIBOR. � Long-term finance lease (EUR 14 million). Long-term portion of lease instalments and interest under long-term leases.
� Short-term bank loans and debt (EUR 71 million), which relate mainly to:
� Cespa (EUR 47 million). Bank loans measured at amortised cost. � Sopovico (EUR 8 million). � Short-term finance lease (EUR 3 million). Short-term portion of lease instalments and interest under long-term leases.
B.7) Construction The borrowings comprise mainly loans granted to the subsidiary Cadagua amounting to EUR 12 million (13 EUR million at 31 December 2009), which bear interest at between 4% and 5.5%, to Webber amounting to EUR 11 million (EUR 0 million at 31 December 2009) and bank borrowings amounting to EUR 17 million (EUR 28 million at 31 December 2009).

Consolidated Financial Statements for 2010 and 2009 Ferrovial, S.A. and Subsidiaries
Ferrovial, S.A. Consolidated financial statements at 31 December 2010 74
20. Other non-current liabilities
The detail of the non-financial non-current liabilities is as follows:
Balance at 31/12/10
Balance at 31/12/09
Balance at 31/12/08
Change 2010-2009
Change 2009-2008
Other long-term payables 122 120 106 1 14
Other non-financial payables 33 15 12 17 3
Total 154 136 118 18 17
“Other Long-Term Payables” includes mainly the participating loan granted by the State to the concession operator Autopista del Sol for the construction of the Estepona − Guadiaro section of the related toll road, totalling EUR 92 million at 31 December 2010 (90 EUR million at 31 December 2009). The increase in “Other Non-Financial Payables” was due mostly to the inclusion of Amey-Cespa in the scope of consolidation (EUR 14 million). This heading also reflects the net position of the investment in certain Economic Interest Groupings (EIGs) in which Ferrovial S.A. holds an interest and the absorption of their results totalling EUR 8 million. These Economic Interest Groupings engage in the lease of assets managed by another company not related to the Group that retains most of the rewards and is exposed to the risks associated with that activity. These Groupings have availed themselves of the tax incentives provided by Spanish legislation and their results are recognised under “Income tax” in the consolidated income statement. Lastly, it should be noted that this line item also includes Ferrovial Agromán’s accounts payable in relation to Sociedad Concesionaria BAIO amounting to EUR 7 million.
21. Trade and other payables Set out below is an analysis of the remaining short-term, non-financial payables at 31 December 2010, 2009 and 2008:
Million Euro ITEM Balance at
31/12/10 Balance at 31/12/09
Balance at 31/12/08
Change 2010-2009
Change 2009-2008
Trade payables 3,906 4,121 4,183 -215 -62 Current tax liabilities 264 216 167 48 49 Other non-trade payables 719 857 792 -138 65 Total 4,889 5,194 5,142 -305 52
Advances paid (Note 14) -50 -69 -72 19 3 Net trade payables 4,839 5,126 5,070 -287 56
“Other Non-Trade Payables” includes payables to public authorities other than income tax payables amounting to EUR 323 million at 31 December 2010 (EUR 289 million in 2009 and EUR 273 million in 2008). Additionally, “Trade Payables” includes advances received on orders amounting to EUR 154 million (EUR 189 million at December 2009 and EUR 181 million at December 2008) and amounts billed in advance for construction work totalling EUR 602 million (EUR 592 million at December 2009 and EUR 299 million at December 2008). Group management considers that the carrying amount of trade receivables approximate their fair value. In compliance with Law 15/2010 amending the Law on combating late payment in commercial transactions, the Group has modified the model agreements with its suppliers in cases in which the new Law applies. At 31 December 2010 and considering the total amount payable to suppliers in Spain at that date, there were no significant unpaid trade payables past due by more than the maximum payment period. “Other Non-Trade Payables” includes payables to public authorities other than income tax payables amounting to EUR 323 million at 31 December 2010 (EUR 289 million in 2009 and EUR 273 million in 2008).

Consolidated Financial Statements for 2010 and 2009 Ferrovial, S.A. and Subsidiaries
Ferrovial, S.A. Consolidated financial statements at 31 December 2010 75
22. Tax matters
22.1 Reconciliation of the income tax expense to the profit or loss before tax The reconciliation of the income tax expense to the profit or loss before tax for 2010 and 2009 is as follows: In view of the significance of the Group’s activities in Spain, the United Kingdom, Canada and the United States, following is the above-mentioned reconciliation for those countries:
Million Euro 2010
Spain
United Kingdom USA Canada
Other countries Total
Tax rate 30% 28% 40% 29% 27%
Profit or loss before tax -401 -1,010 -31 2,580 592 1,730 Result of companies accounted for using the equity method -12 -34 0 -1 -16 -62 Permanent differences -14 481 -8 -2,488 -362 -2,391
Taxable profit/ Tax loss -427 -562 -38 91 214 -723
Tax at applicable tax rate -128 -157 -15 27 48 -227 Tax credits 0 0 0 0 3 3 Other -5 -3 11 5 14 21
Tax expense for the year -133 -160 -4 31 64 -203
Effective tax rate applicable to tax base 31.2% 28.5% 11.8% 34.5% 30.0% 28.1%
Adjustment of prior years’ tax 85 -80 16 19 77 118
Total tax expense -48 -240 12 50 142 -85 Total effective rate applicable to profit or loss before tax 12.0% 23.8% -38.6% 1.9% 23.9% -4.9%
Ferrovial recognised tax income of EUR 85 million in its income statement, in spite of having earned a profit before tax of EUR 1,730 million. Certain items included in the profit before tax that are not taxable need to be taken into consideration in order to be able to understand this figure: - Result of companies accounted for using the equity method, which pursuant to accounting legislation, is presented already net of the related tax effect. The profit generated by these companies totalled EUR 61 million in 2010. Permanent differences: which relate to either profits or losses which are not subject to taxation or which do not generate deductible expenses. The permanent differences totalled EUR 2,391 million in 2010 and related basically to:
United Kingdom: - Non-deductibility of the impairment loss of EUR 460 million recognised by BAA on its interests in certain airports. Canada: - In 2010 10% of the share capital of 407 ETR was sold and the remaining 43% was therefore remeasured at fair value, as explained in Note 25 on impairment and disposals of non-current assets. The gain on that transaction was not subject to taxation and totalled EUR 2,489 million.
Other countries: - In 2010 Cintra sold 60% of its ownership interest in Cintra Chile and, as explained in Note 26 on impairment and disposals of non-current assets, the ownership interest retained was remeasured at fair value, the gain on that transaction amounted to EUR 368 million and was not subject to taxation.
With these adjustments, the tax loss amounted to EUR 723 million and, applying the effective rate of each country and considering the tax credits for the year, the tax income totalled EUR 203 million, with an effective tax rate of 28%. The difference between this tax income of EUR 203 million and total tax income recognised in the year totalling EUR 85 million relates to the adjustment of deferred tax assets and liabilities of prior years, giving rise to an expense of EUR 118 million, without any impact on cash, the detail being as follows:

Consolidated Financial Statements for 2010 and 2009 Ferrovial, S.A. and Subsidiaries
Ferrovial, S.A. Consolidated financial statements at 31 December 2010 76
- In the United Kingdom during 2010 the income rate tax changed from 28% to 27%. This led to an adjustment of the deferred tax balances recognised, giving rise to income totalling EUR 113 million. Additionally, other deferred taxes recognised in prior years were adjusted in relation to the investment in the United Kingdom giving rise to an expense of EUR 44 million. The impact after non-controlling interests of these two adjustments in the United Kingdom gave rise to net income of EUR 19 million.
- Additionally, the review of the business plans at the level of all Group companies led to the derecognition of tax assets previously recognised, giving rise to a period expense of EUR 89 million (same impact after non-controlling interests).
The sum total of all the aforementioned adjustments led to the recognition of an expense of EUR 20 million, with an impact on the net profit of EUR -71 million, which is considered a non-recurring loss with no impact on cash (see Note 25). Lastly, with regard to the previously mentioned divestments of interests held in Cintra Chile and ETR 407 and as those transactions were tax exempt, deferred tax assets amounting to EUR 80 million and EUR 18 million, respectively, associated with the historical remeasurements of those investments were reversed. The related impact on expense totalled EUR 98 million and, for the purposes of the information on those investments, this amount was included in the net result generated by them.
Million Euro 2009
Spain United Kingdom USA Other countries Total Tax rate 30% 28% 40% 25% Profit or loss before tax 233 -1,028 -40 200 -635 Result of companies accounted for using the equity method -10 -38 -10 -59
Permanent differences 12 819 8 36 875
Taxable profit/ Tax loss 235 -248 -32 226 181
Tax at applicable tax rate 70 -69 -13 62 50
Tax credits 0 -5 0 -16 -21
Other -5 -29 0 -4 -39
Tax expense for the year 66 -104 -13 41 -10
Effective tax rate applicable to the tax base 27.9% 42.0% 40.0% 18.4% -5.4%
Adjustment of prior year’s tax -73 -46 24 -30 -126
Total tax expense -7 -150 11 11 -135 Total effective rate applicable to profit or loss before tax -3.1% 14.6% -28.3% 5.5% 21.3%
22.2 Difference between deferred tax and current tax The breakdown of the accrued tax for 2010 and 2009, differentiating between current tax and deferred tax is as follows:
Million Euro 2010
Spain
United Kingdom USA CANADA
Other countries Total
Tax expense for the year -133 -160 -4 31 64 -203
Deferred tax expense -122 -191 5 28 -16 -296
Current tax expense -10 30 -9 3 78 93
Adjustment of prior year’s tax 85 -80 16 19 77 118
TOTAL tax expense -47 -240 12 50 140 -85
Million Euro
2009 Spain
United Kingdom USA Other countries Total
Tax expense for the year 66 -104 -13 41 -10
Deferred tax expense -31 -52 5 16 -62
Current tax expense 96 -52 -18 26 52
Adjustment of prior year’s tax -73 -46 24 -30 -126
TOTAL tax expense -7 -150 11 11 -135

Consolidated Financial Statements for 2010 and 2009 Ferrovial, S.A. and Subsidiaries
Ferrovial, S.A. Consolidated financial statements at 31 December 2010 77
22.3 Changes in deferred tax assets and liabilities at December 2010
Million Euro Balance at 01/01/10
Transfers
Adjustments and other
Charge/ Credit to income statement
Assets held for sale
Charge/Credit to equity
Exchange rate effect
Balance at 12/31/10
Deferred tax assets
Tax assets 972 228 -111 83 -53 0 8 1,127
Temporary differences (tax/accounting recognition methods)
351 88 -5 104 -51 0 9 496
Deferred tax assets arising from business combinations
133 -25 -6 -14 0 0 5 93
Valuations adjustments 599 -3 44 38 -6 61 18 751
Other 135 -105 25 6 -9 0 8 59
Total 2,190 184 -53 217 -121 61 48 2,526
Million Euro
Balance at 01/01/10
Transfers Adjustments and
other
Charge/ Credit to income statement
Assets held for sale
Charge/Credit to equity
Exchange rate effect
Balance at 12/31/10
Deferred tax liabilities
Deferred tax liabilities arising from business combinations
1,086 -13 59 -159 -8 0 39 1,003
Temporary differences (tax/accounting recognition methods)
868 214 15 -53 -39 0 26 1,032
Valuation adjustments 23 0 67 -5 0 40 5 130
Industrial Building Allowance
1,539 -73 0 -130 0 0 56 1,392
Other 521 56 124 155 -8 0 3 852
Total 4,037 184 266 -192 -56 40 129 4,409
The deferred tax assets recognised at 31 December 2010 arose mainly from: a) Tax assets These relate to accrued tax assets which have not been deducted by the Group companies. This item does not include all the tax assets accrued, but rather only those that, based on Company projections, are expected to be used before they expire. Section 4 of this Note provides further detail on these tax assets, which relate to the tax loss carryforwards (EUR 1,091 million), the most relevant of which relate to the BAA Group Airports business, (EUR 213 million) and to the Toll Roads Division (EUR 446 million) There are deferred tax liabilities (EUR 413 million) associated with these tax losses, and to reinvestment and dividend double taxation tax credits (EUR 36 million). b) Assets and liabilities arising from timing differences between the accounting and tax income and expense recognition methods This item relates to the tax impact resulting from the fact that the timing of recognition of certain expenses or depreciation and amortisation charges is different for accounting and tax purposes. The recognition of a tax asset in this connection means that certain expenses have been recognised for accounting purposes before their recognition for tax purposes and, therefore, the Company will recover these expenses for tax purposes in future years. Conversely, a liability represents an expense that is recognised for tax purposes before its recognition for accounting purposes. Worthy of mention is the accelerated depreciation of assets (EUR 649 million) at BAA. This liability reflects the difference between the accounting and tax depreciation of the assets used in BAA’s business and will reverse in future years once the assets have become fully depreciated for tax purposes.

Consolidated Financial Statements for 2010 and 2009 Ferrovial, S.A. and Subsidiaries
Ferrovial, S.A. Consolidated financial statements at 31 December 2010 78
c) Deferred taxes from the revaluation of derivative instruments, pension funds and translation differences (valuation adjustments)
This reflects the accumulated tax impact resulting from valuation adjustments recognised in reserves. This impact appears as an asset or liability since there is no tax payable or refundable until this amount in reserves is transferred to profit or loss. The asset balance relates to accumulated losses in reserves that will result in tax income when it is recognised in profit or loss. The liability balance relates to gains not yet recognised for tax purposes. d) Deferred taxes arising from business combinations The deferred taxes include most notably those arising on the acquisition of BAA, specifically: - A deferred tax asset due to the remeasurement of the BAA Group’s financial debt at fair value (EUR 93 million). - Revaluation of the BAA Group’s investment property at fair value at the date of acquisition by Ferrovial (EUR 146 million). This liability relates to the difference between the carrying amount of these assets and their tax base and will only become an expense if the assets are sold to third parties.
- Remeasurement of intangible assets (EUR 143 million) (rights to operate commercial space and right to operate non-regulated airports) and property, plant and equipment at fair value (EUR 479 million) during the business combination process following the acquisition of the BAA Group. This liability relates to the difference between the carrying amount of these assets and their tax base and will only become an expense if the assets are transferred to third parties.
e) Industrial Building Allowance (IBA) This relate to the difference between the carrying amount of the airport terminals, which are classified as industrial buildings for tax depreciation purposes, (1,392 million) and their tax base (EUR 1,392 million). f) Other The other deferred tax liabilities include most notably the tax provision for the shareholdings abroad, relating specifically to the BAA Group (EUR 370 million) and Cintra USA (EUR 127 million). 22.4 Tax assets At 31 December 2010, the Ferrovial Group companies had tax loss carryforwards totalling EUR 4,408 million, giving a tax asset of EUR 1,386 million calculated at the tax rate applicable in each country. The detail of the tax loss carryforwards and of the related tax credits calculated at the tax rate applicable in each country at 31 December 2010 is as follows:
Million Euro 2010
Country Tax losses
Last year for offset
Maximum tax asset
Tax asset recognised
Spain 2,366 2016-2027 706 706
United States 1,153 2025-2029 457 167
UK 856 No lapsing date 216 216
Ireland 11 No lapsing date 1 1
Portugal 11 2008-2015 3 0
Poland 4 2008-2014 1 1
Chile, construction 6 No lapsing date 1 1
Total 4,408 1,386 1,091
Additionally, Ferrovial had unused reinvestment and other tax credits of EUR 198 million (EUR 206 million in 2009) at 31 December 2010, of which EUR 36 million had been recognised at 31 December 2010.

Consolidated Financial Statements for 2010 and 2009 Ferrovial, S.A. and Subsidiaries
Ferrovial, S.A. Consolidated financial statements at 31 December 2010 79
22.5 Years open to tax audit
The last four years are open for review by the tax authorities for all the taxes applicable to the Group. Contingent tax liabilities
may arise from the criteria that tax authorities may adopt in relation to the years open for review which cannot be objectively
quantified. However, the Parent’s directors consider that such liabilities as might arise from a possible assessment by the tax
authorities would not be significant. 23. Contingent liabilities, contingent assets and obligations a) Contingent liabilities The Group has contingent liabilities for of litigation arising in the ordinary course of business from which no significant liabilities are expected to arise other than those for which provisions have already been recognised. In this connection, the most significant litigation relating to contingent liabilities is as follows: Litigation and risk in relation to Spanish toll roads
In relation to the toll road business, the contingent liabilities relate to the cost of compulsory purchases, mainly in connection with the valuation of the land subject to compulsory purchase required to build toll roads, since several claims have been filed in this regards. Therefore, a provision of EUR 418 million has been recognised (see Note 18), relating mainly to the R4) toll road. However, this risk has been reduced by Additional Provision Forty-One of State Budget Law 26/2009, which provides that toll road concession operators may obtain a participating loan for compulsory purchase cost overruns provided certain requirements are met, which is the case of the R4 toll road concession operator. Also, Additional Provision Eighth of Law 43/2010 has introduced a measure aimed at partly mitigating the imbalance at several toll road concession operators affected by significant reductions in their traffic levels, which include the R4 and Ocaña La Roda toll road concession operators, consisting of the possibility of receiving from the concession grantor compensation equal to the difference between the toll revenue that would have been earned had 80% of the traffic projected in the tender specifications been reached and the toll revenue arising from actual traffic. This compensation will only be available for a period of three years and is subject to certain budget restrictions and maximum volume limits. As regards the M-203 toll road, operated by Sociedad Concesionaria de la Comunidad de Madrid, construction of which has been put on hold for several years, and which is also exposed to the risk of compulsory purchase cost overruns, the Madrid Department of Transportation and Infrastructure, through a Resolution of the Directorate-General of Roads of 9 July 2010, initiated proceedings to modify the concession arrangement and restore its economic and financial equilibrium. To this end, the concession operator submitted a rebalancing application to the Department containing the technical design for the modification of the route required by the grantor. The technical approval of the amended project was secured on 16 December 2010, although the modification case file that will specify the financial and economic rebalancing measures has not yet been finally approved. Also, Other Cintra Group companies are the defendants in a number of lawsuits. The effect this litigation has on the accompanying financial statements should not be material. Claims of Promociones Habitat, S.A. in connection with the agreement for the purchase of Ferrovial Inmobiliaria, S.A.
Certain claims have been filed by Promociones Habitat, S.A. in relation to the guarantees provided under the agreement for the
purchase of Ferrovial Inmobiliaria, S.A., pending resolution or payment, a provision for which has been duly recognised in the
financial statements. BAA, noise and competition The Government requested a bid on measures to reduce noise generated by airport activities. BAA undertook to review those measures in the future. The Government and local entities have not determined to date the needs regarding the reductions of noise in local areas for night-time flights and, therefore, BAA’s obligation in this regards is uncertain. Additionally, in 2010 the UK Government made a change regarding the development of new runways at Stansted (SG2) and Heathrow (RW3) airports, putting their development on hold. Also, no decision has yet been handled down on the appeal filed by BAA in relation to the UK Competition Commission report obliging BAA to sell certain airports on the grounds that the Group holds a monopoly in the sector. These airports include Stansted and one airport in Scotland. BAA filed an appeal on which the Competition Commission had not handed down any decision at the date of these consolidated financial statements. However, as indicated in Note 37 on “Events after the Reporting Period”, the appeal has subsequently been rejected.

Consolidated Financial Statements for 2010 and 2009 Ferrovial, S.A. and Subsidiaries
Ferrovial, S.A. Consolidated financial statements at 31 December 2010 80
Other litigation In addition to the above-mentioned litigation, the various Group companies are involved in a number of lawsuits in the ordinary course of business, as listed below: - Claims relating to defects in construction projects performed or services rendered. - Claims for third-party liability in connection with the use of the Group’s assets or the actions of Group employees, the most relevant of which relate to road accidents on the toll roads managed by the Group. - Employment-related claims. - Environmental claims. - Tax claims. Certain of the above-mentioned risks are covered by insurance policies (third-party liability, construction defects, etc.). b) Bank guarantees
At 31 December 2010, the Group companies had provided guarantees totalling EUR 4,334 million (EUR 4,503 million in 2009).
The following table contains a breakdown of guarantees by business area. The most significant item relates to the Construction
Division (EUR 3,174 million), consisting basically of guarantees covering the liability of construction companies for the performance
and completion of construction work required during the bidding processes:
Million Euro 2010 2009
Construction 3,174 3,452
Toll roads and car parks 436 210
Services 625 503
Airports 7 247
Other 91 91
Total 4,334 4,503
Financing guarantees The guarantees that Ferrovial provided in relation to the financing of certain projects in which it has ownership interests are listed below:
- Talca-Chillán.- Guarantees limited to the increase in operating, financial and maintenance costs in the event of
variances with respect to the estimated costs, for the equity interest retained in this company after the sale of 60% of its
shares. These increases may be offset with the savings resulting in the past in this same connection. - Norte Litoral.- Guarantee limited to the compulsory purchase cost overruns during the compulsory purchase period.
- R4 Madrid Sur.- There are two types of guarantee. A guarantee to cover payment of the debt service and another
guarantee (EUR 13 million) in the event the concession is terminated or any ratio is not achieved prior to its expiry. - Azores.- Guarantee limited to 10 EUR million until 2017 as required by Article 35 of the Portuguese Companies Law. - SH130.- Guarantee limited to USD 23 million for the compulsory purchase cost overruns during the compulsory purchase
period and a guarantee limited to USD 20 million for debt service during the first five years of operations. - Triconitex S.A.- Guarantee of EUR 4 million at 2010 year-end for the payment of the principal of this company’s finance
lease.
- Ecoparc del Mediterrani S.A.- Guarantee from the shareholders in proportion to their shareholdings, limited to the
amount of this company’s credit facility (EUR 6 million at 2010 year-end).
- Inagra.- Guarantee from the shareholders in proportion to their shareholdings, limited to the amount of this company’s
credit facility (EUR 3 million at 2010 year-end).
- UTE Reciclados Daimiel.- Guarantee of EUR 0.15 million at 2010 year-end for the payment of the principal of this
company’s finance lease. - La Selva, Nora.- Guarantee from the shareholders in proportion to their shareholdings, limited to several of this
company’s loans (EUR 3 million at 2010 year-end). Note: The amounts relating to the guarantees correspond to Ferrovial Group’s percentage interest in the various projects. Additionally, in some projects and construction work, there are technical guarantees applicable up to the start-up of operations of the project or construction work, which are the standard guarantees demanded from shareholders in the framework of the financing transactions.

Consolidated Financial Statements for 2010 and 2009 Ferrovial, S.A. and Subsidiaries
Ferrovial, S.A. Consolidated financial statements at 31 December 2010 81
In the ordinary course of the Group’s activities certain other technical guarantees have been provided, as is standard practice in this market. In the Airports Division, following the approval of the refinancing process, BAA has guaranteed the fulfilment of its obligations with all its assets. In the case of the Services Division, Amey has arranged guarantees and letters of credit totalling EUR 13 million for the investment and subordinated debt relating to its infrastructure projects. Contingent assets The Group had not received any significant guarantees from third parties at 31 December 2010 and 2009.
Investment obligations As described in Note 1, the infrastructure projects carried out by the Group are performed through long-term contracts where the concession operator is a company in which the Group has interests, either alone or together with other partners, and it is the project itself to which the borrowings necessary for financing it is allocated, without recourse to the shareholder, under the terms set forth in Note 19. From the management viewpoint, Ferrovial takes into accounting only the investments obligations in the capital of the projects, since the investment in the assets is financed by the borrowings of the projects themselves. The investment obligations undertaken by the Group in relation to the capital of its projects are as follows:
Million Euro Total
Investments in infrastructure projects 483 Investments in infrastructure projects of companies accounted for using the equity method 116
Total 599
Obligations under operating and finance leases The expense recognised in relation to operating leases in the income statement for 2010 totals EUR 215 million. The future total minimum lease payments for non-cancellable operating leases are shown below: 2010
CORPORATE CONSTRUCTION TOLL ROADS SERVICES AIRPORTS TOTAL Less than one year 1 0 70 72
Between one and five years 1 1 287 289
More than five years 0 1,018 1,018
PROJECTS 0 0 3 1 1,375 1,379
Less than one year 2 26 3 33 64
Between one and five years 10 15 4 65 94
More than five years 40 3 18 61
OTHER COMPANIES 52 44 7 116 0 219
LESSEE 52 44 9 117 1,375 1,598
Less than one year 101 101
Between one and five years 336 336
More than five years 2,131 2,131
LESSOR 0 0 0 0 2,568 2,568
The operating leases include most notably those corresponding to “Airports” and “Corporate”, relating mainly to the lease of buildings and technical equipment in the airports managed by BAA, as well as the lease of various buildings, including most notably the corporate headquarters.

Consolidated Financial Statements for 2010 and 2009 Ferrovial, S.A. and Subsidiaries
Ferrovial, S.A. Consolidated financial statements at 31 December 2010 82
Environmental obligations Any operation designed mainly to prevent, reduce or repair damage to the environment is treated as an environmental activity. Investments in environmental activities are measured at acquisition cost and are capitalised to the cost of non-current assets in the year in which they are made, applying the methods described in Note 2 on “Accounting Policies”. Costs incurred to protect and improve the environment are taken to the income statement when incurred, irrespective of when the related monetary or financial flow takes place. Provisions for probable or certain environmental liability, litigation in progress and indemnities or other outstanding obligations of undetermined amount not covered by insurance policies are recorded when the liability or obligation giving rise to the indemnity or payment arises.
24. Fair value adjustments The “Fair Value Adjustments” column shows the impact on the income statement of remeasuring certain assets and liabilities at their fair value without affecting cash. Specifically, in 2010 there were three items with a significant impact: The remeasurement at fair value of the interest retained in the companies over which control was lost during the year (see Notes 2 and 25), the impairment losses recognised on certain assets (see Note 5), and the impact of the revaluation of derivatives that are not considered effective the changes of the value of which are recognised in the income statement (see Note 11). 25. Impairment and disposals of non-current assets and other non-recurring effects In addition to the revaluations and impairment losses included in the fair value adjustments, this line item includes the gains and losses on disposals recognised prior to the fair value adjustments. Gains and losses recognised in 2010 The breakdown of the main gains and losses recognised in 2010 in relation to sales and impairment of significant assets and of their impact on the net profit or loss recognised is as follows: Impact on profit or loss before tax
2010
Before fair value
adjustments
Fair value adjustments
Total 2010 Impact on net profit
or loss
Gains from disposals:
APP 18 0 18 12
US Retail 7 0 7 1
Naples Airport 11 0 11 5
Other disposals 21 0 21 12
Impairments losses (Note 24) 0 -734 -734 -366
Total BAA 56 -734 -678 -336
Gains from disposals (Note 24): 10% ETR 407 474 2,015 2.489 2,471
Chilean toll roads 206 148 354 274
Impairment losses (Note 24) 0 -277 -277 -193
Total Cintra 680 1,886 2,567 2,552
Gains relating to Tubelines 2 0 2 2
Other gains on disposals 2 0 2 2
Other impairment losses 0 -13 -13 -10
Impairment and gains and losses on disposals of non-current assets
740 1,139 1,879 2,210
Gains On 5 October 2010, Cintra Infraestructuras reached an agreement to sell 10% of its interest in the share capital of the 407 ETR toll road concession operator in Toronto, Canada for CAD 894 million (EUR 634 million). The transaction gave rise to a pre-tax gain of 2,489 million (EUR 2,471 million effect on net profit), which is distributed between the gain itself on the sale of the 10% interest (EUR 474 million effect on profit before tax and EUR 467 million effect on net profit), and the remeasurement at fair value of the interest retained, representing 43.23% of the share capital of that company (EUR 2,015 million effect on profit before tax and EUR 2,005 million effect on net profit), and the latter amount was recognised as a fair value adjustment in the Group’s consolidated income statement.

Consolidated Financial Statements for 2010 and 2009 Ferrovial, S.A. and Subsidiaries
Ferrovial, S.A. Consolidated financial statements at 31 December 2010 83
Additionally, on 15 September 2010 Cintra Infraestructuras completed the sale of 60% of its equity interest in Cintra Chile, a company that operates five stretches of Chilean toll roads, CLF 7 million (approximately EUR 220 million). Furthermore, the buyer and seller set forth cross call and put options of 40% on the remaining 40% of the shares. The transaction gave rise to a pre-tax gain of EUR 354 million (EUR 274 million effect on net profit), of which EUR 206 million relate to the gain on the 60% ownership interest sold (EUR 158 million net) and EUR 148 million (before tax) relate to the remeasurement at fair value of the interest retained and the latter amount was recognised as a fair value adjustment in the group’s consolidated income statement (EUR 116 million net). The impact of the capital gains on the net profit totalled EUR 2,779 million. Impairment The BAA Group reviews the fair value of its assets at least once a year and in 2010 recognised an impairment loss EUR 734 million before tax (EUR 369 million effect on net profit), as described in Notes 5, 7.2-a, 7.2-b and 7.2-c. Additionally, net impairment losses of EUR 3 million were reversed at companies accounted for using the equity method within the BAA Group. In the Toll Roads Division, an impairment loss of EUR 277 million (with an impact on net profit of EUR 200 million) was recognised in relation to the portfolio of Spanish toll roads and other European toll roads, due to the negative evolution of traffic during 2010 and to the update of the long-term assumptions made for these toll roads, as described in Notes 7.1 and 9. Additionally, net impairment losses of EUR 7 million were reversed at companies accounted for using the equity method in the Toll Roads Division. Lastly, impairments losses were recognised in the other divisions with a net impact of EUR 10 million, signifying that the total impact of net impairment losses on the net profit for the year amounted to EUR 569 million. Other non-recurring effects Additionally, there are other non-recurring effects with no effect on cash that are not included in this line item: - Taxes, with a negative effect on the profit of EUR 89 million, relating to adjustments to income tax amounting to EUR
71 million, as detailed in Note 22, and provisions for other taxes with an effect of EUR 26 million on the pre-tax profit (EUR 18 million effect on the net profit).
- Derivatives and other fair value adjustments, with a negative impact on the net profit of EUR 46 million, of which:
o EUR -41 million (effect on net profit and EUR -79 effect on profit before tax), relate to the adjustment to fair value of derivatives and other financial instruments at fully consolidated companies, as described in Note 28. The principal item in this connection relates to the measurement at fair value of derivatives and amounts to EUR of -42 million (effect on net profit and EUR -84 million effect on pre-tax profit), as described in Note 11.
o EUR -5 million (effect on net profit) relate to the remeasurement at fair value of financial instruments held by
companies accounted for using the equity method. Gains and losses recognised in 2009
Impact on profit or loss before tax
2009
Before fair value
adjustments
Fair value adjustments
Total 2009 Impact on net profit or loss
Loss on disposal of Gatwick airport -730 0 -730 -408
Impairment loss recognised for Stansted airport 0 -53 -53 -21
Total BAA -730 -53 -783 -429
Gain relating to Cintra Aparcamientos 95 0 95 50
Impairment loss recognition for Valdebebas land 0 -37 -37 -26
Gain on sale of Amey contracts 5 0 5 5
Other 10 0 10 9
Impairment and gains and losses on disposals of non-current assets
-620 -90 -710 -392
The main impact on “Impairment and Disposal of Non-Current Assets” in 2009 related to the impairment loss recognised for Gatwick airport and the loss recognised on its subsequent sale, completed on 3 December, which resulted in a total pre-tax loss of EUR 730 million (EUR 408 million effect on the net profit or loss attributable to the Parent). Additionally, on 27 July the sale of Cintra Aparcamientos was completed, which gave rise to a gain of EUR 95 million (EUR 50 million effect on the net profit or loss attributable to Ferrovial).

Consolidated Financial Statements for 2010 and 2009 Ferrovial, S.A. and Subsidiaries
Ferrovial, S.A. Consolidated financial statements at 31 December 2010 84
26. Operating revenue The detail of the Group’s operating income is as follows: Million Euro
2010 2009
Revenue 12,169 12,095
Sales 11,895 11,942 Other income 275 154
Other operating income 17 30
Total operating income 12,186 12,126
27. Staff costs The detail of the staff costs is as follows:
Million Euro 2010 2009
Wages and salaries 2,928 2,881 Social security costs 434 436 Pension plan contributions 18 60 Share-based payments 15 14 Other employee benefit costs 27 32
Total 3,422 3,423
The average number of employees at 31 December 2010, by professional category and gender, was as follows:
2010 2009
Men Women Total Men Women Total Change
Board directors 11 1 12 11 1 12 0.00%
Senior managers 11 0 11 14 0 14 -21.43%
Managers 1,335 342 1,677 1,305 313 1,618 3.68%
University graduates 7,033 2,498 9,531 6,820 2,501 9,321 2.25%
Administrative staff 2,853 3,596 6,449 3,282 4,099 7,381 -12.63%
Workers and technicians 57,243 26,493 83,736 55,836 25,877 81,713 2.48%
Total 68,486 32,930 101,416 67,268 32,791 100,059 1.36%
The average number of employees by business division is shown below:
2010 2009 Men Women Total Men Women Total
Construction 11,108 1,544 12,652 12,292 1,578 13,870
Corporate 204 145 349 208 144 353
Real estate 36 75 111 39 79 119
Services 49,164 26,201 75,365 49,358 27,030 76,388
Concessions 1,275 974 2,249 2,488 1,967 4,456
Airports 6,251 4,019 10,269 7,851 5,081 12,932
Total 68,038 32,957 100,995 72,237 35,880 108,117

Consolidated Financial Statements for 2010 and 2009 Ferrovial, S.A. and Subsidiaries
Ferrovial, S.A. Consolidated financial statements at 31 December 2010 85
28. Financial results The changes in finance expenses and finance income are as follows:
Million Euro 2010 2009 Change %
Borrowing costs -1,436 -1,445 -1%
Interest income on financial assets 19 26 -26%
Net borrowing costs -1,417 -1,420 0%
Finance expenses relating to derivative financial instruments and other fair value adjustments
-48 -148 -68%
Other -107 18 -697%
Total financial result of infrastructure projects -1,572 -1,550 1%
Borrowing costs -165 -121 36%
Interest income on financial assets 29 22 32%
Net borrowing costs -136 -99 37%
Finance expenses relating to derivative financial instruments and other fair value adjustments
-31 98 -131%
Other 14 -4 -422%
Total financial result of other companies -153 -5 2775%
Financial result -1,725 -1,555 11%
As indicated in Note 11, the loss in 2010 was significantly affected by the effect, in accordance with the applicable accounting legislation, of the remeasurement at fair value of certain hedging transactions not qualifying for hedge accounting, the results of which are therefore recognised in the income statement. The gains or losses presented in the table above relating to changes in the fair value mainly of derivative financial instruments relate to ineffective derivatives; the effective portion is recognised in profit or loss together with the gain or loss on the hedged item of the same nature, as explained in Note 11 on derivative financial instruments at fair value. The remeasurement of derivatives at fair value had a negative impact of EUR 79 million on finance expenses before taxes (negative effect of EUR 41 million on net profit). The breakdown, by project, of the financial result of infrastructure projects is shown below. The table indicates the portion of the borrowing costs that is capitalised to Investments in Infrastructure Projects under construction:
Million Euro
2010 2009
Financial result of infrastructure projects
Borrowing costs
capitalised during
construction period
Borrowing costs
recognised in profit or loss
Accrued finance expenses and income
Borrowing costs
capitalised during
construction period
Borrowing costs
recognised in profit or loss
Accrued finance expenses and income
BAA -27 -984 -1,011 -25 -894 -919
Other airports 0 0 0 0 0 0
407 ETR International 0 -171 -171 0 -218 -218
Skyway Concession 0 -78 -78 0 -70 -70
Spanish toll roads 0 -141 -141 0 -87 -87
Chilean toll roads 0 0 0 -3 -113 -116
Other toll roads -62 -37 -99 -39 -26 -65
Services -1 -2 -3 -3 -6 -9
Construction 0 -5 -5 0 -5 -5
Total -90 -1,417 -1,507 -70 -1,420 -1,489

Consolidated Financial Statements for 2010 and 2009 Ferrovial, S.A. and Subsidiaries
Ferrovial, S.A. Consolidated financial statements at 31 December 2010 86
29. Net profit or loss from discontinued operations In 2010 the Group did not recognise any profit or loss or cash flows from discontinued operations. 30. Earnings per share
A. Basic earnings per share
Basic earnings per share are calculated by dividing the net profit or loss attributable to the Group by the weighted average number of ordinary shares outstanding during the year, excluding the average number of treasury shares held in the year. The calculation of basic earnings per share attributable to the Parent is as follows: Basic earnings per share attributable to the Parent:
2010 2009
Net profit or loss attributed to the Parent (*) 2,163 -72
Weighted average number of shares outstanding (thousands of shares) 589,802 589,802
Less average number of treasury shares (thousands of shares) 0 0
Average number of shares to calculate basic earnings per share 589,802 589,802
Basic earnings per share (euros) 3.67 -0.12
(*) Restated in 2009 under the new accounting rules.
B. Diluted earnings per share
Diluted earnings per share are calculated by adjusting the weighted average number of ordinary shares outstanding in order to reflect the conversion of all dilutive potentially ordinary shares. For these purposes, it is considered that the shares are converted at the beginning of the year or at the date of issue of the potential ordinary shares, if the latter were issued during the current period. At 31 December 2010 and 2009, the Group did not have any dilutive potential ordinary shares, since no convertible shares were issued and the share-based or stock option remuneration plans discussed in Notes 32 and 33, respectively, will not give rise to any capital increases at the Group, as explained therein. Consequently, no dilutive impact is envisaged when employee rights under the plans are exercised. 31. Cash flow The cash flow statement was prepared in accordance with IAS 7. This note provides additional disclosures thereon. This breakdown is based on internal criteria established by the Company for business purposes, which in certain cases differ from the provisions of IAS 7. The main criteria applied are as follows: - In order to provide a clearer explanation of cash generated, the Group separates cash flows into “cash flows excluding infrastructure projects” −where infrastructure project companies are treated as financial assets and the investments in the capital of these companies are therefore included in cash flows from investing activities, and yields on the investments (dividends and cash reimbursements) are included in cash flows from operating activities−, and “cash flows of infrastructure projects”, consisting of cash flows from operating and financing activities of infrastructure projects (Note 1 contains a detailed definition of infrastructure projects).
- The treatment given to interest received on cash and cash equivalents differs from that of the cash flow statement under IAS 7, since this interest is included in cash flows from financing activities with a reduction in the amount recognised under “Net Interest Paid”.
- Lastly, these flows endeavour to present the changes in the net cash position as defined in Note 20, as the net amount of borrowings, cash and cash equivalents and restricted cash. This method also departs from IAS 7, which explains the changes in cash and cash equivalents.

Consolidated Financial Statements for 2010 and 2009 Ferrovial, S.A. and Subsidiaries
Ferrovial, S.A. Consolidated financial statements at 31 December 2010 87
2010
2010 (Million Euro)
Cash flow excluding
infrastructure projects
Cash flow of infrastructure projects Eliminations
CONSOLIDATED CASH FLOW
EBITDA 573 1,941 0 2,514 Dividends received 178 0 -134 44 Income tax paid -60 -22 0 -81 Changes in receivables, payables and other 120 -92 0 28
Cash flows from operating activities 811 1,828 -134 2,505 Investment -420 -1,972 224 -2,168 Divestment 1,124 148 0 1,272 Cash flows from investing activities 704 -1,824 224 -895 Cash flows before financing activities 1,515 4 90 1,609 Net interest paid -138 -1,161 0 -1,299 Proceeds from capital and non-controlling interests 0 355 -221 134 Payment of dividends to shareholders of the Parent -315 0 -315 Payment of dividends to non-controlling interests of investees -5 -211 134 -82 Change in exchange rate -6 -670 0 -676 Exclusion - net debt of held-for-sale assets/companies accounted for using the equity method 180 3,125 0 3,305 Other changes in borrowings (no cash flow) -27 -168 2 -193 Change in net cash position 1,203 1,275 5 2,483 Opening position -1,172 -21,110 11 -22,271 Closing position 31 -19,836 16 -19,789
2009
2009 (Million Euro)
Cash flow excluding
infrastructure projects
Cash flow of infrastructure projects Eliminations
CONSOLIDATED CASH FLOW
EBITDA 561 2,030 0 2,591 Dividends received 129 0 -119 10 Income tax paid -38 -11 0 -49 Changes in receivables, payables and other 188 -208 0 -20 Cash flows from operating activities 841 1,811 -119 2,534 Investment -496 -1,626 285 -1,837 Divestment 483 1,561 -11 2,034 Cash flows from investing activities -12 -65 274 197 Cash flows before financing activities 829 1,746 155 2,730 Net interest paid -128 -1,215 0 -1,343 Proceeds from capital and non-controlling interests 1 448 -271 178 Payment of dividends to shareholders of the Parent -284 0 -284 Payment of dividends to non-controlling interests of investees -20 -204 119 -105 Change in exchange rate -5 -1,131 0 -1,136 Exclusion - net debt of held-for-sale assets/companies accounted for using the equity method 0 -993 0 -993 Other changes in borrowings (no cash flow) -19 -128 0 -147 Change in net cash position 374 -1,476 3 -1,099 Opening position -1,547 -19,634 8 -21,172 Closing position -1,172 -21,110 11 -22,271
The directors’ report includes detailed disclosures on the changes in cash flow for 2010.
32. Remuneration of the Board of Directors 32.1.- Directors’ remuneration The Board of Directors of Ferrovial S.A. intends to prepare and make available to shareholders a “Report on Remuneration” for 2010 addressing the following aspects:

Consolidated Financial Statements for 2010 and 2009 Ferrovial, S.A. and Subsidiaries
Ferrovial, S.A. Consolidated financial statements at 31 December 2010 88
- Approval of the remuneration policy. - Criteria applied in the existing policy. - Bylaw provisions and regulations governing remuneration of the Board of Directors. - Process for determining remuneration. - 2010 remuneration system. - New developments in the remuneration policy. - Policy envisaged for 2011 and subsequent years. - Other matters of interest.
32.2.- Remuneration system for the Board of Directors for 2010 −−−− Total and overall remuneration Under the Company’s current remuneration scheme, regulated by Article 57 of its bylaws, the shareholders at the Annual General Meeting determine the total, fixed annual remuneration for all the members of the Board of Directors. At the Annual General Meeting held on 22 October 20091 the shareholders set the fixed annual remuneration for the whole Board of Directors at EUR 1,772,727, in consideration of the number of members at the time of approval (thirteen). As per the resolutions of that same Annual General Meeting, if the number of Board members were to increase or decrease, the fixed and overall annual amount is to be adjusted accordingly based on the period of Board membership of the incoming or outgoing members. The shareholders at the Annual General Meeting also decided that, for financial years after 2009 this amount would be automatically reviewed in accordance with the changes in the Consumer Price Index. In application of these resolutions (2), the fixed annual amount for 2010 totalled EUR 1,649,455 for the twelve Board members, to be distributed in proportion to the time served on the Board. As a result of the incoming and outgoing Board members throughout the year, the actual overall annual remuneration earned by the Board of Directors was finally EUR 1,721,006.92. 32.3.- Board of Directors’ remuneration items Pursuant to Article 57 of the bylaws, each year the Board of Directors must distribute among its members the overall annual amount set by the Annual General Meeting, comprising the following items:
(i) A fixed emolument, set at a gross annual amount of EUR 420,000 for the twelve members of the Board of Directors at 2010 year-end. This total did not change with respect to 2009.
This amount was adjusted based on Directors joining or leaving the Board during the year, and was allocated on the basis of their period of office, such that the amount actually earned for this item during 2010 was a gross annual sum of EUR 438,171.23 for all the members of the Board.
(ii) Fees for actual attendance at meetings of the Board of Directors and its committees or advisory bodies. Attendance fees for 2010 totalled EUR 646,500. (iii) And the lower of the following amounts: (a) the amount remaining, after deducting the preceding two items, to reach the overall total amount determined by the shareholders at the Annual General Meeting; and (b) a sum equal to 0.5% of the consolidated profit for the year attributable to the Company.
For 2010, since the figure of 0.5% of consolidated profit for the year attributable to the Company was higher, the remainder described in letter (a), i.e., the gross sum of EUR 636,335.69 is to be distributed, at all times in proportion to the time served on the Board. The resulting amount is distributed by dividing it into 15, applying the following factors in the allocation of individual amounts to the ratio: Chairman of the Board: *2; First Deputy-Chairman *1.75; Second Deputy-Chairman *1.25 and the other Board members *1. Pursuant to the resolutions of the Board of Directors, the amount earned under this third item must be invested in Company shares. The acquisition of shares, in a single transaction, shall take place at the first trading session following the deadline set by the Spanish National Securities Market Commission (CNMV) to send the periodic financial information once the Annual General Meeting approving these financial statements for the year has been held. The shares acquired can only be divested by the interested party once three full years have elapsed after the year of acquisition.
1 Under the name of Cintra Concesiones de Infraestructuras de Transporte, S.A. 2 The year-on-year increase in the CPI of December 2009 was 0.8%, the percentage that was applied to the automatic review of the remuneration of the Board of Directors.

Consolidated Financial Statements for 2010 and 2009 Ferrovial, S.A. and Subsidiaries
Ferrovial, S.A. Consolidated financial statements at 31 December 2010 89
32.4.- Individual bylaw-stipulated emoluments of the members of the Board of Directors The table below shows the itemised bylaw-stipulated emoluments of the members of the Board of Directors earned in 2010.
(Amounts in euro)
2010 2009
DIRECTOR (a) Fixed
remuneration Attendance fees (b)
Remainder Total Fixed
remuneration Attendance fees (b)
Total
Rafael del Pino y Calvo-Sotelo 35,000.00 106,000 87,646.24 228,646.24 35,000 114,000 149,000
Santiago Bergareche Busquet 35,000.00 57,000 76,690.46 168,690.46 35,000 71,500 106,500
Joaquín Ayuso García 35,000.00 53,000 54,778.90 142,778.90 35,000 55,000 90,000
Iñigo Meirás Amusco 35,000.00 53,000 43,823.12 131,823.12 6,904 14,000 20,904
Jaime Carvajal Urquijo 35,000.00 65,000 43,823.12 143,823.12 35,000 83,000 118,000
Portman Baela, S.L. 35,000.00 35,000 43,823.12 113,823.12 35,000 49,000 84,000
Juan Arena de la Mora 35,000.00 44,000 43,823.12 122,823.12 35,000 42,000 77,000 Santiago Eguidazu Mayor (until 30/09/10)
26,250.00 31,000 32,777.29 90,027.29 35,000 52,000 87,000
Gabriele Burgio 35,000.00 39,500 43,823.12 118,323.12 35,000 58,500 93,500
María del Pino y Calvo-Sotelo 35,000.00 51,000 43,823.12 129,823.12 35,000 57,000 92,000
Santiago Fernández Valbuena 35,000.00 51,000 43,823.12 129,823.12 35,000 63,000 98,000
José Fernando Sánchez-Junco Mans 35,000.00 37,000 43,823.12 115,823.12 2,685 3,000 5,685
Karlovy S.L. (since 25/03/2010) 26,921.23 24,000 33,857.86 84,779.09 (-) (-) (-)
José María Pérez Tremps (c) (-) (-) (-) (-) 33,658 57,000 90,658
TOTAL 438,171.23 646,500 636,335.69 1,721,006.92 393,247 719,000 1,112,247
(a) Period in office. Full year, unless otherwise stated. (b) The amounts per meeting are the same in 2009 and 2010: Board of Directors: EUR 3,000/meeting; Executive Committee:
EUR 2,000/meeting; Audit and Control Committee: EUR 2,000/meeting; Nomination and Remuneration Committee: EUR 1,500/meeting. The amount of the attendance fees earned by the chairpersons of all these bodies are twice the sums indicated.
(c) Director until 17/12/09. 32.5.- Remuneration of executive directors The executive directors, of whom there were three in 2010, earned the following remuneration, irrespective of attendance fees and bylaw-stipulated emoluments payable to them as directors: (thousands of euros)
2010 2009
Fixed remuneration 2,900 2,540.5
Variable remuneration 3,875 2,708.2
Exercise of share options and/or other financial instruments [see description]
(-) (-)
32.6.- Remuneration of the members of the Board of Directors membership of other managing bodies of Group companies, jointly controlled entities or associates The executive and non-executive directors of Ferrovial S.A., who are in turn members of the managing bodies of other Group companies, jointly controlled entities or associates, earned EUR 51.5 thousand in this respect in 2010 (EUR 2.6 thousand in 2009). 32.7.- Pension funds and plans or life insurance premiums As in 2009, no contributions were made in 2010 to pension plans or funds for former or current members of the Company’s Board of Directors. No such obligations were incurred during the year. As regards life insurance premiums, the Company has insurance policies covering death, for which premiums totalled EUR 14.8 thousand in 2010 (EUR 12.7 thousand in 2009), of which the executive members are beneficiaries. No contributions were made and no obligations incurred in respect of pension funds or plans for the directors of Ferrovial S.A. that are members of other boards of directors and/or the senior management of Group companies, jointly controlled entities or associates. No life insurance premiums were paid in this regard. The situation has not changed since 2009.

Consolidated Financial Statements for 2010 and 2009 Ferrovial, S.A. and Subsidiaries
Ferrovial, S.A. Consolidated financial statements at 31 December 2010 90
32.8.- Advances and loans At 31 December 2010, no advances or loans had been granted to the directors by the Parent or due to their membership of other boards of directors and/or senior management of Group companies, jointly controlled entities or associates.
(A) Remuneration of senior executives The joint remuneration earned by the Company’s senior executives in 2010 was as follows: (thousands of euros) 2010 2009
Fixed remuneration 3,917.8 4,206.0
Variable remuneration 4,087.6 3,943.2
Exercise of share options and/or other financial instruments [see description]
(-) (-)
Remuneration as members of managing bodies of other Group companies, jointly controlled entities or associates
1 33.5
Contributions to pension funds or plans, or similar obligations
(-) (-)
Insurance premiums 20.9 18.4
No loans were granted to the senior executives and at 31 December 2010 the loan granted to the senior executives at the beginning of the year, which had been granted to them prior to their capacity as senior executives, had been repaid in full. In 2009 these loans amounted to EUR 143 thousand. The aforementioned remuneration corresponds to the following posts: Economic and Financial General Manager General Manager - Human Resources General Manager - Construction General Manager - Real Estate General Manager - Services General Manager - Airports General Manager - Toll Roads General Manager - Information Systems Internal Audit Manager Manager of Quality and Environment (until 29 April 2010) Manager of Communication and Corporate Responsibility Manager of Market Studies and Analysis (until 2 March 2010) General Secretary This does not include remuneration for senior managers who were also executive directors which was addressed previously.
(B) Share option plans (2004, 2006 and 2008) Ferrovial S.A.’s assumption of the share option plans of Grupo Ferrovial S.A. By virtue of the merger of Grupo Ferrovial and Cintra Concesiones de Infraestructuras de Transporte S.A. in 2009, and according to the terms and conditions of the merger plan, the post-merger company, Ferrovial S.A., succeeded to the extinct Grupo Ferrovial S.A.’s obligations under the share option plans. The option rights were automatically converted to option rights on the shares of Ferrovial S.A., in accordance with the share exchange ratio stated in the merger plan. In 2004 the shareholders at the Annual General Meeting authorised a remuneration system consisting of a share option plan for members of the Board of Directors discharging executive functions and senior managers reporting directly to the Board or to its delegated bodies. The system consists of share options being granted on Company shares, which can be exercised only after three years have elapsed since the grant date, provided certain profitability ratios are achieved (see the detailed information in the Note on “Share-Based Payment”). In 2006 and 2008, the shareholders at the Annual General Meeting approved two new share option plans with the same scope in terms of beneficiaries.

Consolidated Financial Statements for 2010 and 2009 Ferrovial, S.A. and Subsidiaries
Ferrovial, S.A. Consolidated financial statements at 31 December 2010 91
Amendments to share option plans In 2008 the Board of Directors resolved to amend the share option plans approved prior to that date by extending the exercise period from three to five years, as stipulated in subsequent plans (and 2008). As regards the share option plans in which the beneficiaries are executive directors, members of the Company’s Executive Committee or senior managers reporting directly to the Board or to its delegated bodies, the effectiveness of the amendment was subjected to approval by the shareholders at the Annual General Meeting.
(C) Target-based share plan On 17 December 2009, the Board of Directors approved a remuneration plan consisting of deliveries of shares of Ferrovial, S.A. The total number of shares that may be granted annually under this plan may not exceed 2,420,000 or 0.33% of Ferrovial, S.A.’s share capital. The plan consists of the allocation to beneficiaries of a number of units that will serve as a basis in order to determine the final number of shares that they will be able to receive as a result of their participation in the plan. The plan duration is three years and units will be assigned on an annual basis in 2010, 2011 and 2012. The shares shall be delivered, as the case may be, in the year of the third anniversary of the allocation of the corresponding units. Delivery is conditional upon at least three years’ service at the Company (barring special circumstances), subject to the achievement during this period of ratios based partly on cash flows from operating activities and partly on EBITDA as a percentage of net productive assets. The plan is aimed at managers, members of the Board of Directors of Ferrovial, S.A. who discharge executive functions and senior managers reporting directly to the Board or its delegated bodies. The application of this programme to Senior Management was authorised by the Annual General Meeting held 29 June 2010.
(D) Other disclosures on remuneration Agreements between the company and senior executives, including two executive directors, specifically provide for the right to receive the indemnities referred to in Article 56 of the Workers’ Statute, in the event of unjustified dismissal. In addition, in order to encourage loyalty and long-service, a type of deferred remuneration item was recognised for eleven senior executives, including two executive directors. This item consists of an extraordinary remuneration that will only become effective when certain of the following circumstances occur: - Removal of the senior executive by mutual agreement or upon reaching a certain age. - Unjustified dismissal or abandonment of the Company on the latter’s initiative without justification for dismissal, prior to the
senior executive reaching the age initially agreed upon, if the aforementioned amount exceeded that resulting from applying the Workers Statute.
- The death or disability of the member of the senior executive. To cover this incentive each year, the Company contributes to a group savings insurance policy, of which the Company itself is both policy-holder and beneficiary, quantified according to a certain percentage of the total monetary remuneration of each senior executive. In 2010 the contributions made amounted to EUR 2,528.2 thousand (EUR 2,537.4 euro in 2009). To supplement this information, it should be noted that individuals are occasionally hired to hold positions at various levels of management, mainly abroad, for which certain clauses have been used that provide for termination. In 2009, an executive whose contract includes clauses of this type on a temporary basis became a senior executive. Lastly, it should be noted that the contracts of two senior executives stipulate additional rights in their favour, including prior notice obligations incumbent upon the Company in the event of unjustified dismissal.

Consolidated Financial Statements for 2010 and 2009 Ferrovial, S.A. and Subsidiaries
Ferrovial, S.A. Consolidated financial statements at 31 December 2010 92
33. Share option plans A) SHARE OPTION PLANS
The features of the Ferrovial share option plans at the date of preparation of these consolidated financial statements are as
follows:
All share option plans have a three-year vesting period as from the grant date followed by a three to five-year exercise period, provided certain minimum returns on consolidated equity are obtained by the Ferrovial Group. The exercise price is calculated as the arithmetic mean of the weighted average changes during the previous 20 stock market trading sessions, each option being equivalent to the exercise of one option at that price to which the share exchange ratio resulting from the merger has been applied. The detail of the changes in the Company’s share option plans for 2010 and 2009 is as follows:
Number of options
2010 2009
Number of options at beginning of year 45,262,583 48,940,272
Plans granted - -
Options not taken up and other -2,022,782 -3,447,801
Options exercised -195,700 -229,888
Number of options at end of year 43,044,101 45,262,583
No new plans were granted in 2010. Equity swaps were arranged by Ferrovial at the grant date in order to hedge against possible losses resulting from the exercise of share options. These swaps ensure that Ferrovial will collect an amount equal to the rise in the share price when the options are executed by employees. Under the equity swap contract, the financial institution undertakes to pay to Ferrovial cash amounts equal to the return on Ferrovial’s shares, in return for a payment by Ferrovial. The main features of equity swaps are as follows: • The number of shares used to calculate returns is equal to the number of options granted under each plan. • The share price used to calculate returns coincides with those exercise price employed to calculate the increase in the share’s value.
• Ferrovial will pay a return to the financial institution calculated by applying the EURIBOR rate plus a margin to the result of multiplying the number of shares by the exercise price.
Share option plan
(Participants /Grant Date)
Ferrovial managers / July 2003 7,200,000 6.058 Ferrovial senior executives / April 2004 6,332,000 8.413 Amey-Cespa managers / June 2004 520,000 8.51 Ferrovial managers / October 2005 6,425,440 15.885 Cintra managers / October 2005 374,560 15.885 Cintra managers / October 2005 940,625 8.98 Ferrovial senior executives / May 2006 3.592,000 16.48 Cintra senior executives / November 2006 67,720 10.54 BAA managers / February 2007 5,104,012 18.298-19.635 BAA managers / July 2007 4,511,072 18.090-18.450 Cintra senior executives / July 2007 94,178 10.900-11.900 BAA managers / November 2007 6.008.124 10.825-15.285 Ferrovial managers / November 2007 8,000.000 14.99 Cintra managers / November 2007 871,175 10.72 Ferrovial senior executives / April 2008 6,091,200 12.585 Cintra senior executives / April 2008 256,562 9.09 BAA managers / November 2008 1,540,660 6.018 Plans extensions Ferrovial managers 1,207,200 7.240-18.383
No. of options granted
Exercise price (euros)

Consolidated Financial Statements for 2010 and 2009 Ferrovial, S.A. and Subsidiaries
Ferrovial, S.A. Consolidated financial statements at 31 December 2010 93
• The financial institution will pay Ferrovial an amount equal to all the dividends generated by those shares. Ferrovial may opt to partially or totally terminate the contract, in which case:
a. If the share price is below the exercise price at which the contract was granted, Ferrovial must pay the difference to the financial institution.
b. If the share price is above the exercise price, Ferrovial will receive the difference between the two amounts. For accounting purposes, these contracts are treated as derivative financial instruments, this being the general treatment afforded to financial products of this type (see Note 11). In 2010 a loss was recognised in respect of these contracts, as explained in Note 9. Amounts received in the form of dividends generated by the shares and paid in the form of returns to the financial institution in question, under the equity swap contracts described above totalled EUR 23 million (EUR 16 million in 2009) and EUR 7 million (EUR 7 million in 2009), respectively. Ferrovial's staff costs in relation to these remuneration systems in 2010 totalled EUR 15 million (EUR 14 million in 2009). B) EMPLOYEE SHARE DELIVERY PLAN In 2010 the Board of Directors approved and was granted a remuneration programme consisting of the delivery of Ferrovial, S.A. shares amounting to 2,302,300 shares. This programme was directed at managers and senior executives. This plan has a duration of three years and grants will be made on an annual basis under this plan. The main requirements establish for delivery of shares to the employees under the plan include the following:
• Service at the Company during a vesting period of three years as from the date of execution barring certain exceptional causes.
• Achievement of ratios based on cash flows from operating activities and the ratio between EBITDA and net productive assets during the aforementioned vesting period.
• Every year a calculation is made of the levels that those ratios must reach during the grant period for beneficiaries to be entitled to delivery of all of the shares or a proportional amount thereof.
Staff expenses at Ferrovial relating to these remuneration systems totalled EUR 3 million in 2010. 34. Information on transactions with related parties Approval of transactions In accordance with the Board of Directors Regulations, all professional or commercial transactions involving Ferrovial, S.A. or its subsidiaries and the persons referred to below require the authorisation of the Board of Directors, subject to a report from the Audit and Control Committee. In the case of ordinary transactions involving Ferrovial, the general approval of the Board of Directors will suffice. This authorisation is not necessary, however, for transactions that simultaneously fulfil the following three conditions: 1. Performed under contracts containing standard terms and conditions and applied en masse to numerous customers. 2. Effected at prices or rates established on a general basis by the party acting as the supplier of the good or service in question. 3. Amount does not exceed 1% of the Company’s annual income. The following persons are subject to these rules:
- Directors of Ferrovial S.A. The person requesting authorisation must vacate the meeting room while the Board deliberates and votes and may not exercise or delegate his or her voting rights.
- Controlling shareholders. - Natural persons representing directors that are legal persons - Senior executives. - Other managers designated individually by the Board of Directors. - Persons related to the above listed persons, as defined in the Board of Directors Regulations.

Consolidated Financial Statements for 2010 and 2009 Ferrovial, S.A. and Subsidiaries
Ferrovial, S.A. Consolidated financial statements at 31 December 2010 94
Related party transactions The most relevant arm’s length transactions with related parties effected in 2010 in the ordinary course of the Company’s and the Group’s business are analysed below. The Company provides this information in compliance with the definitions and criteria set forth in Ministry of Economy and Finance Order EHA/3050/2004 of 15 September, and in CNMV Circular 1/2005, 1 April. Where the profit or loss from a transaction cannot be stated, as it pertains to the providing entity or individual, the transaction has been marked with an asterisk (*). Significant shareholders The following table contains a breakdown of the most significant transactions carried out in 2010 with significant shareholders, with members of the “controlling family group” (except for the natural persons who are in turn Company directors, who are included in the following section) or entities related through shareholdings to persons from the “controlling family group” (1):
(Thousands of
euros) 2010 2009
Name/ Company name
Ferrovial Group company
Nature of transaction
Type of transaction Amount Profit or Loss
Amount Profit or Loss
Ferrovial Agromán, S.A. / subsidiaries
Commercial Execution of construction work
1,998 167 7,656 665
Ferrovial Servicios, S.A. / subsidiaries
Commercial Integrated management of services at Madrid offices
423 106 417 125
Ferrovial Conservación, S.A.
Commercial Lease to Ferrovial of offices in Madrid owned by shareholders
186 (*) 151 (*)
Members of “controlling family group” / their related entities
Ferrovial Servicios, S.A. / subsidiaries
Commercial Integrated management of services at Madrid offices
152 20 220 22
(1) According to a notification sent to the CNMV and to the company on 10 December 2009, the "official family group" formed by Maria, Rafael, Leopoldo, Fernando and Joaquin del Pino y Calvo-Sotelo controls, through the company KARLOVY, S.L., the majority of the share capital of PORTMAN BAELA, S.L, which owns 44.607% of Ferrovial S.A.
(*) No profit or loss is stated as the relevant amount pertains to the entity or person providing the service. Transactions with directors and senior executives Transactions performed with the Company’s directors, representatives of directors and senior executives in 2010 are described below. Also shown are transactions performed with Banesto, NH Hoteles, Ericsson, Asea Brown Bovery, Cepsa, Aviva, Telefónica, Sol Meliá, Maxam and Bimarán in accordance with Section Two of Order EHA/3050/2004, as certain Company directors are or were at some time in 2010 Directors or senior executives of those companies:

Consolidated Financial Statements for 2010 and 2009 Ferrovial, S.A. and Subsidiaries
Ferrovial, S.A. Consolidated financial statements at 31 December 2010 95
(Thousands of euros)
2010 2009 Name/ Company name
Ferrovial Group company
Nature of transaction
Type of transaction Amount Profit or Loss
Amount Profit or Loss
Rafael del Pino y Calvo-Sotelo
Ferrovial Servicios, S.A. / subsidiaries
Commercial Cleaning and maintenance services (1)
28 6 25
Ericsson Ferrovial Servicios, S.A. / subsidiaries
“ Integrated services of management 126 34 47 14
Aviva Ferrovial Group companies
“ Arrangement of insurance policies 2,528 (*) 2,537 (*)
Maxam Europe Ferrovial Agromán / subsidiaries
Commercial Receipt of supplies of explosives and detonators
96 (*) 178 (*)
“ Collection of fees for business and settlement of derivative transactions collected
(-) (-) 589 589(‘)
“ Payment of commissions and settlements for derivative instrument transactions
5,593 (*) 3,193 (*)
“ Payment of interest 1,600 1,600 4,967 4,967(')
“ Payment of interest 12,701 (*) 16,233 (*)
“ Balance drawn down against guarantee facilities
256,800 (*) 261,500 (*)
“ Balance drawn down against reverse factoring and documentary credit facilities
45,200 (*) 52,800 (*)
Ferrovial Group companies
“ Balance drawn down against credit facilities
341,900 (*) 348,700 (*)
Banesto
Ferrovial Servicios, S.A. / subsidiaries
“ Credit for cleaning and maintenance services
23 1 3,290 108
NH Hoteles and its group companies
Ferrovial Group companies
Commercial Hotel services provided by NH Hoteles and its group companies
2 (*) 40 (*)
Ferrovial Agromán / subsidiaries
Commercial Execution of construction work 1,443 58 3,626 145
Ferrovial Servicios, S.A. / Ferrovial Agromán / subsidiaries
Commercial Receipt of fuel supplies 9,102 (*) 4,710 (*) Cepsa
Ferrovial Servicios, S.A. / subsidiaries
Commercial Maintenance services rendered 29 5
Everis Ferrovial Servicios, S.A. / subsidiaries
Commercial Advertising services received 329 (*)
Ferrovial Agromán, S.A. / subsidiaries
Commercial Equipment repair and maintenance services received
127 (*) 87 (*) Asea Brown Bovery Ferrovial Servicios,
S.A. / subsidiaries Commercial Waste collection services rendered 33 3 15 1
Telefónica Ferrovial Group companies
Commercial Telecom services received 8,060 (*) 7,359 (*)
Sol Meliá Ferrovial Group companies
Commercial Hotel and catering services received 50 (*) 22 (*)
Bimarán Ferrovial Agromán, S.A. / subsidiaries
Commercial Execution of construction work 10,537 420 2,619 105
Ferrovial Servicios, S.A. / subsidiaries
Commercial Waste collection services rendered 11 1
Ferrovial Servicios, S.A. / Ferrovial Agromán / subsidiaries
Commercial Parking space rental services received 315 (*)
Ferrovial Servicios, S.A. / subsidiaries
Commercial Maintenance services rendered 89 14
Empark
Ferrovial Agromán, S.A. / subsidiaries
Commercial Collection of withholdings 413 0
(1) In 2009 this transaction type was “Refurbishment work”. (#) Advances that generate no profit or loss. (*) No profit or loss is stated as the relevant amount pertains to the entity or person providing the service. (´) For this type of items (fees and interest paid), the gross amount of the transaction is treated as a profit.

Consolidated Financial Statements for 2010 and 2009 Ferrovial, S.A. and Subsidiaries
Ferrovial, S.A. Consolidated financial statements at 31 December 2010 96
Lastly, in addition to the foregoing transactions, five arm’s length transactions were performed in 2010 with members of the controlling family group or entities related to them, directors and senior executives, directly or through related persons, for an overall total of EUR 21 thousand (EUR 109 thousand in 2009), comprising collections for/execution of minor construction work in private residences or corporate headquarters; provision of fitting, repair and maintenance services at facilities; provision of waste collection and integrated management services; and sundry services received, all for a limited duration and amount. Where companies of Ferrovial acted as service providers, the profit obtained totalled one thousand euros (EUR 9 thousand in 2009). The information on remuneration and loans relating to directors and senior executives may be consulted in the section “Remuneration of Directors and Senior Executives”. Intra-Group transactions Set out below is information on transactions between Ferrovial companies, which since they form part of their ordinary businesses as regards purpose and conditions, were not been eliminated on consolidation for the following reason: As explained in detail in Note 2.2-d), the balances and transactions relating to construction work executed by the Construction division for infrastructure concession operators are not eliminated on consolidation since, at consolidated level, contracts of this type are classed as construction contracts in which, during execution, the work is deemed to be performed for third parties, as the ultimate owner of the work is the granting authority from a financial and legal viewpoint. In 2010 Ferrovial’s Construction Division billed those companies for EUR 711,800 thousand (EUR 247,230 thousand in 2009) for work performed and related advance payments and, in this respect, recognised sales totalling EUR 581,600 thousand (EUR 299,260 thousand). In 2010 the profit from these transactions attributable to Ferrovial’s holdings in the concession operators in question and not eliminated on consolidation, net of taxes and non-controlling interests, was EUR 25,064 thousand (2009: EUR 18,799 thousand). 35. Directors’ ownership interests in, positions or functions at in companies engaging in an activity that is similar
or complementary to that of Ferrovial Article 229 of the Spanish Limited Liability Companies Law requires the directors to notify the Company of the following information:
- Conflicts that they may have with the Company’s interest. - Any ownership interests they may have in the share capital of a company engaging in any activity that is identical, similar
or complementary to the Company’s object:
- Positions held or functions discharged at such companies. In accordance with paragraph 3 of the aforementioned Article 229, this information is to be included in the notes to the financial statements. Furthermore, Article 230 establishes that directors may not engage, as independent professionals or as employees, in activities that are identical, similar or complementary to the activity that constitutes the Company’s object, except in the event of receiving express authorisation to do so from the Company, through a resolution by the annual general meeting, which shall require notice to be given as required under Section 229. The following information was provided to the Company by the members of the Board of Ferrovial S.A. in 2010: Conflicts of interest: There were no conflicts of interest.

Consolidated Financial Statements for 2010 and 2009 Ferrovial, S.A. and Subsidiaries
Ferrovial, S.A. Consolidated financial statements at 31 December 2010 97
Ownership interests in the share capital:
• The members of the “controlling family group” and/or related entities ((see related information in “COMPANY OWNERSHIP STRUCTURE” in the Annual Corporate Governance Report) hold an ownership interest in Polan S.A. (real estate business).
Positions or functions:
• Joaquín Ayuso García: Chairman of Ferrovial Agroman, S.A., Autopista Alcalá O’Donell, S.A., Autopista del Sol, S.A., Autopista Madrid Levante Concesionaria Española, S.A. and Inversora de Autopistas de Levante, S.L., and Board Director of Inversora De Autopistas del Sur, S.L. and Autopista Madrid Sur Concesionaria Española, S.A.
• Iñigo Meirás Amusco: Chairman of Ferrovial Aeropuertos, S.A., Cintra Infraestructuras, S.A., Ferrovial Servicios, S.A.
and Ferrovial Fisa, S.L.; Chairman and CEO of Finecofer, S.L.; Deputy-Chairman of BAA Ltd. and director of Ferrovial Agromán, S.A. and Ferrovial Qatar LLC.
• María del Pino y Calvo-Sotelo is Chairman of Polan, S.A. 36. Auditors’ fees In compliance with the provisions of Audit Law 12/2010, of 30 June, all the fees for the audit of the financial statements for 2010 and 2009 by the auditors of Ferrovial S.A. and all its subsidiaries, both in Spain and abroad are disclosed herein. A breakdown of the fees billed for those years to all Ferrovial’s subsidiaries and associates for services other than audit services is also provided. In both years, the information presented in the principal auditor line involves the principal auditor for 2010:
Million Euro
2010 2009
Fees for audit services 4.3 6.3
Principal auditor 3.4 1.0
Other auditors 0.9 5.3
Fees for other services 4.3 2.5
Principal auditor 2.4 1.9
Other auditors 1.9 0.6
37. Events after the reporting period
On 21 January 2011, Cintra Infraestructuras, a subsidiary of Ferrovial, completed the sale of its 50% ownership interest in
Autopista Trados 45, S.A. to Finavías, an investment vehicle of AXA Private Equity’s infrastructure funds. The transaction amount
totalled EUR 68 million and gave rise to net gain of EUR 27 million.
On 17 February 2011, Ferrovial Servicios, a subsidiary of Ferrovial, completed the sale of all of the shares representing the share
capital of Swissport International AG, Parent of Swissport Group, to PAI Partners. The transaction totalled CHF 900 million (EUR
695 million) and the expected net gain totals EUR 192 million.
Also, on 17 February 2011, Ferrovial was apprised of the judgement of the Supreme Court denying BAA permission to appeal the
decision issued by the Court of Appeal, which partially upheld the appeal filed by the Competition Commission in relation to the
obligation to sell certain airports discussed in Note 23 on “Contingent Assets and Liabilities”. The Radial 4 toll road had syndicated borrowings of EUR 557 million outstanding at 31 December 2010. Tranche A amounts to EUR 97 million and matures in 2011; Tranche B amounts to EUR 100 million and matures in 2011; and the EIB tranche amounts to EUR 357 million and has final maturity in 2033, although the guarantee expires in 2011. The syndicated loan of this toll road originally matured in January 2011, but was extended an additional six months until July 2011, and is currently undergoing a long-term refinancing process.

Consolidated Financial Statements for 2010 and 2009 Ferrovial, S.A. and Subsidiaries
Ferrovial, S.A. Consolidated financial statements at 31 December 2010 98
38. Commentaries on appendices Appendix I
Appendix I contains a list of Group companies, making a distinction between fully and proportionately consolidated companies and companies accounted for using the equity method. The companies are presented by business segment, indicating their auditor and the companies that are consolidated for tax purposes.
CORPORATE
Company Auditor Parent % of Ownership Registered Office
SPAIN Ferrovial, S.A. (a) Deloitte SpainCan-Am, S.A., (Sole-Shareholder Company) (a) Ferrovial, S.A. 100,0% SpainFerrovial Inversiones, S.A. (a) Ferrovial, S.A. (i) 100,0% Spain
Ferrovial Financiera A.I.E. Ferrovial, S.A. (iii) 67,0% SpainBetonial, S.A. (a) Ferrovial, S.A. (i) 99,0% SpainBurety, S.L. (a) Ferrovial, S.A. (i) 99,1% SpainFrin Gold, S.A. (a) Ferrovial, S.A. (i) 99,0% SpainInversiones Trenza, S.A. (a) Ferrovial, S.A. (i) 99,0% SpainPromotora Ibérica de Negocios, S.A. (a) Ferrovial, S.A. (i) 99,0% SpainAlkes Reinsurance Limited Deloitte Ferrovial, S.A. 100,0% IrelandRemtecolex, S.A. (a) Ferrovial, S.A. (i) 99,0% SpainSotaverd, S.A. (L) Ferrovial, S.A. (ii) 49,0% SpainTriconitex, S.L. (a) Ferrovial, S.A. (i) 99,0% SpainFerrocorp UK BDO Ferrovial, S.A. 100,0% United KingdomFinecofer (a) Ferrovial, S.A. (i) 99,0% SpainFerrovial Emisiones, S.A. (a) Ferrovial, S.A. (i) 99,0% SpainParticipaciones Alfard, S.L. (a) Ferrovial, S.A. (i) 99,0% SpainParticipaciones Algorab, S.L. (a) Ferrovial, S.A. (i) 99,0% SpainFerrovial Telecomunicaciones, S.A. (a) Ferrovial, S.A. (i) 99,0% Spain
(L) In liquidation. (i) Remaining ownership interests through Can-am, S.A., S.U.(ii) Ferrovial Inversiones, S.A. 28.47%(iii) Ferrovial Agromán, S.A. 19.3487%, Ferrovial Servicios, S.A., 1.1%, FISA 0.0024%, Ferrovial Aeropuertos, S.A., 12.5%, Finecofer 0.004%, Cespa 0.004%
TOLL ROADS
Company Auditor Parent % of Ownership Registered Office
SPAINCintra Infraestructuras, S.A.U. (a) Deloitte Ferrovial, S.A. 100,0% SpainAutopista del Sol, C.E.S.A. (a) Deloitte Cintra Infraestructuras, S.A. 80,0% SpainAutopista Terrasa Manresa, S.A. (a) Deloitte Inversora Autopistas de Cataluña, S.A. 76,0% SpainAutopista de Toronto, S.L. (a) Deloitte Cintra Infraestructuras, S.A. 100,0% SpainInversora de Autopistas del Sur, S.L. Deloitte Cintra Infraestructuras, S.A. 55,0% SpainAutopista Madrid Sur C.E.S.A. Deloitte Inversora de Autopistas del Sur, S.L. 100,0% SpainInversora de Autopistas del Levante, S.L. Deloitte Cintra Infraestructuras, S.A. 51,8% SpainAutopista Madrid Levante, C.E.S.A. Deloitte Inversora de Autopistas del Levante, S.L. 100,0% SpainLaertida, S.L. (a) Deloitte Cintra Infraestructuras, S.A. 100,0% SpainCintra Autopistas Integradas, S.A. (a) Deloitte Cintra Infraestructuras, S.A. 100,0% SpainM-203 Alcalá-O'Donnell (a) Deloitte Cintra Autopistas Integradas, S.A. 100,0% SpainCintra Inversora Autopistas de Cataluña, S.A. (a) Deloitte Cintra Infraestructuras, S.A. 100,0% SpainInversora Autopistas de Cataluña, S.A. (a) Deloitte Cintra Inversora Autopistas de Cataluña, S.A. 100,0% Spain
PORTUGALEuroscut Norte Litoral, S.A. Deloitte Cintra Infraestructuras, S.A. 75,5% PortugalEuroscut -Sociedade Concessionaria da Scut do Algarve, S.A. Deloitte Cintra Infraestructuras, S.A. 77,0% PortugalCintra sucursal Portugal Deloitte Cintra Infraestructuras, S.A. 100,0% PortugalEuroscut Azores, S.A. Deloitte Cintra Infraestructuras, S.A. 89,0% PortugalVia Livre, S.A. Cintra Infraestructuras, S.A. 84,0% Portugal
NETHERLANDSAlgarve International B.V. Deloitte Cintra Infraestructuras, S.A. 77,0% Netherlands407 Toronto Highway B.V. Cintra Infraestructuras, S.A. 100,0% Netherlands
POLANDAutostrada Poludnie, S.A. Deloitte Cintra Infraestructuras, S.A. 93,7% Poland
CANADACintra Canada Inc. Deloitte 407 Toronto Highway B.V. 100,0% Canada
IRELANDEurolink Motorway Operation (M4-M6), Ltd. Deloitte Cintra Infraestructuras, S.A. 66,0% IrelandFinancinfrastructures Deloitte Cintra Infraestructuras, S.A. 100,0% IrelandCinsac, Ltd. Deloitte Cintra Infraestructuras, S.A. 100,0% IrelandEurolink Motorway Operation (M3), Ltd. Deloitte Cinsac, Ltd. 95,0% Ireland
UNITED STATESCintra Zachry, LP Cintra Texas Corp 84,2% USACintra Zachry, GP Cintra Texas Corp 85,0% USACintra Texas Corp. Cintra US Corp 100,0% USACintra Developments, LLC Cintra Texas Corp 100,0% USACintra Skyway LLC Cintra US Corp 100,0% USACintra US Corp. Deloitte Laertida 100,0% USASCC Holdings LLC Deloitte Cintra Skyway LLC 55,0% USASkyway Concession Co.LLC Deloitte SCC Holding LLC 100,0% USACintra ITR LLC Cintra US Corp 100,0% USACintra Texas 56, LLC Cintra US Corp 100,0% USASH-130 Concession Company, LLC Deloitte Cintra Texas 56, LLC 65,0% USACintra NTE, LLC Cintra US Corp 100,0% USACintra LBJ, LLC Cintra US Corp 100,0% USALBJ Infraestructure Group Holding Cintra LBJ, LLC 100,0% USALBJ Infraestructure Group Deloitte LBJ Infraestructure Group Holding 51,0% USANTE Mobility Partners Holding Deloitte Cintra NTE, LLC 56,7% USANTE Mobility Partners Deloitte NTE Mobility Partners Holding 100,0% USA

Consolidated Financial Statements for 2010 and 2009 Ferrovial, S.A. and Subsidiaries
Ferrovial, S.A. Consolidated financial statements at 31 December 2010 99
CONSTRUCTION
Company Auditor Parent % of Ownership Registered Office
SPAIN Ferrovial Agromán, S.A. (a) Deloitte Finecofer, S.L. 100,0% SpainAplicación Recursos Naturales, S.A. (a) Ferrovial Agromán, S.A. (i) 100,0% SpainCadagua, S.A. (a) Deloitte Ferrovial Agromán, S.A. (i) 100,0% SpainCompañía de Obras Castillejos (a) Deloitte Ferrovial Agromán, S.A. (i) 100,0% SpainEncofrados Deslizantes y Técnicas Especiales, S.A. (a) Deloitte Ferrovial Agromán, S.A. (i) 99,1% SpainDitecpresa, S.A. (a) Deloitte Ferrovial Agromán, S.A. (i) 100,0% SpainFerrovial Conservación, S.A. (a) Deloitte Ferrovial Agromán, S.A. (i) 99,0% SpainUrbaoeste, S.A. (a) Ferrovial Agromán, S.A. (i) 99,0% SpainFerrovial Medio Ambiente y Energía, S.A. (a) Deloitte Ferrovial Agromán, S.A. (i) 99,0% SpainDiscota XXI, S.L., (Sole-Shareholder Company) (a) Deloitte Ferrovial Agromán, S.A. 100,0% SpainNorvarem, S.A.U. (a) BDO Ferrovial Agromán, S.A. 100,0% SpainTécnicas del Pretensado y Servicios Auxiliares, S.L. (a) Deloitte Edytesa, S.A. (i) (a) 100,0% SpainConcesionaria de Prisiones Lledoners, S.A. (a) Deloitte Ferrovial Agromán, S.A. 100,0% SpainConcesionaria de Prisones Figueres (a) Deloitte Ferrovial Agromán, S.A. (i) 100,0% SpainFerrovial Railway, S.A. (a) Ferrovial Agromán, S.A. (ii) 98,8% Spain
MEXICOCadagua Ferr. Indust. México Ferovial Medio Ambiente, S.A. 24,9% MexicoCadagua Ferr. Indust. México Cadagua, S.A. (a) 75,1% Mexico
INDIACadagua Ferrovial India Pr Ltd. Ferovial Medio Ambiente, S.A. 5,0% IndiaCadagua Ferrovial India Pr Ltd. Cadagua, S.A. (a) 95,0% India
PUERTO RICOCOCSA Puerto Rico Deloitte Compañía de Obras Castillejos, S.A. 100,0% Puerto Rico
POLAND Budimex, S.A. Deloitte Audit Sp. z o.o. Valivala Holdings B.V. 59,1% PolandBudimex Danwood, Sp. Zoo Deloitte Audit Sp. z o.o. Budimex, S.A. 100,0% PolandBudimex Sygnity, S.j. Deloitte Audit Sp. z o.o. Budimex, S.A. 67,0% PolandMostostal Kraków, S.A. Deloitte Audit Sp. z o.o. Budimex, S.A. 100,0% PolandCentrum Konferencyjne Budimex Sp. z o.o. Deloitte Audit Sp. z o.o. Budimex, S.A. 100,0% PolandBudimex Nieruchomości Sp. z o.o. (IP) Deloitte Audit Sp. z o.o. Budimex, S.A. 100,0% PolandBudimex S.A.Ferrovial Agroman S.A. Sp.j. Deloitte Audit Sp. z o.o. Budimex, S.A. 50,0% PolandBudimex S.A.Ferrovial Agroman S.A. Sp.j. Deloitte Audit Sp. z o.o. Ferrovial Agromán, S.A. 50,0% Poland
CHILE Ferrovial Agromán Chile, S.A. Ferrovial Agromán, S.A. 13,4% ChileFerrovial Agromán Chile, S.A. Ferrovial Agromán Empresa Constructora Ltda. 86,6% ChileFerrovial Agromán Empresa Constructora Ltda. Ferrovial Agromán, S.A. 100,0% ChileConstructora Agromán Ferrovial Limitada Ferrovial Agromán, S.A. 56,9% ChileConstructora Agromán Ferrovial Limitada Ferrovial Agromán Chile, S.A. 2,8% ChileConstructora Agromán Ferrovial Limitada Ferrovial Agromán Empresa Constructora Ltda. 40,4% ChileFerrovial Agromán Compañía Constructora Ltda. Ferrovial Agromán, S.A. 100,0% ChileFerrovial Agromán Compañía Constructora Ltda. Ferrovial Agromán Chile, S.A. 0,1% ChileFerrovial Agromán Latinoamérica, Ltda. Ferrovial Agromán Empresa Constructora, Ltda. 50,0% ChileFerrovial Agromán Latinoamérica, Ltda. Constructora Agromán Ferrovial Limitada 50,0% Chile
CANADA Ferrovial Agromán Canadá, Inc Ferrovial Agromán, S.A. 100,0% Canada
NETHERLANDS Valivala Holdings B.V. Discota XXI, S.L., (Sole-Shareholder Company) (a) 100,0% Netherlands
UNITED STATES Ferrovial Agromán US Corp. BDO Ferrovial Agromán, S.A. 100,0% USAFerrovial Agromán Indiana, LLC BDO Ferrovial Agromán US Corp. 100,0% USAIndiana Toll-Roads Contractors, LLC BDO Ferrovial Agromán Indiana, LLC 75,0% USAFerrovial Agromán Texas, LLC BDO Ferrovial Agromán US Corp. 100,0% USAFerrovial Agromán 56, LLC BDO Ferrovial Agromán Texas, LLC 100,0% USACentral Texas Highway Constructors, LLC BDO Ferrovial Agromán 56, LLC 50,0% USAW.W.Webber, LLC BDO Norvarem 100,0% USAWebber Management Group, INC BDO Norvarem 100,0% USASouthern Crushed Cincrete, INC BDO Norvarem 100,0% USAWebber Barrier Sevices, LLC BDO Norvarem 100,0% USABluebonnet Constractors, LLC Deloitte Ferrovial Agromán Texas, LLC 60,0% USABluebonnet Constractors, LLC Deloitte DBW Construction, LLC 40,0% USATrinitry Infraestructure, LLC Deloitte Ferrovial Agromán Texas, LLC 60,0% USATrinitry Infraestructure, LLC Deloitte DBW Construction, LLC 40,0% USADBW Construction, LLC BDO W.W.Webber, LLC 100,0% USA
IRELAND Ferrovial Agromán Ireland Ltda. Deloitte Ferrovial Agromán, S.A. 100,0% Ireland
NORTHERN IRELAND Ferrovial Agromán Irlanda del Norte, Ltda. Deloitte Ferrovial Agromán Ireland Ltda. 100,0% Northern Ireland
UNITED KINGDOM Ferrovial Agromán UK, Ltda. Deloitte Ferrovial Agromán, S.A. 100,0% United KingdomFerrovial Agromán Airports UK, Ltda. Deloitte Ferrovial Agromán, S.A. 100,0% United Kingdom
GERMANY Budimex Bau Budimex, S.A. 100,0% Germany
(*) A list of BAA companies may be found at the end of the Appendix. (i) Remainder through Can-am, S.A.(ii) Remainder through Técnicas del Pretensado y Servicios Auxiliares, S.L.
AIRPORTS
Company Auditor Parent % of Ownership Registered Office
UNITED KINGDOMFGP Topco Limited Deloitte Finecofer, S.L. 55,9% United KingdomADI Finance 1 Ltd. Deloitte FGP Topco Limited 100,0% United KingdomADI Finance 2 Ltd. Deloitte ADI Finance 1 Ltd. 100,0% United KingdomBAA Limited Deloitte ADI Finance 2 Ltd. 100,0% United KingdomBAA Airports Holdco Limited Deloitte BAA Limited 100,0% United KingdomBAA (Non des Topco) Limited Deloitte BAA Limited 100,0% United KingdomBAA (NDH2) Limited Deloitte BAA Limited 100,0% United Kingdom
SPAINFerrovial Aeropuertos, S.A. (a) Deloitte Ferrovial, S.A. 100,0% Spain
Can-Am, S.A. 0,0%CHILEAeropuerto Cerro Moreno Sociedad Concesionaria, S.A. (Concession operator) Price Waterhouse Coopers Ferrovial Aeropuertos, S.A. 100,0% Chile
Ferrovial Agromán Chile, S.A. 0,0%

Consolidated Financial Statements for 2010 and 2009 Ferrovial, S.A. and Subsidiaries
Ferrovial, S.A. Consolidated financial statements at 31 December 2010 100
SERVICES
Company Auditor Parent % of Ownership Registered Office
SPAIN FERROVIAL SERVICIOS, S.A. (a) BDO Grupo Ferrovial, S.A. 99,9% SpainEUROLIMP, S.A. (a) BDO Ferrovial Servicios, S.A. 99,0% SpainFerroser Infraestrutruas, S.A. (a) BDO Ferrovial Servicios, S.A. 100,0% SpainViales de Castilla y León, S.A. (a) BDO Ferroser Infraestruturas, S.A. 100,0% SpainAndaluza de Señalizaciones, S.A. (a) BDO Ferroser Infraestruturas, S.A. 100,0% SpainAutovía de Aragón, Sociedad Concesionaria, S.A. (Concession operator (a) Deloitte Ferroser Infraestruturas, S.A. 60,0% SpainCompañía Española de Servicios Públicos Auxiliares, S.A. (a) Deloitte Ferrovial Servicios, S.A. 100,0% SpainCespa Conten, S.A. Deloitte Compañía Española de Servicios Públicos Auxiliares, S.A. 100,0% SpainOñeder, S.A. Deloitte Cespa Conten, S.A. 51,6% SpainCespa Gestion Residuos, S.A. (a) Deloitte Compañía Española de Servicios Públicos Auxiliares, S.A. 100,0% SpainContenedores Reus, S.A. (a) Deloitte Cespa Gestion Residuos, S.A. (a) 75,5% SpainCespa Gestión Tratamientos de Residuos, S.A. (a) Deloitte Cespa Gestion Residuos, S.A. (a) 100,0% SpainEconenergia Can Mata AIE Deloitte Cespa Gestion Residuos, S.A. (a) 70,0% SpainTratamientos, Residuos y Energías Valencianas, S.A. Cespa Gestion Residuos, S.A. (a) 55,0% SpainAlbaida Residuos, S.L. (a) Deloitte Cespa Gestion Residuos, S.A. (a) 100,0% SpainTécnicas Medioambientales Avanzadas, S.L. Albaida Residuos, S.L. 55,0% SpainTratamiento de Residuos Medioambientales, S.L. Deloitte Albaida Residuos, S.L. 54,9% SpainEconenergia Can Mata AIE Deloitte Cespa, S.A. 30,0% SpainCespa Inversiones Ambientales, S.A. Compañía Española de Servicios Públicos Auxiliares, S.A. (ii) 60,0% SpainCespa Jardinería, S.A. Deloitte Compañía Española de Servicios Públicos Auxiliares, S.A. 100,0% Spain
Sitkol, S.A. (a) Compañía Española de Servicios Públicos Auxiliares, S.A. (i) 99,0% SpainEmp.Mixta Almendralejo, S.A. Compañía Española de Servicios Públicos Auxiliares, S.A. 51,0% SpainIngenieria Ambiental Granadina, S.A. (a) Deloitte Compañía Española de Servicios Públicos Auxiliares, S.A. 80,0% SpainGestión Medioambiental de Toledo, S.A. Almagro Auditores, S.L. Compañía Española de Servicios Públicos Auxiliares, S.A. 60,0% SpainAyora Gestión Biogas, S.L. Deloitte Compañía Española de Servicios Públicos Auxiliares, S.A. 60,0% SpainEcoparc de Can Mata, S.L. Deloitte Cespa Gestion Residuos, S.A. (a) 80,0% SpainFerrovial Financiera, S.A. Deloitte Ferrovial Servicios, S.A. 5,0% SpainSwissport Handling, S.A. Deloitte Swissport International AG 100,0% SpainSwissport Menzies Handling Alicante Swissport International AG 10,5% SpainSwissport Menzies Handling Swissport International AG 21,0% Spain
MOROCCO
Cespa Nadafa Deloitte Compañía Española de Servicios Públicos Auxiliares, S.A. (iii) 98,8% MoroccoCespa Nadafa Deloitte Cespa Gestion Residuos, S.A. (a) 0,7% Morocco
PORTUGAL Cespa Portugal, S.A. Citrup Lda Ferrovial Construcoes Gestao e Manutencao, S.A. BDO Ferrovial Servicios, S.A. 97,5% PortugalNovipav Invesstimentos SGES, S.A. BDO Ferroser Infraestructuras, S.A. 100,0% PortugalSopovico Soc. Port. Vías de Com- Cons. Infraestructuras BDO Novipav Invesstimentos SGES, S.A. 100,0% Portugal
SWITZERLANDSwissport International AG Deloitte Ferrovial Servicios SASwissport Baggage Sorting AG Deloitte Swissport International AG 100,0% SwitzerlandCheckport Schweiz AG Deloitte Swissport International AG 85,0% SwitzerlandPrivatPort SA Deloitte Swissport International AG 51,0% SwitzerlandCareport Schweiz AG Deloitte Swissport International AG 66,8% SwitzerlandSwissport Group Services GmbH Deloitte Swissport International AG 100,0% SwitzerlandGVAssistance Deloitte Swissport International AG 70,0% Switzerland
UNITED KINGDOMAmey 1321 Ltd. BDO Amey plc 100,0% United KingdomAmey Airports Ltd. BDO Amey plc 100,0% United KingdomAmey Building Ltd. BDO Amey plc 100,0% United KingdomAmey Community Ltd. BDO Amey plc 100,0% United KingdomAmey Construction Ltd. BDO Amey plc 100,0% United KingdomAmey Datel Group Ltd. BDO Amey plc 100,0% United KingdomAmey Datel Ltd. BDO Amey OW Ltd. 100,0% United KingdomAmey Datel Security And Communications Ltd. BDO Amey Datel Group Ltd. 100,0% United KingdomAmey Datel Technology Ltd. BDO Amey Datel Group Ltd. 100,0% United KingdomAmey Facilities Partners Ltd. BDO Comax Holdings Ltd. 100,0% United KingdomAmey Fleet Services Ltd. BDO Amey plc 100,0% United KingdomAmey Group Information Services Ltd. BDO Amey plc 100,0% United KingdomAmey Group Services Ltd. BDO Amey plc 100,0% United KingdomAmey Highways Ltd. BDO Amey plc 100,0% United KingdomAmey Holdings Ltd. BDO Amey plc 100,0% United KingdomAmey Information Services Ltd. BDO Amey plc 100,0% United KingdomAmey Insurance Company PCC Ltd. BDO Amey plc 100,0% United KingdomAmey Investments Ltd. BDO Amey plc 100,0% United KingdomAmey IT Services Ltd. BDO Amey plc 100,0% United KingdomAmey LG Ltd. BDO Amey plc 100,0% United KingdomAmey LUL 2 Ltd. BDO Amey Tube Ltd. 100,0% United KingdomAmey LUL Ltd. Amey plc 100,0% United KingdomAmey Mechanical & Electrical Services Ltd. BDO Amey Property Ltd. 100,0% United KingdomAmey OW Group Ltd. BDO Amey UK plc 100,0% United KingdomAmey OW Ltd. BDO Amey OW Group Ltd. 100,0% United KingdomAmey OWR Ltd. BDO Amey OW Group Ltd. 100,0% United KingdomAmey plc (c.3) BDO Amey UK plc 100,0% United KingdomAmey Procurement Solutions Ltd. BDO Amey plc 100,0% United KingdomAmey Programme Management Ltd. BDO Amey plc 100,0% United KingdomAmey Properties Ltd. BDO Amey plc 100,0% United KingdomAmey Property Ltd. Amey plc 100,0% United KingdomAmey Rail Ltd. BDO Amey plc 100,0% United KingdomAmey Railtech Ltd. Amey OW Ltd. 100,0% United KingdomAmey Railways Holding Ltd. BDO Amey plc 100,0% United KingdomAmey Roads (North Lanarkshire) Ltd. BDO Amey LG Ltd. 66,7% United KingdomAmey Services Ltd. BDO Amey plc 100,0% United KingdomAmey Technology Services Ltd. BDO Amey plc 100,0% United KingdomAmey Tramlink Ltd. BDO Treasurepark Ltd. 100,0% United KingdomAmey Tube Ltd. BDO JNP Ventures Ltd. 100,0% United KingdomAmey UK Plc (a) BDO Ferrovial Servicios, S.A. (iv) 99,9% United KingdomAmey Ventures Asset Holdings Ltd. BDO Amey Investments Ltd. 100,0% United KingdomAmey Ventures Ltd. BDO Amey plc 100,0% United KingdomAmey Ventures Management Services Ltd. BDO Amey Investments Ltd. 100,0% United KingdomAmey Wye Valley Ltd. BDO Amey LG Ltd. 80,0% United KingdomBushclose Ltd. BDO Treasurepark Ltd. 100,0% United KingdomComax Holdings Ltd. BDO Amey plc 100,0% United KingdomComax Secure Business Services Ltd. Comax Holdings Ltd. 100,0% United KingdomJNP Ventures 2 Ltd. BDO Amey Tube Ltd. 100,0% United KingdomJNP Ventures Ltd. BDO Amey Ventures Ltd. 100,0% United KingdomR T James & Partners Ltd. Amey OW Group Ltd. 100,0% United KingdomSherard Secretariat Services Ltd. BDO Amey plc 100,0% United KingdomTreasurepark Ltd. BDO Amey Technololgy Services Ltd. 100,0% United KingdomWimco Ltd. BDO Amey Railways Holding Ltd. 100,0% United KingdomAmey Public Services LLP BDO Amey LG Ltd. 66,7% United KingdomCespa UK BDO Cespa, S.A. 100,0% United KingdomCespa Ventures BDO Cespa UK, S.A. 100,0% United KingdomAmey Cespa Ltd. BDO Cespa UK, S.A. 50,0% United KingdomAmey Cespa Ltd. BDO Amey LG Ltd. 50,0% United Kingdom

Consolidated Financial Statements for 2010 and 2009 Ferrovial, S.A. and Subsidiaries
Ferrovial, S.A. Consolidated financial statements at 31 December 2010 101
Company Auditor Parent % of Ownership Registered Office Donarbon Holdings Ltd. BDO Amey Cespa Ltd. 100,0% United KingdomDonarbon Group Ltd. BDO Amey Cespa Ltd. 84,2% United KingdomDonarbon Group Ltd. BDO Donarbon Holdings Ltd. 15,8% United KingdomDonarbon Ltd. BDO Donarbon Group Ltd. 100,0% United KingdomDonarbon Services Ltd. BDO Donarbon Ltd. 100,0% United KingdomDonarbon Waste Management Ltd. BDO Donarbon Services Ltd. 100,0% United Kingdom
UNITED STATESSwissport North America Holding Inc. Swissport International AG 100,0% USASwissport North America Inc. Swissport International AG 100,0% USASwissport Cargo Holdings Inc. Swissport International AG 100,0% USASwissport Cargo Services LP Inc. Swissport International AG 100,0% USASwissport Fueling of Nevada Inc. Swissport International AG 100,0% USASwissport Holdings Inc. Swissport International AG 100,0% USADapsco Inc. Swissport International AG 100,0% USASwissport USA Inc. Swissport International AG 100,0% USASwissport CFE Inc. Swissport International AG 100,0% USASwissport Cargo Services Inc. Swissport International AG 100,0% USASwissport Fueling Inc. Swissport International AG 100,0% USAHallmark Aviation Services Inc. Swissport International AG 51,0% USANew Age Aviation Security US, Inc. Swissport International AG 51,0% USA
UNITED KINGDOMSwissport Cargo Services Center (UK) Ltd. Deloitte Swissport International AG 100,0% United KingdomSwissport Ltd. Deloitte Swissport International AG 100,0% United KingdomSwissport Stansted Ltd. Deloitte Swissport International AG 100,0% United KingdomSwissport Fueling UK Deloitte Swissport International AG 100,0% United Kingdom
GERMANYSwissport Germany Holding GmbH Swissport International AG 100,0% GermanySwissport Cargo Services Deutschland GmbH Deloitte Swissport International AG 100,0% GermanySwissport Deutschland GmbH Swissport International AG 100,0% GermanySwissport Ground Handling GmbH Price Waterhouse Coopers Swissport International AG 100,0% GermanySwissport Services GmbH Swissport International AG 100,0% GermanySwissport Travel Center GmbH Swissport International AG 100,0% GermanySwissport Cargo Services München GmbH Swissport International AG 100,0% GermanySP Losch GmbH and Co. OHG Swissport International AG 55,0% GermanySP Losch Munchen GmbH Co KG Swissport International AG 55,0% GermanySP Losch Munchen GmbH Co KG Swissport International AG 55,0% GermanySP Losch Services Verwaltungsgeselschaft GmbH Swissport International AG 55,0% GermanySP Losch Solutions GmbH Co KG Swissport International AG 55,0% GermanySP Losch Operations GmbHCo KG Swissport International AG 55,0% GermanySP Losch Operations Verwaltungsgesellschaft Swissport International AG 55,0% Germany
NETHERLANDS ANTILLESAerocargo N.V. Price Waterhouse Coopers Swissport International AG 100,0% Netherlands AntillesCargo Services Center International N.V. Price Waterhouse Coopers Swissport International AG 100,0% Netherlands AntillesSwissport Curacao Price Waterhouse Coopers Swissport International AG 100,0% Netherlands Antilles
FRANCESwissport France Deloitte Swissport International AG 100,0% FranceSwissport Services CDG Deloitte Swissport International AG 100,0% FranceSwissport Cargo Services France Deloitte Swissport International AG 100,0% FranceSwissport Nice SAS Deloitte Swissport International AG 100,0% France
KENYAAirside Ltd. (Swissport Kenya) Deloitte Swissport International AG 100,0% KenyaSwissport Cargo Services Center East Africa B.V. Deloitte Swissport International AG 100,0% Kenya
TANZANIASwissport Tanzania Ltd. Price Waterhouse Coopers Swissport International AG 51,0% Tanzania
CAMEROONCamport, S.A. Swissport International AG 47,0% Cameroon
DOMINICAN REPUBLICCarribbean Jets Swissport International AG 34,0% Dominican RepublicSwissport Dominicana Price Waterhouse Coopers Swissport International AG 34,0% Dominican Republic
NIGERIACheckport Security Nigeria Ltd. Swissport International AG 43,0% Nigeria
SOUTH AFRICACheckport South Africa Ltd. Price Waterhouse Coopers Swissport International AG 43,0% South AfricaSwissport South Africa (PTY) Ltd. Deloitte Swissport International AG 51,0% South Africa
LUXEMBOURGSwissport Cargo Services Lux Sarl Price Waterhouse Coopers Swissport International AG 75,0% Luxembourg
ARGENTINASwissport Argentina, S.A. Deloitte Swissport International AG 100,0% Argentina
AUSTRIASwissport Austria GmbH Swissport International AG 100,0% AustriaSwissport Cargo Services GmbH Swissport International AG 100,0%
MEXICOSwissport Mexico Holding Swissport International AG 100,0% MexicoSwissport Aviation Services de Mexico, S.A. de C.V. Deloitte Swissport International AG 100,0% MexicoSwissport Cargo Services de Mexico, S.A. de C.V. Deloitte Swissport International AG 100,0% Mexico
BRAZILSwissport Brasil Ltda. Swissport International AG 100,0% BrazilSwissport Cargo Services Brazil Logistica Ltda. Swissport International AG 51,0% Brazil
CANADASwissport Canada Holding Swissport International AG 100,0% CanadaSwissport Canada Handling Inc. Swissport International AG 100,0% Canada
NETHERLANDSSwissport Cargo Service Holding B.V. Swissport International AG 100,0% NetherlandsSwissport Nederland B.V. Swissport International AG 100,0% NetherlandsSwissport Cargo Services The Netherlands B.V. Deloitte Swissport International AG 100,0% Netherlands
BELGIUMSwissport Cargo Services Belgium N.V. Swissport International AG 100,0% Belgium

Consolidated Financial Statements for 2010 and 2009 Ferrovial, S.A. and Subsidiaries
Ferrovial, S.A. Consolidated financial statements at 31 December 2010 102
Company Auditor Parent % of Ownership Registered Office ISRAELSwissport Cargo Services Israel Ltd. Deloitte Swissport International AG 51,0% Israel
ITALYSwissport Cargo Services Italy, S.R.L. Swissport International AG 100,0% ItalySwissport Italy, S.R.L. Swissport International AG 100,0% Italy
HUNGARYSwissport Cargo Services Magyarorszag Kft. Price Waterhouse Coopers Swissport International AG 100,0% Hungary
RUSSIASwissport Cargo Services St. Petersburg Swissport International AG 51,0% Russia
VENEZUELASwissport Cargo Services Venezuela, S.A. Swissport International AG 88,0% VenezuelaTramitaven C.A, Swissport International AG 60,0% Venezuela
CYPRUSSwissport G.A.P. Vassilopoulos Price Waterhouse Coopers w/ Price Waterhouse CoopersSwissport International AG 51,0% CyprusSwissport Cyprus Ltd. Deloitte Swissport International AG 38,2% Cyprus
GREECESwissport Hellas Cargo, S.A. Swissport International AG 40,8% GreeceSwissport Hellas, S.A. Deloitte Swissport International AG 51,0% Greece
KOREASwissport Korea Ltd. Swissport International AG 51,0% Korea
POLAND Swissport Poland Ltd. Swissport International AG 100,0% Poland
SINGAPORE Swissport Singapore Pte Ltd. Price Waterhouse Coopers Swissport International AG 100,0% SingaporePeruvian Investments 2008 PTE. Ltd. Price Waterhouse Coopers Swissport International AG 100,0% Singapore
UKRAINESwissport Ukraine Price Waterhouse Coopers Swissport International AG 70,6% Ukraine
BULGARIASwissport Bulgaria Price Waterhouse Coopers Swissport International AG 66,0% Bulgaria
ALGERIASwissport Algeria Audited by local auditor Swissport International AG 51,0% Algeria
IRELANDLandmille, Ltd. BDO Ferrovial Servicios, S.A. 100,0% Ireland
CHILEGrupisa, S.A. BDO Ferroser Infraestructuras, S.A. 66,0% Chile
(i) The remaining percentage belongs to Can-am, S.A.(ii) 40% through Cespa Conten, S.A.(ii) 0.74% through Cespa GR, S.A.(i) The remaining percentage belongs to Grupo Ferrovial, S.A.(ii) 9.23% through Ferrovial Servicios, S.A.
REAL ESTATE
Company Auditor Parent % of Ownership Registered Office
NETHERLANDS Grimalinvest, S.L. Ferrovial, S.A. (i) 99,5% Netherlands
SPAIN Ferrovial FISA, S.L. (a) Ferrovial, S.A. (i) 99,0% Spain
(i) Remaining ownership interests through Can-am, S.A., S.U.
(a) Belong to tax group of Ferrovial, S.A.and subsidiaries.(b) Belong to tax group of Cintra Concesiones de Infraestructuras de Transporte, S.A.(c) Belong to tax group of Inversora de Autopistas del Sur, S.L.(d) Belong to tax group of Inversora de Autopistas del Levante, S.L.(PC) Proportionate consolidation

Consolidated Financial Statements for 2010 and 2009 Ferrovial, S.A. and Subsidiaries
Ferrovial, S.A. Consolidated financial statements at 31 December 2010 103
APPENDIX I (continued)
(*) List of companies in the BAA Group
Company Auditor % of Ownership Registered Office
9G Rail Ltd. 100% United Kingdom
Aberdeen Airport Ltd. Deloitte 100% United Kingdom
ADI Finance 1 Limited Deloitte 100% United Kingdom
ADI Finance 2 Limited Deloitte 100% United Kingdom
Airport Express Rail Ltd. 100% United Kingdom
Airport Hotels General Partner Ltd. 100% United Kingdom
Airport Hotels Trust Manager Ltd. (Jersey) 100% United Kingdom
Airport Industrial Ltd. Partnership 50% United Kingdom
Airport Property GP (No.1) Ltd. 100% United Kingdom
Airport Property GP (No.2) Ltd. 50% United Kingdom
Airports International Ltd. 100% United Kingdom
Airports Ltd. 100% United Kingdom
Airports UK Ltd. 100% United Kingdom
Airportsmart Limited 42% United Kingdom
BAA (AH) Limited Deloitte 100% United Kingdom
BAA (DSH) Limited Deloitte 100% United Kingdom
BAA (Hong Kong) Ltd. 100% United Kingdom
BAA (IP Holdco) Limited 100% United Kingdom
BAA (NDH1) Limited Deloitte 100% United Kingdom
BAA (NDH2) Limited Deloitte 100% United Kingdom
BAA (Non des Topco) Limited Deloitte 100% United Kingdom
BAA (SH) Limited Deloitte 100% United Kingdom
BAA (SP) Limited Deloitte 100% United Kingdom
BAA 21st Century Communities Trust Limited Deloitte 100% United Kingdom
BAA Airports Holdco Limited Deloitte 100% United Kingdom
BAA Airports Limited Deloitte 100% United Kingdom
BAA Building Control Services Ltd. Deloitte 100% United Kingdom
BAA Business Suport Centre Ltd. Deloitte 100% United Kingdom
BAA Enterprises Limited Deloitte 100% United Kingdom
BAA Funding Limited Deloitte 100% United Kingdom
BAA General Partner Ltd. Deloitte 100% United Kingdom
BAA Hotels Ltd. 100% United Kingdom
BAA Insuarance Services Ltd. 100% United Kingdom
BAA International Ltd. Deloitte 100% United Kingdom
BAA Italia 98% Italy
BAA Limited Deloitte 100% United Kingdom
BAA Lynton Developments Ltd. Deloitte 100% United Kingdom
BAA Lynton Holdings Ltd. 100% United Kingdom
BAA Lynton Limited Deloitte 100% United Kingdom
BAA Lynton Management Ltd. Deloitte 100% United Kingdom
BAA Partnership Ltd. Deloitte 100% United Kingdom
BAA Pension Trust Co Ltd. 100% United Kingdom
BAA Properties Ltd. Deloitte 100% United Kingdom
BAA Quest Trustee Ltd. 100% United Kingdom
BAA Trust Company Ltd. 100% United Kingdom
BM Merchant Limited Deloitte 100% United Kingdom
BMG (Ashford) General Partner Ltd. Deloitte 100% United Kingdom
BMG (Ashford) Ltd. 100% United Kingdom
BMG (Ashford) Partnership Trustco Ltd. 100% United Kingdom
BMG (Bridgend) Ltd. 75% United Kingdom
BMG (Cheshire Oaks) Ltd. 100% United Kingdom
BMG (Co 2) Ltd. 100% United Kingdom
BMG (Swindon) (Phases II&III) General Partner Ltd. Deloitte 100% United Kingdom
BMG (Swindon) Ltd. 79% United Kingdom
BMG Bridgend (Phases II and III) General Partner Limited 100% United Kingdom
BMG Bridgend (Phases II and III) Ltd. Partnership 2% United Kingdom
BMG Europe Ltd. 100% United Kingdom
BMG Swindon (Phase III) Trustco Ltd. 100% United Kingdom
British Airports Services Ltd. 100% United Kingdom
Central Land Investment Holdings Ltd. 75% United Kingdom
Devon Nominees (No.1) Ltd. 100% United Kingdom
Devon Nominees (No.2) Ltd. 100% United Kingdom
Devon Nominees (No.3) Ltd. 100% United Kingdom
Devon Nominees Ltd. 67% United Kingdom
Eastleigh Airport Ltd. 100% United Kingdom
Edinburgh Airport Ltd. Deloitte 100% United Kingdom
FGP Topco Limited Deloitte United Kingdom
Gatwick Airport Ltd. 100% United Kingdom
Glasgow Airport Ltd. Deloitte 100% United Kingdom
Global Airport Services Ltd. 50% United Kingdom
Heathdrow Airport Ltd. Deloitte 100% United Kingdom
Heathdrow Airport Community Board Insulation Limited Deloitte 100% United Kingdom
Heathdrow Express Operating Company Limited Deloitte 100% United Kingdom
London Airports 1993 Ltd. Deloitte 100% United Kingdom
London Airports Ltd. Deloitte 100% United Kingdom
London Airports 1992 Ltd. Deloitte 100% United Kingdom
Lynton Estates Ltd. 100% United Kingdom
Lynton Holdings Ltd. 100% United Kingdom
Lynton Investments Ltd. 100% United Kingdom
Lynton MHA Ltd. 100% United Kingdom
Lynton Netherlands 100% Netherlands
Lynton Properties Ltd. 100% United Kingdom
Lynton Unlimited 100% United Kingdom
Martyn Ventures Ltd. 50% United Kingdom
Midhust Investments Ltd. 100% United Kingdom
Newlynton Limited 100% United Kingdom
Precis (2204) Ltd. 100% United Kingdom
Precis (2206) Ltd. 100% United Kingdom
Precis (2207) Orbital Park Ltd. 100% United Kingdom
Sanfield Lynton Ltd. 50% United Kingdom
Scottish Airports Ltd. Deloitte 100% United Kingdom
Southampton Airport Ltd. 100% United Kingdom
Southampton Handling Ltd. 100% United Kingdom
Southampton International Deloitte 100% United Kingdom
Stansted Airport Ltd. Deloitte 100% United Kingdom

Consolidated Financial Statements for 2010 and 2009 Ferrovial, S.A. and Subsidiaries
Ferrovial, S.A. Consolidated financial statements at 31 December 2010 104
APPENDIX I (continued)
(*) List of companies in the BAA Group
Company Auditor % of Ownership Registered Office
Summerbridge Properties Ltd. 100% United Kingdom
The BMG (Ashford) Limited Partnership 99% United Kingdom
The BMG (Co Phase IV) Ltd. 99% United Kingdom
The BMG (Swindon) (Phases II&III) Limited Partnership 73% United Kingdom
The Outlet Company Ltd. 100% United Kingdom
The Swindon Ltd. Partnership 66% United Kingdom
UK Outlet Center 1 Ltd. 99% United Kingdom
World Duty Free Inflight (Europe) Ltd. 100% United Kingdom
World Duty Free Limited 100% United Kingdom
Airports International Ltd. 100% United KingdomPrecis (2206) Ltd. 100% United KingdomSanfield Lynton Ltd. 50% United KingdomMartyn Ventures Ltd. 50% United KingdomWorld Duty Free Inflight (Europe) Ltd. 100% United Kingdom

Consolidated financial statements for 2010 and 2009 Ferrovial S.A. and Subsidiaries APPENDIX I (continued)
ASSOCIATES (companies accounted for using the equity method)
CONSTRUCTION
Company Auditor Parent company % of Ownership
Net cost of ownership interests
(millions of euros) Registered Office Assets Liabilities Income Profit or loss
SPAIN
Urbs ludex et Causidicus, S.A. Deloitte Ferrovial Agromán, S.A. 22,0% 6 Spain 400 453 -33 -7
Clean Cenit A.I.E Ferrovial Agromán, S.A. 13,4% 0 Spain 4 1 1 -1
Boremer, S.A. Deloitte Cadagua, S.A. 50,0% 2 Spain 24 21 21 -1
Dirgerfin, S.L. Deloitte Aplicación Recursos Naturales, S.A. (a) 20,0% 0 Spain 56 51 0 0
Tecnológica Lena, S.L. Attest Consulting Ferrovial Agromán, S.A. 50,0% 0 Spain 1 2 1 0
Sociedade Concesionaria Baio Ferrovial Agromán, S.A. 50,0% 9 Spain 4 0 0 0
POLAND
ElektromontaŜ Poznań, S.A. Deloitte Budimex, S.A. 30,8% 4 Poland 23 10 33 -3
PPHU PROMOS Sp. z o.o. Budimex, S.A. 26,1% 0 Poland 3 1 3 0
SERVICES
Company Auditor Parent company % of Ownership
Net cost of ownership interests
(millions of euros) Registered Office Assets Liabilities Income Profit or loss
SPAIN
Empresa de Mantemimiento y Explotación M-30, S.A. Deloitte Ferrovial Servicios, S.A. 50,0% 30 Spain 307 301 26 43
Concesionaria Madrid Calle 30, S.A. KPMG Empresa de Mantemimiento y Explotación M-30, S.A. 10,0% 0 Spain 3.152 2.616 43 1
Aetec, S.A. Ferroser Infraestructuras, S.A. 9,2% 60 Spain 1 0 0 -0
Necrópolis de Valladolid BDO Audiberia Sitkol, S.A. 49,0% 3.064 Spain 7 3 0 0
Valdedominguez 2000, S.A. Deloitte Compañía Española de Servicios Públicos Auxiliares, S.A. 20,0% 601 Spain 9 6 5 -0
Ingenieria Urbana, S.A. Deloitte Compañía Española de Servicios Públicos Auxiliares, S.A. 35,0% 4.227 Spain 56 41 49 4
Recollida de Residuos D´Osona, S.L Compañía Española de Servicios Públicos Auxiliares, S.A. 45,0% 385 Spain 0 0 0 0
Reciclados y Compostaje Piedra Negra, S.A. Deloitte Compañía Española de Servicios Públicos Auxiliares, S.A. 49,0% 1.654 Spain 15 7 4 0
Companya Especial de Recuperacions i Recondicionaments. S.L Cespa Gestion Residuos, S.A. (a) 42,1% 756 Spain 1 3 0 -0
Ecocat, S.L. Deloitte Compañía Española de Servicios Públicos Auxiliares, S.A. 50,0% 31.494 Spain 33 20 25 -2
Sogarisa, S.A. Deloitte Ecocat, S.L. 50,0% 2.104 Spain 18 14 12 -0
Ecocem, S.A. Ecocat, S.L. 51,0% 153 Spain 1 1 1 -0
Gestio de Residuos Especials de Catalunya, S.A. Deloitte Ecocat, S.L. 33,3% 1.606 Spain 28 31 19 -3
Novalis Medioambiente, S.A. Cespa Gestion Residuos, S.A. 50,0% 30 Spain 4 4 0 -0
MOVITEC Ecocat, S.L. 50,0% 6 Spain 0 0 0 -0
Ecoparc del Mediterrani, S.A. Deloitte Cespa Gestion Residuos, S.A. (a) 48,0% 2.517 Spain 26 20 12 3
RCD'S ALBACETE Cespa Gestion Residuos, S.A. 50,0% 5 Spain 0 0 0 0
Nora, S.A. Compañía Española de Servicios Públicos Auxiliares, S.A. 40,0% 27 Spain 10 9 5 0
Vialnet Vic., S.L. Compañía Española de Servicios Públicos Auxiliares, S.A. 49,0% 0 Spain 2 1 1 0
Millions of euros

Consolidated financial statements for 2010 and 2009 Ferrovial S.A. and Subsidiaries
Ferrovial, S.A. Consolidated financial statements at 31 December 2010 106
Company Auditor Parent company % of Ownership
Net cost of ownership interests
(millions of euros) Registered Office Assets Liabilities Income Profit or loss
PORTUGAL
Valorhospital, S.A. Cespa Portugal, S.A. 35,1% 50 Portugal 1 0 0 0
Ecoberiao Martins Pereira & Asociados Cespa Portugal, S.A. 20,0% 151 Portugal 12 12 0 0
Valor-Rib Industrial Residuos Compañía Española de Servicios Públicos Auxiliares, S.A. 45,0% 549 Portugal 12 8 8 3
Cespa Portugal - Ecoambiente ACE Deloitte Cespa Portugal, S.A. 50,0% 0 Portugal 1 1 2 0
ANDORRA
Centre de Tractament de Residus d´Andorra Gaudit, S.l. Cespa Gestion Residuos, S.A. (a) 29,0% 1.908 Andorra 141 0 0 0
UNITED KINGDOM
Amey Ventures Investments Ltd. BDO Amey Investments Ltd. 50,0% 0 United Kingdom 0 0 0 0
AHL Holdings (Manchester) Ltd. Deloitte Amey Ventures Investments Ltd. 50,0% 0 United Kingdom 0 0 0 0
Amey Highways Lighting (Manchester) Ltd. Deloitte AHL Holdings (Manchester) Ltd. 100,0% 0 United Kingdom 11 -12 1 -0
AHL Holdings (Wakefield) Ltd. Deloitte Amey Ventures Investments Ltd. 50,0% 0 United Kingdom 0 0 0 0
Amey Highways Lighting (Wakefield) Ltd. Deloitte AHL Holdings (Wakefield) Ltd. 100,0% 0 United Kingdom 7 -7 1 -0
ALC (Superholdco) Ltd. KPMG Amey Ventures Investments Ltd. 50,0% 0 United Kingdom 53 -47 22 5
ALC (FMC) Ltd. KPMG ALC (Superholdco) Ltd. 100,0% 0 United Kingdom 0 0 0 0
ALC (Holdco) Ltd. KPMG ALC (Superholdco) Ltd. 100,0% 0 United Kingdom 0 0 0 0
ALC (SPC) Ltd. KPMG ALC (Holdco) Ltd. 100,0% 0 United Kingdom 0 0 0 0
Amey Belfast Schools Partnership Holdco Ltd. BDO Amey Ventures Investments Ltd. 100,0% 0 United Kingdom 69 -72 9 -0
Amey Belfast Schools Partnership PFI Co Ltd. BDO Amey Belfast Schools Partnership HoldCo Ltd. 100,0% 0 United Kingdom 0 0 0 0
Amey Birmingham Highways Holdings Ltd. BDO Amey Ventures Asset Holdings Ltd. 33,3% 0 United Kingdom 27 -31 69 -1
Amey Birmingham Highways Ltd. BDO Amey Birmingham Highways Holdings Ltd. 100,0% 0 United Kingdom 0 0 0 0
Amey FMP Belfast Strategic Partnership Holdco Ltd. BDO Amey Ventures Management Services Ltd. 70,0% 0 United Kingdom 1 -1 1 -0
Amey FMP Belfast Strategic Partnership SP Co Ltd. BDO Amey FMP Belfast Schools Partnership Holdco Ltd. 100,0% 0 United Kingdom 0 0 0 0
Amey Lagan Roads Holdings Ltd. BDO Amey Ventures Investments Ltd. 50,0% 0 United Kingdom 85 -85 17 -0
Amey Lagan Roads Financial plc BDO Amey Lagan Roads Holdings Ltd. 100,0% 0 United Kingdom 0 0 0 0
Amey Lagan Roads Ltd. BDO Amey Lagan Roads Holdings Ltd. 100,0% 0 United Kingdom 0 0 0 0
Amey Lighting (Norfolk) Holdings Ltd. BDO Amey Ventures Investments Ltd. 100,0% 0 United Kingdom 14 -16 7 0
Amey Lighting (Norfolk) Ltd. BDO Amey Lighting (Norfolk) Holdings Ltd. 100,0% 0 United Kingdom 0 0 0 0
BCN Data Systems Ltd. (IP) Price Waterhouse Coopers Amey Information Services Ltd. 50,0% 0 United Kingdom 0 0 0 0
E4D & G HOLDCO Ltd. BDO Amey Ventures Investments Ltd. 85,0% 0 United Kingdom 65 -67 6 0
E4D & G Project Co Ltd. BDO E4D & G Holdco Ltd. 100,0% 0 United Kingdom 0 0 0 0
EduAction (Waltham Forest) Ltd. (IP) PKF (UK) Amey plc 50,0% 0 United Kingdom 18 -19 1 -0
Integrated Bradford Hold Co One Ltd. KPMG Amey Ventures Investments Ltd. 25,2% 0 United Kingdom 0 0 0 0
Integrated Bradford Hold Co One Ltd. KPMG Integrated Bradford LEP Ltd. 10,0% 0 United Kingdom 20 -21 1 0
Integrated Bradford PSP Ltd. (IP) KPMG Amey Ventures Asset Holdings Ltd. 50,0% 0 United Kingdom 1 -1 3 0
Integrated Bradford Hold Co Two Ltd. KPMG Amey Ventures Asset Holdings Ltd. 2,0% 0 United Kingdom 0 0 0 0
Integrated Bradford Hold Co Two Ltd. KPMG Integrated Bradford LEP Ltd. 10,0% 0 United Kingdom 12 -12 5 -0
Integrated Bradford LEP Ltd. KPMG Integrated Bradford PSP Ltd. 80,0% 0 United Kingdom 0 0 0 0
Integrated Bradford LEP Fin Co One Ltd. KPMG Integrated Bradford LEP Ltd. 100,0% 0 United Kingdom 0 0 0 0
Integrated Bradford SPV One Ltd. KPMG Integrated Bradford Hold Co One Ltd. 100,0% 0 United Kingdom 0 0 0 0
Integrated Bradford SPV Two Ltd. KPMG Integrated Bradford Hold Co Two Ltd. 100,0% 0 United Kingdom 0 0 0 0
RSP (Holdings) Ltd. KPMG Amey Ventures Investments Ltd. 35,0% 0 United Kingdom 25 -27 1 -0
The Renfrewshire Schools Partnership Ltd. KPMG RSP (Holdings) Ltd. 100,0% 0 United Kingdom 0 0 0 0
Services Support (Avon & Somerset) Holdings Ltd. Deloitte Amey Ventures Investments Ltd. 20,0% 0 United Kingdom 0 0 0 0
Services Support (Avon & Somerset) Ltd. Deloitte Services Support (Avon & Somerset) Holdings Ltd. 100,0% 0 United Kingdom 8 -8 0 -0
Yarls Wood Immigration Ltd. Price Waterhouse Coopers Amey Programme Management Ltd. 50,0% 0 United Kingdom 0 0 0 0

Consolidated financial statements for 2010 and 2009 Ferrovial S.A. and Subsidiaries
Ferrovial, S.A. Consolidated financial statements at 31 December 2010 107
Company Auditor Parent company % of Ownership
Net cost of ownership interests
(millions of euros) Registered Office Assets Liabilities Income Profit or loss
PERU
Swissport GBH Peru, S.A. Ernst & Young Swissport International AG 41,0% 0 Peru 9 3 10 1
GREECE
WSW Hellas Services, S.A. Swissport International AG 21,7% 0 Greece 1 0 1 0
FRANCE
Swissport Executive Price Waterhouse Coopers Swissport International AG 50,0% 0 France 2 1 7 1
ISRAEL
Quality Airport Services Israel Ltd.. Swissport International AG 50,0% 0 Israel 5 3 21 1
JAPAN
Swissport Japan Ltd. Swissport International AG 51,0% 0 Japan 7 7 17 1
CHINA
Swissport HNA Ground Handling Co., Ltd. Nexia International Swissport International AG 49,0% 0 China 3 0 0 0
CYPRUS
S&L Airport Services Ltd Swissport International AG 19,0% 0 Cyprus 1 1 1 0
QATAR
Ferrovial Qatar LLC Ferrovial Servicios, S.A. 49,0% 2 Qatar 4 0 0 0
TOLL ROADS
Company Auditor Parent company % of Ownership
Net cost of ownership interests
(millions of euros) Registered Office Assets Liabilities Income Profit or loss
SPAIN
Serrano Park, S.A. (a) Deloitte Cintra Infraestructuras, S.A. 50,0% -0 Spain 147 128 5 0
Autopista Trados M-45, S.A (a) Deloitte Cintra Infraestructuras, S.A. 50,0% 12.535 Spain 214 143 25 10
0
CANADA 0
407 International Inc. (a) Deloitte Cintra Canada Inc. 43,2% 252.059 Canada 3.688 4.067 457 0
0
UNITED STATES 0
Statewide Mobility Partners LLC (IP) (a) Deloitte Cintra ITR LLC 50,0% 262.927 USA 526 0 0 0
ITR Concession Company Holdings (IP) (a) Deloitte Statewide Mobility Partners LLC 100,0% 525.855 USA 526 0 0 0
ITR Concession Company (IP) (a) Deloitte ITR Concession Company Holdings 100,0% 525.855 USA 3.235 4.018 132 0
0
GREECE 0
Nea Odos, S.A. Ferrovial, S.A. 33,3% 8.390 Greece 385 170 75 0
Central Greece Motorway Ferrovial, S.A. 33,3% 21.112 Greece 563 362 1 0
REAL ESTATE
Company Auditor Parent company % of Ownership
Net cost of ownership interests
(millions of euros) Registered Office Assets Liabilities Income Profit or loss
SPAIN
Promociones Hábitat (i) Ferrovial FISA 20,0% 0 Spain 0 0 0 0
(i) No information from the auditors.

Consolidated financial statements for 2010 and 2009 Ferrovial S.A. and Subsidiaries