Ferromagnetic resonance in -Co magnetic compositesrras/publications/58.pdf · adjusted by the...
12
This content has been downloaded from IOPscience. Please scroll down to see the full text. Download details: IP Address: 130.233.234.132 This content was downloaded on 15/11/2014 at 20:31 Please note that terms and conditions apply. Ferromagnetic resonance in -Co magnetic composites View the table of contents for this issue, or go to the journal homepage for more ome Search Collections Journals About Contact us My IOPscience
-
Upload
hoangkhuong -
Category
Documents
-
view
228 -
download
0
Transcript of Ferromagnetic resonance in -Co magnetic compositesrras/publications/58.pdf · adjusted by the...

This content has been downloaded from IOPscience. Please scroll down to see the full text.
Download details:
IP Address: 130.233.234.132This content was downloaded on 15/11/2014 at 20:31
Please note that terms and conditions apply.
Ferromagnetic resonance in -Co magnetic composites
View the table of contents for this issue, or go to the journal homepage for more
Home Search Collections Journals About Contact us My IOPscience

Ferromagnetic resonance in ϵ-Co magneticcomposites
Khattiya Chalapat1, Jaakko V I Timonen2, Maija Huuppola3, Lari Koponen2,Christoffer Johans3, Robin H A Ras2, Olli Ikkala2, Markku A Oksanen4,Eira Seppälä4,5 and G S Paraoanu1
1O. V. Lounasmaa Laboratory, Aalto University, PO Box 15100, FI-00076, Finland2Department of Applied Physics, Aalto University, PO Box 14100, FI-00076, Finland3Department of Chemistry, Aalto University, PO Box 16100, FI-00076, Finland4Nokia Research Center, PO Box 407, FI-00045 NOKIA GROUP, Finland
E-mail: [email protected]
Received 25 June 2014, revised 12 September 2014Accepted for publication 16 October 2014Published 14 November 2014
AbstractWe investigate the electromagnetic properties of assemblies of nanoscale ϵ-cobalt crystals withsize range between 5 to 35 nm, embedded in a polystyrene matrix, at microwave (1–12 GHz)frequencies. We investigate the samples by transmission electron microscopy imaging,demonstrating that the particles aggregate and form chains and clusters. By using a broadbandcoaxial-line method, we extract the magnetic permeability in the frequency range from 1 to12 GHz, and we study the shift of the ferromagnetic resonance (FMR) with respect to anexternally applied magnetic field. We find that the zero-magnetic field ferromagnetic resonantpeak shifts towards higher frequencies at finite magnetic fields, and the magnitude of complexpermeability is reduced. At fields larger than 2.5 kOe the resonant frequency changes linearlywith the applied magnetic field, demonstrating the transition to a state in which the nanoparticlesbecome dynamically decoupled. In this regime, the particles inside clusters can be treated as non-interacting, and the peak position can be predicted from Kittelʼs FMR theory for non-interactinguniaxial spherical particles combined with the Landau–Lifshitz–Gilbert equation. In contrast, atlow magnetic fields this magnetic order breaks down and the resonant frequency in zeromagnetic field reaches a saturation value reflecting the interparticle interactions as resulting fromaggregation. Our results show that the electromagnetic properties of these composite materialscan be tuned by external magnetic fields and by changes in the aggregation structure.
Keywords: cobalt nanoparticles, magnetic composites, ferromagnetic resonance
(Some figures may appear in colour only in the online journal)
1. Introduction
The realization of novel materials with designed and tunableoptical, mechanical, thermal and electromagnetic properties isa major goal in nanotechnology. A promising direction is thestudy of nanocomposites, consisting of nano-scale particles(silica, Fe, Co, Ni, Al, Zn, Ti, as well as their oxides) or otherlow-dimensional structures (carbon nanotubes, graphene,DNA) embedded in a bulk matrix or polymer [1].
Nanocomposites with magnetic properties, which use mag-netic nanoparticles inserted in dielectric matrices, are ofconsiderable technological importance, due to the simplicityof fabrication and potential applications for radio-frequencyand microwave antennas, for GHz-frequency data transfercomponents, and for electromagnetic shielding [2, 3]. On thescientific side, these materials are intriguing because conceptssuch as ferromagnetic resonance (FMR), predicted almost acentury ago [4–6] and later demonstrated experimentally inbulk materials [7, 8], can now be applied to particles withnano-scale dimensions and are relevant for understanding theproperties of the resulting composite materials. The standard
Nanotechnology
Nanotechnology 25 (2014) 485707 (11pp) doi:10.1088/0957-4484/25/48/485707
5 Current affiliation: Spinverse Oy, Tekniikantie 14, FI-02150 Espoo,Finland.
0957-4484/14/485707+11$33.00 © 2014 IOP Publishing Ltd Printed in the UK1

measurement technique in FMR is narrow-band: the materialis placed in a microwave cavity whose response is monitoredwhile sweeping the external magnetizing field until the lowestquality factor (maximum of absorption) is observed. How-ever, for modern applications a broadband characterization ofthe electromagnetic properties of the material is required.Recently, non-resonant transmission line methods have beenemployed to study magnetic nanoparticles, but, with thenotable exception of magnetic fluids in the 1990s [9, 10], onlyin zero external magnetic field [11–16]. There is to date nosystematic characterization of the nano-scale and magneticproperties (including the effects of sizes, shapes, magneticdomains, aggregation, etc.) of composite materials containingmagnetic nanoparticles.
In this paper we present a comprehensive study of thebroadband microwave properties and FMR resonance ofcomposite materials comprising chemically synthesized ϵ-cobalt nanoparticles with sizes between 5 and 35 nmembedded in polystyrene (PS), both in zero and in a finitemagnetic field, including information from superconductingquantum interference device (SQUID) measurements. Theparticles are synthesized by two different methods, the hot-injection method [17] and the heating-up method [18]. Atmacroscopic scales, bulk cobalt has only two forms of latticestructures, namely hexagonal-closed-packed (hcp) and face-centered-cubic (fcc). For nanoparticles, a cubic ϵ-cobaltphase, with a structure similar to β-manganese, has beenobserved in addition to the hcp and fcc phases [19, 20], andmore recently developed chemical syntheses have allowed theproduction of ϵ-cobalt particles at specific diameters (narrowsize distribution) [21, 22]. The resonance condition of thecobalt nanocrystals is found by combining Kittelʼs FMRtheory [5, 6] with the Landau–Lifshitz–Gilbert (LLG)equation [4, 23] and various effective-medium models. Kit-telʼs theory is a valid approach under the assumption that theeddy current skin depths are larger than the typical dimensionof the particles. In Co, the skin depths in the frequency rangebetween 1 and 10 GHz are of the order of 100 nm, thereforethe nanoparticles used in our samples satisfy this requirement.We identify two distinct magnetization regimes: at highexternal magnetic fields, the FMR resonance changes linearlywith the field and the composite is well described by theKittel–LLG model, while at low magnetic field the FMRresonance saturates to a constant value. This is explained bythe existence of particle–particle magnetic interactions, whichbecome the dominant effect at small and zero external mag-netic field. Transmission electron microscopy (TEM) imagingconfirms the formation of particle aggregates in thecomposite.
2. Methods
2.1. Synthesis and TEM imaging of ϵ-cobalt nanoparticles
Spherical ϵ-cobalt nanoparticles were synthesized by ther-mally decomposing 1080 mg of dicobalt octacarbonyl(STREM, 95%) in presence of 200 mg of trioctylphosphine
oxide (Sigma-Aldrich, 99%) and 360 mg of oleic acid(Sigma-Aldrich, 99%) in 30 ml of 1, 2-dichlorobenzene(Sigma-Aldrich, 99%) under inert nitrogen atmosphere[18, 21]. The cobalt precursor was either injected into thesurfactant mixture at °180 C [17] or mixed with the surfactantsolution at room temperature and heated up to °180 C [18].No difference in particles produced by the hot-injection orheating-up methods was observed. The particle size wasadjusted by the temperature kinetics during the reaction [18],i.e. by using a higher heating rate in the heating-up method ora higher recovery rate in the hot-injection method to increasethe nucleation rate and to produce smaller particles. Theexcess surfactants were removed after synthesis by pre-cipitating the particles by adding methanol, followed byredispersing the particles into toluene. The composites werefabricated by dissolving desired amounts of PS (Sigma-Aldrich) in the nanoparticle dispersion, followed by eva-poration of the solvent to yield black solid composite mate-rials. The samples can be regarded as a two-componentcomposite, made of magnetically-active Co particles (densityρ = 8.63Co g cm−3) in a magnetically-inert PS bulk (densityρ = 1.05PS g cm−3). The amount of oleic acid left is small andits density is anyway close to that of PS (ρ = 0.89oleic acidg cm−3). Both the pure nanoparticles and thin cross-sectionsof the composite materials were analyzed by TEM (TecnaiT12 and JEOL JEM-3200FSC). The images showed that ourϵ-cobalt nanoparticles typically consists of a single crystalcore. For the high-frequency measurements, the compositematerials were compression molded at °150 C into circularpellets with a diameter of 7.0 mm and thickness of 4.0 mm. Acircular hole of 3.0 mm was drilled through each pellet toaccommodate the inner conductor of the coaxial line.
2.2. Theoretical model
The phenomenon of FMR was predicted by Landau andLifshitz in 1935 [4] and was observed experimentally morethan a decade after by Griffiths [7], and then by WA Yagerand RM Bozorth [8]. Griffith also found that the FMR doesnot occur exactly at the electron spin resonance of frequency
ω μℏ = g He B0 or ω γ= H0 , where ge is the electron g-factor,μ = ℏe m2B e is the Bohr magneton, H is the internal mag-netizing field, and γ = g e m2e e e is the electron gyromagnetic
ratio, γ π2e = 2.799 2 ×10¹⁰ Hz T−1. Immediately after, Kittel[5, 6] proposed that the FMR condition should be modifiedfrom the original Landau–Lifshitz theory by taking intoaccount the shape and crystalline anisotropy through thedemagnetizing fields.
In the case of disordered magnetic composites, the phy-sics is expected to be very complicated, due the interplay ofgeometry, anisotropy, interparticle interactions, and sampleinhomogeneities. In principle, one can attempt to give amicroscopic description of these effects and average overseveral realizations; however this approach is likely to becomplicated. Here we propose a simple phenomenologicaldescription of the composites. Similar to effective-field the-ories in physics, the idea is to construct a model that incor-porates the basic known physical processes—in this case,
2
Nanotechnology 25 (2014) 485707 K Chalapat et al

magnetization precession in an applied magnetic field anddissipation—and solve the problem using very generalmethods—linear response theory in our case. This allows uson one hand to extract the electromagnetic parameters that arerelevant for technological applications (high-frequency mag-netic permittivity and permeability), and on the other hand togive an effective quantitative description of the FMRobserved.
The starting point of the model is the observation that ifthe external magnetic field H applied is large, then the par-ticles will get strongly magnetized in the direction of theapplied field. As a result, irrespective to the configuration ofthe sample or on the geometry of particle anisotropy, thesample behaves as a collection of noninteracting domainswith magnetization rotating in synchronization around a totaleffective magnetic field = +H H Heff . In this regime, onethen expects a linear law for the resonance frequency
ω γ γ= = +( )H H H , (1)0 eff
where H incorporates the effects mentioned above. As wewill see later, the main contribution in H comes from aneffective magnetic anisotropy field HA.
The rotation of the magnetic domains is also accom-panied by energy loss, which can be accounted for throughthe Landau, Lifshitz [4] and Gilbert [23] formalism. Thedynamics of magnetization is described by the LLG equation
γ α= − × + ×
M
tM H
MM
M
t
dd
dd
. (2)s
tottot tot tot
tot
The first term on the right hand side represents the pre-cession of magnetization. The energy loss is taken intoaccount by the second term via a single damping constant α.Mtot is the magnetization of the system, and Htot is the totalmagnetizing field which includes a small microwave probefield ( ωhe ti )
= + ωH H he . (3)ttot eff
i
Demagnetizing fields can be introduced as well inequation (3) and it can be checked that for spherical symmetrythey cancel out from the final results. Similarly, the magne-tization at a given time includes the magnetization of theparticle ≈Ms and the time-varying term
= + ωM M me , (4)st
toti
where Ms is the saturation magnetization.To solve the equation, it is convenient to take the coor-
dinate z along the direction of the field Heff , which in the limitof large fields discussed above coincides with the direction ofthe magnetization Ms. The magnetic susceptibility is given byχ = ∂ ∂ = ∂ ∂⊥ m h m hx x y y, with the magnitude h of the probe
microwave field assumed much smaller than the static fields,≪h Heff . This yields a simple analytical expression for the
complex susceptibility χ χ χ= ′ − ″⊥ ⊥ ⊥i
χγ ω ω ω α
ω ω α ω ω α″ =
− −
− + +⊥
⎡⎣ ⎤⎦⎡⎣ ⎤⎦
( )( )
M 1
1 4, (5)
s 0 02 2 2
02 2 2
22
02 2
χαγ ω ω ω α
ω ω α ω ω α″ =
+ +
− + +⊥
⎡⎣ ⎤⎦⎡⎣ ⎤⎦
( )( )
M 1
1 4, (6)
s 02 2 2
02 2 2
22
02 2
where ω γ= +H H( ˜ )0 .The measured resonance frequency in the presence of
dissipation can be obtained by searching for the maximum ofequation (6). We have solved the equation χ ω∂ ″ ∂ =⊥ 0 ana-lytically, using Mathematica. The polynomial resulting fromthe derivative has six roots, of which we select the physicallyrelevant one (real and positive), and check that it correspondsto a maximum. This solution is
ω π ωα
γα
= =+
=+
+( )f H H21 1
˜ . (7)r r0
2 2
This solution is also intuitively appealing, as it corre-sponds to a zero in the first term in the denominator ofequation (6), a term which tends to increase fast if the fre-quency is detuned only slightly from the resonance.
In general, the total susceptibility isχ ω χ ω χ ω= ′ − ″( ) ( ) i ( ) and the relative permeabilityμ ω χ ω= +( ) 1 ( )Co is composed of both parallel χ∥, andperpendicular χ⊥ components. The total susceptibility is anaverage of these components, with
χ ω χ ω χ ω= +∥ ⊥⎡⎣ ⎤⎦( )
13
( ) 2 ( ) . (8)
The perpendicular component can be well described bythe LLG–Kittel theory, i.e. equations (5) and (6). The parallelcomponent is purely relaxational and usually assumed to bedescribed by the Debye model [24]
χ ωχ
ωτ= +∥∥
∥( )
(0)
1 i. (9)
Here τ τ σ=∥ 0 , where τ γα= ∥ −H( )0 A1, σ = KV k TB , V is
the average particle volume, and the effective anisotropy fieldHA and the effective anisotropy constant K can be estimatedfrom SQUID measurements (see section 2.3).
For materials with inclusions, mixing rules such asBruggeman equation [25] and the Maxwell-Garnett model[26, 27] give good results when the volume fraction of theinclusions is not too large. In the case of spherical inclusions,the Maxwell-Garnett formalism gives the following
3
Nanotechnology 25 (2014) 485707 K Chalapat et al

expression for permeability
μμ μ μ
μ μ=− − +
− − +f f
f f
2( 1) (1 2 )
( 1) (2 ), (10)r
M2
Co M
Co M
while the Bruggeman equation reads
μ μ μ
μ μ μ μ
= − + −
± + − + −
⎡⎣⎤⎦⎥
( ) ( )
(( ) ( ) )
f f
f f
14
3 1 2 3
8 3 1 2 3 , (11)
r Co M
Co M Co M2
where f is the particle volume fraction, μCo is the permeabilityof the cobalt particles, and μM is the permeability of theinsulating material.
We now show that the formula for the resonance fre-quency equation (7) remains valid also for composites, nomatter what the mixing rule is, under the condition that thematerial used for the matrix is magnetically inert. This con-dition is certainly satisfied for our samples. To prove this, letus consider an arbitrary function of the two components μMand μCo, μ μ μ μ= [ , ]r r M Co . Then
μω
μμ
μω
∂∂ =
∂∂
∂∂ , (12)r r
Co
Co
where we have used the assumption above about the matrixmaterial, namely that its spectrum is flat, μ ω∂ ∂ = 0M . Thus,the zeroes of μ ω∂ ∂r will coincide with the zeroes of μ ω∂ ∂Co ,and equation (7) can also be used for the composite. This isintuitively very clear: since the Co is the only material in thecomposite that has some magnetic properties (the FMR in thiscase), one expects that these properties and only these will beresponsible for any structure in the spectra of the compositeas well.
2.3. SQUID magnetometry
The effective anisotropy field K and the saturation magne-tization Ms can be determined from magnetic measurementsdone with a SQUID Quantum Design MPMS XL7 mag-netometer. These measurements provide as well an estimatefor the effective anisotropy field HA, for which we use thestandard result of the Stoner–Wohlfart model
μ=H K M2 sA 0 (see e.g. [3] for a simple derivation). Themeasurements were performed on small sections from theactual sample, see figure 1(a). Each section has a volume ofapproximately 1 mm3. For convenience, we will express thesaturation magnetization in the standard units of magneti-zation per unit mass (emu g−1), which is obtained from themeasurements of the weights of all the samples and theirvolume fractions. When used in the theoretical model, themagnetization is converted into units of magnetic momentper volume (A/m) by using the density of cobalt, ρ = 8.6Cog cm−3.
To determine the effective anisotropy constant K, wemeasure the ferromagnetic-superparamagnetic blockingtemperature TB from the zero-field cooled (ZFC) and field-cooled (FC) magnetization curve. Figure 1(b) shows atypical ZFC/FC curve of a ϵ-cobalt nanoparticle composite.The measurement was realized by firstly cooling the smallpiece of sample to 2 K without an external magnetic field fora ZFC measurement. At the end, the sample was freezedwith no net magnetization, due to the random magnetizationat room temperature. Next, a small field (100 Oe) wasapplied, and the magnetization (M) of the sample wasmeasured at different temperature from 2 to 400 K. As thetemperature increases, more particles go from the ferro-magnetic (blocked) to the paramagnetic phase, and alignwith the applied field. The magnetization reached a max-imum when the blocking temperature was reached.
Figure 1. The magnetic response of ϵ-cobalt nanoparticle composite measured by a SQUID magnetometer. (a) Magnetization M versusapplied magnetic field showing a saturation magnetization of about 77 emu g−1. The inset picture is the result of another section from thesame sample. (b) The ZFC–FC curve of the same sample (m denotes the magnetic moment) showing the blocking temperature above roomtemperature.
4
Nanotechnology 25 (2014) 485707 K Chalapat et al

2.4. Microwave measurements
Standard experiments on FMR such as those analyzed byKittel were done by monitoring the on-resonance response ofa microwave cavity while sweeping the external magnetizingfield. In contrast, our setup is broadband, allowing to monitorthe response at all frequencies. The complex magnetic per-meability of the cobalt samples were measured over a fre-quency range between 1 and 12 GHz by a transmission andreflection method. Prior to the measurements, a sample wasinserted inside the coaxial line (7 mm precision coaxial airline) which was placed between the poles of an electromagnet(the axis of the line being perpendicular to the magnetic field).The line was connected to the ports of a vector networkanalyzer by Anritsu 34ASF50-2 female adapters. The trans-mission/reflection signals were measured and used as theinput parameters of the reference-plane invariant algorithm toobtain the complex permittivity and permeability [28].Similar results are obtained using the short-cut method [29].
3. Results and discussion
3.1. Measurements in externally applied magnetic fields.
We start by presenting the effects of an external magnetizingfield on the FMR spectra of composites made with sphericalϵ-cobalt nanoparticles synthesized by the hot-injectionmethod [21]. We call SET-1 this first set of samples (andsimilar notations will be used for the rest of the sample sets,see table 1). We measured the relative complex magneticpermeability (μ μ μ= ′ − ″ir r r ) of these samples over a widerange of frequencies for various non-zero external static fieldsH. The material exhibits a broad resonance peak around4 GHz in a zero external field, see figure 2(a). The applicationof an external magnetic field causes the resonance to shifttowards higher frequencies, accompanied by a reduction ofthe magnetic loss peak. Interestingly, in the small field regime(below 1.5 kOe), the magnetic absorption remains almostindependent of the field at frequencies above 8 GHz.
Figure 2(b) presents a comparison between the theore-tical models and experimental results. The theoretical spectra(μ″r ) were calculated by combining the phenomenological
models: LLG–Kittel [4, 6] and Debye/LLG–Kittel [24] withthe Bruggeman effective medium model [25]. The simulationwas done with a particle volume ratio of 0.1, and an averageparticle diameter d of 16 nm. The magnetizing field
Table 1. Systematic of the nanoparticle properties of various samples fabricated and measured. Note: very small particles were observed to bepresent in all solutions; they were not included in the calculation of the average diameter, and they are therefore not subsequently included inthe estimations of the effective anisotropy, as these particles are magnetically inert.
sample set volume fraction, f (%) diameter, σ±w (nm) dispersion, σ w100 · (%) synthesis method
SET-1 10% 16 ± 5 nm 31% (polydisperse) hot injectionSET-2 4% and 11% 13.9 ± 0.6 nm 4% (monodisperse) heating-upSET-3A 4.3% 8.6 ± 1.4 nm 16% (polydisperse) heating-upSET-3B 1.9% 27.7 ± 2.7 nm 10% (intermediate) heating-upSET-3C 1.6% 32.1 ± 7.9 nm 25% (polydisperse) heating-upSET-4A N/A 5 ± 0.6 nm 12% (intermediate) hot injectionSET-4B 3.3%, 6.5%, and 6.9% 8 ± 0.8 nm 10% (intermediate) hot injectionSET-4C 2.9% and 6.7% 11 ± 0.9 nm 8% (intermediate) hot injectionSET-4D 7.7% and 8.5% 27 ± 3.5 nm 13% (intermediate) hot injection
Figure 2. (a) Imaginary magnetic permeability of a composite ofpolystyrene (PS) and ϵ-cobalt particles, at a volume fraction of 10%.(b) Theoretical predictions: LLG–Kittel (dotted lines) and Debye/LLG–Kittel (solid and dashed lines), shown in comparison with theexperimental data (discrete symbols) at high magnetic fields (⩾2.5kOe). The average particle diameter was =d 16 nm. Inset:theoretical prediction of LLG–Kittel for a wider range of fieldvalues.
5
Nanotechnology 25 (2014) 485707 K Chalapat et al

corresponds to the experimentally-measured magnetic field atthe sample (using a calibrated gaussmeter) and ranges from2.5 to 5.0 kOe. The dotted lines show the prediction of theLLG–Kittel model, equations (1), (6) and (11), with para-meters =M 64s emu g−1, =T 400B K, and α = 0.37. Thesolid and dashed lines show the prediction of the Debye/LLG–Kittel model, equations (1), (6), (9) and (11). TheDebye model (parallel susceptibility) was calculated by set-ting α = ×∥ −5 10 4 and χ =∥ (0) 104. The solid lines presentthe theoretical prediction with =M 74s emu g−1, andα = 0.37. An even better fitting with the data can be obtained(dashed lines) by allowing for a small magnetic-field depen-dence of the damping α: 0.44 ( =H 2.5 kOe), 0.40, 0.36, 0.32,0.28 and 0.24 ( =H 5 kOe) with =M 84s emu g−1.
The analysis presented in figure 2(b) suggests that bothLLG–Kittel and Debye/LLG–Kittel models can approxi-mately predict the FMR spectra in the regime where themagnetizing field is large. The LLG–Kittel (dotted lines)predicts that the imaginary part of magnetic permeability μ″should go to zero at very low frequencies. In the experimenthowever we see that the decrease in the permeability μ″ doesnot continue indefinitely at low frequencies, but instead startsto increase again below 2 GHz. This large absorption at thelow-frequency range is governed by non-resonant relaxationprocesses, which can be estimated by the Debye/LLG–Kittelmodel (solid lines).
Next, we present the permeability data in the magnetiz-ing-field domain. Four sets of data that show nearly-Lor-enzian curves are plotted in figure 3 to show the FMR peaks.The absorption spectra shown in figure 3 provide a directproof of the linear relation between the resonant microwavefrequency and the magnetizing field (inset graph of figure 3).According to equation (7) the slope of the −f Hr predicted
by the LLG–Kittel model is γ π α+ =2 (1 ) 2.622 GHz/
kOe for α = 0.37 and γ γ= e. From the data, we can estimatean average slope of 2.4 GHz/kOe, remarkably close to theideal value.
At low magnetic fields, discrepancies with respect to theLLG–Kittel theory start to appear. Figure 4 includes the low-field dependence of the FMR, showing that the linear rela-tion equation (7) valid at high fields in region (III) does nothold anymore in region (I). Extrapolating the linear depen-dence ω γ= +H H( ˜ )r of region (III) to low field values and
Figure 3. The imaginary part of magnetic permeability as a functionof the applied magnetic field H. Each color represents the peak atone microwave frequency in the external field domain. Themeasurement shows that the resonance shifts towards a highermagnetic field when the microwave frequency is increased. The insetpicture shows the linear dependence between the resonancefrequency fr of the composite and the external magnetic field H.
Figure 4. Diagram showing the relation between the resonancefrequencies (ω0) and the applied magnetizing field (H). The resonantfrequencies are obtained for each applied external field from thefitting with the LLG/Kittel–Bruggeman equations, and plotted assquare markers. In the low field regime (I), the magnetization of theparticles is random and aligns along local anisotropy fields (denotedby Ha). When chains or clusters are present in the composite, thelocal fields cause an increase of the FMR resonance frequency(continuous line). In the intermediate regime (II) and in especially inthe high field regime (III), the magnetization of the particles isdirected along the external magnetizing field, and Kittelʼs FMRtheory predicts correctly the resonance absorption spectra(dotted line).
Figure 5. Simulated imaginary part of the permeability for twomonodisperse ϵ-Co nanoparticles (10 nm) in random 3D aggregateswith surface-to-surface separation of magnetic cores of 5 nm anddamping α = 0.05.
6
Nanotechnology 25 (2014) 485707 K Chalapat et al

estimating ≈H H˜ A still yields a good estimate for theeffective magnetic anisotropy constant K (energy per unitvolume) of the order of 104 J m−3, with =M 84s emu g−1 asused in the Debye/LLG–Kittel model (dashed lines) infigure 2(b). However, in the low field (I) regime, the reso-nance occurs at a slightly higher frequency. To understandthe origin of this frequency shift, we imaged the ϵ-cobaltnanoparticles with a TEM, and found that they tend toagglomerate in clusters, see figure 5. When the particlesaggregate, the distance between them might be small enoughto create a sizable magnetic interaction. In each cluster, thedipole interactions between particles will generate additionallocal fields Ha, which are not accounted for in the non-interacting model, see e.g. equation (1). These interactioneffects become dominant in the regime of small magneticfields (I). This magnetostatic dipolar interaction betweenparticles gives an additional component to the total aniso-tropy, now proportional to M ds
3 where d is the interparticlespacing. The effect of this interaction can be obtained bysolving numerically the LLG equation using a micro-magnetic simulation package [30, 31] for two particles.When the dipolar coupling is not enabled the free particleresonance is obtained. When dipolar coupling is turned on,the resonance shows significant broadening and shiftingtoward higher frequencies due to the formation of collectiveresonance modes (see figure 6). Although this is a simplifiedmodel with only two particles, the result supports theexperimental observation that the resonance frequency isshifted to higher values (see figure 4). This is also inagreement with the result of reference [32]. The appearanceof collective behavior due to dipolar magnetic percolationand the formation of correlated agglomerates has been alsoobserved experimentally by magnetic force microscopy intwo-dimensional Co layers [33].
3.2. Measurements at zero magnetic field.
For technological application it is not always possible toapply large magnetic fields, thus one should provide a sys-tematic classification of the composites. Since we cannotcontrol the aggregation patterns of the particles, we havechosen instead to modify the structure, distribution, andmorphology of the constituent nanoparticles. The measure-ments show that this does not produce qualitative changes inthe spectra, and the results are compared with the predictionsof the LLG–Kittel complemented with the Bruggeman andMaxwell-Garnett mixing rules. These measurements are alsovery useful for technological applications, where preciseknowledge of the electromagnetic parameters of these com-posite materials is needed. The particle-level properties ofthese composites are summarized in table 1.
The monodispersed ϵ-cobalt particles of SET-2 arefabricated by the heating-up chemical synthesis method[18]. The TEM images of these particles show that theparticles have an average diameter of 14 nm, see figure 7.We measured the permeability spectra of two samples withdifferent volume fractions. The results are shown infigure 8(a). We notice that increasing the volume fractionnot only increases the magnitude of μ″r , but also shifts theresonant peak towards lower frequencies. The calculationsbased on effective medium models show that the Bruggemanequation also predicts that the resonance absorption (μ′′peak) shifts towards lower frequencies when the volumefraction is increased (see figure 8(b)). In figure 8, the
Figure 6. TEM image of Co nanoparticles within SET-1 beforemixing with polystyrene. The average diameter is in the order of16 nm (with most of the particles between 10 and 20 nm).
Figure 7. TEM images of cobalt nanoparticles in SET-2. The mainfigure shows a single crystalline core inside a particle with anaverage diameter of about 14 nm. Note the high quality of theparticle: a single crystal, with no grain boundaries, no dislocations orother defects. (a) The first inset shows the particles after being leftdry on a TEM grid. The size distribution of the particles is verynarrow (almost equal size). (b) The second inset shows thearrangement of particles inside a cluster in the composite; super-lattices (closed-pack array of particles) are seen in many parts of thecluster.
7
Nanotechnology 25 (2014) 485707 K Chalapat et al

theoretical graph was determined with an effective blockingtemperature of 400 K, reproducing correctly the resonantpeak around 3 GHz. An estimation of the effective magneticanisotropy K from the exponent of the Néel–Arrhenius law
≈ =T KV kB B 400 K yields ≈K 3.84 ×10³ J m−3 = 3.84×10⁴ erg cm−3. This effective magnetic anisotropy is lowerthan the anisotropy constant of ϵ-cobalt extracted frommagnetic measurements [34]. This is an expected limitationof our simplified model, in which a single effective super-paramagnetic blocking temperature is used as a parameter tofit the permeability spectra. For our samples, different partsof the composite may have different blocking temperature,depending on how clusters are formed. For example, it isknown that in ferromagnetic films the blocking temperaturerises when the grains coalescence, and also when the mag-netic domains grow [35].
3.3. Particle-size and morphology effects.
Next, we investigate how the particle size and particle mor-phology affects the microwave absorption properties of acomposite made from ϵ-cobalt particles. First, we study threenew composites (SET-3A, SET-3B, SET-3C), from a third setof samples (SET-3). The TEM images of the particles withinthese composites are shown in figure 9. We see that sample-Acontains spherical nanoparticles with the average diameter of
±8.6 1.4 nm, while sample-B and sample-C represent thecomposites made from bigger particles: ±27.7 2.7 nm and
±32.1 7.9 nm, respectively. The images also suggest that
Figure 8. (a) Complex magnetic permeability for SET-2. (b)Theoretical spectra calculated using Maxwell-Garnett and Brugge-man effective medium models with the volume fraction of 0.11. TheLLG/Kittel modelling was done with d = 14 nm, Ms = 150 emu g−1,TB = 400 K, α = 0.12, and = +H H˜ 0.3 kOeA (orμ μ= +H H˜ 30 mT0 0 A ), with HA estimated from μ=H K M2 sA 0
and ≈K k T VB B , where V is the average particle volume. TheDebye part was calculated using α = ×∥ −2 10 3 and χ =∥ (0) 104.
Figure 9. TEM images of ϵ-cobalt nanoparticles in SET-3. (a) SET-3A contains particles with the smallest average diameter (8.6 ±1.4 nm) showing some aggregation in the form of chains. (b) SET-3B contains particles with the average diameter of 27.7 ± 2.7 nm. (c)SET-3C contains particles of the average diameter of 32.1 ± 7.9 nm.
8
Nanotechnology 25 (2014) 485707 K Chalapat et al

the heating-up synthesis method [18] can produce ϵ-cobaltnanoparticles exhibiting facet-structures if the particle sizesare bigger than 25 nm.
The magnetic permeability of these samples (figure 10)demonstrate that faceted particles (non-spherical) exhibit asimilar FMR absorption peak as the smaller spherical parti-cles. The absorption is highest between 2 and 5 GHz. Notethat the samples that are made from bigger (25–40 nm) ϵ-cobalt particles tend to have a wider absorption bandwidth.TEM imaging confirms that nanoparticles larger than 25 nmform facet structures, see figure 11(d). These non-sphericalparticles (figures 9(b)–(c) and figure 11(d) cause their com-posites to exhibit a small absorption at 1 GHz (μ″r is less than0.1) and a large absorption (resonance) over a wide frequencyrange above 1.5 GHz.
From the measurements presented in figure 12, we noticethat composites made of low-dispersion 11 nm particles(SET-4C), see figure 11(c), have relatively large absorption atfrequencies around 1 GHz, compared to the absorption givenby larger-size particles (27 nm, SET-4D) see figure 11(d).This may be due also to the large fraction of closed-packstructures and aggregates. We also found that smaller parti-cles, with an average diameter of 5 nm (SET-4A infigure 11(a)), do not exhibit significant absorption in thisrange.
The magnetic permeability of SET-4 shows that a com-posite made from particles with diameter smaller than 8 nm isa weak absorber compared to composites made from bigger(11 to 35 nm) particles (figure 12). This observation suggeststhat the microwave absorption of SET-3A (figure 9(a)) isassociated with the FMR of minority particles that havebigger sizes (those which form chain structures). In principle,chains can form during the wet-chemical synthesis because ofthe presence of magnetic dipole interaction. Aggregation canchange the anisotropic energy and so cause the unexpected(small) change of microwave absorption spectra. Fromfigure 12, we find that the composites with the average par-ticle diameter of 27 nm exhibit high permeability (μ′ ≈ 1.7r ) at1 GHz, with the magnetic loss μ″r of less than 0.1.
In consequence, for the applications in the area of low-loss devices/materials, the experiments show that it is suffi-cient to use ϵ-cobalt facet-nanoparticles with sizes of about20 nm. For technological applications in the area of micro-wave absorbers we find that the absorption spectra are alsosensitive to the way particles arrange themselves inside thecomposite materials. The formation of superlattices inmonodispersed particles could result in large absorption overa broader bandwidth. Ideally, one should also aim at con-trolling the particle–particle interaction (distance) as well as atcreating regular (periodic) structures, which can be in
Figure 10. The imaginary part of the magnetic permeability of (a)SET-3A, (b) SET-3B, and (c) SET-3C.
Figure 11. TEM images of ϵ-cobalt nanoparticles in SET-4. (a) SET-4A contains nanoparticles with average diameter of 5 nm (b) SET-4B contains nanoparticles with average diameter of 8 nm (c) SET-4Ccontains nanoparticles with average diameter of 11 nm, and (d) SET-4D contains bigger facet-particles with average size of 27 nm.
9
Nanotechnology 25 (2014) 485707 K Chalapat et al
principle done by novel self-assembly and polymerizationtechniques. One possibility would be to use in the synthesis asurfactant with an acid group at one end and a double bond atthe other end (for example docos-21-enoic acid), in order toobtain particles with a double bond functionality. Aftermixing the particles with styrene and polymerization, the
interparticle distance will be limited to the same value for allparticles.
3.4. Effects of aging.
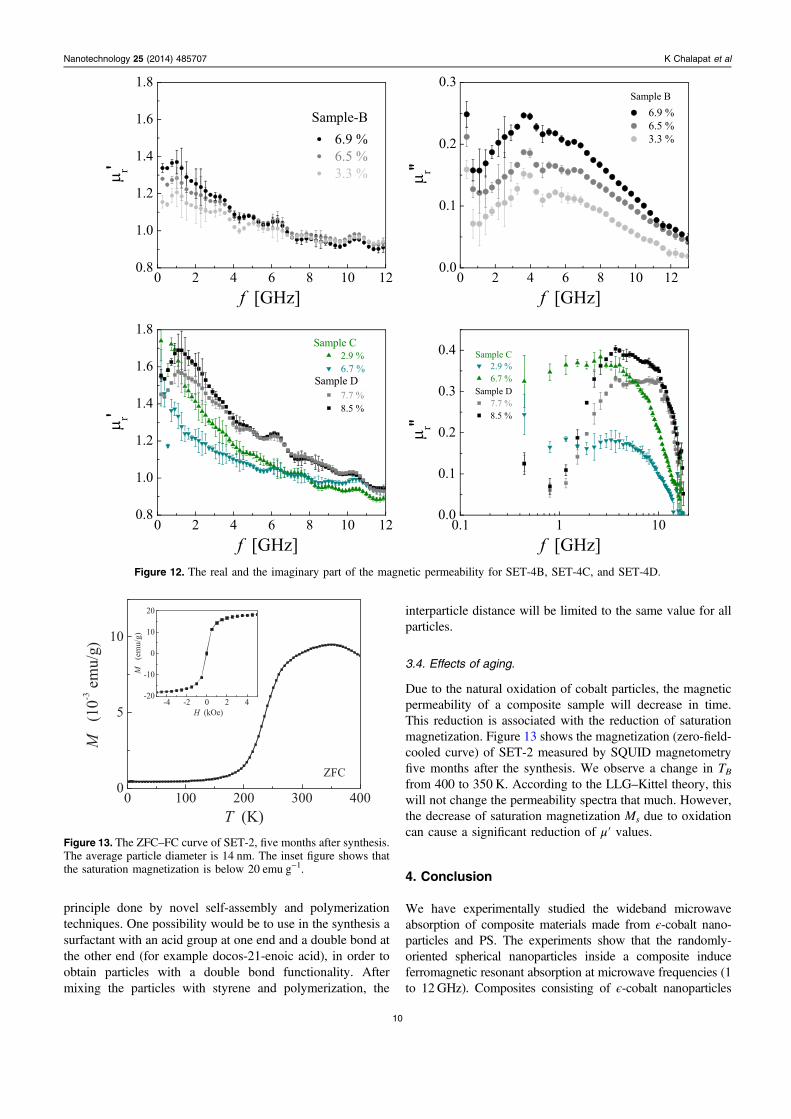
Due to the natural oxidation of cobalt particles, the magneticpermeability of a composite sample will decrease in time.This reduction is associated with the reduction of saturationmagnetization. Figure 13 shows the magnetization (zero-field-cooled curve) of SET-2 measured by SQUID magnetometryfive months after the synthesis. We observe a change in TBfrom 400 to 350 K. According to the LLG–Kittel theory, thiswill not change the permeability spectra that much. However,the decrease of saturation magnetization Ms due to oxidationcan cause a significant reduction of μ′ values.
4. Conclusion
We have experimentally studied the wideband microwaveabsorption of composite materials made from ϵ-cobalt nano-particles and PS. The experiments show that the randomly-oriented spherical nanoparticles inside a composite induceferromagnetic resonant absorption at microwave frequencies (1to 12GHz). Composites consisting of ϵ-cobalt nanoparticles
Figure 12. The real and the imaginary part of the magnetic permeability for SET-4B, SET-4C, and SET-4D.
Figure 13. The ZFC–FC curve of SET-2, five months after synthesis.The average particle diameter is 14 nm. The inset figure shows thatthe saturation magnetization is below 20 emu g−1.
10
Nanotechnology 25 (2014) 485707 K Chalapat et al
within the size range between 8 and 35 nm, either mono-dispersed or polydispersed, exhibit resonant absorption whichpeaks in the frequency range between 2 and 6 GHz. Particles ofsmaller sizes, especially the ones below 5 nm, do not havesignificant response to the microwave field in this frequencyrange. The permeability spectra is well described, especially athigh-magnetizing fields, by the LLG–Kittel equation and theeffective medium model (Bruggeman or Maxwell-Garnett). Atzero-magnetizing field, the LLG–Kittel equation and theeffective medium model predicts magnetic resonance at lowerfrequencies compared to the experimental values. We analyzethis finding qualitatively by dividing the magnetic response ofnanoparticles into three regimes, namely low-field, inter-mediate-field, and high-field. In case of polydispersed ϵ-cobaltparticles with sizes of about 10 nm, the high field regimebegins at a magnetizing field of about 3 kOe.
For technological applications, our results demonstratethat the absorption spectra of composites made with eithermonodispersed and polydispersed particles can be tuned bythe application of an external magnetic field. Also, for high-μlow-loss applications around 1 GHz a good choice are faceted(non-spherical) particles with sizes of about 27 to 35 nm.Medium-size monodispersed spherical particles (10–20 nm)are good as microwave absorbers, particularly if aggregatesare formed. Our measurement results show that in this casethe absorption capability of the material is increased, thusdecreasing the amount of material needed for fabrication ofabsorbers and filters. This suggests an alternative route tofunctionalizing these materials through the control of thearrangement of particles, which could be used for engineeringtunable microwave circuits and RF components without theneed of a magnetic field.
Acknowledgments
We thank M Sarjala, W Skowronski, S van Dijken, A Savin,and J Seitsonen for discussions and technical advice. Thisproject was supported by Thailand Commission on HigherEducation, the Academy of Finland (projects 118122, 141559and 135135), and by the Finnish Funding Agency for Tech-nology and Innovation (TEKES) under the NanoRadio pro-ject. This work was done under the Center of Excellence‘Low Temperature Quantum Phenomena and Devices’ (pro-ject 250280) of the Academy of Finland, and it used the AaltoUniversity Nanomicroscopy Center (Aalto-NMC) and theCryohall (Low Temperature Laboratory) premises.
References
[1] Ajayan P M, Schadler L S and Braun P V 2003 NanocompositeScience and Technology (Weinheim: Wiley)
[2] Chen L F, Ong C K, Neo C P, Varadan V V and Varadan V K2005 Microwave Electronics: Measurement and MaterialsCharacterization (New York: Wiley)
[3] Timonen J V I, Ras R H A, Ikkala O, Oksanen M, Seppälä E,Chalapat K, Li J and Paraoanu G S 2010 Magneticnanocomposites at microwave frequencies Trends inNanophysics: Theory, Experiment, Technology (EngineeringMaterials) ed V Barsan and A Aldea (Berlin: Springer)pp 257–85
[4] Landau L and Lifshitz E 1935 Phys. Z. Sow. 8 153[5] Kittel C 1947 Phys. Rev. 71 270[6] Kittel C 1948 Phys. Rev. 73 155[7] Griffiths J H E 1946 Nature 158 670[8] Yager W A and Bozorth R M R M 1948 Phys. Rev. 72 80[9] Fannin P C, Charles S W and Relihan T 1996 J. Magn. Magn.
Mater. 162 319[10] Fannin P C and Charles S W 1999 J. Magn. Magn. Mater. 196-
197 586[11] Wu L Z, Ding J, Jiang H B, Neo C P, Chen L F and Ong C K
2006 J. Appl. Phys. 99 083905[12] Hong Z, Yong Y, Fu-Sheng W, Hai-Bo Y, Dong Z and
Fa-Shen L 2009 Chin. Phys. Lett. 26 017501[13] Neo C P, Yang Y and Ding J 2010 J. Appl. Phys. 107 083906[14] Yang R B, Liang W L and Lin C K 2011 J. Appl. Phys. 109
07D722[15] Longgang Yan Y, Wang J, Han X, Ren Y, Liu Q and Li F 2010
Nanotechnology 21 095708[16] Yong Y, Cai-Ling X, Liang Q, Xing-Hua L and Fa- Shen L
2010 Chin. Phys. Lett. 27 057501[17] Puntes V F, Krishnan K M and Alivisatos A P 2001 Science
291 2115[18] Timonen J V I, Seppälä E, Ikkala O and Ras R H A 2011
Angew. Chem. Int. Ed. 50 2080[19] Dinega D P and Bawendi M G 1999 Angew. Chem. Int. Ed.
38 1788[20] Sun S and Murray C B 1999 J. Appl. Phys. 85 4325[21] Puntes V F 2001 Appl. Phys. Lett. 78 2187[22] Xia Y, Xiong Y, Lim B and Skrabalak S E 2009 Angew. Chem.
Int. Ed. 48 60103[23] Gilbert T L 2004 IEEE Trans. Magn. 40 3443[24] Fannin P C, Relihan T and Charles S W 1997 Phys. Rev. B 55
14423[25] Bruggeman D A G 1935 Ann. Phys. 416 665[26] Garnett J C M 1904 Phil. Trans. R. Soc. 203 385[27] Mallet P, Guerin C A and Sentenac A 2005 Phys. Rev. B. 72
014205[28] Chalapat K, Sarvala K, Li J and Paraoanu G S 2009 IEEE
Trans. Microw. Theory Tech. 57 2257[29] Vepsäläinen A, Chalapat K and Paraoanu G S 2013 IEEE
Trans. Instrum. Meas. 62 2503[30] Fischbacher T, Franchin M, Bordignon G and Fangohr H 2007
IEEE Trans. Magn. 43 2896[31] Timonen J V I 2013 Collective dynamics in near-field coupled
magnetic nanocrystals at microwave frequencies submitted[32] Buznikov N A, Iakubov I T, Rakhmanov A L and
Sboychakov A O 2005 J. Magn. Magn. Mater. 293 938[33] Puntes V F, Gorostiza P, Aruguete D M, Bastus N G and
Alivisatos A P 2004 Nat. Mater. 3 263[34] Puntes V F and Krishnan K M 2001 IEEE Trans. Magn.
37 2210[35] Frydman A and Dynes R 1999 Solid State Commun. 110
485490
11
Nanotechnology 25 (2014) 485707 K Chalapat et al