Ferrielectric-paraelectric phase transitions in layered ...
20
1 Ferrielectric-paraelectric phase transitions in layered CuInP 2 S 6 and CuInP 2 S 6 - In 4/3 P 2 S 6 heterostructures: A Raman spectroscopy and X-ray diffraction study Rahul Rao, 1* Ryan Selhorst, 1,2 Benjamin S. Conner, 3,4 Michael A. Susner 1 1 Materials and Manufacturing Directorate, Air Force Research Laboratory, 2179 12 th Street, Wright-Patterson Air Force Base, Ohio 45433, USA 2 UES Inc., Dayton, Ohio 45433, USA 3 Sensors Directorate, Air Force Research Laboratory, 2241 Avionics Circle, Wright-Patterson Air Force Base, Ohio 45433, USA 4 National Research Council, Washington, D.C. 20001, USA Abstract CuInP2S6 (CIPS) is an emerging layered material that exhibits ferrielectric ordering well above room temperature (Curie temperature TC ~ 315 K). When synthesized with Cu deficiencies, CIPS spontaneously segregates into CuInP2S6 and In4/3P2S6 domains (CIPS-IPS), which form self- assembled heterostructures within the individual lamellae. This re-structuring and resultant chemical pressure raises the Curie temperature and, depending on the Cu concentration, can be up to ~340 K for the highest Cu deficiency. In both CIPS and CIPS-IPS, the loss of polarization through the ferrielectric-paraelectric transition is driven by the movement of Cu ions within the lattice. Here we uncover the microscopic origins underpinning the phase transitions in pure CIPS and CIPS-IPS (Cu0.4In1.2P2S6) by performing a temperature-dependent Raman and XRD study. We measured the frequencies and linewidths of various cation and anion phonon modes and compared them to the extracted atomic positions from the refinement of XRD data. Our analysis shows that in addition to the Cu cation movement, the anion octahedral cages experience * Correspondence – [email protected]
Transcript of Ferrielectric-paraelectric phase transitions in layered ...

1
Ferrielectric-paraelectric phase transitions in layered CuInP2S6 and CuInP2S6-
In4/3P2S6 heterostructures: A Raman spectroscopy and X-ray diffraction study
Rahul Rao,1* Ryan Selhorst,1,2 Benjamin S. Conner,3,4 Michael A. Susner1
1Materials and Manufacturing Directorate, Air Force Research Laboratory, 2179 12th Street,
Wright-Patterson Air Force Base, Ohio 45433, USA
2UES Inc., Dayton, Ohio 45433, USA
3Sensors Directorate, Air Force Research Laboratory, 2241 Avionics Circle, Wright-Patterson Air
Force Base, Ohio 45433, USA
4National Research Council, Washington, D.C. 20001, USA
Abstract
CuInP2S6 (CIPS) is an emerging layered material that exhibits ferrielectric ordering well above
room temperature (Curie temperature TC ~ 315 K). When synthesized with Cu deficiencies, CIPS
spontaneously segregates into CuInP2S6 and In4/3P2S6 domains (CIPS-IPS), which form self-
assembled heterostructures within the individual lamellae. This re-structuring and resultant
chemical pressure raises the Curie temperature and, depending on the Cu concentration, can be
up to ~340 K for the highest Cu deficiency. In both CIPS and CIPS-IPS, the loss of polarization
through the ferrielectric-paraelectric transition is driven by the movement of Cu ions within the
lattice. Here we uncover the microscopic origins underpinning the phase transitions in pure CIPS
and CIPS-IPS (Cu0.4In1.2P2S6) by performing a temperature-dependent Raman and XRD study. We
measured the frequencies and linewidths of various cation and anion phonon modes and
compared them to the extracted atomic positions from the refinement of XRD data. Our analysis
shows that in addition to the Cu cation movement, the anion octahedral cages experience
* Correspondence – [email protected]
2
significant strains as they deform to accommodate the redistribution of Cu ions upon heating.
This results in several discontinuities in peak frequencies and linewidths close to 315 K in CIPS.
In the CIPS-IPS heterostructure, this process begins around 315 K and ends around 330 K.
I. Introduction
Functional two-dimensional (2D) metal thio- and seleno-phosphates (collectively
abbreviated here as MTPs) have recently come into focus due to their novel ferroelectric,
ferromagnetic and multi-ferroic properties [1,2]. Some of these layered materials exhibit their
properties down to the monolayer limits [3]; the prospect of combining functionalities of various
layers in heterostructure devices, as well as uncovering new physics in moiré structures through
rotational alignments makes MTPs very attractive candidates for next-generation functional
devices [4–8]. The ferroic ordering exhibited in many MTP materials leads to temperature- and
pressure-dependencies of these phase transitions; these are potentially tunable through
dimensionality reduction, doping, strain etc. [1,9,10]. It is therefore important to study the
microscopic origins of these phase transitions in order to engineer their properties for
applications.
CuInP2S6 (CIPS), a room-temperature ferrielectric, has been well-studied of late due to
its chemical stability and its high Curie temperature (TC ) of ~ 315 K in the bulk phase [11]. The
CIPS crystal is monoclinic (space group Cc in the ferrielectric state and C2/c in the paraelectric
state) and each layer consists of S6 octahedra circumscribing either metal cations or P-P pairs (Fig.
1a). The S6 octahedra and the phosphorus atoms together form a structural backbone comprised
of [P2S6]4- ethane-like anion groups that ionically pair with hexagonally arranged Cu and In
cations. The metal cations may occupy three off-center sites within these octahedra as a result
of a second-order Jahn-Teller instability associated with the d10 electron configuration of Cu [12]
- an off-center up or down site, a nearly-central site and a third, tetragonal site that extends into
the interlayer van der Waals gap. Below TC, the polar ordering of the Cu-sublattice (where they
prefer the up (Cu1) position within the octahedra) results in a small displacement of the In3+ ions
from the center of the lamellae an unequal distribution of the Cu+ ions result in the predominant

3
occupation of the up position within the octahedra while the In3+ ions are displaced slightly
downwards from the octahedral center. The up (Cu1) and down (Cu2) positions are denoted by
the fully- and half-filled circles in Fig. 1a. This antiparallel displacement of the Cu+ and In3+ ions
accounts for the room temperature out-of-plane ferrielectric polarization in CIPS [13].
Upon heating, the material becomes paraelectric above ~315 K. The transition has been
found to be of the first order and is driven predominantly by Cu ion movement within the
lamellae [14,15]. Above TC, the Cu+ ions equally occupy both the up and down positions within
the S6 octahedra. At higher temperatures, the occupation of the Cu+ ions extends to the interlayer
tetragonal sites, i.e. inside the van Der Waals gap; this results in a significant lattice expansion in
addition to ionic conductivity [16].
When CIPS is synthesized with Cu deficiencies, the material spontaneously phase
separates into ferrielectric CuInP2S6 and paraelectric In4/3P2S6 (IPS) domains within the same
single crystal with a common [P2S6]4- anionic foundation [17,18]. The IPS domains are embedded
in a CIPS matrix and consist of an ordered arrangement of In3+ ions and vacant sites in the
octahedral network. Within the CIPS-IPS heterostructure, the IPS domains exert a chemical
pressure over the CIPS domains, and the interplay between the two sub-lattices leads to an
increase in the overall TC to ~335 K for highly Cu-deficient CIPS [17,18].
While the presence of a phase transition has been observed previously using various
techniques such as calorimetry, X-ray diffraction (XRD), nuclear magnetic resonance (NMR)
spectroscopy, Raman spectroscopy and dielectric measurements [14,15,19], there are open
questions regarding the microscopic origins of the phase transitions in pure CuInP2S6 and in the
CuInP2S6/In4/3P2S6 heterostructures. For example, modeling suggests that the Jahn-Teller effect
in CIPS is mediated by vibronic coupling, i.e. the coupling between d electrons in Cu and optical
phonons [20]. Moreover, temperature-dependent optical absorption studies [21] have hinted
at variations in the P-S and P-P bonds (and by extension their vibrational modes) due to the
hopping of the Cu+ ions within the lattice on heating up to TC.
Electron-phonon coupling effects as well as lattice distortions can be measured using
Raman spectroscopy. A previous temperature-dependent Raman study on CIPS single crystals

4
showed preliminary evidence for coupling between P2S6 deformation modes and Cu ion
vibrations [19]. However, a detailed analysis of temperature-dependent peak frequencies,
intensities, and widths in CIPS and CIPS-IPS remains lacking. Temperature-dependent Raman
scattering has also been used to study phase transitions in other layered MTP materials such as
CuCrP2S6 [22], CdPS3 [23] and MnPS3 [24]. Here we present temperature-dependent Raman
spectroscopy and XRD measurements on CIPS and CIPS-IPS (with the composition Cu0.4In1.2P2S6)
single crystals. In particular, we focus on the anion vibrational modes (librations, deformation
and stretching) and observe discontinuities in the frequencies, linewidths and intensities of
several peaks in the vicinity of the phase transition temperatures. We correlate the trends in the
vibrational modes to changes in the interatomic distances extracted from Rietveld refinement of
the temperature-dependent XRD data. The loss of polarity above TC is accompanied by structural
changes in both CIPS and CIPS-IPS, with the overall expansion of the unit cell. Local cation
movements within the lamellae result in P-S, In-S, and S-S bond stretching, which are quantified
by XRD data refinements and tied to changes in the Raman signatures.
II. Methods
2.1 Synthesis and Chemical Characterization
The details of the crystal synthesis have been described elsewhere [17]. Briefly, single
crystals of CIPS and CIPS-IPS were synthesized through vapor transport techniques. The precursor
In2S3 (prepared from Alfa Aesar Puratronic elements, 99.999% purity, sealed in an evacuated
fused silica ampoule and reacted at 950 oC for 48 hours) was reacted with the necessary
quantities of Cu (Alfa Aesar Puratronic ), P (Alfa Aesar Puratronic ) and S (Alfa Aesar Puratronic )
to obtain the pure phase CuInP2S6 as well as a Cu-deficient composition Cu0.4In1.2P2S6. The starting
materials were sealed in a fused silica ampoule with ~80 mg of I2 and loaded into a tube furnace.
The furnace was slowly ramped to 775oC over a period of 24 hours and held at that temperature
for 100 hours. Afterwards, the samples were cooled at a rate of 20oC/hr. to ensure the growth of
large domains.
5
2.2 Optical Characterization
Temperature-dependent Raman spectra were collected using a Renishaw inVia Raman
microscope. The incident excitation (785 nm) was directed on to the sample through a Coherent
Thz-micro low-frequency module (enabling measurements down to 10 cm-1), and coupled to the
Raman microscope with a fiber optic cable. A 50x magnification long-working distance objective
lens was used to focus on to CIPS and CIPS-IPS crystals mounted within a temperature stage
(Microptik). The laser power was set to a few mW to avoid additional heating from the laser.
Raman spectra were collected with 15 s acquisition times and 4 accumulations. Spectral analysis
was performed (in Igor Pro) by cubic spline baseline subtraction and Lorentzian peak fitting to
extract frequencies and linewidths.
2.3 Structural Characterization
High-resolution synchrotron data from CIPS were obtained at beamline 11-ID-C at the
Advanced Photon Source at Argonne National Laboratory. The samples were ground into a fine
powder and carefully placed in a Cu cylinder to avoid issues related to preferential orientation in
this layered material. This cylinder was in turn placed in a Linkam THM600 microscope stage and
purged with inert gas. X-ray patterns were taken from low temperatures to high (with DT < 0.2
K). The patterns were collected in transmission mode using a Perkin-Elmer large area detector;
the wavelength of the synchrotron radiation was 0.117418 Å. The collected 2D patterns were
processed into conventional 1D patterns (Fit2d software) which were then refined using the
FullProf suite [25].

6
III. Results and Discussion
Representative unpolarized, room temperature Raman spectra (collected with 785 nm
laser excitation) from CIPS and CIPS-IPS are shown in Fig. 1b. The fitted peaks are shown below
the raw data and the overall fitted spectra are overlaid on top. Both spectra exhibit several peaks
between 10 – 650 cm-1 that consist of external (<150 cm-1) and internal (>150 cm-1) vibrations.
These vibrational modes can be divided into five frequency ranges, and in general are common
to all layered MTPs. In the case of CIPS, the lowest frequency peaks (<50 cm-1) and those between
50 and 150 cm-1 correspond to cation and anion librations, respectively. Among the cation
vibrational modes, the lower and higher frequency peaks correspond to vibrations from Cu and
In, respectively. The peaks between 150 – 200 cm-1 and 200 – 350 cm-1 correspond to
deformations of the S-P-P and S-P-S bonds [d(SPP) and d(SPS)] within the octahedra, respectively
(or collectively, anion deformation modes). Some of the anion deformation modes are sensitive
to the type of metal cation present and its location within its S6 octahedron. In particular, the
peak around 320 cm-1 can be attributed to distortions within the S6 cage occupied by the Cu+
ions [19]. The high intensity peak around 370 cm-1 is attributed to P-P stretching [n(PP)], and the
PS3 stretching modes [n(PS3)] appear around 450 and 550 cm-1. In the range of modes between
500 – 600 cm-1, the lower (higher) frequency modes are influenced by Cu (In) cations [26,27].
The spectrum from CIPS-IPS also exhibits peaks grouped in the same frequency ranges
described above, but is much more complex than the CIPS spectrum and we resolve 27 peaks as
seen in Fig. 1b. The larger number of peaks in the CIPS-IPS Raman spectrum can be attributed to
the CIPS and IPS sub-lattices within the material. A comparison of the CIPS-IPS Raman spectrum
with spectra from the pure phase CIPS and IPS (Ref. [28]) enables us to identify peaks unique to
both sub-lattices. In the low-frequency region (<90 cm-1), we observe two groups of peaks. Similar
to CIPS, the lower and higher frequency peaks within this frequency range can be attributed to
Cu and In vibrational modes, respectively. Above 100 cm-1, there are four peaks in the anion
libration region between 100 and 140 cm-1, two of which can be attributed to CIPS (100 and 114
cm-1) and the other two to IPS (127 and 140 cm-1). Similarly, between 200 and 300 cm-1, the two
most intense peaks appear at ~255 and ~270 cm-1, and can be assigned to IPS and CIPS,
respectively. A peak at 300 cm-1 in the CIPS-IPS spectrum does not appear in the CIPS spectrum,
7
thus it can be attributed to anion deformation in IPS. Furthermore, as previously mentioned, the
peak at 320 cm-1 can be assigned to anion deformation in CIPS. Among the anion stretching
modes, the two highest frequency peaks around 580 and 610 cm-1 do not appear in the CIPS
spectrum and therefore can be attributed to IPS.
Next, we describe the temperature dependence of the Raman peaks in CIPS and CIPS-IPS,
focusing on the vicinity of the two Curie temperatures (TC ~ 315 and 330 K for Cu0InP2S6 and
Cu0.4In1.2P2S6 [17], respectively). As described above, the loss of polarity across the ferrielectric-
paraelectric phase transition is primarily driven by the movement of the Cu+ ions as they
redistribute between the up and down positions within the S6 octahedra. This can be observed
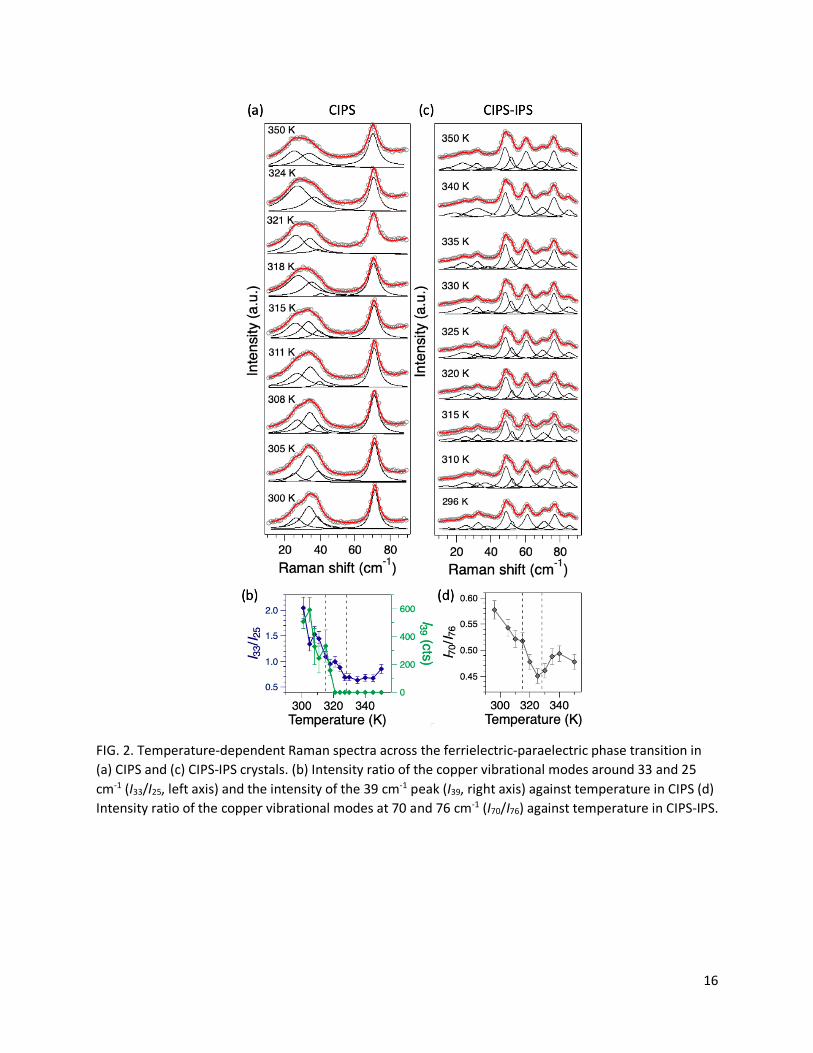
in the changes in the low-frequency cation vibrational modes. Fig. 2a shows a waterfall plot with
Raman spectra between 300 and 350 K from a CIPS crystal. Here we focus on the low-frequency
range (10 – 90 cm-1), which exhibits two peaks, with the lower (higher) frequency peak
corresponding to the Cu (In) extended translational modes. Temperature-dependent Raman
spectra over the full measured range (10 – 650 cm-1) are included in the Supplemental Material,
Figs. S1 and S2 [29]. The low frequency peak centered around 35 cm-1 in the room temperature
spectrum can be deconvoluted into three Lorentzian peaks; the individual peaks are shown below
the raw data, with the overall fit overlaid on the raw spectra. The three low-frequency modes
appear around 25, 33 and 39 cm-1 at room temperature, and are attributed to Cu+ ion translations
within the lattice. The peak around 70 cm-1 is likewise attributed to translations of In3+ ions [19].
Typically, all Raman vibrational modes exhibit redshifts in peak frequencies as well as
broadening with increasing temperature due to lattice anharmonicity and thermal
expansion [30,31]. In the case of the three Cu+ modes in CIPS, we see either an anomalous
blueshift in frequencies or they remain constant upon heating until the TC is reached, around 315
K. Above TC, these peak frequencies redshift slightly with increasing temperature. This anomalous
trend in Cu peak frequencies in CIPS has been observed previously and is discussed in Ref. [19].
Interestingly, however, our data reveals a change in peak intensities across TC that has not been
previously reported. With increasing temperature, we see an overall redshift of the spectral
lineshape with the lowest frequency peak (~25 cm-1 at 300 K) increasing in intensity. In addition,
the peak around 39 cm-1 drops sharply in intensity and disappears above TC. These trends are

8
shown in Fig. 2b, which plots the ratio of intensity of the peak around 33 cm-1 to the peak at 25
cm-1 (I33/I25, left axis in Fig. 2b) against temperature. Also plotted in Fig. 2b are vertical dashed
lines denoting the two Curie temperatures at 315 and 330 K for CIPS and CIPS-IPS, respectively.
The I33/I25 ratio steadily decreases with temperature upon heating, and, interestingly, levels off
above 330 K. The intensity of the 39 cm-1 peak, on the other hand, drops sharply with increasing
temperature and the peak cannot be resolved above 320 K. These dramatic changes in peak
intensities around TC reflect the significant changes within the CIPS lattice due to Cu+ ion
movement/redistribution, eventually resulting in a loss of ferrielectric polarization above 315 K.
Since the In3+ ions do not drastically shift across the lamella like the Cu+ ions across the phase
transition temperature, we do not expect to see any anomalous jumps in frequencies or
intensities in the In vibrational mode at 70 cm-1. As expected, it exhibits a monotonic redshift in
frequency and broadening with increasing temperature, without any anomalous change in peak
intensity. Note that the In3+ ions do move in order to accommodate the higher occupation of the
Cu+ ions in the down positions across TC. This affects the In-S bond distances, and will be discussed
later.
The corresponding temperature-dependent low-frequency Raman spectra from CIPS-IPS
are shown in Fig. 2c. As described above, these spectra exhibit many more peaks compared to
CIPS-IPS due to the two sub-lattices within the lamellae. Other than the expected temperature-
dependent redshifts in peak frequencies, the lowest frequency peaks, which correspond to the
Cu vibrational modes, do not exhibit any anomalous trends across the TC in CIPS-IPS (330 K). We
also do not see any significant variations in peak intensities like those observed in CIPS (Fig. 2b).
However, one peak stands out – the intensity of a vibrational mode at 70 cm-1 decreases sharply
around 330 K relative to neighboring peaks. The trend is shown in Fig. 2d, which plots the ratio
of the intensity of the 70 cm-1 peak to the neighboring peak at 76 cm-1 (I70/I76). The I70/I76 ratio
experiences a sharp dip around 330 K, and increases slightly above TC. The origin of this peak is
unknown; however, by comparing with the CIPS Raman spectrum (Fig. 1b), we can tentatively
attribute the 70 cm-1 peak to extended vibrations due to the In3+ ions in the IPS lattice. In our
previous study we showed that the lattice parameters of the CIPS sub-lattice increase sharply
across the phase transition temperatures, and the most significant increase occurs for the c

9
lattice parameters, i.e. perpendicular to the layers [18]. A discontinuity in the c lattice parameter
of the IPS sub-lattice can also be observed around 330 K, reflecting interfacial effects between
the two chemical phases. These effects are likely responsible for our observed intensity variations
for the 70 cm-1 peak.
While the loss of polarization can be primarily attributed to Cu+ ion occupancy, their
redistribution on heating also affects the surrounding P and S bonds within the octahedra. These
effects should be observable through the anion deformation and stretching modes. To this end,
we analyzed the temperature-dependent frequencies and widths (full-width at half-maximum
intensity) of several anion vibrational modes in CIPS and CIPS-IPS. Below, we discuss the
temperature-dependences of three peaks, which are the most prominent features in the Raman
spectra. As labeled in Fig. 1b, they correspond to S-P-S deformations [d(SPS)], around 260 cm-1 in
CIPS and CIPS-IPS), P-P stretching [n(PP), around 375 cm-1] and the high-frequency PS3 stretching
mode [n(PS3), around 560 cm-1]. Fig. 3 plots the temperature dependence of the frequencies and
widths of these three peaks. In all the figures, we show the two Curie temperatures for CIPS (315
K) and CIPS-IPS (330 K) as dashed vertical lines. Note that the Lorentzian peak fitting revealed the
peaks in CIPS-IPS to consist of two sub-peaks that can be attributed to contributions from the
CIPS and the IPS sub-lattices. Owing to the closeness in frequencies, and being consistent with
the assignments of the low-frequency cation vibrations, we assign the lower and higher
frequency peak to the CIPS and IPS sub-lattices in CIPS-IPS, respectively.
The temperature-dependence (between 300 and 350 K) of the frequencies and widths of
the S-P-S deformation [d(SPS)] modes are shown in Figs. 3a and 3b, respectively. As expected, all
peaks exhibit an anharmonic redshift in frequency with increasing temperature. In addition, the
d(SPS) mode in CIPS (red triangles in Fig. 3a) exhibits a clear and sharp decrease in frequency at
315 K, and continues to redshift up to 350 K. On the other hand, we see a discontinuity (albeit
subtle) in the frequency of the CIPS peak from CIPS-IPS (black circles in Fig. 2a) at 330 K. The sharp
decrease in the CIPS peak frequencies across TC can be attributed to tensile strains developed
within the lamellae as the S6 octahedra deform while trying to accommodate the movement and
equal occupancy of the Cu+ ions in the up and down positions within the octahedra. Concomitant

10
to the frequency of the d(SPS) mode in CIPS, the width also exhibits a sharp narrowing above 315
K (Fig. 3b). And unlike the subtle discontinuities in the frequencies of the d(SPS) modes of CIPS-
IPS, the peak widths of the two d(SPS) modes in CIPS-IPS exhibit noticeable discontinuities at 330
K (Fig. 3b), with the lower frequency CIPS sub-lattice peak experiencing peak sharpening and the
higher frequency IPS sub-lattice peak experiencing peak broadening. Typically, peak sharpening
and broadening are associated with an increase or loss in crystallinity, respectively. The
contrasting effects observed in CIPS-IPS could therefore be related to the deformations
experienced by the sub-lattices as they exert chemical pressure on each other upon heating.
The effect of Cu+ ion redistribution on the chalcogen backbone is perhaps clearest in the
temperature-dependent frequency and width of the PP stretching mode [n(PP)] as shown in Figs.
3c and 3d. The n(PP) mode in CIPS (red triangles in Fig. 3c) exhibits a sharp increase in frequency
just above 315 K, followed by anharmonic redshift with increasing temperature up to 350 K. The
sharp increase can be attributed to a shortening of the P-P bond owing to compressive stresses
as the Cu+ ions redistribute between the up and down positions within the octahedra. In CIPS-
IPS, we observe a blueshift of the n(PP) mode at 315 K, which continues up to the TC of CIPS-IPS
(330 K), followed by redshifted frequencies. This is seen for both of the n(PP) modes in the CIPS
and IPS sub-lattices (black and blue data in Fig. 3c, respectively). The steady increases in n(PP)
peak frequencies between 315 and 330 K suggest compressive strain (or shortening) in the P-P
bonds in both CIPS and IPS sub-lattices. On heating, this strain begins at the TC of CIPS and ends
at the TC of CIPS-IPS. This shows that, even though the loss of polarization occurs around 330 K
in CIPS-IPS, structural changes begin at a lower temperature. Since CIPS-IPS consists of CIPS and
IPS sub-lattices, the P-P bonds within the octahedra apparently shorten continuously as the sub-
lattices expand, culminating in the transition around 330 K. The widths of all three peaks (Fig. 3d)
exhibit broadening with temperature, with a slight discontinuity observed in the width of the
CIPS peak across its TC at 315 K (red open triangles in Fig. 3d). The width of the n(PP) peak from
the IPS sub-lattice in CIPS-IPS exhibits an anomalous decrease between 315 and 330 K (blue open
circles in Fig. 3d). This behavior could be attributed to changes in crystallinity due to the
restructuring of the CIPS and IPS sub-lattices with increasing temperature.

11
In the high frequency region, the n(PS3) peak in CIPS increases in frequency up to TC, above
which it redshifts with temperature (Fig. 3e). The width of the n(PS3) peak experiences a
significant jump across TC (Fig. 3f), followed by a steady increase with temperature. These trends
suggest significant strains in the P-S bonds, likely as a result of increasing Cu+ ion movement with
temperature. In the case of CIPS-IPS, the effects of temperature on the n(PS3) peaks are subtler.
The n(PS3) peak frequencies in both CIPS and IPS sub-lattices exhibit slight discontinuities around
330 K (Fig. 3f), while the width of the n(PS3) peak in IPS exhibits an anomalous decrease between
315 and 330 K (Fig. 3f), similar to the width of the n(PP) peak from the IPS sub-lattice (Fig. 3d). In
addition to trends in the frequencies and widths, we also observed changes in intensities of some
of the anion vibrational modes. In CIPS the anion deformation mode at 320 cm-1 and libration
mode at 100 cm-1 experience a sharp decrease in intensity with increasing temperature. Above
TC, these intensities become constant. A similar behavior is seen in CIPS-IPS for the high frequency
mode at 558 cm-1 [n(PS3) peak in the CIPS sub-lattice], which decreases in intensity relative to the
mode at 565 cm-1, as well as the anion libration mode at 100 cm-1. These intensity trends are
included in the Supplemental Material, Fig. S3.
Further insights into the anomalous frequency and width trends presented in Fig. 3 can
be obtained from temperature-dependent XRD data. Crystallographic data were obtained by
performing Rietveld refinements on temperature-dependent XRD patterns collected upon
heating CIPS powder samples. Some of these XRD data have been published previously in
Ref. [18]. From these data, we extracted the distances between the various S atoms in the
octahedra, as well as P-S and In-S distances. To make the refinements stable, we were forced to
fix the P positions in this analysis. Nonetheless, the other data provide valuable insights into the
trends observed in the Raman peak frequencies and widths. The temperature-dependent
(between 295 – 350 K) S-S, P-S and In-S distances within a single octahedron in a lamella are
presented in Fig. 4, with the data points corresponding to the top and bottom of the octahedra
plotted as open and filled data, respectively. The corresponding atom numbering (S1, P1 etc.) is
shown in Fig. 1a.
12
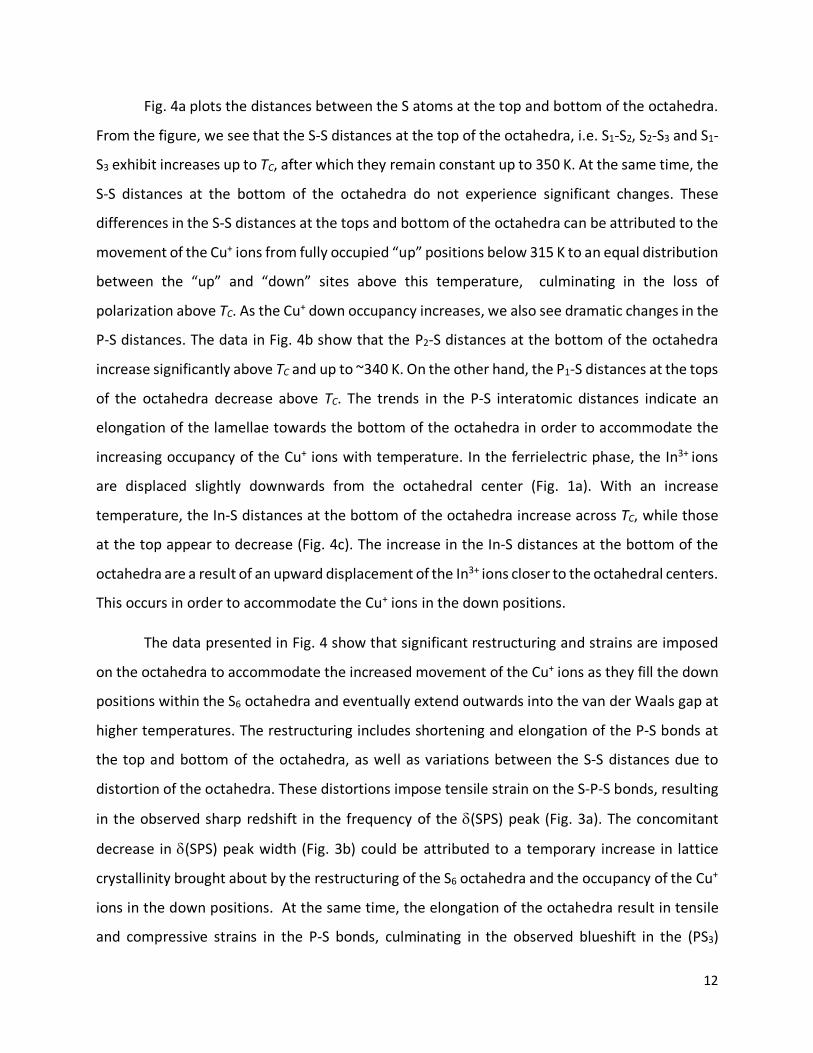
Fig. 4a plots the distances between the S atoms at the top and bottom of the octahedra.
From the figure, we see that the S-S distances at the top of the octahedra, i.e. S1-S2, S2-S3 and S1-
S3 exhibit increases up to TC, after which they remain constant up to 350 K. At the same time, the
S-S distances at the bottom of the octahedra do not experience significant changes. These
differences in the S-S distances at the tops and bottom of the octahedra can be attributed to the
movement of the Cu+ ions from fully occupied “up” positions below 315 K to an equal distribution
between the “up” and “down” sites above this temperature, culminating in the loss of
polarization above TC. As the Cu+ down occupancy increases, we also see dramatic changes in the
P-S distances. The data in Fig. 4b show that the P2-S distances at the bottom of the octahedra
increase significantly above TC and up to ~340 K. On the other hand, the P1-S distances at the tops
of the octahedra decrease above TC. The trends in the P-S interatomic distances indicate an
elongation of the lamellae towards the bottom of the octahedra in order to accommodate the
increasing occupancy of the Cu+ ions with temperature. In the ferrielectric phase, the In3+ ions
are displaced slightly downwards from the octahedral center (Fig. 1a). With an increase
temperature, the In-S distances at the bottom of the octahedra increase across TC, while those
at the top appear to decrease (Fig. 4c). The increase in the In-S distances at the bottom of the
octahedra are a result of an upward displacement of the In3+ ions closer to the octahedral centers.
This occurs in order to accommodate the Cu+ ions in the down positions.
The data presented in Fig. 4 show that significant restructuring and strains are imposed
on the octahedra to accommodate the increased movement of the Cu+ ions as they fill the down
positions within the S6 octahedra and eventually extend outwards into the van der Waals gap at
higher temperatures. The restructuring includes shortening and elongation of the P-S bonds at
the top and bottom of the octahedra, as well as variations between the S-S distances due to
distortion of the octahedra. These distortions impose tensile strain on the S-P-S bonds, resulting
in the observed sharp redshift in the frequency of the d(SPS) peak (Fig. 3a). The concomitant
decrease in d(SPS) peak width (Fig. 3b) could be attributed to a temporary increase in lattice
crystallinity brought about by the restructuring of the S6 octahedra and the occupancy of the Cu+
ions in the down positions. At the same time, the elongation of the octahedra result in tensile
and compressive strains in the P-S bonds, culminating in the observed blueshift in the (PS3)
13
stretching mode (Fig. 3e) and large increase in its width (Fig. 3f) across the ferrielectric-
paraelectric transition temperature. The variations in the P-S distances are also likely responsible
for the compression of the P-P bonds and the striking trends observed in the frequencies and
widths of the n(PP) peak (Figs. 3c and 3d). Here, we have only presented temperature-dependent
XRD data from CIPS. Owing to the much more complex crystal structure of CIPS-IPS, i.e. CIPS and
IPS sub-lattices, and the shrinking and expansion of their domains upon heating [18], extraction
of the temperature-dependent interatomic distances in CIPS-IPS is a significantly challenging
task. Nonetheless, the similarities in the Raman spectral trends between CIPS and CIPS-IPS
suggest that our analysis would be valid for CIPS-IPS as well.
IV Conclusion
In this work, we studied the ferrielectric-paraelectric phase transitions in CIPS and CIPS-
IPS using Raman spectroscopy. Analysis of the temperature-dependent spectra revealed several
structural changes that accompany Cu+ ion redistribution and that result in a loss of polarization
above TC (~315 K). In CIPS we observed the intensity modulations in the low-frequency Cu
vibrational modes, as well as anomalous jumps in the frequencies and linewidths of the anion
vibrations. These trends were correlated with the interatomic distances obtained from
temperature-dependent XRD data, and showed elongation of the S6 octahedral cages and
significant strains in the S-S and P-S bonds. In CIPS-IPS observed changes in the Raman spectra
beginning around 315 K and extending to its TC around 330 K. These results show that, while loss
of polarization occurs above 330 K in Cu0.4In1.2P2S6, structural changes begin at a lower
temperature. Our combined Raman spectroscopy and XRD study revealed a microscopic view
into the ferrielectric-paraelectric phase transition processes in CIPS and CIPS-IPS. Furthermore,
our work also hints at approaches to manipulate lattice strains and thereby ferroelectric behavior
in CIPS and other related functional 2D materials.

14
Acknowledgements
We acknowledge support through the United States Air Force Office of Scientific Research
(AFOSR) LRIRs 19RXCOR052 and 18RQCOR100, AOARD-MOST Grant Number F4GGA21207H002
and the National Research Council Postdoctoral Fellowship award. Use of the Advanced Photon
Source, an Office of Science User Facility operated for the U.S. Department of Energy (DOE) Office
of Science by Argonne National Laboratory, was supported by the U.S. DOE under Contract No.
DE-AC02-06CH11357.

15
FIG. 1. (a) Schematic of the unit cell of CuInP2S6, with all the atoms labeled. (b) Room-temperature Raman spectra (785 nm excitation) from CuInP2S6 (CIPS, bottom spectrum) and CuInP2S6-In4/3P2S6 (CIPS-IPS, top spectrum). The spectra were fitted to Lorentzian peaks and are plotted under the raw data (open circles) along with the overall fit (solid line) overlaid on top.
16
FIG. 2. Temperature-dependent Raman spectra across the ferrielectric-paraelectric phase transition in (a) CIPS and (c) CIPS-IPS crystals. (b) Intensity ratio of the copper vibrational modes around 33 and 25 cm-1 (I33/I25, left axis) and the intensity of the 39 cm-1 peak (I39, right axis) against temperature in CIPS (d) Intensity ratio of the copper vibrational modes at 70 and 76 cm-1 (I70/I76) against temperature in CIPS-IPS.

17
FIG 3. Temperature-dependent frequencies (filled data points) of the (a) d(SPS), (c) n(PP), (e) n(PS)3 peaks and widths (hollow data points) of the (b) d(SPS), (d) n(PP), (f) n(PS3) peaks.

18
FIG. 4. Temperature-dependent distances between (a) S-S, (b) P-S, and (c) In-S atoms, calculated from Rietveld refinement of the XRD data. The data corresponding to the top and bottom of the S6 octahedra are shown as open and filled data, respectively.
19
References
[1] M. A. Susner, M. Chyasnavichyus, M. A. McGuire, P. Ganesh, and P. Maksymovych, Metal Thio- and Selenophosphates as Multifunctional van Der Waals Layered Materials, Adv. Mater. 29, 1602852 (2017).
[2] M. A. McGuire, Cleavable Magnetic Materials from van Der Waals Layered Transition Metal Halides and Chalcogenides, J. Appl. Phys. 128, 110901 (2020).
[3] F. Liu, L. You, K. L. Seyler, X. Li, P. Yu, J. Lin, X. Wang, J. Zhou, H. Wang, H. He, S. T. Pantelides, W. Zhou, P. Sharma, X. Xu, P. M. Ajayan, J. Wang, and Z. Liu, Room-Temperature Ferroelectricity in CuInP2S6 Ultrathin Flakes, Nat. Commun. 7, 12357 (2016).
[4] J. R. Schaibley, H. Yu, G. Clark, P. Rivera, J. S. Ross, K. L. Seyler, W. Yao, and X. Xu, Valleytronics in 2D Materials, Nat. Rev. Mater. 1, 1 (2016).
[5] X. Liu and M. C. Hersam, 2D Materials for Quantum Information Science, Nat. Rev. Mater. 4, 669 (2019).
[6] N. R. Glavin, R. Rao, V. Varshney, E. Bianco, A. Apte, A. Roy, E. Ringe, and P. M. Ajayan, Emerging Applications of Elemental 2D Materials, Adv. Mater. 32, 1904302 (2020).
[7] Z. Guan, H. Hu, X. Shen, P. Xiang, N. Zhong, J. Chu, and C. Duan, Recent Progress in Two-Dimensional Ferroelectric Materials, Adv. Electron. Mater. 6, 1900818 (2020).
[8] C. Gong and X. Zhang, Two-Dimensional Magnetic Crystals and Emergent Heterostructure Devices, Science 363, (2019).
[9] E. Gilioli and L. Ehm, High Pressure and Multiferroics Materials: A Happy Marriage, IUCrJ 1, 6 (2014). [10] R. Rao, B. S. Conner, R. Selhorst, and M. A. Susner, Pressure-Driven Phase Transformations and
Phase Segregation in Ferrielectric CuInP2S6-In4/3P2S6 Self-Assembled Heterostructures, ArXiv210813497 Cond-Mat Physicsphysics (2021).
[11] S. Zhou, L. You, H. Zhou, Y. Pu, Z. Gui, and J. Wang, Van Der Waals Layered Ferroelectric CuInP2S6: Physical Properties and Device Applications, Front. Phys. 16, 13301 (2020).
[12] T. Babuka, K. Glukhov, Yu. Vysochanskii, and M. Makowska-Janusik, Layered Ferrielectric Crystals CuInP2S(Se)6: A Study from the First Principles, Phase Transit. 92, 440 (2019).
[13] V. Maisonneuve, V. B. Cajipe, A. Simon, R. Von Der Muhll, and J. Ravez, Ferrielectric Ordering in Lamellar CuInP2S6., Phys. Rev. B Condens. Matter 56, 10860 (1997).
[14] A. Simon, J. Ravez, V. Maisonneuve, C. Payen, and V. Cajipe, Paraelectric-Ferroelectric Transition in the Lamellar Thiophosphate CuInP2S6, Chem. Mater. 6, 1575 (1994).
[15] X. Bourdon, A.-R. Grimmer, and V. Cajipe, 31P MAS NMR Study of the Ferrielectric− Paraelectric Transition in Layered CuInP2S6, Chem. Mater. 11, 2680 (1999).
[16] V. Maisonneuve, J. M. Reau, M. Dong, V. B. Cajipe, C. Payen, and J. Ravez, Ionic Conductivity in Ferroic CuInP2S6 and CuCrP2S6, Ferroelectrics 196, 257 (1997).
[17] M. A. Susner, A. Belianinov, A. Y. Borisevich, Q. He, M. Chyasnavichyus, P. Ganesh, H. Demir, D. Sholl, D. L. Abernathy, M. A. McGuire, and P. Maksymovych, High TC Layered Ferrielectric Crystals by Coherent Spinodal Decomposition, ACS Nano 9, 12365 (2015).
[18] M. A. Susner, M. Chyasnavichyus, A. A. Puretzky, Q. He, B. S. Conner, Y. Ren, D. A. Cullen, P. Ganesh, D. Shin, H. Demir, J. W. McMurray, A. Y. Borisevich, P. Maksymovych, and M. A. McGuire, Cation–Eutectic Transition via Sublattice Melting in CuInP2S6/In4/3P2S6 van Der Waals Layered Crystals, ACS Nano 11, 7060 (2017).
[19] Yu. M. Vysochanskii, V. A. Stephanovich, A. A. Molnar, V. B. Cajipe, and X. Bourdon, Raman Spectroscopy Study of the Ferrielectric-Paraelectric Transition in Layered CuInP2S6, Phys. Rev. B 58, 9119 (1998).
[20] D. Bercha, S. Bercha, K. Glukhov, and M. Sznajder, Electron-Phonon Interaction as a Mechanism of Phase Transition in the CuInP2S,Sub>6</sub> Crystal, Acta Phys. Pol. A 126, 1143 (2014).
20
[21] I. P. Studenyak, V. V. Mitrovcij, G. S. Kovacs, M. I. Gurzan, O. A. Mykajlo, Y. M. Vysochanskii, and V. B. Cajipe, Disordering Effect on Optical Absorption Processes in CuInP2S6 Layered Ferrielectrics, Phys. Status Solidi B 236, 678 (2003).
[22] M. A. Susner, R. Rao, A. T. Pelton, M. V. McLeod, and B. Maruyama, Temperature-Dependent Raman Scattering and x-Ray Diffraction Study of Phase Transitions in Layered Multiferroic CuCrP2S6, Phys. Rev. Mater. 4, 104003 (2020).
[23] T. Sekine, A. Ohmamiuda, Y. Tanokura, C. Makimura, and K. Kurosawa, Raman-Scattering Study of Structural Phase Transition in Layered Compound CdPS3, J. Phys. Soc. Jpn. 62, 800 (1993).
[24] A. V. Peschanskii, T. Ya. Babuka, K. E. Glukhov, M. Makowska-Janusik, S. L. Gnatchenko, and Yu. M. Vysochanskii, Raman Study of a Magnetic Phase Transition in the MnPS3 Single Crystal, Low Temp. Phys. 45, 1082 (2019).
[25] C. Frontera and J. Rodriguez-Carvajal, FULLPROF as a New Tool for Flipping Ratio Analysis: Further Improvements., Phys. B 350, e731 (2004).
[26] Y. Mathey, R. Clement, J. P. Audiere, O. Poizat, and C. Sourisseau, Structural, Vibrational and Conduction Properties of a New Class of Layer-Type MPS3 Compounds: MnII
1−xMI2xPS3 (MI = Cu, Ag),
Solid State Ion. 9–10, 459 (1983). [27] O. Poizat, C. Sourisseau, and Y. Mathey, Vibrational Study of Metal-Substituted MPS3 Layered
Compounds: MII1− xMI
2xPS3 with MII= Mn, Cd, and MI= Cu (X= 0.13) or Ag (X= 0.50): I. Comprehensive Infrared and Raman Analysis and Structural Properties, J. Solid State Chem. 72, 272 (1988).
[28] C. Sourisseau, J. P. Forgerit, and Y. Mathey, Vibrational Study of the [P2S4−6] Anion, of Some MPS3
Layered Compounds (M = Fe, Co, Ni, In2/3), and of Their Intercalates with [Co(η5-C5H5)2+] Cations, J.
Solid State Chem. 49, 134 (1983). [29] See Supplemental Material at (Link) for Temperature-Dependent Raman Spectra from CIPS and CIPS-
IPS across the Full Frequency Range. [30] R. A. Cowley, Raman Scattering from Crystals of the Diamond Structure, J. Phys. 26, 659 (1965). [31] P. G. Klemens, Anharmonic Decay of Optical Phonons, Phys. Rev. 148, 845 (1966).