Ferguson plc Annual Report and Accounts 2017 · 2019-10-24 · Ferguson plc is a public company...
57
Financials 86 Group income statement 87 Group statement of comprehensive income 87 Group statement of changes in equity 88 Group balance sheet 89 Group cash flow statement 90 Notes to the consolidated financial statements 128 Independent auditor’s report to the members of Ferguson plc 134 Company profit and loss account 134 Company statement of changes in equity 135 Company balance sheet 136 Notes to the Company financial statements Strategic report Governance Financials Other information 85 Ferguson plc Annual Report and Accounts 2017
Transcript of Ferguson plc Annual Report and Accounts 2017 · 2019-10-24 · Ferguson plc is a public company...

Financials 86 Group income statement
87 Group statement of comprehensive income
87 Group statement of changes in equity
88 Group balance sheet
89 Group cash flow statement
90 Notes to the consolidated financial statements
128 Independent auditor’s report to the members of Ferguson plc
134 Company profit and loss account
134 Company statement of changes in equity
135 Company balance sheet
136 Notes to the Company financial statements
Strategic report Governance Financials Other information
85Ferguson plc Annual Report and Accounts 2017

Restated*
Notes
2017Before
exceptional items
£m
2017Exceptional
items (note 5)
£m
2017Total
£m
2016Before
exceptional items
£m
2016Exceptional
items (note 5)
£m
2016Total
£m
Revenue 3 15,224 – 15,224 12,549 – 12,549
Cost of sales (10,814) (2) (10,816) (8,956) (1) (8,957)
Gross profit 4,410 (2) 4,408 3,593 (1) 3,592
Operating costs:
amortisation of acquired intangible assets (64) – (64) (48) – (48)
impairment of goodwill and acquired intangible assets – – – (94) – (94)
other (3,351) 231 (3,120) (2,736) (3) (2,739)
Operating costs (3,415) 231 (3,184) (2,878) (3) (2,881)
Operating profit 3, 4 995 229 1,224 715 (4) 711
Finance costs 6 (43) – (43) (36) – (36)
Share of result of associate 15 (1) – (1) – – –
Profit before tax 951 229 1,180 679 (4) 675
Tax 7 (270) (22) (292) (211) 1 (210)
Profit from continuing operations 681 207 888 468 (3) 465
(Loss)/profit from discontinued operations 8 (47) (58) (105) 31 154 185
Profit for the year 634 149 783 499 151 650
Attributable to:
Shareholders of the Company 634 149 783 508 151 659
Non-controlling interests – – – (9) – (9)
634 149 783 499 151 650
Earnings per share 10
Continuing operations and discontinued operations
Basic earnings per share 311.6p 256.4p
Diluted earnings per share 309.4p 254.8p
Continuing operations only
Basic earnings per share 353.4p 183.4p
Diluted earnings per share 350.8p 182.3p
Alternative performance measures
Trading profit from ongoing operations 2, 3 1,032 827
Trading profit from non-ongoing operations 2, 3 27 30
Trading profit from continuing operations 2, 3 1,059 857
EBITDA before exceptional items 2 1,199 971
Headline earnings per share 2, 10 288.9p 234.7p
* Restated to present the Nordic businesses as discontinued operations in accordance with IFRS 5.
86 Ferguson plc Annual Report and Accounts 2017
Group income statementYear ended 31 July 2017

Notes2017
£m
Restated 2016
£m
Profit for the year 783 650
Other comprehensive income:
Items that may be reclassified subsequently to profit or loss:
Exchange gain on translation of overseas operations(a) 26 495
Exchange loss on translation of borrowings and derivatives designated as hedges of overseas operations(a) (6) (107)
Cumulative currency translation differences on disposals(a) (49) (125)
Tax credit/(charge) on items that may be reclassified to profit or loss(b) 7 1 (7)
Items that will not be reclassified subsequently to profit or loss:
Actuarial loss on retirement benefit plans(b) 26 (1) (120)
Tax (charge)/credit on items that will not be reclassified to profit or loss(b) 7, 26 (1) 25
Other comprehensive (expense)/income for the year (30) 161
Total comprehensive income for the year 753 811
Total comprehensive income/(expense) attributable to:
Continuing operations 850 744
Discontinued operations (97) 67
Total comprehensive income for the year 753 811
(a) Impacting the translation reserve. (b) Impacting retained earnings.
Group statement of changes in equity
Reserves
Notes
Share capital
£m
Share premium
£m
Translation reserve
£m
Treasury shares
£m
Own shares
£m
Retained earnings
£m
Non- controlling
interest£m
Total equity
£m
At 1 August 2015 29 42 117 (240) (63) 2,715 7 2,607
Profit for the year – – – – – 659 (9) 650
Other comprehensive income/(expense) – – 263 – – (102) – 161
Total comprehensive income/(expense) – – 263 – – 557 (9) 811
Purchase of own shares by Employee Benefit Trusts 27 – – – – (14) – – (14)
Issue of own shares by Employee Benefit Trusts 27 – – – – 20 (19) – 1
Credit to equity for share-based payments 28 – – – – – 20 – 20
Purchase of Treasury shares 27 – – – (300) – – – (300)
Disposal of Treasury shares 27 – – – 24 – (10) – 14
Dividends paid 9 – – – – – (238) – (238)
At 31 July 2016 29 42 380 (516) (57) 3,025 (2) 2,901
Profit for the year – – – – – 783 – 783
Other comprehensive expense – – (29) – – (1) – (30)
Total comprehensive (expense)/income – – (29) – – 782 – 753
Purchase of own shares by Employee Benefit Trusts 27 – – – – (6) – – (6)
Issue of own shares by Employee Benefit Trusts 27 – – – – 15 (15) – –
Credit to equity for share-based payments 28 – – – – – 22 – 22
Tax relating to share-based payments 7 – – – – – 4 – 4
Disposal of Treasury shares 27 – – – 31 – (10) – 21
Dividends paid 9 – – – – – (259) – (259)
At 31 July 2017 29 42 351 (485) (48) 3,549 (2) 3,436
Strategic report Governance Financials Other information
87Ferguson plc Annual Report and Accounts 2017
Group statement of comprehensive incomeYear ended 31 July 2017

Notes2017
£m2016
£m
Assets
Non-current assets
Intangible assets: goodwill 12 888 902
Intangible assets: other 13 182 202
Property, plant and equipment 14 808 1,434
Interests in associates 15 124 –
Financial assets 11 23
Retirement benefit assets 26 3 –
Deferred tax assets 16 121 127
Trade and other receivables 17 226 212
Derivative financial assets 18 15 20
2,378 2,920
Current assets
Inventories 1,816 2,017
Trade and other receivables 17 2,093 2,207
Current tax receivable 2 –
Derivative financial assets 18 5 11
Cash and cash equivalents 19 1,911 940
5,827 5,175
Assets held for sale 20 1,298 56
Total assets 9,503 8,151
Liabilities
Current liabilities
Trade and other payables 21 2,279 2,634
Current tax payable 88 101
Bank loans and overdrafts 22 1,627 701
Obligations under finance leases 24 3 4
Provisions 25 81 88
Retirement benefit obligations 26 8 9
4,086 3,537
Non-current liabilities
Trade and other payables 21 180 163
Bank loans 22 831 1,175
Obligations under finance leases 24 4 27
Deferred tax liabilities 16 9 65
Provisions 25 120 133
Retirement benefit obligations 26 16 138
1,160 1,701
Liabilities held for sale 20 821 12
Total liabilities 6,067 5,250
Net assets 3,436 2,901
Equity
Share capital 27 29 29
Share premium 42 42
Reserves 3,367 2,832
Equity attributable to shareholders of the Company 3,438 2,903
Non-controlling interest (2) (2)
Total equity 3,436 2,901
The accompanying notes are an integral part of these consolidated financial statements. The consolidated financial statements on pages 86 to 127 were
approved and authorised for issue by the Board of Directors on 2 October 2017 and were signed on its behalf by:
John Martin Mike PowellGroup Chief Executive Chief Financial Officer
88 Ferguson plc Annual Report and Accounts 2017
Group balance sheetAs at 31 July 2017

Notes2017
£m2016
£m
Cash flows from operating activities
Cash generated from operations 29 1,115 1,019
Interest received 3 2
Interest paid (56) (41)
Tax paid (310) (193)
Net cash generated from operating activities 752 787
Cash flows from investing activities
Acquisition of businesses (net of cash acquired) 30 (256) (113)
Disposals of businesses (net of cash disposed of) 31 231 9
Purchases of property, plant and equipment (153) (187)
Proceeds from sale of property, plant and equipment and assets held for sale 19 56
Purchases of intangible assets (25) (31)
Disposals of financial assets 17 –
Net cash used in investing activities (167) (266)
Cash flows from financing activities
Purchase of own shares by Employee Benefit Trusts 27 (6) (14)
Purchase of Treasury shares 27 – (300)
Proceeds from the sale of shares by Employee Benefit Trusts 27 – 1
Proceeds from the sale of Treasury shares 27 21 14
Proceeds from borrowings and derivatives 339 585
Repayments of borrowings (464) (591)
Finance lease capital payments (5) (4)
Dividends paid to shareholders 9 (259) (238)
Net cash used by financing activities (374) (547)
Net cash generated/(used) 211 (26)
Effects of exchange rate changes (15) 18
Net increase/(decrease) in cash, cash equivalents and bank overdrafts 196 (8)
Cash, cash equivalents and bank overdrafts at the beginning of the year 248 256
Cash, cash equivalents and bank overdrafts at the end of the year 444 248
2017 £m
2016 £m
Cash, cash equivalents and bank overdrafts at the end of the year in the Group balance sheet 32 411 248
Cash, cash equivalents and bank overdrafts in assets held for sale 20 33 –
Cash, cash equivalents and bank overdrafts at the end of the year 444 248
Strategic report Governance Financials Other information
89Ferguson plc Annual Report and Accounts 2017
Group cash flow statementYear ended 31 July 2017

1 – Accounting policies and critical estimates and judgementsBasis of preparation
The consolidated financial statements have been prepared in accordance with International Financial Reporting Standards (“IFRS”) as adopted by the
European Union, including interpretations issued by the International Accounting Standards Board (“IASB”) and its committees.
Ferguson plc is a public company limited by shares incorporated in Jersey under the Companies (Jersey) Law 1991 and is headquartered in Switzerland.
The Company changed its name from Wolseley plc to Ferguson plc on 31 July 2017.
The consolidated financial statements have been prepared on a going concern basis (see page 41) and under the historical cost convention as modified
by the revaluation of financial assets and liabilities held for trading.
The consolidated financial statements are presented in sterling, which is the presentational currency of the Group. The Group’s presentational currency
will change from sterling to US dollars from 1 August 2017.
The Nordic businesses have been reclassified as discontinued operations in accordance with IFRS 5 “Non-current Assets Held for Sale and
Discontinued Operations” and the consolidated financial statements and affected notes for the year ended 31 July 2016 have been restated to reflect this.
Accounting developments and changes
At the time of this report a number of accounting standards have been published, but not yet applied.
IFRS 9 “Financial Instruments” and IFRS 15 “Revenue from Contracts with Customers” are effective for the Group from the year ending 31 July 2019.
The Group has completed an initial assessment of the impact of IFRS 9 and IFRS 15 and it is expected adoption will not have a material impact on the
Group’s consolidated financial results.
IFRS 16 “Leases”, which is yet to be endorsed by the EU, is effective for the Group for the year ending 31 July 2020. IFRS 16 represents a significant
change for the treatment of leases in the lessee’s financial results. Lessees will be required to apply a single model to recognise a lease liability and asset
for all leases, including those classified as operating leases under current accounting standards (note 34), unless the underlying asset has a low value or
the lease term is 12 months or less.
On adoption of IFRS 16 there will be a significant change to the financial statements, as each lease will give rise to a right of use asset, which will be
depreciated on a straight-line basis, and a lease liability, with the related interest charge. This will replace existing lease balances on the balance sheet
and charges to the income statement.
The Group continues to assess the full impact of IFRS 16, however the impact will depend on the transition approach and the contracts in effect at the
time of adoption. It is therefore not yet practicable to provide a reliable estimate of the financial impact on the Group’s consolidated financial results.
Choices permitted by IFRS
The Group has elected to apply hedge accounting to some of its financial instruments.
Accounting policies
Note 37 details the principal accounting policies applied in the preparation of the consolidated financial statements.
Critical accounting judgements
Exceptional ItemsNote 2 provides a definition of exceptional items. The classification of exceptional items requires significant management judgement to determine the
nature and intentions of a transaction. Note 5 provides further details on current year exceptional items.
Pensions and other post-retirement benefitsThe Group operates defined benefit pension plans in the UK and in a number of overseas locations that are accounted for using methods that rely on
actuarial assumptions to estimate costs and liabilities for inclusion in the financial statements. The Group takes advice from independent actuaries relating
to the appropriateness of the assumptions.
The cost of providing benefits is determined annually using the Projected Unit Credit Method, which includes actuarial assumptions for discount rates,
expected salary and pension increases, inflation and life expectancy and are disclosed in note 26. The discount rate used is the yield at the valuation
date on high quality corporate bonds that have a maturity approximating to the terms of the pension obligations. Significant judgement is required when
setting the criteria from which the yield curve is derived.
Sources of estimation uncertainty
In applying the Group’s accounting policies, various transactions and balances are valued using estimates or assumptions. Should these estimates or
assumptions prove incorrect there may be an impact on the following year’s financial statements. The Group believes that the estimates and assumptions
that have been applied would not give rise to a material impact within the next financial year.
90 Ferguson plc Annual Report and Accounts 2017
Notes to the consolidated financial statementsYear ended 31 July 2017

2 – Alternative performance measuresThe Group uses alternative performance measures (“APMs”), which are not defined or specified under IFRS. The Group believes that these APMs, which
are not considered to be a substitute for IFRS measures, provide additional helpful information. APMs are consistent with how business performance is
planned, reported and assessed internally by management and the Board and provide comparable information across the Group.
The Group reports some financial measures net of businesses or branches that have been disposed of, closed or classified as held for sale and uses the
following terminology:
Non-ongoing operations: businesses and groups of branches, which do not meet the criteria to be classified as discontinued operations under IFRS 5
“Non-current Assets Held for Sale and Discontinued Operations”, which have been disposed of, closed or classified as held for sale. In 2017, the Group’s
Swiss business, Tobler, and a small Industrial business in the USA, Endries, have been classified as non-ongoing.
Ongoing operations: continuing operations excluding non-ongoing operations.
A reconciliation between ongoing and continuing operations is shown below.
Revenue Trading profit
2017 £m
Restated2016
£m2017
£m
Restated2016
£m
Ongoing operations 14,878 12,146 1,032 827
Non-ongoing operations 346 403 27 30
Continuing operations 15,224 12,549 1,059 857
Discontinued operations 2,100 2,136 63 59
Constant exchange rates
The Group measures some financial metrics on both a reported basis and at constant exchange rates. The constant exchange rate basis re-translates the
prior year at the current year exchange rate to eliminate the effect of exchange rate fluctuations when comparing information year-on-year.
Ongoing revenue Ongoing trading profit
£m % £m %
Reported 2016 at 2016 exchange rates 12,146 827
Impact of exchange rates 1,550 122
Reported 2016 at 2017 exchange rates 13,696 949
Constant currency growth 1,182 8.6 83 8.7
Reported 2017 14,878 1,032
Like-for-like revenue growth
Management uses like-for-like revenue growth as it provides a consistent measure of the percentage increase/decrease in revenue year-on-year,
excluding the effect of currency exchange, acquisitions and disposals, trading days and branch openings and closures.
Ongoing revenue
£m %
Reported 2016 at 2017 exchange rates 13,696
Like-for-like revenue growth 818 6.0
Opened and closed branches 10
Trading days 60
Acquisitions and divestments 294
Reported 2017 14,878
Exceptional items
Exceptional items are those which are considered significant by virtue of their nature, size or incidence. These items are presented as exceptional within
their relevant income statement category to assist in the understanding of the trading and financial results of the Group as these types of cost do not form
part of the underlying business.
Examples of items that are considered by the Directors for designation as exceptional items include, but are not limited to:
– material restructuring costs within a segment incurred as part of a significant change in strategy or due to the closure of a large part of a business and
are not expected to be repeated on a regular basis.
– significant costs incurred as part of the integration of an acquired business and which are considered to be material.
– gains or losses on disposals of businesses are considered to be exceptional in nature as they do not reflect the performance of the trading business.
– costs or credits arising as a result of material regulatory and litigation matters.
If provisions have been made for exceptional items in previous years, then any reversal of these provisions is treated as exceptional.
Exceptional items for the current and prior year are disclosed in note 5.
Strategic report Governance Financials Other information
91Ferguson plc Annual Report and Accounts 2017
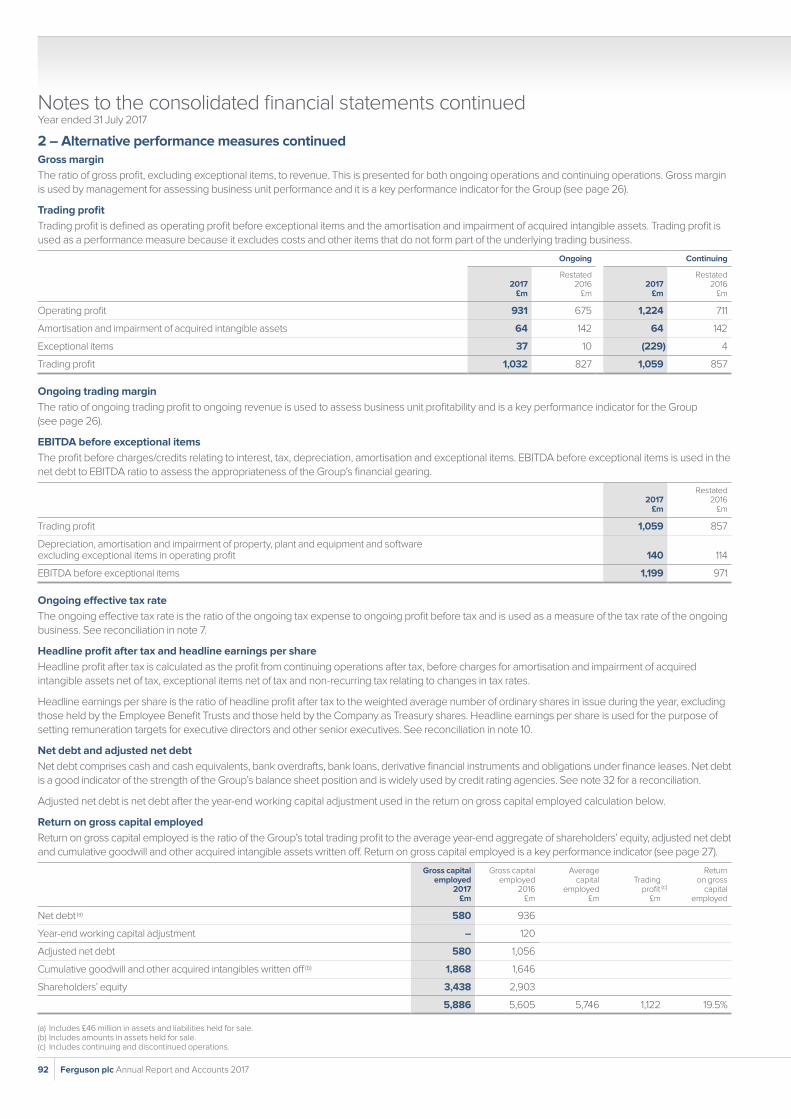
2 – Alternative performance measures continued Gross margin
The ratio of gross profit, excluding exceptional items, to revenue. This is presented for both ongoing operations and continuing operations. Gross margin
is used by management for assessing business unit performance and it is a key performance indicator for the Group (see page 26).
Trading profit
Trading profit is defined as operating profit before exceptional items and the amortisation and impairment of acquired intangible assets. Trading profit is
used as a performance measure because it excludes costs and other items that do not form part of the underlying trading business.
Ongoing Continuing
2017 £m
Restated2016
£m2017
£m
Restated2016
£m
Operating profit 931 675 1,224 711
Amortisation and impairment of acquired intangible assets 64 142 64 142
Exceptional items 37 10 (229) 4
Trading profit 1,032 827 1,059 857
Ongoing trading margin
The ratio of ongoing trading profit to ongoing revenue is used to assess business unit profitability and is a key performance indicator for the Group
(see page 26).
EBITDA before exceptional items
The profit before charges/credits relating to interest, tax, depreciation, amortisation and exceptional items. EBITDA before exceptional items is used in the
net debt to EBITDA ratio to assess the appropriateness of the Group’s financial gearing.
2017 £m
Restated2016
£m
Trading profit 1,059 857
Depreciation, amortisation and impairment of property, plant and equipment and software excluding exceptional items in operating profit 140 114
EBITDA before exceptional items 1,199 971
Ongoing effective tax rate
The ongoing effective tax rate is the ratio of the ongoing tax expense to ongoing profit before tax and is used as a measure of the tax rate of the ongoing
business. See reconciliation in note 7.
Headline profit after tax and headline earnings per share
Headline profit after tax is calculated as the profit from continuing operations after tax, before charges for amortisation and impairment of acquired
intangible assets net of tax, exceptional items net of tax and non-recurring tax relating to changes in tax rates.
Headline earnings per share is the ratio of headline profit after tax to the weighted average number of ordinary shares in issue during the year, excluding
those held by the Employee Benefit Trusts and those held by the Company as Treasury shares. Headline earnings per share is used for the purpose of
setting remuneration targets for executive directors and other senior executives. See reconciliation in note 10.
Net debt and adjusted net debt
Net debt comprises cash and cash equivalents, bank overdrafts, bank loans, derivative financial instruments and obligations under finance leases. Net debt
is a good indicator of the strength of the Group’s balance sheet position and is widely used by credit rating agencies. See note 32 for a reconciliation.
Adjusted net debt is net debt after the year-end working capital adjustment used in the return on gross capital employed calculation below.
Return on gross capital employed
Return on gross capital employed is the ratio of the Group’s total trading profit to the average year-end aggregate of shareholders’ equity, adjusted net debt
and cumulative goodwill and other acquired intangible assets written off. Return on gross capital employed is a key performance indicator (see page 27).
Gross capital employed
2017 £m
Gross capital employed
2016 £m
Average capital
employed£m
Trading profit (c)
£m
Return on gross
capital employed
Net debt (a) 580 936
Year-end working capital adjustment – 120
Adjusted net debt 580 1,056
Cumulative goodwill and other acquired intangibles written off (b) 1,868 1,646
Shareholders’ equity 3,438 2,903
5,886 5,605 5,746 1,122 19.5%
(a) Includes £46 million in assets and liabilities held for sale.(b) Includes amounts in assets held for sale.(c) Includes continuing and discontinued operations.
Notes to the consolidated financial statements continuedYear ended 31 July 2017
92 Ferguson plc Annual Report and Accounts 2017

3 – Segmental analysisThe Group’s reportable segments are the operating businesses overseen by distinct divisional management teams responsible for their performance.
All reportable segments derive their revenue from a single business activity, the distribution of plumbing and heating products.
The Group’s business is not highly seasonal and the Group’s customer base is highly diversified, with no individually significant customer.
In the year ended 31 July 2017, the Nordic businesses have been reclassified into discontinued operations and all comparatives have been restated
for consistency and comparability.
The changes in revenue and trading profit for continuing operations between the years ended 31 July 2016 and 31 July 2017 include changes in
exchange rates, disposals, acquisitions and organic change.
Where businesses are disposed in the year, the difference between the revenue and trading profit in the current year up to the date of disposal and the
revenue and trading profit in the equivalent portion of the prior year is included in organic change.
Revenue by reportable segment for continuing operations is as follows:
Analysis of change in revenue
Restated 2016
£mExchange
£mDisposals
£mAcquisitions
£m
Organic change
£m2017
£m
USA 9,456 1,445 (35) 285 843 11,994
UK 1,996 – – – 16 2,012
Canada and Central Europe 1,097 164 (85) 9 33 1,218
Group 12,549 1,609 (120) 294 892 15,224
Trading profit/(loss) (note 2) by reportable segment for continuing operations is as follows:
Analysis of change in trading profit/(loss) (note 2)
Restated2016
£mExchange
£mDisposals
£mAcquisitions
£m
Organic change
£m2017
£m
USA 775 118 (4) 33 44 966
UK 74 – – – 2 76
Canada and Central Europe 53 8 (5) 1 (1) 56
Central and other costs (45) – – – 6 (39)
Group 857 126 (9) 34 51 1,059
The reconciliation between trading profit/(loss) (note 2) and operating profit/(loss) by reportable segment for continuing operations is as follows:
2017Restated
2016
Trading profit/(loss)
£m
Exceptional items
£m
Amortisation and impairment
of acquired intangible
assets£m
Operating profit/(loss)
£m
Trading profit/(loss)
£m
Exceptional items
£m
Amortisation and impairment
of acquired intangible
assets£m
Operating profit/(loss)
£m
USA 966 94 (62) 998 775 2 (34) 743
UK 76 (28) – 48 74 (9) (106) (41)
Canada and Central Europe 56 170 (2) 224 53 – (2) 51
Central and other costs (39) (7) – (46) (45) 3 – (42)
Group 1,059 229 (64) 1,224 857 (4) (142) 711
Finance costs (43) (36)
Share of after tax loss of associate (1) –
Profit before tax 1,180 675
Strategic report Governance Financials Other information
93Ferguson plc Annual Report and Accounts 2017

3 – Segmental analysis continued In 2016 and 2017, a number of Group businesses or groups of branches have been disposed of, closed or are classified as held for sale. The revenue and
trading profit of the Group’s segments excluding those businesses and branches (“ongoing operations”) are analysed in the following table. These are
alternative performance measures.
Revenue Trading profit
2017 £m
Restated2016
£m2017
£m
Restated2016
£m
Ongoing operations
USA 11,824 9,288 950 761
UK 2,012 1,996 76 74
Canada and Central Europe 1,042 862 45 37
Central and other costs – – (39) (45)
Total ongoing operations 14,878 12,146 1,032 827
Non-ongoing operations 346 403 27 30
Continuing operations 15,224 12,549 1,059 857
Other information on assets and liabilities by segment is set out in the tables below:
2017Restated
2016
Segment assets and liabilities
Segment assets
£m
Segment liabilities
£m
Segment net assets/(liabilities)
£m
Segment assets
£m
Segment liabilities
£m
Segment net assets/
(liabilities) £m
USA 4,681 (1,872) 2,809 4,268 (1,645) 2,623
UK 850 (492) 358 856 (508) 348
Canada and Central Europe (a) 598 (195) 403 599 (265) 334
Central and other costs 16 (95) (79) 18 (103) (85)
Discontinued 1,304 (851) 453 1,312 (656) 656
Total 7,449 (3,505) 3,944 7,053 (3,177) 3,876
Tax assets and liabilities 123 (97) 26 127 (166) (39)
Net cash/(debt) 1,931 (2,465) (534) 971 (1,907) (936)
Group assets/(liabilities) 9,503 (6,067) 3,436 8,151 (5,250) 2,901
(a) 2017 segmental assets includes £124 million relating to interest in associate.
2017Restated
2016
Additions to goodwill
£m
Additions to other
acquired intangible
assets £m
Additions to non-acquired
intangible assets
£m
Additions to property, plant and
equipment £m
Additions to goodwill
£m
Additions to other
acquired intangible
assets £m
Additions to non-acquired
intangible assets
£m
Additions to property, plant and
equipment £m
USA 136 80 11 81 34 25 17 123
UK – – 8 21 – – 5 15
Canada and Central Europe – – 3 9 6 3 2 18
Central and other costs – – 1 – – – 1 1
Discontinued 3 1 2 46 – – 6 33
Group 139 81 25 157 40 28 31 190
Notes to the consolidated financial statements continuedYear ended 31 July 2017
94 Ferguson plc Annual Report and Accounts 2017

3 – Segmental analysis continued
2017Restated
2016
Impairment of goodwill
and other acquired
intangible assets
£m
Amortisation of other
acquired intangible
assets £m
Amortisation and impairment
of non- acquired
intangible assets
£m
Depreciation and
impairment of property,
plant and equipment
£m
Impairment of goodwill
and other acquired
intangible assets
£m
Amortisation of other
acquired intangible
assets £m
Amortisation and impairment
of non- acquired
intangible assets
£m
Depreciation and
impairment of property,
plant and equipment
£m
USA – 62 11 92 – 34 7 72
UK – – 5 17 94 12 5 17
Canada and Central Europe – 2 2 8 – 2 1 9
Central and other costs – – 3 2 – – 1 2
Discontinued 102 4 3 24 – 5 1 25
Group 102 68 24 143 94 53 15 125
4 – Operating profitAmounts charged/(credited) in arriving at operating profit include:
Notes2017
£m
Restated2016
£m
Depreciation of property, plant and equipment 14 118 99
Impairment of property, plant and equipment 14 1 1
Gain on disposal and closure of businesses 31 (266) (6)
Loss on disposal of property, plant and equipment and assets held for sale – 1
Staff costs 11 2,140 1,766
Amortisation of non-acquired intangible assets 13 19 14
Amortisation of acquired intangible assets 13 64 48
Impairment of non-acquired intangible assets 13 2 –
Impairment of goodwill and acquired intangible assets 12, 13 – 94
Operating lease rentals: land and buildings 187 161
Operating lease rentals: plant and machinery 59 49
Amounts included in costs of goods sold with respect to inventory 10,758 8,806
Trade receivables impairment 10 9
2017£m
2016£m
During the year, the Group obtained the following services from the Company’s auditor and its associates:
Fees for the audit of the parent company and consolidated financial statements 0.9 0.9
Fees for the audit of the Company’s subsidiaries pursuant to legislation 2.5 2.0
Total audit fees 3.4 2.9
Audit related assurance services 0.5 0.2
Other assurance services 0.1 –
Other services 0.2 –
Total non-audit fees 0.8 0.2
Total fees payable to the auditor 4.2 3.1
Details of the Company’s policy on the use of the auditor for non-audit services, the reasons why the auditor was used and how the auditor’s
independence and objectivity was safeguarded are set out in the Audit Committee Report on page 62. No services were provided pursuant to
contingent fee arrangements.
Strategic report Governance Financials Other information
95Ferguson plc Annual Report and Accounts 2017

5 – Exceptional itemsExceptional items included in operating profit from continuing operations are analysed by purpose as follows:
2017 £m
Restated2016
£m
Gain on disposal of businesses (note 31) 266 6
Business restructuring (40) (10)
Other exceptional items 3 –
Total included in operating profit 229 (4)
For the year to 31 July 2017, business restructuring comprises costs incurred in the UK in respect of its business transformation strategy and includes
£2 million charged to cost of sales for inventory write downs.
Other exceptional items include an £11 million one-off credit relating to the UK defined benefit pension plan which arose as a result of a change in future
earnings assumptions.
The net cash outflow from exceptional items, excluding the gain on disposal of businesses, was £20 million (2016: £6 million). The net inflow of cash
in respect of the disposal of businesses is detailed in note 31.
Exceptional items relating to discontinued operations are disclosed in note 8.
6 – Finance costs
2017 £m
Restated2016
£m
Interest payable
– Bank loans and overdrafts 48 45
– Unwind of fair value adjustment to senior unsecured loan notes (8) (9)
– Finance lease charges 1 2
Net interest expense/(income) on defined benefit obligation (note 26) 2 (1)
Valuation gains on financial instruments
– Derivatives held at fair value through profit and loss – (1)
Total finance costs 43 36
Finance costs relating to discontinued operations are detailed in note 8.
7 – Tax
The tax charge for the year comprises:2017
£m
Restated2016
£m
Current year tax charge 294 225
Adjustments to tax charge in respect of prior years 1 (13)
Total current tax charge 295 212
Deferred tax credit: origination and reversal of temporary differences (3) (2)
Total tax charge 292 210
An exceptional tax charge of £22 million was recorded against exceptional items (2016: credit £1 million). The deferred tax credit of £3 million (2016: credit
£2 million) includes a charge of £10 million (2016: charge £5 million) resulting from changes in tax rates.
Tax on items credited/(charged) to the statement of other comprehensive income:2017
£m2016
£m
Deferred tax (charge)/credit on actuarial loss on retirement benefits (3) 25
Current tax credit on actuarial loss on retirement benefits 2 –
Deferred tax credit/(charge) on losses 1 (7)
Total tax on items credited to the statement of other comprehensive income – 18
In 2017, there is no tax in the statement of other comprehensive income which relates to changes in tax rates. In 2016, £1 million of the £18 million credit
related to changes in tax rates.
Notes to the consolidated financial statements continuedYear ended 31 July 2017
96 Ferguson plc Annual Report and Accounts 2017

7 – Tax continued
Tax on items credited/(charged) to equity:2017
£m2016
£m
Current tax credit on share-based payments 3 6
Deferred tax credit/(charge) on share-based payments 1 (6)
Total tax on items credited to equity 4 –
2017
Ongoing profit/tax (h)Non-ongoing and
other profit/tax (i)Total profit/tax from
continuing operations
Tax reconciliation: £m % £m % £m %
Profit before tax 989 191 1,180
Expected tax at weighted average tax rate (a) (241) 24.4 (52) 27.2 (293) 24.8
Adjusted for the effects of:
(under)/over provisions in respect of prior periods (b) (5) 0.5 11 (5.7) 6 (0.5)
exceptional items which are non-taxable/(non-tax deductible) (d) – – 26 (13.6) 26 (2.2)
current year increase in uncertain tax provisions (e) (25) 2.5 – – (25) 2.1
tax credits and incentives 3 (0.3) – – 3 (0.2)
non-taxable income 8 (0.8) – – 8 (0.7)
other non-tax deductible expenditure (f) (9) 0.9 – – (9) 0.8
other 2 (0.2) – – 2 (0.2)
effect of UK tax rate changes (g) (10) 1.0 – – (10) 0.8
Tax charge/effective tax rate (277) 28.0 (15) 7.9 (292) 24.7
Restated2016
Ongoing profit/tax (h)Non-ongoing and
other loss/tax (i)Total profit/tax from
continuing operations
Tax reconciliation: £m % £m % £m %
Profit/(loss) before tax 792 (117) 675
Expected tax at weighted average tax rate (a) (202) 25.5 26 22.2 (176) 26.1
Adjusted for the effects of:
over provisions in respect of prior periods (b) 18 (2.3) – – 18 (2.7)
non-tax deductible amortisation/impairment of acquired intangible assets (c) – – (15) (12.8) (15) 2.2
exceptional items which are non-taxable/(non-tax deductible) (d) – – 1 0.9 1 (0.1)
current year increase in uncertain tax provisions (e) (31) 3.9 – – (31) 4.6
tax credits and incentives 3 (0.4) – – 3 (0.4)
non-taxable income 4 (0.5) – – 4 (0.6)
other non-tax deductible expenditure (f) (6) 0.8 – – (6) 0.9
other (3) 0.4 – – (3) 0.4
effect of UK tax rate changes (g) – – (5) (4.3) (5) 0.7
Tax (charge)/credit/effective tax rate (217) 27.4 7 6.0 (210) 31.1
(a) This expected weighted average tax rate reflects the applicable statutory corporate tax rates on the accounting profits/losses in the countries in which the Group operates after intra-group financing. This results in interest deductions and lower taxable profits in many of the countries and therefore reduces the tax rate. The pre intra-group financing ongoing expected weighted average tax rate is 32.7 per cent (2016: 37.6 per cent) and this is reduced to a post intra-group financing ongoing expected weighted average tax rate of 24.4 per cent (2016: 25.5 per cent). The 1.1 per cent decrease in the post intra-group financing ongoing expected weighted average tax rate is primarily due to a change in profit mix.
(b) This includes adjustments arising out of movements in uncertain tax provisions regarding prior periods and differences between the final tax liabilities in the tax computations and the tax liabilities provided in the accounts. The non-ongoing and other credit of £11 million relates primarily to a one-off settlement of tax enquiries in the UK.
(c) In 2016, this relates primarily to non-tax deductible impairment of goodwill in the UK.(d) In 2017, this relates primarily to non-taxable disposals of businesses.(e) This reflects management’s assessment of the potential tax liability for the current year in relation to open tax issues and audits. (f) This relates to certain expenditure for which no tax relief is available such as disallowable business entertaining costs.(g) This relates to the reduction in the UK standard rate of corporation tax from 20 per cent to 19 per cent from 1 April 2017 and to 17 per cent from 1 April 2020. The rate change was considered
exceptional in 2016 on the grounds that it was only announced at the end of the 2015 financial year and could not be foreseen in the Group’s forecast ongoing effective tax rate for the 2016 financial year.
(h) Ongoing profit means profit before tax, exceptional items and the amortisation and impairment of acquired intangible assets for ongoing operations as defined in note 2. Ongoing tax is the tax expense arising on ongoing profit.
(i) Non-ongoing and other profit or loss is profit or loss from non-ongoing operations as defined in note 2 and from the amortisation and impairment of acquired intangible assets and exceptional items. Non-ongoing and other tax is the tax expense or credit arising on the non-ongoing and other profit or loss.
Strategic report Governance Financials Other information
97Ferguson plc Annual Report and Accounts 2017

8 – Discontinued operationsThe Group is in the process of selling its business and property assets (the “disposal group”) in the Nordic region and, in accordance with IFRS 5
“Non-current Assets Held for Sale and Discontinued Operations”, the disposal group has been classified as discontinued and prior periods have
been restated to reflect this.
As at 31 July 2017, the sales process for the remaining French property assets is in progress and these are classified as discontinued.
The results from discontinued operations, which have been included in the Group income statement, are set out below.
2017Restated
2016
Before exceptional
items £m
Exceptional items
£mTotal
£m
Before exceptional
items £m
Exceptional items
£mTotal
£m
Revenue 2,100 – 2,100 2,136 – 2,136
Cost of sales (1,565) (8) (1,573) (1,573) – (1,573)
Gross profit 535 (8) 527 563 – 563
Operating costs:
gain on disposal of businesses – – – – 139 139
amortisation of acquired intangible assets (4) – (4) (5) – (5)
impairment of goodwill and acquired intangible assets (102) – (102) – – –
other (472) (60) (532) (504) 16 (488)
Operating costs (578) (60) (638) (509) 155 (354)
Operating (loss)/profit (43) (68) (111) 54 155 209
Finance (costs)/income (4) 8 4 (2) 4 2
(Loss)/profit before tax (47) (60) (107) 52 159 211
Attributable tax – 2 2 (21) (5) (26)
(Loss)/profit from discontinued operations (47) (58) (105) 31 154 185
Basic (loss)/earnings per share (18.7)p (23.1)p (41.8)p 12.3p 60.7p 73.0p
Diluted (loss)/earnings per share (18.5)p (22.9)p (41.4)p 12.1p 60.4p 72.5p
The discontinued exceptional items in 2017 relate predominantly to restructuring activities in the Nordic region.
During the year, discontinued operations generated cash of £51 million (2016: £51 million) in respect of operating activities, used £28 million
(2016: generated £17 million) in respect of investing activities and used £54 million (2016: generated £26 million) in respect of financing activities.
9 – Dividends2017 2016
£mPence per
share £mPence per
share
Amounts recognised as distributions to equity shareholders:
Final dividend for the year ended 31 July 2015 – – 154 60.50p
Interim dividend for the year ended 31 July 2016 – – 84 33.28p
Final dividend for the year ended 31 July 2016 167 66.72p – –
Interim dividend for the year ended 31 July 2017 92 36.67p – –
Dividends paid 259 238
Since the end of the financial year, the Directors have proposed a final ordinary dividend of £185 million (73.33 pence per share). The dividend is subject
to approval by shareholders at the Annual General Meeting and is therefore not included in the balance sheet as a liability at 31 July 2017.
Notes to the consolidated financial statements continuedYear ended 31 July 2017
98 Ferguson plc Annual Report and Accounts 2017

10 – Earnings per share
2017Restated
2016
Earnings £m
Basic earnings
per share pence
Diluted earnings
per share pence
Earnings £m
Basic earnings
per share pence
Diluted earnings
per share pence
Headline profit after tax from continuing operations 726 288.9 595 234.7
Exceptional items (net of tax) 207 82.4 (3) (1.2)
Amortisation and impairment of acquired intangible assets (net of tax) (45) (17.9) (122) (48.1)
Non-recurring tax charge relating to changes in tax rates – – (5) (2.0)
Profit from continuing operations 888 353.4 350.8 465 183.4 182.3
(Loss)/profit from discontinued operations (105) (41.8) (41.4) 185 73.0 72.5
Profit from continuing and discontinued operations 783 311.6 309.4 650 256.4 254.8
The weighted average number of ordinary shares in issue during the year, excluding those held by Employee Benefit Trusts and those held by the
Company as Treasury shares, was 251.3 million (2016: 253.5 million). The impact of all potentially dilutive share options on earnings per share would
be to increase the weighted average number of shares in issue to 253.1 million (2016: 255.1 million).
11 – Employee information and Directors’ remuneration
2017 £m
Restated2016
£m
Wages and salaries 1,936 1,585
Social security costs 134 111
Pension costs – defined contribution plans 57 48
Pension (credit)/costs – defined benefit plans (note 26) (7) 5
Share-based payments (note 28) 20 17
Total staff costs 2,140 1,766
The total staff costs, including discontinued operations, was £2,451 million (2016: £2,071 million).
Average number of employees 2017Restated
2016
USA 24,086 22,468
UK 6,064 6,208
Canada and Central Europe 3,257 3,489
Central and other 104 104
Group 33,511 32,269
The average number of employees including discontinued operations was 39,205 (2016: 39,717).
Further details of Directors’ remuneration and share options are set out in the Remuneration Report on pages 69 to 84, which form part of these financial
statements. The aggregate emoluments for all key management are set out in the following table:
Key management personnel compensation (including Directors)2017
£m2016
£m
Salaries, bonuses and other short-term employee benefits 11 8
Termination and post-employment benefits – 1
Share-based payments 4 4
Total compensation 15 13
Strategic report Governance Financials Other information
99Ferguson plc Annual Report and Accounts 2017
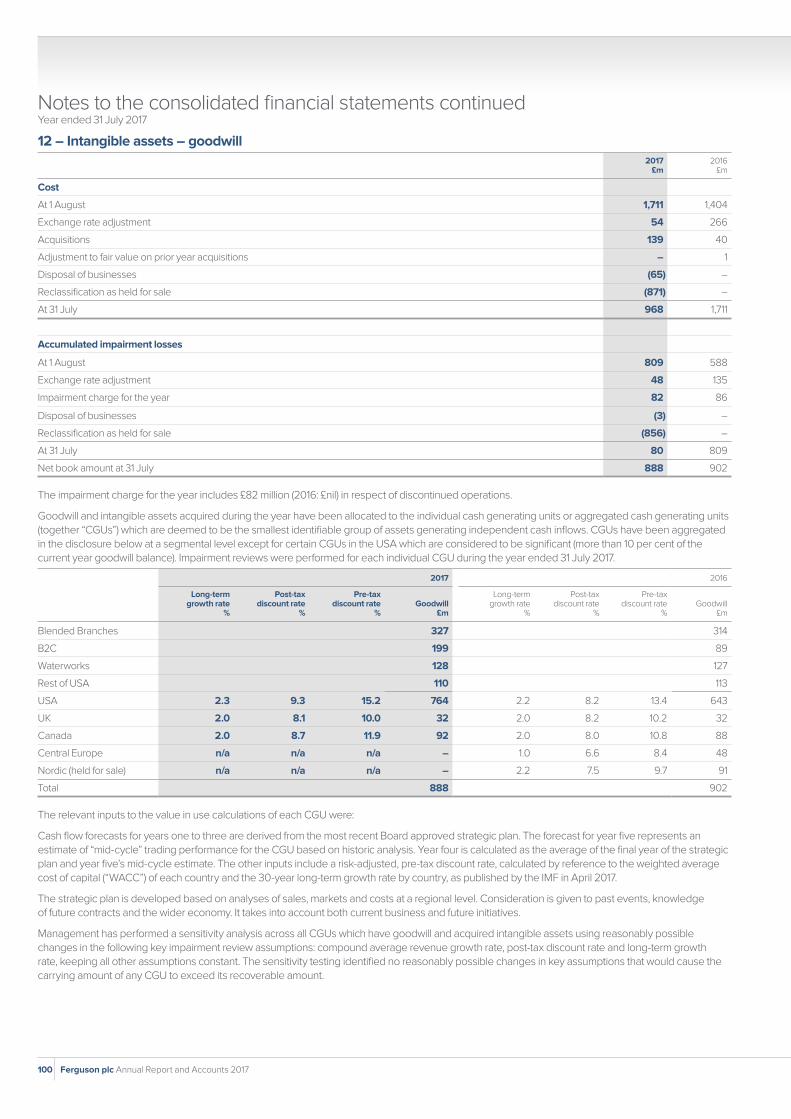
12 – Intangible assets – goodwill2017
£m2016
£m
Cost
At 1 August 1,711 1,404
Exchange rate adjustment 54 266
Acquisitions 139 40
Adjustment to fair value on prior year acquisitions – 1
Disposal of businesses (65) –
Reclassification as held for sale (871) –
At 31 July 968 1,711
Accumulated impairment losses
At 1 August 809 588
Exchange rate adjustment 48 135
Impairment charge for the year 82 86
Disposal of businesses (3) –
Reclassification as held for sale (856) –
At 31 July 80 809
Net book amount at 31 July 888 902
The impairment charge for the year includes £82 million (2016: £nil) in respect of discontinued operations.
Goodwill and intangible assets acquired during the year have been allocated to the individual cash generating units or aggregated cash generating units
(together “CGUs”) which are deemed to be the smallest identifiable group of assets generating independent cash inflows. CGUs have been aggregated
in the disclosure below at a segmental level except for certain CGUs in the USA which are considered to be significant (more than 10 per cent of the
current year goodwill balance). Impairment reviews were performed for each individual CGU during the year ended 31 July 2017.
2017 2016
Long-term growth rate
%
Post-tax discount rate
%
Pre-tax discount rate
%Goodwill
£m
Long-term growth rate
%
Post-tax discount rate
%
Pre-tax discount rate
%Goodwill
£m
Blended Branches 327 314
B2C 199 89
Waterworks 128 127
Rest of USA 110 113
USA 2.3 9.3 15.2 764 2.2 8.2 13.4 643
UK 2.0 8.1 10.0 32 2.0 8.2 10.2 32
Canada 2.0 8.7 11.9 92 2.0 8.0 10.8 88
Central Europe n/a n/a n/a – 1.0 6.6 8.4 48
Nordic (held for sale) n/a n/a n/a – 2.2 7.5 9.7 91
Total 888 902
The relevant inputs to the value in use calculations of each CGU were:
Cash flow forecasts for years one to three are derived from the most recent Board approved strategic plan. The forecast for year five represents an
estimate of “mid-cycle” trading performance for the CGU based on historic analysis. Year four is calculated as the average of the final year of the strategic
plan and year five’s mid-cycle estimate. The other inputs include a risk-adjusted, pre-tax discount rate, calculated by reference to the weighted average
cost of capital (“WACC”) of each country and the 30-year long-term growth rate by country, as published by the IMF in April 2017.
The strategic plan is developed based on analyses of sales, markets and costs at a regional level. Consideration is given to past events, knowledge
of future contracts and the wider economy. It takes into account both current business and future initiatives.
Management has performed a sensitivity analysis across all CGUs which have goodwill and acquired intangible assets using reasonably possible
changes in the following key impairment review assumptions: compound average revenue growth rate, post-tax discount rate and long-term growth
rate, keeping all other assumptions constant. The sensitivity testing identified no reasonably possible changes in key assumptions that would cause the
carrying amount of any CGU to exceed its recoverable amount.
Notes to the consolidated financial statements continuedYear ended 31 July 2017
100 Ferguson plc Annual Report and Accounts 2017

12 – Intangible assets – goodwill continued Nordic
During the period, the performance of our Swedish building materials business, Beijer, deteriorated sharply with trading profit significantly lower
compared with the corresponding period last year and below management’s expectations. This generated a trigger event for management to reassess
the recoverability of its associated goodwill and acquired intangible assets. This assessment resulted in an impairment charge, as follows:
CGUGoodwill
£m
Acquired intangible
assets£m
Total£m
Impairment£m
Remaining balance
£m
Post-tax discount rate
%
Pre-tax discount rate
%
Beijer 82 20 102 (102) – 7.5 9.6
As at 31 July 2017, the Nordic businesses have been classified as held for sale (note 20) and discontinued operations (note 8).
13 – Intangible assets – otherAcquired intangible assets
Software £m
Trade names and brands
£m
Customer relationships
£mOther
£mTotal
£m
Cost
At 1 August 2015 125 264 481 61 931
Exchange rate adjustment 15 51 86 11 163
Acquisitions – 7 16 5 28
Additions 31 – – – 31
Disposals and transfers (19) – (2) – (21)
At 31 July 2016 152 322 581 77 1,132
Exchange rate adjustment 1 17 14 – 32
Acquisitions – 46 25 10 81
Additions 25 – – – 25
Disposals and transfers (7) – – – (7)
Disposal of businesses (13) (2) (20) (4) (39)
Reclassification as held for sale (11) (289) (251) – (551)
At 31 July 2017 147 94 349 83 673
Accumulated amortisation and impairment losses
At 1 August 2015 82 234 383 37 736
Exchange rate adjustment 10 45 72 7 134
Amortisation charge for the year 15 8 40 5 68
Impairment charge for the year – 2 6 – 8
Disposals and transfers (14) – (2) – (16)
At 31 July 2016 93 289 499 49 930
Exchange rate adjustment – 15 15 – 30
Amortisation charge for the year 22 13 36 19 90
Impairment charge for the year 2 13 7 – 22
Disposals and transfers (7) – – – (7)
Disposal of businesses (10) (1) (18) (4) (33)
Reclassification as held for sale (5) (286) (250) – (541)
At 31 July 2017 95 43 289 64 491
Net book amount at 31 July 2017 52 51 60 19 182
Net book amount at 31 July 2016 59 33 82 28 202
The amortisation charge includes £7 million (2016: £6 million) in respect of discontinued operations of which £3 million relates to software (2016: £1 million).
The impairment charge includes £20 million (2016: £nil) in respect of discontinued operations of which £nil relates to software.
Strategic report Governance Financials Other information
101Ferguson plc Annual Report and Accounts 2017

14 – Property, plant and equipmentLand and buildings
Plant machinery and
equipment £m
Total £m
Freehold £m
Finance leases
£m
Operating leasehold
improvements £m
Cost
At 1 August 2015 1,076 28 278 637 2,019
Exchange rate adjustment 193 4 43 91 331
Acquisitions 9 – – 2 11
Additions 85 1 12 92 190
Disposals and transfers (1) (1) (7) (39) (48)
Reclassification as held for sale (3) – – – (3)
At 31 July 2016 1,359 32 326 783 2,500
Exchange rate adjustment 43 – 1 8 52
Acquisitions 12 – – 14 26
Additions 55 – 25 77 157
Disposal of businesses (11) (24) (1) (44) (80)
Disposals and transfers (7) (6) (22) (65) (100)
Reclassification as held for sale (745) – (7) (96) (848)
At 31 July 2017 706 2 322 677 1,707
Accumulated depreciation
At 1 August 2015 219 7 182 447 855
Exchange rate adjustment 42 – 28 63 133
Depreciation charge for the year 30 1 20 72 123
Impairment charge for the year 2 – – – 2
Disposals and transfers – – (7) (39) (46)
Reclassification as held for sale (1) – – – (1)
At 31 July 2016 292 8 223 543 1,066
Exchange rate adjustment 6 – 2 3 11
Depreciation charge for the year 35 – 24 83 142
Impairment charge for the year 1 – – – 1
Disposal of businesses (1) (3) (2) (34) (40)
Disposals and transfers (2) (5) (8) (61) (76)
Reclassification as held for sale (142) – (6) (57) (205)
At 31 July 2017 189 – 233 477 899
Owned assets 517 – 89 194 800
Assets under finance leases – 2 – 6 8
Net book amount at 31 July 2017 517 2 89 200 808
Owned assets 1,067 – 103 232 1,402
Assets under finance leases – 24 – 8 32
Net book amount at 31 July 2016 1,067 24 103 240 1,434
At 31 July 2017, the book value of property, plant and equipment that had been pledged as security for liabilities was £12 million (2016: £591 million).
In addition, £179 million of property, plant and equipment included in assets held for sale (note 20) had been pledged as security for liabilities at
31 July 2017.
The depreciation charge and impairment charge for the year include £24 million (2016: £24 million) and £nil (2016: £1 million) respectively relating
to discontinued operations.
Notes to the consolidated financial statements continuedYear ended 31 July 2017
102 Ferguson plc Annual Report and Accounts 2017

15 – AssociatesIn April 2017, the Group acquired a 39.21% share in Walter Meier AG, a trading company whose principal place of business is Switzerland and which is
engaged in the distribution and maintenance of heating and air conditioning systems.
The investment in Walter Meier AG is accounted for as an associate using the equity method. Walter Meier AG prepares accounts under Swiss GAAP
FER with a year-end of 31 December. The Group’s accounts have been prepared based on Walter Meier AG’s half year accounts ended 30 June 2017.
There were no significant transactions between that date and 31 July 2017 and no material differences would arise if the accounts were prepared
under IFRS.
Summarised financial information from Walter Meier AG’s half year accounts ended 30 June 2017 is set out below. Trading results are from the date
of acquisition.
2017 £m
Non-current assets 138
Current assets 244
Current liabilities (149)
Non-current liabilities (96)
Net assets 137
Revenue 109
Loss from continuing operations (3)
Other comprehensive income attributable to the owners of the company –
Total comprehensive income (3)
The amount recognised in the Group’s consolidated financial statements is as follows:
Share of result of associate 39.21% (1)
There were no dividends received from the associate in the year.
The reconciliation of associate net assets to the carrying amount recognised in the Group’s consolidated financial statements is as follows:
%2017
£m
Net assets of associate 137
Proportion of the Group’s ownership interest in the associate 39.21 54
Goodwill 70
Carrying amount of the Group’s interest in the associate 124
Strategic report Governance Financials Other information
103Ferguson plc Annual Report and Accounts 2017

16 – Deferred tax assets and liabilities The deferred tax assets and liabilities shown in the balance sheet are analysed as follows:
Deferred tax2017
£m2016
£m
Deferred tax assets 121 127
Deferred tax liabilities (9) (65)
112 62
The following are the major deferred tax assets and liabilities recognised by the Group and movements thereon during the current and prior
reporting year:
Goodwill and intangible
assets £m
Share-based payments
£m
Property, plant and
equipment £m
Retirement benefit
obligations £m
Inventory £m
Tax losses £m
Other £m
Total £m
At 31 July 2015 (47) 21 16 45 (75) 58 44 62
Credit/(charge) to income 5 – (13) 2 9 (2) (5) (4)
Credit/(charge) to other comprehensive income – – – 25 – (7) – 18
Charge to equity – (6) – – – – – (6)
Acquisitions (2) – – – – – – (2)
Exchange rate adjustment (8) 3 (10) 12 (12) 2 7 (6)
At 31 July 2016 (52) 18 (7) 84 (78) 51 46 62
Credit/(charge) to income 7 (1) (4) (3) (4) 21 (9) 7
(Charge)/credit to other comprehensive income – – – (3) – 1 – (2)
Credit to equity – 1 – – – – – 1
Acquisitions (6) – (3) – – – – (9)
Disposals of businesses – – 1 (1) 2 – – 2
Transferred to held for sale 2 (1) 61 (3) (4) (6) 2 51
Transfers between categories – – – – – (7) 7 –
Exchange rate adjustment – – (1) 1 – – – –
At 31 July 2017 (49) 17 47 75 (84) 60 46 112
Legislation has been enacted in the UK to reduce the standard rate of UK corporation tax from 20 per cent to 19 per cent with effect from 1 April 2017 and
to 17 per cent with effect from 1 April 2020. Accordingly, the UK deferred tax assets and liabilities have predominantly been calculated based on a 17 per
cent tax rate which materially reflects the rate for the period in which the deferred tax assets and liabilities are expected to reverse.
Net deferred tax assets have been recognised on the basis that sufficient taxable profits are forecast to be available in the future to enable them to
be utilised.
In addition, the Group has unrecognised gross tax losses totalling £328 million (2016: £68 million) that have not been recognised on the basis that their
future economic benefit is uncertain. These losses have no expiry date and relate predominantly to capital losses.
No deferred tax liability has been recognised in respect of temporary differences associated with investments in subsidiaries. However, tax may arise
on £284 million (2016: £253 million) of temporary differences but the Group is in a position to control the timing of their reversal and it is probable that
such differences will not reverse in the foreseeable future.
Notes to the consolidated financial statements continuedYear ended 31 July 2017
104 Ferguson plc Annual Report and Accounts 2017

17 – Trade and other receivables
Current2017
£m2016
£m
Trade receivables 1,795 1,933
Less: provision for impairment (24) (39)
Net trade receivables 1,771 1,894
Other receivables 92 81
Prepayments 230 232
2,093 2,207
Non-current
Other receivables 226 212
Included in prepayments is £177 million (2016: £182 million) due in relation to Supplier Rebates where there is no right to offset against trade
payable balances.
Movements in the provision for impairment of trade receivables are as follows:
2017 £m
2016 £m
At 1 August 39 35
Net charge for the year 13 14
Utilised in the year (17) (14)
Disposal of businesses and reclassified as held for sale (11) –
Exchange rate adjustment – 4
At 31 July 24 39
Provisions for impairment of receivables have two components comprising a provision for amounts that have been individually determined not to be
collectable in full, because of known financial difficulties of the debtor or evidence of default or delinquency in payment, amounting to £13 million at
31 July 2017 (2016: £16 million); and a provision based on historic experience of non-collectability of receivables, amounting to £11 million at 31 July 2017
(2016: £23 million).
Trade receivables have been aged with respect to the payment terms specified in the terms and conditions established with customers as follows:
2017 £m
2016 £m
Amounts not yet due and less than one month past due 1,620 1,452
Past due more than one month 175 481
1,795 1,933
18 – Derivative financial instrumentsThe Group uses interest rate swaps to manage its exposure to interest rate movements on its borrowings and foreign exchange swaps to hedge cash
flows in respect of committed transactions or to hedge its investment in overseas operations. The fair values of derivative financial instruments are
as follows:
Derivative financial instrument type
2017 2016
Assets£m
Liabilities£m
Total£m
Assets£m
Liabilities£m
Total£m
Interest rate swaps 20 – 20 29 – 29
Foreign exchange swaps – – – 2 – 2
20 – 20 31 – 31
The current element of derivative financial assets is £5 million (2016: £11 million) and the non-current element is £15 million (2016: £20 million).
The Group’s accounting and risk management policies, and further information about the derivative financial instruments that it uses, are set out
on pages 123 to 126.
Strategic report Governance Financials Other information
105Ferguson plc Annual Report and Accounts 2017

19 – Cash and cash equivalents 2017
£m2016
£m
Cash and cash equivalents 1,911 940
Included in the balance at 31 July 2017 is an amount of £1,420 million (2016: £606 million) which is part of the Group’s cash pooling arrangements where
there is an equal and opposite balance included within bank overdrafts (note 22). These amounts are subject to a master netting arrangement.
At 31 July 2017, cash and cash equivalents included £64 million (2016: £60 million) which is used to collateralise letters of credit on behalf of Wolseley
Insurance Limited.
Restricted cash held by the Group at the balance sheet date amounted to £17 million (2016: £3 million) and is recorded in other receivables.
20 – Assets and liabilities held for sale2017
£m2016
£m
Properties awaiting disposal 66 10
Assets of disposal groups held for sale 1,232 46
Assets held for sale 1,298 56
Liabilities of disposal groups held for sale 821 12
During the year ended 31 July 2017, the Group announced its decision to sell its Nordic businesses and subsequently classified these as held for sale.
At 31 July 2017, the sales process for the remaining French property assets was progressing and accordingly these properties have been reclassified
as properties awaiting disposal.
The assets and liabilities of disposal groups held for sale consist of:
2017 £m
2016 £m
Intangible assets 25 –
Property, plant and equipment 615 42
Inventories 274 –
Trade and other receivables 256 4
Tax receivables 29 –
Cash and cash equivalents 33 –
Bank loans (79) –
Trade and other payables (598) (7)
Provisions and retirement benefit obligations (73) (1)
Tax payables (71) (4)
411 34
21 – Trade and other payables
Current2017
£m2016
£m
Trade payables 1,767 2,121
Tax and social security 66 88
Other payables 90 71
Accruals 354 346
Deferred income 2 8
2,279 2,634
Non-current
Other payables 180 163
Trade payables are stated net of £nil (2016: £15 million) due from suppliers with respect to Supplier Rebates where an agreement exists that allows these
to be net settled.
Notes to the consolidated financial statements continuedYear ended 31 July 2017
106 Ferguson plc Annual Report and Accounts 2017

22 – Bank loans and overdrafts
2017 2016
Current£m
Non-current£m
Total£m
Current£m
Non-current £m
Total£m
Bank overdrafts 1,500 – 1,500 692 – 692
Bank and other loans 2 4 6 1 224 225
Senior unsecured loan notes 125 827 952 8 951 959
Total bank loans and overdrafts 1,627 831 2,458 701 1,175 1,876
Included in bank overdrafts at 31 July 2017 is an amount of £1,420 million (2016: £606 million) which is part of the Group’s cash pooling arrangements
where there is an equal and opposite balance included within cash and cash equivalents (note 19). These amounts are subject to a master
netting arrangement.
£2 million of bank loans are secured against the Group’s freehold property (2016: £130 million). In addition, £79 million of bank loans included in liabilities
held for sale (note 20) are secured against freehold property included in assets held for sale. No bank loans were secured against trade receivables at
31 July 2017 (2016: £nil) as the trade receivables facility of £454 million was undrawn as at 31 July 2017.
Non-current loans are repayable as follows:
2017 £m
2016 £m
Due in one to two years 6 124
Due in two to three years 4 4
Due in three to four years 214 4
Due in four to five years 1 215
Due in over five years 606 828
Total 831 1,175
The carrying value of the senior unsecured loan notes of £952 million comprises a par value of £937 million and a fair value adjustment of £15 million
(2016: £959 million, £936 million and £23 million respectively). The fair value adjustment arose before 30 November 2011 when the loan notes were
hedged by a series of interest rate swaps. From 30 November 2011, the hedge relationship was de-designated and the fair value adjustment is being
released to the income statement on an amortised cost basis and the fair value hedge is based on a recalculated effective interest rate at the date
when hedge accounting was discontinued. The adjustment will be fully amortised at the point the unsecured loan notes mature. Finance costs are
disclosed in note 6.
There have been no significant changes during the year to the Group’s policies on accounting for, valuing and managing the risk of financial instruments.
These policies are summarised on pages 123 to 126.
23 – Financial instruments and financial risk managementCapital structure
To assess the appropriateness of its capital structure based on current and forecast trading, the Group’s principal measure of financial gearing is the ratio
of net debt to EBITDA before exceptional items. The Group aims to operate with investment grade credit metrics and ensure this ratio remains within 1
to 2 times. The Group’s main borrowing facilities contain a financial covenant limiting the ratio of net debt to EBITDA before exceptional items to 3.5:1.
The reconciliation of opening to closing net debt is detailed in note 32.
In order to maintain or adjust the capital structure, the Group may return capital to shareholders, repurchase its own shares, issue new shares or sell
assets to reduce debt.
Liquidity
During the year ended 31 July 2017, the Group’s US$600 million revolving credit facility has been extended by one year and matures in December 2019.
The Group also entered into a US$190 million bilateral revolving credit facility agreement maturing in December 2017. As at 31 July 2017, all of the Group’s
revolving credit facilities were undrawn. The maturity profile of the Group’s undrawn facilities is as follows:
2017 £m
2016 £m
Less than one year 144 –
Between one and two years – –
Between two and three years 454 454
Between three and four years – –
Between four and five years 800 –
Greater than five years – 705
Total 1,398 1,159
Strategic report Governance Financials Other information
107Ferguson plc Annual Report and Accounts 2017

23 – Financial instruments and financial risk management continuedForeign currency
Net debt by currency was as follows:
As at 31 July 2017
Interest rate swaps
£m
Finance lease
obligations £m
Cash, overdrafts and
bank loans £m
Currency (sold)/bought
forward £m
Total £m
Pounds sterling – (3) 62 (7) 52
US dollars 20 (4) (604) 7 (581)
Euro, Danish kroner and Swedish kronor – – 6 – 6
Other currencies – – (11) – (11)
Total 20 (7) (547) – (534)
As at 31 July 2016
Interest rate swaps
£m
Finance lease
obligations £m
Cash, overdrafts and
bank loans £m
Currency bought/(sold)
forward £m
Total £m
Pounds sterling – (3) (60) 65 2
US dollars 29 (6) (789) (151) (917)
Euro, Danish kroner and Swedish kronor – – (102) 88 (14)
Other currencies – (22) 15 – (7)
Total 29 (31) (936) 2 (936)
Currency bought/(sold) forward comprises short-term foreign exchange swaps which were designated and effective as hedges of overseas operations.
Interest rates
The interest rate profile of the Group’s net debt including the effect of interest rate swaps is set out in the following tables:
As at 31 July
2017 2016
Floating £m
Fixed £m
Total £m
Floating £m
Fixed £m
Total £m
Pounds sterling 55 (3) 52 5 (3) 2
US dollars 360 (941) (581) 48 (965) (917)
Euro, Danish kroner and Swedish kronor 6 – 6 113 (127) (14)
Other currencies (11) – (11) 15 (22) (7)
Total 410 (944) (534) 181 (1,117) (936)
Fixed rate borrowings at 31 July 2017 carried a weighted average interest rate of 3.3 per cent fixed for a weighted average duration of 6.5 years (31 July
2016: 3.2 per cent for 7.6 years). The Group had no floating rate borrowings at 31 July 2017 (31 July 2016: floating rate borrowings carried a weighted
average interest rate of 0.9 per cent).
24 – Obligations under finance leasesGross 2017
£m
Gross 2016
£m
Net 2017
£m
Net 2016
£m
Due within one year 4 5 3 4
Due in one to five years 3 10 3 7
Due in over five years 4 25 1 20
11 40 7 31
Less: future finance charges (4) (9)
Present value of finance lease obligations 7 31
Current 3 4
Non-current 4 27
Total obligations under finance leases 7 31
It is the Group’s policy to lease certain of its property, plant and equipment under finance leases. Finance lease obligations included above are secured
against the assets concerned.
Notes to the consolidated financial statements continuedYear ended 31 July 2017
108 Ferguson plc Annual Report and Accounts 2017

25 – Provisions Environmental
and legal £m
Wolseley Insurance
£mRestructuring
£m
Other provisions
£mTotal
£m
At 31 July 2015 70 41 32 63 206
Utilised in the year (7) (12) (12) (4) (35)
Amortisation of discount 3 – – – 3
Charge for the year 5 18 8 7 38
Disposal of businesses and reclassified as held for sale (7) – (1) (11) (19)
Exchange rate adjustment 11 6 1 10 28
At 31 July 2016 75 53 28 65 221
Utilised in the year (11) (13) (23) (4) (51)
Changes in discount rate (10) – – – (10)
Charge for the year 7 14 50 5 76
Disposal of businesses and reclassified as held for sale (3) – (10) (24) (37)
Exchange rate adjustment 1 – – 1 2
At 31 July 2017 59 54 45 43 201
Provisions have been analysed between current and non-current as follows:
At 31 July 2017
Environmental and legal
£m
Wolseley Insurance
£mRestructuring
£m
Other provisions
£mTotal
£m
Current 10 18 28 25 81
Non-current 49 36 17 18 120
Total provisions 59 54 45 43 201
At 31 July 2016
Environmental and legal
£m
Wolseley Insurance
£mRestructuring
£m
Other provisions
£mTotal
£m
Current 23 14 16 35 88
Non-current 52 39 12 30 133
Total provisions 75 53 28 65 221
The environmental and legal provision includes £52 million (2016: £61 million) for the estimated liability for asbestos litigation on a discounted basis
using a long-term discount rate of 2.3 per cent (2016: 1.5 per cent). This amount has been actuarially determined as at 31 July 2017 based on advice from
independent professional advisers. The Group has insurance that it believes is sufficient cover for the estimated liability and accordingly an equivalent
insurance receivable has been recorded in other receivables. Based on current estimates, the amount of performing insurance cover significantly
exceeds the expected level of future claims and no material profit or cash flow impact is therefore expected to arise in the foreseeable future. Due to the
nature of these provisions, the timing of any settlements is uncertain.
Wolseley Insurance provisions represent an estimate, based on historical experience, of the ultimate cost of settling outstanding claims and claims
incurred but not reported on certain risks retained by the Group (principally USA casualty and global property damage). Due to the nature of these
provisions, the timing of any settlements is uncertain.
Restructuring provisions include provisions for staff redundancy costs and future lease rentals on closed branches. In determining the provision for
onerous leases, the cash flows have been discounted on a pre-tax basis using appropriate government bond rates. The weighted average maturity
of these obligations is approximately three years.
Other provisions include warranty costs relating to businesses disposed of, rental commitments on vacant properties and dilapidations on leased
properties. The weighted average maturity of these obligations is approximately three years.
Strategic report Governance Financials Other information
109Ferguson plc Annual Report and Accounts 2017

26 – Retirement benefit obligations(i) Long-term benefit plans provided by the Group
The Group has a defined benefit pension plan for certain of its UK employees. This plan was closed for future service accrual in December 2013 and
during October 2016 the plan was closed for future non-inflationary salary accrual. The Group operates a number of smaller plans in other jurisdictions,
providing pensions or other long-term benefits such as long service or termination awards. More information about the plans operated by the Group is
set out on page 126.
During the year, the Group secured a buy-in insurance policy with Pension Insurance Corporation (PIC) for the UK pension plan. This policy covered all
of the pensioner members of the plan and exactly matches the benefits provided by the plan. This has led to the recognition of an asset in respect of this
policy exactly equal to the insured liabilities at 31 July 2017. The difference between the premium paid and the asset recognised in respect of this policy
has been recognised as an actuarial movement in other comprehensive income.
(ii) Financial impact of plans
As disclosed in the Group balance sheet2017
£m2016
£m
Non-current asset 3 –
Current liability (8) (9)
Non-current liability (16) (138)
Total liability (24) (147)
Net liability (21) (147)
2017 2016
Analysis of Group balance sheet net asset/(liability)UK£m
Non-UK£m
Total£m
UK£m
Non-UK£m
Total£m
Fair value of plan assets 1,337 164 1,501 1,308 250 1,558
Present value of defined benefit obligation (1,334) (188) (1,522) (1,336) (369) (1,705)
Net asset/(liability) 3 (24) (21) (28) (119) (147)
Analysis of total (income)/expense recognised in the Group income statement2017
£m2016
£m
Current service cost 5 7
Administration costs 3 2
Exceptional past service gain (note 5) (11) –
Past service gain from settlements (2) (4)
(Credited)/charged to operating costs (a) (5) 5
Charged to finance costs (note 6) (b) 3 –
Total (income)/expense recognised in the Group income statement (2) 5
(a) Includes a charge of £2 million (2016: £nil) relating to discontinued operations.(b) Includes a charge of £1 million (2016: £1 million) relating to discontinued operations.
Expected employer contributions to the defined benefit plans for the year ending 31 July 2018 are £14 million. The remeasurement of the defined benefit
net liability is included in the Group statement of comprehensive income.
Analysis of amount recognised in the Group statement of comprehensive income2017
£m2016
£m
The return on plan assets (excluding amounts included in net interest expense) 5 40
Actuarial gain arising from changes in demographic assumptions 32 17
Actuarial loss arising from changes in financial assumptions (78) (200)
Actuarial gain arising from experience adjustments 40 23
Tax (1) 25
Total amount recognised in the Group statement of comprehensive income (2) (95)
The cumulative amount of actuarial losses recognised in the Group statement of comprehensive income is £370 million (2016: £369 million).
Notes to the consolidated financial statements continuedYear ended 31 July 2017
110 Ferguson plc Annual Report and Accounts 2017

26 – Retirement benefit obligations continued(ii) Financial impact of plans continued
The fair value of plan assets is as follows:
2017 2016
Fair value of plan assetsUK £m
Non-UK £m
Total £m
UK £m
Non-UK £m
Total £m
At 1 August 1,308 250 1,558 1,262 215 1,477
Interest income 31 5 36 45 6 51
Employer’s contributions 37 30 67 2 7 9
Participants’ contributions – 2 2 – 3 3
Benefit payments (46) (14) (60) (45) (15) (60)
Settlement payments – (3) (3) – – –
Disposal of businesses – (102) (102) – – –
Reclassification as held for sale – (8) (8) – – –
Remeasurement gain/(loss):
Return on plan assets (excluding amounts included in net interest expense) 7 (2) 5 44 (4) 40
Currency translation – 6 6 – 38 38
At 31 July 1,337 164 1,501 1,308 250 1,558
Actual return on plan assets 38 3 41 89 2 91
Employer’s contributions included special funding contributions of £55 million (2016: £nil).
At 31 July 2017, the plan assets were invested in a diversified portfolio comprised of:
2017 2016
Value at 31 JulyUK£m
Non-UK£m
Total£m
UK£m
Non-UK£m
Total£m
Equity type assets quoted 406 53 459 663 85 748
Government bonds quoted 255 36 291 356 22 378
Corporate bonds quoted 31 56 87 147 75 222
Real estate 40 – 40 4 24 28
Cash 35 8 43 12 10 22
Insurance policies 505 – 505 – 17 17
Other 65 11 76 126 17 143
Total market value of assets 1,337 164 1,501 1,308 250 1,558
2017 2016
Present value of defined benefit obligationUK £m
Non-UK £m
Total £m
UK £m
Non-UK £m
Total £m
At 1 August 1,336 369 1,705 1,206 286 1,492
Current service cost (including administrative costs) 2 6 8 2 7 9
Past service gain (11) (2) (13) (2) (2) (4)
Interest cost 31 8 39 41 10 51
Benefit payments (46) (14) (60) (45) (15) (60)
Settlement and curtailment payments – (5) (5) – – –
Participants’ contributions – 2 2 – 3 3
Remeasurement (gain)/loss:
Actuarial gain arising from changes in demographic assumptions (31) (1) (32) (14) (3) (17)
Actuarial loss/(gain) arising from changes in financial assumptions 91 (13) 78 174 26 200
Actuarial (gain)/loss arising from experience adjustments (38) (2) (40) (26) 3 (23)
Disposal of businesses – (120) (120) – – –
Reclassified as held for sale – (49) (49) – – –
Currency translation – 9 9 – 54 54
At 31 July 1,334 188 1,522 1,336 369 1,705
Strategic report Governance Financials Other information
111Ferguson plc Annual Report and Accounts 2017

26 – Retirement benefit obligations continued(ii) Financial impact of plans continued
Analysis of present value of defined benefit obligation2017
£m2016
£m
Amounts arising from wholly unfunded plans 3 44
Amounts arising from plans that are wholly or partly funded 1,519 1,661
1,522 1,705
(iii) Valuation assumptions
The financial assumptions used to estimate defined benefit obligations are:
2017 2016
UK Non-UK UK Non-UK
Discount rate 2.6% 3.6% 2.4% 2.2%
Inflation rate 3.2% 2.5% 2.8% 1.4%
Increase to deferred benefits during deferment 2.1% n/a 1.7% 1.8%
Increases to pensions in payment 2.9% 2.0% 2.5% 1.8%
Salary increases 2.1% 2.5% 1.7% 1.8%
The life expectancy assumptions used to estimate defined benefit obligations are:
2017 2016
UKYears
Non-UKYears
UKYears
Non-UKYears
Current pensioners (at age 65) – male 22 21 22 22
Current pensioners (at age 65) – female 24 24 24 24
Future pensioners (at age 65) – male 24 23 25 24
Future pensioners (at age 65) – female 26 25 27 26
The weighted average duration of the defined benefit obligation is 20.4 years (2016: 21.2 years).
(iv) Sensitivity analysis
The Group considers that the most sensitive assumptions are the discount rate, inflation and life expectancy. The table below shows the impact of the
sensitivities on the Group’s defined benefit plan net liability.
2017 2016
ChangeUK£m
Non-UK£m Change
UK£m
Non-UK£m
Discount rate +0.25% 69 4 +0.25% 68 13
(0.25)% (75) (4) (0.25)% (71) (14)
Inflation +0.25% (65) – +0.25% (61) (2)
(0.25)% 63 – (0.25)% 52 2
Life expectancy +1 year 52 6 +1 year 57 9
Notes to the consolidated financial statements continuedYear ended 31 July 2017
112 Ferguson plc Annual Report and Accounts 2017

27 – Share capital(i) Ordinary shares in issue
Authorised numbers Allotted and issued numbers
2017 2016 2017 2016
Number of ordinary 10 53⁄66 pence shares in the Company (million) 463 463 267 267
Nominal value of ordinary 10 53⁄66 pence shares in the Company (£ million) 50 50 29 29
All the allotted and issued shares, including those held by Employee Benefit Trusts and in Treasury, are fully paid or credited as fully paid.
A summary of the movements in the year is detailed in the following table:
2017 2016
Number of ordinary shares 10 53⁄66 pence ordinary shares in the Company in issue at 1 August 266,636,106 266,592,678
New shares issued to settle share options – 43,428
Number of 10 53⁄66 pence ordinary shares in the Company in issue at 31 July 266,636,106 266,636,106
Consideration received, net of transaction costs, in respect of shares issued to participants in the long term incentive plans and all-employee sharesave
plans amounted to £nil (2016: £nil).
(ii) Treasury shares
The shares purchased under the Group’s buyback programme have been retained in issue as Treasury shares and represent a deduction from equity
attributable to owners of the parent.
A summary of the movements in Treasury shares in the year is detailed in the following table:
Treasury shares
2017 2016
Number of shares
Cost£m
Number of shares
Cost£m
As at 1 August 14,259,276 516 7,105,842 240
Treasury shares purchased – – 7,862,836 300
Disposal of Treasury shares to settle share options (876,696) (31) (709,402) (24)
As at 31 July 13,382,580 485 14,259,276 516
Consideration received in respect of shares transferred to participants in the long term incentive plans and all-employee sharesave plans amounted
to £21 million (2016: £14 million). After the reporting date the Directors proposed a further share buyback programme of up to £500 million.
(iii) Own shares
Two Employee Benefit Trusts have been established in connection with the Company’s discretionary share option plans and long term incentive plans.
A summary of the movements in own shares held in Employee Benefit Trusts is detailed in the following table below:
Own shares
2017 2016
Number of shares
Cost£m
Number of shares
Cost£m
As at 1 August 1,762,657 57 2,019,377 63
New shares purchased 142,000 6 368,441 14
Exercise of share options (469,502) (15) (625,161) (20)
As at 31 July 1,435,155 48 1,762,657 57
Consideration received in respect of shares transferred to participants in the discretionary share option plans and long term incentive plans amounted
to £nil (2016: £1 million). At 31 July 2017, the shares held in the trusts had a market value of £65 million (2016: £74 million).
Dividends due on shares held by the Employee Benefit Trusts are waived in accordance with the provisions of the trust deeds.
Strategic report Governance Financials Other information
113Ferguson plc Annual Report and Accounts 2017

28 – Share-based payments
Analysis of charge to income statement2017
£m
Restated2016
£m
Executive share option plans – 2
Ordinary share plans 15 12
All-employee sharesave plans 2 1
Long term incentive plans 3 2
20 17
The total share-based payments charge including discontinued operations was £22 million (2016: £20 million).
The number and weighted average exercise price of outstanding and exercisable share options and share awards are detailed below:
2017 2016
Number of shares/options
000’s
Weighted average exercise price
£
Number of shares/options
000’s
Weighted average exercise price
£
Outstanding at 1 August 3,728 13.21 4,423 13.91
Granted 1,282 8.60 1,022 9.80
Options exercised or shares vested (1,350) 15.61 (1,438) 11.89
Surrendered or expired (401) 9.99 (279) 18.65
Outstanding at 31 July 3,259 10.80 3,728 13.21
Exercisable at 31 July 353 18.80 696 18.35
2017 2016
Weighted average fair value per share/option granted during the year (£) 32.95 24.28
At 31 July 2017 and 31 July 2016, all of the shares and options outstanding had an exercise price which was below the market price. The market price at
31 July 2017 was £45.27 (2016: £42.09) and the average share price in the year to 31 July 2017 was £47.28 (2016: £38.30). For executive share option plans
and all-employee sharesave plans, the range of exercise prices for shares and options outstanding at 31 July 2017 was £12.69 to £42.96 (2016: £7.01 to
£33.62). For the ordinary share plan and long term incentive plans, all share options outstanding at 31 July 2017 had an exercise price of £nil (2016: £nil).
For shares and options outstanding at 31 July 2017, the weighted average remaining contractual life was three years (2016: four years).
The fair value at the date of grant of options awarded during the year has been estimated using the binomial methodology for all plans except the portion
of the grants awarded under the long term incentive plan that are subject to a relative Total Shareholder Return (“TSR”) performance condition, for which
a Monte Carlo simulation was used.
The fair value of shares granted under the ordinary share plan was calculated as the market price of the shares at the date of grant reduced by the
present value of dividends expected to be paid over the vesting period.
The principal assumptions required by these methodologies were:
Ordinary share plans All-employee sharesave plans Long term incentive plans
2017 2016 2017 2016 2017 2016
Risk-free interest rate 0.3% 0.7% 0.1% 0.6% 0.3% 0.7%
Expected dividend yield 2.7% 3.0% 2.4% 2.7% 0.0% 2.2%
Expected volatility 22% 23% 22% 25% 22% 23%
Expected life 1–3 years 3 years 1–6 years 1–6 years 3 years 3 years
There were no executive share options granted in the period.
Expected volatility has been estimated on the basis of historical volatility over the expected term, excluding the effect of extraordinary volatility due
to the Group’s capital reorganisation and rights issue in 2009. Expected life has been estimated on the basis of historical data on the exercise pattern.
Additional information on share-based payment plans operated by the Group is provided on page 127.
Notes to the consolidated financial statements continuedYear ended 31 July 2017
114 Ferguson plc Annual Report and Accounts 2017

29 – Reconciliation of profit to cash generated from operationsProfit for the year is reconciled to cash generated from continuing and discontinued operations as follows:
2017 £m
2016 £m
Profit for the year 783 650
Net finance costs 39 34
Share of result of associate 1 –
Tax expense 290 236
Gain on disposal and closure of businesses and revaluation of assets held for sale (256) (147)
Depreciation and impairment of property, plant and equipment 143 125
Amortisation and impairment of non-acquired intangible assets 24 15
Amortisation and impairment of goodwill and acquired intangible assets 170 147
Loss/(profit) on disposal of property, plant and equipment and assets held for sale 9 (18)
Increase in inventories (97) (36)
Increase in trade and other receivables (211) (21)
Increase in trade and other payables 231 13
(Decrease)/increase in provisions and other liabilities (33) 1
Share-based payments 22 20
Cash generated from operations 1,115 1,019
Trading profit is reconciled to cash generated from continuing and discontinued operations as follows:
2017 £m
Restated2016
£m
Trading profit 1,059 857
Exceptional items in operating profit 229 (4)
Gain on disposal and closure of businesses and revaluation of assets held for sale (256) (147)
Operating (loss)/profit from discontinued operations before the amortisation and impairment of goodwill and acquired intangible assets (note 8) (5) 214
Depreciation and impairment of property, plant and equipment 143 125
Amortisation and impairment of non-acquired intangible assets 24 15
Loss/(profit) on disposal of property, plant and equipment and assets held for sale 9 (18)
Increase in inventories (97) (36)
Increase in trade and other receivables (211) (21)
Increase in trade and other payables 231 13
(Decrease)/increase in provisions and other liabilities (33) 1
Share-based payments 22 20
Cash generated from operations 1,115 1,019
Strategic report Governance Financials Other information
115Ferguson plc Annual Report and Accounts 2017

30 – AcquisitionsThe Group acquired the following 11 businesses in the year ended 31 July 2017. All these businesses are engaged in the distribution of plumbing and
heating products and building materials. All transactions have been accounted for by the purchase method of accounting. The Group also acquired a
share of Walter Meier AG (see note 15), which has been accounted for as an associate.
Name Date of acquisitionCountry of
incorporationShares/asset
deal % acquired
Clawfoot Supply LLC (t/a Signature Hardware) August 2016 USA Shares 100
Westfield Lighting Co., Inc. August 2016 USA Asset 100
Mölnlycke Trä AB October 2016 Sweden Shares 100
Berners Tunga Fordon Fastighet AB October 2016 Sweden Shares 100
Ramapo Wholesalers Inc. October 2016 USA Asset 100
The Plumbing Source Co., Inc. October 2016 USA Shares 100
Underground Pipe & Valve, Incorporated November 2016 USA Asset 100
Matera Paper Company, Inc. December 2016 USA Shares 100
P.V. Sullivan Supply Co., Inc. February 2017 USA Asset 100
Custom Lighting Incorporated and Custom Hardware and Accessories, Inc. February 2017 USA Asset 100
Lighting Unlimited, LLC February 2017 USA Asset 100
The assets and liabilities acquired and the consideration for all acquisitions in the period are as follows:
Book values acquired
£m
Fair value adjustments
£m
Provisional fair values acquired
£m
Intangible assets
– Customer relationships – 25 25
– Trade names and brands – 46 46
– Other – 10 10
Property, plant and equipment 25 1 26
Inventories 47 (9) 38
Receivables 23 – 23
Cash, cash equivalents and bank overdrafts 8 – 8
Payables (14) – (14)
Deferred tax – (9) (9)
Total 89 64 153
Goodwill arising 139
Consideration 292
Satisfied by:
Cash 254
Deferred consideration 38
Total consideration 292
The fair value adjustments are provisional figures, being the best estimates currently available. Further adjustments may be necessary when additional
information is available for some of the judgemental areas.
The goodwill arising on these acquisitions is attributable to the anticipated profitability of the new markets and product ranges to which the Group
has gained access and additional profitability and operating efficiencies available in respect of existing markets.
The acquisitions contributed £214 million to revenue, £29 million to trading profit and £12 million to the Group’s operating profit for the period between
the date of acquisition and the balance sheet date. It is not practicable to disclose profit before and after tax, as the Group manages its borrowings
as a portfolio and cannot attribute an effective borrowing rate to an individual acquisition.
If each acquisition had been completed on the first day of the financial year, Group revenue would have been £15,277 million and Group trading profit
would have been £1,062 million. It is not practicable to disclose profit before tax or profit attributable to equity shareholders, as stated above. It is also not
practicable to disclose operating profit as the Group cannot estimate the amount of intangible assets that would have been acquired at a date other than
the acquisition date.
Notes to the consolidated financial statements continuedYear ended 31 July 2017
116 Ferguson plc Annual Report and Accounts 2017
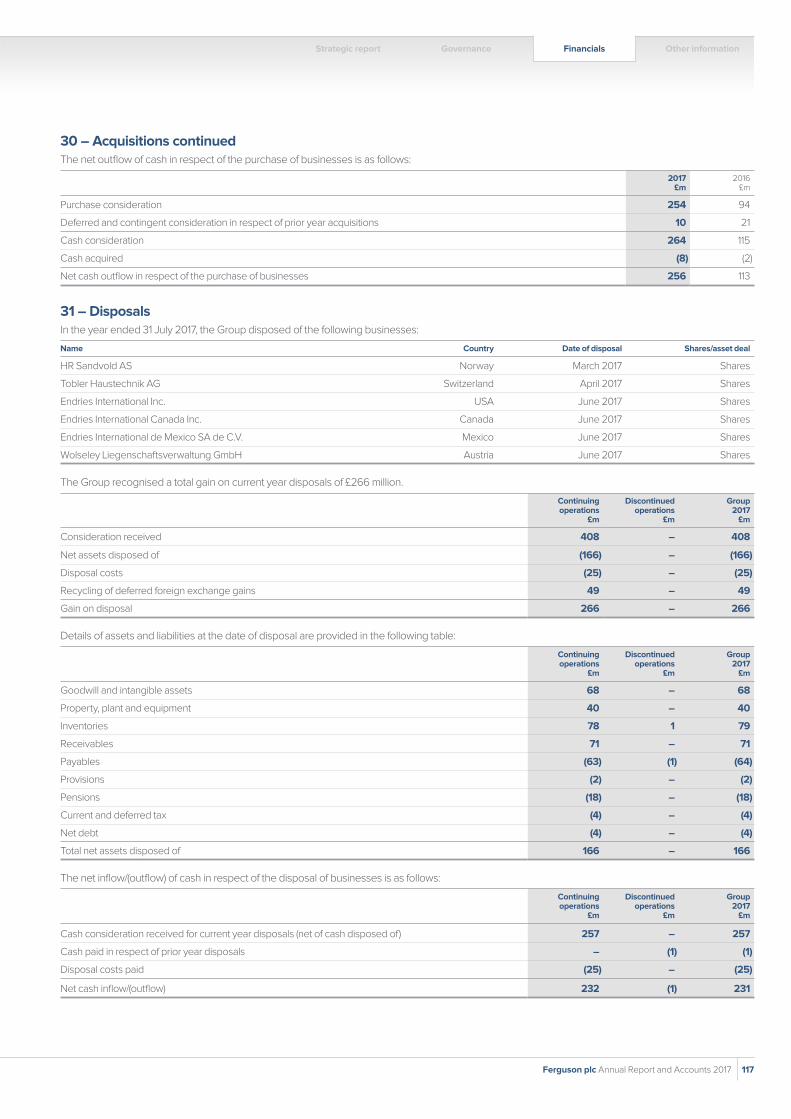
Strategic report Governance Financials Other information
117Ferguson plc Annual Report and Accounts 2017
30 – Acquisitions continuedThe net outflow of cash in respect of the purchase of businesses is as follows:
2017 £m
2016 £m
Purchase consideration 254 94
Deferred and contingent consideration in respect of prior year acquisitions 10 21
Cash consideration 264 115
Cash acquired (8) (2)
Net cash outflow in respect of the purchase of businesses 256 113
31 – DisposalsIn the year ended 31 July 2017, the Group disposed of the following businesses:
Name Country Date of disposal Shares/asset deal
HR Sandvold AS Norway March 2017 Shares
Tobler Haustechnik AG Switzerland April 2017 Shares
Endries International Inc. USA June 2017 Shares
Endries International Canada Inc. Canada June 2017 Shares
Endries International de Mexico SA de C.V. Mexico June 2017 Shares
Wolseley Liegenschaftsverwaltung GmbH Austria June 2017 Shares
The Group recognised a total gain on current year disposals of £266 million.
Continuing operations
£m
Discontinued operations
£m
Group 2017
£m
Consideration received 408 – 408
Net assets disposed of (166) – (166)
Disposal costs (25) – (25)
Recycling of deferred foreign exchange gains 49 – 49
Gain on disposal 266 – 266
Details of assets and liabilities at the date of disposal are provided in the following table:
Continuing operations
£m
Discontinued operations
£m
Group2017
£m
Goodwill and intangible assets 68 – 68
Property, plant and equipment 40 – 40
Inventories 78 1 79
Receivables 71 – 71
Payables (63) (1) (64)
Provisions (2) – (2)
Pensions (18) – (18)
Current and deferred tax (4) – (4)
Net debt (4) – (4)
Total net assets disposed of 166 – 166
The net inflow/(outflow) of cash in respect of the disposal of businesses is as follows:
Continuing operations
£m
Discontinued operations
£m
Group2017
£m
Cash consideration received for current year disposals (net of cash disposed of) 257 – 257
Cash paid in respect of prior year disposals – (1) (1)
Disposal costs paid (25) – (25)
Net cash inflow/(outflow) 232 (1) 231

32 – Reconciliation of opening to closing net debt
For the year ended 31 July 2017
At 1 August
2016 £m
Cash flows
£m
Acquisitions and new
finance leases £m
Disposal of businesses
£m
Fair value and other
adjustments £m
Held for sale movements
£m
Exchange movement
£m
At 31 July
2017 £m
Cash and cash equivalents 940 1,911
Bank overdrafts (692) (1,500)
248 228 8 (25) – (33) (15) 411
Derivative financial instruments 31 (9) – – – – (2) 20
Bank and other loans (1,184) 134 – 7 8 79 (2) (958)
Obligations under finance leases (31) 5 (3) 22 – – – (7)
Net debt (936) 358 5 4 8 46 (19) (534)
For the year ended 31 July 2016
At 1 August
2015 £m
Cash flows
£m
Acquisitions and new
finance leases £m
Disposal of businesses
£m
Fair value and other
adjustments £m
Held for sale movements
£m
Exchange movement
£m
At 31 July
2016 £m
Cash and cash equivalents 1,105 940
Bank overdrafts (848) (692)
257 (28) 2 – – (1) 18 248
Derivative financial instruments 33 (10) – – 1 – 7 31
Bank and other loans (1,066) 16 – 27 9 – (170) (1,184)
Obligations under finance leases (29) 4 (2) – – – (4) (31)
Net debt (805) (18) – 27 10 (1) (149) (936)
33 – Related party transactionsThere are no related party transactions requiring disclosure under IAS 24 “Related Party Disclosures” other than the compensation of key management
personnel which is set out in note 11.
34 – Operating lease commitmentsFuture minimum lease payments under non-cancellable operating leases for the following periods are:
2017 £m
2016 £m
Within one year 260 253
Later than one year and less than five years 461 457
After five years 133 143
Total operating lease commitments 854 853
Operating lease payments mainly represent rents payable for properties. Some of the Group’s operating lease arrangements have renewal options and
rental escalation clauses. No arrangements have been entered into for contingent rental payments.
The commitments shown above include commitments for onerous leases which have already been provided for. At 31 July 2017, provisions include an
amount of £27 million (2016: £25 million) in respect of minimum lease payments for such onerous leases net of sublease income expected to be received.
The total minimum sublease income expected to be received under non-cancellable subleases at 31 July 2017 is £7 million (2016: £8 million).
The commitments above include £91 million operating lease commitments (2016: £102 million) for discontinued operations.
Notes to the consolidated financial statements continuedYear ended 31 July 2017
118 Ferguson plc Annual Report and Accounts 2017
35 – Contingent liabilitiesGroup companies are, from time to time, subject to certain claims and
litigation arising in the normal course of business in relation to, among
other things, the products that they supply, contractual and commercial
disputes and disputes with employees. Provision is made if, on the basis of
current information and professional advice, liabilities are considered likely
to arise. In the case of unfavourable outcomes, the Group may benefit from
applicable insurance protection.
Warranties and indemnities in relation to business disposals
Over the past few years, the Group has disposed of a number of non-core
businesses and various Group companies have provided certain standard
warranties and indemnities to acquirers and other third parties. Provision is
made where the Group considers that a liability is likely to crystallise,
though it is possible that claims in respect of which no provision has been
made could crystallise in the future. Group companies have also made
contractual commitments for certain property and other obligations which
could be called upon in an event of default. As at the date of this report,
there are no significant outstanding claims in relation to business disposals.
Environmental liabilities
The operations of certain Group companies are subject to specific
environmental regulations. From time to time, the Group conducts
preliminary investigations through third parties to assess potential risks
including potential soil or groundwater contamination of sites. Where an
obligation to remediate contamination arises then this is provided for,
though future liabilities could arise from sites for which no provision
is made.
Outcome of claims and litigation
The outcome of claims and litigation to which Group companies are
party cannot readily be foreseen as, in some cases, the facts are unclear,
further time is needed to assess properly the merits of the case, or they
are part of continuing legal proceedings. However, based on information
currently available, the Directors consider that the cost to the Group of an
unfavourable outcome arising from such litigation is not expected to have
a material adverse effect on the financial position of the Group.
36 – Post-balance sheet eventsSince the year-end, the Group has acquired five businesses, two in the
USA and three in Canada and Central Europe with a combined annual
revenue of £109 million. As at the date of this report, the accounting for
these transactions has not been finalised.
On 31 August 2017, the Group disposed of Silvan, its DIY business
in Denmark.
37 – Additional information(i) Group accounting policies
A summary of the principal accounting policies applied by the Group in
the preparation of the consolidated financial statements is set out below.
The accounting policies have been applied consistently throughout the
current and preceding year.
ConsolidationThe consolidated financial information includes the results of the
parent company and entities controlled by the Company (its subsidiary
undertakings and controlling interests) and its share of the results of
its associate drawn up to 31 July 2017.
The trading results of business operations are included in profit from
continuing operations from the date of acquisition or up to the date of sale.
Intra-group transactions and balances and any unrealised gains and losses
arising from intra-group transactions are eliminated on consolidation,
with the exception of gains or losses required under relevant IFRS
accounting standards.
Discontinued operationsWhen the Group has disposed of or intends to dispose of a business
component that represents a separate major line of business or
geographical area of operations, it classifies such operations as
discontinued. The post-tax profit or loss of the discontinued operations
is shown as a single line on the face of the income statement, separate
from the other results of the Group.
Foreign currenciesItems included in the financial statements of each of the Group’s subsidiary
undertakings are measured using the currency of the primary economic
environment in which the subsidiary undertaking operates (the “functional
currency”). The consolidated financial statements are presented in sterling,
which is the presentational currency of the Group and the functional
currency of the parent company.
The trading results of overseas subsidiary undertakings are translated
into sterling using the average rates of exchange ruling during the relevant
financial period. The balance sheets of overseas subsidiary undertakings
are translated into sterling at the rates of exchange ruling at the period end.
Exchange differences arising between the translation into sterling of the
net assets of these subsidiary undertakings are recognised in the currency
translation reserve (as are exchange differences on foreign currency
borrowings to the extent that they are used to finance or provide a hedge
against foreign currency net assets).
Changes in the fair value of derivative financial instruments, entered into to
hedge foreign currency net assets and that satisfy the hedging conditions
of IAS 39, are recognised in the currency translation reserve (see the
separate accounting policy on derivative financial instruments).
In the event that a subsidiary undertaking which has a non-sterling
functional currency is disposed of, the gain or loss on disposal recognised
in the income statement is determined after taking into account the
cumulative currency translation differences that are attributable to
the subsidiary undertaking concerned.
Foreign currency transactions entered into during the year are translated
into sterling at the rates of exchange ruling on the dates of the transactions.
Monetary assets and liabilities denominated in foreign currencies are
retranslated at the rate of exchange ruling at the balance sheet date.
All currency translation differences are taken to the income statement with
the exception of differences on foreign currency net borrowings to the
extent that they are used to finance or provide a hedge against foreign
currency net assets as detailed above.
Business combinationsThe cost of an acquisition is measured as the fair value of the assets given,
equity instruments issued and liabilities incurred or assumed at the date
of exchange. Identifiable assets acquired and liabilities and contingent
liabilities assumed in a business combination are measured initially at their
fair values at the acquisition date, irrespective of the extent of any non-
controlling interest. Acquisition-related costs are expensed as incurred.
The excess of the cost of acquisition over the fair value of the Group’s
share of the identifiable net assets acquired is recorded as goodwill. If the
cost of acquisition is less than the fair value of the Group’s share of the net
assets of the subsidiary acquired, the difference is recognised directly in
the income statement.
Non-controlling interestsNon-controlling interests in subsidiaries are identified separately from the
equity attributable to shareholders of the Company. The interests of non-
controlling shareholders are initially measured at fair value. Subsequent to
acquisition, the carrying amount of non-controlling interests is the amount
of those interests at initial recognition plus the non-controlling interests’
share of subsequent changes in equity.
Total comprehensive income is attributed to non-controlling interests even
if this results in the non-controlling interests showing a deficit balance.
Strategic report Governance Financials Other information
119Ferguson plc Annual Report and Accounts 2017

37 – Additional information continued(i) Group accounting policies continued
Interests in associatesInvestments in companies where significant influence is exercised
are accounted for as interests in associates using the equity method
of accounting from the date the investee becomes an associate.
The investment is initially recognised at cost and adjusted thereafter for
changes in the Group’s share in the net assets of the investee. The Group’s
share of profit or loss after tax is recognised in the Group income
statement and share of other comprehensive income or expense is
recognised in the Group statement of other comprehensive income.
On acquisition of the investment in an associate, any excess of the cost
of the investment over the Group’s share of the net assets of the investee
is recognised as goodwill, which is included within the carrying amount
of the investment. The requirements of IAS 36 are applied to determine
whether it is necessary to recognise any impairment loss with respect to
the Group’s investment in an associate.
RevenueRevenue is the amount receivable for the provision of goods and services
falling within the Group’s ordinary activities, excluding intra-group sales,
estimated and actual sales returns, trade and early settlement discounts,
value added tax and similar sales taxes.
The Group acts as principal for direct sales which are delivered directly
to the customer by the supplier.
Revenue from the provision of goods is recognised when the risks and
rewards of ownership of goods have been transferred to the customer.
The risks and rewards of ownership of goods are deemed to have been
transferred when the goods are shipped to, or picked up by, the customer.
Revenue from services is recognised when the service provided to the
customer has been completed.
Customer loyalty credits are accounted for as a separate component
of the sales transaction in which they are granted. A portion of the fair
value of the consideration received is allocated to the loyalty credits
and recognised in the period that loyalty credits are redeemed.
Revenue from the provision of goods and services is only recognised
when the amounts to be recognised are fixed or determinable and
collectability is reasonably assured.
Cost of salesCost of sales includes purchased goods, the cost of bringing inventory
to its present location and condition and labour and overheads attributable
to assembly and construction services.
Supplier rebatesIn line with industry practice, the Group has agreements (“Supplier
Rebates”) with a number of its suppliers whereby volume-based rebates,
marketing support and other discounts are received in connection with
the purchase of goods for resale from those suppliers. Rebates relating to
the purchase of goods for resale are accrued as earned and are recorded
initially as a deduction in inventory with a subsequent reduction in cost of
sales when the related product is sold.
Volume-based rebatesThe majority of volume-based rebates are determined by reference to
guaranteed rates of rebate. These are calculated through a mechanical
process with minimal judgement required to determine the amount
recorded in the income statement.
A small proportion of volume-based rebates are subject to stepped
targets where the rebate percentage increases as volumes purchased
reach agreed targets within a set period of time. The majority of rebate
agreements apply to purchases in a calendar year and therefore, for
stepped rebates, judgement is required to estimate the rebate amount
recorded in the income statement at the end of the period. The Group
assesses the probability that targeted volumes will be achieved in the
year based on forecasts which are informed by historical trading patterns,
current performance and trends. This judgement is exercised consistently
with historically insignificant true ups at the end of the period.
An amount due in respect of Supplier Rebates is not recognised within
the income statement until all the relevant performance criteria, where
applicable, have been met and the goods have been sold to a third party.
Marketing supportMarketing support, which represents a smaller element of the Group’s
overall Supplier Rebates, is recognised in the income statement when
all performance conditions have been fulfilled.
Supplier Rebates receivableWhere Supplier Rebates are netted off the amounts owing to that
supplier, any outstanding amount at the balance sheet date is included
within trade payables. Where the Supplier Rebates are not offset against
amounts owing to a supplier, the outstanding amount is included within
prepayments. The carrying value of inventory is reduced by the relevant
amount where the inventory has not been sold by the balance sheet date.
Intangible assetsGoodwillGoodwill represents the excess of the cost of an acquisition over the
fair value of the Group’s share of the net identifiable assets of the
acquired subsidiary undertaking at the date of acquisition. Goodwill on
acquisitions of subsidiary undertakings is included within intangible assets.
Goodwill is allocated to cash generating units or aggregations of cash
generating units (together “CGUs”) where synergy benefits are expected.
CGUs are independent sources of income streams and represent
the lowest level within the Group at which the associated goodwill is
monitored for management purposes. The Group considers that a CGU
is a business unit because independent cash flows cannot be identified
below this level.
Goodwill is not amortised but is tested annually for impairment and
carried at cost less accumulated impairment losses. For goodwill
impairment testing purposes, no CGU is larger than the reporting
segments determined in accordance with IFRS 8 “Operating Segments”.
The recoverable amount of goodwill and acquired intangible assets is
assessed on the basis of the value in use estimate for CGUs to which they
are attributed. Where carrying value exceeds the recoverable amount a
provision for the impairment is established with a charge included in the
income statement.
Gains and losses on the disposal of an entity include the carrying amount
of goodwill relating to the entity sold.
Other intangible assetsAn intangible asset, which is an identifiable non-monetary asset without
physical substance, is recognised to the extent that it is probable that the
expected future economic benefits attributable to the asset will flow to
the Group and that its cost can be measured reliably. The asset is deemed
to be identifiable when it is separable or when it arises from contractual or
other legal rights.
Intangible assets, primarily brands, trade names and customer
relationships, acquired as part of a business combination are capitalised
separately from goodwill and are carried at cost less accumulated
amortisation and accumulated impairment losses. Amortisation is
calculated using the reducing balance method for customer relationships
and the straight-line method for other intangible assets.
Notes to the consolidated financial statements continuedYear ended 31 July 2017
120 Ferguson plc Annual Report and Accounts 2017

37 – Additional information continued(i) Group accounting policies continued
The cost of the intangible assets is amortised and charged to operating
costs in the income statement over their estimated useful lives as follows:
Customer relationships 4–25 years
Trade names and brands 1–15 years
Other 1–4 years
Computer software that is not integral to an item of property, plant and
equipment is recognised separately as an intangible asset and is carried
at cost less accumulated amortisation and accumulated impairment
losses. Costs include software licences and external and internal costs
directly attributable to the development, design and implementation of the
computer software. Costs in respect of training and data conversion are
expensed as incurred. Amortisation is calculated using the straight-line
method so as to charge the cost of the computer software to operating
costs in the income statement over its estimated useful life of between
three and five years.
Property, plant and equipment (“PPE”)PPE is carried at cost less accumulated depreciation and accumulated
impairment losses, except for land and assets in the course of
construction, which are not depreciated and are carried at cost less
accumulated impairment losses. Cost includes expenditure that is directly
attributable to the acquisition of the items. In addition, subsequent costs
are included in the asset’s carrying amount or recognised as a separate
asset, as appropriate, only when it is probable that future economic
benefits associated with the item will flow to the Group and the cost of
the item can be measured reliably. All other repairs and maintenance costs
are charged to the income statement during the financial period in which
they are incurred.
Assets are depreciated to their estimated residual value using the
straight-line method over their useful lives as follows:
Freehold buildings and long leaseholds 20–50 years
Operating leasehold improvements over the period of the lease
Plant and machinery 7–10 years
Computer hardware 3–5 years
Fixtures and fittings 5–7 years
Motor vehicles 4 years
The residual values and useful lives of PPE are reviewed and adjusted
if appropriate at each balance sheet date.
Borrowing costs directly attributable to the long-term construction or
production of an asset are capitalised as part of the cost of the asset.
Leased assetsAssets held under finance leases, which are leases where substantially
all the risks and rewards of ownership of the asset have transferred to
the Group, are capitalised in the balance sheet and depreciated over
the shorter of the lease term or their useful lives. The asset is recorded
at the lower of its fair value and the present value of the minimum
lease payments at the inception of the lease. The capital elements of
future obligations under finance leases are included in liabilities in the
balance sheet and analysed between current and non-current amounts.
The interest elements of future obligations under finance leases are
charged to the income statement over the periods of the leases and
represent a constant proportion of the balance of capital repayments
outstanding in accordance with the effective interest rate method.
Leases where the lessor retains substantially all the risks and rewards of
ownership are classified as operating leases. The cost of operating leases
(net of any incentives received from the lessor) is charged to the income
statement on a straight-line basis over the period of the leases.
Assets and disposal groups held for sale Assets are classified as held for sale if their carrying amount will be
recovered by sale rather than by continuing use in the business.
Where a group of assets and their directly associated liabilities are to be
disposed of in a single transaction, such disposal groups are also classified
as held for sale. For this to be the case, the asset or disposal group must
be available for immediate sale in its present condition and management
must be committed to and have initiated a plan to sell the asset or disposal
group which, when initiated, was expected to result in a completed
sale within 12 months. Assets that are classified as held for sale are not
depreciated. Assets or disposal groups that are classified as held for sale
are measured at the lower of their carrying amount and fair value less
costs to sell.
InventoriesInventories, which comprise goods purchased for resale, are stated at the
lower of cost and net realisable value. Cost is determined using the first-in,
first-out (“FIFO”) method or the average cost method as appropriate to the
nature of the transactions in those items of inventory. The cost of goods
purchased for resale includes import and custom duties, transport and
handling costs, freight and packing costs and other attributable costs less
trade discounts, rebates and other subsidies. It excludes borrowing costs.
Net realisable value is the estimated selling price in the ordinary course of
business, less applicable variable selling expenses.
Provisions are made against slow-moving, obsolete and damaged
inventories for which the net realisable value is estimated to be less than
the cost. The risk of obsolescence of slow-moving inventory is assessed
by comparing the level of inventory held to estimated future sales on the
basis of historical experience.
Trade receivablesTrade receivables are recognised initially at fair value and measured
subsequently at amortised cost using the effective interest method, less
provision for impairment. A provision for impairment of trade receivables
is established when there is objective evidence that the Group will not
be able to collect all amounts due according to the original terms of the
receivables. The amount of the loss is recognised in the income statement.
Trade receivables are written off against the provision when recoverability
is assessed as being remote. Subsequent recoveries of amounts
previously written off are credited to the income statement.
ProvisionsProvisions for self-insured risks, legal claims, environmental restoration
and onerous leases are recognised when the Group has a present legal or
constructive obligation as a result of past events, it is more likely than not
that an outflow of resources will be required to settle the obligation and
the amount can be reliably estimated. Such provisions are measured at the
present value of management’s best estimate of the expenditure required
to settle the present obligation at the balance sheet date. The discount rate
used to determine the present value reflects current market assessments
of the time value of money. Provisions are not recognised for future
operating losses.
Retirement benefit obligationsContributions to defined contribution pension plans and other post-
retirement benefits are charged to the income statement as incurred.
For defined benefit pension plans and other retirement benefits, the
cost of providing benefits is determined annually using the Projected
Unit Credit Method by independent qualified actuaries. The current
service cost of defined benefit plans is recorded within operating profit.
Past service costs are recognised immediately in income.
Strategic report Governance Financials Other information
121Ferguson plc Annual Report and Accounts 2017

37 – Additional information continued(i) Group accounting policies continued
The net interest amount is calculated by applying the discount rate used
to measure the defined benefit net asset or liability at the beginning of
the period. The pension plan net interest is presented as finance income
or expense.
Actuarial gains and losses arising from experience adjustments and
changes in actuarial assumptions are charged or credited to equity in other
comprehensive income in the period in which they arise. The liability/asset
recognised in the balance sheet in respect of defined benefit pension
plans is the fair value of plan assets less the present value of the defined
benefit obligation at the end of the reporting period.
TaxCurrent tax represents the expected tax payable (or recoverable) on
the taxable income (or losses) for the year using tax rates enacted or
substantively enacted at the balance sheet date and taking into account
any adjustments arising from prior years.
Deferred tax is provided in full, using the liability method, on temporary
differences arising between the tax bases of assets and liabilities and their
carrying amounts in the consolidated financial statements. Deferred tax
is not accounted for if it arises from initial recognition of an asset or liability
in a transaction, other than a business combination, that at the time of the
transaction affects neither accounting nor taxable profit or loss.
Deferred tax is determined using tax rates (and laws) that have been
enacted or substantively enacted by the balance sheet date and are
expected to apply when the related deferred tax asset is realised or
the deferred tax liability is settled. Deferred tax assets are recognised
to the extent that it is probable that future taxable profit will be available
against which the temporary differences can be utilised.
Deferred tax is provided on temporary differences arising on investments
in subsidiaries except where the timing of the reversal of the temporary
difference is controlled by the Group and it is probable that the temporary
difference will not reverse in the foreseeable future.
Tax provisionsThe Group is subject to income taxes in numerous jurisdictions.
Judgement is sometimes required in determining the worldwide provision
for income taxes. There may be transactions and calculations for which
the ultimate tax determination is uncertain and may be challenged by the
tax authorities. The Group recognises liabilities for anticipated or actual tax
audit issues based on estimates of whether additional taxes will be due.
Where an outflow of funds to a tax authority is considered probable and
the Group can make a reliable estimate of the outcome of the dispute,
management calculates the provision using the single best estimate
of likely outcome approach. In assessing its uncertain tax provisions,
management takes into account the specific facts of each dispute, the
likelihood of settlement and the advice from its in-house tax specialists
and professional advisers. Where the ultimate liability in a dispute varies
from the amounts provided, such differences could impact the current and
deferred income tax assets and liabilities in the period in which the dispute
is concluded.
The Group believes that it has made adequate provision for the liabilities
likely to arise from open audits and assessments. At 31 July 2017, the
Group has recognised provisions of £162 million in respect of its uncertain
tax positions (2016: £166 million). The total provision has decreased by
£4 million in the year due to the settlement of various open tax issues in
the UK. The remaining open significant tax issues relate predominantly
to cross border transfer pricing risks. Given the uncertainty regarding
the timing of the resolution of these matters, it is difficult for the Group
to estimate whether there will be a material change in its estimate of
uncertain tax provisions within the next 12 months.
Share capitalIncremental costs directly attributable to the issue of new shares or options
are shown in equity as a deduction from the proceeds, net of tax.
Where any Group company purchases the Company’s equity share capital
(Treasury shares), the consideration paid, including any directly attributable
incremental costs (net of tax), is deducted from equity attributable to
the Company’s equity holders until the shares are cancelled, reissued
or disposed of. Where such shares are subsequently sold or reissued,
any consideration received, net of any directly attributable incremental
transaction costs and the related tax effects, is included in equity
attributable to the Company’s equity holders.
Share-based paymentsShare-based incentives are provided to employees under the Group’s
executive share option plan, long term incentive plan, all-employee
sharesave plan, ordinary share plan, performance ordinary share plan
and revised ordinary share plan. The Group recognises a compensation
cost in respect of these plans that is based on the fair value of the awards,
measured using Binomial and Monte Carlo valuation methodologies.
For equity-settled plans, the fair value is determined at the date of
grant (including the impact of any non-vesting conditions such as a
requirement for employees to save) and is not subsequently remeasured
unless the conditions on which the award were granted are modified.
For cash-settled plans, the fair value is determined at the date of grant
and is remeasured at each balance sheet date until the liability is settled.
Generally, the compensation cost is recognised on a straight-line basis
over the vesting period. Adjustments are made to reflect expected and
actual forfeitures during the vesting period due to the failure to satisfy
service conditions or non-market performance conditions.
Dividends payableDividends on ordinary shares are recognised in the Group’s financial
statements in the period in which the dividends are approved by the
shareholders of the Company or paid.
Cash and cash equivalentsCash and cash equivalents includes cash in hand, deposits held at call with
banks, other short-term highly liquid investments with original maturities
of three months or less and bank overdrafts. Bank overdrafts are shown
within borrowings in current liabilities on the balance sheet to the extent
that there is no legal right of offset and no practice of net settlement with
cash balances.
Cash which is not freely available to the Group is disclosed as
restricted cash.
Derivative financial instrumentsDerivative financial instruments, in particular interest rate swaps and
foreign exchange swaps, are used to manage the financial risks arising
from the business activities of the Group and the financing of those
activities. There is no trading activity in derivative financial instruments.
At the inception of a hedging transaction involving the use of derivative
financial instruments, the Group documents the relationship between
the hedged item and the hedging instrument together with its risk
management objective and the strategy underlying the proposed
transaction. The Group also documents its assessment, both at the
inception of the hedging relationship and subsequently on an ongoing
basis, of the effectiveness of the hedge in offsetting movements in the
fair values or cash flows of the hedged items.
Derivative financial instruments are recognised as assets and liabilities
measured at their fair values at the balance sheet date. Where derivative
financial instruments do not fulfil the criteria for hedge accounting
contained in IAS 39, changes in their fair values are recognised in the
income statement. When hedge accounting is used, the relevant hedging
relationships are classified as fair value hedges, cash flow hedges or net
investment hedges.
Notes to the consolidated financial statements continuedYear ended 31 July 2017
122 Ferguson plc Annual Report and Accounts 2017

37 – Additional information continued(ii) Additional information about financial instruments
Where the hedging relationship is classified as a fair value hedge, the carrying amount of the hedged asset or liability is adjusted by the increase or
decrease in its fair value attributable to the hedged risk and the resulting gain or loss is recognised in the income statement where, to the extent that
the hedge is effective, it will be offset by the change in the fair value of the hedging instrument. If the hedge no longer meets the criteria for hedge
accounting, the adjustment to the carrying amount of a hedged item for which the effective interest method is used is amortised to profit or loss over the
period to maturity. Where the hedging relationship is classified as a cash flow hedge or as a net investment hedge, to the extent the hedge is effective,
changes in the fair value of the hedging instrument arising from the hedged risk are recognised directly in equity.
When the hedged item is recognised in the financial statements, the accumulated gains and losses recognised in equity are either recycled to the
income statement or, if the hedged item results in a non-financial asset, are recognised as adjustments to its initial carrying amount. When a hedging
instrument expires or is sold, or when a hedge no longer meets the criteria for hedge accounting, any cumulative gain or loss existing in equity at that
time remains in equity and is recognised when the forecast transaction is ultimately recognised in the income statement. When a forecast transaction is
no longer expected to occur, the cumulative gain or loss that was reported in equity is immediately transferred to the income statement.
BorrowingsBorrowings are recognised initially at the fair value of the consideration received net of transaction costs incurred. Borrowings are subsequently stated
at amortised cost with any difference between the proceeds (net of transaction costs) and the redemption value being recognised in the income
statement over the period of the borrowings using the effective interest method. Borrowings are classified as current liabilities unless the Group has an
unconditional right to defer settlement of the liability for at least 12 months after the balance sheet date.
Financial instruments by measurement basis The carrying amount of financial instruments by category as defined by IAS 39 “Financial Instruments: Recognition and Measurement” is as follows:
2017 £m
2016 £m
Financial assets
Financial assets at fair value through profit and loss 20 31
Loans and receivables 2,277 2,392
Financial liabilities
Financial liabilities at amortised cost 4,596 4,403
Financial instruments in the category “fair value through profit and loss” are measured in the balance sheet at fair value. Fair value measurements
can be classified in the following hierarchy:
– quoted prices (unadjusted) in active markets for identical assets or liabilities (level 1);
– inputs other than quoted prices included within level 1 that are observable for the asset or liability, either directly or indirectly (level 2); and
– inputs for the asset or liability that are not based on observable market data (that is, unobservable inputs) (level 3).
The following tables present the Group’s assets and liabilities that are measured at fair value at 31 July 2017 and 31 July 2016:
2017 2016
Level 1 £m
Level 2 £m
Level 3 £m
Total £m
Level 1 £m
Level 2 £m
Level 3 £m
Total £m
Derivatives at fair value through profit and loss – 20 – 20 – 31 – 31
As at 31 July 2017 and 31 July 2016, there were no derivative liabilities held at fair value through profit and loss. No transfers between levels occurred
during the current or prior year.
The fair value of financial instruments traded in active markets is based on quoted market prices at the balance sheet date. The fair value of financial
instruments that are not traded in an active market (such as over-the-counter derivatives) is determined by using valuation techniques. The Group’s other
financial instruments are measured on bases other than fair value. Other receivables include an amount of £50 million (2016: £60 million) which has been
discounted at a rate of 2.3 per cent (2016: 1.5 per cent) due to the long-term nature of the receivable. Other current assets and liabilities are either of short
maturity or bear floating rate interest and their fair values approximate to book values. The only non-current financial assets or liabilities for which fair value
does not approximate to book value are the senior unsecured loan notes, which had a book value of £952 million (2016: £959 million) and a fair value
(level 2) of £991 million (2016: £1,027 million).
Strategic report Governance Financials Other information
123Ferguson plc Annual Report and Accounts 2017

37 – Additional information continued(ii) Additional information about financial instruments continued
Financial instruments: disclosure of offsetting arrangementsThe financial instruments that have been offset in the financial statements are disclosed below:
At 31 July 2017 Notes
Gross balances (a)
£m
Offset amounts (b)
£m
Financial statements (c)
£m
Cash poolingamounts (d)
£mNet total (e)
£m
Financial assets
Non-current assets
Derivative financial assets 18 39 (24) 15 – 15
Current assets
Derivative financial assets 18 17 (12) 5 – 5
Cash and cash equivalents 19 1,911 – 1,911 (1,420) 491
1,967 (36) 1,931 (1,420) 511
Financial liabilities
Current liabilities
Derivative financial liabilities 18 12 (12) – – –
Bank loans and overdrafts 22 1,627 – 1,627 (1,420) 207
Finance leases 24 3 – 3 – 3
Non-current liabilities
Derivative financial liabilities 18 24 (24) – – –
Bank loans 22 831 – 831 – 831
Finance leases 24 4 – 4 – 4
2,501 (36) 2,465 (1,420) 1,045
Closing net debt 32 (534) – (534) – (534)
At 31 July 2016 Notes
Gross balances (a)
£m
Offset amounts (b)
£m
Financial statements (c)
£m
Cash pooling amounts (d)
£mNet total (e)
£m
Financial assets
Non-current assets
Derivative financial assets 18 51 (31) 20 – 20
Current assets
Derivative financial assets 18 24 (13) 11 – 11
Cash and cash equivalents 19 940 – 940 (606) 334
1,015 (44) 971 (606) 365
Financial liabilities
Current liabilities
Derivative financial liabilities 18 13 (13) – – –
Bank loans and overdrafts 22 701 – 701 (606) 95
Finance leases 24 4 – 4 – 4
Non-current liabilities
Derivative financial liabilities 18 31 (31) – – –
Bank loans 22 1,175 – 1,175 – 1,175
Finance leases 24 27 – 27 – 27
1,951 (44) 1,907 (606) 1,301
Closing net debt 32 (936) – (936) – (936)
(a) The gross amounts of the recognised financial assets and liabilities under a master netting agreement, or similar arrangement.(b) The amounts offset in accordance with the criteria in IAS 32.(c) The net amounts presented in the Group balance sheet.(d) The amounts subject to a master netting arrangement, or similar arrangement, not included in (c).(e) The net amount after deducting the amounts in (d) from the amounts in (c).
Notes to the consolidated financial statements continuedYear ended 31 July 2017
124 Ferguson plc Annual Report and Accounts 2017

37 – Additional information continued(ii) Additional information about financial instruments continued
Financial instruments: risk management policiesThe Group is exposed to market risks arising from its international operations and the financial instruments which fund them. The main risks arising from
the Group’s financial instruments are foreign currency risk, interest rate risk and liquidity risk. The Group has well-defined policies for the management of
interest rate, liquidity, foreign exchange and counterparty exposures, which have been consistently applied during the financial years ended 31 July 2017
and 31 July 2016. By the nature of its business, the Group also has trade credit and commodity price exposures, the management of which is delegated
to the operating businesses. There has been no change since the previous year in the major financial risks faced by the Group.
Policies for managing each of these risks are regularly reviewed and are summarised below. When the Group enters into derivative transactions
(principally interest rate swaps and foreign exchange contracts), the purpose of such transactions is to hedge certain interest rate and currency risks
arising from the Group’s operations and its sources of finance. It is, and has been throughout the period under review, the Group’s policy that no trading
in financial instruments or speculative transactions be undertaken.
Capital risk managementThe Group’s sources of funding currently comprise cash flows generated by operations, equity contributed by shareholders and borrowings from banks
and other financial institutions. In order to maintain or adjust the capital structure, the Group may pay a special dividend, return capital to shareholders,
repurchase its own shares, issue new shares or sell assets to reduce debt.
Liquidity riskThe Group maintains a policy of ensuring sufficient borrowing headroom to finance all investment and capital expenditure included in its strategic plan,
with an additional contingent safety margin.
The Group has estimated its anticipated contractual cash outflows (excluding interest income and income from derivatives) including interest payable
in respect of its trade and other payables and bank borrowings on an undiscounted basis. The principal assumptions are that floating rate interest is
calculated using the prevailing interest rate at the balance sheet date and cash flows in foreign currency are translated using spot rates at the balance
sheet date. These cash flows can be analysed by maturity as follows:
As at 31 July
2017 2016
Trade and other
payables £m
Debt £m
Interest on debt
£mTotal
£m
Trade and other
payables £m
Debt £m
Interest on debt
£mTotal
£m
Due in less than one year 1,935 125 40 2,100 2,280 5 44 2,329
Due in one to two years 20 4 37 61 19 122 40 181
Due in two to three years 21 1 34 56 12 2 37 51
Due in three to four years 10 213 34 257 14 1 37 52
Due in four to five years 9 1 27 37 8 215 31 254
Due in over five years 120 606 66 792 110 847 116 1,073
Total 2,115 950 238 3,303 2,443 1,192 305 3,940
Foreign currency riskThe Group has significant overseas businesses whose revenues are mainly denominated in the currencies of the countries in which the operations
are located. Approximately 79 per cent of the Group’s revenue is in US dollars. Within each country it operates, the Group does not have significant
transactional foreign currency cash flow exposures. However, those that do arise may be hedged with either forward contracts or currency options.
The Group does not normally hedge profit translation exposure since such hedges have only a temporary effect.
The Group’s policy is to adjust the currencies in which its net debt is denominated materially to match the currencies in which its trading profit is
generated. Details of average exchange rates used in the translation of overseas earnings and of year-end exchange rates used in the translation
of overseas balance sheets for the principal currencies used by the Group are shown in the five-year summary on page 139. The net effect of
currency translation was to increase revenue by £1,609 million (2016 restated: increase by £548 million) and to increase trading profit by £126 million
(2016 restated: increase by £46 million). These currency effects primarily reflect a movement of the average sterling exchange rate against US dollars,
euro and Canadian dollars as follows:
2017
Weakening of sterling
2016 (Weakening)/
strengtheningof sterling
US dollars (15.3%) (6.8%)
Euro (13.5%) (0.8%)
Canadian dollars (15.5%) 4.1%
The Group has net financial liabilities denominated in foreign currencies which have been designated as hedges of the net investment in its overseas
subsidiaries. The principal value of those financial liabilities designated as hedges at the balance sheet date was £1,528 million (2016: £1,636 million).
The loss on translation of these financial instruments into sterling of £6 million (2016: £107 million) has been taken to the translation reserve.
Strategic report Governance Financials Other information
125Ferguson plc Annual Report and Accounts 2017

37 – Additional information continued(ii) Additional information about financial instruments continued
Net investment hedgingExchange differences arising from the translation of the net investment in
foreign operations are recognised directly in equity. Gains and losses on
those hedging instruments designated as hedges of the net investments
in foreign operations are recognised in equity to the extent that the
hedging relationship is effective; these amounts are included in exchange
differences on translation of foreign operations as stated in the Group
statement of comprehensive income. Gains and losses relating to hedge
ineffectiveness are recognised immediately in the income statement
for the period. Gains and losses accumulated in the translation reserve
are included in the income statement when the foreign operation is
disposed of.
Interest rate riskAt 31 July 2017, 100 per cent of loans were at fixed rates. The Group
borrows in the desired currencies principally at rates determined by
reference to short-term benchmark rates applicable to the relevant
currency or market, such as LIBOR. Rates which reset at least every
12 months are regarded as floating rates and the Group then,
if appropriate, considers interest rate swaps to generate the
desired interest rate profile.
The Group reviews deposits and borrowings by currency at Treasury
Committee and Board meetings. The Treasury Committee gives prior
approval to any variations from floating rate arrangements.
During November 2011, the Group entered into interest rate swap
contracts comprising fixed interest payable on US$729 million of notional
principal. The residual contracts of US$438 million expire between
November 2017 and November 2020 and the fixed interest rates range
between 2.06 per cent and 2.94 per cent (2016: 2.06 per cent and 2.94
per cent). These contracts have been held since inception at fair value
through profit and loss. With effect from 1 December 2011, interest rate
swap contracts comprising fixed interest receivable on an original notional
principal of US$729 million and as at 31 July 2017, residual contracts of
US$438 million have been classified as held at fair value through profit and
loss. The contracts expire between November 2017 and November 2020
and the fixed interest rates range between 5.18 per cent and 5.32 per cent
(2016: 5.18 per cent and 5.32 per cent).
The table below shows the income statement movement on interest rate
swaps at fair value through profit and loss.
At fair value through profit and loss (hedge accounting not applied)
2017 £m
2016 £m
At 1 August 29 34
Settled (9) (11)
Valuation gain credited to income statement – 1
Exchange – 5
At 31 July 20 29
There are no fixed rate interest borrowings that form part of a hedge
relationship.
Monitoring interest rate and foreign currency riskThe Group monitors its interest rate and foreign currency risk by reviewing
the effect on financial instruments over various periods of a range of
possible changes in interest rates and exchange rates. The Group has
estimated that an increase of one percentage point in the principal
floating interest rates to which it is exposed would result in a charge to
the income statement of £nil (2016: £1 million). The Group has estimated
that a weakening of sterling by 10 per cent against gross borrowings
denominated in foreign currency in which the Group does business
would result in a charge to equity of £156 million (2016: £177 million).
The Group does not require operating businesses to adhere to a
formalised risk management policy in respect of trade credit risk or
commodity price risk and does not consider that there is a useful way
of quantifying the Group’s exposure to any of the macroeconomic
variables that might affect the collectability of receivables or the prices
of commodities.
Credit riskThe Group provides sales on credit terms to most of its customers.
There is an associated risk that customers may not be able to pay
outstanding balances. At 31 July 2017, the maximum exposure to credit
risk was £2,022 million (2016: £2,187 million).
Each of the Group’s businesses have established procedures in place to
review and collect outstanding receivables. Significant outstanding and
overdue balances are reviewed on a regular basis and resulting actions
are put in place on a timely basis. In some cases, protection is provided
through credit insurance arrangements. All of the major businesses
use professional, dedicated credit teams, in some cases field-based.
Appropriate provisions are made for debts that may be impaired on a
timely basis. Concentration of credit risk in trade receivables is limited as
the Group’s customer base is large and unrelated. Accordingly, the Group
considers that there is no further credit risk provision required above the
current provision for impairment.
The Group has cash balances deposited for short periods with financial
institutions and enters into certain contracts (such as interest rate swaps)
which entitle the Group to receive future cash flows from financial
institutions. These transactions give rise to credit risk on amounts
due from counterparties with a maximum exposure of £424 million
(2016: £237 million). This risk is managed by setting credit and settlement
limits for a panel of approved counterparties. The limits are approved
by the Treasury Committee and ratings are monitored regularly.
(iii) Additional information on the allotment of equity securities for cash
During the year, the Company did not issue any ordinary shares
to participants in the long term incentive plans and all-employee
sharesave plans (2016: issued 43,428 ordinary shares with a nominal
value of 10 53/66 pence per share).
(iv) Additional information about pensions and other long-term employee benefits
Description of plansThe principal UK defined benefit plan is the Wolseley Group Retirement
Benefits Plan which provides benefits based on final pensionable
salaries. This plan was closed to new entrants in 2009. The assets are
held in separate trustee administered funds. The Group contribution rate
is calculated on the Projected Unit Credit Method and agreed with an
independent consulting actuary. The Group Retirement Benefits Plan
was closed to future service accrual in December 2013 and was replaced
by a defined contribution plan. During October 2016, the plan was closed
for future non-inflationary salary accrual.
The principal plans operated for USA employees are defined contribution
plans, which are established in accordance with USA 401k rules.
Companies contribute to both employee compensation deferral and profit
sharing plans. The Group also operates two defined benefit plans in the
USA which are closed to new entrants. One of the plans is funded and the
majority of assets are held in trustee administered funds independent of
the assets of the companies. The closed plans now provide a minimum
pension guarantee in conjunction with a defined contribution plan.
The contribution rate is calculated on the Projected Unit Credit Method
as agreed with independent consulting actuaries.
In Canada, defined benefit plans and a defined contribution plan are
operated. Most of the Canadian defined benefit plans are funded.
Notes to the consolidated financial statements continuedYear ended 31 July 2017
126 Ferguson plc Annual Report and Accounts 2017
37 – Additional information continued (iv) Additional information about pensions and other long-term employee benefits continued
The contribution rate is calculated on the Projected Unit Credit Method
as agreed with independent consulting actuaries.
In Europe, both defined contribution and defined benefit plans are
operated. Liabilities arising under defined benefit plans are calculated
in accordance with actuarial advice.
Investment policyThe Group’s investment strategy for its funded post-employment plans
is decided locally and, if relevant, by the trustees of the plan and takes
account of the relevant statutory requirements. The Group’s objective for
the investment strategy is to achieve a target rate of return in excess of the
increase in the liabilities, while taking an acceptable amount of investment
risk relative to the liabilities.
This objective is implemented by using specific allocations to a variety
of asset classes that are expected over the long term to deliver the target
rate of return. Most investment strategies have significant allocations to
equities, with the intention that this will result in the ongoing cost to the
Group of the post-employment plans being lower over the long-term
and within acceptable boundaries of risk.
For the UK plan, the buy-in insurance policy represents approximately
40 per cent of the plan assets. For the remaining assets, the strategy is to
invest predominantly in growth assets including equities and diversified
growth assets. The investment strategy is subject to regular review by
the plan trustees in consultation with the Company. For the overseas
plans, the investment strategy involves the investment in defined levels of
predominantly equities with the remainder of the assets being invested in
cash and bonds.
Investment riskThe present value of the UK defined benefit plan liability is calculated using
a discount rate determined by reference to high quality corporate bond
yields; if the actual return on plan assets is below this rate, it will decrease
a net surplus or increase a net pension liability. Currently, the plan has a
relatively balanced investment in equity securities, debt instruments and
property. Due to the long-term nature of the plan liabilities, the trustees of
the pension plan consider it appropriate that a reasonable portion of the
plan assets should be invested in equity securities to leverage the return
generated by the fund.
Interest riskA decrease in the bond interest rate will increase the UK plan liability
and this will be partially offset by an increase in the value of the plan’s
debt investments.
Longevity riskThe present value of the defined benefit obligation is calculated by
reference to the best estimate of the mortality of the UK plan participants
both during and after their employment. An increase in the life expectancy
of the plan participants will increase the plan’s liability.
(v) Additional information about share-based payment plans
The Group currently operates five types of discretionary plans and
two types of all-employee sharesave plans.
Historical awards granted under the executive share option plans are
subject to a condition such that they may not be exercised unless the
growth in headline earnings per share over a period of three consecutive
financial years exceeds the growth in the UK Retail Price Index over the
same period by at least 9 per cent and consequently vest over a period
of three years.
For historical awards granted under the long term incentive plan (“LTIP
2012”), senior executives were awarded a variable number of shares
depending on the level of total shareholder return over a three-year
period relative to that of the FTSE 100. The maximum award under the LTIP
2012 was determined at grant date and then adjusted at vesting date in
accordance with the market performance condition. The vesting period
is three years.
For awards granted under the new long term incentive plan (“LTIP 2015”)
senior executives are awarded a variable number of shares depending
on three equally weighted conditions of: (1) level of total shareholder return
over a three-year period relative to that of the FTSE 100; (2) growth in
headline earnings per share over a period of three consecutive financial
years, which must exceed the growth in the UK Retail Price Index over the
same period by at least 9 per cent; and (3) a cumulative three-year figure
of operating cash flow measured against the agreed three-year target.
The vesting period is three years.
For awards granted to eligible employees (excluding Executive Directors)
under the ordinary share plan, such employees may be granted a variable
number of awards in any form or combination of options, restricted
share awards, conditional share awards or phantom share awards up to
a maximum of 100 per cent of their current salary. The vesting period is
typically three years and there are no performance measures other than
retained employment.
For awards granted to eligible employees (excluding Executive Directors)
under the performance ordinary share plan, such employees may be
granted a variable number of awards in any form or combination of
options, restricted share awards, conditional share awards or phantom
share awards with a maximum amount typically set at 5 times salary.
The vesting period is typically three years and the performance period
relating to the relevant operating business’ performance is typically over a
three-year period.
For awards granted to eligible employees (excluding Executive Directors)
under the revised ordinary share plan, such employees may be granted
a variable number of awards in any form or combination of options,
restricted share awards, conditional share awards with a maximum amount
typically set at 3 times salary. The vesting period is typically three years
and the performance period relating to the relevant operating business’
performance is typically over a one-year performance period.
Awards granted under the all-employee sharesave plans vest over periods
ranging from three to seven years, except for awards granted under the
Employee Share Purchase Plan (“ESPP”) in the USA and Canada, which
vest over a one-year period.
(vi) Additional information about the parent company of the Group
The Company is incorporated in Jersey under the Companies (Jersey) Law
1991 and is headquartered in Switzerland. It operates as the ultimate parent
company of the Ferguson Group. Its registered office is 26 New Street,
St Helier, Jersey, JE2 3RA, Channel Islands.
The Group’s subsidiary undertakings are set out on pages 140 and 141.
Strategic report Governance Financials Other information
127Ferguson plc Annual Report and Accounts 2017

Report on the audit of the financial statementsOpinion
In our opinion:
– the financial statements give a true and fair view of the state of the Group’s and of the parent company’s affairs as at 31 July 2017 and of the Group’s
and the parent company’s profit for the year then ended;
– the Group financial statements have been properly prepared in accordance with International Financial Reporting Standards (“IFRSs”) as adopted
by the European Union;
– the parent company financial statements have been properly prepared in accordance with United Kingdom Generally Accepted Accounting Practice
including Financial Reporting Standard 101 “Reduced Disclosure Framework”; and
– the financial statements have been properly prepared in accordance with the Companies (Jersey) Law, 1991.
We have audited the financial statements of Ferguson plc (the “parent company”) and its subsidiaries (the “Group”) which comprise:
– the Group Income Statement;
– the Group Statement of Comprehensive Income;
– the Parent Company Profit and Loss Account;
– the Group and Parent Company Balance Sheets;
– the Group Cash Flow Statement;
– the Group and Parent Company Statements of Changes in Equity;
– the notes to the Group financial statements 1 to 37; and
– the notes to the Parent Company financial statements 1 to 15.
The financial reporting framework that has been applied in the preparation of the Group financial statements is applicable law and IFRSs as adopted
by the European Union. The financial reporting framework that has been applied in the preparation of the parent company financial statements is
applicable law and United Kingdom Accounting Standards, including FRS 101 “Reduced Disclosure Framework” (United Kingdom Generally Accepted
Accounting Practice).
Basis for opinion
We conducted our audit in accordance with International Standards on Auditing (UK) (ISAs (UK)) and applicable law. Our responsibilities under those
standards are further described in the auditor’s responsibilities for the audit of the financial statements section of our report.
We are independent of the Group and the parent company in accordance with the ethical requirements that are relevant to our audit of the
financial statements in the UK, including the FRC’s Ethical Standard as applied to listed public interest entities, and we have fulfilled our other ethical
responsibilities in accordance with these requirements. We confirm that the non-audit services prohibited by the FRC’s Ethical Standard were not
provided to the parent company.
We believe that the audit evidence we have obtained is sufficient and appropriate to provide a basis for our opinion.
While the parent company is not a public interest entity as defined by European Regulation 537/2014, the Directors have decided that the parent
company should follow the same requirements as if that Regulation applied to the parent company.
Summary of our audit approach
Key audit matters The key risks that we identified in the current year were:
– Appropriateness of supplier rebates;
– Inventory provision for slow-moving and obsolete inventory; and
– Accounting for restructuring costs.
Materiality The materiality that we used in the current year was £45m (2016: £40m) which was determined on the basis of approximately 5% of profit
before tax excluding exceptional items.
Scoping We performed full audits on the three key regions of continuing businesses, Head office entities and the consolidation process,
representing 97% (2016: 96%) of revenue, 99% (2016: 86%) of profit before tax and 98% (2016: 99%) of net assets.
Significant changes in our approach
Our approach is consistent with the previous year with the exception of:
– the inclusion of an additional key audit matter relating to the accounting for restructuring costs. This relates to the disposal of
the Nordic region businesses and the restructuring in the UK where judgements are made over the costs categorised as exceptional.
– the exclusion of the key audit matter relating to goodwill and intangible asset carrying values. Following the impairment charge
recognised for Beijer and the proposed sale of the Nordic businesses, the judgement over the carrying value of goodwill and
intangible assets reduced; and
– our planned audit scope has changed, taking into consideration changes in the Group structure as a result of completed and
planned disposals. The Nordic regions (Denmark, Sweden, Finland and Norway) and Switzerland were subject to full scope audits in
the previous year. This year the scope has been reduced to analytical procedures.
128 Ferguson plc Annual Report and Accounts 2017
Independent auditor’s report to the members of Ferguson plc

Conclusions related to principal risks, going concern and viability statement
We have reviewed the Directors’ statement regarding the appropriateness of the going concern basis of accounting contained within note 1 to the
Financial Statements and the Directors’ statement on the longer-term viability of the Group contained within the principal risks and their management
section on page 43.
We are required to state whether we have anything material to add or draw attention to in relation to:
– the disclosures on pages 42-49 that describe the principal risks and explain how they are being managed or mitigated;
– the Directors’ confirmation on page 51 that they have carried out a robust assessment of the principal risks facing the Group, including those that
would threaten its business model, future performance, solvency or liquidity;
– the Directors’ statement in note 1 to the Financial Statements about whether they considered it appropriate to adopt the going concern basis
of accounting in preparing them and their identification of any material uncertainties to the Group and the parent company’s ability to continue
to do so over a period of at least 12 months from the date of approval of the financial statements;
– the Directors’ explanation on page 43 as to how they have assessed the prospects of the Group, over what period they have done so and why they
consider that period to be appropriate, and their statement as to whether they have a reasonable expectation that the Group will be able to continue
in operation and meet its liabilities as they fall due over the period of their assessment, including any related disclosures drawing attention to any
necessary qualifications or assumptions; or
– whether the Directors’ statements relating to going concern and the prospects of the Company required in accordance with Listing Rule 9.8.6R(3)
are materially inconsistent with our knowledge obtained in the audit.
We confirm that we have nothing material to add or draw attention to in respect of these matters.
We agreed with the Directors’ adoption of the going concern basis of accounting and we did not identify any such material uncertainties. However,
because not all future events or conditions can be predicted, this statement is not a guarantee as to the Group’s ability to continue as a going concern.
Key audit matters
Key audit matters are those matters that, in our professional judgement, were of most significance in our audit of the financial statements of the
current period and include the most significant assessed risks of material misstatement (whether or not due to fraud) that we identified. These matters
included those which had the greatest effect on: the overall audit strategy; the allocation of resources in the audit; and directing the efforts of the
engagement team.
These matters were addressed in the context of our audit of the financial statements as a whole, and in forming our opinion thereon, and we do not
provide a separate opinion on these matters.
Appropriateness of supplier rebates
Key audit matter description
As described in the Audit Committee report on page 61 as a significant judgement and the Accounting Policies in note 37 to the
Financial Statements, the Group recognises a reduction in cost of sales as a result of amounts receivable from suppliers in the form of
rebate arrangements. Where the rebate arrangements are non-tiered arrangements (flat rate), there is limited judgement. However,
a proportion of the rebate arrangements comprise annual volume rebates, for which the end of the period is often non coterminous
with the Group’s year-end. Additionally, in some cases the rebate rises as a portion of purchases, as higher quantities or values of the
purchases are made.
There is complexity in supplier rebates which give rise to management judgement and scope for fraud and error in accounting for
this income.
Judgement is required in estimating the expected level of rebates for the rebate year, driven by the forecast purchase volumes.
This requires a detailed understanding of the specific contractual arrangements themselves as well as complete and accurate source
data to apply the arrangements to.
How the scope of our audit responded to the key audit matter
We assessed the design and implementation of manual and automated controls over the recording of supplier rebate income.
Our procedures on supplier rebates included:
– evaluating the design and implementation of key controls operating across the Group over the appropriateness of supplier rebates;
– in certain components, testing the operating effectiveness of the controls relating to supplier rebates;
– interviewing a sample of Ferguson’s internal buyers to supplement our understanding of the key contractual rebate arrangements;
– testing the accuracy of the amounts recognised by agreeing a sample to individual supplier agreements;
– circularising a sample of suppliers to test whether the arrangements recorded were complete;
– testing the completeness and accuracy of the inputs to the calculations for recording supplier rebates by agreement to supporting
evidence, including historical volume data. We challenged the assumptions underlying management’s estimates of purchase
volumes including looking at the historical accuracy of previous estimates and historical purchase trends and recalculation of rebates
for a sample of suppliers;
– consider the adequacy of rebate related disclosure within the Group’s financial statement;
– holding discussions with management to understand if there has been any whistleblowing; and
– testing post year-end cash receipts, where relevant, to test the recoverability of amounts recorded.
Key observations We consider the Group’s estimation methodology to be prudent based on a number of factors, including a look back at historical cash
receipts. However, the methodology is consistently applied year-on-year and the understatement of rebate income is not material to the
financial position or the reported financial result as at 31 July 2017.
Strategic report Governance Financials Other information
129Ferguson plc Annual Report and Accounts 2017

Inventory provision for slow-moving and obsolete inventory
Key audit matter description
The Group had inventory of £1,816m at 31 July 2017, held in distribution centres, warehouses and numerous branches, and across
multiple product lines. Details of its valuation are included in the Audit Committee report on page 61 and the Accounting policies in note
37 to the Financial Statements.
Inventories are carried at the lower of cost and net realisable value. As a result, the Directors apply judgement in determining the
appropriate values for slow-moving or obsolete items. Inventory is net of a provision of £113m which is primarily driven by comparing
the level of inventory held to future projected sales.
The provision is calculated within the Group’s accounting systems using an automated process.
We consider the assessment of inventory provisions to require judgement based on the size of the inventory balance held at year-end
and the manual intervention required in the calculation. There is risk that inappropriate management override and/or error may occur.
How the scope of our audit responded to the key audit matter
We challenged the appropriateness of management’s assumptions applied in calculating the value of the inventory provisions by:
– evaluating the design and implementation of key inventory provision controls operating across the Group, including those at a
sample of distribution centres, warehouses and branches;
– evaluating the design and implementation of key system controls around the provision calculation and their operating effectiveness;
– comparing the net realisable value, obtained through a detailed review of sales subsequent to the year-end, to the cost price
of a sample of inventories and comparison to the associated provision to assess whether inventory provisions are complete;
– reviewing the historical accuracy of inventory provisioning, and the level of inventory write-offs during the year; and
– challenging the completeness of inventory provisions through assessing actual and forecast sales of inventory lines to assess
whether provisions for slow moving or obsolete stock are valid and complete.
Key observations We consider the Group’s provisioning methodology to be prudent when compared with historical levels of inventory write-offs.
However, the methodology is consistently applied year-on-year and our estimate of the potential overstatement of the provision is not
material to the financial position or the reported result as at 31 July 2017.
Accounting for restructuring costs
Key audit matter description
As described in notes 5 and 8 to the Financial Statements, the Group has announced a restructuring plan for the UK business and the
disposal of the Nordic region businesses.
The key judgements related to this risk lie in the estimation of the restructuring costs where they may differ from the future obligations.
By nature, the provision is difficult to estimate and includes many variables. There is a risk that the provision could be underestimated by
management to minimise the liabilities. Additionally, depending on timing there is a risk that costs could be provided inappropriately that
are not yet committed.
The impact of strategic reviews within the business and other future events gives rise to a source of estimation uncertainty. The Group
has recognised a cost of £40m in the year in respect of the UK restructuring, which is reported as an exceptional item in note 5, and
an additional amount related to the Nordic region businesses, which is shown within discontinued exceptional items (note 8). There is
a judgement required in determining whether disclosure as an exceptional item is appropriate. The UK business is in phase 2 of the
restructuring and given the branch closures and expected job losses, there is judgement around the estimated costs.
How the scope of our audit responded to the key audit matter
Our procedures on restructuring costs included:
– challenging the key judgements made by management including evaluating the positions taken on which costs were provided for;
– determining whether what is disclosed as exceptional directly related to the restructuring was incremental;
– checking the consistency of items included year-on-year and assessing adherence to IFRS requirements and latest Financial
Reporting Council (“FRC”) guidance;
– holding discussions with the finance teams on the provision recorded;
– testing the provision in place by agreeing it to documentation to assess appropriateness of the level of provisioning; and
– understanding if any aspects of the restructuring could result in items to be classified as impaired.
Key observations We consider the restructuring charge recorded in the year to have been appropriately calculated.
130 Ferguson plc Annual Report and Accounts 2017
Independent auditor’s report to the members of Ferguson plc continued
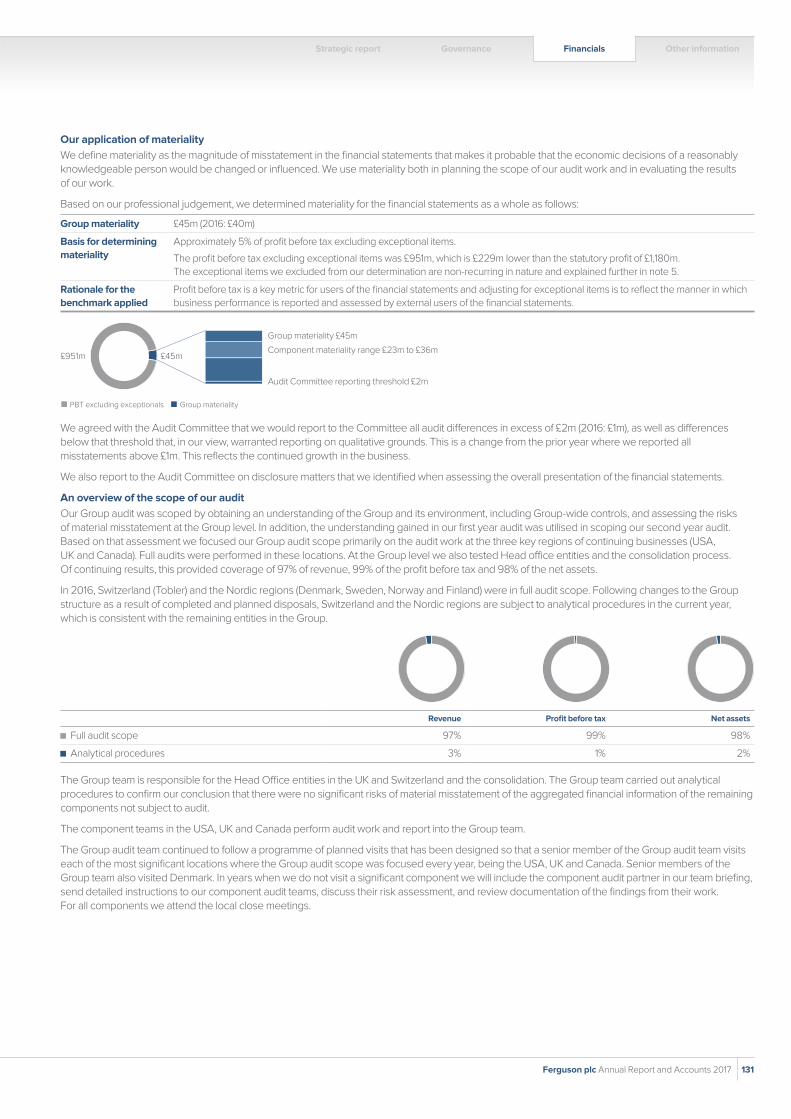
Our application of materiality
We define materiality as the magnitude of misstatement in the financial statements that makes it probable that the economic decisions of a reasonably
knowledgeable person would be changed or influenced. We use materiality both in planning the scope of our audit work and in evaluating the results
of our work.
Based on our professional judgement, we determined materiality for the financial statements as a whole as follows:
Group materiality £45m (2016: £40m)
Basis for determining materiality
Approximately 5% of profit before tax excluding exceptional items.
The profit before tax excluding exceptional items was £951m, which is £229m lower than the statutory profit of £1,180m.
The exceptional items we excluded from our determination are non-recurring in nature and explained further in note 5.
Rationale for the benchmark applied
Profit before tax is a key metric for users of the financial statements and adjusting for exceptional items is to reflect the manner in which
business performance is reported and assessed by external users of the financial statements.
Audit Committee reporting threshold £2m
£951m £45mComponent materiality range £23m to £36m
Group materiality £45m
PBT excluding exceptionals Group materiality
We agreed with the Audit Committee that we would report to the Committee all audit differences in excess of £2m (2016: £1m), as well as differences
below that threshold that, in our view, warranted reporting on qualitative grounds. This is a change from the prior year where we reported all
misstatements above £1m. This reflects the continued growth in the business.
We also report to the Audit Committee on disclosure matters that we identified when assessing the overall presentation of the financial statements.
An overview of the scope of our audit
Our Group audit was scoped by obtaining an understanding of the Group and its environment, including Group-wide controls, and assessing the risks
of material misstatement at the Group level. In addition, the understanding gained in our first year audit was utilised in scoping our second year audit.
Based on that assessment we focused our Group audit scope primarily on the audit work at the three key regions of continuing businesses (USA,
UK and Canada). Full audits were performed in these locations. At the Group level we also tested Head office entities and the consolidation process.
Of continuing results, this provided coverage of 97% of revenue, 99% of the profit before tax and 98% of the net assets.
In 2016, Switzerland (Tobler) and the Nordic regions (Denmark, Sweden, Norway and Finland) were in full audit scope. Following changes to the Group
structure as a result of completed and planned disposals, Switzerland and the Nordic regions are subject to analytical procedures in the current year,
which is consistent with the remaining entities in the Group.
Revenue Profit before tax Net assets
Full audit scope 97% 99% 98%
Analytical procedures 3% 1% 2%
The Group team is responsible for the Head Office entities in the UK and Switzerland and the consolidation. The Group team carried out analytical
procedures to confirm our conclusion that there were no significant risks of material misstatement of the aggregated financial information of the remaining
components not subject to audit.
The component teams in the USA, UK and Canada perform audit work and report into the Group team.
The Group audit team continued to follow a programme of planned visits that has been designed so that a senior member of the Group audit team visits
each of the most significant locations where the Group audit scope was focused every year, being the USA, UK and Canada. Senior members of the
Group team also visited Denmark. In years when we do not visit a significant component we will include the component audit partner in our team briefing,
send detailed instructions to our component audit teams, discuss their risk assessment, and review documentation of the findings from their work.
For all components we attend the local close meetings.
Strategic report Governance Financials Other information
131Ferguson plc Annual Report and Accounts 2017

Other information
The Directors are responsible for the other information. The other information comprises the information included in the Annual Report, other than the
financial statements and our auditor’s report thereon.
Our opinion on the financial statements does not cover the other information and, except to the extent otherwise explicitly stated in our auditor’s report,
we do not express any form of assurance conclusion thereon.
In connection with our audit of the financial statements, our responsibility is to read the other information and, in doing so, consider whether the other
information is materially inconsistent with the financial statements or our knowledge obtained in the audit or otherwise appears to be materially misstated.
If we identify such material inconsistencies or apparent material misstatements, we are required to determine whether there is a material misstatement
in the financial statements or a material misstatement of other information. If, based on the work we have performed, we conclude that there is a material
misstatement of this other information, we are required to report that fact.
In this context, matters that we are specifically required to report to you as uncorrected material misstatements of the other information include where
we conclude that:
– Fair, balanced and understandable – the statement given by the Directors that they consider the Annual Report and Financial Statements taken as
a whole is fair, balanced and understandable and provides the information necessary for shareholders to assess the Group’s performance, business
model and strategy, is materially inconsistent with our knowledge obtained in the audit; or
– Audit Committee reporting – the section describing the work of the Audit Committee does not appropriately address matters communicated by us to
the audit committee; or
– Directors’ statement of compliance with the UK Corporate Governance Code – the parts of the Directors’ statement relating to the Company’s
compliance with the UK Corporate Governance Code containing provisions specified for review by the auditor in accordance with Listing Rule
9.8.10R(2) do not properly disclose a departure from a relevant provision of the UK Corporate Governance Code.
We have nothing to report in respect of these matters.
Responsibilities of the Directors
As explained more fully in the Directors’ responsibilities statement, the Directors are responsible for the preparation of the financial statements and
for being satisfied that they give a true and fair view, and for such internal control as the Directors determine is necessary to enable the preparation
of financial statements that are free from material misstatement, whether due to fraud or error.
In preparing the financial statements, the Directors are responsible for assessing the Group’s and the parent company’s ability to continue as a going
concern, disclosing as applicable, matters related to going concern and using the going concern basis of accounting unless the Directors either intend
to liquidate the Group or the parent company or to cease operations, or have no realistic alternative but to do so.
Auditor’s responsibilities for the audit of the financial statements
Our objectives are to obtain reasonable assurance about whether the financial statements as a whole are free from material misstatement, whether due
to fraud or error, and to issue an auditor’s report that includes our opinion. Reasonable assurance is a high level of assurance, but is not a guarantee that
an audit conducted in accordance with ISAs (UK) will always detect a material misstatement when it exists. Misstatements can arise from fraud or error
and are considered material if, individually or in the aggregate, they could reasonably be expected to influence the economic decisions of users taken
on the basis of these financial statements.
A further description of our responsibilities for the audit for the financial statements is located on the Financial Reporting Council’s website at:
www.frc.org.uk/auditorsresponsibilities. This description forms part of our auditor’s report.
Use of our report
This report is made solely to the Company’s members, as a body, in accordance with Article 113A of the Companies (Jersey) Law, 1991. Our audit work has
been undertaken so that we might state to the Company’s members those matters we are required to state to them in an auditor’s report and/or those
further matters we have expressly agreed to report to them on in our engagement letter and for no other purpose. To the fullest extent permitted by law,
we do not accept or assume responsibility to anyone other than the Company and the Company’s members as a body, for our audit work, for this report,
or for the opinions we have formed.
132 Ferguson plc Annual Report and Accounts 2017
Independent auditor’s report to the members of Ferguson plc continued

Report on other legal and regulatory requirementsOpinions on other matters prescribed by our engagement letter
In our opinion the part of the Directors’ Remuneration Report to be audited has been properly prepared in accordance with the provisions of the UK
Companies Act 2006 as if that Act had applied to the Company.
In our opinion, based on the work undertaken in the course of the audit:
– the information given in the strategic report and the Directors’ report for the financial year for which the financial statements are prepared is consistent
with the financial statements; and
– the strategic report and the Directors’ report have been prepared in accordance with applicable legal requirements.
In the light of the knowledge and understanding of the Group and of the parent company and their environment obtained in the course of the audit,
we have not identified any material misstatements in the strategic report or the Directors’ report.
Matters on which we are required to report by exception
Adequacy of explanations received and accounting records Under the Companies (Jersey) Law, 1991 we are required to report to you if, in our opinion:
– we have not received all the information and explanations we require for our audit; or
– adequate accounting records have not been kept by the parent company, or returns adequate for our audit have not been received from branches
not visited by us; or
– the financial statements are not in agreement with the accounting records and returns.
We have nothing to report in respect of these matters.
Directors’ remunerationWe are also required to report, under the Companies Act 2006 (as if that Act had applied to the Company) if in our opinion certain disclosures of
Directors’ remuneration have not been made or the part of the Directors’ Remuneration Report to be audited is not in agreement with the accounting
records and returns.
We have nothing to report arising from these matters.
Other matters
Auditor tenureFollowing the recommendation of the Audit Committee, we were appointed by the Company on 12 November 2015 to audit the financial statements
for the year ending 31 July 2016 and subsequent financial periods. The period of total uninterrupted engagement including previous renewals and
reappointments of the firm is two years, covering periods from our appointment to 31 July 2017.
Consistency of the audit report with the additional report to the Audit CommitteeOur audit opinion is consistent with the additional report to the Audit Committee we are required to provide in accordance with ISAs (UK).
Ian Waller For and on behalf of Deloitte LLP
Recognized Auditor
London, UK
2 October 2017
Strategic report Governance Financials Other information
133Ferguson plc Annual Report and Accounts 2017
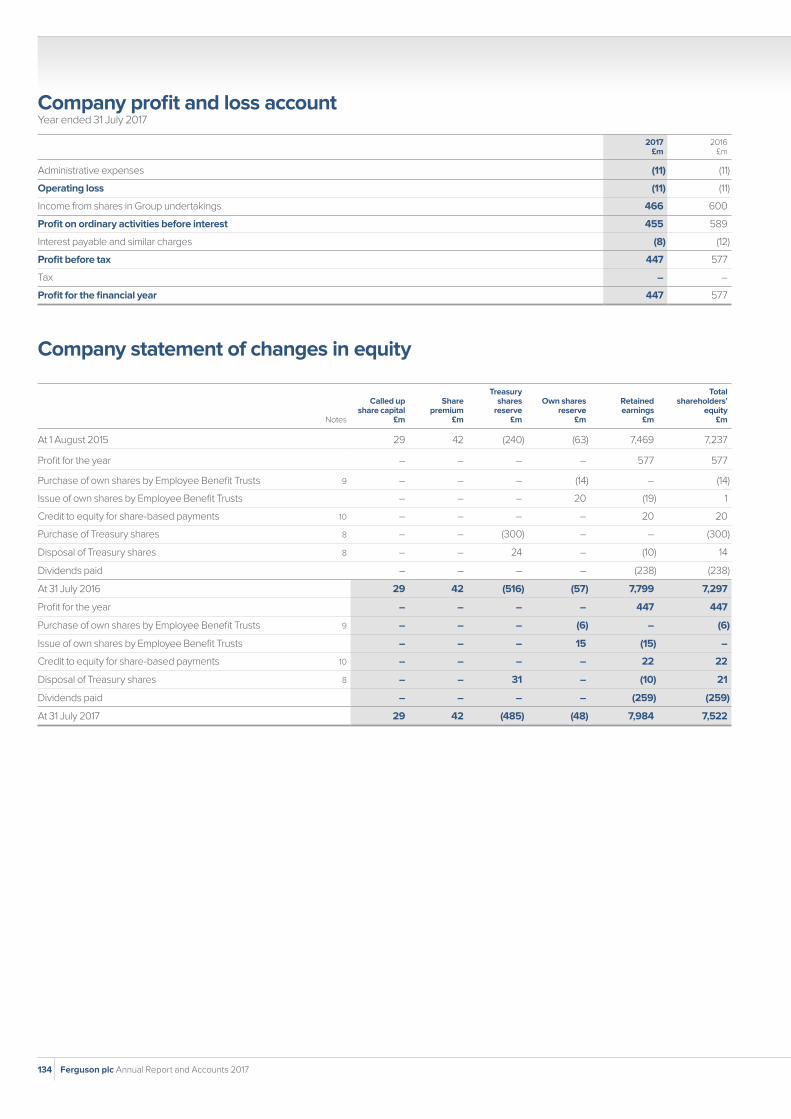
2017 £m
2016 £m
Administrative expenses (11) (11)
Operating loss (11) (11)
Income from shares in Group undertakings 466 600
Profit on ordinary activities before interest 455 589
Interest payable and similar charges (8) (12)
Profit before tax 447 577
Tax – –
Profit for the financial year 447 577
Company statement of changes in equity
Notes
Called up share capital
£m
Share premium
£m
Treasury shares
reserve£m
Own shares reserve
£m
Retained earnings
£m
Total shareholders’
equity£m
At 1 August 2015 29 42 (240) (63) 7,469 7,237
Profit for the year – – – – 577 577
Purchase of own shares by Employee Benefit Trusts 9 – – – (14) – (14)
Issue of own shares by Employee Benefit Trusts – – – 20 (19) 1
Credit to equity for share-based payments 10 – – – – 20 20
Purchase of Treasury shares 8 – – (300) – – (300)
Disposal of Treasury shares 8 – – 24 – (10) 14
Dividends paid – – – – (238) (238)
At 31 July 2016 29 42 (516) (57) 7,799 7,297
Profit for the year – – – – 447 447
Purchase of own shares by Employee Benefit Trusts 9 – – – (6) – (6)
Issue of own shares by Employee Benefit Trusts – – – 15 (15) –
Credit to equity for share-based payments 10 – – – – 22 22
Disposal of Treasury shares 8 – – 31 – (10) 21
Dividends paid – – – – (259) (259)
At 31 July 2017 29 42 (485) (48) 7,984 7,522
134 Ferguson plc Annual Report and Accounts 2017
Company profit and loss accountYear ended 31 July 2017

Notes2017
£m2016
£m
Fixed assets
Investments in subsidiaries 3 8,309 7,945
8,309 7,945
Current assets
Debtors: amounts falling due within one year 4 1 2
Current liabilities
Creditors: amounts falling due within one year 5 (788) (650)
Net current liabilities (787) (648)
Net assets 7,522 7,297
Capital and reserves
Called up share capital 6 29 29
Share premium 7 42 42
Treasury shares reserve 8 (485) (516)
Own shares reserve 9 (48) (57)
Retained earnings 7,984 7,799
Total shareholders’ equity 7,522 7,297
The accompanying notes are an integral part of these Company financial statements.
The Company financial statements on pages 134 to 137 were approved by the Board of Directors on 2 October 2017 and were signed on its behalf by:
John Martin Mike PowellGroup Chief Executive Chief Financial Officer
Strategic report Governance Financials Other information
135Ferguson plc Annual Report and Accounts 2017
Company balance sheetYear ended 31 July 2017

1 – Corporate informationFerguson plc (the “Company”) was incorporated and registered in
Jersey on 28 September 2010 under the Jersey Companies Law as
a public company limited by shares under the name Ferguson plc with
registered number 106605. The principal legislation under which the
Company operates is the Companies (Jersey) Law 1991, as amended,
and regulations made thereunder. The address of its registered
office is 26 New Street, St Helier, Jersey, JE2 3RA, Channel Islands.
It is headquartered in Switzerland.
The principal activity of the Company is to act as the ultimate holding
company of the Ferguson Group of companies.
The Company changed its name from Wolseley plc to Ferguson plc
on 31 July 2017.
2 – Company accounting policiesBasis of accounting
The Company meets the definition of a qualifying entity under FRS 100
(Financial Reporting Standard 100) issued by the Financial Reporting
Council (“FRC”). Accordingly, the financial statements have been prepared
in accordance with FRS 101 (Financial Reporting Standard 101) “Reduced
Disclosure Framework” as issued by the FRC.
As permitted by FRS 101, the Company has taken advantage of the
disclosure exemptions available under that standard in relation to share-
based payments, financial instruments, capital management, presentation
of comparative information in respect of certain assets, presentation of a
cash flow statement, standards not yet effective, impairment of assets and
related party transactions.
The financial statements have been prepared on the historical cost basis
and on the going concern basis.
Note 4 (Operating profit) on page 95, note 9 (Dividends) on page 98,
note 27 (Share capital) on page 113, note 28 (Share-based payments)
on page 114 and note 36 (Post-balance sheet events) on page 119 of
the Ferguson plc consolidated financial statements form part of these
financial statements.
Foreign currencies
The financial statements are presented in sterling which was the functional
currency of the Company at 31 July 2017.
The cost of the Company’s investments in overseas subsidiary
undertakings is translated into sterling at the rate ruling at the date
of investment.
Foreign currency transactions entered into during the year are
translated into sterling at the rates of exchange ruling on the dates of
the transactions. Monetary assets and liabilities denominated in foreign
currencies are retranslated at the rate of exchange ruling at the balance
sheet date. All currency translation differences are charged or credited
to retained earnings.
Investments in subsidiaries
Fixed asset investments are recorded at cost less provision for impairment.
The Company assesses at each balance sheet date whether there
is objective evidence that an investment or a group of investments
is impaired.
Cash at bank and in-hand
Cash at bank and in-hand includes cash in-hand and deposits held
with banks which are readily convertible to known amounts of cash.
Bank overdrafts are shown within borrowings in current liabilities on the
balance sheet to the extent there is no right of offset or intention to net
settle with cash balances.
Share capital
The Company has one class of shares, ordinary shares, which are
classified as equity. Incremental costs directly attributable to the issue
of new shares or options are shown in equity as a deduction from the
proceeds, net of tax.
Where the Company or one of the Company’s trusts purchases the
Company’s equity share capital, the consideration paid, including any
directly attributable incremental costs (net of tax), is deducted from equity
attributable to the Company’s equity holders until the shares are cancelled,
reissued or disposed of. Where such shares are subsequently disposed
or reissued, any consideration received, net of any directly attributable
incremental transaction costs and the related tax effects, is included in
equity attributable to the Company’s equity holders.
Share-based payments
Share-based incentives are provided to employees under the Company’s
executive share option, long term incentive and share purchase and
ordinary share plans. The Company recognises a compensation cost
in respect of these plans that is based on the fair value of the awards,
measured using Binomial and Monte Carlo valuation methodologies.
For equity-settled plans, the fair value is determined at the date of grant
(including the impact of non-vesting conditions such as requirement
for employees to save) and is not subsequently remeasured unless the
conditions on which the award was granted are modified. Generally, the
compensation cost is recognised on a straight-line basis over the vesting
period. Adjustments are made to reflect expected and actual forfeitures
during the vesting period due to the failure to satisfy service conditions
or achieve non-market performance conditions.
Dividends payable
Dividends on ordinary shares are recognised in the Company’s financial
statements in the period in which the dividends are paid or approved by
the shareholders of the Company.
Tax
Ferguson plc is taxed as a holding company in Switzerland so no tax is
due at cantonal or communal level. The tax charge is therefore made
up of federal tax and capital tax. Federal tax is levied on profits in the
year subject to any participation exemption for qualifying dividends from
subsidiaries. Capital tax is based on the value of the Company’s assets,
primarily its investment in Wolseley Limited and Ferguson Holdings
(Switzerland) AG.
3 – Fixed asset investments Cost
£m
At 1 August 2016 7,945
Additions 364
At 31 July 2017 8,309
All of the above investments are in unlisted shares. The Directors believe
that the carrying value of the investments is supported by the recoverable
amount of their underlying assets.
136 Ferguson plc Annual Report and Accounts 2017
Notes to the Company financial statementsYear ended 31 July 2017

3 – Fixed asset investments continued
The Company’s direct holdings in subsidiary undertakings as at 31 July
2017 were as follows:
CompanyCountry of registration and operation Principal activity
Percentage of ordinary
shares held
Wolseley Limited England and Wales Investment 100%
Ferguson de Puerto Rico, Inc.
Commonwealth of Puerto Rico
Distributor of industrial products
100%
Ferguson Holdings (Switzerland) AG
Switzerland Investment 100%
Details of the subsidiary undertakings of the Company, including those
that are held indirectly, are listed on pages 140 and 141 of the Ferguson plc
Annual Report.
4 – Debtors: amounts falling due within one year 2017
£m2016
£m
Other debtors 1 2
Total 1 2
The fair value of amounts included in debtors approximates to book value.
5 – Creditors: amounts falling due within one year 2017
£m2016
£m
Bank overdrafts 787 –
Other creditors 1 3
Amounts owed to Group companies – 647
Total 788 650
The fair value of amounts included in creditors approximates to book
value. Bank overdrafts are interest bearing, carrying an interest rate
of 2.0 per cent and are payable on demand. Amounts owed to Group
companies in 2016 were interest bearing, carrying an interest rate of
1.2 per cent and were payable on demand.
6 – Share capitalDetails of the Company’s share capital are set out in note 27 on page 113
to the Ferguson plc consolidated financial statements.
7 – Share premium accountDetails of new share capital subscribed are set out in note 27 on page 113
to the Ferguson plc consolidated financial statements.
8 – Treasury sharesDetails on Treasury shares are set out in note 27 on page 113 to the
Ferguson plc consolidated financial statements.
9 – Own shares reserveDuring the year, the Company contributed £6 million (2016: £11 million)
of cash to its USA Employee Benefit Trust and £nil (2016: £3 million) to
its Jersey Employee Benefit Trust to purchase shares. The Treasury
shares held by both of these Trusts have been consolidated within the
Company’s balance sheet as at 31 July 2017 and amount to £48 million
(2016: £57 million).
10 – Share-based paymentsDetails of share awards granted by Group companies to employees, and
that remain outstanding over the Company’s shares are set out in note
28 on page 114 to the Ferguson plc consolidated financial statements.
The net profit and loss charge to the Company for equity-settled share-
based payments was £nil (2016: £nil). The Company charged the full
amount incurred for equity-settled share-based payments of £22 million
(2016: £20 million) to its subsidiary undertakings.
11 – Contingent liabilitiesProvision is made for the Directors’ best estimate of known claims and
legal actions in progress. The Company takes legal advice as to the
likelihood of success of claims and actions and no provision is made where
the Directors consider, based on that advice, that the action is unlikely to
succeed or a sufficiently reliable estimate of the potential obligation cannot
be made.
In addition, the Company has given certain banks and lenders authority
to transfer at any time any sum outstanding to its credit against or towards
satisfaction of its liability to those banks of certain subsidiary undertakings.
The Company has also given indemnities and warranties to the purchasers
of businesses from the Company and certain Group companies in respect
of which no material liabilities are expected to arise.
The Company acts as a guarantor for the Group’s UK defined benefit
pension plan, which is disclosed in note 26 on pages 110 to 112 to the
Ferguson plc consolidated financial statements.
12 – Employees, employee costs and auditor’s remuneration
The average number of employees of the Company in the year ended
31 July 2017 was one (2016: one). Other employees of Group companies
were seconded or assigned to the Company in the period in order to
fulfil their duties or to carry out the work of the Company. Each of the Non
Executive Directors of the Company has an appointment letter with the
Company. The Executive Directors and certain other senior managers
of the Group have assignment letters in place with the Company.
Total employment costs of the Company for the period, including
Non Executive Directors and seconded employees, were £2 million
(2016: £2 million).
Fees payable to the auditor for the audit of the Company’s financial
statements are set out in note 4 on page 95 to the Ferguson plc
consolidated financial statements.
13 – DividendsDetails of the Company’s dividends are set out in note 9 on page 98 to the
Ferguson plc consolidated financial statements.
14 – Related party transactionsThe Company is exempt under the terms of FRS 101 from disclosing
related party transactions with entities that are 100 per cent owned
by Ferguson plc.
15 – Post-balance sheet eventsDetails of post-balance sheet events are given in note 36 on page 119
of the Ferguson plc consolidated financial statements.
Strategic report Governance Financials Other information
137Ferguson plc Annual Report and Accounts 2017

Restated
2017 £m
2016 £m
2015 £m
2014£m
2013 £m
Revenue
USA 11,994 9,456 8,343 7,070 6,785
UK 2,012 1,996 1,987 1,853 1,769
Canada and Central Europe 1,218 1,097 1,138 1,413 1,568
Group 15,224 12,549 11,468 10,336 10,122
Trading profit
USA 966 775 681 546 492
UK 76 74 90 96 95
Canada and Central Europe 56 53 55 72 80
Central and other costs (39) (45) (43) (35) (42)
Group 1,059 857 783 679 625
Amortisation of acquired intangible assets (64) (48) (41) (15) (20)
Impairment of goodwill and acquired intangible assets – (94) (4) – (10)
Exceptional items 229 (4) (2) 27 (13)
Operating profit 1,224 711 736 691 582
Finance costs (43) (36) (43) (24) (25)
Share of result of associate (1) – – – –
Profit before tax 1,180 675 693 667 557
Tax (292) (210) (215) (199) (185)
Profit from continuing operations 888 465 478 468 372
(Loss)/profit from discontinued operations (105) 185 (265) 36 (76)
Profit attributable to equity shareholders 783 650 213 504 296
Ordinary dividends (259) (238) (222) (191) (173)
Special dividend – – – (298) (348)
Total dividends (259) (238) (222) (489) (521)
Net assets employed
Intangible fixed assets 1,070 1,104 1,011 1,198 1,246
Property, plant and equipment 808 1,434 1,164 1,226 1,263
Other net assets, excluding liquid funds 2,094 1,301 1,230 1,173 955
3,972 3,839 3,405 3,597 3,464
Financed by
Share capital 29 29 29 29 28
Share premium 42 42 42 41 27
Translation reserve 351 380 117 127 402
Retained earnings and other reserves 3,016 2,452 2,412 2,689 2,596
Equity attributable to shareholders of the Company 3,438 2,903 2,600 2,886 3,053
Net debt 534 936 805 711 411
Net assets employed 3,972 3,839 3,405 3,597 3,464
138 Ferguson plc Annual Report and Accounts 2017
Five-year summary(a)

Restated
Continuing operations (unless otherwise stated) 2017 2016 2015 2014 2013
Like-for-like revenue growth 5.8% 2.7% 7.1% 5.2% 5.8%
Gross margin 29.0% 28.6% 28.3% 28.1% 27.7%
Trading margin 7.0% 6.8% 6.8% 6.6% 6.2%
Headline earnings per share 288.9p 234.7p 206.7p 173.2p 154.5p
Basic earnings per share from continuing and discontinued operations 311.6p 256.4p 82.1p 189.8p 107.4p
Dividends per share (in respect of the financial year) 110.0p 100.0p 90.75p 82.5p 66.0p
Special dividend per share – – – 110.0p 122.0p
Cover for ordinary dividends 2.6 2.3 2.3 2.1 2.3
Net tangible assets per ordinary share 886.9p 673.8p 595.1p 632.1p 659.9p
Return on gross capital employed 19.6% 17.2% 16.9% 14.8% 14.3%
Average number of employees 33,511 32,269 31,033 29,596 28,990
Number of shares in issue at year-end (million) 267 267 267 267 274
Number of branches at year-end
Continuing operations 2,310 2,498 2,480 2,444 2,470
Discontinued operations 380 256 427 436 558
Total branches 2,690 2,754 2,907 2,880 3,028
US dollar translation rate
Income statement/profit and loss 1.27 1.46 1.56 1.64 1.56
Balance sheet 1.32 1.32 1.56 1.69 1.52
Euro translation rate
Income statement/profit and loss 1.16 1.31 1.33 1.21 1.20
Balance sheet 1.12 1.18 1.42 1.26 1.14
Canadian dollar translation rate
Income statement/profit and loss 1.68 1.94 1.86 1.76 1.57
Balance sheet 1.65 1.72 2.04 1.84 1.56
(a) for an extract of the five-year summary presented in US dollars please visit www.fergusonplc.com
Strategic report Governance Financials Other information
139Ferguson plc Annual Report and Accounts 2017

The Ferguson Group comprises a large number of companies. This list includes only those subsidiaries which in the Directors’ opinion principally affect
the figures shown in the consolidated financial statements. A full list of subsidiary undertakings is detailed in the second list below and on the next page.
Principal subsidiary undertakingsCompany name Principal activity Country of incorporation
Beijer Byggmaterial AB Operating company Sweden
Capstone Global Solutions AG Operating company Switzerland
DT Finland Oy Operating company Finland
Ferguson Enterprises Inc Operating company USA
Ferguson Finance (Switzerland) AG Financing company Switzerland
Ferguson Holdings (Switzerland) AG* Investment company Switzerland
Ferguson Group Services Limited Service company England and Wales
Neumann Bygg AS Operating company Norway
Stark Group Holdings A/S Operating company Denmark
Wasco Holding B.V. Operating company The Netherlands
Wolseley Canada Inc. Operating company Canada
Wolseley UK Limited Operating company England and Wales
Wolseley Capital, Inc. Financing company USA
Wolseley Insurance Limited Operating company Isle of Man
Wolseley Investments North America, Inc. Investment company USA
Wolseley Limited * Investment company England and Wales
(1) Shareholdings in companies marked * are held 100 per cent directly by Ferguson plc. The proportion of the voting rights in the subsidiary undertakings held directly by Ferguson plc do not differ from the proportion of the ordinary shares held. All other shareholdings in the above mentioned companies are held by intermediate subsidiary undertakings.
(2) All shareholdings in the above subsidiary undertakings are of ordinary shares or equity capital.(3) All subsidiary undertakings have been included in the consolidation.
Full list of subsidiary undertakingsA full list of subsidiaries, joint ventures, companies in which a Ferguson Group company has a controlling interest and associated undertakings
as at 31 July 2017. The country of incorporation and the effective percentage of equity owned (if less than 100 per cent) is also detailed below.
Unless otherwise noted, the share capital comprises ordinary shares which are indirectly held by Ferguson plc.
Fully owned subsidiaries
893111 Canada Inc. (Canada)(x)(11)
A C Electrical Holdings Limited (England)(ix)(30)
A C Electrical Wholesale Limited (England)(iii)(30)
A C Ferguson Limited (Scotland)(ii)(iii)(20)
Advancechief Limited (England)(ii)(iii)(2)
B Holding SAS (France)(iii)(7)
B Participations SAS (France)(iii)(7)
Beijer Byggmaterial AB (Sweden)(iii)(14)
Beijer Byggmaterial i Uppsaala AB (Sweden)(iii)(14)
British Fittings Central Limited (England)(ii)(iii)(2)
British Fittings Company (North Eastern) Limited
(England)(ii)(ix)(2)
British Fittings Group Limited (England)(ii)(iii)(2)
British Fittings Limited (England)(ii)(iii)(2)
Broughton’s Limited (England)(ii)(iii)(2)
Build Center Limited (England)(ii)(iii)(2)
Build.com, Inc.(US)(ix)(3)
Builder Center Limited (England)(ii)(iii)(2)
Building & Engineering Plastics Limited
(England)(ii)(iii)(2)
Capstone Global Solutions AG (Switzerland)(iii)(1)
Caselco Limited (England)(ii)(iii)(2)
Clawfoot Supply, LLC (US)(xii)(3)
Clayton International, LLC (US)(xii)(3)
Controls Center Limited (England)(ii)(ix)(2)
Crew-Davis Limited (England)(ii)(iii)(2)
Davidson Group Leasing Co. LLC (US)(xii)(3)
Drain Center Limited (England)(ii)(iii)(2)
DT Finland Oy (Finland)(iii)(21)
DT Holding (Sweden) AB (Sweden)(iii)(14)
DT Holding 1 AS (Denmark)(iii)(17)
Electro Energy A/S (Denmark)(iii)(16)
Energy & Process Corporation (US)(x)(3)
Ferguson Enterprises Inc (US)(x)(3)
Ferguson Enterprises Real Estate, Inc (US)(iii)(3)
Ferguson Finance (Switzerland) AG
(Switzerland)(iii)(1)
Ferguson Fire & Fabrication Inc. (US)(iii)(5)
Ferguson Group Services Limited (England)(iii)(2)
Ferguson Holdings (Switzerland) AG
(Switzerland)(i)(iii)(1)
Ferguson Panama, S.A. (Panama)(x)(4)
Ferguson Receivables, LLC. (US)(x)(3)
Ferguson Sourcing (Switzerland) AG
(Switzerland)(iii)(1)
Fusion Provida Holdco Limited (England)(iii)(30)
Fusion Provida UK Limited (England)(iii)(30)
G. L. Headley Limited (England)(ii)(iii)(2)
Glegg & Thomson Limited (Scotland)(ii)(iii)(20)
H.P. Products Corporation (US)(x)(3)
Hall & Co. Limited (England)(ii)(iii)(30)
Health Equipment Hire Limited (England)(ii)(iii)(2)
Heating Replacement Parts & Controls
Limited (England)(ii)(iii)(2)
Heatmerchants Limited (England)(ii)(iii)(2)
Het Onderdeel BV (Netherlands)(iii)(24)
Hobro Ny Trælast A/S (Denmark)(iii)(26)
Home Outlet Online Limited (England)(iii)(30)
HP Logistics, Inc. (US)(x)(3)
Huggjärnet 6 Kommanditbolag (Sweden)(xiii)(14)
Improvement Brand Holdings, Inc. (US)(x)(3)
Julise Limited (England)(ii)(iii)(2)
King & Company (1744) Limited (England)(ii)(iii)(2)
Kommanditbolaget Näringen 8:4 (Sweden)(xiii)(14)
Living Direct, Inc. (US)(x)(3)
M. A. Ray & Sons Limited (England)(ii)(iii)(2)
Matera Paper Company, Inc. (US)(x)(3)
Melanie Limited (England)(ii)(iii)(2)
Mölnlycke Trä AB (Sweden)(iii)(14)
MPS Builders Merchants Limited (England)(iii)(30)
Neumann Bygg AS (Norway)(iii)(29)
Nevill Long Limited (England)(iii)(30)
Ningbo Capstone Service Solutions Company
Limited (China)(iii)(27)
Northern Heating Limited (Scotland)(ii)(iii)(20)
Northern Heating Supplies Limited
(Scotland)(ii)(iii)(20)
140 Ferguson plc Annual Report and Accounts 2017
Group companies

Fully owned subsidiaries (continued)
Nu-Way Heating Plants Limited (England)(ii)(iii)(2)
O.B.C. Limited (England)(ii)(iii)(2)
O.B.C. Limited (Northern Ireland)(ii)(iii)(9)
Oil Burner Components Limited (England)(ii)(iii)(2)
P.D.M. (Plumbers Merchants) Limited
(Scotland)(ii)(iii)(20)
Parts Center Limited (England)(ii)(iii)(2)
Pat Murphy Industrial (Sales & Service) Limited
(Republic of Ireland)(iii)(6)
Pipeline Controls Limited (England)(ii)(iii)(2)
Plumb-Center Limited (England)(ii)(iii)(2)
Power Equipment Direct Inc. (US)(x)(3)
Promandis Limited (England)(ii)(iii)(2)
Reay Electrical Distributors Limited (England)(ii)(iii)(2)
Rosco Industrial Limited (Scotland)(ii)(iii)(20)
Sellers of Leeds (Group Services) Limited
(England)(ii)(iii)(2)
Sellers of Leeds International Limited
(England)(ii)(iii)(2)
Sellers of Leeds Limited (England)(ix)(30)
SEMSCO Barbados, LLC (US)(ii)(x)(12)
Soak B.V. (Netherlands)(ii)(iii)(32)
St. Nicholas Finance Limited (England)(ii)(ix)(2)
STARK Føroyar PF (Denmark)(iii)(19)
Stark Group A/S (Denmark)(iii)(17)
Stark Group Holdings A/S (Denmark)(iii)(17)
Stark Kalaallit Nunaat A/S (Greenland)(iii)(22)
Starkki Property Oy (Finland)(iii)(21)
Stock Loan Services LLC (US)(xii)(3)
Sundsvall Vagnen 1 Fastighets AB
(Sweden)(ii)(iii)(14)
T & R Electrical Wholesalers Ltd (England)(iii)(30)
Tellum Construction, LLC (US)(xii)(3)
Thames Finance Company Limited
(England)(ii)(iii)(2)
Thomson Brothers Limited (Scotland)(iii)(20)
Uni-Rents Limited (England)(ii)(iii)(2)
Utility Power Systems Limited (England)(vi)(30)
Wasco Distributiecentrum B.V. (Netherlands)(iii)(24)
Wasco Energie Centrum B.V. (Netherlands)(iii)(24)
Wasco Groothandelsgroep B.V.
(Netherlands)(iii)(24)
Wasco Holding B.V. (Netherlands)(iii)(24)
Wasco Twello B.V. (Netherlands)(iii)(23)
Wholesale Group Operations, Inc. (US)(x)(3)
Wholesale Supplies (C.I.) Ltd (Jersey)(iii)(v)(10)
William Wilson & Co. (Aberdeen) Limited
(Scotland)(ii)(iii)(20)
William Wilson & Company (Glasgow) Limited
(Scotland)(ii)(iii)(20)
William Wilson (Rugby) Limited (England)(ii)(iii)(2)
William Wilson Holdings Limited (Scotland)(iii)(vi)(20)
William Wilson Ltd (Scotland)(iii)(20)
WM. C. Yuille & Company Limited (Scotland)(ii)(iii)(20)
Wolseley (Barbados) Ltd (Barbados)(iii)(3)
Wolseley Bristol Limited (England)(ii)(iii)(2)
Wolseley Canada Inc (Canada)(x)(11)
Wolseley Capital, Inc. (US)(x)(3)
Wolseley Centers Limited (England)(ii)(iii)(2)
Wolseley Centres Limited (England)(ii)(iii)(2)
Wolseley de Puerto Rico, Inc. (Puerto Rico)(i)(x)(3)
Wolseley Developments Limited (England)(ii)(iii)(2)
Wolseley Directors Limited (England)(ii)(iii)(2)
Wolseley ECD Limited (Northern Ireland)(ii)(iii)(9)
Wolseley Engineering Limited (England)(ii)(iii)(2)
Wolseley Europe Limited (England)(iii)(2)
Wolseley Finance (Isle of Man) Limited
(Isle of Man)(ii)(ix)(xiv)(8)
Wolseley Finance (Thames) Limited
(England)(ii)(iii)(2)
Wolseley Finance (Theale) Limited (England)(ii)(vii)(2)
WFBM SNC (France)(iii)(7)
Wolseley Green Deal Services Limited
(England)(iii)(30)
Wolseley Group Holdings Limited (England)(iii)(2)
Wolseley Haworth Limited (England)(iii)(30)
Wolseley Holding A/S (Denmark)(iii)(17)
Wolseley Holdings (Ireland)
(Republic of Ireland)(ii)(iii)(xiv)(6)
Wolseley Holdings Canada Inc. (Canada)(xi)(11)
Wolseley Industrial Canada Inc. (Canada)(iii)(11)
Wolseley Insurance Limited (Isle of Man)(ix)(31)
Wolseley Integrated de Mexico, S.A. de C.V.
(Mexico)(iv)(33)
Wolseley Integrated Services Inc. (Canada)(x)(11)
Wolseley Investments Limited (England)(ii)(iii)(2)
Wolseley Investments North America,
Inc. (US)(iii)(3)
Wolseley Investments, Inc. (US)(iii)(3)
Wolseley Limited (England)(i)(iii)(2)
Wolseley NA Construction Services, LLC (US)(xii)(3)
Wolseley Nordic Holdings AB (Sweden)(iii)(14)
Wolseley North America, Inc. (US)(ii)(iii)(3)
Wolseley Overseas Limited (England)(iii)(2)
Wolseley Pension Trustees Limited
(England)(ii)(iii)(2)
Wolseley Properties Limited (England)(ii)(iii)(2)
Wolseley QUEST Limited (England)(ii)(iii)(2)
Wolseley Trinidad Ltd (Trinidad and Tobago)(iii)(15)
Wolseley UK Directors Limited (England)(iii)(30)
Wolseley UK Finance Limited (Guernsey)(ii)(iii)(xiv)(18)
Wolseley UK Limited (England)(ix)(30)
Wolseley Utilities Limited (England)(iii)(30)
Wolseley-Hughes Limited (England)(ii)(iii)(2)
Wolseley-Hughes Merchants Limited
(England)(ii)(iii)(2)
Wright (Bedford) Limited (England)(ii)(iii)(2)
Yorkshire Heating Supplies Limited
(England)(ii)(iii)(2)
Joint ventures
Brabyggare Sverige AB (Sweden)(iii)(25)
Controlling interests
Luxury for Less Limited (England, 68%)(viii)(13)
SCI de Lhoumaille (France, 53%)(iii)(7)
Shanghai Du De International Trading Company
(China)(iii)(xv)(28)
Associated undertakings
Walter Meier AG (Switzerland, 39%)(iii)(34)
Notes:(i) Directly owned by Ferguson plc(ii) Dormant(iii) Ownership held in ordinary shares(iv) Ownership held in class of A shares(v) Ownership held in class of B Shares(vi) Ownership held in classes of A and B shares(vii) Ownership held in classes of A, B, C and D shares(viii) Ownership held in classes of A1, A2, B, C, D, E, G shares(ix) Ownership held in ordinary and preference shares(x) Ownership held in common stock(xi) Ownership held in common stock and preferred stock(xii) Ownership held as membership interests(xiii) Ownership held as partnership interests(xiv) Companies controlled by the Group based
on management’s assessment(xv) Ownership held 100% by Luxury for Less Limited
Registered office addresses:(1) Grafenauweg 10, CH-6301, Zug, Switzerland(2) Parkview 1220, Arlington Business Park, Theale,
Reading, RG7 4GA, United Kingdom(3) 12500 Jefferson Avenue, Newport News VA 23602,
United States(4) 140 Commerce Road, Boynton Beach, FL 33426,
Panama(5) 18825 San Jose, City of Industry CA, United States(6) 25/28 North Wall Quay, Dublin 1, Ireland(7) 3 avenue de l’Opera, 75001, Paris, France(8) 33-37 Athol Street, Douglas, IM1 1LB, Isle of Man(9) 42-46 Fountain Street, Belfast, Northern Ireland,
BT1 5EF, United Kingdom(10) 47 Esplanade, St Helier, Jersey, JE1 0BD, Jersey(11) 880 Laurentian Drive, Burlington ON L7N 3V6, Canada(12) 9501 Highway, 92 East, Tampa FL FL 33610,
United States(13) Attleborough House, Townsend Drive, Attleborough
Fields Industrial Estate, Nuneaton, Warwickshire, CV11 6RU, United Kingdom
(14) Box 798, S-19127, Sollentuna, Sweden(15) Building no 6, Fernandes Industrial Centre, Eastern
Main Road, Laventille, Port of Spain, Trinidad and Tobago
(16) GI Landevej 2, POB 1499, DK-2600, Glostrup, Denmark(17) Gladsaxe Møllevej 5, 2860, Søborg, Denmark(18) Glategny Court, Glategny Esplanade, St Peter Port,
GY1 1WR, Guernsey(19) Gulsteinsvegur 3, Saltangara, Færøerne, Denmark,
FO-600, Faroe Islands(20) Hareness Road, Altens Industrial Estate, Aberdeen,
AB12 3QA, United Kingdom(21) Helsingintie 50, Lahti, 15100, Finland(22) Industrivej 16, Nuuk, 3900, Greenland(23) Koppelstraat 9, 7391 AK, Twello, Netherlands(24) Leigraaf 54, 7391 AL Twello, Twello, Netherlands(25) Lindingo, Stureplan 6, 4tr, 114 35, Stockholm, Sweden(26) Lucernevej 2, DK-9500 Hobro, Denmark(27) Room 1203, Building 1 (Beilun Financial Building),
527 Baoshan Road, Xinqi, Beliun District, Ningbo, China(28) Room 306-1 Building 2, 3000 Yixian Road, Baoshan
district, Shanghai, China(29) Sandviksboder 58, Postboks 705, Bergen, NO-5807,
Norway(30) The Wolseley Center, Harrison Way, Leamington Spa,
CV31 3HH, United Kingdom(31) Tower House, Loch Promenade, Douglas, Isle of Man,
IM1 2LZ, Isle of Man(32) Bergpoortstraat 71, 7411 cl Deventer, Netherlands(33) Carretera a General Cepeda 8395, Derramadero,
Coahuila, 25300, Mexico(34) Bahnstrasse 24, 8603 Scherzenbach, Switzerland
Strategic report Governance Financials Other information
141Ferguson plc Annual Report and Accounts 2017