Fenton Mill Development York County, Virginia
49
Fenton Mill Development York County, Virginia TRAFFIC IMPACT ANALYSIS Prepared for Fenton Mill Associates, LLC September 2020 CONSULTING ENC . McPHER Lie. No. 025738 Digitally signed by: kmcpherson@mcphersonconsulting . com / Date: 2020.09.25 10:13:39 -05'00' Karen C. McPherson PE McPherson Consulting, LLC Project #: 757 . 061 . 001
Transcript of Fenton Mill Development York County, Virginia

Fenton Mill Development York County, Virginia
TRAFFIC IMPACT ANALYSIS
Prepared for Fenton Mill Associates, LLC
September 2020
CONSULTING
ENC. McPHER Lie. No. 025738
Digitally signed by: kmcpherson@mcphersonconsulting .
com / Date: 2020.09.25 10:13:39 -05'00'
Karen C. McPherson PE
McPherson Consulting, LLC
Project #: 757.061 .001

CONSULTING
Table of Contents Section Page
1 Introduction ...................................................................................... 3 1.1 Project History and Background .. .. .. .. ............ ... ..... .... .... ...... ........ ... .... .. ... .. .. ... .... ..... 3 1.2 Study Area ...... .. ...... .... ........ .. ... .... ...... ..... .. ....... .. ....... ........... ......... ... ...... ... ..... .. .. ..... 6 1.3 Existing Land Use ... ............... .. ........ ... ... .. ..... ...... .... ... ... .. ...... ... .... ... ...... ..... ...... .. .. ... 6 1.4 Existing Conditions ....... .... ... .... ... ..... .. ....... ........ ... ........ .... .. ..... ... .... ... ........ .... ....... ... 6
2 Analysis of Existing Conditions ..................................................... 8 2.1 Capacity analyses at Critical Points ..... .. ... ..... .................. .. ......... .... ... ... ...... ... .. ... .... 8 2.2 Turning Movement Counts (TMC) ..... ... .... .. ..... ... .... ...... ........... ..... ..... ....... ... .... ... ..... 8 2.3 Average Daily Traffic (ADT) Counts ..... ..... .. .. .. .... .... .... ......... ... .. .. .. ... .... .... ..... .... ..... . 9 2.4 Capacity and Levels of Service Analyses at Critical Points ........... ..... .. .. ... ... .. .. ... .. 11
3 Future Conditions without Development ..................................... 12 3.1 Growth Rates ... ...... .. .. .... .. ...... ........ .......... ......... ..... ......... .. ..... .... ... .... ... ......... ... .. ... 12
4 Trip Generation .............................................................................. 15 4.1 Trip Generation ......... ... .. ... .. ............ ...... ... ... ... ..... ..... ... ..... .... .. .. ... .... ... .. .... ... .... .... .. 15 4.2 Internal Capture ... ........... .... .. ..... .... .... .......... ........ ...... ..... ........ ... .......... ... .. .... .... .... 17 4.3 Pass-by ... ............ ..... .. ... .. .. ... ... .... .. .. ........... ... ...... ... ... .... ........ ..... ..... ..... .... .. ....... ... . 17
5 Site traffic Distribution and Traffic Assignments ........................ 18 5.1 Trip Distribution .. .... ................ ...... ... ...... ... ..... ............. .. .... ... .......... .. .. .......... ..... .. ... 18 5.2 Trip Assignment. ... ..... ........ ....... ... ..... .. .. ... .. .. ... .......... .... ........ ... .. ... ... .. ......... .... ...... 18
6 Future Conditions with Development.. ......................................... 21 6.1 Future Traffic Volume .. .... ... ... .. ... ... .. ...... ...... ... .. ........... ....... ... ...... ........ ........... .... .. 21 6.2 Capacity and Level of Service Analyses at Critical Points ......... .. .... .... .. ... ... .. .... .... 30 Traffic Signal Warrant Analysis ... .. .. ... ..... .... .. ....... .... .... ..... ... .. ..... ..... .. ... ........ ..... .... .. ... .. . 32 6.3 School Impacts ........ ... ... ....... ...... ........ ...... ...... ....... ..... ...... ..... ... ......... .. .... .. ....... .... 42 6.4 Queuing Analysis .. ... ... .... ...... .... ...... ... ..... ..... ..... ......... ..... ... ... ...... .. ...... ..... .. ... ....... . 43
7 Conclusions and Recommended Improvements ........................ 44 7.1 Proposed lmprovements ........... ... ...... ... ...... .. .... ..... .... .... ...... .... .. .... .... ....... .. .. ........ 44

CONSULTING
List of Tables Table Page
Table 1: Levels of Service and Ranges of Delay .. ... .... ....... ..... .... .... ...... ........... ... ....... ..... 8
Table 2: Proposed Trip Generation - Zone 1 .............. ...... .......... .... ..... ......... .... ..... ....... 15
Table 3: Proposed Trip Generation - Zone 2 ............... .. .... ........ ..... ...... ....... ..... .... ....... . 15
Table 4: Proposed Tip Generation - Zone 3 .... .... ..... .. .... ... .. .. .... ... .. ... ... ..... ... .... .. .... ...... 16
Table 5: Proposed Trip Generation - Total Fenton Mill. ....... ....... ... ........ .. ...... ... ....... ... .. 16
Table 6: Proposed Trip Generation - Fenton Mill with School .. .... ....... ... ............. ........ 16
Table 7: Newman Road/ 1-64 EB Off Ramp
Unsignalized Intersection Level of Service .. .... ....... .......... ... ...... .... .... ..... ..... .. ..... ..... ...... 31
Table 8: Newman Road/ Fenton Mill Road Unsignalized Intersection
Level of Service ... ........ .. ....... ... .... ..... ........ .... .. ... .... ... ....... .... ....... ... ...... .... .. .. .. .......... .... .. 34
Table 9: Newman Road/ Barlow Road Unsignalized Intersection
Level of Service ... ........ ... ...................... .... ................. ...... ................ ........ .... ...... ...... ...... 36
Table 10: Barlow Road/ Fenton Mill Road Unsignalized Intersection
Level of Service ... ...... .... .................... ... ...... ........ ....... ............ ........ ........ ... ......... ... .. .... ... 37
Table 11 : Barlow Road/ E. Rochambeau Drive Unsignalized Intersection
Level of Service ......... ..... ........... ........ .... .... .. ... ................ ...... ... ...... .. .......... ... .... ... .... .. .. .. 38
Table 12: Newman Road/ Primary Site Entrance
Unsignalized Intersection Level of Service ... ... .... .............. ... ... ... .. ... ... .. ..... ...... ...... ...... .. 39
Table 13: Fenton Mill Road/ North Site Entrance
Unsignalized Intersection Level of Service ...... ..... .... ... ... ....... .... ..... .. ... ................. .. ....... 40
Table 14: Fenton Mill Road/ South Site Entrance
Unsignalized Intersection Level of Service .... .. ............... .. .... .... ...... .. .. ....... .... .... ..... ...... . 41
Table 15: School Impacted Intersections ... .... ......... ....... ...... ........... .... ... ...... ...... ......... .. 42 11
20.09.25 Fenton Mill Development TIA

CONSULTING
List of Figures Figure
1
2
3
4
5
6
7
8
9
10
11
12
13
14
15
Page
Study Area .. .. ............... ... ......................... ........ ....... ..... .......... ..... ...... ... ........... 4
Site Plan ... ........ .... ..................... ....... .... .... .. ..... ... ... .. ... .... ... .... .. ..... ...... .... ... ...... 5
Existing 2020 Volumes: AM and PM Peak Hour ....... ..... .......... .............. ....... 10
2030 No Build ........ .. ... .. ...... ....... ........... .......... ................................... ..... ....... 13
2036 No Build ........................................................................ ........ ....... ....... .. 14
Trip Assignment - Total Fenton Mill ............................................................. . 19
Trip Assignment - School Site ...... ..... .. .. .......... ...... ...... .......... ....... ......... ...... . 20
2030 AM Build - Total Fenton Mill ................................................................ 22
2030 PM Build - Total Fenton Mill ... .... .. ................ ... .......... .......... ... ........ .. ... 23
2036 AM Build - Total Fenton Mill ................................................................ 24
2036 PM Build - Total Fenton Mill ........................................................ .. ..... . 25
2030 AM Build - Fenton Mill Plus School. ... .................................................. 26
2030 PM Build - Fenton Mill Plus School. ..................................................... 27
2036 AM Build - Fenton Mill Plus School. ..... .... ...... .... .. .... ... .... ... .. .. ... ...... ..... 28
2036 PM Build - Fenton Mill Plus School. ........................................ .... ... .... .. 29
111
20.09.25 Fenton Mill Development TlA

Executive Summary
The Fenton Mill Development, located in York County, Virginia, is a proposed residential development which will consist of various types of residential housing. As part of the rezoning , the developer is also dedicating two parcels to York County. The parcel along Barlow Road is intended to remain vacant or developed for a recreational use and was not included in this analysis as it will generate minimal if any traffic during peak periods. The second dedicated parcel is located on Fenton Mill Road. To be conservative, this parcel was analyzed as an elementary school. However, York County does not have any specific plans for this parcel. The rezoning will also include seven residential lots at the end of Wichita Lane. Given the minimal number of units and established roadway network, these unit were not included in the analysis.
This residential development is located south of Newman Road immediately east of Fenton Mill Road. This property will have three (3) access points to include the main entrance on Newman Road , and two access points on Fenton Mill Road . Figure 1 illustrates the site location , the three (3) access points, and the study area intersections. Figure 2 illustrates the conceptual site plan. The proposed planned development will consist of 488 single family homes and 104 multi-family homes. The study area includes three local roadways: Newman Road , Fenton Mill Road , and Barlow Road. In addition, the analysis evaluates the impacts of nine (9) study area intersections, which include six 6 unsignalized intersections and 3 site entrances. While the Fenton Mill development will increase traffic volumes throughout the study area, given the various types of residential uses, traffic demands will be distributed throughout the peak period and dispersed to the several access points. Therefore, the existing roadway network is well suited to accommodate the additional traffic with minor improvements outline below.
Newman Road / 1-64 EB Ramps
• Extend the southbound off ramp right-turn lane by 250'.
Newman Road/ 1-64 WB Ramps
■ No additional improvements needed / maintain existing laneage.
Newman Road/ Fenton Mill Road
• No additional improvements needed / maintain existing laneage.
Newman Road/ Primary Site Entrance
• Construct the northbound approach to include an exclusive left-turn lane and an exclusive right-turn lane.
20.09.25 Fenton Mill Development TIA 1

• Construct an eastbound right-turn lane.
Newman Road / Barlow Road
CONSULTING
• No additional improvements needed / maintain existing laneage.
Barlow Road / Fenton Mill Road • No additional improvements needed / maintain existing laneage.
Barlow Road / E. Rochambeau Drive • No additional improvements needed / maintain existing laneage.
Fenton Mill Road/ North Site Entrance
• Construct the westbound approach to include one inbound and one outbound lane.
Fenton Mill Road/ South Site Entrance
• Construct the westbound approach to include one inbound and one outbound lane.
York County- Fenton Mill Road Parcel
The Fenton Mill developer will dedicate a 16.5-acre site along Fenton Mill Road to the County. This study analyzed the site as a 700-student elementary school to reflect a conservative approach. The county currently does not have specific plans for this parcel to be a school, however, if a school is constructed. the following improvements should be considered
Fenton Mill Road / North Site Entrance (by others) • Construct an exclusive Northbound right-turn lane along Fenton Mill
Road to include 100' of storage and 200' of taper.
20 .09.25 Fenton Mill Development TIA 2

CONSULTING
1 Introduction
1.1 Project History and Background
The Fenton Mill Development, located in York County, Virginia, is a proposed residential development, which will consist of a mix of various types of residential units along with a parcel to be dedicated to York County. While there are no specific uses identified, the traffic study assumed an elementary school uses, which is generate significant more traffic than a public park and is a conservative approach for the traffic analysis. The development is located south of Newman Road immediately east of Fenton Mill Road. This site will have three (3) access points to include the main entrance on Newman Road, and two access points on Fenton Mill Road. Figure 1 illustrates the site location, three (3) access points, as well as the study area intersections. Figure 2 illustrates the conceptual site plan.
The Fenton Mill Development is an approximately 313.45-acre site with a current zoning of RR and LB and is requesting a rezoning to Planned Development Residential (PDR). With the rezoning application, the development will consist of a maximum of 488 single family homes and 104 multi-family homes. The development also includes a 16.5-acre site along Fenton Bill Road that will to be dedicated to the County. For the purposes of this analysis, it is assumed the 16.5-acre site will support a 700-student elementary school. Several future scenario years are included in this traffic study to address the VDOT Chapter 527 criteria, that include a build out year, plus an additional 6-year horizon. Separate analysis is included to account for those specific improvements associated with the Fenton Mill development. However, a Full Build out analysis with the school traffic is also included such that the County can plan for specific infrastructures improvements needs if the property is development as an elementary school .
McPherson Consulting, LLC (McPherson) was retained to perform a traffic impact analysis for Fenton Mill Associates, LLC. The development is located in York County; however, the roadways are maintained by the Virginia Department of Transportation. Therefore, this report has been prepared based on criteria outline in the Chapter 527 guidelines for submittal to the Virginia Department of Transportation (VDOT). The study will evaluate existing and future traffic conditions, and make recommendations to mitigate traffic impacts, if necessary. Assumptions regarding the study area, count data, traffic generation, and trip distribution patterns were discussed with the VDOT and York County and are documented in the Scoping Meeting documents included in the Appendix.
20 .09.25 Fenton Mill Development TIA 3

Study Area
Newman Road
\ Barlow Road
fJ j Grea V olf I ody Q
* e; ·Q
:------_ Fenton Mill Road
IM!li 1
2
Intersection
Newman Rd./ 1-64 EB off Ramp Exit
234B
Newman Rd./ 1-64 WB off Ramp Exit
234
Newman Rd/ Fenton Mill Rd
Newman Rd./ Barlow Rd.
Barlow Rd./ Fenton Mill Rd.
Barlow Rd/ E. Rochambeau Dr.
Newman Rd./ Site Entrance
/ Barlow Road
II
E. Rochambeau Drive
Legend
* -Site
0
f North
Not to sca le
Carters Neck
Road
I
3
4
5
6
7
8
9
Fenton Mill Rd./ North Site Entrance
Fenton Mill Rd./ South Site Entrance
O - Study Area Intersections
El - Site entrances
Fenton Mill Development, York County, Virginia Figure l CONSULTING

Site Plan
l£0£1Cl
-.....,
LP D
' i
....... --
I II I ... -- ..... -- - -- --- --·- __ .._
f"CNlOH M TUI f'lAN -
Fenton Mill Development, York County, Virgin ia CONSULTING
t North
Not to scale
Figure 2

CONSULTING
1.2 Study Area
The study area for this analysis includes the following roadways and intersections:
Roadways ■ Newman Road
■ Fenton Mill Road
■ Barlow Road
Intersections 1. Newman Road/ 1-64 EB Off Ramp (exit 234B)
2. Newman Rood/ 1-64 WB Off ramp (exit 234)
3. Newman Road / Fenton Mill Road
4. Newman Road/ Barlow Road
5. Barlow Road / Fenton Mill Road
6. Barlow Road/ E. Rochambeau Drive
7. Newman Road / Site Entrance
8. Fenton Mill Road / North Site Entrance
9. Fenton Mill Road / South Site Entrance
The study area roadways and unsignalized intersections were agreed upon during the Scoping Meeting held on January 3, 2020, which included input from both York County and VDOT staff. The site plan has been revised from the initial layout, which has removed all direct access to Barlow Road. Consequently, the two site driveways along Barlow Road listed in the scoping document were eliminated.
1.3 Existing Land Use
The Fenton Mill development site is currently vacant. It is planned to be rezoned to accommodate a Planned development to include various residential housing types. Within the project vicinity, surrounding land uses consists of residential developments along with Fire Station 5 and a religious institution.
1.4 Existing Conditions Within York County, Newman Road, Fenton Mill Road, and Barlow Road are all local two-lane rural roadways providing access to the proposed development and residential communities. It is anticipated that most of the traffic generated by the residential development will be oriented to/from 1-64 or further west along Humelsine Parkway towards Williamsburg.
20 .09.25 Fenton Mill Development TIA 6
CONSULTING
The following provides a short description of the study area roadways:
Newman Road - is a four-lane, divided facility with a full movement interchange with 1-64. Approximately 720' east of the 1-64 westbound off ramp, Newman Road reduces to a two-lane undivided roadway within the limits of York County. Newman Road is a rural major collector that extends from 1-64 to River View Road. In the project vicinity, Newman Road has a posted speed limit of 45 miles per hour (mph) and an average daily traffic (ADT) volume of 2,900 vehicles per day (vpd).
Fenton Mill Road - is a two-lane, undivided facility that parallels 1-64 between Newman Road and Barlow Road. It has a posted speed limit of 55 mph for approximately 1.5 miles south of Newman Road and then a posted speed 40 mph hour where the roadway is narrows to approximately a 20' roadway section. Per the VDOT Daily Traffic Volume Estimates Jurisdiction Report 99, Fenton Mill has an ADT of 190 VPD. During a citizen information meeting held on September 8, 2020, it was noted that Fenton Mill often carries higher traffic volumes during the summer months. Furthermore, given its proximity and access to 1-64, Fenton Mill Road often functions as a detour route during incidents along 1-64. Additionally, it serves as an alternate route for traffic management during the 1-64 Widening - Segment 3 construction. However, this is a temporary condition , as the 1-64 Widening is scheduled to be complete in late 2021/early 2022.
Additional count data was collected in July 2021 along Fenton Mill, resulting in an ADT of 700 vpd at the northern end by Newman Road and 600 vpd at the southern end by Barlow Road. The current 2-lane roadway can accommodate the current and future traffic volumes. However, at the southern end , the current geometry has several curves and narrow lanes. Therefore, consideration should be given to reducing the posted speed and perform tree trimming to increase sight distance were feasible within the available right-of-way.
Barlow Road - is a two-lane, undivided roadway with no shoulders and open ditches. The local connector provides direct access for several singlefamily homes and residential neighborhoods. At its northern termini , Barlow Road intersects with Newman Road and Barnstaple Way at a four-legged unsignalized intersection. As it continues south for approximately 2.1 miles, it is oriented in a south/east west direction where it intersects Fenton Mill Road and terminates at an unsignalized T-intersection with E. Rochambeau Drive. Barlow Road has a posted speed limit of 45 mph and an ADT volume of between 1 ,200 and 1 ,400 vpd.
20.09.25 Fenton Mill Development TIA 7

CONS ULT I NG
2 Analysis of Existing Conditions
2.1 Capacity analyses at Critical Points
Intersection turning movement counts were used in conjunction with the number of lanes and traffic operations at each study intersection to determine existing and future levels of service. Level of service (LOS) describes traffic conditions-the amount of traffic congestion-at an intersection or on a roadway. Table 1 shows the LOS and delay range for signalized and unsignalized intersections.
Table 1: Levels of Service and Ranges of Delay
LOS
A :5 10 :5 10 B > 10 - 20 >10-15 C > 20- 35 > 15 - 25 D > 35- 55 > 25-35 E > 55- 80 > 35 - 50 F > 80 > 50
2.2 Turning Movement Counts (TMC)
Turning movement counts (TMC) were collected by Data Collection Group at each of the unsignalized study area intersections on January 22, 2020 during the AM (7 :00 to 9:00) and PM (4:00 to 6:00) peak periods for the following study area intersections.
■ Newman Road / 1-64 EB on/off ramps
■ Newman Road/ 1-64 WB off ramp
■ Newman Road / Fenton Mill Road
■ Newman Road / Barlow Road
■ Barlow Road / Fenton Mill Road
■ Barlow Road/ E. Rochambeau Drive
In addition to the TMC data, 12-hour ADT hourly counts were collected from January 21-23, 2020 for the following locations at the 1-64 and Newman Road interchange.
■ 1-64 on/off ramps
■ 1-64 on/off loops
20.09.25 Fenton Mill Development TIA 8

CONSULTING
As noted above, VDOT historical ADT along Fenton Mill Road appeared low. Therefore, additional ADT count were collected at two location along Fenton Road for seven consecutive days from July 21-27, 2020. This data reflects peak summer volumes Detailed data is included in the appendix.
2.3 Average Daily Traffic (ADT) Counts
Historic ADT counts were used from data in the Virginia Department of Transportation 's (VDOT) 2019 Historic Average Daily Traffic Counts.
Actual ADT counts were collected along Newman Road.
TMC and ADT data are illustrated in Figure 3.
It should be noted that the data collected in January 2020 was not impacted by the current COVID travel restrictions which were initiated in Virginia in March 2020.
20.09.25 Fenton Mill Development TIA 9

m' N \0 -!!!-0 N Vl
00
~ (0) 0 ~ (1) 1 (3) 1
AM
Peak Hour 7:15 - 8:15 AM
PM :a: Peak Hour 4:45 - 5:45 PM ., 0 "'
"' N
January 22, 2020 ◄i+L+
(11) 6
(10) 12 ~ (41) 73
N;:::-:a 00 0 ., g:
1-64 EB off ramp. + + 4
I 26) 21 • I o) o-'+
(559) 701 ♦
1 ( 7)
◄$- 0 ( 5) 48 (42)
◄-t. ~NO
N N
N 00 00 -.e!!l
.,; a: C e 3 ~ z
4 ( 9) 4 7 (16) 15 5
◄-i ttr+ ~ "' 00 ., ... NVlm'
~~=
Barlow Rd .
Weekday Average Daily Traffic Counts:
July 21 - 27, 2020
◄- 18 (31)
(23) 22 -
1-64 WB off ramp.
Fenton Mill Rd .
Legend
- - Laneage
Weekday Average Daily Traffic Counts:
July 21- 27, 2020
◄- 12 (33)
(24) 15 -
Q9 -Signalized Intersection
Q -Unsignalized Intersection
xx (xx) - AM (PM) Peak Hour Volume
:~ N ,--... ~
( 2) 2-i (23) 24
.,; a: 3 0
~ .,
E. Rochambeau Dr.
( 17) 5 _f. (226) 94
AM
Peak Hour 7:00 - 8:00 AM
PM
Peak Hour 4:00- 5:00 PM
January 22, 2020
4 ~~ \DO ~!::
l_ 25 ( 80) ◄= 100 (185)
~ > ...., C ~ 0 u V)
~ C ... 0 t -~ ...., ""O C C a., 0 E c.. u
.Q b.O a., C > +-' a., 0
V)
X w
~ C 0 ...., C a.,
LL
(9
z t_J
:::> CJ')
z 0 (.)

CONSULTING
2.4 Capacity and Levels of Service Analyses at Critical Points
Capacity analyses for the existing study intersections in the AM and PM peak hours were performed for the existing conditions for each of the study area intersections. Analyses were completed to determine the operating characteristics using Synchro Professional 10. 0, which uses methodologies contained in the 2010 Highway Capacity Manual (HCM).
Level of service analyses for the study area intersections were performed using unsignalized intersection operations. To compare operations among various scenarios, detailed analyses are illustrated in Tables 7 - 15 in Chapter 6 to provide a side by side comparison.
20.09.25 Fenton Mill Development TIA 11

3 Future Conditions without Development
CONSULTING
Background traffic growth is the increase in traffic volumes due to usage increases and non-specific growth throughout an area. One method of determining reasonable growth rates for an area is to research past traffic counts for a roadway or intersection and review historical data or use knowledge of the surrounding area. After reviewing VDOT data , it was noted that the traffic growth was relatively flat. However, based on conversations with the VDOT along with York County staff, a 1 % annual growth rate was used throughout the entire roadway network for both the 2030 and 2036 background traffic volumes.
3.1 Growth Rates
The agreed upon 1 % annual growth rate was applied to the existing 2020 conditions to project the 2030 and 2036 base volumes. This growth rate, applied over 10 and 16 years, results in a factor of 1.1 and 1.17 to generate the 2030 and 2036 base year volumes, respectively.
The following figures illustrate the study intersections and interchange background conditions for the AM and PM peak hours, respectively.
■ Figure 4 - 2030 No Build
■ Figure 5 - 2036 No Build
20.09.25 Fenton Mill Development TIA 12

~ m
"' 0
"' "§-:; al A-;:;-;:. ~~.!:: ~,g~ ~
L 53 (35) 00 .... j_ 4 ( 10)
__, 0 W __, __,
"' - 660 (741) ~ 319 (151) ~ f 27~ \13::
.... 0 W
+l++ f 134 ( 29)
~ Newman Rd . ..., .
(314) 106 =: ;;:. (134) 45 .t ~ ( 0) 2 ~ (270) 83 - .... (1030) 526 =+
( 415) 439 l,
~ 0 © t ( I
C V, ,-
a c;;;· ., ► ::, ::, s: <l) c;;;· !?!. ., -:,;
::, ;:.· "" !?!. <l) <l)
~ ;:.· a. <l)
~ a. z ~
<l)
0 vl
"' ~ <l)
!:. ~ "' o· a: ~ ::,
'O o· "' ::, ~ ::c 0 !; < 0 c 3 "'
m ,, g =r
3 O"
~ !a'
;_;-"' .... ~~ .... 0
}: 7 (15) w en
++ 106 (48)
i~ .... .... "' 0 00 ,_,-~;
Phersll1 CONSULTING
=r __, 00 "' w ( 14) 9 --;:;-;:; "' ~~s w ~
t ~ "' 0
"' 3 '!'
~
"' :,
g ~ ,, ~
,_,-~~
"' 2 ( 2) "' "' ~ 85 (39) +-4 Barlow Rd .
I
(40) 11 1. (77) 25
Fenton Mill Development -York County, VA
2030 No Build
~E:§ 0 ( 3) ........ 0 4 90 (35)
~/' 6 ( 7)
,.-4 ( 2) 1 +- ~~:: (97) 24 (64) 22
"'"' 00 r--- --
~ 0 ~ ,, ~
I 1-o 1-o~ ,,. ~
o, <'q~
Figure
4

(n--V, w ~.9.S 00
"' "' 0 0 v,
+l~
( 0) 2 ~ (1095) 559 ~ ( 441) 467 l,
X
( X
0 © t I C V, r-
~ ,;;;· .,
l> ::, ::, s: ,;;;· '!!. :,,: ~
::, ;::;· "" '!!. (1) (1)
~ ;::;· c.. (1)
~ c.. z ~
(1)
0 ;;: "'
(1) (1)
!:. ;;: ~ (1) a: ~ i5'
'O o· ::,
(1) ::, ., "" I 0 !:; < Q. C
3 (1)
!"
"' g =r
3 <:r ~ C
~
-;:;-!-2 .... ....
~ 7 (16) o en
~ 112 (51)
' -+~ .... .... "' .... "' -;:;-.... "' ~~
PberSm1 CONSULTING
t rn (10
0 =i:
~ A.:--;; ~~~
"!' L 00 .... j_ 5 ( 11) V, ,. ....
- 702 (789)
~ 56 ( 37)
~ 293 (144) -f 143 ( 30) 339 (160) f 4 ( 8) /
Newman Rd . .-(333) 112 =: ;;:. (143) 48 _j ,..... 4 - .... (287) 88 =+, 00 00 V,
( 15) 9 l, --;;-;: w ~$!:! "' ....
0 ~
~ :E (10
0 =i:
~ "!'
~ .. :,
s :,
~ "' fl-
"' .::::!~ "' 2 ( 2) 00"'
.1- 90 (41) ..-1. Barlow Rd .
(42) 12 -1. (82) 27
Fenton Mill Development - York County, VA
2036 No Build
~ES 0 ( 4) .... .... 0 4 96 (37)
~ 6 ( 7)
\ , ,..4 ( 2) 1 ~ "' en o..., (103) 26 ~- -( 68) 23 .!2-!!!..!!!!
~ 0 ~
"' fl-
I '1< 1-o o,,. 'I'~ o,
t"'41/~
Figu re
5

CONSULTING
4 Trip Generation 4.1 Trip Generation
Traffic generated by the proposed development was determined using trip generation methodology contained in the Institute of Transportation Engineers (/TE) Trip Generation Manual, 10th Edition, 2017.
Based on the size of the development and access between the internal/external roadway network, the site was divided into three (3) zones to reflect unique travel patterns to be assigned to each zone. Tables 2-6 summarize the proposed site traffic by zone.
Table 2: Proposed Trip Generation - Zone 1
I Variable~
Land Use (code) (Units) J In I Out I In I Out I In I Out
Zone 1 Single Family Detached (210) 388 Units 1,832 1,831 72 215 242 142
Total 388 Units 1,832 1,831 72 215 242 142
Table 3: Proposed Trip Generation - Zone 2
Residential Development Single Family Detached 210
61 Units 288
Multifamily Housing Low Rise 220
104 Units
Elementary School 700 520 Students
Total School Total
381
662
662 1331
288
661
661 1329
11 34 38 22
11 37 37 21
253 216 57 62
253 216 57 62 275 287 132 105
Table 3 illustrates that the residential portion has the potential to generate 93 and 118 trips during the AM and PM peak periods respectively. The county currently does not have plans for this dedicated parcel to be a school however, this potential land use of a 700-student elementary school reflects a conservative approach. If a school is construction on this site, it has the potential to generate 469 and 119 total drips during the AM and PM peak periods, respectively.
20.09.25 Fenton Mill Development TIA 15

CONS ULT I NG
Table 4: Proposed Tip Generation - Zone 3
Single Family Detached 210
39 Units 184
Total 184
184 7 22 25 14
184 7 22 25 14
Table 5 combines all "zones" and indicates the entire Fenton Mill development has the potential to generate approximately 409 and 541 trips during the AM and PM peaks, respectively.
Table 5: Proposed Trip Generation -Total Fenton Mill
Zone
Zone 1 1,832 1,831 72 215 242 142 Zone 2 669 668 22 71 75 43 Zone 3 184 184 7 22 25 14
Total 2,685 2,683 101 308 342 199
In addition to the Fenton Mill Development, the proposed rezoning will dedicate 16.5 acres to York County for a potential 700-student elementary school. The combined site traffic is illustrated in Table 6.
Table 6: Proposed Trip Generation - Fenton Mill with School
Zone Daily AM Peak PM Peak
In Out In Out In Out Fenton Mill Development 2,685 2,683 101 308 342 199 Zone 3 School 662 661 253 216 57 62
Total 3,347 3,344 354 524 399 261
Table 6 shows that the Fenton Mill development and school traffic combined have the potential to generate 878 trips and 660 trips during the AM and PM peak periods, respectively. For this study, separate analyses were performed for each scenario to identify the infrastructure improvements associated with Fenton Mill residential development as well as school specific infrastructure requirements.
20.09.25 Fenton Mi ll Development TIA 16

CONSULT I NG
4.2 Internal Capture
The commercial portion of the development has been eliminated. Therefore, since the development is comprised solely of residential land uses, no internal capture applied. All trips are anticipated to be new trips and will be added to study area intersections and roadways.
4.3 Pass-by
Based on the nature of this development, no pass-by reductions were applied to the network as part of the trip assignment.
20.09.25 Fenton Mill Development TIA 17

CONSUL TING
5 Site traffic Distribution and Traffic Assignments
5.1 Trip Distribution
The directional distribution and assignment of trips generated by the proposed development are based on a review of existing intersection traffic volumes, an understanding of travel patterns within the study area, and discussions with York County staff and the Virginia Department of Transportation (VDOT). Detailed trip distribution for each zone can be located in the Appendix.
Trip distribution for the outbound and inbound movement are mirrored travel patterns for Zone 1. For Zones 2 and 3, outbound trips designated to travel eastbound on 1-64 will travel to Barlow Road, then to E. Rochambeau Drive to use the 1-64 and Capitol Landing Road interchange. However, the returning inbound trips were projected to remain on 1-64 and exit directly to Newman Road interchange to access Fenton Mill development. These assumptions were discussed and agreed upon with VDOT and York County staff.
5.2 Trip Assignment
The trip distribution percentage for each zone was applied to the proposed trip generations outlined in Tables 2-4. The detailed AM and PM peak hour trip assignment for each zone are provided in the Technical Appendix. These trip assignments were then combined to reflect the overall site generated traffic by Fenton Mill development only for the AM and PM peak periods for each of the study area intersections and are illustrated in Figure 6. The traffic assignment generate by the proposed school is illustrated in Figure 7.
20.09.25 Fenton Mill Development TIA 18

X X
0 ® I C V,
)> ~ oo· s: ::, oo· !!!. ::, ;:.· "'o !!!. ,,, £ ;:.· a. ,,,
~ a. "C ~
,,, ,,, ;;: ~
,,, ,,, I
;;: i:. ,,, o· 0 i:. ~ o· ::,
< ::,
2. C:
3 ,,,
t Iii" ::, ,,, Q)
"" ,,,
.... !::! ,,. ~
.... V,
(80) 24 ;;;:: -.
(
1- 11 ( 7) 61 (38)
tr+
.__Pberslll~ CONSULTING
+--- 71 (47) f 118 (78) ~ j --+
1230) 68 'f V, ., (100) 29 ....
"' £
t N-::J ~ ~~
"' N 0 -., N :i:
~ ~ ,,
-;; ~ ....
Barlow Rd . :L. (12) 4 _f..
j_ +--- 204 (135) f
4 1230) 68 w N
.... £
.... ,,. --;:; ~~
South Driveway
t.. ,,. .... N
.i
.. =t ~r+
N 0
~ ,,.
3 .... w
Q ~ '1 !(? ;;; "' ;; a " ~
Fenton Mill Development -York County, VA
Trip Assignment - Tota l Fenton M il l
~ 4
Newman Rd . 4 • ..
~ 0 :E ,, fl-
I
Figure
6

e :".! ~
~ Barnstaple Way. -t►
(17) 76 30%
; " :::l -;,. Sl
~
.,; - « ; ; " E N 3: .... .. Sz "'
+{+1+
(6) 25 10% -t►
1-64 EB off ramp.
4 Barlow Rd.
4►
;~
t.. f Primary Site Entrance
J 0
"' 00
;l .... m
so~ 10s (311 41Q~ ZZ ! 61
+ittr-►
>.
~ .. ·~ Cl
-s ~
-4 ~
(34) 152 60% ~
1-64 WB off ramp.
.!&ll!!l!
- -Laneage
Q9 -Signalized Intersection
0 -Unsignalized Intersection
~
xx% xx ~ - Distribution Inbound/~ AM JE.MJ..Peak Hour Volume
~ >- Q) +-' -~ C V') ::::i 0
0 u ~ 0 ,._ ..c ~ u
I V')
m N
+-' I C .... QJ +-'
.t_ 40% 101 (23)
;l .... 0 .., ~
E C 0. Q)
_Q E QJ C > QJ l:l.O
(251 86 40% i +t 0 Vl Vl
2 <C C a. 0 ,._ +-' I-C QJ
LL
E. Rochambeau Dr. -4 .t (9
z
~ I-__. :::> (./)
z 0 (_)

6 Future Conditions with Development
6.1 Future Traffic Volume
CONSULTING
Total future traffic volumes represent the addition of traffic generated by the proposed Fenton Mill development to the background traffic volumes. These resulting volumes are also referred to as "build" volumes. The 2030 and 2036 Build traffic volumes are illustrated in the following figures:
• Figure 8 - 2030 AM Build - Total Fenton Mill
• Figure 9 - 2030 PM Build - Total Fenton Mill
• Figure 10 - 2036 AM Build - Total Fenton Mill
• Figure 11 - 2036 PM Build - Total Fenton Mill
An additional future scenario was also evaluated for each of the four scenarios noted above that includes the school generated traffic. The 2030 and 2036 Build traffic volumes with the additions of the school traffic are illustrated in the following figures:
• Figure 12 - 2030 AM Build - Fenton Mill Plus School
• Figure 13 - 2030 PM Build - Fenton Mill Plus School
• Figure 14- 2036 AM Build - Fenton Mill Plus School
• Figure 15 - 2036 PM Build - Fenton Mill Plus School
20.09.25 Fenton Mill Development TIA 21

(550] (24) 526 ;: (439] ( 0) 439 1,
(145] (39) 106 ::: r+ I 45) I o) 45 .t (151) (68) 83 -I 38) (29) 9 "f
)< )<
0 )<
~ x ~ ,, C
~ a C: oo· z ii:
0 ::,
"' !!!. a, 0 ;;;· !: . .,
"' a: C. C.
~ l:
~ ., < "' .!!. ;;:
0, "' :::. !:. a· ~ ::,
(8)
V, oo· ::, !!!. ;;;·
"' C.
~ "' ;;: "' :::. a· ::,
t :;;-::,
"' ., "" "'
!" ,, g ::r
3 IT
re C
!;'
(495] (0) 495
(
t 7 (11) I 18] ♦ 106 (61) (167]
CONSULTING
f ,:;: "' 0 =I:
~ "!'
Barlow Rd .
WN ~.t:J. --;;; ~.!::::'.
"' V, 0
~
.,-~.:::! .;;-.. :::L:::! "' 00 0
f►
(15] (4) 11 _f. (25) (0) 25
~
" 00 ,. w--!:!.9,.9 A-~~~
!--0 (25) (25)
0 (57) (57)
_ _ N2,rt! ~ri~e~ay
t.. "' "'0 3~ .:;;-~~
!--0(7)(7]
0 (15) (15) _ _ S~u!_h Er~e~ay
t.. ~
WO
:E§ -;o-.:::!.9.
~ ~ ~
i, ~
~ ,, ?--
2 (Ol I 21 85 (O) (85)
Fenton Mill Development - York County, VA
2030 AM Build - Total Fenton Mill
[ l) ( O) l (24) ( 0) 24 i► (22) ( 0) 22
o(o) I 01 90 (OJ (90)
6(0) I 6)
V, 0 ~
""--Sss -v;-~.9.~
I
Figure
8

[ OJ( 0) 0 ~ [1110] (80) 1030 =+
( 415J ( 0) 415 t
X X
0 © X I X
:[ "TI C V,
~ ::, ,;;;· ~- §. S; z "" (1) ::, ;::;· 0
"' !!!. (1) 0, 0 ;::;· C. !: ., (1)
?: a: C. C. ,. ?: (1)
~ .,
vl < (1) (1)
~ vl ~ (1) a· 0, ~ ::, ~ a· ~
::,
"' AW ~.!=.
~ s~ "' J> ~
"'"' ++
x m "' 0
"'
:= 741 (47) l788J f" 29 (78) [107J
t i r ., ::, (1) ., "" (1)
!"
"' g ::r
3 .,. m C
!a'
1- 15 ( 7) l22J 48 (38) [86]
tr+ "' 0 00 J> 00
:§£ -;:;-~~
j;'j:;'"j3' ~~~
L 35 ( 291 I 64] ~ ~ ~ j_ 10 ( o) I 101 ,._151 (125) 1276] "' ~ "' 135 (135) [270]
~ f 8( O)I 8]
153 (0) ll53J .. O(O)I OJ
"' 00
x :;; "' 0
"' ~ ,,
Barlow Rd .
1134) ( 0) 134 _j 4 [292J ( 0) 292 =r I +][+ [500J [230) 270 :: ~ ~ [230] [230) 0 : ~ o
1114] [100) 14 t f ~ ~ ~ • ~ g
~.9S g :E
v,-::::; ~~
"'" ~~ w WO
++
en-;;:; .!::.~ WN ~~
"' " 0
++
~S.!::, -:;;~.9 "'
~~~ ~ , ~ £ ~· I ~. ii ~
~
1-0 (15) [15]
0 (35) l35J
__ N:!_rt! ~i';_e'!_OY
t.. !~ ~~ 'ojj:; 2?..!::.
o ( 4) I 4J
1-a (101 110J
South Driveway -------
.:c .i 2 (Ol I 21
39 (0) 139)
l52J (12) 40 .f. l77J ( 0) 77
Newman Rd . 4 I 21 [O) 2 +~
197](0)97 • I 64J [O) 64
~ 0 ,. "' fl-
3 IOI I 3J 35 (0) l35J
7 (o) I 7J
I
Figu re Fenton Mill Development -York County, VA
2030 PM Build - Tota l Fenton Mill 9

~ (583] (24) 559 =+ [467J ( 0) 467 t
" " x ~ x ~ .,,
s C:
z ;;; 0 :z,
"' 0 !:. ., a: C.
:E vi ., ,. < .!!.
°' !:. ~
0 © C :, !<?.
"" :,
~ <1) C.
~ <1) .. <1)
::I o· :,
.... ....
V> cjq" :, !!!. ;::;· <1) C.
~ <1) .. <1)
::I o· :,
0 "'
!= 702 ( 71) (773] f 143 (118) (261]
t ( ... ., :, <1) ., "" <1)
t 7 (11) I 181 ~ ♦ 112 (61)1173J
....
.... "' -., "' :§:§ .... .... "' .::::L~
ftletSIIJ CONSULTING
co~~~.:::! coo L 561 47) 1103J -;;; -;:: -
EE£ :§:§:§ 0(0)[ OJ
39 (189) [528J "' ;.: .J_ 5 ( O) I SJ ._ 293 (204) (497J f 4( 0)( 4J
........ 0 4 96(0) [96)
302 (O) (302) 4--4 6
(O) I 6
J ~ 0(0)[ OJ T
~ :;; "' 0
"' ~ ,:,
Barlow Rd .
I 481( o) 48 J' [156J (68) 88 ;;;:: I 38J (29) 9 t
~~ "' .:::::!~
"' -., 0
~
~; -;;;-.::::L::: w 00
f►
(16) (4J 12 .f. [27J (O) 27
~ 0(25) [25J
0 (57) [57J North Driveway -------
t-. w .... 0
3~ ;.;-~~
o ( 7) I 7)
!-0 (15) [lSJ South Driveway -------
t-.
.... 0 ~-:Es -;::-~.9
~
"' :,
s :,
~ :z, ,,..
2 (O)I 2) 90 (O) [90J
Fenton Mill Development -York County, VA
2036 AM Build - Total Fenton Mill
I 11(0) 1 [26J (0) 26 ~ [23J (O) 23 "' "' 0 ....
:§§:§ 'vi' ............ ~.3~
~ 0 f :z, ,,..
I
Figure
10

I OJ( O) o ~ [ll 75J (80) 1095
I 441J I O) 441 +
l: X X
0 © X
V> X .,, C s a: ... 'a ... :,
z !!!. 0 "' :, ,.·
"' !!!. "' "' 0 ;.· a. != . .,
"' ~ C: a. a.
vi l: ~ "' .,
vl rl < "' "' ~ vl ::. oi "' a· ::. :, != a· ~ :,
:= 789 (47) [836J f 30 (78) [108J
t .;-:,
"' ., "" "'
[759J (0) 759
(
16 ( 7) [23J 51 (38) {89J
CONSULTING
{143J I o) 143 j ~ {517J (230J 287 ::
~ {llSJ (100) 15 1
t :E "' 0 =l:
~ ,,
~~ ;:;-::; ~~ u, V, 0
~
~~ w;:::; ~~ N "'0
~
:::;.!:::.!::: .;~ ,g N
.J_ 11 I O) I llJ
._ 144 (135) {279J
f 81 o) I 8J
}- 0 (15) {15J
0 (35) {35J
__ N:!.rt! f;.ri'!_e~a y
!: "'0
.... ~~ A';:' £.!:::
}-o I 4) I 4J
0 (10) {lOJ
__ S~u!_h Er~e~ay
t.. ,. ,. 0
.... !::!.9 .;;-~£
~ ~ :,
s :,
~ "' ?-
Barlow Rd. .:c .t
2 IO) I 2J 41 (0) {41{
{54] (12) 42 _t. {82] I o) 82
163 (0) {163J
4.- 0(0) { OJ
Newman Rd . I 2J (Ol 2 {103J (0) 103 ~ I 68J 10) 68
Fenton Mill Development -York County, VA
2036 PM Build - Total Fenton Mill
4 IO) I 4J 37 (0) {37J
7 {O) I 7J
~~~ :§_g_g '.ii: ....... .-... ~~~
I
Figure
11

-:::;-: ~£~ sss " " w ... 0""
{550) (O) 550 :1: {439) (0) 439 t
:= 731 (O) (731) f 252 (O) {252)
cow£~.:::!.
100 (0) {100) 8 ~ 8 j__ 4 ( O) I 4] 508 (0) {508] ~ t;; " .__ 479 ( O) {479)
~ f 3 (127) I 130]
I 45) (o) 45 J' {151] (0) 151 ::: I 38] (OI 38 t
-:::;--.:::!.~£ ":;::j--"' 0 0 -;: -;: "c; O ( O) I OJ
282 (127) {409] ...I-. 4 90 (13) {103] .. O( O){ OJ ' ♦ " 6( O){ 6]
{66)(65) 1 4 {35) (11) 24 ~ u,
{22] ( 0) 22 w o .., :§§§ 'u,--~£~
{495) {O) 495
X X
x ~ X ~
""n
"' :,
0 ::,
~ ~ :,-0 g, 0, !:. .§;
""n
s C: ;;; "' 0 ., a. :;; .,
-<
0 ®
C \!l ~ "" .;;;· ::,
!!!. :, ;:; · !!!. "' ;:;· a. "' ~ a.
~ "' ul "' "' ul :::i "' a· :::i :, a· :,
... 0 ... ~£ :§§ ... 0 ... WO
t ( :;;-::,
"' ., "" "'
t 18 (O) I 18] ~ r- 167 (0) {167]
Pll8ISIII CONSULTING
t :. "' 0 :l,
~ °!'
Barlow Rd .
--;:; w " ~~ --;:;
u, .9.t:! !- 25 (130) {155] w .., .., ..,
~ 57 ( 86) {143)
_ _ N~rt~ ~i!'.'..e~ay
t.. w "' ,. ...
0 0!:! ... WO "'~
... " ~.:::!.
~s !- 7(0) I 7J "" u, "
~ 15 (0) {15] __ S~u.!_h _Er~e!'ay
t.. ~~ ... ~_g --... ... !££
~
~ s :,
~ ,, a.
+-4 ~ 2 (101) {103) 85 ( o) I 85]
{15] (0) 15 _f. {25] (0) 25
Fenton Mill Development - York County, VA
2030 AM Build - Fenton Mill Plus School
I
Figure
12

[ 0)(0) 0 ~ [1110] (0) 1110 =+ I 415) (O) 415 l,
X X
0® X X
X \!l ~ .,, C
s a "" C: ::, .,,
;;; OQ. !!!.
<1) ::, ;:;· ::, ,, !!!. <1)
0 0 ~- a. ::, .,
~ ~
a. a. l: ~
<1) ., ;;:
~ -< <1) <1) ;;: ~
:::r <1) a· 0 ~ ::, g a· ro
::,
£ .§;
'"-J>..., ~.t:. :§:§
"' ,,. ..., "' ....
++
:= 788 (0) (788]
f 107 (0) (107)
t ( .;-::, <1) ., "" <1)
!" ,. g :,-
3 CT
m C
!a'
1- 22 (O) [22]
86 (0) [86]
t~ ~~
~~ 0 ., ~~
'.l: :, "' 0 =1'
~ "!"
Barlow Rd .
~';:'-;::' ~.:::::!~ :§§£ J> .... .... "' .... "'
(134) (0) 134 _j [500) (0) 500 ;;;:: (114] (0) 114 l,
--;:;-"'0 ~~ -.;; £~ "'-.J ., "'
++
00 N .::::L~
'"-.!!!£
"'"' "'"' ++
:::;,::; £.:::::!
"' E~ -.J 0"'
+4 (52) (0) 52 .f. (77) (0) 77
J_ 10 ( 0) [ 10] .._ 270 ( 0) [270)
f 8 ( 29) I 37)
1-15 (37) [52)
35 (25) [60)
_ _ N:;_rt~ fl:l":_e~ay
1- 4(0) I 41
10 (0) (10)
__ s2,u!._h E'f!e!'ay
t. 't:. 0
"' ..., g -.J -.Jg
.,, .. :, ;; :,
~ ,. ?-
2 (23) (25)
.1- 39 ( O) (39)
.... .:::! EE w .... o 3 (O)[ 3)
153 (29) (182)
.. 0(0)[ OJ
Newman Rd.
[ 21) (19) 2
(100) ( 3) 97
I 64) I o) 64
~ 4 35 (3) (38) ••• 7(0) [ 7)
I
Figure Fenton Mill Development -York County, VA
2030 PM Build - Fenton Mill Plus School 13

~
::: 773 (0) [773) f 261 (0) [261)
[583) (0) 583 =+ (467) (0) 467 l,
)( )(
)( )(
x ~
.,, ~ !; .,, .. ..
::,
"' 0 0 ::, .. ~
a. :E ..
1<i <
::,-0 _g,
°' !:. §;
0 ® V, C
~ ,;;;· ::, ,;;;· '!'. ::, ;::;·
'!'. .. ~- a.
~ a.
~ .. vl
~ .. >l .. o· >l ::, o·
::,
-;::;-........ ££ :§:§ .... .... .... 00
t ,--.. ::, .. .. ""
m
"' g
..
::r
3 CT
IB C
!;'
(
L 18(0) [ 18) ♦ 173 (0) [173]
CONSULTING
Barlow Rd .
oow~~.:::! -,::;-£~£ 00 .... V, ,. ....
I 48) (O) 48 J' [156] (0) 156 ;:;:: I 38) (OJ 38 l,
.... .... ~.::::!
jS 00 .... .... }►
[16) (0) 16 -1► [27) (0) 27
j__ 5(0) I SJ +- 497 ( 0) [497) f 4 (127) [131)
!- 1101 I 11
15 (0) [15)
__ s::u!..h E'!!e::iay
.t_ 2 (101) [103] 90 ( o) I 90)
Fenton Mill Development -York County, VA
2036 AM Build - Fenton Mill Plus School
'::;::J--.::::!.!=,£ "::::J--$.9£
[66] (65) 1 [37) (11) 26 i► [23) ( 0) 23
o ( O) I OJ 4 96 (13) [109) 6 ( oJ I 6I
V,
'" 0 ....
:§:§:§ 'vi' ............ ~£.!=.
I
Figure
14

608 (0) [608J
) OJ (O) O ~ [1175) (0) 1175 =+ I 441J (O) 441 1,
X X
X I X
0® X .,, C V, 2:S ,;;;· ~ ::l
C: !<!. ::l .,, ;;: "" !!!. .. ::l ;:.·
"" :,:, ~ .. 0 C. 0 .. ..
~ ::l C. C.
~ I:
"' .. .. ;;i -<
~ .. ~ ~ .. a· ::r ~ 0 ::l _g, a·
::l
C, '=· §;
j~ :§:§ N
i~
~
::: 836 (0) (836J ,f" 108 (0) [108)
t ( ,-.. ::l .. .. "" ..
!" ,, g :,-
3 C'
~ ~
}- 23 (0) [23J
89 (0) [89J
tr+ N ~"' "',. :§:§ N-~"' ~~
ftlerSml CONSULTING
U> 0 U>
:§
9;! :;: "' 0 =I:
~ "!>
Barlow Rd .
[143J (0) 143 J' [517J (O) 517 :! [115J (0) 115 1,
-';3' "'0 £..'£ -w £-=! ~~
~
OON ..'£~ N-~.9 7:::;:
~
"::JN .!:::.:::!
N .9~ -., N N
+1+ [54J (0) 54 -±. [82J (0) 82
♦ 11 ( o) I 11) ~ 279 ( 0) [279] f 8(29) I 37J
.-t.
}-15 {37) [52)
35 {25) [60)
North Driveway -------
}- 4 (o) I 4J
10 (0) [lOJ
__ S~u!_h Er~e~ay
t.. ~~ N U> .9 -., "'8
~ ,. :,
s :,
~ ,, fl-
.i_ 2 (23) [25) 41 ( 0) [41J
163 (29) [192J
.. 0( O)[ OJ
~
.:::.9 .9 4(0) I 4) ,. ~ 0 4 37 (3) [40J
~ 7(0)[ 7J
Newman Rd. +t. I 21J 119) 2
1106) I 3) 103 ~ ~ "' ., I 68J ( oJ 68 :§ :§ :§
~--..'£!:!!~
~ 0 ~ ,, fl-
I
Figure Fenton Mill Development -York County, VA
2036 PM Build - Fenton Mill Plus School 15

CONSULTING
6.2 · Capacity and Level of Service Analyses at Critical Points
Capacity analyses for the unsignalized intersections in the AM and PM peak hours were performed for the 2030 and 2036 Build conditions. Analyses were completed to determine the operating characteristics of the study area intersections and roadways using Synchro Professional 10. 0, which uses methodologies contained in the 2010 Highway Capacity Manual (HCM).
To compare operations among various scenarios (Existing, No Build and Build) detailed analyses are illustrated in Tables 7-15 in Chapter 6 to provide a side by side comparison for the following five (5) conditions:
■ 2020 Conditions ■ 2030 No Build Conditions
- (1.0% annual growth rate for 10 years) ■ 2030 Build - Fenton Mill Conditions
- (2030 No Build plus site traffic) ■ 2036 No Build Conditions
- (1.0% annual growth rate for 16 years) ■ 2036 Build - Fenton Mill Conditions
- (2036 No Build plus site traffic)
To determine the potential impacts generated by the school traffic, additional analyses were evaluated to include the following two (2) additional scenarios:
• 2030 Build - Fenton Mill plus school conditions - (2030 Build plus school traffic)
• 2036 Build Fenton Mill plus school conditions - (2036 Build plus school traffic)
20.09.25 Fenton Mill Development TIA 30
CONSULT I NG
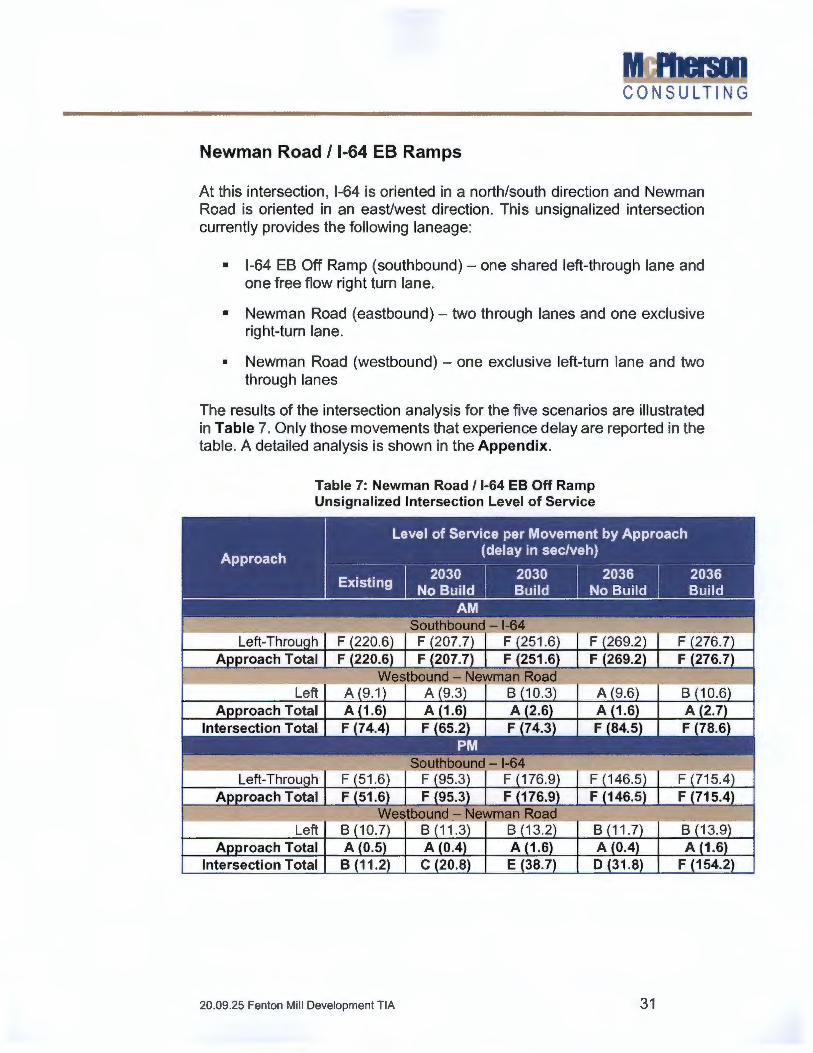
Newman Road/ 1-64 EB Ramps
At this intersection, 1-64 is oriented in a north/south direction and Newman Road is oriented in an east/west direction. This unsignalized intersection currently provides the following laneage:
■ 1-64 EB Off Ramp (southbound) - one shared left-through lane and one free flow right turn lane.
■ Newman Road (eastbound) - two through lanes and one exclusive right-turn lane.
■ Newman Road (westbound) - one exclusive left-turn lane and two through lanes
The resu lts of the intersection analysis for the five scenarios are illustrated in Table 7. Only those movements that experience delay are reported in the table. A detailed analysis is shown in the Appendix.
Approach
Table 7: Newman Road / 1-64 EB Off Ramp Unsignalized Intersection Level of Service
Level of Service per Movement by Approach (delay in sec/veh)
Existing 2030 2030 2036
No Build Build No Build 2036 Build
AM a I I I ■ I t .t - -
• •• • A . . F 276.7
Westbound - Newman Road Left
A roach Total
Southbo nd - I-F 51 .6 F 95.3 F
A F 51.6 F 95.3 -
Left B A roach Total
Inte rsect ion Total
20.09.25 Fenton Mil l Development TIA 31

CONSULTING
This unsignalized intersection operates at a LOS F under existing AM conditions and a LOS B during the PM peak, with no delay along Newman Road . While the southbound approach operates at a LOS Funder both AM and PM peak conditions. This delay is attributed to a very low left turning side street volume, with 21 and 26 during the AM and PM peaks, respectively. However, as the traffic volume increases under the future scenarios, Fenton Mill will add 15 and 51 vehicles, during the AM and PM peaks respectively, to the southbound approach under full build out results in longer delays. Under the future build conditions, with the 1 % growth rate applied along Newman Road, there are fewer gaps along the mainline resulting in even higher delays. Given the poor operational conditions at this location, the intersection was evaluated for a proposed traffic signal as outlined below.
Traffic Signal Warrant Analysis
The analysis evaluated the proposed build out conditions using the warrant analysis as outlined in the Manual on Uniform Traffic Control Devices (MUTCD) for the following three warrants:
• Warrant 1, Eight-Hour Vehicular Volume
• Warrant 2, Four-Hour Vehicular Volume
• Warrant 3, Peak Hour
To project daily build out conditions for this intersection, actual AM and PM peak period hourly volumes were used in conjunction with estimated daily distribution patterns obtained from Newman Road ADTs and ITE hourly distribution patterns for entering and existing vehicles. This methodology was used to estimate hourly volumes between 6:00 AM - 10:00 PM along the 1-64 EB off ramp and actual ADTs were use along Newman Road.
Based on the assumed travel patterns and under full build out conditions. A traffic signal is not warranted . Detailed results of these analyses are contained in the Appendix.
While a traffic signal is not warranted , it is recommended that the existing right-turn lane be extended 250'. The will allow the heavy right turn movement access to the free flow turn lane even during the PM peak when the left-turns are queued.
20 .09.25 Fenton Mill Development TIA 32

CONSULTING
Newman Road/ 1-64 WB Off Ramp
This intersection was included in the study area to capture traffic generated to/from 1-64 as well as evaluate access management requirements. However, given the intersection configuration, which allows for on/off ramp movement only, intersection analysis was not performed at this location .
Newman Road/ Fenton Mill Road
At this intersection, Fenton Mill Road is oriented in a north/south direction and Newman Road is oriented in an east/west direction. This unsignalized intersection currently provides the following laneage:
■ Fenton Mill Road (northbound) - one shared left-through-right turn lane.
■ Fenton Mill Road (southbound) - one shared left-through-right turn lane.
■ Newman Road (eastbound) - one exclusive left-turn lane, two through lanes, and one exclusive right-turn lane.
■ Newman Road (westbound) - one exclusive left-turn lane, two through lanes, and one exclusive right-turn lane.
The results of the intersection analysis for the five scenarios are illustrated in Table 8. Detailed analyses are provided in the Appendix.
20 .09.25 Fenton Mill Development TIA 33

Table 8: Newman Road / Fenton Mill Road Unsignalized Intersection Level of Service
B 14.1 B 14.1
B 11 .2 B B 11.2 B
Eastbound - Newman Road Left A 8.1 A 8.0 A 8.7 A 8.1 A 8.8
A roach Total A 3.1 A 2.7 A 1.7 A 2.7 A 1.8 Westbound - Newman Road
Left A roach Total
C 16.0 C 16.2 C 16.0 C 16.2
Southbound - Fenton Mill Road B 12.8 B 12.6 C 18.4 B 13.0 C B 12.8 B 12.6 C 18.4 B 13.0 C Eastbound - Newman Road
Left A 7.8 A 7.8 A 8.3 A 7.9 A 8.4 A roach Total A 2.5 A 2.5 A 1.5 A 2.5 A 1.5
Westbound - Newman Road Left A 7.8 A 7.9 A 9.0 A 7.9 A 9.0
A roach Total A 0.5 A 0.4 A 0.2 A 0.4 A 0.2 Intersection Total A 4.0 A 3.8 A 3.7 A 3.9 A 4.2
This unsignalized intersection operates at a level of service (LOS) A during all scenarios for the Fenton Mill Development. The northbound movement, during the PM 2030 Build and PM 2036 Build , operates at a LOS D and E respectively. This development only adds 32 trips and 19 trips during the AM and PM peak periods adding approximately 22 seconds of delay. Nevertheless, the overall intersection still operates at acceptable levels of service.
20.09.25 Fenton Mi ll Development TIA 34
CONSULTING
Newman Road / Barlow Road
At this intersection, Newman Road is oriented in an east/west direction and Barlow Road and Barnstaple Way are oriented in a north/south direction. This unsignalized intersection currently provides the following laneage:
■ Barlow Road (northbound) - one shared left-through-right turn lane.
• Barnstaple Way (southbound) - one shared left-through-right turn lane.
• Newman Road (eastbound)- one shared left-through-right turn lane.
• Newman Road (westbound) - one shared left-through-right turn lane.
The results of the intersection analysis for the five scenarios are illustrated in Table 9. A detailed analysis is shown in the Appendix.
20.09.25 Fenton Mill Development TIA 35

CONSULTING
Table 9: Newman Road / Barlow Road Unsignalized Intersection Level of Service
A 9.6 A 9.4 A 9.6 A 9.4 Eastbound - Newman Road A 0.4 A 0.1 A 0.1 A 0.4 A 0.1 A 0.1
A 9.3 A 8.9 A 9.0 A 8.9 A 9.3 A 8.9 A 9.0 A 8.9 Eastbound - Newman Road A 0.3 A 0. 1 A 0.1 A 0.1 A 0.1 A 0.3 A 0.1 A 0.1 A 0.1 A 0.1
W stb und- e an R d A 1.0 A 1.2 A 1.2 A 1.1 A 1.0 A 1.2 A 1.1
Intersection Total A 3. A 2.6 A 2.7
This unsignalized intersection operates at an overall LOS A for all scenarios during the AM and PM peak periods.
20.09.25 Fenton Mill Development TIA 36

CONSULT I NG
Barlow Road/ Fenton Mill Road
At this intersection, Barlow Road is oriented in a north/south direction and Fenton Mill Road is oriented in an east/west direction. This unsignalized Tintersection currently provides the following laneage:
■ Barlow Road (northbound) - one shared left-through lane.
■ Barlow Road (southbound) - one shared through-right turn lane.
■ Fenton Mill Road (eastbound) - one shared left-right lane.
The results of the intersection analysis for the five scenarios are illustrated in Table 10. A detailed analysis is shown in the Appendix.
Table 10: Barlow Road/ Fenton Mill Road Unsignalized Intersection Level of Service
Approach
A
A
A Intersection Total
Level of Service per Movement by Approach dela in sec/veh
2030 2030 2036 2036 ExiSting No Build Build No Build Build
AM Northbound - Barlow Road A 3.2 A 2.3 A 2.9 A 2.8 A 3.2 A 2.3 2.2 A 2.8 Southbound - Bario A 0.0 A 0.0 A 0.0 A 0.0 A 0.0 A 0.0 A 0.0 A 0.0
Northbound - Barlow Road A 2.8 A 2.6 A 3.1 A 2.7 A 3.1 A 2.8 A 2.6 A 3.1 A 2.7 A 3.1 Southbound - Barlow Road A 0.0 A 0.0 A 0.0 A 0.0 A 0.0 A 0.0 A 0.0 A 0.0 A 0.0 A 0.0
Eastbound - Fenton Mill Road A 8.9 A 8.8 A 8.9 A 8.8 A 8.9 A 8.9 A 8.8 A 8.9 A 8.8 A 8.9 A 3.2 A 3.0 A 4.3 A 3.0 A 4.3
This unsignalized intersection operates at an overall LOS A for all scenarios and all approaches during the AM and PM peak periods.
20 .09.25 Fenton Mill Development TIA 37

CONSULT I NG
Barlow Road / E. Rochambeau Drive
At this intersection, E. Rochambeau Drive is oriented in a north/south direction and Barlow Road is oriented in an east/west direction. This unsignalized T- intersection currently provides the following laneage:
■ E. Rochambeau Drive (northbound) - one through lane and one exclusive right-turn lane.
■ E. Rochambeau Drive (southbound) - one shared left-through lane.
■ Barlow Road (westbound) - one shared left-right turn lane.
The results of the intersection analysis for the five scenarios are illustrated in Table 11 . A detailed analysis is shown in the Appendix.
Table 11: Barlow Road / E. Rochambeau Drive Unsignalized Intersection Level of Service
Westbound - Barlow Drive
1.1 1.1
This unsignalized intersection operates at an overall LOS A for all scenarios during the AM and PM peak periods.
20 .09.25 Fenton Mill Development TIA 38

CONSULTING
Newman Road / Primary Site Entrance
This intersection will serve as the primary site entrance, with the entrance oriented in a north direction and Newman Road oriented in an east/west direction with the following laneage:
■ Primary Site Entrance (northbound) - one exclusive left turn lane and one exclusive right turn lane.
■ Newman Road ( eastbound) - one through lane and one exclusive right-turn lane.
■ Newman Road (westbound) - one shared left-through lane.
Since this intersection does not currently exists only the build scenarios are reported. The results of the proposed unsignalized operations for the two future scenarios are illustrated in Table 12. A detailed analysis is shown in the Appendix.
Table 12: Newman Road/ Primary Site Entrance Unsignalized Intersection Level of Service
Level of Service per Movement by Approach A roach dela in sec/veh
2036 Build AM PM
Northbound - Primarv Site Entrance Left C (15.2) C (15.8) 8 (14.6) C (15.2)
RiQht A (0.0) A (0.0) A (0.0) A (0.0)
Aooroach Total C (15.2) C (15.8) B (14.6) C (15.2) Westbound - Newman Road
Throuqh-Riqht A (0.0) A (0.0) A (0.0) A (0.0)
Approach Total A (0.0) A (0.0) A (0.0) A (0.0)
Intersection Total A (4.8) A (4.8) A (2.2) A (2.4)
This unsignalized intersection operates at an overall LOS A during the AM and PM peak periods, with all movements operating at a LOS C or better.
20.09.25 Fenton Mill Development TIA 39

CONSULTING
Fenton Mill Road / North Site Entrance
At this intersection, Fenton Mill Road is oriented in a north/south direction and the North Site entrance is oriented in an east/west direction. This unsignalized intersection will be constructed with the following laneage:
• Fenton Mill Road (northbound) - one shared through-right turn lane.
• Fenton Mill Road (southbound) - one shared left-through lane.
• North Site Entrance (westbound) - one share left-right turn lane.
Since this intersection does not currently exists only the build scenarios are reported. The results of the unsignalized intersection analysis for the four scenarios are illustrated in Table 13. A detailed analysis is shown in the Appendix.
Table 13: Fenton Mill Road/ North Site Entrance . . .. • . . . Approach
Intersection Total
Level of Service per Movement by Approach dela in sec/veh
2030 2036 2030 2036 Build Build Build Build
AM PM Southbound - Fenton Mill Road A (3.1) A (2.9) A(4.4) A (4.3) A (3.1) A (2.9) A (4.4) A (4.3)
Westbound - North Site Entrance A (9.5) A (9.5) B (10.3) B(10.3) A (9.5) A (9.5) B (10.3) B{10.3) A (5.3) A (5.2) A (4.7) A (4.6)
This unsignalized intersection operates at an overall LOS A during all scenarios during both the AM and PM peak periods.
20.09.25 Fenton Mill Development TIA 40

Fenton Mill Road/ South Site Entrance
At this intersection, Fenton Mill Road is oriented in a north/south direction and the South Site entrance is oriented in an east/west direction. This unsignalized intersection will be constructed with the following laneage:
■ Fenton Mill Road (northbound) - one shared through-right turn lane.
■ Fenton Mill Road (southbound)- one shared left-through lane.
■ South Site Entrance (westbound) - one share left-right turn lane.
Since this intersection does not currently exists only the build scenarios are reported. The resu lts of the unsignalized intersection analysis for the four scenarios are illustrated in Table 14 A detailed analysis is shown in the Appendix.
Table 14: Fenton Mill Road/ South Site Entrance
Southbound - Fenton Mill Road h A (0.6) A (0.6) A (2 .2) A (2.1)
A A (0.6) A (0.6) A (2.2) A (2.1) Westbound - South Site Entrance
Left-Ri ht A (9.1) A (9.1) A (9.3) A (9.4) A (9.4)
Intersection Total A (1 .9) A (1.9) A (2.1) A (2.0)
This unsignalized intersection operates at an overall LOS A during all scenarios during both the AM and PM peak periods.
20.09.25 Fenton Mill Development TIA 41

6.3 School Impacts
Additional analysis was conducted to include future school generated traffic volumes that would impact the study area intersections. These trip assignments are depicted in Figure 7 and only impact three (3) study area intersections along with the three (3) site driveways. The North Site driveway is anticipated to serve as the entrance to the county parcel if it is development as an elementary school
Table 15 illustrates the overall LOS for the AM and PM peak periods for the impacted intersections for the two future build scenarios. Figures 12-15 reflect the full Fenton Mill development volumes in addition to the school traffic. Detailed LOS tables for the intersections for all scenarios are provided in the Appendix.
Table 15: School Impacted Intersections Overall Level of Service
2030 Build Plus School Newman Road and Fenton Mill Road B (11.9) Newman Road and Primary Site Driveway A (5.7) Newman Road and Barlow Road A (5.6) Fenton Mill and Barlow Road A (5.2)
Fenton Mill and North Site Entrance B (10.6)
Fenton Mill and South Site Entrance A (0.9) 2036 Build Plus School
Newman Road and Fenton Mill Road B (13.8) Newman Road and Primary Site Driveway A (6.0) Newman Road and Barlow Road A (5.6)
Fenton Mill and Barlow Road A (5.2) Fenton Mill and North Site Entrance B (10.6)
Fenton Mill and South Site Entrance A (0.7)
A (5.1)
A (2.5) A (3.4)
A (4.6) A (6.0) A (1 .6)
A (6.1)
A (2.5) A (3.4)
A (4.6) A (6.2) A (1 .5)
The study area intersections that were impacted by the school traffic illustrate an overall LOS A for the AM and PM peak period for both the 2030 and 2036 Build scenarios with the school traffic. The Newman Road I Fenton Mill Road and Fenton Mill Road / North Site entrance intersections operate at an LOS B during the 2030 and 2036 AM peak period. As noted above this intersection is anticipated to be the primary entrance to the proposed school.
20.09.25 Fenton Mi ll Development TIA 42

CONSULTING
6.4 Queuing Analysis
To evaluate the impacts of the Fenton Mill development, beyond just level of service, a queuing analysis was performed using Synchro Professional 10, which uses methodologies contained in the 2000 Highway Capacity Manual (HCM) [TRB Special Report 209, 2000], to determine maximum queue lengths. The primary focus of this analysis focused on the turning movements throughout the study area as well as 1-64 off ramps.
The 1-64 EB off ramp onto Newman Road reflected a queuing issue correlating with the additional traffic from the Fenton Mill development and the existing right turn storage length. The queue from the left turning vehicles would queue back far enough to block the right turning vehicles from getting access to turn onto Newman Road. Lengthening the right turn storage length to approximately 550' will allow enough roadway for the right turns to still access the turn lane even with the queue length of the left turning vehicles.
Detailed queuing analyses are in the Appendix.
20 .09.25 Fenton Mill Development TIA 43

CONSULTING
7 Conclusions and Recommended Improvements
The traffic study area includes roadways and intersections in the immediate vicinity of the proposed Fenton Mill development. As currently proposed, the development will significantly increase the volume of traffic on roadways and at intersections throughout the study area. The following recommendations will provide acceptable levels of service for the study area intersections.
7.1 Proposed Improvements
Newman Road/ l-64 EB Ramps
■ Extend the southbound off ramp right-turn lane by 250'.
Newman Road / l-64 WB Ramps
■ No additional improvements needed / maintain existing laneage.
Newman Road/ Fenton Mill Road
■ No additional improvements needed / maintain existing laneage.
Newman Road/ Primary Site Entrance
■ Construct the northbound approach to include an exclusive left-turn lane and an exclusive right-turn lane.
■ Construct an eastbound right-turn lane.
Newman Road / Barlow Road
• No additional improvements needed / maintain existing laneage.
Barlow Road/ Fenton Mill Road
■ No additional improvements needed / maintain existing laneage.
Barlow Road / E. Rochambeau Drive ■ No additional improvements needed / maintain existing laneage.
Fenton Mill Road/ North Site Entrance ■ Construct the westbound approach to include one inbound and one
outbound lane.
Fenton Mill Road / South Site Entrance ■ Construct the westbound approach to include one inbound and one
outbound lane.
20.09.25 Fenton Mill Development TIA 44

CONSULTING
County Site
The Fenton Mill developer will dedicate a 16.5-acre site along Fenton Mill Road to the County. For the purposed of this study, the site was analyzed as a school to reflect a conservative approach with higher traffic volumes as opposed to a public park or recreational use. The county currently does not have specific plans for this parcel to be a school , however, if a school is construction the following improvements should be considered
Fenton Mill Road / North Site Entrance (by others)
Construct an exclusive Northbound right-turn lane along Fenton Mill Road to include 100' of storage and 200' of taper.
20 .09.25 Fenton Mill Development TIA 45