Female Brain Drains and Women’s Rights Gaps: An Empirical...
43
Female Brain Drains and Women’s Rights Gaps 1 Female Brain Drains and Women’s Rights Gaps: An Empirical Analysis of Bilateral Migration Flows † Maryam Naghsh Nejad Institute for the study of labor (IZA) Schaumburg-Lippe-Strasse 5-9 53113 Bonn Germanyph: +49 228 3894-512 em: [email protected] Andrew T. Young College of Business and Economics West Virginia University Morgantown, WV 26506-6025 ph: +1 304 293 4526 em: [email protected] JEL Codes: F22, J11, J61, J16, O17, O43 Keywords: female brain drain, high skilled female migration, bilateral migration flows, women’s rights, institutional quality, gravity models † The authors wish to thank Dr. Frédéric Docquier for providing us with the education and gender specific bilateral migration data. Also, we are thankful to helpful comments from discussants and participants of SEA, WEAI, and SRSA meetings in 2012.
Transcript of Female Brain Drains and Women’s Rights Gaps: An Empirical...

Female Brain Drains and Women’s Rights Gaps 1
Female Brain Drains and Women’s Rights Gaps:
An Empirical Analysis of Bilateral Migration Flows†
Maryam Naghsh Nejad
Institute for the study of labor (IZA)
Schaumburg-Lippe-Strasse 5-9
53113 Bonn
Germanyph: +49 228 3894-512
Andrew T. Young
College of Business and Economics
West Virginia University
Morgantown, WV 26506-6025
ph: +1 304 293 4526
JEL Codes: F22, J11, J61, J16, O17, O43
Keywords: female brain drain, high skilled female migration, bilateral migration flows,
women’s rights, institutional quality, gravity models
† The authors wish to thank Dr. Frédéric Docquier for providing us with the education and gender specific bilateral
migration data. Also, we are thankful to helpful comments from discussants and participants of SEA, WEAI, and
SRSA meetings in 2012.

Female Brain Drains and Women’s Rights Gaps 2
Female Brain Drains and Women’s Rights Gaps:
A Gravity Model Analysis of Bilateral Migration Flows
Abstract: We explore women’s rights as a determinant of the female brain drain rate relative to
that of men (the female brain drain ratio). We develop a model of migration where both
women’s expected costs and benefits of migration are a function of women’s rights in the origin
country relative to those of the destination (the women’s rights gap). Since both costs and
benefits are a function of the women’s rights gap, the relationship between changes in that gap
on the female brain drain ratio is nonlinear. In particular, starting from low levels of the rights
gap, increases in the relative level of rights in the origin country can be associated with increases
in the female brain drain ratio. However, starting from higher levels of the gap the relationship
turns positive. Using a panel of over 5,000 bilateral migration flows across OECD and non-
OECD countries and the women’s rights indices from the CIRI Human Rights Dataset, we report
evidence consistent with the theory. A statistically significant and nonlinear relationship exists
between women’s rights gaps and female brain drain ratios. The evidence is particularly strong
for the case of women’s political rights.
JEL Codes: F22, J11, J61, J16, O17, O43
Keywords: female brain drain, high-skilled female migration, bilateral migration flows,
women’s rights, institutional quality, gravity models

Female Brain Drains and Women’s Rights Gaps 3
1. Introduction
Female migration rates are higher than those of males in 88 percent of non-OECD
countries. This relative tendency of females to migrate is most pronounced for high-skilled
individuals. The migration rates of females with post-secondary education are on average 17
percent higher than those of males (Docquier, Lowell, and Marfouk, 2009). Furthermore, the
migration rate of the high-skilled, or brain drain, is relatively greater for females on each of the
inhabited continents.1 (See figure 1).
What explains the relatively high rates of female brain drain in developing countries?
Answering this question is of clear interest to students of development and policy-makers.
Human capital losses are costly, but female brain drain may be particularly so. Higher
educational attainment by females is associated with reduced fertility and infant mortality; also
improved health and increased educational attainment for their children (Schultz (1988),
Behrman and Deolalikar (1988), and Subbarao and Raney (1995)). Abu-Ghaida and Klasen
(2004) estimate that these lost “social gains” from gender inequality in education amount to
between 0.1 and 0.3 points in annual per capita income growth.2
In this paper we explore one potential determinant of the rates of female brain drain
relative to those of males: women’s rights. In many developing countries, not only do women
suffer from a lack of political rights and protections from violence. They also lack basic
economic rights to productive resources:
Few farming women in developing countries have title and control of land in
their own names. In many areas of sub-Saharan Africa, widows lack even basic
1 The data on continents here comes from Mayer and Zignago (2006). Asia, Africa, America, Europe and Pacific
are the five possible continents associated with each country. Pacific refers to Australia and Pacific island countries. 2 Knowles, Lorgelly, and Owen (2002) estimate a neoclassical growth model that explicitly includes both female
and male human capital. Using cross-country data they find that increases in female education positively affect labor
productivity while the effect of male education is often statistically insignificant or even negative.

Female Brain Drains and Women’s Rights Gaps 4
rights to inherit marital property [.] In south Asia, women have gained greater
legal inheritance rights over time, but inequitable restrictions continue to keep
women at a disadvantage, and women's property rights in practice are much
less than in the legal code[.] Women may also have less access [to] productive
assets such as labor-saving technologies, credit, and extension services
(Mammen and Paxson, 2000, p. 161).
Increases in women’s rights can decrease both the costs and benefits to migration.
Women’s rights may, therefore, have non-linear effects on the relative rate of female brain drain
in a country. For example, greater protection from physical coercion decreases the riskiness of
trying to migrate but, at the same time, it creates an environment that an individual has less
reason to flee.
Our work complements that of Naghsh Nejad (2012). She examines the relationship
between ratios of female-to-male brain drain rates (female brain drain ratios) and the women's
rights index values from the Cingranelli and Richards (2010) (CIRI) Human Rights Dataset.
Using a panel of up to 195 countries, Naghsh Nejad estimates a non-linear relationship between
the female brain drain ratio and women’s rights. Starting from very low levels of women’s
rights, increases are associated with increases in the female brain drain ratio; however, at higher
levels of women’s rights the marginal effect becomes negative.
One limitation of Naghsh Nejad (2012) is that women’s rights in an origin country are
not explicitly placed in a relative context. That paper focuses only on migration flows from non-
OECD countries to OECD countries. An implicit assumption in the analysis is that each OECD
country provides a full set of women’s rights. If this is true, then the CIRI index values of non-
OECD countries can be considered as measures of women’s rights in the origin country relative

Female Brain Drains and Women’s Rights Gaps 5
to those of the destination country. While this may not be an implausible approximation, we
employ a gravity model framework to analyze bilateral migration rates of the high-skilled
(Docquier et al., 2009). Female-to-male brain drain ratios are then related to the gap between
(i.e., the ratio of) women’s rights in the origin and destination countries. This allows us to exploit
information in the women’s rights differentials across OECD countries; also the differentials
involved with migration between non-OECD countries.
A simple plot of non-OECD female-to-male brain drain ratios against CIRI women’s
rights index values in figure 2 suggests a “hump-shaped” relationship. Based on bilateral
migration rates and the gravity model framework, we also estimate a statistically significant non-
linear relationship between women’s rights gaps and the migration of high-skilled females
(relative to males) from origin to destination countries. In addition to the ordinary least squares
(OLS) results, we report that the relationship is robust to employing a Heckman (1970) two-stage
regression approach or the Poisson pseudo-maximum likelihood estimation suggested by Silva
and Tenreyro (2006). (Both approaches are utilized to deal with bilateral migration observations
with a value of zero or ratios of flows that are undefined.)
This organization of this paper is as follows. Section 2 contains a review of literature
relevant to the present research. A theoretical model of migration choice is developed in section
3. This theory motivates the empirical model described in section 4; this section also overviews
the data used to estimate that model. Estimation results are reported in section 5. Summary
discussion appears in the concluding section 6.
2. Previous Work on Female Brain Drain
Brain drain is a widely explored topic in the context of development economics. (See

Female Brain Drains and Women’s Rights Gaps 6
Docquier and Rapoport (2012) for a review of the literature.) However, the gender aspect of
brain drain has received relatively little attention; and that only recently.
Dumont, Martin and Spievogel (2007) are the first researchers to provide data on gender-
specific brain drain using OECD census databases for emigrants from 25 OECD and 79 non-
OECD countries. They report that female brain drain rates from African countries tend to be
notably higher than those of males. Alternatively, there is almost no brain drain gender gap when
considering European origin countries. They also estimate the impact of female brain drain on
the social and economic development of origin countries. They find that female brain drain ratios
are positively and significantly related to infant mortality and under-five mortality; negatively
and significantly related to female secondary school enrollment relative to males. They do not
find similar harmful effects associated with the emigration of less-educated women. This
suggests an important role for educated women in the health and education of children.
Docquier et al. (2009) provide a more extensive dataset for education- and gender-
specific migration from 174 origin countries in 1990 and from 195 countries in 2000. Using this
data, Docquier, Marfouk, Salomone, and Sekkat (2012) find that women respond differently than
men to conventional “push” factors. For example, while male brain drain is negatively associated
with an origin country’s average human capital level, all else equal, the analogous relationship is
positive in the case of women. Also, the distance from an origin country to the OECD area is
negatively associated with male brain drain but positively associated with high-skilled female
emigration. Relevant to the present research, Docquier et al. (2012) suggest that both of these
anomalies may be related to gender discrimination.
Everything being equal, females would tend to migrate more because even
with a college degree they may have difficulties to find an adequate job. The
Female Brain Drains and Women’s Rights Gaps 7
hidden discrimination would lead to some kind of positive selection that
characterizes female migration. [Also] the positive sign of the coefficient of
the distance to the OECD may reflect, especially for migrants originating from
the South, the relatively lower discrimination in furthest OECD countries as
compared to closer ones (p. 261).
This suggests the importance of taking into account differentials in women’s rights
between origin and destination countries. It also suggests that controlling for variation in
women’s rights across destination OECD countries may be important.
Other than Naghsh Nejad (2012), we are aware of only two studies that explore the role
of gender discrimination in the determination of female brain drain ratios. First, Bang and Mitra
(2011) attempt to proxy, separately, for “access to economic opportunities” and “economic
outcomes”. Based on Docquier et al.’s (2009) data on emigration rates to the OECD they find
that only “opportunities” are related to female brain drain and the estimated relationship is a
negative one. However, their “opportunity” variables include fertility rates and gender gaps in
schooling and literacy. These variables might just as easily be interpreted as “outcomes”. In the
present paper we utilize the CIRI women’s rights indices. These indices are directly based on the
economic rights (e.g., the right to work without a husband’s consent), political rights (e.g., the
right to vote), and social rights (e.g., the right to initiate a divorce) that women have in a given
country. These rights are institutional and more clearly interpreted in terms of opportunities open
to women. Also, because Bang and Mitra do not motivate their empirics with a formal model of
how gender discrimination affects the costs and benefits of migration choices, they do not allow
for the type of nonlinear effects that we report below.
Second, Baudassé and Baziller (2011) use a principal components analysis (PCA) to

Female Brain Drains and Women’s Rights Gaps 8
aggregate variables such as female-male income and education differentials and female labor
market participation rates into indices of gender inequality. The data necessary for their PCA
limits them to a relatively small sample from 51 countries.3 Like us, they suggest that the
theoretical sign of the effect of discrimination on female brain drain is ambiguous. Gender
discrimination may be a push factor, increasing the benefits to migration; however, it may also
create a selection bias against women at the household or village levels in collective decisions
concerning who will get to migrate. However, empirically they find that improving gender
inequality is positively associated with female migration rates, especially those of high-skilled
females. One shortcoming of Baudassé and Baziller (2011) is that they do not allow for the sort
of nonlinear relationship that logically follows from their discussion of push factor versus
selection bias effects.
The results of our present analysis are one way to reconcile Bang and Mitra’s (2011) and
Baudassé and Baziller’s (2011) contradictory findings. By theoretically deriving and estimating a
non-linear relationship between women’s rights in origin countries relative to destination
countries and female brain drains, we claim that both pairs of authors are capturing part of the
truth. Both the costs and the benefits of migration for females are a function of the rights that
their home countries provide. Whether the negative effect of smaller benefits to migration
dominates, or the positive effect of lower costs, depends on the level of women’s rights that the
country is starting from.
The relative dearth of research on women’s rights in relation to female brain drain is an
important shortcoming in the literature. Studies have suggested that, in general, gender inequality
is harmful to a country’s economic growth (e.g., Dollar and Gatti (1999) and Klasen (2000)).
3 Baudassé and Baziller also use numbers of migrants rather than migration rates. Even though they do control for
population on the right-hand-side of their empirical specifications, not using a rate of the dependent variable is
inconsistent with the bulk of existing studies.

Female Brain Drains and Women’s Rights Gaps 9
These suggest that the participation of women in the labor force contributes positively to
economic development, a general view that is supported for the specific cases of India and Sub-
Saharan Africa by, respectively, Esteve-Volart (2004) and Blackden, Canagarajah, Klasen, and
Lawson (2006). If gender discrimination is also associated with the flight of female human
capital, this could another economically important channel through which gender inequality
harms development.
3. A Model of Migration Choice Facing Differences in Women’s Rights
The importance of gender has been long overlooked in the economic theory of migration.
Pfeiffer, Richter, Fletcher, and Taylor (2007) review the literature and conclude that, given the
dissimilar migration patterns of women and men, “[s]eparate modeling approaches allowing for
variables that differently affect migration benefits and costs for the sexes may be needed” (p.
18). One contribution of this paper is to address precisely this concern in regards to women’s
rights in the neoclassical theory of international migration.
We assume that individuals view a migration decision as a utility-maximization problem.
Each individual makes her or his migration decision by computing the expected net gains
associated with each possible location choice including their origin country (i.e., no migration).
We follow the framework developed by Borjas (1987) and Grogger and Hanson (2011).
Consider a model of migration with a single skill type (high-skilled). A high-skilled
individual of gender g (= m or f) living in country i decides whether or not to migrate to some
other country j to maximize her or his utility. The individual’s utility function if she or he stays
in country i is,
(1)

Female Brain Drains and Women’s Rights Gaps 10
The function, (1), is a simple linear function of wages in the country, Wi, and other
characteristics of the country, Ei. All of the variables thus far are gender-nonspecific. However,
we also introduce the variable which represents the effects of institutionalized
discrimination. Discrimination is inversely proportional to the level of women’s rights provided
in i. By assumption, Di,g = 0 for g = m; Di,g ≥ 0 for g = f. Note that, for simplicity but without
loss of generality, we assume that Wi is the same for both women and men (i.e., any
discrimination-based wage differentials are subsumed in Di,g.) Lastly, εij,g is a shock that is may
be distributed differently for each gender but has an independently and identically distributed
extreme value distribution in either case.
The utility function of an individual from i who migrates to country j is,
(2) ( )
where is the cost of migrating from country i to j and ij,g is a shock similar to that in (1).
This costs include the monetary cost of moving, the opportunity cost of moving, the challenges
of learning a new language, and the psychological cost of moving.4 More importantly for our
purposes, we will assume below that these costs are, for women, a function of the origin
country’s level of discrimination. Ej are other j country characteristics and is the level of
gender discrimination faced by the potential emigrant in j. Again by assumption, Dj,g = 0 for g =
m; Dj,g ≥ 0 for g = f.
As in Naghsh Nejad (2012) we introduce the assumption that the cost function is a
strictly increasing convex function of discrimination in origin and destination countries:
(3)
4 Beine and Salomone (2010) argue these costs can affect women and men differently. We here assume that the cost
functions have identical forms for both men and women and, instead, look at how a lack of women’s rights imposes
different costs on men and women. This is not to argue against Beine and Salomone (2010). Rather we abstract from
gender-specific cost functional form differences to focus on our question of interest.

Female Brain Drains and Women’s Rights Gaps 11
(4)
(5)
(6)
(7)
(8)
represents factors (other than discrimination) that affect migration costs for women . We
assume increasing costs in both origin and destination country gender discrimination. In the case
of origin country discrimination, this is plausible if, as discrimination increases (i.e., the level of
women’s rights decreases) the barriers to migration accumulate from primarily cultural norms
(e.g., discouragement from family and friends) to norms and legal restrictions (e.g., difficulties in
obtaining a passport) and then eventually to the lack of basic protections from threats of physical
harm or death (e.g., a woman’s husband can physically restrain her with impunity). On the
margin, each of these barriers seems to present increasingly large costs. Analogous arguments
can be made for destination country discrimination levels. The same elements of a society that
represent barriers to potential female emigrants also represent hardships to be borne by females
immigrating to that society.
Based on the above assumptions, the net gain from moving from country i to j is,
(9) ( ) ( ) ( ) ( ) .
An individual in i will decide to move to a new country if (9) is positive for any j. Also, the
individual will choose the destination that gives her or him the largest net gain, i.e., the j for

Female Brain Drains and Women’s Rights Gaps 12
which (9) is largest. Following the results from McFadden (1984) the logged odds of migration
from i to j is,
(10)
( ) ( ) ( )
Where
is the population share of gender group g in i that migrates to j.
is the population
share of gender group g in i that remains in i, and assuming . Furthermore, the
between female and male odds of migration is,
(11)
Inspection of (11) gives us some intuition that motivates the empirical analysis below.
There are two terms on the right-hand-side; one is negative and the other is positive. First, the
positive term clearly expresses that, all else equal, the relative benefits to women considering
migration from i to j are increasing in the amount of discrimination in i relative to j. All else
equal, the benefits to migration are higher when the move is towards a destination with a higher
level of women’s rights. On the other hand, the negative right-hand-side term concerns the
relative costs of migration. Recalling, (3)-(7) above, the cost to females (relative to males) is
increasing and convex in the discrimination in i relative to j. For a given level of women’s rights
in j, a decrease in i’s women’s rights implies both increased costs and benefits to migration from
i to j. Because the costs are convex in discrimination, (11) will be a non-linear relationship in
.
Differentiating (11) separately with respect to discrimination levels in i and j yields,
(12)
and

Female Brain Drains and Women’s Rights Gaps 13
(13)
.
Using the partial derivatives, (12) and (13), the total differentiation of (11) is,
(14) (
) ( )
5
The first right-hand-side term is based on the expected benefits of migration and, by
itself, confirms what might seem to be “common sense”. When there is an increase in i’s
discrimination relative to j, a woman’s expected benefits in considering a move to j increase. All
else equal, this increases female migration from i to j relative to that of males. However, the
second right-hand-side component of (14) is a cost component. An increase in i’s discrimination
relative to j implies that dDi,f > 0 and/or dDi,f < 0. Consider the interesting case where, starting
from an initial Di,f > Dj,f, both of these inequalities hold and both dDi,f and dDj,f are small in
absolute value. In other words, consider a migration opportunity from a country with fewer
women’s rights to one with more, and where the discrimination differential has become
marginally more beneficial to women. On the cost side, higher discrimination in i makes
migration more costly (
) which, all else equal, makes female migration less
likely. Alternatively, lower costs due to less discrimination in j (
makes
female migration more likely. Because costs are convex in both Di,f and Di,g, at a relatively a high
initial Di,f level, a negative effect will dominate the cost component and, possibly, (14) itself will
be negative.
The nonlinear relationship derived from the model is perhaps more interesting if one
considers why the “common sense” view that increasing women’s rights may lead to less female
5 Note that there is no component of (14) including a partial derivative with respect to Tij. Since, by assumption, a
change in Tij has identical effects on male and female costs, its effect on relative migration rates is nil.

Female Brain Drains and Women’s Rights Gaps 14
brain drain. In a country that begins with a very low level of women’s rights, increases in those
rights may be associated with increases in female brain drain relative to that of males. This is
because, on the margin, women’s responses to the lower costs of leaving the country dominate
the lesser benefits to migration. Our empirical analysis below is, to our knowledge, the one to
explicitly incorporate and estimate this sort of nonlinearity.
4. Data and Empirical Model
Motivated by the theory in section 3, we now introduce the dependent and independent
variables of our analysis. We also describe the gravity model and estimation techniques that we
employ.
4.1 Dependent Variable
The dependent variable of interest is the rate of female brain drain from country i to
country j for each origin-destination pair in our sample. This variable is constructed from the
Docquier et al.’s (2010) dataset based on census and register data across countries. It includes
both OECD and non-OECD countries for the years 1990 and 2000. They focus on the population
over the age of 25 in an attempt to exclude students from their data. In this data they can identify
immigrants based on country of birth rather than citizenship status, which is consistent over time.
To calculate migration rates we find the proportion of migration flows from each origin
country (i) to each destination country (j) as a percent of nationals of the origin country with the
same level of education and gender in 1990. As for the number of nationals in each education
and gender group we used the data from Docquier et al. (2009). These authors report the number
of all the nationals by summing the population residing in the origin country with the stock of
migrants living abroad. They use population data from United Nations and CIA fact books.

Female Brain Drains and Women’s Rights Gaps 15
We use the following formula to calculate the female brain drain ratio (FBDR) as
follows:
(15)
where the brain drain rates are,
(16)
In (16), g and h refer to, respectively, gender and education level. The education level, h, that we
focus on is high-skilled, i.e., individuals with post-secondary education.
4.2 Independent Variables
Our independent variables of interest are the gap between origin and destination countries
women’s rights indices based on the Cingranelli and Richards (2010) (CIRI) Human Rights
Dataset. CIRI publishes three women’s rights indices: women’s social rights, women’s economic
rights, and women’s political rights. Each of these indexes varies from 0 to 3. A 0 value implies
that women’s rights are not recognized at all by law (high degrees of discriminations against
women are present both culturally and by law) and 3 if they are fully recognized and the
government thoroughly enforces those laws. For the intermediary values; a score of 1 implies
that a government has very weak laws and little enforcement; a score of 2 implies that there are
adequate laws but that enforcement is weak. The women’s economic rights index focuses on the
right to get and choose a job without husband or male relative’s consent. It also includes the
equalities in hiring, pay, promotion, and job securities in workplace. Moreover, this index
includes the freedom from sexual harassments at work, as well as the right to work at night, in
dangerous conditions, and in military and police force. Women’s political rights include the right
to vote and engage in political activities such as running a political office, hold government

Female Brain Drains and Women’s Rights Gaps 16
positions, join political parties, and petition government officials. Women’s social rights consider
gender inequalities in inheritance, marriage, and divorce as well as the women’s rights to travel,
obtain education, and choose a residence. This index also takes into account the protection from
genital mutilation and forced sterilization.
In our analysis we initially calculate a comprehensive women’s rights variable by adding the
three different indexes from CIRI dataset. We add one to each component so that each varies
between one and four.6 This presents denominator (and, for that matter, numerator) values from
ever being zero. The comprehensive women’s rights gap between an origin country, i, and a
destination country, j, is then calculated at the ratio of the j value to the i value7:
(17)
.
Both the numerator and denominator of (17) can vary from 3 to 12; the range of the ratio is
therefore from 0.25 to 4.00.
The comprehensive women’s rights gap, (17), assumes equal weighting of all three
dimensions of women’s rights – economic, social, and political. This, of course, may be more
than an approximately incorrect assumption. As well, the question of which dimensions of
women’s rights are most important for determining the female brain drain ratio is an important
one in its own right. Still, including measures of all three dimensions of women’s rights
separately is likely to inflate standard errors by introducing collinearity. Faced with this, we
6 Alternatively, we also estimate the results by constructing the women’s rights variables in origin and destinations
by adding women’s social, economic and political rights in their origin form. The only origin country with women’s
rights levels of zero is Afghanistan which is dropped from the estimation. The results are presented in table A2 in
appendix 1. 7 Alternatively, we also estimate the results by constructing the women’s rights’ gap variable as a subtraction
between the women’s rights levels in origin from the women’s rights levels in destination. The results are presented
in Table A1 in appendix 1. The results that we report below are not different qualitatively from those found in Table
A1.

Female Brain Drains and Women’s Rights Gaps 17
proceed by first reporting based on the comprehensive index. Subsequently, we report results
using the constituent components of the comprehensive index:
(18)
;
(19)
;
(20)
.
Again, we are using CIRI index values plus one. This prevents denominators from being zero
and implies maximum values for the gaps of 4.00 and minimum values of 0.25.
In addition to our women’s rights variables of interest, we control for various other
variables including, first, origin and destination countries’ GDP per capita. We use the GDP per
capita data available through the World Bank.8 Based on the neoclassical models of migration
higher GDP per capita in a source country is associated with lower incentives to migrate.
Likewise, higher GDP in a destination country is considered to be an important factor that
“pulls” migrants in its direction. Dumont et al. (2007) also report that high-skilled women are
more responsive to levels of GDP than are men. For similar reasons we control for the
unemployment rates of both origin and source countries. Unemployment rates data comes from
the World Bank.9 A high level of unemployment in a source country is likely to “push” migrants
away; a low unemployment rate in a destination country is then likely to “pull” those migrants in
its direction. Furthermore, we control for an origin countries’ political stability. This variable is
from World Bank governance indicators.10
It represents the likelihood that the government loses
8 This comes from the World Bank national accounts data and OECD national accounts data files:
http://data.worldbank.org. 9 This comes from the World Bank Key Indicators of the Labour Market database: http://data.worldbank.org.
10 http://info.worldbank.org/governance/wgi/sc_country.asp

Female Brain Drains and Women’s Rights Gaps 18
its power by internal terrorism or other violent means. This score varies between -2.5 and 2.5. A
higher score indicate a more stable government.
Several geographic characteristics of origin and destination countries are included in our
gravity model estimations. We use the landlocked dummy variable from Mayer and Zignango
(2011) for which 1 indicates a country that is landlocked and 0 if it is not. Countries that are
“geographically disadvantaged” are isolated and tend generally to have lower migration flows
(Docquier, et al., 2012). Also from Mayer and Zignango (2011) we include a small island
dummy (1 = small island; 0 otherwise) in the regressions. Small islands tend to have significantly
higher rates of emigration. Docquier (2006) reports that the brain drain rates from the small
islands are typically higher than other countries.
Finally, we include several origin-destination specific cost factors that follow the
suggestions of Mayer and Zignago (2011) we include a contiguity dummy to capture the effect of
being geographic neighbors. We also use the bilateral distance between country pairs, i.e., the
geodesic distances between the major cities. Colonial relationships between country pairs can
lower migration costs. First, countries that have had colonial links are more likely to have similar
cultures, religions and/or institutions. Colonizer countries often have a similar system of
education and a historically higher stock of migrants from the colonized countries. Moving into a
country with a similar education system can make finding a job easier because the likelihood of
one’s documentation and skill sets being accepted is higher. Cultural similarities also make the
transition process easier. Having a network of previous migrants from one’s origin can reduce
monetary and non-monetary costs of migration. Based on this we a colony dummy takes the
value of one for country pairs that have a past colonial relationship; zero otherwise. Finally, we
include two common language dummy variables. A common language dummy takes the value of

Female Brain Drains and Women’s Rights Gaps 19
one if 20 percent or more of the population in the origin and destination countries speak the same
language. A common second language dummy takes the value of one if more than 9 but less than
20 percent of the populations speak a same language.
We also use the average of 1990 and 2000 data for the independent variables. However,
we subsequently check the robustness of our results to using “initial” 1990 values for
independent variables. Table 1 reports summary statistics for all of the variables contained in our
regressions.
4.3 Gravity Model and Estimation Techniques
The gravity models that we estimate are each of one of three forms:
(21)
ijijZ
ijijij
Z
GapRightssWomenGapRightssWomenFBR
2
210 ' 'log,
(22)
ijijZ
ijijij
Z
GapRightssWomenGapRightssWomenFBR
2
210 ' '1log,
or
(23)
ijijZ
ijijij
Z
GapRightssWomenGapRightssWomenFBR
2
210 ' '
where, in each case, FBRij and the Women’s Rights Gapij are defined according to (15) and (17)
above; Zij contains our other control variables. We estimate (21) using both OLS and the
Heckman (1970) two-stage regression approach. Since multiple observations taking the value of
zero is an issue with migration data, we also estimate (22) by OLS. The addition of one to the
dependent variable allows us to include (logged) observations where FBRij is equal to zero.
However, observations where FBRij is undefined (when the male migration flow in the

Female Brain Drains and Women’s Rights Gaps 20
denominator is zero) are still excluded. We also apply the Poisson pseudo-maximum likelihood
estimation suggested by Silva and Tenreyro (2006) to (23).
Our approaches to handling the problem of a large number of zero and undefined flows in
the bilateral migration flows that constitute FBRij deserve some attention here. If zeros are
randomly distributed or when zeros are random missing data or random rounding errors, then
dropping the zeros in OLS estimation of (21) is correct. In other words, the OLS estimation is
correct if we believe that zeros are not informative so we can drop them. However, if the zero
female brain drain ratio in the data is really a zero migration rate, or it reflects systematic
rounding errors associated with very small flows, throwing zero female brain drain ratios out of
the sample will result in a loss of useful information and will yield inconsistent results. (Silva
and Tenreyro, 2006) For example, if zero female migration rates reflect prohibitive gender
discrimination in origin or destination country, a mass of zero observation is informative in this
case and should be treated as such.
Here, we have the problem of large number of both zeros and undefined values in cases
where there are no male or female high-skilled flows between a pair of country. The presence of
a high number of zero or unidentified values can lead to inconsistent estimates. More precisely,
the use of logarithm drops all the zero and undefined observations which could bias the estimates
of the effects of women’s rights gap on female brain drain ratio. It might be the case that there
are no female or male migrants from country i to country j because migration costs are very high
between these two countries. Migration costs might be too high for women specifically because
of high discrimination against her in origin or destination country. In this situation exclusion of
those observations leads to underestimation of the impact of the discrimination on female brain
drain ratio.

Female Brain Drains and Women’s Rights Gaps 21
To overcome this problem, first we follow the traditional literature using gravity models
by simply adding one to the dependent variable and then applying OLS to (22). The adding one
to OLS estimation is ad hoc and there is no guarantee that it reflects the underlying relationships.
As a result, the regression may be misspecified. Also, since our dependent variable is a ratio of
migrations flows, in our analysis zero migration flow observations translate into dependent
variable observations that may be zero or may be undefined. Adding one to an undefined
variable is not, of course, a solution and OLS estimation of (22) still excludes those observations.
Another alternative approach is Heckman (1970) two-stage estimation of (21). Heckman
considers both the missing (for us, undefined) and zero observations as a self-selection issue. It is
plausible that the probability of having positive (non-zero) migration between two countries is
correlated with unobserved characteristics of that country pair. In a Heckman estimation, the first
step is the probit estimation of (21) to determine, based on the conditioning variables, the
probability of a non-zero, defined dependent variable observation. Then in a second stage OLS
regression of (21), the expected values from the first-stage probit estimation are used in place of
the undefined and zero dependent variable observations,
Wooldridge (2002) argues that using the same sets of variables in the probit model is
acceptable and Beine, Docquier, and Özden (2011) show that their result stays consistent when
they use the same set of variables or when they use an instrumental variable to predict the
possibility of having a migration flow between countries. Here, we use the same sets of variables
for the first stage of Heckman model. Here we assume the probability of observing a positive
migration flow or female brain drain ratio is correlated with observing a positive stock of
migration from country i in country j in year 2000. The Heckman estimation creates an inverse
Mills Ratio from the first stage estimation (estimated expected error) based on the parameters

Female Brain Drains and Women’s Rights Gaps 22
estimates. Then, it uses the inverse Mills Ratio as an additional regressor in the second stage
OLS estimation of (21). In a way the Heckman estimation removes the part of the error term
correlated with this regressor. The Heckman model is the most comprehensive in terms of taking
the maximum number of observations into account.
Yet another approach that we employ is the Poisson pseudo maximum likelihood method
suggested by Silva and Tenreyro (2006). PPML estimates directly the nonlinear form of the
gravity model, (23), and avoids dropping zero dependent variable observations. In other words,
PPLM avoids needing to take the natural log of the dependent variable. Silva and Tenreyro
(2011) argue that the Poisson pseudo maximum likelihood estimation is robust to the presence of
large number of zeros in the data. Moreover, they argue that while the traditional gravity model
is biased in the presence of heteroskedasticiy and log linearization leads to inconsistent
estimates, the Poisson pseudo maximum likelihood estimation is consistent. However, the
Poisson pseudo maximum likelihood estimation, like OLS estimation of (22), cannot overcome
the case of undefined values for the female brain drain ratio. The Heckman two stage estimation
is the only method that treats the zero migration flows as unobserved rather than inexistent in the
case of OLS and PPML.
5. Results
Tables 2 through 7 report our empirical results. Each table reports (I) OLS estimates based
on log(FBRij) as the dependent variable, (II) OLS estimates based on log(FBRij + 1) as the
dependent variable, (III) Heckman two-stage estimates, (IV) PPML estimates, and (V) PPML
estimates based only on values of FBRij that are positive. All estimations include a women’s

Female Brain Drains and Women’s Rights Gaps 23
rights gap variable and that variable’s squared value as regressors. As a way of summarizing, the
results reported below in advance.
A statistically significant, non-linear relationship between the female brain drain ratio and
the comprehensive women’s rights gap is estimated across all specifications.
The relationship is robust to using 1990-2000 averages or initial 1990 values of control
variables.
The inverse Mills ratio enters significantly (five percent level) in the second stage of the
eight different estimations which confirms the existence of sample selection bias. The
Heckman estimation treats this sample selection bias; and as a result it is our preferred
estimation technique.
Based on estimations including one rights gap measure at a time, a statistically significant
non-linear relationship is estimated across all specifications for both political and social
women’s rights gaps; the non-linear relationship for the economic women’s rights gap is
statistically significant in all specifications except for PPML.
Including all three rights gaps measures in single estimations yields a statistically
significant nonlinear relationship for the women’s political rights gap across
specifications; the relationship for the women’s economic rights gap is statistically
significant in all specifications except for PPML.
All statistically significant estimated relationships imply that, starting from low levels of
the women’s rights gap, increases are associated with greater relative female brain drain
on the margin; at higher levels of women’s rights the relationship becomes positive.
As indicated above, we report estimations including one type of women’s rights gap (and its
squared value) at a time (tables 4, 5, & 6) and also estimations including all three types

Female Brain Drains and Women’s Rights Gaps 24
simultaneously (table 7). In the case of the former estimations, the excluded women’s rights
variables may be omitted variables that are correlated with the included variables, biasing the
estimates. Alternatively, including all three types of rights at once is likely to introduce
collinearity, yielding imprecise estimates. Our compromise is to report on both, having noted the
caveats to each.
5.1 Comprehensive Women’s Rights Gap
Column I of table 2 shows the results of the benchmark OLS estimation. The women’s
rights gap variable enters positively and significantly at the one percent level; its squared value
enters negatively and significantly also at the one percent level. This nonlinear, “hump-shaped”
relationship peaks at a women’s rights gap value of about 1.796. A value of 1.796 is more than a
sample standard deviation greater than the sample mean (1.193). It implies a large gap in
women’s rights in favor of the destination country. For example, gap values in our sample
greater than 1.796 would correspond to Saudi Arabia, Lesotho, and Sudan as origins relative to
the US as a destination. As an alternative example, the ratio of the US women’s rights index to
that of Nigeria 1.636 < 1.796.
Starting from a women’s rights gap value of less than 1.796, the OLS estimates suggest
that increases in an origin country’s women’s rights, relative to those of the destination country,
will decrease the relative amount of female brain drain. This would apply to most of the origin-
destination pairs in our sample. We also believe that it is the “common sense” result, i.e., at first
consideration one is likely to conjecture that the more relatively desirable the destination
country’s women’s rights, the greater the high-skilled female migration to that destination will
be.

Female Brain Drains and Women’s Rights Gaps 25
However, while “relatively desirable” implies the benefits of the destination relative to
the origin, there are also the costs of migration to be taken into account. The OLS estimates
suggest that, starting from women’s rights gap values greater than 1.796, increases in that gap
will be associated with decreases in female brain drain from the origin to the destination.
Interpreted in terms of our theoretical model in section 3 above, starting from a high gap value
the women’s rights in the destination country are very good and/or those in the origin country are
exceedingly poor. If the gap widens, in terms of the cost component of equation (14), the costs
associated with leaving the origin country increase and/or those associated with entering the
destination country decrease. If both the origin and destination costs are convex (partial
derivatives (6) and (7)), then it is the former effect that likely dominates the estimated effect. A
decrease in origin country’s women’s rights imposes large marginal increases to the costs
associated with a high-skilled female leaving. Therefore, starting from very high women’s rights
gap values (especially from exceedingly poor origin country women’s rights levels) this cost
effect dominates.
The OLS results from column I exclude (log) female brain drain ratios observations that
are zero because of a zero numerator. Column II reports OLS results that incorporate the latter
(an additional 353 observations) by adding one before taking the natural log. The results for the
women’s rights variables of interest are qualitatively unchanged. Furthermore, while the
coefficient estimates on women’s rights gap and its squared value are quantitatively different,
they imply a threshold value of 1.763, almost identical to that implied by the column I estimates.
Column III contains the results of the Heckman estimation. This approach allows us to
incorporate information from another 743 undefined observations where the denominator or both
numerator and denominator of the female brain drain ratio are zero. The inverse Mills ratio
Female Brain Drains and Women’s Rights Gaps 26
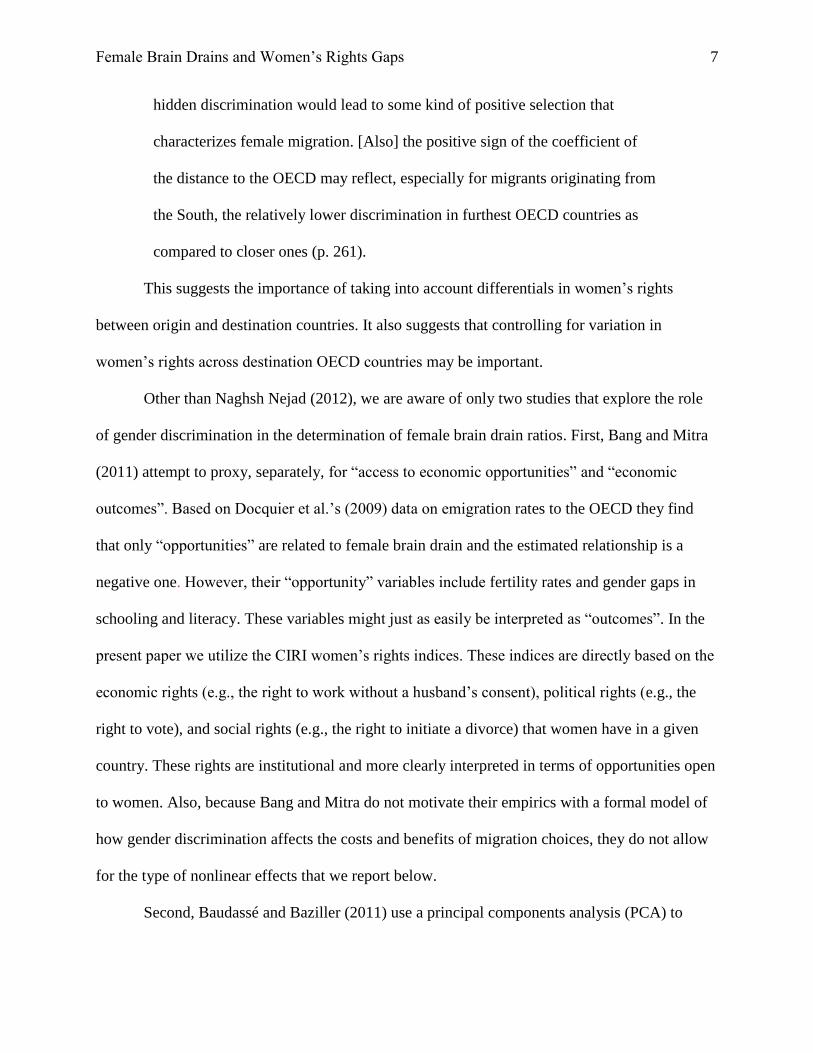
enters significantly (five percent level) in the second state estimation. This is evidence that
selection bias is important when the undefined/zero observations are excluded. The Heckman
coefficient estimates on the women’s rights gap and gap squared are both statistically significant
(five percent level or better). Furthermore, they are almost indistinguishable from the column I,
OLS results; they imply a threshold women’s rights gap value of 1.795. Starting from only from
very high women’s rights gap values, increases in the gap between destination and origin
countries are associated with decreases in the female brain drain ratio. Again, the result implies
that, for most origin-destination pairs in our sample, increasing (decreasing) women’s rights in
origin (destination) country decreases the relative number of high-skilled women migrating from
the origin to the destination.
To check the robustness of this result, columns IV and V report results from the
estimation of (23) using the Poison pseudo maximum likelihood (PPML) method suggested by
Silva and Tenreyro (2011). Whether using all values of the female brain drain ratio (column IV)
or just the positive value (column V) the results are qualitatively similar to those from the
Heckman estimation. All relevant coefficient estimates are statistically significant (10 percent
level or better) but smaller in absolute values compare to the Heckman two stage specification or
the OLS estimations. This is consistent with Silva and Tenreyro (2011).The threshold women’s
rights gap levels are actually slightly higher at 1.934and 1.998 for columns IV and V,
respectively. This might arise from the fact that the PPML model cannot take into account the
presence of undefined values of the dependent variable. Regardless, the thresholds are still quite
high relative to the women’s rights gap sample mean (1.193).
As a robustness check we also used the data from 1990 for explanatory variables rather
than the average of 1990 and 2000 data. As it can be seen in table 3 the results are very similar.

Female Brain Drains and Women’s Rights Gaps 27
Specifically, from our preferred Heckman results (column III) the coefficients on both the
women’s rights gap and its squared value are statistically significant at the one percent level. As
before, the former point estimate is positive and the latter is negative. The implied threshold
women’s rights gap value is1.943. (The inverse Mills ratio enters significantly in the second
stage regression.)
5.2 Economic, Political, and Social Rights Gaps Separately
Lumping economic, political, and social rights into one comprehensive measure might be
inappropriate. Therefore we proceed to allow different (nonlinear) effects to be associated with
different rights components. We first consider separate specifications including, respectively,
women’s economic, political, or social rights gaps. These results are contained in, respectively,
tables 4, 5, and 6. In each case, omitting the other two rights components may lead to omitted
variable bias. Alternatively, introducing all three individual rights gaps (and their squared values)
in a single specification may lead to inflated standard errors due to collinearity. We will explore
whether that is the case in the following section 5.3.
Tables 4, 5, and 6 present the results of estimation using, separately and respectively,
women’s economic, political, and social rights gaps along with their squared values as
regressors. The women’s economic rights gap and its squared value each remain statistically
significant at the one percent level in both of the OLS regressions (table 4; columns I & II) and
the Heckman estimation (column III). The point estimate on the gap level is always positive; on
its squared value it is always negative. Focusing on our preferred Heckman estimation results,
the positive effect of changes in the women’s economic rights gap on the female brain drain ratio
turns negative at around a gap value of 2.076 while the mean of this variable is 1.213 in our data.

Female Brain Drains and Women’s Rights Gaps 28
However, in both of the PPML estimations (columns IV & V) neither the women’s economic
rights gap nor its squared value enters significantly. We must conclude that the table 4 results
based on the women’s economic rights gap are not as robust to estimation technique as those
reported in table 2 using the general women’s rights index values.
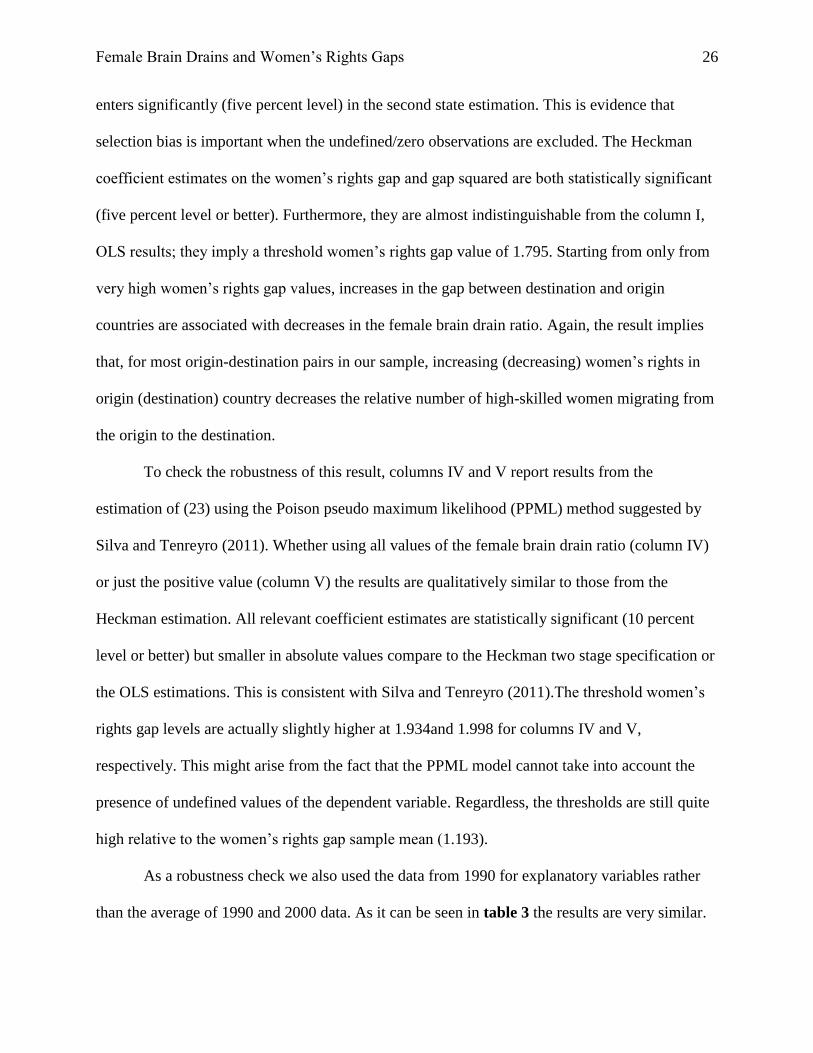
On the other hand, the women’s political rights gap and its squared value enter
significantly into both of the OLS regressions (table 5; columns I & II), the Heckman estimation
(column III), and both of the PPML estimations (columns IV & V). The signs of the point
estimates are always positive and negative, respectively. Based on the Heckman results, starting
from any women’s political rights gap level below 1.935, increases in the gap between the
destination and origin countries’ rights levels are associated with increases in relative female
brain drain towards the destination country. Starting from higher gap levels the estimated effect
is negative. This is a robust result across estimation techniques and is consistent with the
intuition described in regards to the table 2 results.
The table 5 results, concerning women’s social rights gaps, are qualitatively the same as
those reported in table 5. The now-familiar, non-linear “hump-shaped” relationship appears
significantly across of estimation techniques. The threshold women’s social rights gap value
(based on the column III Heckman results) is higher (2.422) than reported for the other types of
rights gaps. However, the sample mean of the women’s social rights gap is also higher (1.345)
than that associated with economic (1.213), political (1.063), or general (1.193) rights.
The common result across tables 4, 5, and 6 - which is robust for both women’s political
and social rights – is that, for most origin and destination country pairs in our sample, increasing
women’s rights in origin country decreases the relative number of high-skilled women migrating
away from the origin country and towards the destination. Only starting from exceptionally high

Female Brain Drains and Women’s Rights Gaps 29
women’s rights gap values (and, presumably, when the origin country has exceedingly poor
definition and enforcement of women’s rights) do we find that increases in the gap are associated
with decreases in the female brain drain ratio. Intuitively, even though increases in the gap make
migration more beneficial, they also make it more costly and this latter effect dominates.
5.3 Economic, Political, and Social Rights Gaps Simultaneously
Table 7 reports the results of estimations including women’s economic, political, and
social rights gaps (along with their squared values) as independent variables simultaneously. The
first thing to note is that, across estimation techniques, whenever a gap variable is statistically
significant, it carries the sign that we would expect given the results already reported on above;
the “hump-shaped” relationship manifests itself.
The political rights gaps and the squared values are statistically significant, always at the
one percent level, in both OLS regressions (columns I & II), the Heckman estimation (column
III), and both PPML estimations (columns IV and V). Using the preferred Heckman results, the
threshold women’s political rights gap value is 2.562. This nonlinear effect associated with the
women’s political rights gap is, overall, the most robust finding that we report. The women’s
economic rights gap and its squared value are again significant in all but the two PPML
estimations. The threshold economic rights gap value implied by the Heckman results is 2.194.
Apparently, the women’s social rights gap is the weakest candidate in our estimations. When
included along with the economic and political rights gaps it only enters significantly (five
percent level) in the PPML estimation using positive female brain drain ratio values only
(column V). Even then its squared value enters insignificantly (though the point estimate remains
negative).

Female Brain Drains and Women’s Rights Gaps 30
6. Conclusion
We explore women’s rights as a determinant of the female brain drain rate relative to that
of men (the female brain drain ratio). We develop a model of migration where both women’s
expected costs and benefits of migration are a function of women’s rights in the origin country
relative to those of the destination (the women’s rights gap). Since both costs and benefits are a
function of the women’s rights gap, the relationship between changes in that gap on the female
brain drain ratio is nonlinear. In particular, starting from high values of the rights gap, increases
in the relative level of rights in the origin country can be associated with increases in the female
brain drain ratio. However, starting from lower levels of the gap the relationship turns negative.
In other words, when women’s rights levels are higher in the destination country in comparison
with the origin country, high-skilled women are more likely to migrate (compare to men), unless
the low levels of women’s rights in origin manifests as increased cost of migration for women.
Using a panel of over 5,000 bilateral migration flows across OECD and non-OECD
countries and the women’s rights indices from the CIRI Human Rights Dataset, we report
evidence consistent with the theory. A statistically significant and nonlinear relationship exists
between women’s rights gaps and female brain drain ratios. The results are consistent across
different estimation techniques and different measures of the women’s rights gap variable. We
use the gap in women’s economic, political and social rights as well as a comprehensive variable
that consist of all the three variables The evidence is particularly strong for the case of women’s
political rights.

Female Brain Drains and Women’s Rights Gaps 31
References
Abu-Ghaida, D., Klasen, S. 2004. The costs of missing the millennium development goal on
gender equity. World Development 32, 1075-1107.
Bang, J.T., Mitra, A. 2011. Gender bias and the female brain drain. Applied Economics Letters
18, 829-833.
Baudassé, T., Bazilier, R. 2011. Gender discrimination and emigration: push factor or selection
process? http://remi.bazillier.free.fr/baudasse_bazillier_gender.pdf.
Behrman, J. R., Deolalikar, A. B. 1988. Health and nutrition. in Chenery and Srinivasan (eds)
Handbook of Development Economics, Volume I, North-Holland, Amsterdam.
Beine, M.A., Docquier, F., Özden, C. 2011. Diasporas. Journal of Development Economics 95,
30–41.
Beine, M.A., Salomone, S. 2011. Network effects in international migration: education versus
gender. Center for Research in Economic Analysis Discussion Paper Series 11-08
Blackden, M., Canagarajah, S., Klasen, S., Lawson, D. 2006. Gender and growth in Sub-Saharan
Africa: issues and evidence. WIDER Research Paper No. 2006-37.
Borjas, G.J. 1987. Self-selection and the earnings of immigrants. American Economic Review
77, 531-553.
Cingranelli, D. L., Richards, D. L. 2010. The Cingranelli-Richards (CIRI) Human Rights
Dataset. Version 2010.05.17.
Docquier, F. 2006. Brain drain and inequality across nations. IZA Discussion Paper No. 2440.
Docquier, F., Lowell, B. L., Marfouk, A. 2009. A gendered assessment of the brain drain.
Population and Development Review 35, 297-321.
Docquier, F., Marfouk, A., Salamone, S., Sekkat, K. 2012. Are skilled women more migratory

Female Brain Drains and Women’s Rights Gaps 32
Than skilled men? World Development 40, 251-265.
Docquier, F., Rapoport, H. 2012. Globalization, brain drain and development. Journal of
Economic Literature (forthcoming).
Dollar, D., Gatti, R. 1999. Gender inequality, income, and growth: are good time good for
women? Policy Research Report on Gender and Development, Working Paper Series,
No. 1, World Bank.
Dumont, J.C., Martin, J.P., & Spielvogel, G. 2007. Women on the move: the neglected gender
dimension of the brain drain. IZA Discussion Papers No. 2920.
Esteve-Volart, B. 2004. Gender discrimination and growth: theory and evidence from India.
Working Paper, Suntory and Toyota International Centres for Economics and Related
Disciplines, London School of Economics.
Grogger, J., Hanson, G.H. 2011. Income maximization and the selection and sorting of
international migrants. Journal of Development Economics 95, 42-57.
Klassen, S. 2000. Does gender inequality reduce growth and development? evidence from cross-
country regressions. Policy Research Report on Gender and Development, Working
Paper Series, No. 7, World Bank.
Knowles, K., Lorgelly, P. K., Owen, P. D. 2002. Are educational gender gaps a break on
economic development? some cross-country empirical evidence. Oxford Economic
Papers 54, 118-149.
Mammen, K., Paxson, C. 2000. Women’s work and economic development. Journal of
Economic Perspectives 14, 141-164.
Mayer, T., Zignago, S. 2011. Notes on CEPII’s distances measures (GeoDist). CEEPII
Working Paper 2011-25 (www.cepii.fr/anglaisgraph/bdd/distances.htm).

Female Brain Drains and Women’s Rights Gaps 33
McFadden, D.L. 1984. Econometric analysis of qualitative response models. in Handbook of
Econometrics, Elsevier.
Naghsh Nejad, M. 2012. Women’s rights as the determinants of female brain drain: an empirical
study of migration rates to OECD countries. Working Paper.
Pfeiffer, L., Richter, S., Fletcher, P., Taylor, J.E. 2007. Gender in economic research on
international migration and its impacts: a critical review. in Morrison, Schiff, and
Sjöblom (eds) The International Migration of Women, Palgrave McMillan and the
World Bank, New York.
Schultz, T. P. 1988. Education investments and returns. in Chenery and Srinivasan (eds)
Handbook of Development Economics, Volume I, North-Holland, Amsterdam.
Silva, J. M., Santos, C., Tenreyro, S. 2006. The log of gravity. Review of Economics and
Statistics 88, 641–658.
Subbarao, K., Raney, L. 1995. Social gains from female education: a cross-national study.
Economic Development and Cultural Change 44, 105-28.

Female Brain Drains and Women’s Rights Gaps 34
Figure 1.
Brain drain gender gaps on each major continent.
Note: data are from Docquier et al. (2009).
Figure 2.
Female-to-male brain drain ratios versus women’s rights index values
Note: data are from Docquier et al. (2009) and Cingranelli and Richards (2010).

Female Brain Drains and Women’s Rights Gaps 35
Table 1. Summary statistics of variables included in estimations.
min max mean Standard deviation Observations
Landlocked dummy 0.000 1.000 0.198 0.399 172
Small Island dummy 0.000 1.000 0.348 0.348 172
Contiguity dummy 0.000 1.000 0.062 0.241 5001
Common first* language dummy 0.000 1.000 0.184 0.387 5001
Common second language dummy 0.000 1.000 0.191 0.393 5001
Colony dummy 0.000 1.000 0.040 0.195 5001
Distance 35.591 19649.830 6132.615 4627.423 5001
Log distance 3.572 9.886 8.331 1.010 5001
Unemployment rate 0.450 43.500 9.660 7.279 149
Government stability 0.223 0.603 0.290 0.084 149
Polity -10.000 10.000 2.232 6.596 125
Female brain drain flow rates 0.000 23.333 0.025 0.353 6605
Male brain drain flow rates 0.000 4.533 0.010 0.113 6605
Female Brain Drain Ratio 0.00 49.971 2.194 3.111 5,268
Log(Female Brain Drain Ratio) -5.728 3.911 0.497 0.893 4,671
Log GDP 5.040 10.592 7.563 1.490 171
Women’s social rights 1.000 4.000 2.201 0.715 144
Women’s political rights 1.000 4.000 2.752 0.581 141
Women’s economic rights 1.000 3.500 2.295 0.520 144
Women’s rights 3.000 11.500 7.227 1.600 139
Women’s rights gap 0.304 3.833 1.193 0.421 5520
Women’s social rights gap 0.250 4.000 1.345 0.665 5889
Women’s economic rights gap 0.400 3.500 1.213 0.412 5882
Women’s political rights gap 0.400 2.500 1.063 0.269 5588

Female Brain Drains and Women’s Rights Gaps 36
Table 2. Effects of women’s rights gaps on female brain drain ratios using 1990-2000 averages for conditioning
variables.
Estimation Method
Dependent Variable
(I)
OLS
Log(FBR)
(II)
OLS
Log(FBR+
1)
(III)
Heckman
Log(FBR)
(IV)
PPML
FBR
(V)
PPML
FBR>0
Women’s Rights Gap 1.749***
0.984***
1.748***
1.438***
1.275***
(0.191) (0.109) (0.182) (0.455) (0.428)
(Women’s Rights Gap)2 -0.487
*** -0.279
*** -0.487
*** -0.371
** -0.319
*
(0.061) (0.037) (0.059) (0.179) (0.168)
Origin-landlocked dummy 0.122***
(0.046)
0.057*
(0.032)
0.119**
0.104 0.102
(0.049) (0.074) (0.070)
Origin Small Island Dummy 0.221**
0.159***
0.216**
0.365**
0.345**
(0.090) (0.062) (0.091) (0.149) (0.147)
Origin-loggdp -0.090***
-0.035***
-0.090***
-0.106***
-0.130***
(0.015) (0.009) (0.014) (0.023) (0.022)
Origin-unemployment -0.023***
-0.013***
-0.023***
-0.028***
-0.028***
(0.003) (0.002) (0.003) (0.005) (0.005)
Destination-loggdp 0.020 0.059***
0.028 0.011 -0.059**
(0.017) (0.010) (0.023) (0.029) (0.027)
Destination - unemployment 0.003 0.000 0.003 -0.014**
-0.015**
(0.004) (0.003) (0.004) (0.007) (0.006)
Contiguity Dummy 0.019 -0.014 0.015 -0.036 -0.017
(0.081) (0.051) (0.084) (0.132) (0.124)
Common Language Dummy -0.188***
-0.115**
-0.184**
-0.256**
-0.251**
(0.071) (0.052) (0.091) (0.107) (0.110)
Common Second Language Dummy 0.217***
0.192***
0.221**
0.295***
0.196*
(0.069) (0.051) (0.089) (0.104) (0.107)
Colony Dummy -0.041 -0.012 -0.039 -0.009 -0.019
(0.070) (0.044) (0.083) (0.129) (0.127)
Log distance 0.005 -0.017 0.002 0.004 0.034
(0.019) (0.012) (0.020) (0.031) (0.030)
Origin government instability 0.199 -0.773**
0.127 -1.103* -0.263
(0.445) (0.328) (0.493) (0.670) (0.620)
Mills Test 1.516**
(0.621)
Constant -0.295 0.337 -0.345 0.853 1.462***
(0.332) (0.211) (0.341) (0.576) (0.543)
Observations 2617 2970 3713 2970 2617
F-stat 27.547 24.069
R2 0.132 0.096 0.048 0.063
Note: Standard errors in parentheses. * p < 0.10,
** p < 0.05,
*** p < .01
Women’s rights gap here is defined as ratio of women’s rights levels in destination to women’s rights levels in
origin.

Female Brain Drains and Women’s Rights Gaps 37
Table 3. Effects of women’s rights gaps on female brain drain ratios using 1990 values for conditioning variables.
Estimation Method
Dependent Variable
(I)
OLS
Log(FBR)
(II)
OLS
Log(FBR+
1)
(III)
Heckman
Log(FBR)
(IV)
PPML
FBR
(V)
PPML
FBR>0
Women’s Rights Gap 1.398***
0.764***
1.399***
1.186***
1.109***
(0.153) (0.088) (0.145) (0.364) (0.346)
(Women’s Rights Gap)2 -0.359
*** -0.200
*** -0.360
*** -0.285
** -0.260
**
(0.046) (0.027) (0.044) (0.139) (0.130)
Origin-landlocked dummy 0.120***
(0.045)
0.056*
(0.032)
0.116**
0.098 0.099
(0.048) (0.070) (0.066)
Origin Small Island Dummy 0.201**
0.156**
0.195**
0.340**
0.307**
(0.090) (0.061) (0.091) (0.147) (0.145)
Origin-loggdp -0.091***
-0.037***
-0.090***
-0.109***
-0.128***
(0.015) (0.009) (0.014) (0.021) (0.020)
Origin-unemployment -0.022***
-0.012***
-0.022***
-0.026***
-0.025***
(0.003) (0.002) (0.003) (0.005) (0.004)
Destination-loggdp 0.020 0.057***
0.028 0.008 -0.058**
(0.016) (0.010) (0.022) (0.027) (0.025)
Destination - unemployment 0.001 -0.001 0.001 -0.016**
-0.017***
(0.004) (0.003) (0.004) (0.006) (0.006)
Contiguity Dummy 0.006 -0.024 0.001 -0.055 -0.031
(0.081) (0.052) (0.083) (0.129) (0.122)
Common Language Dummy -0.193***
-0.121**
-0.189**
-0.267**
-0.258**
(0.071) (0.053) (0.091) (0.106) (0.109)
Common Second Language Dummy 0.205***
0.193***
0.211**
0.285***
0.179*
(0.069) (0.052) (0.089) (0.103) (0.106)
Colony Dummy -0.032 -0.009 -0.029 0.007 -0.003
(0.070) (0.044) (0.082) (0.126) (0.124)
Log distance 0.002 -0.018 -0.001 -0.000 0.029
(0.019) (0.012) (0.020) (0.031) (0.030)
Origin government instability 0.599 -0.618* 0.518 -0.729 0.188
(0.429) (0.321) (0.475) (0.615) (0.562)
Mills Test 1.694***
(0.596)
Constant -0.137 0.501**
-0.194 1.011* 1.461
***
(0.311) (0.200) (0.321) (0.516) (0.480)
Observations 2644 3003 3752 3003 2644
F-stat 28.378 23.160
R2 0.133 0.093 0.048 0.066
Standard errors in parentheses * p < 0.10,
** p < 0.05,
*** p < .01

Female Brain Drains and Women’s Rights Gaps 38
Table 4. Effects of women’s economic rights gaps on female brain drain ratios using 1990-2000 averages for
conditioning variables.
Estimation Method
Dependent Variable
(I)
OLS
Log(FBR)
(II)
OLS
Log(FBR+
1)
(III)
Heckman
Log(FBR)
(IV)
PPML
FBR
(V)
PPML
FBR>0
Women’s economic Rights Gap 1.422***
0.762***
1.424***
0.444 0.230
(0.219) (0.132) (0.193) (0.461) (0.453)
(Women’s economic Rights Gap)2 -0.342
*** -0.173
*** -0.343
*** -0.039 0.008
(0.068) (0.043) (0.061) (0.165) (0.162)
Origin-landlocked dummy 0.181***
(0.046)
0.091***
(0.033)
0.177***
0.179**
0.177***
(0.048) (0.070) (0.066)
Origin Small Island Dummy 0.309***
0.203***
0.303***
0.387**
0.350**
(0.091) (0.062) (0.092) (0.150) (0.148)
Origin-loggdp -0.080***
-0.025***
-0.080***
-0.104***
-0.135***
(0.016) (0.010) (0.015) (0.022) (0.021)
Origin-unemployment -0.021***
-0.011***
-0.021***
-0.022***
-0.022***
(0.003) (0.002) (0.003) (0.005) (0.005)
Destination-loggdp 0.004 0.049***
0.013 0.017 -0.047*
(0.017) (0.011) (0.023) (0.028) (0.026)
Destination - unemployment 0.013***
0.006**
0.013***
-0.002 -0.004
(0.004) (0.002) (0.004) (0.006) (0.006)
Contiguity Dummy 0.013 -0.002 0.009 -0.019 -0.013
(0.078) (0.049) (0.082) (0.127) (0.120)
Common Language Dummy -0.221***
-0.131**
-0.216**
-0.326***
-0.339***
(0.070) (0.051) (0.089) (0.104) (0.106)
Common Second Language Dummy 0.212***
0.196***
0.217**
0.320***
0.230**
(0.068) (0.050) (0.087) (0.100) (0.102)
Colony Dummy -0.039 -0.014 -0.037 -0.024 -0.036
(0.067) (0.042) (0.082) (0.126) (0.124)
Log distance 0.003 -0.015 0.000 0.018 0.049
(0.019) (0.011) (0.019) (0.031) (0.030)
Origin government instability 0.480 -0.451 0.406 -0.162 0.583
(0.460) (0.328) (0.471) (0.660) (0.617)
Mills Test 1.732***
(0.574)
Constant -0.238 0.278 -0.305 0.944* 1.668
***
(0.329) (0.210) (0.341) (0.529) (0.502)
Observations 2772 3165 4005 3165 2772
F-stat 26.016 20.260
R2 0.118 0.084 0.039 0.056
Standard errors in parentheses * p < 0.10,
** p < 0.05,
*** p < .01
Female Brain Drains and Women’s Rights Gaps 39
Table 5. Effects of women’s political rights gaps on female brain drain ratios using 1990-2000 averages for
conditioning variables.
Estimation Method
Dependent Variable
(I)
OLS
Log(FBR)
(II)
OLS
Log(FBR+
1)
(III)
Heckman
Log(FBR)
(IV)
PPML
FBR
(V)
PPML
FBR>0
Women’s Political Rights Gap 1.058***
0.617***
1.068***
1.299***
1.208***
(0.127) (0.073) (0.125) (0.187) (0.182)
(Women’s Political Rights Gap)2 -0.273
*** -0.167
*** -0.276
*** -0.365
*** -0.330
***
(0.033) (0.020) (0.036) (0.050) (0.047)
Origin-landlocked dummy 0.146***
(0.046)
0.075**
(0.033)
0.141***
0.145**
0.143**
(0.049) (0.071) (0.067)
Origin Small Island Dummy 0.167* 0.123
** 0.160
* 0.258
* 0.240
(0.091) (0.062) (0.092) (0.151) (0.149)
Origin-loggdp -0.120***
-0.050***
-0.119***
-0.115***
-0.136***
(0.014) (0.009) (0.014) (0.022) (0.022)
Origin-unemployment -0.022***
-0.013***
-0.023***
-0.026***
-0.025***
(0.003) (0.002) (0.003) (0.005) (0.005)
Destination-loggdp 0.061***
0.080***
0.071***
0.041 -0.030
(0.015) (0.010) (0.021) (0.027) (0.026)
Destination - unemployment 0.002 -0.000 0.002 -0.015**
-0.016**
(0.004) (0.003) (0.004) (0.007) (0.007)
Contiguity Dummy 0.028 -0.008 0.022 -0.040 -0.021
(0.082) (0.052) (0.084) (0.130) (0.123)
Common Language Dummy -0.222***
-0.145***
-0.218**
-0.342***
-0.327***
(0.073) (0.053) (0.092) (0.107) (0.111)
Common Second Language Dummy 0.243***
0.215***
0.249***
0.346***
0.238**
(0.070) (0.052) (0.090) (0.103) (0.106)
Colony Dummy -0.044 -0.015 -0.040 -0.015 -0.027
(0.070) (0.044) (0.083) (0.127) (0.126)
Log distance 0.016 -0.011 0.012 0.021 0.052*
(0.019) (0.012) (0.020) (0.031) (0.029)
Origin government instability 0.778* -0.364 0.685 0.040 0.815
(0.463) (0.345) (0.488) (0.664) (0.622)
Mills Test 2.101***
(0.613)
Constant -0.143 0.408* -0.215 0.433 0.976
**
(0.325) (0.209) (0.334) (0.467) (0.446)
Observations 2647 3003 3763 3003 2647
F-stat 27.000 21.752
R2 0.127 0.089 0.048 0.067
Standard errors in parentheses * p < 0.10,
** p < 0.05,
*** p < .01

Female Brain Drains and Women’s Rights Gaps 40
Table 6. Effects of women’s social rights gaps on female brain drain ratios using 1990-2000 averages for
conditioning variables.
Estimation Method
Dependent Variable
(I)
OLS
Log(FBR)
(II)
OLS
Log(FBR+1
)
(III)
Heckman
Log(FBR)
(IV)
PPML
FBR
(V)
PPML
FBR>0
Women’s Social Rights Gap 0.811***
0.426***
0.804***
0.677***
0.661***
(0.097) (0.058) (0.095) (0.154) (0.146)
(Women’s Social Rights Gap)2 -0.168
*** -0.090
*** -0.166
*** -0.126
*** -0.120
***
(0.023) (0.014) (0.023) (0.049) (0.046)
Origin-landlocked dummy 0.166***
(0.045)
0.077**
(0.032)
0.162***
0.136**
0.142**
(0.048) (0.069) (0.065)
Origin Small Island Dummy 0.229**
0.159***
0.224**
0.367**
0.349**
(0.090) (0.062) (0.091) (0.149) (0.146)
Origin-loggdp -0.091***
-0.035***
-0.091***
-0.100***
-0.122***
(0.015) (0.009) (0.014) (0.022) (0.021)
Origin-unemployment -0.021***
-0.011***
-0.021***
-0.024***
-0.025***
(0.003) (0.002) (0.003) (0.005) (0.004)
Destination-loggdp 0.013 0.059***
0.020 0.005 -0.071***
(0.017) (0.010) (0.024) (0.028) (0.026)
Destination - unemployment 0.006 0.001 0.006 -0.012* -0.013
**
(0.004) (0.003) (0.004) (0.006) (0.006)
Contiguity Dummy 0.004 0.004 0.001 -0.023 -0.038
(0.079) (0.050) (0.081) (0.125) (0.118)
Common Language Dummy -0.203***
-0.112**
-0.199**
-0.288***
-0.305***
(0.069) (0.050) (0.088) (0.101) (0.102)
Common Second Language Dummy 0.230***
0.198***
0.234***
0.331***
0.241**
(0.067) (0.049) (0.086) (0.099) (0.099)
Colony Dummy -0.050 -0.019 -0.048 -0.036 -0.048
(0.068) (0.042) (0.081) (0.123) (0.122)
Log distance -0.002 -0.017 -0.005 -0.003 0.023
(0.019) (0.011) (0.019) (0.031) (0.029)
Origin government instability 0.072 -0.696**
0.010 -0.932 -0.222
(0.438) (0.320) (0.472) (0.662) (0.608)
Mills Test 1.287**
(0.569)
Constant 0.424 0.653***
0.373 1.319***
1.940***
(0.311) (0.204) (0.323) (0.507) (0.478)
Observations 2779 3172 4006 3172 2779
F-stat 27.341 21.082
R2 0.119 0.082 0.044 0.063
Standard errors in parentheses * p < 0.10,
** p < 0.05,
*** p < .01

Female Brain Drains and Women’s Rights Gaps 41
Table 7. Effects of women’s political, economic, and social rights gaps on female brain drain ratios using 1990-
2000 averages for conditioning variables.
Estimation Method
Dependent Variable
(I)
OLS
Log(FBR)
(II)
OLS
Log(FBR+1)
(III)
Heckman
Log(FBR)
(IV)
PPML
FBR
(V)
PPML
FBR>0
Women’s Political Rights Gap 0.571***
0.341***
0.579***
0.798***
0.715***
(0.148) (0.090) (0.147) (0.229) (0.219)
(Women’s Political Rights Gap)2
-0.178***
-0.113***
-0.181***
-0.276***
-0.242***
(0.037) (0.023) (0.039) (0.065) (0.061)
Women’s Economic Rights Gap 1.177***
0.789***
1.176***
0.292 -0.133
(0.260) (0.156) (0.247) (0.534) (0.528)
(Women’s Economic Rights Gap)2
-0.268***
-0.161***
-0.268***
0.003 0.085
(0.076) (0.047) (0.072) (0.180) (0.177)
Women’s Social Rights Gap 0.172 0.011 0.172 0.269 0.427**
(0.131) (0.082) (0.135) (0.211) (0.204)
(Women’s Social Rights Gap)2
-0.042 -0.012 -0.042 -0.048 -0.071
(0.029) (0.018) (0.030) (0.053) (0.052)
Origin-landlocked dummy 0.114**
0.047 0.108**
0.095 0.105
(0.046) (0.032) (0.050) (0.074) (0.070)
Origin small island dummy 0.255***
0.187***
0.250***
0.367**
0.322**
(0.092) (0.063) (0.092) (0.152) (0.148)
Origin-loggdp -0.068***
-0.018* -0.068
*** -0.083
*** -0.112
***
(0.017) (0.010) (0.016) (0.024) (0.023)
Origin-unemployment -0.025***
-0.014***
-0.025***
-0.030***
-0.029***
(0.003) (0.002) (0.003) (0.005) (0.005)
Destination-loggdp 0.006 0.048***
0.015 0.004 -0.062**
(0.018) (0.011) (0.024) (0.029) (0.027)
Destination - unemployment 0.006 0.003 0.006 -0.014* -0.017
**
(0.004) (0.003) (0.004) (0.007) (0.007)
Contiguity dummy 0.018 -0.019 0.013 -0.042 -0.016
(0.080) (0.051) (0.084) (0.132) (0.124)
Common first language dummy -0.198***
-0.121**
-0.194**
-0.298***
-0.296***
(0.071) (0.052) (0.091) (0.109) (0.110)
Common second language dummy 0.221***
0.191***
0.227**
0.337***
0.251**
(0.069) (0.051) (0.089) (0.105) (0.107)
Colony dummy -0.032 -0.006 -0.029 -0.005 -0.019
(0.069) (0.043) (0.083) (0.128) (0.127)
Log distance 0.002 -0.019 -0.002 0.002 0.033
(0.019) (0.012) (0.020) (0.032) (0.031)
Origin government instability 0.498 -0.555* 0.408 -0.805 -0.017
(0.456) (0.334) (0.498) (0.679) (0.626)
Mills Test 1.679***
(0.589)
Constant -0.594* 0.093 -0.660
* 0.717 1.497
***
(0.347) (0.219) (0.355) (0.555) (0.526)
Observations 2617 2970 3733 2970 2617
F-stat 22.724 20.832
R2
0.138 0.107 0.054 0.070
t statistics in parentheses * p < 0.10,
** p < 0.05,
*** p < .01

Female Brain Drains and Women’s Rights Gaps 42
Appendix
Table A1-Effects of women's rights gap on female brain drain ratio
Estimation Method
Dependent Variable
(I)
OLS
Log(FBR)
(II)
OLS
Log(FBR+1)
(III)
Heckman
Log(FBR)
(IV)
PPML
FBR
(V)
PPML
FBR>0
Women's Rights Gap 0.084***
0.047***
0.084***
0.093***
0.082***
(0.010) (0.005) (0.009) (0.014) (0.014)
(Women's Rights Gap)2 -0.007***
-0.004***
-0.007***
-0.009* -0.006
(0.002) (0.001) (0.002) (0.005) (0.004)
Origin-landlocked dummy 0.127***
0.060* 0.123
** 0.107 0.104
(0.046) (0.032) (0.049) (0.074) (0.070)
Origin small island dummy 0.222**
0.158**
0.217**
0.350**
0.335**
(0.090) (0.062) (0.092) (0.147) (0.145)
Origin-loggdp -0.091***
-0.034***
-0.091***
-0.102***
-0.127***
(0.016) (0.010) (0.015) (0.022) (0.022)
Origin-unemployment -0.023***
-0.013***
-0.023***
-0.027***
-0.027***
(0.003) (0.002) (0.003) (0.005) (0.005)
Destination-loggdp 0.023 0.060***
0.031 0.010 -0.061**
(0.017) (0.011) (0.024) (0.030) (0.028)
Destination - unemployment 0.004 0.001 0.004 -0.015**
-0.015**
(0.004) (0.003) (0.004) (0.006) (0.006)
Contiguity dummy 0.017 -0.016 0.013 -0.044 -0.022
(0.081) (0.051) (0.084) (0.132) (0.124)
Common first language dummy -0.191***
-0.117**
-0.187**
-0.265**
-0.258**
(0.072) (0.052) (0.091) (0.108) (0.111)
Common second language dummy 0.211***
0.189***
0.216**
0.297***
0.198*
(0.070) (0.051) (0.089) (0.105) (0.107)
Colony dummy -0.037 -0.009 -0.034 -0.002 -0.014
(0.070) (0.044) (0.084) (0.129) (0.127)
Log distance 0.010 -0.014 0.007 0.009 0.038
(0.019) (0.012) (0.020) (0.032) (0.031)
Origin government instability 0.201 -0.767**
0.121 -1.048 -0.231
(0.446) (0.327) (0.494) (0.658) (0.610)
Mills Test 1.660***
(0.614)
Constant 0.914***
1.014***
0.855***
1.872***
2.390***
(0.309) (0.201) (0.329) (0.484) (0.463)
Observations 2617 2970 3713 2970 2617
F 25.625 23.618
R2 0.125 0.093 0.049 0.063
Note: Standard errors in parentheses. * p < 0.10,
** p < 0.05,
*** p < .01
Women’s rights gap here is defined as the subtraction of the women’s rights levels in origin from the women’s
rights levels in destination.

Female Brain Drains and Women’s Rights Gaps 43
Table A2 -Effects of women's rights gap on female brain drain ratio
Estimation Method
Dependent Variable
(I)
OLS
Log(FBR)
(II)
OLS
Log(FBR+1)
(III)
Heckman
Log(FBR)
(IV)
PPML
FBR
(V)
PPML
FBR>0
Women's Rights Gap 0.176***
0.091***
0.175***
0.136***
0.136***
(0.032) (0.019) (0.030) (0.047) (0.046)
(Women's Rights Gap)2 -0.013***
-0.007***
-0.013***
-0.008 -0.008
(0.002) (0.001) (0.002) (0.005) (0.005)
Origin-landlocked dummy 0.120***
0.055* 0.114
** 0.104 0.102
(0.047) (0.033) (0.050) (0.074) (0.070)
Origin small island dummy 0.277***
0.193***
0.270***
0.417***
0.385***
(0.090) (0.062) (0.092) (0.148) (0.146)
Origin-loggdp -0.127***
-0.057***
-0.127***
-0.141***
-0.158***
(0.015) (0.009) (0.014) (0.022) (0.021)
Origin-unemployment -0.022***
-0.013***
-0.022***
-0.027***
-0.027***
(0.003) (0.002) (0.003) (0.005) (0.005)
Destination-loggdp 0.057***
0.079***
0.069***
0.047 -0.026
(0.016) (0.010) (0.023) (0.029) (0.028)
Destination - unemployment 0.009**
0.004 0.010**
-0.009 -0.010*
(0.004) (0.003) (0.004) (0.006) (0.006)
Contiguity dummy 0.046 0.002 0.040 -0.009 0.005
(0.082) (0.052) (0.085) (0.132) (0.124)
Common first language dummy -0.159**
-0.101* -0.154
* -0.242
** -0.237
**
(0.073) (0.053) (0.092) (0.108) (0.111)
Common second language dummy 0.183**
0.174***
0.190**
0.273***
0.178*
(0.071) (0.052) (0.090) (0.105) (0.108)
Colony dummy -0.042 -0.013 -0.038 -0.011 -0.022
(0.071) (0.045) (0.084) (0.130) (0.128)
Log distance 0.011 -0.014 0.007 0.013 0.043
(0.019) (0.012) (0.020) (0.032) (0.031)
Origin government instability -0.014 -0.899***
-0.125 -1.247* -0.393
(0.451) (0.329) (0.500) (0.667) (0.621)
Mills Test 2.226***
(0.622)
Constant 0.704**
0.931***
0.626* 1.664
*** 2.148
***
(0.309) (0.199) (0.326) (0.464) (0.443)
Observations 2617 2970 3713 2970 2617
F 22.162 17.716
R2 0.108 0.078 0.042 0.057
Note: Standard errors in parentheses. * p < 0.10,
** p < 0.05,
*** p < .01
Women’s rights variables here is computed based on adding women’s social, economic and political rights in their
original form which is when they vary between 0 and 3. Women’s rights gap here is defined as ratio of women’s
rights levels in destination to women’s rights levels in origin. The only country with women’s rights level of zero is
Afghanistan which was dropped to avoid unidentified values for women’s rights gap variable.