FELIX: A Static Volume 3D-Laser Display
14
FELIX: A Static Volume 3D-Laser Display Knut Langhans * , Christian Guill, Elisabeth Rieper, Klaas Oltmann, Detlef Bahr VFN – Youth Research Center of Applied Sciences – FELIX 3D Project, Stade, Germany ABSTRACT The two basic classes of volumetric displays are swept volume techniques and static volume techniques. During several years of investigations on swept volume displays within the FELIX 3D Project we learned about some significant disadvantages of rotating screens, one of them being the presence of hidden zones, and therefore started investigations on static volume displays two years ago with a new group of high school students. Systems which are able to create a space-filling imagery without any moving parts are classified as static volume displays. A static setup e.g. a transparent crystal describes the complete volume of the display and is doped with optically active ions of rare earths. These ions are excited in two steps by two intersecting IR-laser beams with different wavelengths (two-frequency, two-step upconversion) and afterwards emit visible photons. Suitable host materials are crystals, various special glasses and in future even polymers. The advantage of this approach is that there are only very little hidden zones which leads to a larger field of view and a larger viewing zone, the main disadvantage is the small size of the currently used fluoride crystals. Recently we started working with yttrium -lithium-fluoride (YLiF 4 ) crystals, which are still very small but offer bright voxels with less laser- power than necessary in CaF 2 crystals. Potential applications are for example in medical imaging, entertainment and computer aided design. Keywords: 3D display, static volume display, SOLID FELIX, two-step upconversion, medical imaging, entertainment 1. INTRODUCTION The FELIX 3D Display project team has evolved from a scientific working group of students and teachers at the Vincent Lübeck High School in Stade (Germany). The group carried out projects which mainly focused on science, environmental care and art. Topics range from the development of a “ciberbike” to multivision productions through to the development of the FELIX 3D Display. All these voluntary activities aimed at combining aspects of science and art. Main objective was to give interested young students the possibility of an up -to-date, practice-orientated education connected with the acquisitions of additional qualifications. The team projects are of a multidisciplinary, multimedia and integrated nature lasting several years. Despite minor funding resources within this non-commercial group considerable results have been achieved. For a long time people are searching for ways to display our three-dimensional world in an appropriate way: In all three physical dimensions, interactively, in real time, and in color. Two-dimensional display systems are not able to realize depth cues like perspective or hidden contours satisfyingly. Still the viewer has to interpret the given data in order to reconstruct the three-dimensional pictures. Already since the 1940s various methods have been investigated to develop a volumetric 3D display, but technology limits made the immediate implementation impossible. Recent advances in hard- and software technology provide new chances for near-term operational concepts for certain applications. The volumetric 3D display technology will provide an important option for team tasks and tasks requiring many simultaneous views of real-time or multidimensional data. Our volumetric display architecture is able to show a true three dimensional image created in a physical space with height, width and depth. It presents wireframe graphics which a group of people can walk around and examine simultaneously from nearly any orientation and without visual aides. Further to the detailed vector scanning mode, a raster scanned system is under development. * [email protected]; phone/fax ++49-4141-87146; http://www.felix3d.com; FELIX 3D Project, Entenstieg 5, 21682 Stade, Germany To a ppear in: Stereoscopic Displays and Applications XIV, proceedings of SPIE, Vol. 5006 15th International IS&T/SPIE Symposium at "Electronic Imaging: Science and Technology 2003", 20-24 January 2003 , Santa Clara, California , USA
Transcript of FELIX: A Static Volume 3D-Laser Display

FELIX: A Static Volume 3D-Laser Display
Knut Langhans*, Christian Guill, Elisabeth Rieper, Klaas Oltmann, Detlef Bahr
VFN – Youth Research Center of Applied Sciences – FELIX 3D Project, Stade, Germany
ABSTRACT
The two basic classes of volumetric displays are swept volume techniques and static volume techniques. During several years of investigations on swept volume displays within the FELIX 3D Project we learned about some significant disadvantages of rotating screens, one of them being the presence of hidden zones, and therefore started investigations on static volume displays two years ago with a new group of high school students. Systems which are able to create a space-filling imagery without any moving parts are classified as static volume displays. A static setup e.g. a transparent crystal describes the complete volume of the display and is doped with optically active ions of rare earths. These ions are excited in two steps by two intersecting IR-laser beams with different wavelengths (two-frequency, two-step upconversion) and afterwards emit visible photons. Suitable host materials are crystals, various special glasses and in future even polymers. The advantage of this approach is that there are only very little hidden zones which leads to a larger field of view and a larger viewing zone, the main disadvantage is the small size of the currently used fluoride crystals. Recently we started working with yttrium -lithium-fluoride (YLiF4) crystals, which are still very small but offer bright voxels with less laser-power than necessary in CaF 2 crystals. Potential applications are for example in medical imaging, entertainment and computer aided design. Keywords: 3D display, static volume display, SOLID FELIX, two-step upconversion, medical imaging, entertainment
1. INTRODUCTION
The FELIX 3D Display project team has evolved from a scientific working group of students and teachers at the Vincent Lübeck High School in Stade (Germany). The group carried out projects which mainly focused on science, environmental care and art. Topics range from the development of a “ciberbike” to multivision productions through to the development of the FELIX 3D Display. All these voluntary activities aimed at combining aspects of science and art. Main objective was to give interested young students the possibility of an up -to-date, practice-orientated education connected with the acquisitions of additional qualifications. The team projects are of a multidisciplinary, multimedia and integrated nature lasting several years. Despite minor funding resources within this non-commercial group considerable results have been achieved. For a long time people are searching for ways to display our three-dimensional world in an appropriate way: In all three physical dimensions, interactively, in real time, and in color. Two-dimensional display systems are not able to realize depth cues like perspective or hidden contours satisfyingly. Still the viewer has to interpret the given data in order to reconstruct the three-dimensional pictures. Already since the 1940s various methods have been investigated to develop a volumetric 3D display, but technology limits made the immediate implementation impossible. Recent advances in hard- and software technology provide new chances for near-term operational concepts for certain applications. The volumetric 3D display technology will provide an important option for team tasks and tasks requiring many simultaneous views of real-time or multidimensional data. Our volumetric display architecture is able to show a true three dimensional image created in a physical space with height, width and depth. It presents wireframe graphics which a group of people can walk around and examine simultaneously from nearly any orientation and without visual aides. Further to the detailed vector scanning mode, a raster scanned system is under development.
* [email protected]; phone/fax ++49-4141-87146; http://www.felix3d.com; FELIX 3D Project, Entenstieg 5, 21682 Stade, Germany
To appear in: Stereoscopic Displays and Applications XIV, proceedings of SPIE, Vol. 5006 15th International IS&T/SPIE Symposium at "Electronic Imaging: Science and Technology 2003", 20-24 January 2003 , Santa Clara, California , USA

In the following sections we will illustrate the past and present developments in the field of volumetric imaging and static volume displays by selecting representative examples for different approaches. This will be followed by an explanation of the specific advantages and disadvantages of static volume displays in comparison to swept volume displays and a discussion of different host materials. Finally we will introduce our work on static volume displays and our SOLID FELIX 3D Display with its special properties as a typical representative of the class of static volume displays.
2. BASIC CONCEPTS OF VOLUMETRIC IMAGING
To produce volumetric images, it is necessary to create a display volume within which the image may be drawn. A number of attempts to achieve this goal have been made in several past and current development efforts. Generally these attempts can be divided into two basic categories:
• static volume displays,
• swept volume displays.
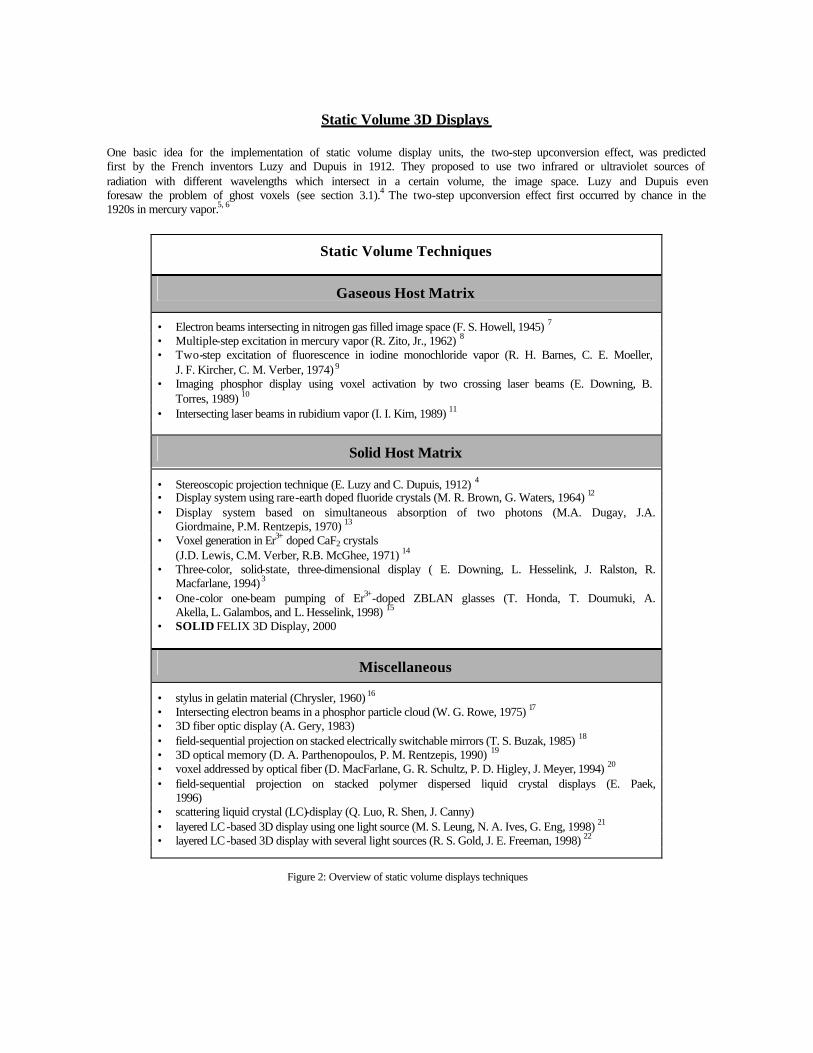
Swept volume displays have been discussed extensively in earlier FELIX publications1, 2 and will therefore not be recognized in this paper. Holographic displays will not be discussed, too, because they represent a class of their own. Figure 2 gives an overview of the static volume concepts with examples, which do not claim to be complete. Some approaches of related developments will be described in more detail in the following sections. The table contains completely theoretical works which either describe the principles of volumetric image generation in a static setup or introduce innovative but not realized display concepts as well as experimental displays which have been realized to a certain degree. The most common principle used to create 3D pictures in a static setup is the two-frequency, two-step (TFTS) upconversion technique. It is based on the absorption of two photons (normally invisible IR photons) by optically active atoms, molecules or ions. The light sources used to excite the active material are monochrome and of different wavelengths. A first photon with wavelength ?1 excites the ion or molecule to an intermediate energy level E1 with lifetime t 2, a photon of the second light source (wavelength ?2) then excites the dopant to the higher level E2. The decay back to the ground state goes along with the emission of a visible photon – a point of light is created within a doped display volume. Or speaking in terms of volumetric imaging: A volume pixel (or voxel) is displayed. (Figure 1) A related principle of voxel generation in a static setup is the simultaneous two-photon absorption process. Voxels are activated by two coherent beams of radiation without an intermediate energy level. These wavelengths have to be chosen carefully, as identical ones may cause visible light not only at the intersection point, but along the lasers’ paths, too.
Figure 1: Two-frequency, two -step (TFTS) upconversion technique 3
Static Volume 3D Displays
One basic idea for the implementation of static volume display units, the two-step upconversion effect, was predicted first by the French inventors Luzy and Dupuis in 1912. They proposed to use two infrared or ultraviolet sources of radiation with different wavelengths which intersect in a certain volume, the image space. Luzy and Dupuis even foresaw the problem of ghost voxels (see section 3.1).4 The two-step upconversion effect first occurred by chance in the 1920s in mercury vapor.5, 6
Static Volume Techniques
Gaseous Host Matrix
• Electron beams intersecting in nitrogen gas filled image space (F. S. Howell, 1945) 7
• Multiple-step excitation in mercury vapor (R. Zito, Jr., 1962) 8 • Two-step excitation of fluorescence in iodine monochloride vapor (R. H. Barnes, C. E. Moeller, J. F. Kircher, C. M. Verber, 1974) 9 • Imaging phosphor display using voxel activation by two crossing laser beams (E. Downing, B. Torres, 1989) 10 • Intersecting laser beams in rubidium vapor (I. I. Kim, 1989) 11
Solid Host Matrix
• Stereoscopic projection technique (E. Luzy and C. Dupuis, 1912) 4
• Display system using rare-earth doped fluoride crystals (M. R. Brown, G. Waters, 1964) 12 • Display system based on simultaneous absorption of two photons (M.A. Dugay, J.A. Giordmaine, P.M. Rentzepis, 1970) 13 • Voxel generation in Er3+ doped CaF2 crystals (J.D. Lewis, C.M. Verber, R.B. McGhee, 1971) 14
• Three-color, solid-state, three-dimensional display ( E. Downing, L. Hesselink, J. Ralston, R. Macfarlane, 1994) 3
• One-color one-beam pumping of Er3+-doped ZBLAN glasses (T. Honda, T. Doumuki, A. Akella, L. Galambos, and L. Hesselink, 1998) 15 • SOLID FELIX 3D Display, 2000
Miscellaneous
• stylus in gelatin material (Chrysler, 1960) 16 • Intersecting electron beams in a phosphor particle cloud (W. G. Rowe, 1975) 17 • 3D fiber optic display (A. Gery, 1983) • field-sequential projection on stacked electrically switchable mirrors (T. S. Buzak, 1985) 18 • 3D optical memory (D. A. Parthenopoulos, P. M. Rentzepis, 1990) 19 • voxel addressed by optical fiber (D. MacFarlane, G. R. Schultz, P. D. Higley, J. Meyer, 1994) 20 • field-sequential projection on stacked polymer dispersed liquid crystal displays (E. Paek, 1996) • scattering liquid crystal (LC)-display (Q. Luo, R. Shen, J. Canny)
• layered LC-based 3D display using one light source (M. S. Leung, N. A. Ives, G. Eng, 1998) 21
• layered LC-based 3D display with several light sources (R. S. Gold, J. E. Freeman, 1998) 22
Figure 2: Overview of static volume displays techniques

2.1 Displays using Gaseous Host Material In 1945 F. S. Howell filed a patent about the realization of a 3D display using two electron beams as excitation source intersecting orthogonally within a nitrogen filled gas tube (Figure 3). Controlled changes of the electrons’ velocity and intensity cause visible light.7
Figure 3: Electron beams intersecting in a gas -filled
volume (F. S. Howell, 1945)7 Figure 4: Intersecting light sources in mercury vapor
(R. Zito, 1962)8 As one of the first, Ralph Zito Jr. studied a multiple-step excitation process in a gas-filled volume for the possible application to a three-dimensional display of data. His enclosure was filled with a mixture of mercury vapor as the primary absorbing medium and nitrogen gas. Two light sources (wavelengths: 253.7 nm and 404.7 nm) intersect the volume and cause the Hg vapor to radiate at a local region in space with a visible (green) wavelength of 546.1 nm (Figure 4). The energy-level diagram is a little more complicated than described in the beginning of this section. Excitation 1 raises the normal ground-stat e 61S0 atoms to the first resonant 63P1 level. Collisions with diatomic nitrogen lead to the metastable-state 63P0 Hg atoms, which are afterwards excited by the 404.7 nm line to the 73P1 level. The green fluorescence is produced by the spontaneous decay to the lower 63P2 level. This means the visible decay does not lead back to the ground state as it does in most of today’s display approaches.8
A group around Barnes examined two-step excitation in iodine monochloride vapor using two synchronized tunable laser sources (1974). While Lewis et al. and Zito have investigated two-step excitation in single atoms or ions, this group was the first to do measurements of sequential excitation in diatomic molecules. The ICl was purified by vacuum distillation and sealed in a quartz cell with windows arranged in a way that the two laser beams could enter from opposite directions. Fluorescence was viewed in a direction perpendicular to the line of excitation. Though the process of excitation is based on two-step excitation involving an intermediate state, there is an important difference to the other concepts described: Fluorescence was only observed from transitions returning from the second excited state to the intermediate state. Two-step excitation was only used to populate forbidden electronic states in gas molecules by two successive allowed transitions. As this work was never meant to lead to a 3D display -photochemical applications had been standing in the center of interest- the used wavelength were mainly in the visible area (between 410 nm and 800 nm).9 In 1989, Kim et al. realized a volumetric 3D display based on two-step upconversion in rubidium vapor. Two low power diode laser beams (one red laser at 630 nm and one near-IR laser at 780 nm) intersect orthogonally in an enclosure containing the rubidium vapor. In the small intersection volume of the two beams (between 0.5 and 1 cubic mm) the rubidium atoms first undergo the excitation from the 780 nm laser (5S1/2 to 5P3/2) and are then excited by the 630 nm laser (5P3/2 to 6D 5/2) which results in isotropical red fluorescence from the intersection point after a lifetime of 244 nsec. As the human eye has very low sensitivity at the IR-wavelength 780 nm, no fluorescence can be seen from the line excited by this laser. Although the second wavelength is part of the visible spectrum, the laser beam cannot be seen as it moves too fast and refreshes the three dimensional picture faster than the human eye can recognize the changes. The picture seems to be steady if it is redrawn 15 times a second or more often. Rubidium as the material meant to be

excited was chosen because the required wavelength corresponded to currently available diode lasers. The limited speed of the mechanical scanners used in the apparatus (Figures 5, 6) lead to a low complexity of the three dimensional images, but with higher power lasers and faster acousto-optical scanners this display should be able to draw images that are detailed enough to make the display useful for applications in air traffic control or medical imaging. With the lasers tuned to the exact transition wavelengths an extended voxel (red spot) with maximum brightness is drawn, a very localized spot with less brightness can be achieved with the laser wavelengths being slightly tuned of the transition wavelengths.11
Figure 5: Intersecting laser beams in Rubidium vapor (Korevaar et al., 1989)23
Figure 6: Experimental setup: chamber filled with rubidium vapor (Kim et al., 1989)11
2.2 Displays with Solid Host Matrix
In 1964 M. R. Brown et al. filed the first patent for a 3D display based upon two photon upconversion processes (Figure 7). He proposes several fluoride crystals containing between 0.05 and 25% of trivalent thulium, erbium or holmium ions as useable. In his apparatus voxels appear in the region of intersection between a light beam (movable in X and Y direction) and a fan-shaped light plane (movable in Z direction). Thereby the angle stays nearly constant, so that the shape of voxels will be essentially invariant with position.12
Figure 7: Light beam crossing a light plane (Brown et al., 1964)12
In 1967 Dugay et al. described a 3D display using the simultaneous absorption of two-photon. Especially their voxel activation strategy is notable. Two collinear lasers cross the display volume in different directions. The first laser encodes the voxel information, which means, whether a voxel is to be activated or not. The second laser interrogates this information and executes them.13 In 1971 Lewis et al. developed a 3D display based upon two-frequency, two-step upconversion. The display volume is described by a 2-cm CaF 2 crystal cube doped with the rare earth element erbium. Two orthogonally arranged filtered

xenon lamps are the excitation source (Figure 8). By pumping the erbium with 1540 nm and 830 nm a green output (540 nm) is emitted. As the second beam is reflected through the crystal cube, it crosses the first beam twice and thereby two voxels appear. The spots have a size of 2 mm in diameter and a measured output of 2·10-8 W radiated isotropically, which means that they are clearly visible in a dimly lit room. Even though the physical principle was realized, this display was not able to show complex pictures or moving points. The main problem was the lack of suitable excitation sources and materials.14
Figure 8: Principle of excitation (Lewis et al., 1971)14 Figure 9: Scanning technique proposed by Downing et al. (1995)24
In 1994 a group around Elizabeth Downing improved this type of 3D display (Figures 9, 10). In this sense the display volume consists of rare earth doped heavy metal fluoride glass; the excitation source are three pairs of commercially available infrared lasers. In order to achieve a three color display, Downing used three different dopants, Praseodymium for red, Thulium for blue and Erbium for green. As the mixing of the three rare earth elements causes many problems with their energy levels, thin layers of 100 to 500 µm each single doped were laminated together with index-matching optical adhesive. The concentration of the dopants is around 0.5 mol%, which maximizes voxel brightness. Higher concentrations lead to increased single frequency upconversion which draws unwanted visible lines into the display volume. Each dopant is activated by a suitable wavelength combination of intersecting lasers. By using computer controlled scanners and mirrors, voxels can be ‘turned on’ everywhere inside the display volume and thus form complex structures. As voxels disappear shortly after removing the excitation source, whole pictures have to be refreshed regularly. A rate of 30 to 100 Hz avoids flickers.3
Figure 10: 3D-image generated in a ZBLAN cube
(Downing et al.)25 Figure 11: Excitation path of the focused laser beam in ZBLAN
(Honda et al., 1998)15 In 1998 Honda investigated the quantum efficiency for one frequency two step upconversion in 0.2 mol% Erbium doped ZBLAN glass. This alternative excitation method uses one focused laser beam at a wavelength of 979 nm, which matches both first and second energy level. Figure 11 shows the IR fluorescence, which is caused by one step excitation along the laser beam’s path, and the green emission, which appears only at the beam’s waist, the point with the largest intensity.15

2.3 Miscellaneous
D. A. Parthenopoulos and P. M. Rentzepis used similar physical principles in order to realize a 3D optical memory (1990). Although this display is not considered to show pictures, it has several parallels to usual 3D displays. The hardware consists of two photochromic materials doped in polymer systems. Two laser beams one at 532nm and the other at 1064nm intersect with different powers within this polymer. Recording information is achieved by two photon absorption in the polymer systems that transforms the molecule to the visibly absorbing form. Reading is realized by two-photon-induced fluorescence.19 D. L. MacFarlane built a quite different true 3D display in 1994. The display has a volume of 300 cm³ and is able to emit 11*11*5 monochrome voxels. Transparent optical fibers address each single voxel within several layers of planar glass microsheets (Figures 12, 13). The fibers are made of an UV-curved optical resin doped with an organic dye. In order to avoid Fresnel reflections, MacFarlane filled the gaps between the voxels with an index-matching liquid medium. Light excitation sources like nitrogen pumped dye lasers or Hg lamps were tested successfully. A mayor problem of this display is to find glasses, fibers and filling mediums with suiting indexes of reflections. However, a mayor advantage is its ability to switch all voxels at the same time, as the fibers are pumped via several flat arrays of liquid crystals outside the display.20
Figure 12: Light pyramid (MacFarlane et al., 1994)20 Figure 13: Transparent optical fibers in glass microsheets addressing single voxels (MacFarlane et al., 1994)26
A similar display system was invented by Leung et al. He proposed to use a stack of LCD panels as display volume. An image is cut in several slices, which can be represented by the planar LCD Panels. Activating voxels means darken them by a voltage, whereas passive voxels stay transparent. Because of the polarization of light, a gray scale may be achieved.21 Another tricky display has been demonstrated by Gold and Freeman. Several layers of optical shutters form the display volume. Each shutter includes layers of liquid crystals and may be switched between transparent and translucent state. Again an image is divided into several planes, which are projected by a light source onto the optical shutters. A timing scheme grants that the moment a 2D picture is send to its layer, this shutter is switched to translucent state, whereas all others stay transparent. The form of the optical shutters may be formed to suit best its application, for example a hemispherical or planar face. A single-layer prototype has been fabricated showing high-quality full-color images.22
Besides, early approaches from the beginning of the 1960s proposed the mechanical insertion, support, and translation of objects or particles in a volume. E.g. a stylus which can write in three colors was suspended in a tank of transparent gelatin. The servo-driven stylus moves through the gelatin, leaving a colored trace (Figure 14). This concept is limited to low data rates but provides history or track, since the unit itself handles integration and storage.16 Actual stereo-lithography processes for rapid prototyping purposes may be seen as a modern application of this technology.

Figure 14: Stylus leaving trace in transparent gelatin (Chrysler, 1960)16
3. CHARCTERISTICS OF STATIC VOLUME DISPLAYS
3.1 The Ghost Voxel Problem It is a specific problem of static volume displays using the TFTS upconversion technique that ghost voxels might occur. This unwanted effect happens when the lifetime t2 of the first excited state is long in comparison to the total voxel activation time. Though voxels are only created in the point of intersection of the two laser beams, the dopant is excited all along the first beams path to the first state. The IR-photon emitting decay of this energy state leaves a significant number of potential fluorescence centers in this intermediate state if its half-life is too long. If two voxels are meant to be created in the same plane of the beams as shown in figure 15, the second beam will cross the previous path of beam 1 once again and will excite enough ions to the second energy level that a weak ghost voxel may be recognized. (In the point where beam 1 crosses the previous path of beam 2 no ghost voxel will be excited, as beam 2 does not excite the dopant to an intermediate level.)
Figure 15: Ghost voxel excitation27
It is not impossible to avoid this effect as it only takes place when two voxels which are activated shortly one after the other are coplanar with the beam sources. This can be avoided by a computer-optimized voxel activation order which regards the co planarity of the addressed voxels, but the demands on the software and the 3D interface are high.27
Unwanted voxels may also be generated easily by unwanted beam intersection if the control-software was not programmed carefully.
3.2 Hidden zones in static volume displays One serious problem of swept volume displays using rotating helical surfaces is the existence of extended hidden zones. In these parts of the display it is either not possible to create pictures because they are not addressable by the imaging beam (dead zones) or the created pictures cannot be seen from every point around the display because the image is hidden from the viewer by the axis or parts of the screen (occlusion zones). In static volume displays there are no occlusion zones as the display volume completely consists of a homogeneous, transparent material. But there are some kinds of dead zones existing. It is very likely that the beams do not intersect

perfectly when scanned through the volume. Shape, size and brightness of the voxels will therefore be varying and it is even possible that the beams do not intersect at all. The reason for this effect is that the two or more beams have an uncertainty of position caused by the deflection system. Furthermore the number of addressable voxel positions is limited by the discrete number of angular positions of the beams. The problem of dead zones does not occur in display systems where one beam is split up to a complete light plane by collimating lenses. In this case there will always be an intersection of the light beam with the plane and the voxel’s shape will stay constant, but the ability of creating real three-dimensional pictures with depth sharpness is reduced.
3.3 Single Frequency and Double Frequency Upconversion in Erbium As the rare earths have one of the most complicated spectra of the elements, they have been neglected for long time. Their outer electrons form a non-regular scheme of low lying energy levels, so that the transitions in between give a many-line spectrum.28 Unfortunately, the wavelengths of absorption and emission depend on different host materials. Figure 16 shows a simplified model of im portant energy levels for Er3+ doped in an YLiF4 crystal and ZBLAN glass.
Figure 16: Simplified energy level for two frequency excitation (left) and one frequency excitation (right)
Two main TSTF upconversions are possible for erbium. One leads to green light, the other to red. As non emissive transitions (phonon) from the 4S3/2 energy state to the 4F9/2 appear, every green excitation goes together with some red light, which is usually under the visible threshold. The inverse does not happen.14
The alternative pump method using only one focused beam at 979 nm offers some advantages. As there are no two crossing beams, the beam’s diameter can be chosen to be smaller. Therefore the intensity in the beam’s waist is higher by two orders of magnitude for the same pump power as the two beam excitation scheme.15
3.4 Materials
Suitable materials for display applications must provide several properties. In their ground state they have to be transparent and in the exited state they have to emit visible light. The inner structure should be homogenous, and by this means emit photons isotropic. Furthermore the display volume needs a refraction index similar to air, as otherwise pictures will become distorted. Some materials have yet been examined for their feasibility as display volume. Gas: This display host material is easy to produce and fills every given shape. In addition to this, its refraction index difference to air is rather low. Nevertheless, most gases are poisonous and have to be kept in chambers with a higher pressure than air. Usually these chambers have only some small windows, so that the viewing zone is limited. Crystals: Because crystals are well known as laser host materials, first attempts to create real solid displays used them. Fluoride crystals are characterized by low phonon energies (YLiF 4: 442 – 460/cm) and have a refraction index of round about 1.5. Unfortunately, it is difficult to manufacture them in large sizes, which will set certain limits for display application. Furthermore, many crystals like our YLiF4 have two different polarizations, and therefore restrict the pump directions.29

Heavy metal fluoride glasses: Originally developed for fiber laser and optical amplifier applications, they became useful in display technologies. These glasses have similar phonon energies like crystals (>500/cm), are isotropic, have no polarizations and may be cast into several different display shapes. ElectroActivePolymers: EAP represent a new and promising field of research worldwide. The electronic properties of these polymers can be controllable and reproducible changed. Light emitting polymers for flexible displays are subject of modern science.
4. SOLID FELIX 3D LASER DISPLAY
4.1 System Architecture
The prototype system introduced in this section is based on investigations made by high school students at the Youth Research Center in Stade. During several years of investigations on swept volume displays within the FELIX 3D Project30, 31 (Figure 17) we learned about some significant disadvantages of rotating screens, one of them being the presence of hidden zones. We therefore started investigations on static volume displays two years ago with the goal to construct a prototype of new projection display being ideal, inertial free, free addressable, flicker free, bright enough to be seen in ambient room light and using TFTS upconversion.
Figure 17: Three dimensional image of a human
skeleton created in the FELIX 3D Display1 Figure 18 :System Architecture of the SOLIDFELIX 3D Display with
intersecting laser beams in an YLiF4 crystal The investigated prototype of our solid state display, called SOLID FELIX, is a compact, light and easy to transport system. A crystal made of YLiF 4 represents the core element of the display. For the image generation, two laser projection systems are used, one with an IR laser of 840 nm wavelength, the other with an IR laser of 1480 nm wavelength. Furthermore each projection system consists of an electro-optical modulation unit and a two-dimensional XZ respectively YZ scanner and are controlled by a PC with 3D interface and 3D software (Figure 18). At the point were the two invisible laser beams intersect and hit an Er3+ ion the energy generated is sufficient enough to create a visible point of light, a so called voxel. Moving the spot rapidly within the volume of the crystal allows 3D images to be drawn. This is realized by moving the XZ and YZ scanners mirrors simultaneously and fast enough in respect to refresh rate of the picture and lifetime of the excited energy state E2 of the activated Er3+ ions. It has to be regarded that faster scanning makes the ghost voxel problem become more relevant. Computer controlled deflection and modulation of the intersecting laser beam allows all X, Y, Z coordinates within the crystal to be addressed. To create three-dimensional objects in the display volume, all imaging components have to be synchronized by computer via a specially designed 3D interface. The development of the new software benefits from the former experiences with CAD manipulating software. Therefore we work on a software written in C++ which is able to handle the drawing exchange format (DXF) for an easy import of existing 3D models.

4.2 Scanning techniques The following different scanning techniques are under investigation:
• 3D vector graphic
• 3D raster graphic
Employing vector graphics, spatial images are created which consist of polygon lines instead of single voxels. Objects are drawn as a combination of daisy-chained lines into the crystal cube. Two pairs of closed loop galvanometric scanners, each with an orthogonal arrangement of the mirrors, allow vectorized control in XZ respectively YZ direction. A disadvantage of galvanometric scanners is the mechanical inertia limiting the number of lines that can be displayed. Despite these disadvantages galvanometric scanners are comparably cheap and easy to handle. First a vector scanning method was implemented. Each pair of scanners is driven by a digital to analog converter. Scanner control and spatial image generation is performed by a specially developed software written in turbo pascal. Any point of in the given display volume may be addressed in this way. As a result 3D wire frame graphics are presented which a group of people can walk around and examine from any orientation simultaneously without any visual aids. Further to the detailed vector scanning mode, a raster scanned system is under development. Goal of this method is the generation of a spatial voxel matrix. In this way rastered three-dimensional images are created, complementary to the usual flat raster images on common TV sets or computer monitors.
4.3 Results As the structure of the host material is one important factor for voxel brightness, we tested several fluoride crystals with the support of the Institute for Laser Physics of the University of Hamburg. In order to achieve TFTS upconversion, we used a diode laser with a wavelength in between 1480 and 1490 nm and a titan-sapphire laser at 850 nm. We tested the following host materials: CaF2 (1% Erbium, 3% Holmium), YLiF4 (1% Erbium) and BaYF4 (1%Erbium). Problems occurred with single frequency upconversion, which led to two visible lines within the crystal. When decreasing the focus of both lasers, these lines could be eliminated but as a consequence this led to decreasing voxel sharpness. Furthermore we observed that YLiF4 emits around ten times more visible photons than CaF2 which means that YLiF4 has higher quantum efficiency. BaYF4 also has higher quantum efficiency but because of its more complicated structure we concentrated our work on YLiF4. We also decided to decrease the dopant’s concentration (from 1.0 mol% to 0.5 mol%) so that the single frequency upconversion effect could be diminished.
Figure 19: Excited state absorption of YLiF4 (1% erbium)32
The first absorption energy level (4I13/2) is several tens of nanometer wide, from around 1470 nm to 1510 nm. We chose a diode laser at 1480 nm. The second energy gap from 4I13/2 to 4S3/2 is much smaller, which can be seen in Figure 19. In order to achieve maximal quantum efficiency the processing temperature of the diode laser has to be stabilized to get a constant wavelength of 850 nm.32 The green voxels we excited successfully in this way were clearly visible in a dimly lit room.

4.4 Applications
Real true volumetric displays have several advantages for the working process. In contrast to available virtual reality systems or common flat screens displaying 3D images, the presented image in volumetric displays is visible from nearly any angle in space. The users can walk around the 3D monitor to have an individual view of the created image; they can communicate face to face and cooperate in a natural way. The portrayed objects appear transparent since the light emitted by voxels cannot be hidden from the viewer by foreground voxels. This limits practical applications to fields where the objects of interest are easily iconized or represented by wireframe models. Visionary examples of possible applications for our SOLID FELIX 3D Display are:
• Medical Imaging: Display of a human skeleton in three dimensions (Figure 20)
• Entertainment: Small games which benefit from computerized visualization (Figure 21)
Figure 20:Design study of the SOLID FELIX display Figure 21: Visionary entertaining application for our SOLID FELIX
3D display
5. Conclusions Another attempt of realizing a volumetric 3D laser display has been undertaken by the FELIX 3D Project team. In contrast to earlier works which mainly based on swept volume techniques our new group of high school students investigated static volume displays. The principle of this class of volumetric displays is already known since the beginning of the 20th century and first attempts to realize a display based on two-step upconversion date to the 1940s. At that time the experimental approaches failed to come to satisfactory operational stage due to technical restrictions. Even today, despite rapid technology advances, much is left to be optimized; there are still possibilities as well as necessities of investigations and improvements referring static volume displays. The demonstration system described in this paper refers to some of the proposed volumetric techniques extended by new ideas. Our new SOLID FELIX 3D Display is presented as a light and compact system using of-the-shelve components whenever possible. The apparatus is simple in comparison to other approaches. The software is self-developed and standardized so that it can be implemented easily. The immediate goal of future development is to improve some technical parameters e.g. the host material and the dopants. YLiF4 crystals had been a very promising approach as they are relatively easy to produce and suffer less than other crystals from phonon energy losses but due to their small size they will only see limited action in future. The improvement of the scanning- and controlling system is the second main point of interest of our group.

Acknowledgements
We thank Prof. Dr. Ernst Heumann and Dr. Klaus Petermann (Institute for Laser Physics, University of Hamburg), whose personal engagement was invaluable, for their help, cooperation, and for supporting us with hardware needed for our research and the development of the SOLID FELIX display. We also thank Prof. Dr. Dietmar Müller, Ralf Seidel and Heiko Kiessling (Faculty of Electrical Engineering and Information Technology at the Chemnitz University of Technology) for developing special electronics and software for our 3D interface and Hermann Neumann (2. Physical Institute, University of Stuttgart) for providing us a display crystal. We also acknowledge Y. Oldenburg of GSI LUMONICS for technical assistance with galvanometric scanners and drivers, Thomas Engel of LINOS-Photonics GmbH for special modulators, Jan Brune of LISA for hardware needed and Duncan MacFarlane for providing us images of his display.
References
1. K. Langhans, D. Bahr, D. Bezecny, D. Homann, K. Oltmann, K. Oltmann, C. Guill, E. Rieper, G. Ardey, “FELIX 3D Display: An Interactive Tool for Volumetric Imaging”, Proceedings of SPIE, Vol. 4660, San Jose, CA, 2002.
2. K. Langhans, D. Bezecny, D. Homann, D. Bahr, C. Vogt, C. Blohm, and K.-H. Scharschmidt, “New portable FELX 3D display”, Projection Displays IV, Proceedings of SPIE, Vol. 3296, San Jose, CA, 1998.
3. E. Downing, L. Hesselink, J. Ralston, R. Macfarlane, “A Three-Color, Solid-State, Three-Dimensional Display”, Science, Vol. 273, pp. 1185-1189, 1996.
4. E. Luzy, C. Dupuis, “Procédé pour obtenir des projections en relief”, French Patent (Brevet d`invention) 461,600, 1914.
5. C. Fuchtbauer, “Excitation of mercury spectral lines”, Z. Phys., 21, pp. 635-638, 1920. 6. R. W. Wood, “Controlled orbital transfer of electrons in optically excited mercury atoms”, Proc. R. Soc. London,
106, pp 679-694, 1924. 7. F. S. Howell, “Three-dimensional indicator tube and circuit therefore”, U.S. patent 2,604,607, 1952. 8. Ralph Zito, Jr., “Rate Analysis of Multiple-Step Excitation in Mercury Vapor”, Journal of Applied Physics, Volume
34, Number 5, pp. 1535-1543, 1963. 9. R. H. Barnes, C. E. Moeller, J. F. Kircher and C. M. Verber, “Two-step excitation of fluorescence in iodine
monochloride vapor“, Applied Physics Letters, Volume 24, Number12, pp 610-612, 1974. 10. E. Downing, B. Torres, “Three dimensional image generating apparatus having a phosphor chamber”, U.S. patent
4,870,485, 1989. 11. I. I. Kim, E. Korevaar, and H. Hakakha, “Three-dimensional volumetric display in rubidium vapor”, Proceedings of
SPIE, Vol. 2650, pp. 274-284, San Jose, CA, 1996. 12. M. R. Brown and G. S. Waters, “Three-Dimensional Visual Display Systems”, U.S. patent 3,474,248, 1969. 13. M.A. Dugay, J.A. Giordmaine, P.M. Rentzepis, “Display system using two-photon fluorescent materials”, U.S.
Patent 3,541,542, 1970. 14. J.D. Lewis, C.M. Verber, R.B. McGhee , „A True Three-Dimensional Display“, IEEE Transaction on electron
devices, Vol. ED-18, No. 9, pp.724-732, 1971. 15. T. Honda, T. Doumuki, A. Akella, L. Galambos, L. Hesselink, “One-color one beam pumping of Er(3+)-doped
ZBLAN glasses for a three-dimensional two-step excitation display”, Optics Letters, Vol. 23, No.14, pp. 108-110, 1998.
16. N.N., “Flight Patterns Displayed in 3-D”, Aviation Week, p.85, May, 1960. 17. W. G. Rowe, “Three-dimensional display devices”, U.S. patent 4,063,233, 1977. 18. T. S. Buzak, “A Field-Sequential Discrete-Depth-Plane Three-Dimensional Display“, Society for Information
Display, SID 85 Digest, pp. 345-347, 1985. 19. D.A. Parthenopoulos, P.M. Rentzepis, “Two-photon volume information storage in doped polymer systems”,
Journal of Applied Physics, 68 (11), pp. 5814-5818, 1990. 20. D. L. MacFarlane, “Volumetric three-dimensional display”, Appl. Optics, Vol. 33, No.31, pp. 7453-7457, 1994. 21. M. S. Leung, N. A. Ives, G. Eng, “Three-dimensional real-image volumetric display system and method”, U.S.
patent 5,745,197, 1998.

22. R.S. Gold, J.E. Freeman, “Layered display system and method for volumetric presentation”, U.S. patent 5,813,742, 1998.
23. E. J. Korevaar, B. Spivey, “Three dimensional display apparatus”, U.S. patent 4,881,068, 1989. 24. E. A. Downing, A. Akella, L. Hesselink, R. M. Macfarlane, “A Laser Diode Driven Solid-State Three-Dimensional
Display”, Stanford, 1995. 25. E. A. Downing, www.3DTL.com 26. J. Wallace, “Waveguides show depth”, Laser Focus World, pp 18-19, April 2000 27. A. J. Schwarz, B. G. Blundell, “Considerations regarding voxel brightness in volumetric displays utilizing two-step
excitation process”, Optical Engineering, Vol. 32, No. 11, pp 2818-2823, 1993 28. G.H. Dieke, H.M. Crosswhite, “The spectra of the Doubly und Triply Ionized Rare Earth”, Applied Optics, Vol. 2,
No. 7, p. 675, 1963. 29. Patrick E.-A. Möbert, “Er3+: YLiF Upconversion Lasers”, doctoral thesis, University of Hamburg, 1998. 30. D. Bahr, K. Langhans, D. Bezecny, D. Homann, and C. Vogt, “FELIX: a volumetric 3D imaging technique”, New
Image Processing Techniques and Applications, Proceedings of SPIE, Vol. 3101, pp. 202-210, Munich, 1997. 31. K. Langhans and D. Bahr, “Science Education in Action: Germany’s FELIX Project”, Journal of Laser
Applications, Vol. 8, No. 5, pp. 221-224, 1996. 32. P.E.-A. Moebert, E. Heumann, G. Huber, B. H. T. Chai, “540mW of blue output power at 425nm generated by
intracavity frequency doubling an upconversion-pumped Er3+:YLiF4 laser”, Appl. Phys. Lett., Vol. 73, No. 2, 1998.