“Feels Like Home” MCB Tour - showme.org · 6/12/2014 1 “Feels Like Home” MCB Tour March,...
10
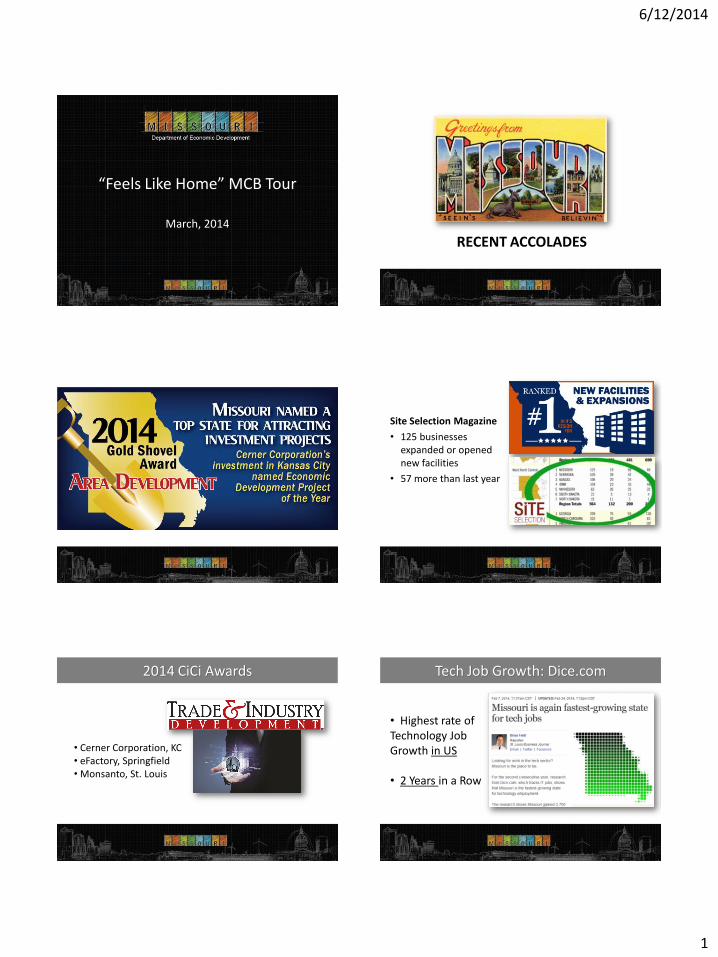
6/12/2014 1 “Feels Like Home” MCB Tour March, 2014 RECENT ACCOLADES Site Selection Magazine • 125 businesses expanded or opened new facilities • 57 more than last year 2014 CiCi Awards • Cerner Corporation, KC • eFactory, Springfield • Monsanto, St. Louis Tech Job Growth: Dice.com • Highest rate of Technology Job Growth in US • 2 Years in a Row
Transcript of “Feels Like Home” MCB Tour - showme.org · 6/12/2014 1 “Feels Like Home” MCB Tour March,...
6/12/2014
1
“Feels Like Home” MCB Tour
March, 2014
RECENT ACCOLADES
Site Selection Magazine
• 125 businesses expanded or opened new facilities
• 57 more than last year
2014 CiCi Awards
• Cerner Corporation, KC • eFactory, Springfield • Monsanto, St. Louis
Tech Job Growth: Dice.com
• Highest rate of Technology Job Growth in US • 2 Years in a Row

6/12/2014
2
OPENING SESSION
TIP Strategies
Consultant
Jon Roberts
4-Person Scramble Wednesday, Sept. 3, 1pm
$75/player Tan-Tar-A Resort
Skills-Based Volunteering and Pro-Bono
Wednesday, Sept. 3, 2-4pm Free
Tan-Tar-A Resort
Tour Summary
• Why did we do it?
• What did we accomplish?
• What did we learn?
• How are we going to follow up?
MCB Conference, Sept. 2013
Bragg City
Bragg City

6/12/2014
3
Bragg City
• Population:
– City: • 1960: 318
• 2012: 148
– Zip Code: • 1960: 2,876
• 2012: 982
• 1960:
⁻ Cotton Gin
⁻ Schools
⁻ Trains
⁻ Stores
⁻ Hotel
⁻ Churches
What happened?
• Early-1960s:
– Ag mechanization/technology.
• About 10x less labor needed.
– Trains cease operations.
– School merged with Kennett. • Closed Bragg City schools.
• Early 1980s:
– Gin closes.
10,000
15,000
20,000
25,000
30,000
35,000
40,000
45,000
50,000
1940 1950 1960 1970 1980 1990 2000 2010 2013 est.
2020 Proj.
2030 Proj.
Axi
s Ti
tle
Bootheel Population, 1940-2030
Dunklin Pemiscot Co. New Madrid
Purpose of the Tour
• Attempt to improve the economy of the communities.
• Learn about the problems of rural economic development.
• Develop strategies to improve rural ED.
Tour Partners Tour Communities

6/12/2014
4
Windsor, Henry Co.
• Population: 2,863 – (-8% past 12 years)
• Economic Drivers: – Agriculture
– Bedroom to Clinton, Warrensburg and Sedalia.
• Key Issues: – Declining business activity and
population.
– Dilapidated buildings.
Steelville, Crawford Co.
• Population: 1,682 – +15%, past 12 yrs.
• Economic Drivers: – Tourism (rivers) – Manufacturing
• Key Issues: – Tourism marketing
cooperation. – Manufacturing growth. – Streets.
Clinton, Henry Co.
• Population: 9,043 – (-3% past 12 years)
• Economic Drivers: – Manufacturing
– Agriculture
– Tourism
• Key Issues: – Manufacturing growth.
– Growing entrepreneurs.
Albany, Gentry Co.
• Population: 1,732 – (-12% past 12 years)
• Economic Drivers: – Agriculture
• Issues: – Manufacturing growth – Growing entrepreneurs – Infrastructure – Dilapidated buildings – Regional cooperation &
marketing
Grant City, Worth Co.
• Population: 821 – (-13% in 12 years)
• Economic Drivers: – Agriculture
• Key Issues: – Business/entrep. growth
– Infrastructure
– Dilapidated buildings
– Regional cooperation
Jamesport, Daviess Co.
• Population: 509 – +1% in 12 years.
• Economic Drivers: – Agriculture
– Tourism
• Key Issues: – Regional tourism
– Dilapidated buildings

6/12/2014
5
What Did We Learn?
• The communities don’t lack for effort, leadership, or intelligence.
– Some get along with each other better than others.
– The activities of planning don’t automatically result in significant change.
• Communities don’t seem interested in attempting regional collaboration.
– Local services, such as code enforcement.
– ED and Tourism promotion.
What Did We Learn?
• Need: Demolition of dilapidated buildings.
– Costly; Lengthy; Controversial.
• Need: Infrastructure improvements.
– Rates/taxes would rise more than affordability.
• Need: Keeping the kids home.
– Lack of opportunities and amenities.
• Need: Lack of advanced math/science.
What Did We Learn
• The communities have unique catalysts.
– Agriculture, manufacturing, tourism, bedroom.
• Misperceptions:
– Low cost of living is a significant attraction.
– Retail attraction will build the community.
– Super 4 or Interstate highway will automatically result in increased project activity.
– A new manufacturing project is imminent.
What Did We Learn?
• Most community leaders don’t understand what drives modern “primary” business locations.
– Thinks having 1 or 2 attributes will win projects.
• Lack of:
– Fully developed/shovel-ready sites.
– Available buildings for modern needs.
– Sizeable skilled young workforce.
– Adequate infrastructure.
– 4-Lane highway; Proximity to major markets. 0
5,000
10,000
15,000
20,000
25,000
30,000
1940 1950 1960 1970 1980 1990 2000 2010 2013 2020 2030
Axi
s Ti
tle
Population Change, 1940-2030 Tour Counties
Crawford Co.
Henry Co.
Daviess Co
Gentry Co.
Worth Co.

6/12/2014
6
0.6%
0.3%
-0.1%
-0.9%
0.0%
0.8%
-0.3%
-1.8%
-0.7%
0.6%
-2.0%
-1.5%
-1.0%
-0.5%
0.0%
0.5%
1.0%
Crawford Co. Daviess Co. Gentry Co. Worth Co. Henry Co.
Population Change - Annual Rate Tour Counties
Chng, 2000-2013
Proj. Chng, 2013-2030
ECONOMIC CATALYSTS
Economic Catalysts
• Brings in “new” money to the local market.
– Doesn’t compete within the local market.
• Doesn’t base a facility location on local demographics.
– Economic Catalysts location criteria:
• Proximity; People; Place; Product; Perception; and Price.
• Greater job “spinoff” and higher wages.
What are “Economic Catalysts”
A. Tourism attractions. B. Agriculture production C. Universities/colleges D. Retail E. Hospitals/medical
facilities F. Office/headquarters G. Local services H. Regional services I. Military facilities J. Prisons
Types of Catalysts • “Primary” Businesses:
– Manufacturing, Headquarters, Back Office – Regional Services, R&D – Contact center
• Tourism Attractions (with regional draw) – Lakes/rivers, pro sports, large events, large conventions
• Agriculture • Universities/Colleges • Federal/State Government and Military, Prison,
Institutions • “Regional significance”
– Specialty hospitals, Unique retail
Economic Catalysts Answer 1 only.
A. I agree with the concept.
B. I disagree.
C. I don’t understand it.

6/12/2014
7
AREA TYPES IN MISSOURI
Number of Counties by Area Type
• Metro: 32 counties
– Population: 72%
• Micro: 25 counties
– Population: 15%
• Rural: 58 counties
– Population: 14%
What is Your ED Service Area?
A. Metro
B. Micro
C. Rural
D. Micro and Rural
E. Statewide
F. Not in MO 0.2%
0.9%
0.7%
0.1%
0.8% 0.8%
0.0%
0.1%
0.2%
0.3%
0.4%
0.5%
0.6%
0.7%
0.8%
0.9%
1.0%
Rural Micro Metro
Population Change - Annual Rate
Chng, 2000-2013 Chng, 2013-2030
# Counties 58 32 25
State:
2000-2013: .6% 2013-2030: .7%
Total Establishments

6/12/2014
8
Economic Catalyst
• Rural Counties: 58 – Ag – 37
– Tourism/Retirement - 5
– Mfg/Ag – 4
– Bedroom/Ag - 12
• Micro Counties - 25
• Metro Counties - 32 – Newer Metropolitan - 29
– Older Metropolitan - 3
0.7%
0.0%
0.2% 0.2%
0.9%
1.4%
-0.1%
0.8%
-0.3%
0.8%
0.5%
0.8%
1.4%
0.1%
-0.4%
-0.2%
0.0%
0.2%
0.4%
0.6%
0.8%
1.0%
1.2%
1.4%
1.6%
Rural Tourism/Retire
Rural Ag Rural Mfg/Ag Rural Bedroom/Ag
Micro Areas Newer Metro Older Metro
Population Change - All Counties Annual Rate
2000-2013 Actual
2013 to 2030 Proj.
5 37
4 12 25 3 # Counties
29
State:
2000-2013: 6% 2013-2030: 7%
0.7%
0.0%
0.2% 0.2%
0.8%
-0.3%
0.8%
0.5%
-0.4%
-0.2%
0.0%
0.2%
0.4%
0.6%
0.8%
1.0%
Rural Tourism/Retire
Rural Ag Rural Mfg/Ag Rural Bedroom/Ag
Population Change, Rural Counties Annual Rate
Chng, 2000-2013 Chng, 2013-2030
5 37 4 12 # Counties
State:
2000-2013: 6% 2013-2030: 7%
MCB Tour Follow-Up
• Project Managers to follow up with each community.
• July 18: Rural Task Force meeting.
– Develop sustainable strategies.
– Involve all MO organizations that affect rural ED.

6/12/2014
9
WORKFORCE TRENDS
Missouri Labor Supply and Demand, Mar. 2014
STEM Jobs
• 60%+ of new jobs will require degrees in STEM.
• Only 20% of the workforce has these skills.
52
“Live First, Work Second,” consultant Rebecca Ryan notes just how important lifestyle is to next generation workers:
75% surveyed said that finding a “cool city” was more
important to them than finding a “good job.”
Recent Project Trends
• Attraction Projects – Key Drivers
1. Proximity/Market
2. Talent
3. Cost
• Existing Business Projects:
– Technology and regional services growing in predominance.
– Low-tech mfg still relocating to Mexico.
QUESTIONS Select top 3 (in order)

6/12/2014
10
Best way to improve economy of rural Ag counties? (Rank Order Top 3 – Most important first)
A. Lower taxes.
B. Focus attraction efforts (infra, bldg, mktg) on a few key communities that have the best chance.
C. Improve entrepreneurship efforts.
D. Improve business retention and expansion efforts.
E. Improve marketing/attraction efforts.
F. Improve education/training.
G. More regional collaboration.
H. Other
Rank the reasons for lack of growth in rural Ag counties? (Rank Order Top 3 - Most important first)
A. Lack of preparation or expertise by communities.
B. Inadequate infrastructure.
C. Insufficient attention by state & federal ED agencies.
D. Changing economy – companies are more tech.
E. Insufficient marketing.
F. High taxes.
G. Lack of skilled labor.
H. Don’t know.
“Feels Like Home” MCB Tour
Please pass the clickers to the aisle.