Feeling Norway - SpareBank 1 · SpareBank 1 Boligkreditt AS ... The company also buys...
19
Feeling Norway 2nd Quarterly Report 2013
Transcript of Feeling Norway - SpareBank 1 · SpareBank 1 Boligkreditt AS ... The company also buys...

Feeling Norway
2nd Quarterly Report 2013

Financial statements 2nd quarter 2013

NOK 1,000 Note 30.06.2013 30.06.2012 2012
Total interest income 2 2,348,243 2,603,596 5,031,867
Total interest expenses 2 -2,227,741 -2,502,703 -4,846,847
Net interest income 120,503 100,894 185,020
Net gains/losses from financial instruments 3 -9,756 111,670 193,931
Net other operating income -9,756 111,670 193,931
Total operating income 110,747 212,564 378,951
Salaries and other ordinary personnel expenses 4 -4,684 -4,212 -9,458
Administration expenses 5 -4,252 -3,041 -7,009
Other operating expenses 6 -5,038 -5,805 -11,216
Depreciation/Amortisation -925 -661 -1,713
Total operating expenses -14,899 -13,719 -29,396
Operating result before losses 95,848 198,845 349,555
Write-downs on loans and guarantees 8 0 0 -2,023
Pre-tax operating result 95,848 198,845 347,532
Taxes 26,837 55,677 -97,305
Profit/loss for the period 69,010 143,169 250,227
NOK 1,000 30.06.2013 30.06.2012 2012
Profit/loss for the period 69,010 143,169 250,227
Pension estimates deviation 7,096
Tax effect pension estimates deviation -1,987
Total profit/loss accounted for in equity 0 0 5,109
Total profit/loss 69,010 143,169 255,336
Allocations:
Declared dividends 145,886
Other Equity 69,010 143,169 109,450
Total allocations 69,010 143,169 255,336
SpareBank 1 Boligkreditt AS
Income statement first six months 2013
SpareBank 1 Boligkreditt AS
Statement of total profit/loss for the first six months 2013
2

NOK 1,000 Note 30.06.2013 30.06.2012 2012
Assets
Other intangible assets 3,646 1,573 2,035
Other assets 7 1,454 1,071 1,552
Treasury Bills 5,071,915 1,507,532 1,801,802
Bonds 11 13,656,316 9,853,743 12,472,275
Lending to and deposits with credit institutions 7,125,187 4,014,483 6,036,499
Lending to customers 8 166,914,671 148,328,247 160,233,984
Financial derivatives 10 8,778,292 5,972,318 6,104,499
Total assets 201,551,481 169,678,967 186,652,647
Liabilities and equity
Liabilities
Deferred taxes 100,712 0 100,712
Debt incurred by issuing securities 9 185,028,695 156,010,915 170,644,817
Debt to credit institutions 4,706,383 2,973,916 3,213,665
Financial derivatives 10 1,312,415 2,751,198 3,531,313
Tax payable 0 0 0
Other liabilities 14 2,267,746 880,925 1,369,734
Total liabilities 193,415,951 162,616,954 178,860,241
Equity
Contributed equity 7,968,470 6,918,470 7,548,470
Retained Earnings 98,050 695 98,050
Result 69,010 142,848 0
Declared dividends 0 0 145,886
Total equity 8,135,531 7,062,013 7,792,406
Total liabilities and equity 201,551,481 169,678,967 186,652,647
Stavanger, 09.08.2013
Kjell Fordal Inge Reinertsen Tore Anstein Dobloug
SpareBank 1 Boligkreditt AS
Balance sheet as of 30 June 2013
Chief Executive Officer
Chairman of the Board
Inger S. Eriksen Merete Nygaard Kristiansen Arve Austestad
3

Share capitalPremium
reserve
Declared
dividend
Fund for
unrealised
profits
Other
equityTotal equity
Balance as of 31 December 2011 3,770,548 1,887,922 82,952 695 5,742,118
Share increase January 5, 2012 280,000 140,000 420,000
Share increase January 27, 2012 280,000 140,000 420,000
Share increase March 16, 2012 280,000 140,000 420,000
Share increase August, 20 2012 280,000 140,000 420,000
Share increase October 24, 2012 140,000 70,000 210,000
Dividend 2011 -82,952 -82,952
Result for the period 145,886 97,072 7,269 250,227
Pension estimates deviation net of tax effect 5,109 5,109
Pension obligation accounted for in equity -12,095 -12,095
Balance as of December 31, 2012 5,030,548 2,517,922 145,886 97,072 978 7,792,406
Share increase April 8, 2013 280,000 140,000 420,000
Dividend 2012 ####### -145,886
Result for the period 69,010 69,010
Balance as of June 30, 2013 5,310,548 2,657,922 0 97,072 69,988 8,135,530
SpareBank 1 Boligkreditt AS
Statement of changes in equity
NOK 1,000
4

NOK 1,000 30.06.2013 30.06.2012 2012
Cash flows from operations
Interest received 2,192,208 2,295,015 4,691,621
Payments to operations -12,626 -15,692 -22,007
Paid tax 0 -38,644 -32,259
Net cash flow relating to operations 2,179,581 2,240,679 4,637,355
Cash flows from investments
Net purchase of loan portfolio -6,652,727 -21,310,639 -33,205,024
Net payments on the acquisition of government bills -3,266,753 2,630,160 2,332,616
Net payments on the acquisition of bonds -705,756 -920,953 -3,720,224
Net investments in intangible assets -2,536 -102 -1,616
Net cash flows relating to investments -10,627,773 -19,601,533 -34,594,249
Cash flows from funding activities
Net receipt/payment from the issuance of certificates 760,095 -999,878 -480,627
Net receipt/payment from the issuance of bonds 8,174,068 18,499,461 33,482,836
Net receipt/payment from the issuance of loans to credit institutions 2,362,782 1,850,336 2,615,429
Equity capital subscription 420,000 1,260,000 1,890,000
Paid dividend -145,886 -82,952 -82,952
Net interest payments on funding activity -2,033,940 -2,186,448 -4,485,657
Net cash flow relating to funding activities 9,537,119 18,340,519 32,939,030
Net cash flow in the period 1,088,927 979,665 2,982,136
Balance of cash and cash equivalents Jan 1, 2012 6,036,499 3,046,116 3,046,116
Net receipt/payments on cash 1,088,927 979,665 2,982,136
Exchange rate difference -239 -11,298 8,248
Balance of cash and cash equivalents Dec 31, 2012 7,125,187 4,014,483 6,036,499
SpareBank 1 Boligkreditt AS
Cash Flow Statement
5

Profit and Loss
2nd quarter 1st quarter 4th quarter 3rd quarter 2nd quarter
NOK 1,000 2013 2013 2012 2012 2012
Interest income 1,184,976 1,163,267 1,205,275 1,222,996 1,278,517
Interest expense -1,138,467 -1,089,274 -1,167,297 -1,176,848 -1,224,908
Net interest income 46,509 73,993 37,978 46,148 53,610
Net gains/losses on financial instruments -35,524 25,768 36,392 45,869 41,502
Net other operating income -35,524 25,768 36,392 45,869 41,502
Total operating income 10,985 99,762 74,370 92,016 95,112
Salaries and other ordinary personnel expenses -2,753 -2,613 -2,539 -2,707 -1,641
Administration expenses -2,195 -1,375 -2,406 -1,562 -1,614
Other operating expenses -1,622 -3,416 -3,110 -2,301 -3,752
Depreciation/Amortisation -487 -438 -574 -478 54
Total operating expenses -7,057 -7,842 -8,629 -7,048 -6,952
Operating result before losses 3,928 91,920 65,741 84,968 88,159
Write-downs on loans and guarantees 0 0 -2,023 0 0
Operating result before taxes 3,928 91,920 63,718 84,968 88,159
Taxes -1,100 -25,737 -17,837 -23,791 -24,685
Profit/loss for the period 2,828 66,182 45,881 61,177 63,475
Other income and costs 0 0 0 0 0
Total profit/loss for the period 2,828 66,182 45,881 61,177 63,475
Balance Sheet
2nd quarter 1st quarter 4th quarter 3rd quarter 2nd quarter
NOK 1,000 2013 2013 2012 2012 2012
Assets
Other intangible assets 3,646 2,179 2,035 2,279 1,573
Other assets 1,454 1,336 1,552 1,176 1,071
Treasury Bills 5,071,915 1,612,305 1,801,802 5,266,663 1,507,532
Bonds 13,656,316 12,612,044 12,472,275 11,740,867 9,853,743
Lending to and deposits with credit institutions 7,125,187 4,677,406 6,036,499 5,030,819 4,014,483
Lending to customers 166,914,671 164,866,968 160,233,984 157,261,220 148,328,247
Financial derivatives 8,778,292 6,651,730 6,104,499 6,107,841 5,972,318
Sum eiendeler 201,551,481 190,423,968 186,652,647 185,410,866 169,678,967
Liabailities and Equity
Liabilities
Deferred taxes 100,712 100,712 100,712 0 0
Debt incurred by issuing securities 185,028,695 174,827,620 170,644,817 169,296,209 156,010,915
Debt to credit institutions 4,706,383 3,361,575 3,213,665 3,495,568 2,973,916
Financial derivatives 1,312,415 2,514,262 3,531,313 3,983,467 2,751,198
Tax payable 0 0 0 0 0
Other liabilities 2,240,909 1,761,209 1,369,734 1,092,111 880,925
Total Liabilities 193,389,114 182,565,378 178,860,241 177,867,355 162,616,954
Equity
Contributed equity 7,968,470 7,548,470 7,548,470 6,918,470 6,918,470
Contributed equity (not yet registered) 98,050 0 0 420,000 0
Retained Earnings 69,010 98,050 98,050 695 695
Result 0 66,182 0 204,346 142,848
Declared dividends 0 145,886 145,886 0 0
Total Equity 8,135,530 7,858,588 7,792,406 7,543,511 7,062,013
Total Liabilities and Equity 201,551,481 190,423,967 186,652,647 185,410,866 169,678,967
Key Figures
Number of shares 5,310,548 50,305,482 50,305,482 48,905,482 46,105,482
Result per share 0.55 1.32 2.90 4.18 3.10
SpareBank 1 Boligkreditt AS
Profits and loss and balance sheet development
6

1.1 Basis for preparation
1.2 Segment
1.3 Currency
1.4 Risk Management
1.5 Estimates
SpareBank 1 Boligkreditt AS
Notes to the Financial Statements 2nd quarter 2013
Note 1 Accounting Principles
These quarterly accounts for SpareBank 1 Boligkreditt refers to the period 01.01.2013 - 30.06.2013. The accounts have been produced in accordance with IAS 34 reporting for a partial
year. The accounts are prepared in accordance with IFRS and IFRIC interpretations thereof. The Company's accounting principles and calculation methods have not materially changed
since the annual accounts for 2012. The principles adressed below should be seen in connection with the accounting principles as they were presented in the annual accounts for 2012.
SpareBank 1 Boligkreditt AS' financial assets and liabilities fluctuates in value as a result of the variability of prices of such assets and liabilities in the financial markets. In the annual
accounts for 2012 Note 3 this risk and its management is more closely discussed.
The preparation of the financial information is in accordance with IFRS and involves management's estimates which affect the implementation of accounting principles and thereby
accounting values for assets, liabilities, revenue and costs. These estimates have been described in the notes to the annual accounts for 2012.
SpareBank1 Boligkreditt main office is located in Stavanger, visiting address Bjergsted Terrasse 1.
These financial accounts for the first quarter of 2013 have been approved by the Board of Directors of SpareBank 1 Boligkreditt on 09.08.2013
SpareBank 1 Boligkreditt AS is the SpareBank 1 Alliance's separate legal vehicle established according to the specialist banking principle within the Norwegian legislation for covered
bonds. The Company's purpose is to acquire residential mortgages from its ownership banks organised in the SpareBank 1 Alliance and finance these by issuing covered bonds.
The presentation currency is Norwegian Kroner (NOK), which is also the Company's functional currency. All amounts are given in NOK thousand unless otherwise stated.
Business segments are the Company's primary reporting segment. The Company has only one segment, which is the retail customer segment. The segment consists of lending to private
individuals and all loans have been acquired from the member banks of the SpareBank 1 alliance. The Company's total results for the first quarter of 2013 is therefore equal to the retail
segment total results.
7

SpareBank 1 Boligkreditt AS
Notes to the Financial Statements 2nd quarter 2013
NOK 1 000 30.06.2013 30.06.2012 2012
Interest income
Interest income and similar income from loans to and balances with credit institutions 153,254 198,882 270,499
Interest income and similar income from loans to and balances with customers 3,188,478 2,828,128 5,859,367
Interest income treasury bills 24,252 5,481 54,644
Commission expense (payable to shareholder banks) * -1,017,740 -428,895 -1,152,643
Total interest income 2,348,243 2,603,596 5,031,867
Interest expense
Interest expense and similar expenses to credit institutions 8,850 7,099 15,031
Interest expense and similar expenses on issued bonds 2,162,836 2,391,032 4,690,224
Interest expense and similar expenses on issued certificates 56,049 76,569 141,560
Other interest expenses 5 28,002 32
Total interest expense 2,227,740 2,502,703 4,846,847
Total net interest income 120,503 100,894 185,020
NOK 1 000 30.06.2013 30.06.2012 2012
Net gains (losses) from financial liabilities -1,828,372 -1,172,720 -1,499,100
Net gains (losses) from financial assets -447,292 -89,713 -148,503
Net gains (losses) from financial derivatives, hedging, at fair value 2,285,420 1,374,104 1,841,534
Net gains (losses) from financial instruments 9,756 111,670 193,931
NOK 1 000 30.06.2013 30.06.2012 2012
Salary 4,355 4,735 10,198
Salaries reinvoiced to SpareBank1 Næringskreditt* -2,217 -2,344 -4,523
Pension expenses 1,141 884 1,839
Social insurance fees 1,171 770 1,389
Other personnel expenses 234 168 555
Total salary expenses 4,684 4,212 9,458
Average number of man-years 8 8 8
Note 4 Salaries and Remuneration
*The company’s employees have shared employment between SpareBank 1 Næringskreditt and SpareBank 1 Boligkreditt. All remuneration is effectuated through SpareBank 1 Boligkreditt
and a portion is reinvoiced to SpareBank 1 Næringskreditt. The company also buys administrative services from SpareBank 1 SR-Bank ASA and SpareBank 1 Gruppen. Pension benefit
obligations are safeguarded in SpareBank 1 Boligkreditt through participation in the pension fund of SpareBank 1 SR-Bank ASA. This pension scheme meets the legal demands on
mandatory occupational pension.
* Commissions are calculated daily and individually for the loans which Boligkreditt has purchased from its ownership banks. Commissions are calculated by deducting the the Company's
all-in cost (average funding costs and an estimate for running operating costs as determined by the Company's Board from time to time) from the mortgage interest rate charged on a
particular loan.
Note 2 Net Interest Income
Note 3 Net Gains from Financial Instruments
8

SpareBank 1 Boligkreditt AS
Notes to the Financial Statements 2nd quarter 2013
NOK 1 000 30.06.2013 30.06.2012 2012
IT operation and maintenance 3,505 2,495 5,627
Travel 682 461 1,183
Telephone and postage 45 76 150
Misc other adm expenses 20 10 49
Total 4,252 3,041 7,009
NOK 1 000 30.06.2013 30.06.2012 2012
Auditing, hired personnel from SpareBank 1 Group, other services 5,057 5,970 11,399
Operating expenses rented offices 285 243 528
Operating expenses reinvoiced to SpareBank 1 Næringskreditt -503 -562 -1,025
Misc other operating expenses 200 154 314
Total 5,038 5,805 11,216
NOK 1 000 30.06.2013 30.06.2012 2012
Receivables from SpareBank 1 Næringskreditt AS 1454 1,071 1,552
Total 1454 1,071 1,552
Note 6 Other Operating Expenses
Note 7 Other Assets
Note 5 Administration Expenses
9

SpareBank 1 Boligkreditt AS
Notes to the Financial Statements 2nd quarter 2013
NOK 1 000 30.06.2013 30.06.2012 2012
Revolving loans - retail market 65,169,568 61,505,655 64,373,537
Amortising loans - retail market 101,534,519 86,651,320 95,677,823
Accrued interest 218,292 176,957 190,333
Total loans before specified and unspecified loss provisions 166,922,379 148,333,931 160,241,692
Specified loan loss provisions
Unspecified loan loss provisions 7,708 5,685 7,708
Total net loans and claims with customers 166,914,671 148,328,247 160,233,984
Liability
Unused balances under revolving credit lines 20,750,450 18,325,871 19,604,652
Total 20,750,450 18,325,871 19,604,652
Defaulted loans
Defaults* 0 % 0 % 0 %
Specified loan loss provisions 0 % 0 % 0 %
Net defaulted loans 0 % 0 % 0 %
Loans at risk of loss
Loans not defaulted but at risk of loss 0 % 0 % 0 %
- Write downs on loans at risk of loss 0 % 0 % 0 %
Net other loans at risk of loss 0 % 0 % 0 %
interest payments are not received within 90 days or if credit limits on revolving loans are exceeded for 90 days or more
Changes to loan loss provisions
NOK 1 000 30.06.2013 30.06.2012 2012
Loan loss provisions as of 01.01.2012 7,708 5,685 5,685
Change in group loan loss provisions 0 0 2,023
Loan loss provisions as of 31.12.2012 7,708 5,685 7,708
*The entire customer loan balance is considered to be in default and will be included in overviews of defaulted loans when overdue instalments and
Note 8 Lending to Customers
Lending to customers consists of loans secured on residential real estate. The mortgage loans generally have a low loan-to-value ratio and historical loan provisions have been very low.
Total lending to customers at the end of the second quarter 2013 was NOK 166.9 billion. All loans to customers carry a variable interest rate.
10

SpareBank 1 Boligkreditt AS
Notes to the Financial Statements 2nd quarter 2013
Nominelle beløp* Nominelle beløp* Nominelle beløp*
NOK 1 000 30.06.2013 30.06.2012 2012
Issued short term notes and borrowing, unsecured 5,050,000 4,075,000 4,425,000
Repurchased/retained short term notes, unsecured -270,000 -405,000
Senior unsecured bonds 3,839,000 3,050,000 5,558,000
Repurchased/retained senior unsecured bonds -527,000 0
Covered bonds 176,222,750 152,103,370 165,892,696
Repurchased/retained covered bonds -6,499,512 -3,880,395 -4,876,034
Withdrawn from the Norwegian Central Bank Swap Facility 6,569,843 14,864,778 14,864,778
Bonds deposited in the Norwegian Central Bank Swap Facility -7,552,000 -18,100,000 -18,100,000
Total liabilities incurred by issuing securities 176,833,081 152,112,753 167,359,440
* Nominal value is incurred debt at exchange rates (EUR/NOK and USD/NOK) at the time of issuance
Bokført verdi Bokført verdi Bokført verdi
NOK 1 000 30.06.2013 30.06.2012 2012
Issued short term notes and borrowing, unsecured 5,048,792 4,073,935 4,424,021
Repurchased/retained short term notes, unsecured -270,089 0 -405,412
Senior unsecured bonds 3,838,663 3,049,328 5,557,427
Repurchased/retained senior unsecured bonds -527,143 0 0
Covered bonds 183,075,361 154,760,384 168,001,496
Repurchased/retained covered bonds -6,672,260 -4,083,904 -5,060,049
Withdrawn from the Norwegian Central Bank Swap Facility 6,579,046 14,905,348 14,885,672
Bonds deposited in the Norwegian Central Bank Swap Facility -7,552,000 -18,100,000 -18,100,000
Activated costs incurred by issuing debt -189,763 -150,247 -174,032
Accrued interest 1,698,088 1,556,071 1,515,695
Total liabilities incurred by issuing securities 185,028,695 156,010,915 170,644,817
Liabilities incurred by issuing securities according to maturity (nominal value* NOK 1,000)
Senior unsecured Bonds
Maturity Year 30.06.2013 30.06.2012 2012
2012 - 2,940,000
2013 1,713,000 3,135,000 5,320,000
2014 3,975,000 1,050,000 3,197,500
2015 2,404,000 -
Sum 8,092,000 7,125,000 8,517,500
Central Bank Swap Facility
Maturity Year 30.06.2013 30.06.2012 2012
2012 - -
2013 - 8,294,936 8,294,936
2014 6,569,843 6,569,843 6,569,843
Sum 6,569,843 14,864,778 14,864,778
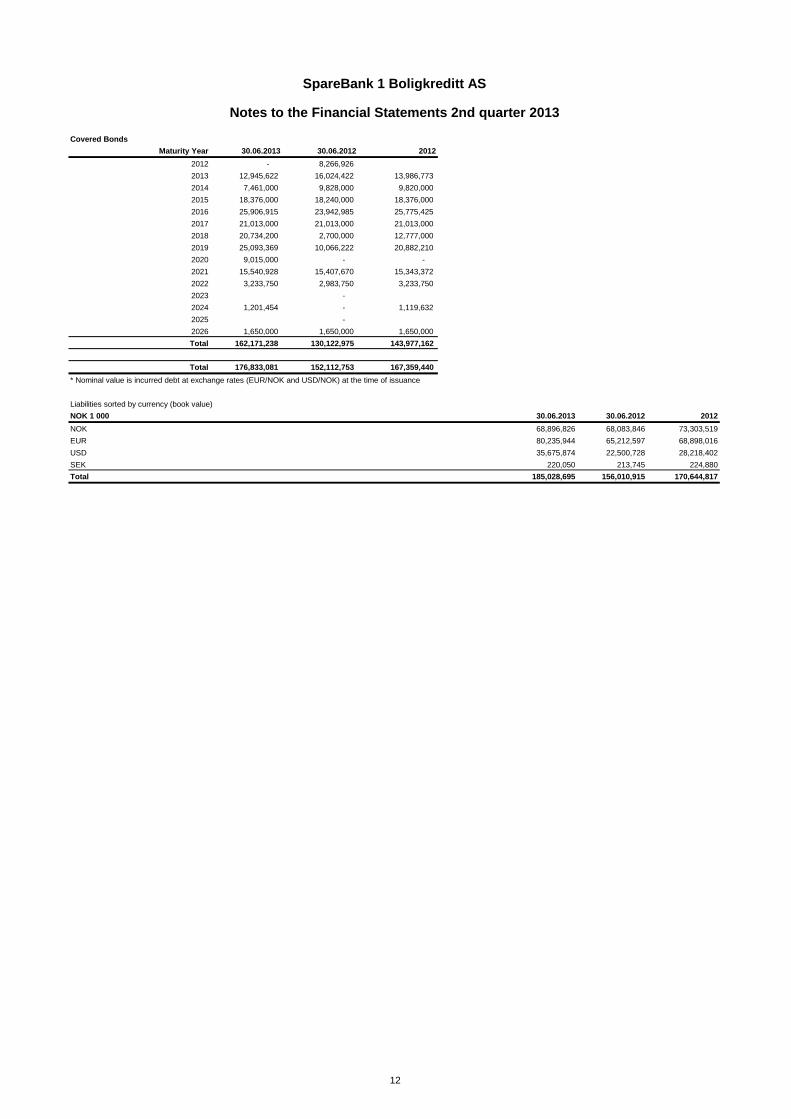
Note 9 Liabilities incurred by issuing Securities
11
SpareBank 1 Boligkreditt AS
Notes to the Financial Statements 2nd quarter 2013
Covered Bonds
Maturity Year 30.06.2013 30.06.2012 2012
2012 - 8,266,926
2013 12,945,622 16,024,422 13,986,773
2014 7,461,000 9,828,000 9,820,000
2015 18,376,000 18,240,000 18,376,000
2016 25,906,915 23,942,985 25,775,425
2017 21,013,000 21,013,000 21,013,000
2018 20,734,200 2,700,000 12,777,000
2019 25,093,369 10,066,222 20,882,210
2020 9,015,000 - -
2021 15,540,928 15,407,670 15,343,372
2022 3,233,750 2,983,750 3,233,750
2023 -
2024 1,201,454 - 1,119,632
2025 -
2026 1,650,000 1,650,000 1,650,000
Total 162,171,238 130,122,975 143,977,162
Total 176,833,081 152,112,753 167,359,440
* Nominal value is incurred debt at exchange rates (EUR/NOK and USD/NOK) at the time of issuance
Liabilities sorted by currency (book value)
NOK 1 000 30.06.2013 30.06.2012 2012
NOK 68,896,826 68,083,846 73,303,519
EUR 80,235,944 65,212,597 68,898,016
USD 35,675,874 22,500,728 28,218,402
SEK 220,050 213,745 224,880
Total 185,028,695 156,010,915 170,644,817
12
SpareBank 1 Boligkreditt AS
Notes to the Financial Statements 2nd quarter 2013
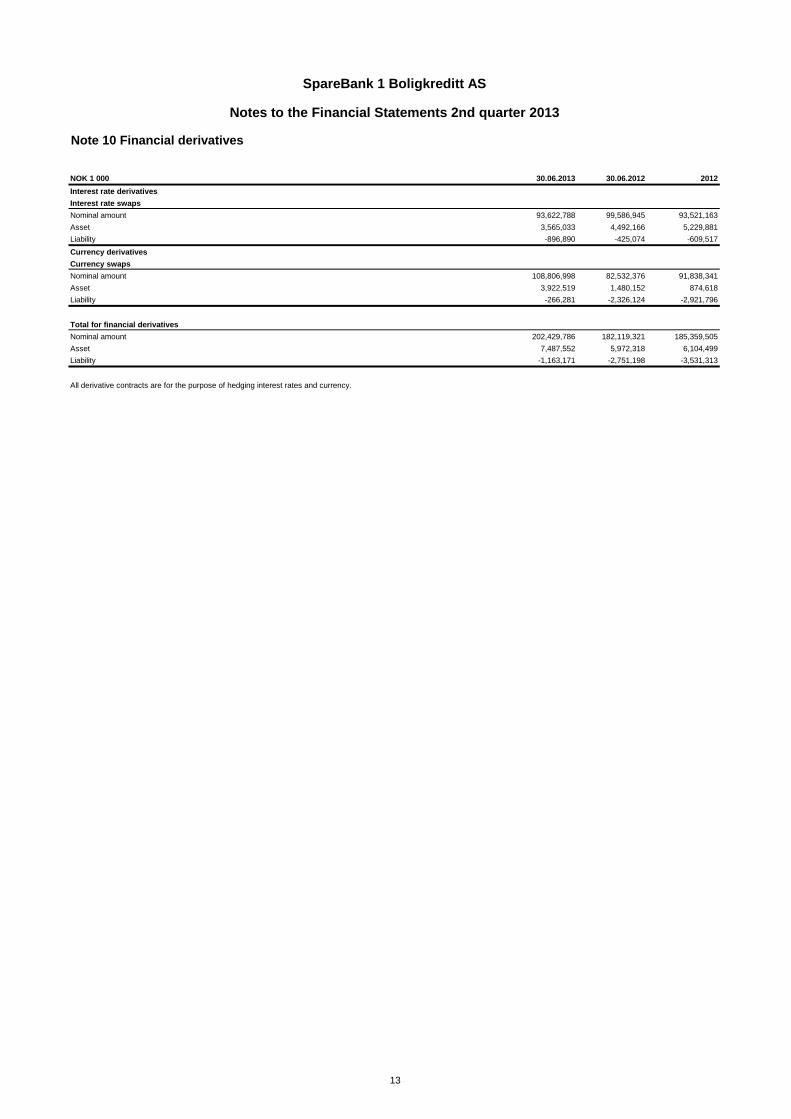
NOK 1 000 30.06.2013 30.06.2012 2012
Interest rate derivatives
Interest rate swaps
Nominal amount 93,622,788 99,586,945 93,521,163
Asset 3,565,033 4,492,166 5,229,881
Liability -896,890 -425,074 -609,517
Currency derivatives
Currency swaps
Nominal amount 108,806,998 82,532,376 91,838,341
Asset 3,922,519 1,480,152 874,618
Liability -266,281 -2,326,124 -2,921,796
Total for financial derivatives
Nominal amount 202,429,786 182,119,321 185,359,505
Asset 7,487,552 5,972,318 6,104,499
Liability -1,163,171 -2,751,198 -3,531,313
All derivative contracts are for the purpose of hedging interest rates and currency.
Note 10 Financial derivatives
13

SpareBank 1 Boligkreditt AS
Notes to the Financial Statements 2nd quarter 2013
Financial instruments Financial assets and Financial assets Non-financial
accounted for at debt accounted for held to maturity assets and liabilities
NOK 1,000 fair value * at amortised cost 30.06.2013
Assets
Other intangible assets 3,646 3,646
Other assets 1,454 1,454
Treasury Bills 5,071,915 5,071,915
Bonds 12,099,621 1,556,695 13,656,316
Lending to and deposits with credit institutions 7,125,187 7,125,187
Lending to customers 166,914,671 166,914,671
Financial derivatives 8,778,292 8,778,292
Total Assets 25,949,828 174,039,858 1,556,695 5,100 201,551,481
Liabilities
Deferred taxes 100,712 100,712
Debt incurred by issuing securities 136,378,051 48,650,644 185,028,695
Debt to credit institutions 4,706,383 4,706,383
Financial derivatives 1,312,415 1,312,415
Other liabilities 2,267,746 2,267,746
Total liabilities 137,690,466 53,357,027 0 2,368,458 193,415,951
Total equity 8,135,531 8,135,531
Total liabilities and equity 137,690,466 53,357,027 10,503,989 201,551,481
*Fair value calculation according to market interest rates and currencies
Financial instruments Financial assets and Financial assets Non-financial
accounted for at debt accounted for held to maturity assets and liabilities
NOK 1 000 fair value * at amortised cost 31.12.2012
Assets
Other intangible assets 2,035 2,035
Other assets 1,552 1,552
Treasury Bills 1,801,802 1,801,802
Bonds 10,664,881 1,807,394 12,472,275
Lending to and deposits with credit institutions 6,036,499 6,036,499
Lending to customers 160,233,984 160,233,984
Financial derivatives 6,104,499 6,104,499
Total Assets 18,571,182 166,270,483 1,807,394 3,587 186,652,646
Liabilities
Deferred taxes 100,712 100,712
Debt incurred by issuing securities 125,109,912 45,534,905 170,644,817
Debt to credit institutions 3,213,665 3,213,665
Financial derivatives 3,531,313 3,531,313
Tax payable 0 0
Other liabilities 1,369,734 1,369,734
Total liabilities 128,641,225 48,748,570 0 1,470,446 178,860,241
Total equity 7,792,406 7,792,406
Total liabilities and equity 128,641,225 48,748,570 9,262,852 186,652,646
*Fair value calculation according to market interest rates and currencies
Note 11 Classification of Financial Instruments
14

SpareBank 1 Boligkreditt AS
Notes to the Financial Statements 2nd quarter 2013
Note 12 Financial Instruments at Fair Value
Procedures to determine fair value
General
Interest rate and currency swaps
Bonds
- Quoted price in an active market for an identical asset or liability (level 1)
- Valuation based on observable factors either direct (prices) or indirected (deduced from prices used in level 1) other than quoted price
for the asset or liability (level 2)
- The valuation is based on factors that are not found in observable markets (non-observable assumptions) (level 3)
The following numbers present the company’s assets and liabilities at fair value as of 30.06.2013
NOK 1 000
Level 1 Level 2 Level 3 Total
Bonds and bills 17,171,536 17,171,536
Financial Derivatives 0 8,778,292 0 8,778,292
Total Assets 0 19,269,037 0 19,269,037
Bonds 0 136,378,051 0 136,378,051
Financial Derivatives 1,312,415 1,312,415
Total Liabilities 0 137,690,466 0 137,690,466
The following numbers present the company’s assets and liabilities at fair value as of 31.12.2012
NOK 1 000
Level 1 Level 2 Level 3 Total
Bonds and bills 12,466,683 12,466,683
Financial Derivatives 0 6,104,499 0 6,104,499
Total Assets 0 18,571,182 0 18,571,182
Bonds 0 125,109,912 0 125,109,912
Financial Derivatives 3,531,313 3,531,313
Total Liabilities 0 128,641,225 0 128,641,225
As of 30.06.2013
Book value Exchange rate Amortised cost
Bonds classified as 31.12.2012 Investering Avgang Amortisering Valutaeffekter 30.06.2013
Hold to maturity 1,803,199 0 -250,000 -69 0 1,553,130
Total certificates and bonds 1,803,199 0 -250,000 -69 0 1,553,130
Market value of bonds in hold to maturity portfolio
Bonds classified as Book value
Hold to maturity 1,553,130 1,561,230 8,100
Total certificates and bonds 1,553,130 1,561,230 8,100
Effect on result if at
fair value
Note 13 Bonds classified as Hold to Maturity
Market value incl
exchange rate
effects
With effect from 2009 SpareBank 1 Boligkreditt AS has implemented the changes in IFRS 7 in relation to the valuation of financial instruments as of the date of the financial accounts. The
changes require a presentation of the fair value measurement for each Level. We have the following three Levels for the fair value measurement:
Valuation of bonds at fair value is done through discounting future cash flows to present value.
The interest rate curve that is used as input for fair value valuations of hedging instruments and hedging objects consists of the NIBOR-curve for maturities less than one year. The swap-
curve is used for maturities exceeding one year.
Valuation of interest rate swaps at fair value is done through discounting future cash flows to their present values. Valuation of currency swaps will also include the element of foreign
exchange rates
15

SpareBank 1 Boligkreditt AS
Notes to the Financial Statements 2nd quarter 2013
NOK 1 000 30.06.2013 30.06.2012 2012
Employees tax deductions and other deductions 788 309 526
Employers national insurance contribution 54 464 368
Accrued holiday allowance 383 923 914
Commission payable to shareholder banks 2,201,455 806,096 1,332,547
Deposits* 11,506 11,456 10,348
Pension liabilities 11,046 674 11,046
Other accrued costs 42,513 61,004 13,985
Total 2,267,746 880,925 1,369,734
Pool 1
NOK 1 000 30.06.2013 30.06.2012 2012
Covered Bonds 177,299,176 138,045,566 151,398,813
Repurchased/retained Bonds -6,812,370 -4,202,925 -4,045,963
Derivatives -7,848,060 -3,459,703 -2,977,540
Total Covered Bonds 162,638,746 130,382,938 144,375,311
Lending to customers 159,515,216 132,635,486 145,006,745
Treasury Bills 5,071,915 74,735 198,218
Substitute collateral 14,983,875 10,198,674 14,432,542
Total Cover Pool 179,571,005 142,908,895 159,637,505
Asset-coverage 110.4 % 109.6 % 110.6 %
Pool 2
NOK 1 000 30.06.2013 30.06.2012 2012
Covered Bonds 8,556,093 18,114,617 18,113,843
Repurchased/retained Bonds -998,881 -1,014,086 -1,014,019
Derivatives -6,724 -35,996 -18,975
Total Covered Bonds 7,550,488 17,064,534 17,080,849
Lending to customers 7,322,561 15,644,370 15,180,144
Treasury Bills 0 1,432,798 1,603,584
Substitute collateral 697,759 180,460 433,229
Total Cover Pool 8,020,321 17,257,628 17,216,957
Asset-coverage 106.2 % 101.1 % 100.8 %
The asset coverage is calculated according to the Financial Services Act § 2-31 (Covered Bond Legislation). There is a discrepancy between the asset coverage test and the amounts in
the balance sheet because for the purposes of the test mortgage loans which may have migrated above the 75% loan to value level are reduced to reflect the decrease in the value of the
underlying collateral so that only a maximum loan corresponding to a value of 75% of the collateral is considered. Furthermore, the fact that market values are recorded for all bonds and
certificates in the cover pool could have an impact. In addition any defaulted loans, i.e. loans in arrears at or beyond 90 days, are excluded from the test (there have been no occurances of
any defaults starting with the commencement of operations through 30.06.2013). The company separates Cover Pool 1 and Cover Pool 2. Cover Pool 1 is utilised for market issuances of
covered bonds whilst Cover Pool 2 is a separate mortgage portfolio established solely for use in the swap facility with Norway's Central Bank in 2009.
* Deposits represents temporary balances paid in by customers in excess of the original loan amount
Note 14 Other Liabilities
Note 15 Asset Coverage Requirement
The Company does not have an overdraft facility or a revolving credit facility as of 30.06.2013
16

SpareBank 1 Boligkreditt AS
Notes to the Financial Statements 2nd quarter 2013
Subordinated capital in NOK 1 000 30.06.2013 30.06.2012 2012
Share capital 5,310,548 4,610,548 5,030,548
Premium share fund 2,657,922 2,307,922 2,517,922
Other equity capital 98,050 695 243,936
Total equity capital entered into the balance sheet 8,066,520 6,919,165 7,792,406
Intangible assets -3,646 -1,573 -2,035
Declared share dividend 0 0 -140,855
100% deduction of expected losses exceeding loss provisions IRB -174,951 -131,875 -149,491
Core capital (Tier 1) 7,887,923 6,785,717 7,574,771
Supplementary capital 0 0 0
Total capital 7,887,923 6,785,717 7,574,771
Minimum requirements for capital according to Basel II i NOK 1 000 30.06.2013 30.06.2012 2012
Credit risk 1,921,547 1,568,621 1,721,475
Market risk 0 0 0
Operational risk 27,797 23,942 23,942
Depreciation on groups of loans 0 0 0
Difference in capital requirement resulting from transitional period 2007-2009 3,961,474 3,680,139 3,986,810
Minimum requirement for capital 5,910,818 5,272,702 5,732,227
Capital adequacy
30.06.2013 30.06.2012 2012
Core capital ratio (%) (Tier 1) 10.68 % 10.30 % 10.57 %
Total capital ratio (%) 10.68 % 10.30 % 10.57 %
The primary goal for the Company's management of capital reserves is to ensure compliance with laws and regulatory requirements and maintain solid financial ratios and a high quality
credit assessment in order to best support its business. The Board of Directors have approved a target for the Company's risk weighted equity coverage of assets of 10%.
A new capital requirements directive was introduced in Norway as of January 1, 2007 (Basel II). SpareBank1 Boligkreditt AS obtained permission from the Financial Services Authority in
Norway (Finanstilsynet) for the implementation of its own Internal Ratings Based (IRB) model for credit risks from the seond quarter of 2009.
Transitional rules have been implemented by the FSA whereby regulated financial institutions with approved IRB models will not be able to fully benefit from the results of such models until
the year 2015. In 2012 regulated entities are allowed to reduce by 20% the total sum of risk weighted assets which would otherwise have been in place under the previous Basel I
framework. In the following years until the end of 2015, the transitional rules will lead to significantly higher capital requirements than what would otherwise have been applicable under
Basel II.
The European Union is expected to introduce new regulatory requirements, CRD IV, in 2013. The new regulations will introduce robust demands for capital adequacy, capital structure,
liquidity buffers and funding. SpareBank 1 Boligkreditt AS is well placed, given its current capital structure to meet these new requirements in CRD IV. The Board of Directors are
evaluating the capitalisation of the Company on a continous basis in accordance with the international development.
Boligkreditt's parent banks have committed to support a minimum level of the Company's core capital ratio (Tier 1) of 9% pro rata according to their ownership stakes. If one or more banks
are not able to pay in capital as needed the commitment takes the form of a joint responsibility where each bank is responsible for up to twice its pro rata ownership in the Company.
Note 16 Capital Adequacy
17

SpareBank 1 Boligkreditt AS
Notes to the Financial Statements 2nd quarter 2013
Transactions with related parties
The Company has 166 915 MNOK loans to customers. These are acquired from shareholder banks at market value (i.e. nominal value).
SpareBank 1 SR-Bank ASA
The Company purchases a substantial amount of their support functions from SpareBank 1 SR-Bank ASA.
A complete SLA are established between the Company and SpareBank 1 SR-Bank ASA.
SpareBank 1 - alliansen
SpareBank 1 Næringskreditt AS
SpareBank 1 Boligkreditt AS is not a party to any ongoing legal proceedings.
No events have taken place subsequently to the date of these financial statements, 30.06.2013, which would affect these accounts in any material way.
All employees within SpareBank 1 Boligkreditt AS are also to various degrees working for SpareBank 1 Næringskreditt AS. In accordance with a Board decision in SpareBank 1
Næringskreditt dated 17.09.09 one third of the administrative expenses in SpareBank 1 Boligkreditt AS are to be charged to SpareBank 1 Næringskreditt AS. This division of administrative
expenses between the two companies reflect the actual resources utilisation in SpareBank 1 Boligkredit AS.
Note 17 Related parties
Note 20 Events after Balance Sheet Date
SpareBank 1 Boligkreditt has signed ISDA-agreements including CSAs (Credit Support Annexes) with a number of financial institutions that are counterparties in interest rate and currency
swaps. These institutions post collateral in the form of cash deposits to SpareBank 1 Boligkreditt. At the the end of June 2013 this collateral amounted to NOK 4,706,382,759. This amount
is included in the balance sheet as a deposit, but represents restricted cash.
Note 19 Restricted Cash
Note 18 Contingencies
In addition the Company has a Transfer and Servicing agreement in place with each individual shareholder bank regulating amongst other things the servicing of mortgage loans.
18