Feedstock Push hits the Demand Wall
37
www.icis.com 1 Feedstock Push hits the Demand Wall John Richardson David Hughes ICIS International eChem GPCA Dubai, November 2018
Transcript of Feedstock Push hits the Demand Wall

www.icis.com 1
Feedstock Push hits the Demand Wall
John Richardson David Hughes
ICIS International eChem
GPCA
Dubai, November 2018

www.icis.com 2
Feedstock Push hits the Demand Wall
• Feedstock push will support integrated players
• Demand patterns are changing as the demographics change
• The circular economy will massively impact our markets
• Globalisation is already coming to an end

www.icis.com 3
The Energy Transformation will up-end the oil markets
• Renewable wind / solar are now the cheapest forms of energy in the world
• Coal and then gas will be the losers in this transition
• Falling battery costs will support and accelerate the move
Source: Lazard Levelized cost of Energy

www.icis.com 4
The Energy Transformation will up-end the oil markets
Source: Prof Ray Wills, Univ. West Australia

www.icis.com 5
Shale boom will continue into the future

www.icis.com 6
Self sufficiency & return to naphtha adds 25 M te
ethylene by 2030
Chemicals used as diversification and hedge
against oil sales
Chemicals used as route to economic growth inside
BRIShale feedstock push adds
6.5 M te in wave 22020-22
Chemicals capacity growth driven by external factors

www.icis.com 7
CompanyCapacity (kt/year)
Downstream (kt/year) Location Start-up Status
Total/Borealis/NOVA 1,000Borstar PE (625) + existing PE
(400)Port Arthur, Texas End 2020
Cracker underconstruction, FID pending
for PE
Shell 1,500HDPE/LLDPE (2x 550), HDPE
(500)Monaca, Pennsylvania Early 2020s
Underconstruction
SABIC/ExxonMobil
1,800 PE (2 units), MEG Corpus Christi, Texas H2 2022Under
construction
PTTGC/Daelim 1,000HDPE (700), MEG (500), EO
(100)Belmont County, Ohio 2021 Evaluation
Formosa Petrochemicals
1,200LLDPE (400), HDPE (400), EG
(900)St James Parish,
Louisiana2022 Permitting, Evaluation
No breathing space before “Wave Two” crackers in US
ICIS Supply & Demand Database

www.icis.com 8
What’s the outlook for demand?

www.icis.com 9
Rich Western consumers are disappearing as they age
International eChem analysis

www.icis.com 10
Since last year, plastic waste has now moved to the top of the agenda

www.icis.com 11
Brands are now driving the circular economy agenda
Company Targeted
▪ Plastics
▪ All packaging
▪ Plastics
▪ All packaging
▪ All packaging
▪ All packaging
Initiative/commitment
“We are planning that all bottles will be made from 100% recycled plastic and trial non-plastic, biodegradable materials by 2020
“Use 100% recycled plastic in 65% of the entire annual bottle volume by 2020, aiming to go up to 100% for all our consumer goods packaging by 2025”
“100% of plastic packaging will be fully reusable, recyclable or compostable by 2025”
“Aiming to make all its consumer packaging 100% recyclable by 2025 and to have 50% recycled content in its packaging by 2030, ultimately help collect and recycle 100% of the packaging it cells”
“M&S announced that all its plastic packaging in the UK will not only be 100% recyclable, but also 'widely recycled' in the UK by 2022”
“Double recycled resin in plastic packaging (2020 vs. 2010), reduce packaging by 20%, ensure 90% of packaging is recyclable”
▪ All packaging “100% of packaging will be recyclable, compostable or biodegradable, increase recycled materials in its plastic packaging by 2025”

www.icis.com 12
A line in the sand … newplasticseconomy.org
• Elimination of problematic or unnecessary plastic packaging through redesign, innovation, and new delivery models is a priority
• Reuse models are applied where relevant, reducing the need for single-use packaging
• All plastic packaging is 100% reusable, recyclable, or compostable
• All plastic packaging is reused, recycled, or composted in practice
• The use of plastic is fully decoupled from the consumption of finite resources
• All plastic packaging is free of hazardous chemicals, and the health, safety, and rights of all people involved are respected.

www.icis.com 13
Where recycling is technically easy, expect big rise in production from recycled material
ICIS Supply & Demand Database
-
10000
20000
30000
40000
50000
60000
70000
80000
‘00
0 t
on
es
Global HDPE recycled production grows to 7% by 2030
Production Ex VIRGIN RESIN Production Ex RECYCLE
-
10000
20000
30000
40000
50000
60000
70000
80000
'00
00
to
nn
es
Global HDPE recycled production at 33.5%* in 2030
Production Ex VIRGIN RESIN Production Ex RECYCLE
*50% of today’s average global recycling rate for aluminium, steel and glass

www.icis.com 14ICIS Supply & Demand Database
Disappearing demand where recycling does not happen
-
10000
20000
30000
40000
50000
60000
70000
2018 2019 2020 2021 2022 2023 2024 2025 2026 2027 2028 2029 2030
'00
0 t
on
nes
LLDPE: 118m tonnes of lost cumulative global demand
Base case: Growth averages 4.6% per annumm Growth averages 1%
55% of LLDPE consumption is into single-use applications

www.icis.com 15ICIS Supply & Demand Database
Circular Economy threatens cracker operating rates
80%
82%
84%
86%
88%
90%
92%
-
50000
100000
150000
200000
250000
300000
Op
erat
ing
rate
s
'00
0 t
on
nes
/yea
r
Global ethylene capacity
Operating rates under LLDPE base case
Operating rates under LLDPE downside
• Current cracker plans seem to ignore the demand reduction from Circular Economy
• Margins on non-integrated crackers will be squeezed and will see no relief
www.icis.com 16
Protectionism and trade wars are here to stay
• The current trade wars are symptoms of the end of the baby boom in the west
• The easy growth of the past is no longer needed, so people see no value and only threats in globalization
• America continues to worry about the threat from Chinese technology
• America views China’s manufacturing dominance as a national security threat

www.icis.com 17
Four themes will drive our future
• Feedstock push will support integrated players
• Demand patterns are changing as the demographics change
• The circular economy will massively impact our markets
• Globalisation is already coming to an end

www.icis.com 18
US-China trade war – the context

www.icis.com 19www.icis.com 19
Why China is so important
ICIS Supply & Demand Database
-
20000
40000
60000
80000
100000
120000
140000
160000
1800002
00
0
20
01
20
02
20
03
20
04
20
05
20
06
20
07
20
08
20
09
20
10
20
11
20
12
20
13
20
14
20
15
20
16
20
17
20
18
20
19
20
20
20
21
20
22
20
23
20
24
20
25
20
26
20
27
20
28
20
29
20
30
‘00
0 t
on
nes
Global polyethylene consumption
NORTH AMERICA SOUTH & CENTRAL AMERICA EUROPE
FORMER USSR AFRICA MIDDLE EAST
NORTH EAST ASIA EX-CHINA CHINA ASIA AND PACIFIC
Since 2008 China has become the biggest consumer as well as biggest growth market. Result of post-crisis stimulus and wealth growth
Will remain at around 30% of global consumption –largest of all countries and regions

www.icis.com 20www.icis.com 20
…when it is in a race against time to move up the manufacturing value chain as its populations ages
Meanwhile, it still faces the challenge of 500m of its population who live on less than $5.50 a day
So it cannot possibly agree to stop state subsides for manufacturing
US also closing the door on technology transfers
US is demanding China scrap its economic growth model….

www.icis.com 21www.icis.com 21
Largely overlooked key moment last November when, for the first time, the US National Security Strategy identified China as a geopolitical threat
Mike Pence: China now spends as much on its military as the rest of Asia combined. Beijing has prioritisedcapabilities to erode America’s military advantages. But they will fail.
Democrat support for Trump’s China policies
The threat of a new Cold War

www.icis.com 22www.icis.com 22
Speculative shadow lending down by $698nn year-on-year in January-October 2018
Total social financing, which is lending via the shadow and state-owned banks, $246bn lower
Financial easing measures taken to help with credit shortages
But on a net basis, credit will be lower in 2018 than last year
China’s environmental clean-up will continue
China debt reduction was already dampening growth

www.icis.com 23
US new capacity: major market disruptions if trade war continues

www.icis.com 24www.icis.com 24
Overreliance on China as US PE surpluses rise
ICIS Supply & Demand Database
All grades of HDPE and 93% of grades of LLDPE US exports to China affected by duties
But evidence traders are avoiding all cargoes
US needs China more than China needs US – e.g. only 5% of Chinese 2017 PE imports from US, but 11% of US exports-
5000
10000
15000
20000
25000
2019 PE global net imports without China 2019 PE global net imports with China
‘00
0 t
on
nes US would need 36% share of
remaining market based on its net exports
16% US market share

www.icis.com 25www.icis.com 25
Biggest impact on LLDPE
ICIS Supply & Demand Database
My forecast is for US total exports to reach 3.7m tonnes next year, up from 2.2m tonnes in 2017
Exports as a percentage of production at record high so far in 2018
US production to rise 12% in 2019 with local demand up just 2%
-
1000
2000
3000
4000
5000
6000
7000
8000
9000
Global net imports including China Global net imports excluding China
,00
0 t
on
nes
LLDPE in 2019
US would need 27% global market share
US would need 53%
www.icis.com 26www.icis.com 26
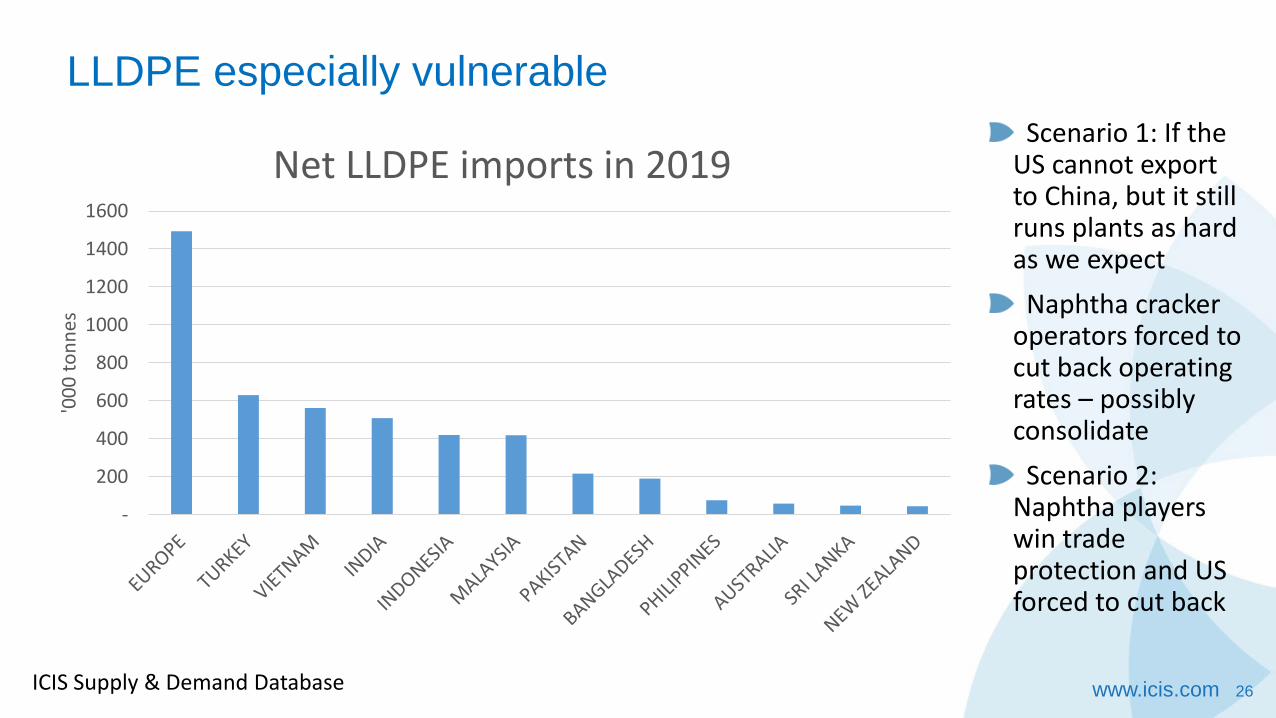
LLDPE especially vulnerable
ICIS Supply & Demand Database
Scenario 1: If the US cannot export to China, but it still runs plants as hard as we expect
Naphtha cracker operators forced to cut back operating rates – possibly consolidate
Scenario 2: Naphtha players win trade protection and US forced to cut back
-
200
400
600
800
1000
1200
1400
1600
'00
0 t
on
nes
Net LLDPE imports in 2019

www.icis.com 27www.icis.com 27
China will account for 84% of global net imports between 2018 and 2025
US will swing from net imports of 4m tonnes in 2008-2017 to net exports of 8.3m tonnes in 2018-2025 (big surpluses after 2020)
This is what could happen if US has no access to China!
Big impact on ethylene glycols longer term
- 20,000 40,000 60,000 80,000 100,000 120,000
Global net imports excludling China
Global net imports including China
Ethylene glycols in 2018-2025
US would need 53% share of this market
9% US marketshare
ICIS Supply & Demand Database

www.icis.com 28
China thought it had more time to make this multi-generational project work
But risk of losing US export markets has made the project more urgent
It has also created major geopolitical and economic opportunity for China to replace the US
In its largest definition, the Belt and Road Initiative would include 78 countries, 4.4 billion people and about 40% of global GDP – the World Bank
China is accelerating BRI because of the US

www.icis.com 29www.icis.com 29
One centred on China and its trading and geopolitical partners. This could comprise most of the developing world –and most consumption and growth
The other trading bloc centred on the US and its partners
Where does this leave the Middle East?
Two new trading blocs – US petchems face major risk
ICIS Supply & Demand Database
China 36%
Asia P15%
NE Asia Ex china8%
Africa3%
Former USSR2%
Middle East 5%
Europe14%
S&C America4%
North America13%
2018-2025 percentage shares of PE, PP, styrene and ethylene glycols consumption
www.icis.com 30
Sustainability and other risks to Chinese growth

www.icis.com 31www.icis.com 31
But this might lead to lower than expected per capita polymer consumption:
1. The rich, apart from sustainability concerns, don’t want to waste time in traffic jams
2. China government funding for autonomous driving and ride-hailing
3. Focus on improving air quality
4. The time poor, cash rich and the washing machine
China’s booming urban clusters are driving wealth growth
Bloomberg picture, September 2018: Hong Kong surpasses New Yorkin number of super rich (number of people worth at least $30m)
South China Morning Post: Baidu autonomous cars funded byIts Nasdaq-listed Apollo Fund

www.icis.com 32
0.00
5.00
10.00
15.00
20.00
25.00
30.00
35.00
-
5,000
10,000
15,000
20,000
25,000
30,000
35,000
40,000
45,000
50,000
2018 2019 2020 2021 2022 2023 2024 2025 2026 2027 2028 2029 2030
Base case in '000 tonnes
Downside in '000 tonnes
Base case per capita consumption in kilograms
Downside per capita consumption in kilograms
ICIS Supply & Demand Database
Base case: China’s per capita PP consumption rising from 19.9 kilograms in 2018 to 32.3 kilograms in 2030.
This would result in PP demand growing from 27.6m tonnes in 2018 to 45.4m tonnes in 2030.
Downside scenario: Only reaches 28.3 kilograms in 2030 with 19m tonnes of lost demand
Quantifying downside for PP

www.icis.com 33www.icis.com 33
Benefit of urbanisation: Beijing per capita consumption at 46 kilograms last year up from 16 kilograms in 2000
Meanwhile, Gansu, poorest region in China, rose to 10 kilograms from 1.5 kilograms
Boost from further more urbanisationand wealth growth
Booming internet sales a further factor?
Jing Daily, IMF and ICIS Supply & Demand Database
0.0
5.0
10.0
15.0
20.0
25.0
30.0
35.0
40.0
45.0
50.0
Be
ijin
g
Shan
ghai
Tian
jin
Jian
gsu
Zhe
jian
g
Fuji
an
Inn
er
Mo
ngo
lia
Gu
angd
on
g
Shan
do
ng
Ch
on
gqin
g
Hu
be
i
Shaa
nxi
Jilin
Liao
nin
g
Nin
gxia
Hu
nan
Hai
nan
Heb
ei
Hen
an
Jian
gxi
Xin
jian
g
Sich
uan
Qin
ghai
An
hu
i
Hei
lon
gjia
ng
Gu
angx
i
Shan
xi
Tib
et
Gu
izh
ou
Yu
nn
an
Gan
su
Kilo
gram
s
PE per capita consumption by province and other administrative regions in 2017
Potential for inland wealth growth to accelerate

www.icis.com 34www.icis.com 34
Sustainability issues drive “less is more” focus on plastic packaging as recycling replaces virgin resins
Residents in poorer inland cities lack access to sufficient health care and education
Unless China escapes middle income trap faces major pension, healthcare shortfalls
2030 consumption 10.6m tonnes lower
What if per capita consumption growth disappoints?
0
10000
20000
30000
40000
50000
60000
Scenario 1: Average PE per capitaconsumption at 34.9 Kgs (up from 21.5
kgs in 2018)
Scenario 2: Average PE per capitaconsumption at 28.9 Kgs
'00
0 t
on
nes
China PE consumption in 2030
ICIS Supply & Demand Database

www.icis.com 35
Our concluding thoughts

www.icis.com 36www.icis.com 36
Just two of many scenariosScenario 1 - China/US reach deal and sustainability small effect
• Trump/XI reach a compromise. OR Trump leaves office and
US/China trade war ends
• Petchem world remains fully globalised
• US production and export growth continue
• Producers in other regions continue today’s strong capacity
growth
• Demand big enough to easily absorb new capacities
• Pushback against plastic waste has small effect on demand
Scenario 2 - China/US fail to resolve differences and
sustainability has major effect
• Trade war escalates
• New world of China + friends versus US + friends
• US unable to export to China and so floods Europe and
developing world ex-China with excess supply
• US and other projects are cancelled
• Global investment also slows on demand loss from plastic
rubbish crisis

www.icis.com 37www.icis.com 37
Feedstock push will support integrated players
Demand patterns are changing as the demographics change
The circular economy will massively impact our markets
Globalisation is already coming to an end
Winning in the new world requires focus