Feedgrain and Wheat Situation & Outlook John D. Anderson Mississippi State University.
29
Feedgrain and Wheat Situation & Outlook John D. Anderson Mississippi State University
-
Upload
horatio-little -
Category
Documents
-
view
219 -
download
3
Transcript of Feedgrain and Wheat Situation & Outlook John D. Anderson Mississippi State University.

Feedgrain and Wheat Situation & Outlook
John D. AndersonMississippi State University

Commodity Markets in the News
• Record high commodity prices leading to…– … credit crunch for grain elevators and reduced
forward pricing against deferred contracts– … proposed tighter limits on speculative trading– … possible early out for some CRP land– … discussion of partial waiver of RFS biofuel
mandates– … export taxes in several countries (see, e.g.,
Argentina)

What’s behind all this?
• It depends – mostly on who you ask• Plenty of suspects– Wheat crop failures in 2006 and 2007– Economic growth in India and China– High crude oil prices– Bioenergy production in developed countries– Commodity market speculation

World Production of Grains

World Stocks/Use Ratio: Total Grains

Corn Highlights
• Corn prices began moving sharply higher in Fall 2006
• In 2008, prices moved well past previous record set in July 1996
• Futures prices reflect expectations of relatively high prices as far out as contracts are traded

Weekly Chicago Corn (Cash)

CBOT Corn: September 22, 2008

Corn Highlights
• Corn prices began moving sharply higher in Fall 2006• In 2008, prices moved well past previous record set in
July 1996• Futures prices reflect expectations of high prices as far
out as contracts are traded• Current economic uncertainty creating huge volatility• Pullback from June highs reflects… – … improving crop condition ratings– … effect of outside markets (esp. crude oil, dollar)– But longer term fundamentals are exceptionally strong

Corn Market Volatility: CZ8
Date Close ChangeSep 15 562’0 -1’2Sep 16 532’2 -29’6Sep 17 554’0 +21’6Sep 18 527’2 -26’6Sep 19 542’2 +15’0

DEC08 Corn

DEC08 Corn
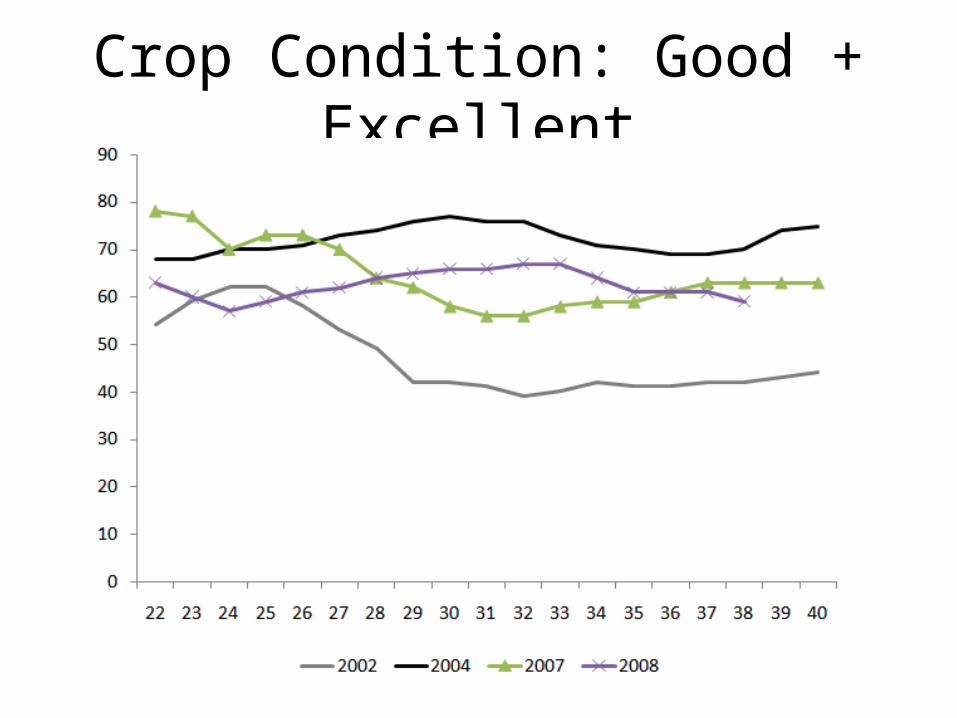
Crop Condition: Good + Excellent


Corn Balance Sheet2004/05 2005/06 2006/07 2007/08 2008/09
Planted Ac.
80.9 81.8 78.3 93.6 87.0
Harv. Acres
73.6 75.1 70.6 86.5 79.3
Yield 160.4 148.0 149.1 151.1 152.3
Prod. 11.807 11.114 10.535 13.074 12.072
Ethanol 1.323 1.603 2.117 3.000 4.100
Exports 1.818 2.147 2.125 2.425 2.000
Total Use 10.662 11.270 11.210 12.820 12.645
End. Stks. 2.114 1.967 1.304 1.576 1.018
Price 2.06 2.00 3.04 4.205.00-6.00
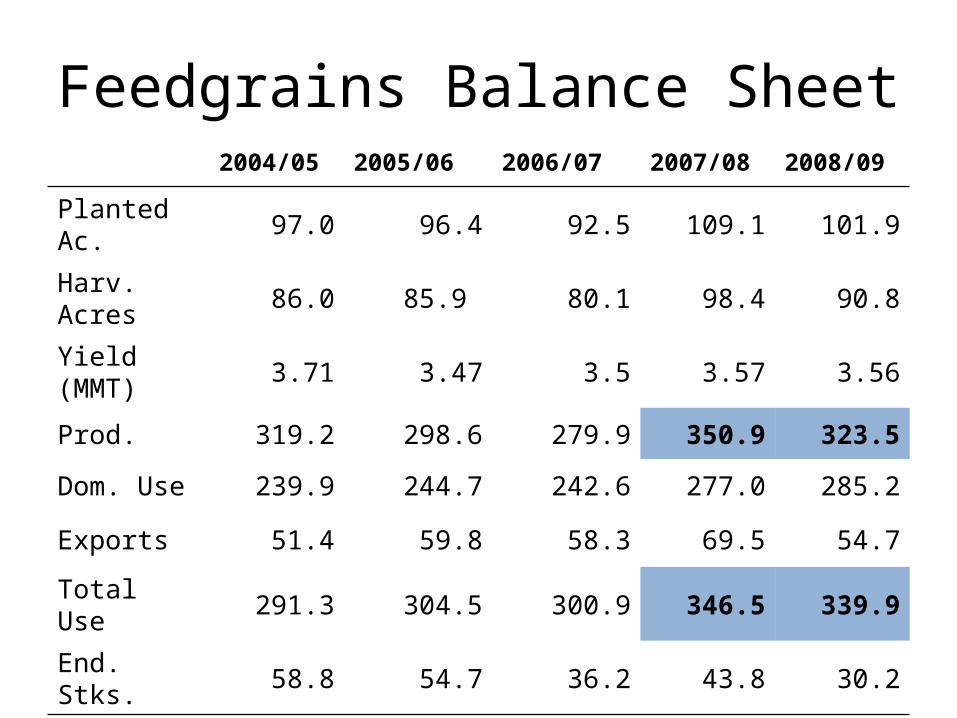
Feedgrains Balance Sheet2004/05 2005/06 2006/07 2007/08 2008/09
Planted Ac.
97.0 96.4 92.5 109.1 101.9
Harv. Acres
86.0 85.9 80.1 98.4 90.8
Yield (MMT)
3.71 3.47 3.5 3.57 3.56
Prod. 319.2 298.6 279.9 350.9 323.5
Dom. Use 239.9 244.7 242.6 277.0 285.2
Exports 51.4 59.8 58.3 69.5 54.7
Total Use 291.3 304.5 300.9 346.5 339.9
End. Stks. 58.8 54.7 36.2 43.8 30.2

Corn Stocks/Use

Does the RFS Matter?
• RFS mandate has an enormous impact on market participant expectations– With respect not just to the level but also to the
stability of demand– Because of mandates, corn demand from ethanol
sector should be less price responsive than other sectors
• Effect of oil prices is also critically important– High oil price supports corn use for ethanol
despite higher corn prices

RFS Mandate History

Corn Use Components
57.8%
54.6%
49.9%
47.2%
41.1%
12.4%
14.2%
18.9%
23.4%
32.4%
12.8%
12.2%
12.2%
10.5%
10.6%
17.1%
18.9%
19.0%
18.9%
15.8%
0% 20% 40% 60% 80% 100%% of Total Corn Use
Mar
ket
ing
Yea
r
Feed & Residual Ethanol Other Industrial Exports

Corn Use: US Ethanol v. Foreign Feed

Two Models of Corn Demand
No Mandate Mandate

RFS Mandate and Demand

Distribution of Corn P & Q
Price Quantity

Summary• High prices for corn• High offtake of corn despite high prices– Weak dollar– Ethanol production
• A bit of slack showing up in world grain stocks, but US corn balance sheet tighter in 2008/09– Lower 2008 plantings– And potential for late-season damage
• But corn fundamentals will likely be overwhelmed by outside market influences

Wheat Highlights
• Declining world stocks in 2006/07 and 2007/08 due largely to production problems in key production regions
• Soaring prices in winter 2008• Larger production in 2008 increasing stocks,
decreasing prices– But, strong fundamentals for corn and beans will
continue to support prices• Weak basis, high production costs likely to
reduce US acreage this fall

Wheat Balance Sheet2004/05 2005/06 2006/07 2007/08 2008/09
Planted Ac.
59.7 57.2 57.3 60.4 63.5
Harv. Acres
50.0 50.1 46.8 51.0 56.6
Yield 43.2 42.0 38.7 40.5 43.5
Prod. 2.158 2.105 1.812 2.067 2.462
Dom. Use 1.169 1.152 1.140 1.066 1.294
Exports 1.066 1.003 0.908 1.264 1.000
Total Use 2.235 2.155 2.049 2.330 2.294
End. Stks. 0.540 0.571 0.456 0.306 0.574
Price 3.40 3.42 4.26 6.486.70-7.80

Wheat Stocks/Use

US Avg. April Fertilizer Prices
Source: USDA-NASS, Agricultural Prices, April.