Feedback-Directed Instrumentation for Deployed JavaScript ... · PDF fileFeedback-Directed...
16
Feedback-Directed Instrumentation for Deployed JavaScript Applications Magnus Madsen * University of Waterloo Waterloo, Ontario, Canada [email protected] Frank Tip Samsung Research America Mountain View, CA, USA [email protected] Esben Andreasen * Aarhus University Aarhus, Denmark [email protected] Koushik Sen EECS Department UC Berkeley, CA, USA [email protected] Anders Møller Aarhus University Aarhus, Denmark [email protected] ABSTRACT Many bugs in JavaScript applications manifest themselves as objects that have incorrect property values when a failure occurs. For this type of error, stack traces and log files are often insufficient for diagnosing problems. In such cases, it is helpful for developers to know the control flow path from the creation of an object to a crashing statement. Such crash paths are useful for understanding where the object originated and whether any properties of the object were corrupted since its creation. We present a feedback-directed instrumentation technique for computing crash paths that allows the instrumentation overhead to be distributed over a crowd of users and to re- duce it for users who do not encounter the crash. We imple- mented our technique in a tool, Crowdie, and evaluated it on 10 real-world issues for which error messages and stack traces are insufficient to isolate the problem. Our results show that feedback-directed instrumentation requires 5% to 25% of the program to be instrumented, that the same crash must be observed 3 to 10 times to discover the crash path, and that feedback-directed instrumentation typically slows down execution by a factor 2x–9x compared to 8x–90x for an approach where applications are fully instrumented. 1. INTRODUCTION Despite the best efforts of software engineers and testers, software shipped to end users still contains bugs, causing applications to crash or produce incorrect results. Failures that occur post-deployment are often reported via on-line error reporting facilities, 1 or in a bug reporting forum. De- pending on the type of problem, additional information may * The work of these authors was carried out during intern- ships at Samsung Research America. 1 E.g. Windows Error Reporting [22] or CrashReporter [5]. Permission to make digital or hard copies of all or part of this work for personal or classroom use is granted without fee provided that copies are not made or distributed for profit or commercial advantage and that copies bear this notice and the full cita- tion on the first page. Copyrights for components of this work owned by others than ACM must be honored. Abstracting with credit is permitted. To copy otherwise, or re- publish, to post on servers or to redistribute to lists, requires prior specific permission and/or a fee. Request permissions from [email protected]. ICSE ’16, May 14-22, 2016, Austin, TX, USA © 2016 ACM. ISBN 978-1-4503-3900-1/16/05. . . $15.00 DOI: http://dx.doi.org/10.1145/2884781.2884846 be available along with failure reports. For example, log files may exist that contain a summary of an application’s exe- cution behavior, or a dump of an application’s state at the time of a crash. However, such information is often of lim- ited value, because the amount of information can be over- whelming (e.g., log files may span many megabytes, most of which is typically completely unrelated to the failure), or is woefully incomplete (e.g., a stack trace or memory dump usually provides little insight into how an application arrived in an erroneous state). Many bugs that arise in JavaScript applications manifest themselves as objects that have incorrect property values when a failure occurs. This includes situations where an ob- ject is created with incorrect or missing property values, and where properties are corrupted after the object was created. In such cases, it is helpful for developers to know the control- flow path from the creation of the object of interest to the crashing statement. We will refer to such a path as a crash path. In the case studies reported on in this paper, we con- sider real-life bugs where the error message and stack trace provided with a bug report are insufficient to find and fix the underlying cause of a bug. In these case studies, infor- mation contained in the crash path provided crucial hints to developers in a debugging scenario. In principle, crash paths could be obtained by instrumenting applications so that control-flow is recorded as the program executes and exercising the application until the same failure is encoun- tered. Unfortunately, such a“full instrumentation”approach tends to incur prohibitive runtime overhead and is indiscrim- inate in that much of the instrumentation occurs in regions of the code unrelated to the failure. Furthermore, in many cases, developers do not need an entire execution history as much of it tends to be unrelated to the bug being pursued. In this paper, we present a feedback-directed technique for computing crash paths in scenarios where the same failure can be observed repeatedly. The technique relies on repeat- edly deploying new versions of the application in which the amount of instrumentation is gradually increased to uncover successively longer suffixes of the crash path. This process continues until the complete crash path is found (i.e., the al- location site for the object of interest is found). We believe that our technique is particularly well-suited for a scenario where users collectively isolate crash paths associated with bugs in deployed software. In the scenario we envision, users 1
Transcript of Feedback-Directed Instrumentation for Deployed JavaScript ... · PDF fileFeedback-Directed...

Feedback-Directed Instrumentationfor Deployed JavaScript Applications
Magnus Madsen∗
University of WaterlooWaterloo, Ontario, Canada
Frank TipSamsung Research America
Mountain View, CA, [email protected]
Esben Andreasen∗
Aarhus UniversityAarhus, Denmark
EECS DepartmentUC Berkeley, CA, USA
Anders MøllerAarhus UniversityAarhus, Denmark
ABSTRACTMany bugs in JavaScript applications manifest themselvesas objects that have incorrect property values when a failureoccurs. For this type of error, stack traces and log files areoften insufficient for diagnosing problems. In such cases, itis helpful for developers to know the control flow path fromthe creation of an object to a crashing statement. Suchcrash paths are useful for understanding where the objectoriginated and whether any properties of the object werecorrupted since its creation.
We present a feedback-directed instrumentation techniquefor computing crash paths that allows the instrumentationoverhead to be distributed over a crowd of users and to re-duce it for users who do not encounter the crash. We imple-mented our technique in a tool, Crowdie, and evaluated iton 10 real-world issues for which error messages and stacktraces are insufficient to isolate the problem. Our resultsshow that feedback-directed instrumentation requires 5% to25% of the program to be instrumented, that the same crashmust be observed 3 to 10 times to discover the crash path,and that feedback-directed instrumentation typically slowsdown execution by a factor 2x–9x compared to 8x–90x foran approach where applications are fully instrumented.
1. INTRODUCTIONDespite the best efforts of software engineers and testers,
software shipped to end users still contains bugs, causingapplications to crash or produce incorrect results. Failuresthat occur post-deployment are often reported via on-lineerror reporting facilities,1 or in a bug reporting forum. De-pending on the type of problem, additional information may
∗The work of these authors was carried out during intern-ships at Samsung Research America.1E.g. Windows Error Reporting [22] or CrashReporter [5].
Permission to make digital or hard copies of all or part of this work for personal orclassroom use is granted without fee provided that copies are not made or distributedfor profit or commercial advantage and that copies bear this notice and the full cita-tion on the first page. Copyrights for components of this work owned by others thanACM must be honored. Abstracting with credit is permitted. To copy otherwise, or re-publish, to post on servers or to redistribute to lists, requires prior specific permissionand/or a fee. Request permissions from [email protected].
ICSE ’16, May 14-22, 2016, Austin, TX, USA© 2016 ACM. ISBN 978-1-4503-3900-1/16/05. . . $15.00
DOI: http://dx.doi.org/10.1145/2884781.2884846
be available along with failure reports. For example, log filesmay exist that contain a summary of an application’s exe-cution behavior, or a dump of an application’s state at thetime of a crash. However, such information is often of lim-ited value, because the amount of information can be over-whelming (e.g., log files may span many megabytes, mostof which is typically completely unrelated to the failure), oris woefully incomplete (e.g., a stack trace or memory dumpusually provides little insight into how an application arrivedin an erroneous state).
Many bugs that arise in JavaScript applications manifestthemselves as objects that have incorrect property valueswhen a failure occurs. This includes situations where an ob-ject is created with incorrect or missing property values, andwhere properties are corrupted after the object was created.In such cases, it is helpful for developers to know the control-flow path from the creation of the object of interest to thecrashing statement. We will refer to such a path as a crashpath. In the case studies reported on in this paper, we con-sider real-life bugs where the error message and stack traceprovided with a bug report are insufficient to find and fixthe underlying cause of a bug. In these case studies, infor-mation contained in the crash path provided crucial hintsto developers in a debugging scenario. In principle, crashpaths could be obtained by instrumenting applications sothat control-flow is recorded as the program executes andexercising the application until the same failure is encoun-tered. Unfortunately, such a“full instrumentation”approachtends to incur prohibitive runtime overhead and is indiscrim-inate in that much of the instrumentation occurs in regionsof the code unrelated to the failure. Furthermore, in manycases, developers do not need an entire execution history asmuch of it tends to be unrelated to the bug being pursued.
In this paper, we present a feedback-directed technique forcomputing crash paths in scenarios where the same failurecan be observed repeatedly. The technique relies on repeat-edly deploying new versions of the application in which theamount of instrumentation is gradually increased to uncoversuccessively longer suffixes of the crash path. This processcontinues until the complete crash path is found (i.e., the al-location site for the object of interest is found). We believethat our technique is particularly well-suited for a scenariowhere users collectively isolate crash paths associated withbugs in deployed software. In the scenario we envision, users
1

install applications from a central software repository (e.g.,through an app store or a package manager). When a crashis encountered by a user, new versions of the applicationthat contain additional instrumentation can be distributedto other users so that the effort of isolating crash paths isdistributed over a user population. Furthermore, while ourfeedback-directed instrumentation approach occurs signifi-cant overhead, this tends to be up to an order of magnitudeless than an approach where applications are fully instru-mented. Similar crowdsourcing techniques for debuggingwere pioneered by Liblit et al. [18, 19] and by Orso et al.[10, 12], although they do not consider the specific problemof computing crash paths. We implemented the techniqueusing Jalangi [28], and evaluated it on crashing executions ofJavaScript applications available from GitHub. We reporton instrumentation overhead and on the number of timesthat the same crash needs to be encountered to recover thecomplete crash path. In summary, the contributions are:
● We propose the notion of a crash path as a supple-ment to error messages and stack traces. A crash pathrecords the path from the creation of an object of in-terest to a crashing statement.
● We present a technique for computing crash paths basedon feedback-directed program instrumentation. Thistechnique identifies increasingly longer suffixes of crashpaths in successive executions of the application, bygradually increasing the amount of instrumentation.
● We implemented a prototype of our technique in a toolcalled Crowdie and used it to debug 10 real-world is-sues previously reported on GitHub. Our case studyshows that error messages and stack traces are insuffi-cient to debug these issues, and that crash paths pro-vide useful hints to developers debugging these issues.
● Our experimental evaluation shows that only 5% to25% of the program is instrumented, that the samecrash must be observed between 3 to 10 times to re-cover complete crash paths, and that the feedback-directed instrumentation has a typical slowdown of 2x–9x compared to 8x–90x with full instrumentation.
Furthermore, we argue informally that our technique iswell-suited to a “crowdsourcing” scenario, where the effort ofidentifying crash paths is distributed over a user population.
2. MOTIVATING EXAMPLESIn this section, we look at two real-world bugs in popular
JavaScript libraries. What these bugs have in common isthat traditional debugging information (e.g., the error mes-sage, the line on which the crash occurs, and the stack trace)is insufficient to locate the root cause of the defect. We willshow how, in each case, the crash path provides informationthat is vital for understanding and fixing the bug.
Loki Issue #0046. Loki is a database written in Java-Script. In issue #0046, entitled “Clearing collection breaksindex”,2 a user reports that “after clearing a collection Iwasn’t able to insert new objects without error.” Such areport is typically not enough for the developer to reproducethe bug and locate its cause. A stack trace, which may besent automatically to the server when a crash occurs, mayprovide some hints but is also often insufficient. To keep
2https://github.com/techfort/LokiJS/issues/46
the example simple, imagine that we just try to execute thefollowing four lines (example1.js) inspired by the text in thereport, which happen to be enough to encounter the error:
1 var db = new loki(’Example ’);2 var col = db.addCollection (/* omitted */);3 col.clear ();4 col.insert ({ /* omitted */});
Running this code makes Loki throw an exception with thefollowing stack trace:
TypeError: undefined is not a functionat Collection.add (loki.js:1789)at Collection.insert (loki.js :1661)at Object.<anonymous > (example1.js:4)
This stack trace tells us that the crash occurs at line 1789in loki.js, which is executed due to the call col.insert online 4. Line 1789 in loki.js looks as follows:
1789 this.idIndex.push(obj.id);
As there is only one function call on this line, one can inferthat this.idIndex.push is undefined. From this, a devel-oper may conclude that the value of this.idIndex or itspush property is incorrect. To find the root cause of thecrash we need to know what is the value of this.idIndex,and why the push property is undefined. Was it never set,or was it perhaps mistakenly overwritten?
We cannot answer these questions easily by inspectingthe stack trace and source code. We could use a tool suchas grep to search for this.idIndex, but such an approachis very crude and may match statements unrelated to thecrash. What we want to know is (a) where was the objectreferred to by this.idIndex created, and (b) how was thepush property of this object modified in the time betweenits creation and the crash. Our Crowdie tool computes thisinformation automatically. Applying Crowdie to this pro-gram reveals that the object referred to by this.idIndexoriginates from line 1670 in loki.js:
1670 this.idIndex = {};
At this point, the root cause becomes clear: this line as-signs the idIndex property with an empty object instead ofan empty array. Arrays have a push method, whereas ordi-nary objects do not, which causes the expressionthis.idIndex.push to evaluate to undefined, and calling thepush method on undefined results in the exception beingthrown. Crowdie also reveals that no writes to the pushproperty of the object occur before the crash.
Upon realizing this problem, a project maintainer fixedthe issue3 by assigning an array instead of an object tothis.idIndex on line 1670 of loki.js.
To find this problem using Crowdie, this.idIndex is des-ignated as an object of interest. Then, Crowdie producesthe following crash path (shown simplified here; details ofthe path format are described in Section 3.1, and detailsabout the actual path for this bug appear in Table 1):
Start(loki.js:1670) this.idIndex = {};Return(example1.js:3) col.clear();Call(example1.js:4) col.insert({ .. });Call(loki.js:1661) this.add(doc);Crash(loki.js:1789) this.idIndex.push(obj.id);
With this information, the developer would be able to quicklyidentify the buggy assignment on line 1670.
3Commit 5da46aeecda6046f738c6a612c2f181b21487108
2

Immutable Issue #0381. Immutable is a JavaScriptcollection library created by Facebook. In issue #0381, enti-tled“subCursor (cursor.cursor(’a’)) returns improper type”,4
a user reports that the cursor method may return the wrongtype of cursor. The following code fragment (example2.js),reported by the user, is a highly simplified version of theactual application code that triggers the bug:
1 var data = Immutable.fromJS ({a: [1 ,2 ,3]});2 var cursor = Cursor.from(data);3 var deepCursor = cursor.cursor(’a’);4 assert(deepCursor instanceof IndexedCursor );
In this example, the stack trace only tells us that theassertion on line 4 fails:
Error: AssertionErrorat Object.<anonymous > (example2.js:4)
We see that the value of deepCursor returned by the callto cursor.cursor has the wrong type, causing the asser-tion to fail. However, it is not obvious whether the callCursor.from(data) on line 2 or the call cursor.cursor(’a’)on line 3 is at fault.
At this point, we ask Crowdie to find where the erro-neous deepCursor object was allocated and by what path itreached the assertion. In response, Crowdie produces thefollowing crash path:
Start(cursor.js:242) ..new CursorClass(r,k,c,s);Return(cursor.js:250) return makeCursor(Return(cursor.js:187) ..subCursor(this, s);Return(example2.js:3) ..cursor.cursor(’a’);Crash(example2.js:4) assert(deepCursor ..);
This crash path shows that the object was created on line 242in function makeCursor in cursor.js, which looks as follows:
236 function makeCursor(r, k, c, value) {237 if (arguments.length < 4) {238 value = r.getIn(k);239 }240 var s = value && value.size;241 var CursorClass = Iterable.isIndexed(
value) ? IndexedCursor : KeyedCursor;242 return new CursorClass(r, k, c, s);243 }
Looking at this code, we see that an object with thewrong type could be allocated for two reasons: (1) functionisIndexed is buggy, or (2) value somehow has an incorrectvalue. We also note that makeCursor implements overload-ing by checking the number of arguments on line 237.
The crash path produced by Crowdie not only tells usthat the object originated from line 242 but also provides in-formation about the call stack when this object was created.This call stack can be obtained by observing that Return la-bels on the produced path must have had matching callsthat occurred earlier. From this call stack, we learn thatmakeCursor was invoked by subCursor:
249 function subCursor(cursor , k, value) {250 return makeCursor(251 cursor._rootData ,252 newKeyPath(cursor._keyPath , k),253 cursor._onChange ,254 value255 ); }
Crucially, we observe that subCursor always passes fourarguments to makeCursor on line 250 and that the fourth
4https://github.com/facebook/immutable-js/pull/381
argument value is an argument to subCursor itself. Sinceit always passes four arguments, the condition on line 237will always evaluate to false when called from subCursor.Furthermore, our tool tells us that subCursor, in turn, wascalled by KeyedCursorPrototype.cursor. The calling code ofthat function looks as follows:
187 .. subCursor(this , s);
Here, we can see that subCursor is passed two argumentseven though it has three parameters, so the third parameterwill take on a default value of undefined. The subCursorfunction in turn calls makeCursor with this parameter, whichchecks if it received four arguments instead of checking if thefourth argument has the default value undefined! The coreissue is thus that makeCursor implements an overloadingcheck in a way that subCursor did not anticipate.
The fix5 for the issue is to change the overloading checkin line 237 to value === undefined.
These examples demonstrate how Crowdie can provideinformation that is vital for understanding and fixing bugs,especially in cases where the error message and stack trace ofa crash provides insufficient information. Note that Crowdieis not a fully automated debugging process: a nontrivialamount of human ingenuity may still be needed. However,in both cases, the crash path was sufficient to debug theissue. In particular, the (typically much longer) full execu-tion path from the start of the application was not needed.Here, we have presented the crash paths as plain text, butwe can imagine a scenario where IDEs naturally show thepaths and allow the programmer to “jump” forwards andbackwards through the statements on the path.
3. TECHNIQUEA high-level architecture of the kind of system in which we
envision our technique to be embedded is depicted in Fig-ure 1. We assume a distribution model where users (shownon the left) install their applications through a central server(shown on the right). For example, in the case of client-sideweb applications the server is responsible for sending theJavaScript code to the users. As another example, in thecase of a server-side application, the group of “users” mayconsist of a cluster of servers running the application. Fi-nally, we envision that app stores for (mobile or non-mobile)devices could be extended with the techniques presented inthis paper. To make this practical, an approach to feedback-directed instrumentation would be required that does notrequire pushing out new versions to users frequently. Thelatter could be accomplished by having selected parts of theinstrumentation in an application be enabled or disabledbased on an instrumentation policy that it periodically re-ceives from the server.
The server in Figure 1 has several components, includ-ing an instrumentor component for instrumenting applica-tions according to an instrumentation policy that specifiesthe functions that need to be traced. It also contains ananalyzer component that decides which functions should beinstrumented based on an analysis of traces of crashing ex-ecutions that it receives from users and produces an instru-mentation policy accordingly. In the scenario we envision,the instrumentation policy is updated repeatedly, each timethe same failure is encountered.
5Commit 91afb4100eaed6375ceba239ad624a4453684429
3

instrumented application
instrumentor
users
analyzer
developer
(complete) crash path
original application
instrumentation policy
server
partial crash path
Figure 1: A central server deploys instrumented ver-sions of the program to its users. Crashing usersreport information back to the server.
As users execute the application, some of them will in-evitably encounter a crash (e.g., an uncaught exception, anassertion failure, a suspicious operation [11], or a securitypolicy violation). When this happens, the added instrumen-tation ensures that a crash path is recorded that reflects theset of functions specified in the instrumentation policy. Thiscrash path identifies at least in what function the crash oc-curred and what local and global variables may be relevantto the crash (see Section 4 for more details). The instru-mentation ensures that this crash path is uploaded to theanalyzer component of the server, which in response up-dates the instrumentation policy accordingly. Note that, ingeneral, the crash paths that users upload to the server arepartial crash paths, in the sense that they may not containthe full flow of control from the allocation of an object to thepoint where the crash occurred. However, when the analyzercomponent determines that a bug was localized because thecrash path is complete, the complete crash path is passedto the developer and all instrumentation is disabled for theentire user population.
Various features can be added to the architecture dis-cussed above. For example, the server can be configuredto trace multiple bugs concurrently, and these efforts can becrowdsourced over different subsets of the user population.Furthermore, the server can compare crash paths for differ-ent bugs that it is tracking concurrently, try to determinewhen they are duplicates, and prefer the shortest candidate.
3.1 Execution PathsThe grammar shown in Figure 2 defines the structure of
execution paths constructed by our technique. An executionpath p ∈ Path is a sequence of labels that are recorded duringprogram execution. We capture intra-procedural control-flow using the three labels:
Intra ∶= Branch(s, c) ∣ Start(s) ∣ Crash(s)
The Branch(s, c) label records the value of a conditional cin an if or while statement s. The Start(s) label recordsthat the object of interest originates from statement s. TheCrash(s) label records the statement s where the programcrashed. We use heuristics to determine the object(s) ofinterest in an a crashing statement. For example, if thestatement o.f() crashes because o.f is undefined then theobject o is of interest. On the other hand, if the statementcrashes because o.f is not a function then o.f is of interest.We define similar heuristics for other types of statements.
We say that an execution path that begins with a Startlabel and ends with a Crash label is a crash path. Intu-
Intra ∶= Branch(s, c) ∣ Start(s) ∣ Crash(s, v)Inter ∶= Call(s, f) ∣ Return(s) ∣ Enter(f) ∣ Exit(f)
` ∈ Label ∶= Intra ∣ Inter
p ∈ Path ∶= Label,⋯,Label
f ∈ Fun = the set of functions in the program
s ∈ Stm = the set of statements in the program
Figure 2: Grammar for execution paths.
itively, a crash path identifies a statement where an objectwas created and a sequence of control-flow decisions leadingto a crash where that object was somehow involved. A paththat ends with the Crash label, but does not begin with theStart label is a partial crash path.
Inter-procedural control-flow is tracked using four labels:
Inter ∶= Call(s, f) ∣ Return(s) ∣ Enter(f) ∣ Exit(f)
The Call(s, f) label records a function invocation from callsite s to function f . The Return(s) label records the com-pletion of a call at statement s. The Enter(f) label recordsthat the control-flow has entered function f . The Exit(f)label records that the control-flow has left function f .
Intuitively, the call/return labels represent a function in-vocation as seen from the caller, whereas the enter/exit la-bels represent a function invocation as seen from the callee.The reason for requiring both is that our technique does notinstrument every function, and thus to observe whether ornot calls are missing from a trace, we must record informa-tion inside both the caller and the callee. In particular, anexecution path that has the labels
Call(s, f)→ Enter(f)→ Exit(f)→ Return(s)
is complete because it records the invocation of f from s,the execution inside f and the return of control to s. Onthe other hand, the execution path Call(s, f)→ Return(s),which lacks the Enter and Exit labels, records a call to anuninstrumented function f (if f was instrumented then itsexecution would have generated the appropriate enter/exitlabels). We will discuss in Section 3.3 how this informationis used to determine whether a crash path is complete.
Example I. Consider the code fragment of Figure 3 andthe execution path that is generated when f is invoked withthe arguments x = 7, y = 8 and o = {} (the empty object):For this example, execution crashes when line 5 is reached,because o.missingMethod has the value undefined at thatpoint, and any attempt to call undefined as a function resultsin a crash. The full crash path6 is:
Start(s1)→ Call(s7,f)→ Enter(f)⤦→ Branch(s3,true)→ Branch(s4,true)→ Crash(s5)
Example II. In the example of Figure 3, the crash hap-pened due to the arguments passed to f and a stack tracewould contain all neccessary information to debug the issue.However, this is not always the case as illustrated by theprogram of Figure 4. For this example, the crash path is:
Start(s9)→ Branch(s10,true)→ Exit(f)⤦→ Return(s13)→ Branch(s14,true)→ Crash(s15)
6 We will use the notation sl where l is some line numberin this example and subsequent examples to identify theprogram construct at line l.
4
1 var empty = {};2 function f(x, y, o) {3 if (x > 5)4 if (y > 5)5 o.missingMethod ();6 }7 f(7, 8, empty);
Figure 3: Example I.
8 function f(x) {9 var o = {};
10 if (x > 5)11 return o;12 }13 var o = f(7);14 if (?)15 o.missingMethod ();
Figure 4: Example II.
16 var x;17 function f() { g(); }18 function g() { h(); j(); k(); }19 function h() { i(); }20 function i() { }21 function j() { x = {}; /* empty object */ }22 function k() { l(); m(); }23 function l() { }24 function m() { x.missingMethod (); }25 f();
Figure 5: A JavaScript program.
Note that the path begins inside function f when the objecto is created on line 9 and that it includes the branch choicesmade until the crash at line 15. Anything that occurred priorto that time is not part of the crash path. In particular, thecrash path does not record the initial Call and Enter labelsfor f, but it does record the Exit and Return labels sincethey occurred after the object was created.
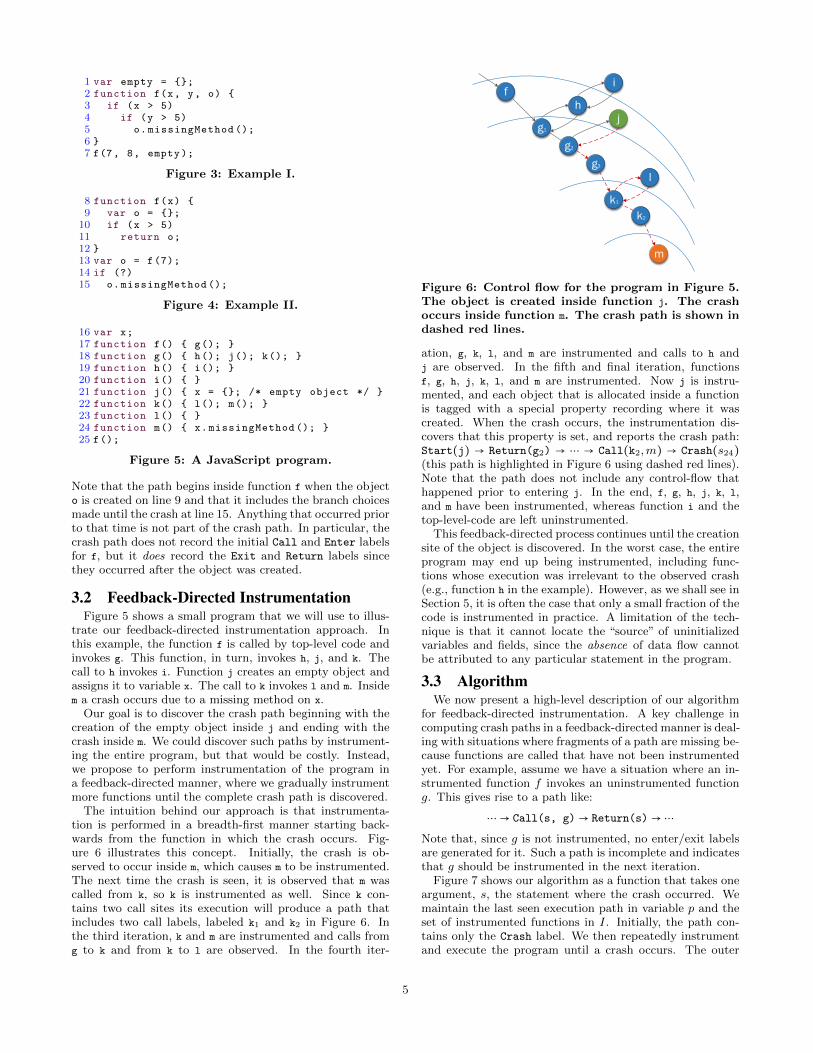
3.2 Feedback-Directed InstrumentationFigure 5 shows a small program that we will use to illus-
trate our feedback-directed instrumentation approach. Inthis example, the function f is called by top-level code andinvokes g. This function, in turn, invokes h, j, and k. Thecall to h invokes i. Function j creates an empty object andassigns it to variable x. The call to k invokes l and m. Insidem a crash occurs due to a missing method on x.
Our goal is to discover the crash path beginning with thecreation of the empty object inside j and ending with thecrash inside m. We could discover such paths by instrument-ing the entire program, but that would be costly. Instead,we propose to perform instrumentation of the program ina feedback-directed manner, where we gradually instrumentmore functions until the complete crash path is discovered.
The intuition behind our approach is that instrumenta-tion is performed in a breadth-first manner starting back-wards from the function in which the crash occurs. Fig-ure 6 illustrates this concept. Initially, the crash is ob-served to occur inside m, which causes m to be instrumented.The next time the crash is seen, it is observed that m wascalled from k, so k is instrumented as well. Since k con-tains two call sites its execution will produce a path thatincludes two call labels, labeled k1 and k2 in Figure 6. Inthe third iteration, k and m are instrumented and calls fromg to k and from k to l are observed. In the fourth iter-
k1
l
g1
h
m
fi
j
g2
g3
k2
Figure 6: Control flow for the program in Figure 5.The object is created inside function j. The crashoccurs inside function m. The crash path is shown indashed red lines.
ation, g, k, l, and m are instrumented and calls to h andj are observed. In the fifth and final iteration, functionsf, g, h, j, k, l, and m are instrumented. Now j is instru-mented, and each object that is allocated inside a functionis tagged with a special property recording where it wascreated. When the crash occurs, the instrumentation dis-covers that this property is set, and reports the crash path:Start(j) → Return(g2) → ⋯ → Call(k2,m) → Crash(s24)(this path is highlighted in Figure 6 using dashed red lines).Note that the path does not include any control-flow thathappened prior to entering j. In the end, f, g, h, j, k, l,and m have been instrumented, whereas function i and thetop-level-code are left uninstrumented.
This feedback-directed process continues until the creationsite of the object is discovered. In the worst case, the entireprogram may end up being instrumented, including func-tions whose execution was irrelevant to the observed crash(e.g., function h in the example). However, as we shall see inSection 5, it is often the case that only a small fraction of thecode is instrumented in practice. A limitation of the tech-nique is that it cannot locate the “source” of uninitializedvariables and fields, since the absence of data flow cannotbe attributed to any particular statement in the program.
3.3 AlgorithmWe now present a high-level description of our algorithm
for feedback-directed instrumentation. A key challenge incomputing crash paths in a feedback-directed manner is deal-ing with situations where fragments of a path are missing be-cause functions are called that have not been instrumentedyet. For example, assume we have a situation where an in-strumented function f invokes an uninstrumented functiong. This gives rise to a path like:
⋯→ Call(s, g)→ Return(s)→ ⋯
Note that, since g is not instrumented, no enter/exit labelsare generated for it. Such a path is incomplete and indicatesthat g should be instrumented in the next iteration.
Figure 7 shows our algorithm as a function that takes oneargument, s, the statement where the crash occurred. Wemaintain the last seen execution path in variable p and theset of instrumented functions in I. Initially, the path con-tains only the Crash label. We then repeatedly instrumentand execute the program until a crash occurs. The outer
5
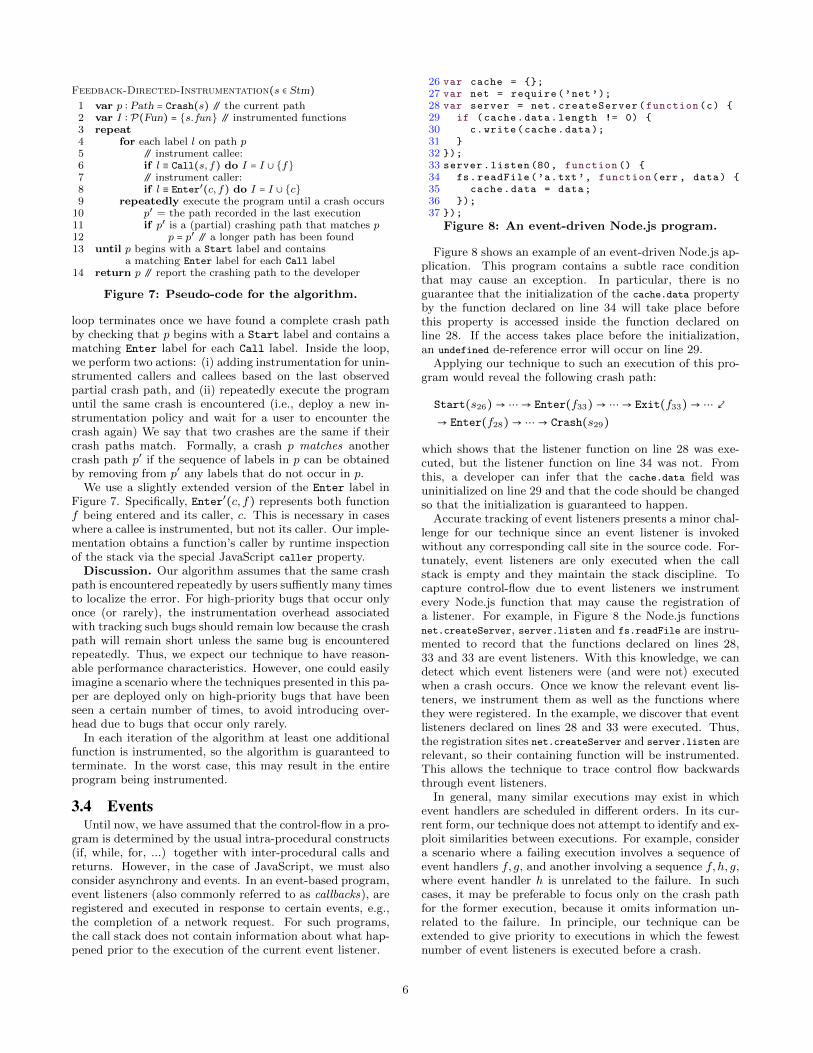
Feedback-Directed-Instrumentation(s ∈ Stm)1 var p ∶ Path = Crash(s) // the current path2 var I ∶ P(Fun) = {s. fun} // instrumented functions3 repeat4 for each label l on path p5 // instrument callee:6 if l ≡ Call(s, f) do I = I ∪ {f}7 // instrument caller:8 if l ≡ Enter′(c, f) do I = I ∪ {c}9 repeatedly execute the program until a crash occurs
10 p′ = the path recorded in the last execution11 if p′ is a (partial) crashing path that matches p12 p = p′ // a longer path has been found13 until p begins with a Start label and contains
a matching Enter label for each Call label14 return p // report the crashing path to the developer
Figure 7: Pseudo-code for the algorithm.
loop terminates once we have found a complete crash pathby checking that p begins with a Start label and contains amatching Enter label for each Call label. Inside the loop,we perform two actions: (i) adding instrumentation for unin-strumented callers and callees based on the last observedpartial crash path, and (ii) repeatedly execute the programuntil the same crash is encountered (i.e., deploy a new in-strumentation policy and wait for a user to encounter thecrash again) We say that two crashes are the same if theircrash paths match. Formally, a crash p matches anothercrash path p′ if the sequence of labels in p can be obtainedby removing from p′ any labels that do not occur in p.
We use a slightly extended version of the Enter label inFigure 7. Specifically, Enter′(c, f) represents both functionf being entered and its caller, c. This is necessary in caseswhere a callee is instrumented, but not its caller. Our imple-mentation obtains a function’s caller by runtime inspectionof the stack via the special JavaScript caller property.
Discussion. Our algorithm assumes that the same crashpath is encountered repeatedly by users suffiently many timesto localize the error. For high-priority bugs that occur onlyonce (or rarely), the instrumentation overhead associatedwith tracking such bugs should remain low because the crashpath will remain short unless the same bug is encounteredrepeatedly. Thus, we expect our technique to have reason-able performance characteristics. However, one could easilyimagine a scenario where the techniques presented in this pa-per are deployed only on high-priority bugs that have beenseen a certain number of times, to avoid introducing over-head due to bugs that occur only rarely.
In each iteration of the algorithm at least one additionalfunction is instrumented, so the algorithm is guaranteed toterminate. In the worst case, this may result in the entireprogram being instrumented.
3.4 EventsUntil now, we have assumed that the control-flow in a pro-
gram is determined by the usual intra-procedural constructs(if, while, for, ...) together with inter-procedural calls andreturns. However, in the case of JavaScript, we must alsoconsider asynchrony and events. In an event-based program,event listeners (also commonly referred to as callbacks), areregistered and executed in response to certain events, e.g.,the completion of a network request. For such programs,the call stack does not contain information about what hap-pened prior to the execution of the current event listener.
26 var cache = {};27 var net = require(’net’);28 var server = net.createServer(function(c) {29 if (cache.data.length != 0) {30 c.write(cache.data);31 }32 });33 server.listen (80, function () {34 fs.readFile(’a.txt’, function(err , data) {35 cache.data = data;36 });37 });
Figure 8: An event-driven Node.js program.
Figure 8 shows an example of an event-driven Node.js ap-plication. This program contains a subtle race conditionthat may cause an exception. In particular, there is noguarantee that the initialization of the cache.data propertyby the function declared on line 34 will take place beforethis property is accessed inside the function declared online 28. If the access takes place before the initialization,an undefined de-reference error will occur on line 29.
Applying our technique to such an execution of this pro-gram would reveal the following crash path:
Start(s26)→ ⋯→ Enter(f33)→ ⋯→ Exit(f33)→ ⋯⤦
→ Enter(f28)→ ⋯→ Crash(s29)
which shows that the listener function on line 28 was exe-cuted, but the listener function on line 34 was not. Fromthis, a developer can infer that the cache.data field wasuninitialized on line 29 and that the code should be changedso that the initialization is guaranteed to happen.
Accurate tracking of event listeners presents a minor chal-lenge for our technique since an event listener is invokedwithout any corresponding call site in the source code. For-tunately, event listeners are only executed when the callstack is empty and they maintain the stack discipline. Tocapture control-flow due to event listeners we instrumentevery Node.js function that may cause the registration ofa listener. For example, in Figure 8 the Node.js functionsnet.createServer, server.listen and fs.readFile are instru-mented to record that the functions declared on lines 28,33 and 33 are event listeners. With this knowledge, we candetect which event listeners were (and were not) executedwhen a crash occurs. Once we know the relevant event lis-teners, we instrument them as well as the functions wherethey were registered. In the example, we discover that eventlisteners declared on lines 28 and 33 were executed. Thus,the registration sites net.createServer and server.listen arerelevant, so their containing function will be instrumented.This allows the technique to trace control flow backwardsthrough event listeners.
In general, many similar executions may exist in whichevent handlers are scheduled in different orders. In its cur-rent form, our technique does not attempt to identify and ex-ploit similarities between executions. For example, considera scenario where a failing execution involves a sequence ofevent handlers f, g, and another involving a sequence f, h, g,where event handler h is unrelated to the failure. In suchcases, it may be preferable to focus only on the crash pathfor the former execution, because it omits information un-related to the failure. In principle, our technique can beextended to give priority to executions in which the fewestnumber of event listeners is executed before a crash.
6

4. IMPLEMENTATIONWe have implemented our technique using the Jalangi in-
strumentation framework [28] in a tool called Crowdie.
Overall Structure. The implementation splits the tech-nique into two phases. In the detection phase, the program isinstrumented to assign every function object a unique iden-tifier and a global error handler is installed. This handlercatches any thrown exception that reaches the top-level andrecords in which function the exception was thrown. The de-tection phase also determines which event listeners (if any)were executed before the crash. The detection phase is runrepeatedly until an exception is encountered. Its runtimeoverhead is negligible since only one instruction per func-tion declaration is added. A separate isolation phase imple-ments the feedback-directed technique of Section 3.3. Onlythe last 10,000 labels are tracked, to prevent the crash pathfrom growing too large.
Instrumentation Details. Figure 9 presents some ofthe instrumentation rules used in our tool. Here, we aimto be informal and do not describe the finer details of thetransformations used, and just sketch their overall struc-ture. More details can be found in the original paper onthe Jalangi instrumentation framework [28]. A conditionalstatement labeled s is instrumented to record the Branchlabel (lines 38–41). Lines 42–43 show how a function calls is instrumented to record Call and Return labels. Like-wise, lines 44–47 show how a function declaration f is in-strumented to record the Enter and Exit labels7. Finally,an object creation statement s is instrumented to record thelength of the path at the moment of creation (lines 48–50).This means that every object (created inside a function se-lected for instrumentation) knows its offset inside the path.In addition to these instrumentation steps, we assume thatthe program contains a special crash(o) function call whereo is the object of interest. This call is intercepted by the in-strumentation and generates the Crash(s) label, but it alsochecks if __path_offset__ is set to the object o. If so, theorigin of o has been found, and the Start label is insertedat the offset. If not, we have not yet instrumented the func-tion in which the object was created and no Start label isgenerated.
Other JavaScript Features. Our tool implements thetechnique of Section 3.3 as well as the mechanisms relatedto event handling discussed in Section 3.4. Features such asexceptions, getters and setters, and native functions requireadditional support, and can be added with modest effort.Support for these features is in progress, but has not beenneeded in any of the case studies discussed in Section 5 (andwe did not exclude any candidate programs due to lack offeature support).
5. EVALUATIONThe evaluation of our technique aims to answer the fol-
lowing research questions:
Q1: How useful are the crash paths computed by our toolfor understanding and fixing real bugs?
7 In reality this instrumentation is more complicated sincethe body may contain multiple exit points, e.g. explicit re-turn statements or exceptional control-flow, which must betaken into account by the instrumentation.
38 s: if (e) { s1 } else { s2 }39 => var c = e;40 rec(Branch(s, c));41 if (c) { s1 } else { s2 }42 s: f()43 => rec(Call(s, f)); f(); rec(Return(s));44 f: function () { body }45 => function () {46 rec(Enter(f)); body; rec(Exit(f))47 }48 s: new Object ();49 => var tmp = new Object ();50 tmp.__path_offset__ = ...;
Figure 9: Instrumentation rules.
Q2: How many times must a crash be observed before thecrash path has been found?
Q3: How much runtime overhead is incurred by users ofour tool for computing crash paths?
The rationale behind Q1 is to determine whether the infor-mation computed by our tool is useful for debugging, par-ticularly in cases where the information contained in errormessages and stack traces is insufficient. The purpose of Q2is to determine if the number of times that a bug needs tobe encountered is reasonably low. This is relevant because ifthe same crash path needs to be encountered many times bydifferent users, then the usefulness of the technique wouldbe limited to bugs that occur very often. Lastly, Q3 aims todetermine whether runtime overhead is acceptable.
5.1 Experimental MethodologyCrowdie produces information that is intended to assist
developers with debugging, but manual effort remains re-quired in diagnosing the problem. Therefore, we opt for anevaluation based on case studies, in which we apply our toolto 10 real bugs in open source programs taken from GitHub.For these programs, we compute crash paths with our tool,manually inspect these crash paths to determine whetherthey are helpful (Q1), and measure various aspects of thetool’s execution behavior to answer Q2 and Q3.
Selection Criteria. We chose subject programs by look-ing at bug reports for popular JavaScript projects on GitHub.These applications had to satisfy some limitations of our im-plementation: (a) the program did not make use of eval,and (b) the program was runnable on Node.js version 0.12.Furthermore, we required that the reported bug could bereproduced with modest effort, and that the reported issuehad an identifiable place in the source code where the prob-lem was observable (i.e., a crash caused by an exceptionbeing thrown, an assertion failure, or an incorrect returnedvalue). Lastly, we excluded “easy bugs” where the bug waslocal to the same function in which the crash occurred, i.e.,situations where the line number in an error message or ina stack trace would suffice to diagnose the problem quickly.
Subject Programs and Issues. For triggering the bugof interest we use small bug triggering examples provided inthe bug reports, as seen twice in Section 2. This creates amuch simpler scenario than the one Crowdie is intended tobe used in, but no bug reports describe a complete scenariowhere the bug is encountered in a production environment.Each bug reporter has spent time manually creating these
7

Program and Issue Instrumentation Recorded Path
Program Issue Lines Func. Iterations Func. (%) Length Lines Func. (%)
AlaSQL (v0.0.36) #0092 12,561 752 5 (+ 1) 34 (5%) 74 38 8 (1%)
Bucket-JS (v1.81) #0006 2,393 167 4 (+ 1) 10 (6%) 44 8 4 (3%)
Esprima (v2.1) #0299 4,410 182 8 (+ 1) 45 (25%) 349 78 26 (14%)
Esprima (v1.2) #0560 3,762 151 7 (+ 1) 37 (25%) 219 54 24 (16%)
Esprima (v2.2) #1042 5,314 222 8 (+ 1) 49 (22%) 185 53 23 (10%)
Immutable (v3.6.2) #0381 5,147 674 3 (+ 1) 10 (2%) 13 9 3 (1%)
Immutable (v3.7.3) #0489 4,935 635 9 (+ 1) 52 (8%) 90 30 14 (2%)
Loki (v1.0) #0042 2,599 132 5 (+ 1) 20 (15%) 46 19 4 (3%)
Loki (v1.0) #0046 2,599 132 4 (+ 1) 8 (6%) 26 14 4 (3%)
Redis (v0.7.1) #0067 1,529 87 3 (+ 1) 27 (31%) 17 9 4 (5%)
Table 1: Summary of main results from the case study.
Performance benchmarks Unit testsProgram Issue Tests Orig. Partial instr. Full instr. Tests Orig. Partial instr. Full instr.
Alasql (v0.0.36) #0092 14 95 s 188 s (2x) 1929 s (20x) 415 15s 43 s (3x) 158 s (11x)Esprima (v2.1) #0299 7 40 s 315 s (8x) 321 s (8x) 1229 5 s 86 s (17x) 96 s (19x)Esprima (v1.2) #0560 7 40 s 297 s (7x) 325 s (8x) 1229 6 s 70 s (12x) 82 s (14x)Esprima (v2.2) #1042 7 40 s 332 s (8x) 332 s (8x) 1229 6 s 91 s (15x) 102 s (17x)Immutable (v3.6.2) #0381 6 6 s 27 s (5x) 726 s (121x) 258 5 s 13 s (3x) 422 s (84x)Immutable (v3.7.3) #0489 6 6 s 360 s (60x) 718 s (120x) 258 4 s 116 s (29x) 414 s (104x)Loki (v1.0) #0042 9 13 s 112 s (9x) 1164 s (90x) 50 5 s 19 s (4x) 25 s (5x)Loki (v1.0) #0046 9 13 s 15 s (1x) 1172 s (90x) 50 5 s 13 s (3x) 25 s (5x)
Table 2: Summary of performance results.
small examples before the reporting the bug, Crowdie couldpotentially alleviate the need for this manual work.
The leftmost four columns of Table 1 identify the selectedsubject programs and their associated bug reports (all takenfrom GitHub). Each row in the table corresponds to one bugreport and one debugging scenario. The Program columnshows the name of the application/library, the Issue columnshows the number assigned to the bug report. The Lines andFunctions columns show the number of lines in the sourcecode (including whitespace and comments) and the totalnumber of function declarations, respectively.
AlaSQL is a JavaScript SQL database. Buckets is a datastructure library. Esprima is a JavaScript parser. Immutableis a collection library. Loki is a JavaScript database. Redisis a Redis client for JavaScript. The bugs include incor-rectly returned objects, field values that are inadvertentlycorrupted, incorrect control-flow due to argument passing,and various type-related errors.
Process. In the case studies, we used the following 5-stepprocess for diagnosing a bug report using our tool: (1) runthe program and observe that a crash occurs; (2) manuallyidentify the function and line which caused the crash; (3)manually select a subset of relevant local and global variablesrelated to the function and line of interest (frequently only asingle variable was selected). In the fully automated scenariothe variables would be selected by heuristics, as discussedearlier; (4) run our tool with the given line and variablesas input to compute a crash path; (5) manually understandand debug the issue using the computed crash path. Insome cases, the crash was caused by an exception that wasthrown from a generic error handling function. In such cases,we followed the above steps, except that we focused on theprevious function on the call stack.
5.2 ExperimentsWe now discuss the results obtained by running our tool.Quantitative Results: Instrumentation and Paths.
The columns under the header Instrumentation in Table 1show some key characteristics of our feedback-directed in-strumentation method. The column Iterations shows thenumber of times the same bug had to occur for the tech-nique to find the complete crash path. Moreover, the col-umn Functions shows the number of functions instrumentedby the technique in its final iteration, both as an absolutenumber and as a percentage of the total number of func-tions. For example, for Esprima issue #0560, 7 executionswere required before the complete crash path was found plusone execution to detect the crash in the first place.
The columns under the header Recorded Path report char-acteristics of the complete crash path found by the tech-nique. Here, the column Length reports the length of thecrash path (i.e., the total number of labels), and the columnFunc. counts the number of functions on the crash path.Regarding the last metric, recall that a function might beinstrumented although it is not on the crash path, so it isinteresting to see whether the technique instruments manyfunctions unnecessarily. Returning to Esprima issue #0560,during the last iteration 37 functions where instrumentedcorresponding to 25% of the total number functions in theprogram. Finally, the crash path contained 219 labels dis-tributed over 54 source code lines in 24 functions correspond-ing to only 16% of the total number of functions. Looking at219 labels might seem like a daunting task for a programmer,but multiple labels can be present on each of the 54 sourcecode lines, e.g., in the case of loops, and some labels areimplied by others, e.g. Call/Enter. Thus, the programmerhas to look at significantly fewer statements/labels.
8

Quantitative Results: Performance. Column Func.under the heading Instrumentation in Table 1 shows thenumber (and percentage) of functions instrumented in thefinal iteration by the feedback-directed technique. Onlybetween 2% and 31% of functions are ultimately instru-mented, suggesting good potential for performance improve-ment compared to full instrumentation.
To measure actual impact on runtime performance we ex-ercised the programs using benchmarks and unit tests avail-able in the source repositories. Table 2 shows the results.
Starting with the performance benchmarks, the row forAlaSQL issue #0092 shows that the benchmark programcontained 14 different executions and the original programtook 95 seconds to execute them all. Using our feedback-directed approach, 34 functions are instrumented (see Ta-ble 1), resulting in a total running time of 188 seconds, i.e.,a slowdown by a factor 2x. In contrast, running the bench-mark with full instrumentation took 1929 seconds, i.e., afactor 20x overhead. Continuing, AlaSQL’s unit test suitecomprises 415 individual tests which took 15 seconds to runoriginally; this was 3x slower with feedback-directed instru-mentation, and 11x slower with full instrumentation. For thethree Esprima issues there is negligible difference in perfor-mance between feedback-directed and full instrumentation.For the remaining 5 programs there are significant differ-ences ranging from 1.1x to 121x.
In general, the performance benchmarks show a larger per-formance difference than the unit tests when comparing par-tial and full instrumentation. We postulate this is becausethe unit tests cover a broad range of functionality and exer-cise the code more evenly (including the instrumented code),whereas the benchmark programs presumably exercise onlyperformance critical components of the code that may avoidinstrumentation with our technique.
We investigated why our technique worked so poorly forEsprima. We found that Esprima is divided into two com-ponents; a lexer and a parser. In each case, an unexpectedtoken was generated by the lexer, and then caused a crash inthe parser. The problem was not the actual token itself, butthe control-flow that followed. Regardless, this architectureand the tight connectedness of the parser itself meant thatlarge parts of the program were ultimately instrumented.
The Buckets and Redis programs were not included inTable 2 since they had no performance benchmark suites.
In summary, if we exclude the best and worst runningtimes for both techniques, then feedback-directed instru-mentation has a typical overhead of between 2x–9x com-pared to an overhead of 8x–90x for full instrumentation.
Usefulness. We previously discussed two of our casestudies in Section 2 that illustrated how it can be useful toknow: (1) where an object was allocated, (2) what the callstack looked like during that allocation and (3) what proper-ties were not written since that allocation. Space limitationskeep us from discussing the remaining 8 case studies in de-tail, but they cover similar, and more complex, issues. Ineach case, the crash path provides crucial information aboutobject allocation and initialization, the call stack structureat points of interest, and the presence or absence of writes toa property of interest. In each case, some amount of humaningenuity remains necessary but we believe that the crashpaths computed by Crowdie would be helpful for develop-ers. In particular, the size of the code base that developersneed to consider is greatly reduced by allowing them to focus
on only the source lines in the crash path; these reductionscan be seen in Table 1. A detailed analysis of each of thesecase studies can be found in a technical report [20].
5.3 Summary of ResultsWe can now answer the research questions stated earlier.Q1. The crash paths computed by Crowdie can pro-
vide useful assistance to developers, but by themselves arenot a panacea: some amount of human ingenuity remainsnecessary to complete the debugging task.
Q2. In our case studies, between 4 and 9 iterations (ex-ecutions) were needed to discover the crash path. This isa relatively low number, suggesting that our technique maybe generally useful for widely deployed software, except forbugs that are very rarely encountered.
Q3. The typical runtime overhead of the feedback-directedinstrumentation in Crowdie ranges from 2x–9x. While thisis often dramatically better than the overhead of full instru-mentation (8x–90x), work remains to be done on making theinstrumentation more efficient. Furthermore, as the resultsfor Esprima suggest, the architecture of certain applicationsmay make them unsuitable candidates for the technique.
5.4 Threats to ValidityWe selected our subject programs based on issues reported
on GitHub. While these programs are widely used, they maynot be representative of all programs and likewise the re-ported bugs that we investigated may not be representativeeither. Furthermore, we selected bug reports that involvedcrashes (thrown exceptions, assertions errors, ...) but notevery bug necessarily manifests itself as a crash. When wedebugged these issues we had no prior knowledge of the pro-gram. Thus, it is possible that a developer familiar withsource code might have debugged the program differently.On the other hand, the debugging scenario we faced, withno prior knowledge of the codebase, is the hardest possible.
Another valid concern is that the experiments are all basedon small snippets of code that trigger the bugs. These sce-narios may differ from real-life deployment scenarios, forwhich the results could be very different from the ones wereport here. These more complex scenarios might requirelonger crash paths and make Crowdie more expensive touse, but extra complexity will also make the partial instru-mentation of Crowdie even more tractable compared tonaive full instrumentation.
6. RELATED WORKNumerous techniques have been developed to support de-
bugging. A key property of our approach is that it helps ob-taining critical information about failures that occur in de-ployed JavaScript programs. This setting is particularly wellsuited for crowdsourced analysis that collects data from userexecutions, since it is easy to deploy new instrumentationpolicies. Although we focus on errors that manifest as un-caught exceptions in the JavaScript programs, our techniqueworks more generally, for example, also when debugging as-sertion failures, errors related to suspicious coercions andother bad coding practices [11], or DOM-related faults [26].
Record and replay techniques. The ability to recordand replay failing executions is valuable for debugging, asdemonstrated by, e.g., Narayanasamy et al. [23]. We arguethat knowing the part of the execution history that we call
9

the crash path is often sufficient for the developer to de-bug the crash, and is cheaper to produce in a JavaScriptsetting. The BugRedux framework by Jin and Orso [12]gathers partial execution traces from deployed programs andthen uses symbolic execution to synthesize reproducible fail-ures. SymCrash [8] instead uses dynamic symbolic executionand more selective instrumentation. We avoid the need forsymbolic execution by the use of iterative instrumentation.Some techniques utilize static analysis to reduce the instru-mentation overhead [24, 31], however, the dynamic languagefeatures in JavaScript are known to cause considerable chal-lenges for static analysis [3].
One challenge to dynamic analysis of deployed JavaScriptapplications is that instrumenting JavaScript programs isknown to incur a large runtime overhead. Techniques thatattempt to reduce the overhead by only logging sources ofnondeterminism, as e.g. Chronicler [6], are difficult to ap-ply to JavaScript. Even though our implementation usesthe state-of-the-art Jalangi infrastructure [28], we observe asubstantial runtime overhead when full instrumentation isenabled, which necessitates the more selective instrumenta-tion. Several other tools described in the literature are capa-ble of recording live executions, which can subsequently beanalyzed by the developers when debugging. Mugshot [21] iscapable of capturing events using unmodified browsers. Sim-ilarly, WaRR [4] and, more recently, Timelapse and Dolos [7]can in principle provide full information about failing exe-cutions. Ripley [30] instruments JavaScript applications toenable replaying executions on the server with the purpose ofensuring computational integrity, and DoDOM [27] performsreplaying to infer DOM invariants, not to aid debugging ofcrashes that users encounter. However, we have seen no con-crete usage of these tools in real-world debugging. We be-lieve that record/replay tools usually require that the recordand replay environments, which include browser configura-tion, browser state, persistent data (e.g. cookies), networkspeed, processor speed, and operating system configuration,to be exactly same. Such a requirement is too strict and dif-ficult to reproduce in real-world scenarios where an applica-tion can be run by any user under any possible environment.Crowdie does not suffer from such limitations because itdoes not aim to faithfully replay a buggy execution—it sim-ply tries to collect a relevant portion of the control-flow pathusing light-weight and targeted instrumentation.
Fault localization techniques. Several automated faultlocalization techniques [13, 14, 18] rely on statistical datafrom user executions collected in order to assist developerswith debugging. Such information may be useful for de-bugging, but it does not provide the crash paths that weargue are valuable when debugging. For future work, it willbe interesting to perform a direct experimental comparisonwith such techniques. Liblit et al. [19] interestingly notethat“the stack contains essentially no information about thebug’s cause” in half of the bugs considered in their experi-ments, which aligns well with our observation that more in-formation about the failing executions is often needed. TheHolmes tool [9] localizes faults using path profiles, which areconstructed by iteratively instrumenting and re-deployingprograms similar to our technique. Unlike crash paths, pathprofiles only provide statistical information about intrapro-cedural and acyclic paths. The AutoFLox tool by Ocariza etal. [25] performs fault localization for JavaScript under theassumption that a complete failing execution is known, un-
like our technique that aims to automatically find the crashpath. Our algorithm for finding crash paths is also relatedto algorithmic program debugging [29] but does not requireguidance by the programmer or by formal specifications.
Dynamic program slicing. Our notion of crash pathsis related to the use of dynamic slicing for debugging [1,2, 17, 32]. Such techniques typically compute slices back-wards, which resembles our construction of crash paths, butusually assuming that a complete execution trace is alreadyknown. Although many variations of dynamic slicing havebeen proposed, they generally differ from our notion of crashpath, which comprises a path from the creation of an objectof interest to a crashing statement, without including alldependencies earlier in the execution. In principle, slicingmay be applied subsequently to the crash path to filter awayinstructions that are likely irrelevant.
Other crowdsourced analysis techniques. Crowd-sourced analysis has also been suggested for other debuggingscenarios. For example, Kerschbaumer et al. [16] use crowd-sourced analysis to test for information flow vulnerabilitiesby letting different users track different information flowsso that a crowd of users can achieve high coverage of all in-formation flows without imposing unacceptable performanceoverhead on any single user. Likewise, Kasikci et al. [15] testpotential data races by distributing them over a set of usersby giving each user an instrumented version of an applicationwhere the purpose of the added instrumentation code is toconfirm whether the potential race happens in practice. Tolower the overhead, instrumentation is enabled probabilis-tically. In contrast, we enable instrumentation only whena crash occurs, then increase instrumentation until a crashpath is discovered, and finally disable the instrumentation.
7. CONCLUSIONS AND FUTURE WORKMany bugs manifest themselves as objects that have in-
correct property values when a failure occurs. For such bugs,error messages and stack traces often provide insufficient in-formation for diagnosing the problem. We have proposedthe notion of a crash path, which reflects the control flowfrom the allocation of a selected object of interest to thecrashing statement, and argue that this often provides use-ful information for debugging such problems.
In principle, crash paths can be computed by executing afully instrumented version of a program, but this incurs pro-hibitive runtime overhead. Therefore, we have developed afeedback-directed instrumentation technique for computingcrash paths that we envision to be deployed in a crowd-sourced scenario where the same failure can be observedrepeatedly. We implemented the technique in a tool calledCrowdie, and evaluated it in 10 case studies by using it todebug real-world issues reported on GitHub for which errormessages and stack traces are insufficient to find and fix thebugs. In these case studies, the feedback-directed techniquerequires the same crash to be encountered 3 to 10 times, andthe runtime overhead generally compares favorably to thatof full instrumentation.
Directions for future work include achieving a deeper un-derstanding in which situations the feedback-directed tech-nique is useful, and reducing instrumentation overhead. Wealso plan to explore the use of more detailed instrumentationonce a complete crashing path has been identified in orderto prune irrelevant statements from the path.
10
References[1] H. Agrawal, R. A. DeMillo, and E. H. Spafford. Debug-
ging with dynamic slicing and backtracking. Softw.,Pract. Exper., 23(6):589–616, 1993.
[2] H. Agrawal and J. R. Horgan. Dynamic program slicing.In Proc. ACM SIGPLAN Conference on ProgrammingLanguage Design and Implementation, pages 246–256,1990.
[3] E. Andreasen and A. Møller. Determinacy in staticanalysis for jQuery. In Proc. ACM International Con-ference on Object Oriented Programming Systems Lan-guages & Applications, pages 17–31, 2014.
[4] S. Andrica and G. Candea. WaRR: A tool for high-fidelity web application record and replay. In Proc.IEEE/IFIP International Conference on DependableSystems and Networks, pages 403–410, 2011.
[5] Apple. Crash reporter. https://developer.apple.com/library/mac/technotes/tn2004/tn2123.html.
[6] J. Bell, N. Sarda, and G. E. Kaiser. Chronicler:lightweight recording to reproduce field failures. InProc. 35th International Conference on Software En-gineering, pages 362–371, 2013.
[7] B. Burg, R. Bailey, A. J. Ko, and M. D. Ernst. Inter-active record/replay for web application debugging. InProc. 26th ACM Symposium on User Interface Softwareand Technology, pages 473–484, 2013.
[8] Y. Cao, H. Zhang, and S. Ding. SymCrash: selectiverecording for reproducing crashes. In Proc. ACM/IEEEInternational Conference on Automated Software Engi-neering, pages 791–802, 2014.
[9] T. M. Chilimbi, B. Liblit, K. K. Mehra, A. V. Nori, andK. Vaswani. Holmes: effective statistical debugging viaefficient path profiling. In Proc. 31st International Con-ference on Software Engineering, pages 34–44, 2009.
[10] J. A. Clause and A. Orso. A technique for enablingand supporting debugging of field failures. In Proc.29th International Conference on Software Engineering,pages 261–270, 2007.
[11] L. Gong, M. Pradel, M. Sridharan, and K. Sen.DLint: dynamically checking bad coding practices inJavaScript. In Proc. International Symposium on Soft-ware Testing and Analysis, pages 94–105, 2015.
[12] W. Jin and A. Orso. BugRedux: Reproducing fieldfailures for in-house debugging. In Proc. 34th Interna-tional Conference on Software Engineering, pages 474–484, 2012.
[13] W. Jin and A. Orso. F3: fault localization for fieldfailures. In Proc. International Symposium on SoftwareTesting and Analysis, pages 213–223, 2013.
[14] J. A. Jones and M. J. Harrold. Empirical evaluationof the Tarantula automatic fault-localization technique.In Proc. 20th IEEE/ACM International Conference onAutomated Software Engineering, pages 273–282, 2005.
[15] B. Kasikci, C. Zamfir, and G. Candea. RaceMob:crowdsourced data race detection. In Proc. ACMSIGOPS 24th Symposium on Operating Systems Prin-ciples, pages 406–422, 2013.
[16] C. Kerschbaumer, E. Hannigan, P. Larsen, S. Brun-thaler, and M. Franz. CrowdFlow: Efficient informationflow security. In Proc. 16th Information Flow SecurityConference, 2013.
[17] B. Korel and J. W. Laski. Dynamic program slicing.Inf. Process. Lett., 29(3):155–163, 1988.
[18] B. Liblit, A. Aiken, A. X. Zheng, and M. I. Jordan. Bugisolation via remote program sampling. In Proc. ACMSIGPLAN 2003 Conference on Programming LanguageDesign and Implementation, pages 141–154, 2003.
[19] B. Liblit, M. Naik, A. X. Zheng, A. Aiken, and M. I.Jordan. Scalable statistical bug isolation. In Proc. ACMSIGPLAN 2005 Conference on Programming LanguageDesign and Implementation, pages 15–26, 2005.
[20] M. Madsen, F. Tip, E. Andreasen, K. Sen, andA. Møller. Feedback-directed instrumentation fordeployed JavaScript applications. Technical ReportCS-2015-16, School of Computer Science, Universityof Waterloo, 2015. https://cs.uwaterloo.ca/sites/ca.computer-science/files/uploads/files/CS-2015-16.pdf.
[21] J. W. Mickens, J. Elson, and J. Howell. Mugshot: De-terministic capture and replay for JavaScript applica-tions. In Proc. 7th USENIX Symposium on NetworkedSystems Design and Implementation, pages 159–174,2010.
[22] Microsoft. Windows error reporting. https://msdn.microsoft.com/en-us/library/windows/hardware/dn641144.aspx.
[23] S. Narayanasamy, G. Pokam, and B. Calder. BugNet:Continuously recording program execution for deter-ministic replay debugging. In Proc. 32st InternationalSymposium on Computer Architecture, pages 284–295,2005.
[24] G. C. Necula, J. Condit, M. Harren, S. McPeak, andW. Weimer. Ccured: type-safe retrofitting of legacysoftware. ACM Trans. Program. Lang. Syst., 27(3):477–526, 2005.
[25] F. Ocariza, G. Li, K. Pattabiraman, and A. Mesbah.Automatic fault localization for client-side JavaScript.Software Testing, Verification and Reliability, 2015.
[26] F. S. Ocariza Jr., K. Bajaj, K. Pattabiraman, andA. Mesbah. An empirical study of client-side JavaScriptbugs. In Proc. ACM / IEEE International Symposiumon Empirical Software Engineering and Measurement,pages 55–64, 2013.
[27] K. Pattabiraman and B. G. Zorn. DoDOM: LeveragingDOM invariants for web 2.0 application robustness test-ing. In Proc. IEEE 21st International Symposium onSoftware Reliability Engineering, pages 191–200, 2010.
11

[28] K. Sen, S. Kalasapur, T. G. Brutch, and S. Gibbs.Jalangi: a selective record-replay and dynamic analysisframework for JavaScript. In Proc. European SoftwareEngineering Conference / ACM SIGSOFT Symposiumon the Foundations of Software Engineering, pages 488–498, 2013.
[29] E. Y. Shapiro. Algorithmic Program Debugging. MITPress, Cambridge, MA, USA, 1983.
[30] K. Vikram, A. Prateek, and V. B. Livshits. Ripley: au-tomatically securing web 2.0 applications through repli-cated execution. In Proc. ACM Conference on Com-puter and Communications Security, pages 173–186,2009.
[31] S. H. Yong and S. Horwitz. Using static analysis toreduce dynamic analysis overhead. Formal Methods inSystem Design, 27(3):313–334, 2005.
[32] X. Zhang, R. Gupta, and Y. Zhang. Precise dynamicslicing algorithms. In Proc. 25th International Confer-ence on Software Engineering, pages 319–329, 2003.
12

APPENDIXA. CASE STUDY
Here we report on our experience debugging the bug re-ports not described in Section 2.
A.1 AlaSQL Issue #0092In this issue entitled “Error: Something wrong with index
on table” reported for AlaSQL (v0.0.36) the developer re-ports that an exception is thrown8 after the creation of sev-eral tables, insertion of multiple rows and multiple queries:
1 Error: Something wrong with index on table2 at table.delete (alasql.js :8311:27)3 at statement (alasql :9262:41)4 at Function.alasql.drun (alasql :3369:43)5 at Function.alasql.dexec (alasql.js :3353:31)6 at Function.alasql.exec (alasql.js :3296:27)7 at alasql (alasql.js :106:31)
The error message hints that an index is corrupted. In-specting the stack trace indicates that the error occurs whenrows are deleted from a table. The (simplified) source codeof the table.delete function is:
8298 table.delete = function(i) {8299 // ...8300 var r = this.data[i];8301 var pk = this.pk;8302 var addr = pk.onrightfn(r);8303 if (typeof this.indices[pk.hh][addr]8304 == ’undefined ’) {8305 throw new Error(’Something␣wrong␣’8306 + ’with␣index␣on␣table’);8307 } else {8308 this.indices[pk.hh][addr] = undefined;8309 }8310 }
We see that the exception is thrown in response to this.indices[pk.hh][addr] being undefined. A closer look at thecode reveals that there are three values that may be incor-rect: this.indices, pk.hh and addr (which originates fromthis.data). Since the lookup this.indices[pk.hh] returnedsome object, i.e., it didn’t throw an undefined dereferenceexception, the value of addr seems most suspicious.
Looking further down the stack trace does not reveal anynew information: We cannot determine the location of thefault from the error message and stack trace alone. ApplyingCrowdie to find the crash path for each of these values givesseveral paths for the developer to inspect. Looking at thecrash path for this.data reveals something interesting:
9152 ... = function(db, params , alasql) {9153 var res = selectfn(params );9154 db.tables[tableid ].data =9155 db.tables[tableid ].data.concat(res);9156 return res.length;9157 }
which is a function used during a SELECT sub query, as re-vealed by the crash path. Note that the value of the dataproperty is overwritten directly with the result of an arrayconcatenation operation. This is problematic, since this onlyupdates the array without updating the index accordingly.Instead, the table.insert function should have been used,which is responsible for keeping the index up-to-date. Thefix is simply to use this function instead of directly mutatingthe data property.
8https://github.com/agershun/alasql/issues/92
In this case study the error message and stack trace wereinsufficient the debug the issue. Crowdie helped find theorigin of several values of interest and revealed that the crashwas related to sub-queries (which was not knowable from thestack trace). In the debugging scenario the developer stillhad to use some ingenuity: First, to determine the value(s)of interest. And, second, to know that the index is main-tained by the table.insert function and that the data prop-erty should not be updated directly.
A.2 Buckets Issue #0005In this issue, entitled “Various Dictionary bugs”, appear-
ing in Buckets v1.82, the reporting user explains that aDictionary implementation contains several bugs related toJavaScript semantics that the implementer did not take intoaccount9. One of the bugs is exposed with the followingcode, extracted from the bug report:
1 var dict = new buckets.Dictionary ();2 var obj = {};3 dict.set("hasOwnProperty", obj);4 dict.keys ();
The last call makes the library throw an exception: “Type-Error: object is not a function”, with the stack trace:
TypeError: object is not a functionat buckets.Dictionary.keys (buckets.js:796)at Object.<anonymous > (example.js:4)
The stack trace only reveals that a call at line 796 couldnot be performed. Looking at that line:
796 if (this.table.hasOwnProperty(name)) {
We see that the property hasOwnProperty was supposedto be a function, but according to the exception, it is not.
An experienced JavaScript programmer knows that has-OwnProperty is a built-in method in the Object prototype-chain, so the natural question is to find out what has over-ridden it. So we instruct Crowdie to find the origin ofthis.table.hasOwnProperty, Crowdie uses four iterationsto discover the following path:
Start(ex.js:2) var obj = {};Call(ex.js:3) dict.set("hasOwnProperty", obj);Enter(buckets.js:751) ...set = function(key, value) {. . .Exit(buckets.js:770) return ret;Return(ex.js:3)) dict.set("hasOwnProperty", obj);Call(ex.js:4) dict.keys();Enter(buckets.js:793) ...keys = function() {Crash(buckets.js:796) if (this.table.
hasOwnProperty(name)) {
From this path, it can be seen that the origin of theobject is the obj-object on line 2 in the above examplecode. Crowdie also tells us that this object is used indict.set("hasOwnProperty", obj) on the very next line,from which it is clear that the user-selected dictionary key,“hasOwnProperty”, breaks the dictionary implementationby creating a local property hasOwnProperty in the internaldictionary datastructure that shadows the hasOwnPropertyproperty of a prototype object.
On line 796, Buckets relies on hasOwnProperty being thenative implementation of hasOwnProperty, but the call online 3 ends up shadowing that property with the object al-located at line 2. The fix for this issue is to remove thedependency in Buckets on hasOwnProperty being unmodi-
9https://github.com/mauriciosantos/Buckets-JS/issues/6
13
fied by user-selected values. The following code illustratesthe principle behind the fix for line 796:
796 // if (this.table.hasOwnProperty(name)) {797 var HOP = Object.prototype.hasOwnProperty;798 if (HOP.call(this.table , name)) {
In this case study, we needed to know why a property hadbeen overridden, and the stack trace could not tell us that.The crash path produced by Crowdie helped with findingthe cause of the overriding problem. In particular, the crashpath revealed that shortly after the object of interest wasallocated, it was used inside Buckets to override the prop-erty of interest – this revealed that internal dependencies ofBuckets needed to be rethought10.
Although the bug report appears to originate from a codereview, we believe the bug could just as well have occurredin the wild.
A.3 Esprima Issue #0560In this issue entitled “LeftHandSideExpression in ForIn-
Statement not parsing when it contains an ‘in‘ operator”,reported for Esprima (v1.2), the user states that Esprimacrashes on the input "for (a[b in c] in d);" which heor she expected to parse11, 12.
Esprima crashes with the following error message andstack trace13:
799 Error: Line 1: Unexpected token in800 at throwError801 at throwUnexpected802 at expect803 at parseComputedMember804 at parseLeftHandSideExpressionAllowCall805 at parsePostfixExpression806 at parseUnaryExpression807 at parseBinaryExpression808 at parseConditionalExpression809 at parseAssignmentExpression810 at parseExpression811 at parseForStatement812 at parseStatement813 at parseSourceElement814 at parseSourceElements815 at parseProgram816 at Object.parse817 at Object.<anonymous >
The error message says that the token “in” was unex-pected. This may lead the developer to believe that thetoken was somehow corrupted or that the token was ac-cidently replaced by another token. The stack trace it-self does not indicate whether or not this is the case. Us-ing Crowdie we discover that the token was created in-side scanIdentifier and was not changed along the crashpath. While this information is useful, it does not, by it-self, help us to locate the bug: The bug cannot be iso-lated with the error message, stack trace and Crowdiealone. Looking at the fix on GitHub we can see that fixinvolves intricate updates of a global variable state.allowIninside the functions parseLeftHandSideExpressionAllow-Call, parseLeftHandSideExpression and parseForStatement.Coming up with these changes seems to require a deep knowl-
10https://github.com/mauriciosantos/Buckets-JS/commit/f58f2f0a3edcb9041fb5d26afec7bc57b7f21de2
11https://code.google.com/p/esprima/issues/detail?id=56012https://github.com/jquery/esprima/pull/26713Here line numbers have been omitted for brevity.
edge of the internals of Esprima.Esprima issues #029914 and #104215 are similar to the
above: We can use Crowdie to rule out certain scenarios,but such information by itself is not necessarily sufficient tolocate the bug. Nevertheless, we believe that even in suchscenarios, Crowdie provides developers with a useful newtool for debugging.
A.4 Immutable Issue #0489In this issue, entitled “‘deleteIn‘ fails for Set within Map”
for Immutable v3.7.3 the user reports that a sequence ofoperations on a collection object cause an exception16. Theuser provides a code fragment:
1 new Map()2 .set("decks", new Set([1, 12, 2]))3 .deleteIn (["decks", 12])
which produces the error message and stack trace:
1 Error: invalid keyPath2 at invariant (immutable.js :932:31)3 at updateInDeepMap (immu.js :2509:9)4 at updateInDeepMap (immu.js :2515:27)5 at src_Map__Map.updateIn (immu.js :1816:28)6 at src_Map__Map.deleteIn (immu.js :1802:21)
This somewhat cryptic error message does not providemuch information, at least for someone who is unfamiliarwith the Immutable library. The stack trace tell us that theexception is thrown from:
7 function invariant(condition , error) {8 if (! condition) throw new Error(error );9 }
which is a generic error construction function. This functionis called from updateInDeepMap where the real error occurs17:
2495 function updateInDeepMap(existing , ...) {2496 // ...2497 invariant( /* ... */2498 || (existing && existing.set),2499 ’invalid␣keyPath ’);2500 // ...2501 );
From the error message and stack trace alone it is not clearwhy the invariant is violated. Using Crowdie we discoverthat the invariant is violated when the existing variablepoints to an object without a set property 18. As in previouscase studies, it is not clear why this property is missing: Wasit never set? Was it overwritten? Does existing point to thewrong object? Inspecting the crash path we discover thatthe object is created by the makeSet function:
3700 function makeSet(map , ownerID) {3701 var set = Object.create(SetPrototype );3702 // ...3703 return set;3704 }
The call to Object.create(SetPrototype) creates a new ob-ject whose internal prototype is the SetPrototype object.This is a global object which holds all functionality com-
14https://github.com/jquery/esprima/pull/29915https://github.com/jquery/esprima/issues/104216https://github.com/facebook/immutable-js/issues/48917 Here the line number 2509 reported in the stack tracecorresponds to line 2497 in the example, due to the elisionof some irrelevant code.
18Here set should be understood as “assign” or “update”, andnot as the notion of a mathematical set.
14

monly available on sets. Manual inspection of the crashpath shows that the set property is never set nor overwrit-ten. Furthermore, the prototype object does not containany set property.
Pondering this, we realize that updateInDeepMap implicitlyassumes that it is only passed map objects (which have aset property) and not sets (which lack such a property). Wecan fix this issue by adding a set property to the prototypeSetProperty.
In this issue Crowdie was useful for finding the origin ofthe existing object and determining that the set propertywas not modified along the crash path, but was missing fromthe time the object was created (due to its type).
A.5 Loki Issue #0042In this issue, entitled “when not found findOne returns
Array[0] instead of null” for Loki (v1.0) the developer re-ports that the findOne function should return null insteadof a zero-sized array when the result set is empty19. Asstated earlier, Loki is a JavaScript database and the findOnefunction is used to retrieve the first row from a given query.
In the bug report, the developer does not provide any codefragment, presumably because it is very easy to reproduce.For the sake of exposition, we will assume that the developerencountered the problem while trying to run the code:
1 var db = new loki (/* ... */);2 var users = db.addCollection (* ... */);3 var result = users.findOne (* ... */);4 assert(result == null);
which crashes with the assertion failure:
5 AssertionError: false == true6 at main.js:4:11
Here (and in general) the error message and stack tracesdo not contain information about where the object camefrom, since the object was created inside the library andstack has since been collapsed. Using Crowdie to discoverthe origin of result reveals that the Resultset.prototype.findfunction returns an empty array:
607 Resultset.prototype.find = function (...) {608 if (this.collection.data.length === 0) {609 // ..610 return [];611 }612 // ...613 }
This function, as revealed by the crash path, is called from:
266 function Resultset (...) {267 // ...268 if (typeof (queryObj) !== "undefined"269 && queryObj !== null) {270 return this.find(queryObj , firstOnly );271 }272 // ...273 }
which according to the crash path is called from:
2469 ... findOne = function (...) {2470 // ...2471 return new Resultset (...);2472 };
Note that although Resultset is invoked as a constructor (us-ing new ...) on line 2471 its result is thrown away by the state-
19https://github.com/techfort/LokiJS/issues/42
ment return this.find(...) on line 270 inside Resultset.The issue is fixed by checking the size of the result set in-
side either Resultset.prototype.find or directly in the Resultsetconstructor. Debugging this issue with Crowdie was easysince the tool readily identified from where the object cameand the relevant functions on the crash path.
A.6 Redis Issue #0067In this issue, entitled “hgetall returns when no results”,
reported for Loki v1.0, the user reports that “Testing forif(results) ends up with a false positive.”20. The problem isthat the library breaks the JavaScript idiom of returning avalue that coerces to false in case of a query without anyresults. The returned value is an empty object instead of avalue like null or undefined. In this case, the user did notinclude a code snippet with the bug report that triggers theproblem. However, from the description of the issue, it waseasy for us to reconstruct what such a code example wouldlook like. In the discussion below, we will assume that theuser encountered the reported problem in the context of thefollowing example.
1 var client = redis.createClient ();2 client.hgetall("does␣not␣exist", function (
err , results) {3 if(results){4 throw new Error("Redis -bug␣0067:␣
non -null␣results");5 }6 });
The following stack trace is produced by running the code:
Error: Redis -bug 0067: non -null resultat example.js:4at try_callback (redis.js:980)at RedisClient.return_reply (redis.js :1024)at RedisReplyParser.<anonymous > (redis.js:773)at RedisReplyParser.emit (events.js :107)at RedisReplyParser.send_reply (redis.js:502)at RedisReplyParser.execute (redis.js:387)at RedisClient.on_data (redis.js:936)at Socket.<anonymous > (redis.js :580)at Socket.emit (events.js:107)at readableAddChunk (_stream_readable.js:163)at Socket.Readable.push (_stream_readable.js:126)at TCP.onread (net.js:538)
The stack trace reveals that asynchronous JavaScript isbeing used because the root of the stack trace is not in theexample code. This means that single-stepping the codewith a debugger would be harder than usual.
Nevertheless, Crowdie can find the origin of results inthree iterations, at line 1021 of redis.js. In the allocatingfunction it is seen that an empty results object is alwaysallocated, and that each individual query result from theexternals array is added to it later. The following codeillustrates the principle:
var results = {};for(var i = 0; i < externals.length; i++){
var result = externals[i];results[result.name] = result.value;
}return result;
The fix21 for the issue is an early return of null if no
20https://github.com/NodeRedis/node redis/issues/6721https://github.com/NodeRedis/node redis/commit/69092a3f267b67c8067c19f98ab08bad2f936aad
15

query results are found. This fix is applied where the emptyresults object was allocated, i.e., at the root of the crashpath.
The following code illustrates the principle behind the fix:
var results = {};if(externals.length === 0){
return null;}for(var i = 0; i < externals.length; i++){
var result = externals[i];results[result.name] = result.value;
}return result;
In this case study, the source location of interest is ac-tually close to one of the lines mentioned in the long stacktrace, but Crowdie pinpoints exactly where the object wasallocated – saving the bug fixer from having to look througha long stack trace for the right location to apply a fix.
16