FedTransaction Analyzer Sample Preformatted Reports · 2:00 PM ET 318 354 304 347 361 1684 2:00 PM...
13
FedTransaction Analyzer ® Sample Preformatted Reports Version 10.18.17
Transcript of FedTransaction Analyzer Sample Preformatted Reports · 2:00 PM ET 318 354 304 347 361 1684 2:00 PM...
FedTransaction Analyzer® Sample Preformatted Reports
Version 10.18.17

FedTransaction Analyzer Sample Reports v10.18.17 Page 2
1) Instructions Tab from Excel Download
2) Data Reports
2a) User_Specified_Report: Data is sorted by the criteria you specify. Data contained in this report is based on the Master Account structure at the time of report creation.
2b) Time of Day Activity Dashboard: The time of day activity tables show your institution’s sent/received/on-us wires by hour of the calendar day and day of the week. Two tables in the Excel® tab provide volume and net value for each time/day increment. Cell data represents the number of wires or net value in that category based on filter selections.
2c) Bene ID Research: The beneficiary identifier research tab provides a listing of beneficiary identifiers (including those used by your clients if your institution is the beneficiary’s bank) for those wires your institution received during the reporting period. The identifiers are ordered by total volume of wires received.
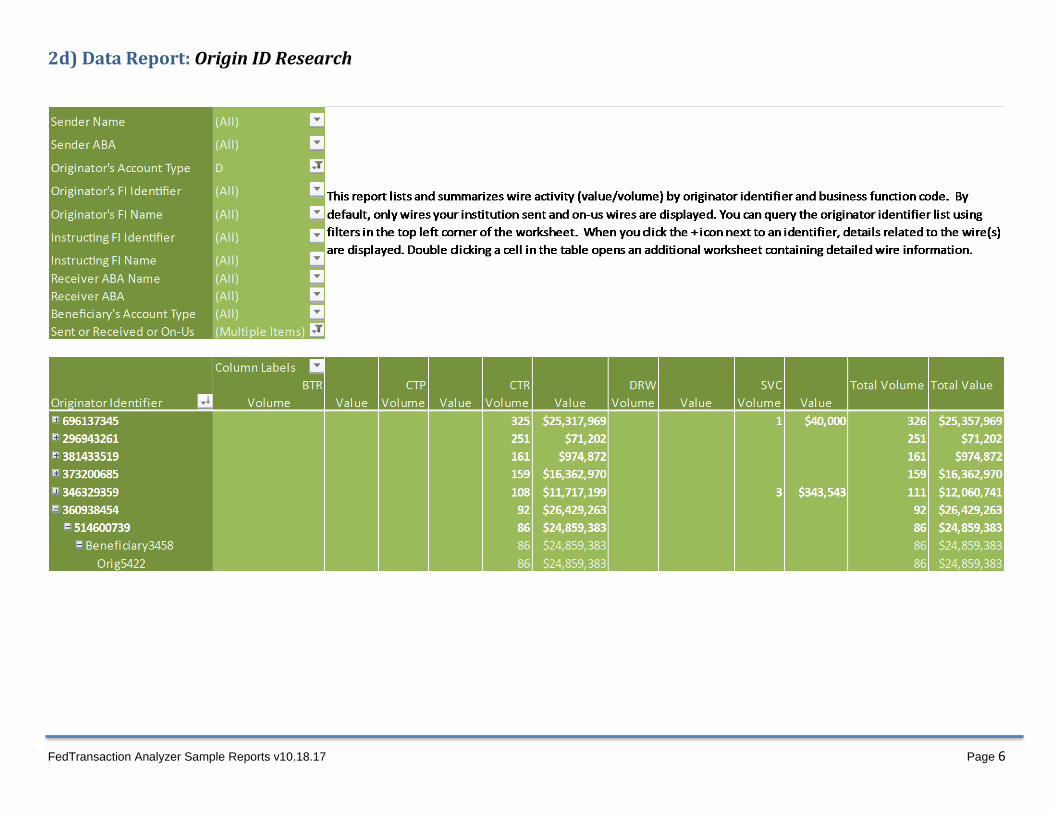
2d) Origin ID Research: The originator identifier research tab provides a listing of originator identifiers (including those for your clients if your institution is the originator’s bank) for those wires your institution sent during the reporting period. The identifiers are ordered by total volume of wires sent.
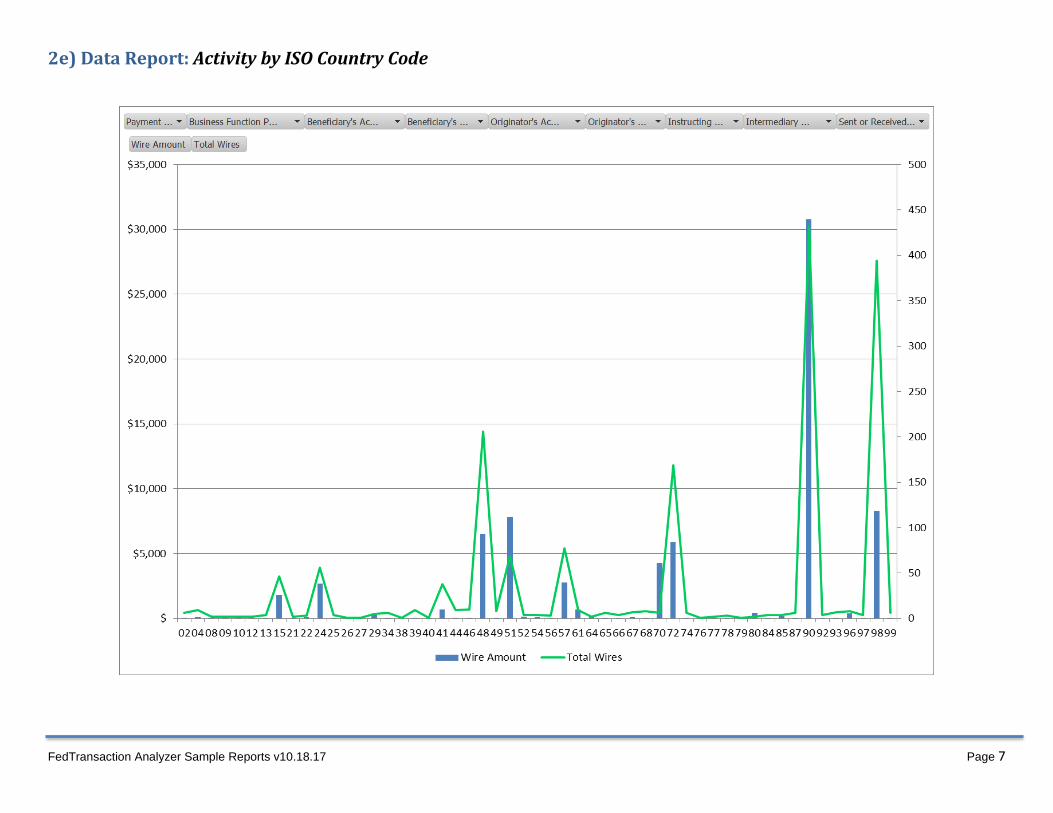
2e) Activity by ISO Country Code: The chart summarizes activity (value/volume) by ISO® country code for wires that include a SWIFT® Business Identifier Code (BIC) for either the originator’s bank or the beneficiary’s bank. The ISO country code is a component of the BIC.
3) Management Dashboard Reports
3a) Organization Dashboard: Distribution Over Time, Top Transactions by Value and Volume, Average Transactions, Top Percentiles, Transactions by Business Function and Outliers.
3b) Customer Dashboard: Same data as for Organization Dashboard but for one selected customer only
3c) Customer Activity Report: Originated and Received Transactions by customer name within a date range

FedTransaction Analyzer Sample Reports v10.18.17 Page 3
1) Instructions Tab from Excel Download
Data is sorted by the criteria you specify. Data contained in this report is based on the Master Account structure at the time of report creation.ABA # 310926618Institution Name Sample Bank Create Management Reports:
Search Criteria Advanced SearchDate Range From: 04/01/2016 To: 06/30/2016 Sender ABA N/A
Transaction Value Range From: N/A To: N/A Receiver ABA N/A
User John Doe - User IMAD Number N/A
Submiss ion Date 08/08/2016 17:10:11
Number of Entries 17065
Data Reports User_Speci fied_Report
Time of Day Activi ty Dashboard
Bene ID Research
Origin ID Research
Activi ty by ISO Country Code
Management Reports Organization_Dashboard
Customer_Dashboard
Customer_Activi ty
Please visit the FedTransaction Analyzer® web page for a full summary of the service.
The time of day activi ty tables show your insti tution’s sent/received/on-us wires by hour of the ca lendar day and day of the week. Two tables in the Excel tab provide volume and net value for each time/day increment. Cel l data represents the number of wires or net va lue in that category based on f l l
Same as Dashboard but for one selected customer only. (This report does not combine wire activi ty when names do not match exactly)
Originated and Received Transactions by Customer within date range. (This report does not combine wire activi ty when names do not match exactly)
“FedTransaction Analyzer” and "Fedwire" are regis tered service marks of the Federa l Reserve Banks . A complete l i s t of marks owned by the Federa l Reserve Banks i s ava i lable at FRBservices .org."Excel" i s a regis tered trademark or trademark of Microsoft Corporation in the U.S. and/or other countries .
For questions please ca l l the Customer Contact Center at (888) 333-7010. For feedback and suggestions please emai l us at FedTransactionAnalyzer@chi .frb.org.
Disclaimer The reports generated by this service conta in post-process ing information from actual Fedwire® Funds Service transactions and should be handled accordingly by your insti tution. Your use of this service i s subject to the terms and conditions in the appendix to Operating Ci rcular 1 that relates to this service.
The beneficiary identi fier research tab provides a l i s ting of beneficiary identi fiers (including those used by your cl ients i f your insti tution i s the beneficiary’s bank) for those wires your insti tution received during the reporting period. The identi fiers are ordered by tota l volume of wires received.
The originator identi fier research tab provides a l i s ting of originator identi fiers (including those for your cl ients i f your insti tution i s the originator’s bank) for those wires your insti tution sent during the reporting period. The identi fiers are ordered by tota l volume of wires sent.
The chart summarizes activi ty (va lue/volume) by ISO country code for wires that include a SWIFT Bus iness Identi fier Code (BIC) for ei ther the originator’s bank or the beneficiary’s bank. The ISO country code i s a component of the BIC.
Dis tribution Over Time, Top Transactions by Va lue and Volume, Average Transactions , Top Percenti les , Transactions by Bus iness Function and Outl iers .
Data i s sorted by the cri teria you speci fy. Data conta ined in this report i s based on the Master Account s tructure at the time of report creation.
FedTransaction Analyzer® ServiceWorksheet Recap
Create Preformatted Reports To create the preformatted reports please enable the macros by cl i cking Options on the Message Bar (a securi ty dia log box opens). Once macros are enabled use the drop-down buttons above to select the des i red report. (See below for a description of the ava i lable reports .) The selected report wi l l then be automatica l ly generated. Depending on the number of transactions and computer speed i t may take severa l minutes to generate the worksheets .
(Reports are available in Excel® version 2007 or later
FedTransaction Analyzer Sample Reports v10.18.17 Page 4
2a) Data Report: User-specified Report Note: Provides over 30 columns of data in sort order specified by user – no sample shown.
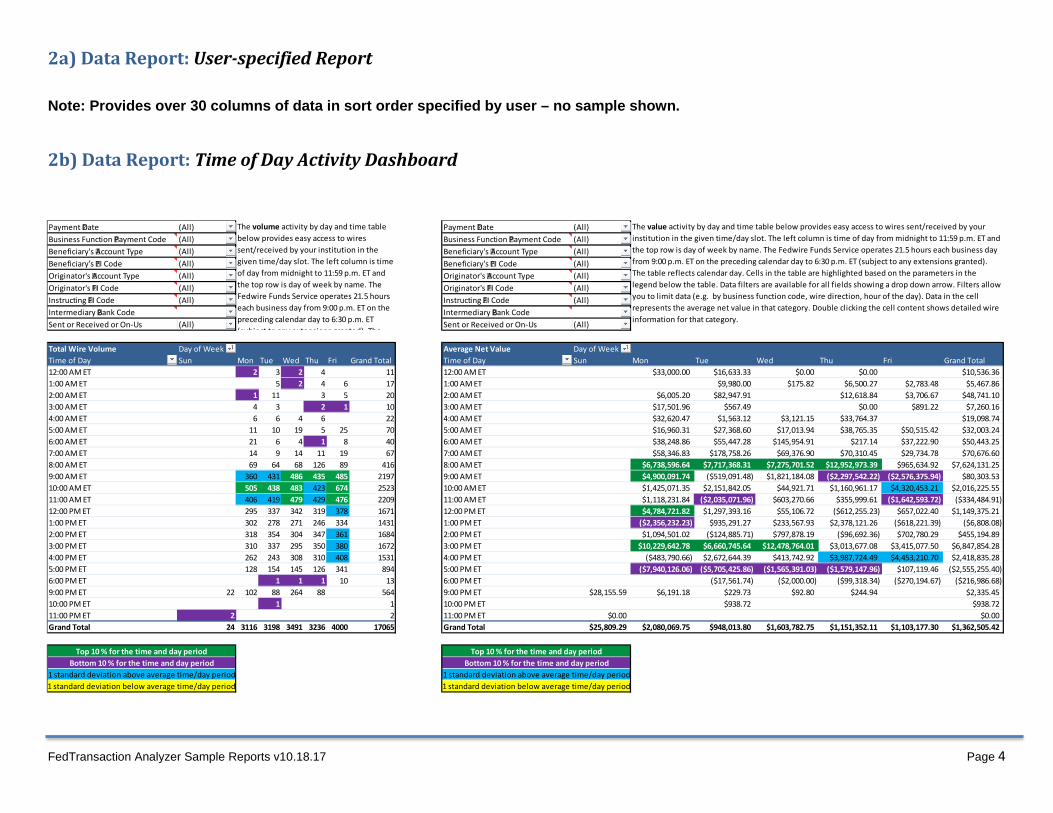
2b) Data Report: Time of Day Activity Dashboard
Payment Date (All) Payment Date (All)Business Function Payment Code (All) Business Function Payment Code (All)Beneficiary's Account Type (All) Beneficiary's Account Type (All)Beneficiary's FI Code (All) Beneficiary's FI Code (All)Originator's Account Type (All) Originator's Account Type (All)Originator's FI Code (All) Originator's FI Code (All)Instructing FI Code (All) Instructing FI Code (All)Intermediary Bank Code Intermediary Bank CodeSent or Received or On-Us (All) Sent or Received or On-Us (All)
Total Wire Volume Day of Week Average Net Value Day of WeekTime of Day Sun Mon Tue Wed Thu Fri Grand Total Time of Day Sun Mon Tue Wed Thu Fri Grand Total12:00 AM ET 2 3 2 4 11 12:00 AM ET $33,000.00 $16,633.33 $0.00 $0.00 $10,536.361:00 AM ET 5 2 4 6 17 1:00 AM ET $9,980.00 $175.82 $6,500.27 $2,783.48 $5,467.862:00 AM ET 1 11 3 5 20 2:00 AM ET $6,005.20 $82,947.91 $12,618.84 $3,706.67 $48,741.103:00 AM ET 4 3 2 1 10 3:00 AM ET $17,501.96 $567.49 $0.00 $891.22 $7,260.164:00 AM ET 6 6 4 6 22 4:00 AM ET $32,620.47 $1,563.12 $3,121.15 $33,764.37 $19,098.745:00 AM ET 11 10 19 5 25 70 5:00 AM ET $16,960.31 $27,368.60 $17,013.94 $38,765.35 $50,515.42 $32,003.246:00 AM ET 21 6 4 1 8 40 6:00 AM ET $38,248.86 $55,447.28 $145,954.91 $217.14 $37,222.90 $50,443.257:00 AM ET 14 9 14 11 19 67 7:00 AM ET $58,346.83 $178,758.26 $69,376.90 $70,310.45 $29,734.78 $70,676.608:00 AM ET 69 64 68 126 89 416 8:00 AM ET $6,738,596.64 $7,717,368.31 $7,275,701.52 $12,952,973.39 $965,634.92 $7,624,131.259:00 AM ET 360 431 486 435 485 2197 9:00 AM ET $4,900,091.74 ($519,091.48) $1,821,184.08 ($2,297,542.22) ($2,576,375.94) $80,303.5310:00 AM ET 505 438 483 423 674 2523 10:00 AM ET $1,425,071.35 $2,151,842.05 $44,921.71 $1,160,961.17 $4,320,453.21 $2,016,225.5511:00 AM ET 406 419 479 429 476 2209 11:00 AM ET $1,118,231.84 ($2,035,071.96) $603,270.66 $355,999.61 ($1,642,593.72) ($334,484.91)12:00 PM ET 295 337 342 319 378 1671 12:00 PM ET $4,784,721.82 $1,297,393.16 $55,106.72 ($612,255.23) $657,022.40 $1,149,375.211:00 PM ET 302 278 271 246 334 1431 1:00 PM ET ($2,356,232.23) $935,291.27 $233,567.93 $2,378,121.26 ($618,221.39) ($6,808.08)2:00 PM ET 318 354 304 347 361 1684 2:00 PM ET $1,094,501.02 ($124,885.71) $797,878.19 ($96,692.36) $702,780.29 $455,194.893:00 PM ET 310 337 295 350 380 1672 3:00 PM ET $10,229,642.78 $6,660,745.64 $12,478,764.01 $3,013,677.08 $3,415,077.50 $6,847,854.284:00 PM ET 262 243 308 310 408 1531 4:00 PM ET ($483,790.66) $2,672,644.39 $413,742.92 $3,987,724.49 $4,453,210.70 $2,418,835.285:00 PM ET 128 154 145 126 341 894 5:00 PM ET ($7,940,126.06) ($5,705,425.86) ($1,565,391.03) ($1,579,147.96) $107,119.46 ($2,555,255.40)6:00 PM ET 1 1 1 10 13 6:00 PM ET ($17,561.74) ($2,000.00) ($99,318.34) ($270,194.67) ($216,986.68)9:00 PM ET 22 102 88 264 88 564 9:00 PM ET $28,155.59 $6,191.18 $229.73 $92.80 $244.94 $2,335.4510:00 PM ET 1 1 10:00 PM ET $938.72 $938.7211:00 PM ET 2 2 11:00 PM ET $0.00 $0.00Grand Total 24 3116 3198 3491 3236 4000 17065 Grand Total $25,809.29 $2,080,069.75 $948,013.80 $1,603,782.75 $1,151,352.11 $1,103,177.30 $1,362,505.42
Top 10 % for the time and day periodTop 10 % for the time and day periodBottom 10 % for the time and day period
The volume activity by day and time table below provides easy access to wires sent/received by your institution in the given time/day slot. The left column is time of day from midnight to 11:59 p.m. ET and the top row is day of week by name. The Fedwire Funds Service operates 21.5 hours each business day from 9:00 p.m. ET on the preceding calendar day to 6:30 p.m. ET (subject to any extensions granted) The
The value activity by day and time table below provides easy access to wires sent/received by your institution in the given time/day slot. The left column is time of day from midnight to 11:59 p.m. ET and the top row is day of week by name. The Fedwire Funds Service operates 21.5 hours each business day from 9:00 p.m. ET on the preceding calendar day to 6:30 p.m. ET (subject to any extensions granted). The table reflects calendar day. Cells in the table are highlighted based on the parameters in the legend below the table. Data filters are available for all fields showing a drop down arrow. Filters allow you to limit data (e.g. by business function code, wire direction, hour of the day). Data in the cell represents the average net value in that category. Double clicking the cell content shows detailed wire information for that category.
1 standard deviation above average time/day period1 standard deviation below average time/day period
Bottom 10 % for the time and day period1 standard deviation above average time/day period1 standard deviation below average time/day period

FedTransaction Analyzer Sample Reports v10.18.17 Page 5
2c) Data Report: Bene ID Research
FedTransaction Analyzer Sample Reports v10.18.17 Page 6
2d) Data Report: Origin ID Research
FedTransaction Analyzer Sample Reports v10.18.17 Page 7
2e) Data Report: Activity by ISO Country Code

FedTransaction Analyzer Sample Reports v10.18.17 Page 8
3a) Management Dashboard Report: Organization Dashboard – Sample page 1 of 4
Query Search Criteria Advanced Search
Date Range From: 04/01/2016 To: 06/30/2016 Sender ABA N/ATransaction Value Range From: N/A To: N/A Receiver ABA N/AUser John Doe - User IMAD Number N/ASubmiss ion Date 08/08/2016 17:10:11
Number of Entries 17065
A. Distribution over Time
Items Sent Items Received On-Us ItemsTotal # of Transactions 10,025 7,008 32
Total Value of Transactions ($2,207,740,133.73) $3,049,026,223.70 $2,089,655.60
Dashboard Report
0
200
400
600
800
1000
1200
3/28 4/4 4/11 4/18 4/25 5/2 5/9 5/16 5/23 5/30 6/6 6/13 6/20 6/27Week of
# of Wires(April 1 to June 30, 2016)
Items Sent
Items Received
On-Us Items
Chart Frequency
Daily Weekly Monthly

FedTransaction Analyzer Sample Reports v10.18.17 Page 9
3a) Management Dashboard Report: Organization Dashboard – Sample page 2 of 4
B. Top Transactions by Value and VolumeTop 5 Transactions
IMAD # Value Date20160628 B1Q8153C 006704 $143,596,083.21 6/28/201620160427 A1Q8153X 006380 $65,902,218.75 4/27/201620160527 A1Q8151X 007679 $56,795,242.86 5/27/201620160613 B1Q8152C 007288 $48,226,087.26 6/13/201620160616 B1Q8154C 007642 $43,901,080.51 6/16/2016
Top 10 Originators Top 10 ReceiversBy Value Total Value By Value Total ValueOrig3906 (310926618) $812,240,572.44 Beneficiary1619 (613312857) $580,000,000.00Orig3887 (798058262) $597,626,024.09 Beneficiary1680 (479778571) $407,000,000.00Orig3868 (613312857) $580,000,000.00 Beneficiary3068 (048369142) $365,336,449.53Orig3901 (310926618) $446,245,375.29 Beneficiary1619 (657824285) $317,000,000.00Orig3886 () $421,000,000.00 Beneficiary3781 (568259533) $293,563,588.14Orig3868 (657824285) $317,000,000.00 Beneficiary1744 (021451428) $232,289,574.56Orig3910 (310926618) $192,797,752.12 Beneficiary3264 (004963016) $230,000,464.09Orig4770 (664302281) $167,662,198.49 Beneficiary1739 (67992385.) $213,000,000.00Orig3961 (667090866) $163,391,373.60 Beneficiary3254 (828685714) $167,662,198.49Orig5014 (568259533) $146,781,794.07 Beneficiary1674 (833136857) $163,391,373.60
By Volume Total Volume By Volume Total VolumeOrig3906 (310926618) 3,637 Beneficiary4518 (822343000) 792Orig3910 (310926618) 1,334 Beneficiary5081 (457795088) 366Orig3308 (822343000) 528 Beneficiary1204 (697586637) 224Orig3912 (310926618) 345 Beneficiary2848 (056066440) 213Orig3815 (296943261) 263 Beneficiary3781 (568259533) 182Orig3523 (696137345) 213 Beneficiary2870 (846046605) 161Orig4526 (373200685) 159 Beneficiary1 () 145Orig3901 (310926618) 136 Beneficiary118 (665825843) 132Orig5278 (386708860) 124 Beneficiary2973 (325675833) 124Orig5409 (113453742) 122 Beneficiary2828 (373200685) 114

FedTransaction Analyzer Sample Reports v10.18.17 Page 10
3a) Management Dashboard Report: Organization Dashboard – Sample page 3 of 4
C. Top Percentile(s)
4,355
2,9531,977
6,819
267 477 183 025.6%
42.9%54.5%
94.6% 96.1% 98.9% 100.0% 100.0%
0.0%
20.0%
40.0%
60.0%
80.0%
100.0%
0
2000
4000
6000
8000
$10,000 $50,000 $100,000 $500,000 $1,000,000 $5,000,000 $10,000,000 More
Freq
uenc
y
Transactions <=
Transactions by Amount(April 1 to June 30, 2016)
Frequency Cumulative %

FedTransaction Analyzer Sample Reports v10.18.17 Page 11
3a) Management Dashboard Report: Organization Dashboard – Sample page 4 of 4
D. Transactions by Business FunctionBusiness Function Total
ValueTotal
VolumeAverage
TransactionBTR: Bank Transfer (Beneficiary is a bank) 1,846,941,514$ 643 2,872,382$ CKS: Check Same Day Settlement -$ 0 n/aCTP*: Customer Transfer Plus (Beneficiary is not a bank) 1,049,640,011$ 2,538 413,570$ CTR*: Customer Transfer (Beneficiary is not a bank) 2,180,789,938$ 12,665 172,190$ DEP:Deposit to Sender's Account -$ 0 n/aDRB: Bank-to-bank Drawdown Request -$ 0 n/aDRC: Customer or corporate Drawdown Request 230,105,655$ 675 340,897$ DRW: Drawdown Payment 181,484,550$ 405 448,110$ FFR: Fed Funds Returned -$ 0 n/aFFS: Fed Funds Sold -$ 0 n/aSVC: Service Message 13,216,082$ 139 95,080$ Other -$ 0 n/aGRAND TOTAL 5,502,177,750$ 17,065 322,425$ * (Note: Can also be used for Cover Payments)
Origination Receipt# of Transactions Above Average 473 720# of Transactions Below Average 16,592 16,345
# of Transactions 100% Above Average 305 429# of Transactions 50% Below Average 16,324 16,049
Disclaimer: The reports generated by this service conta in post-process ing information from actual Fedwire® Funds Service transactions and should be handled accordingly by your insti tutiYour use of this service i s subject to the terms and conditions in the appendix to Operating Ci rcular 1 that relates to this service.

FedTransaction Analyzer Sample Reports v10.18.17 Page 12
3b) Management Dashboard Report: Customer Dashboard – Sample page 1 of 4 NOTE: same summary data as for Organization Report except for one selected customer only.
3b) Management Dashboard Report: Customer Dashboard– Pages 2 of 4
Pages 2 through 4 show same data summaries as the Organization Report except for one selected customer only.
Select Customer Name: 1
Query Search Criteria Advanced Search
Date Range From: 01/01/2014 To: 05/31/2015 Sender ABA N/ATransaction Value Range From: N/A To: N/A Receiver ABA N/AUser John Smith IMAD Number N/ASubmiss ion Date Today
Number of Entries 18
A. Distribution over Time
`
Total # of Transactions 18Total Value of Transactions $2,071,615.93
0
1
2
3
4
5
Jan Feb Mar Apr May Jun Jul Aug Sep Oct Nov Dec Jan Feb Mar Apr MayMonth of
# of Wires(January 8, 2014 to May 28, 2015)
Chart Frequency
Daily Weekly Monthly

FedTransaction Analyzer Sample Reports v10.18.17 Page 13
The Financial Services logo and “FedTransaction Analyzer” are registered service marks of the Federal Reserve Bank. A complete list of marks owned by the Federal Reserve Banks is available at FRBservices.org "Excel" is a registered trademark of Microsoft Corporation in the United States and/or other countries. “ISO” is a registered service mark of the International Organization for Standardization. “SWIFT” is a registered trademark of S.W.I.F.T. SCRL.
Query Search Criteria Advanced Search
Date Range From: 01/01/2014 To: 05/31/2015 Sender ABA N/ATransaction Value R From: N/A To: N/A Receiver ABA N/AUser John Smith IMAD Number N/ASubmiss ion Date Today
Number of Entries 66
laimer: The reports generated by this service conta in post-process ing information from actual Fedwire® Funds Service transactions and should be handled accordingly by your insti tution.Your use of this service i s subject to the terms and conditions in the appendix to Operating Ci rcular 1 that relates to this service.
Customer ID Customer Name SourceTotal Transaction
ValueTotal Transaction
Volume
Average Transaction
Value
# of Transactions Above Average
# of Transactions 100% Above
Average
5678 123 Company Originated $1,076,484.16 9 $119,609.35 2 25678 123 Company Received $995,131.77 9 $110,570.20 2 11111 ABC Bank Originated $207,058.79 10 $20,705.88 2 11111 ABC Bank Received $231,866.01 10 $23,186.60 3 2321 Jane Doe Originated $1,521,254.86 9 $169,028.32 2 2321 Jane Doe Received $2,288,459.33 9 $254,273.26 3 3222 John Doe Originated $4,159,683.89 10 $415,968.39 1 1222 John Doe Received $5,737,198.57 10 $573,719.86 2 21234 My Bank Originated $2,271,123.95 9 $252,347.11 2 11234 My Bank Received $792,202.57 9 $88,022.51 3 29876 XYZ CU Originated $316,831.38 10 $31,683.14 2 19876 XYZ CU Received $168,510.67 10 $16,851.07 3 1456 Your Bank Originated $1,078,593.67 9 $119,843.74 2 1456 Your Bank Received $417,661.78 9 $46,406.86 2 1
Fi l ter = Al l
3c) Management Dashboard Report: Customer Activity Report