EGI federated Cloud, developing a Production Quality Federated Cloud Infrastructure
1
Federated Query Processing Using OntologyStructure and Ranking
Neda Alipanah, Latifur Khan, and Bhavani ThuraisinghamDepartment of Computer Science
University of Texas at DallasRichardson, U.S.A.
Email: neda.alipanah, lkhan, [email protected]—In view of the need for service-based query processing in a federated environment, ranking data sources (ontologies)and robust query expansion in a specific domain have great impact on the performance and accuracy of web applications. Sincerobust query expansion exploits multiple data sources (ontologies) instead of a single ontology, ontology ranking is considered asa precursor for robust query expansion. For this, first, we calculate the similarity of ontologies by an Entropy Based Distribution(EBD) measurement based on commonality of overlapping entities [13]. Next, we determine robust expansion terms by a numberof semantic measures. We consider each individual ontology and user query keywords to determine the Basic Expansion Terms(BET) based on the structure of the ontology. We use Density Measure (DM), Betweenness Measure (BM), Semantic SimilarityMeasure (SSM) and Weight of Semantic Path (WSP) to calculate BET. Then, we specify New Expansion Terms (NET) usingthe ontology alignment. Both BET and NET are determined using Map-Reduce algorithms for efficiency and scalability purpose.Further, we determine the Robust Expansion Term (RET) using a dynamic threshold. Ontology rank is used as a heuristic todetermine dynamic threshold and k-top relevant terms for each user query. Finally, we compare the result of our novel ontology-driven expansion approach with existing tools and show the effectiveness of our robust expansion in federated architecture.
Index Terms—Federated Query, Query Expansion, Ontology, Ontology Matching, Expansion Terms.
F
1 INTRODUCTION
THE distributed federated architecture of the inter-net provides many benefits for Web applications
in the World Wide Web. However, there are alwaysseveral related data sources for simultaneous consid-eration by applications that causes performance andaccuracy problems for federated queries. To improvethe information retrieval performance and accuracy,it is required to rank data sources (ontologies) andenrich the original user query. The process of addingterms to an original user query to cover the gapbetween the user query and required information iscalled query expansion. For example, consider severalbibliography ontologies which present descriptionsof publication like Author, Organization, Product, Eventand Topic. They include several entities and theirrelationships. When a user searches for Publicationand Academic Staff, it is desired to retrieve relatedURIs (i.e. web pages) with specific priorities fromdifferent data sources such that the URIs for differentkinds of publications (i.e. Article, Book, Proceedings)and the URIs for all Academic Staff are retrieved in acorrect order. There are two different query expansionapproaches: dependent and independent knowledgemodels [4]. Dependent knowledge model concentrateson the content of document collections and use dif-ferent techniques such as term co-occurrence, conceptnode structure in lexical networks or distributionanalysis of terms in documents to calculate the queryexpansion. Independent knowledge models concen-
trates on domain or general ontologies (i.e. WordNet)[4] for query expansion calculation. In our bibliogra-phy example, several expansion terms exist such asThesis, Tech Report, Soft Copy, Association, Collection andWriter. The major problem with different availableexpansion methods is that they may worsen the queryresult in some cases [3]. Thus, the goal of manyresearchers is to determine some weighting criteriathat improves robustness of query expansion. Thatis, query expansion improves precision and recall ofretrieved URIs for each query.
In this paper, we propose a novel weighting mecha-nism to find the expansion terms based on a combina-tion of independent and dependent knowledge tech-niques benefitting from both methods. We use a setof ontologies in a domain as independent knowledgeand calculate the expansion terms using an iterativeMap-Reduce Breath First Search algorithm to benefitfrom parallel processing. For this, first we constructthe adjacency matrix of ontologies using an RDFgraph of ontologies. Second, we determine the BasicExpansion Terms (BET) in each ontology based ontheir structure. That is, we define the central keywordin each ontology by calculating the paths for all pair ofentities in the ontology graph. Then, we find the num-ber of shortest paths passing through each keyword.We compute the BET using the density of query termsand semantic similarity between the central keywordand other query terms. Third, we use the idea ofco-occurrence across ontologies as it is used in the
2
dependent knowledge. We find the New ExpansionTerms (NET) by a Map-Reduce ontology aligningalgorithm. Similar entities are determined by theirname and structural similarity in each ontology. Atthe end of expansion we generate a set of terms alongwith weight as a query vector. Weights are calculatedbased on different criteria including Semantic Similar-ity Measure (SSM), Density Measure(DM), AlignmentConfidence Measure (ACM), and Weight of SemanticPath (WSP). Finally, we use the rank of ontologies asa heuristic to find the set of Robust Expansion Terms(RET) with the largest weights. We use Blackbook[7] to facilitate federated queries and run differentqueries on a number of data sources. Blackbook ex-ploits lucene indexing to find the matching of thequery vector based on cosine similarities. For eachquery term, it retrieves all the relevant instances inthe ontologies. Our query expansion improves theprecision and recall of retireved instances for eachquery.
The idea of ranking ontologies is not only con-sidered as a solution for query expansion scenarios,but also it is a solution for a wider scope of knowl-edge searching in ontology-driven searches. We rankontologies based on the frequency of their CommonSubset of Entities (CSE). We use a novel Map-Reducealgorithm for matching ontologies. We use two Map-Reduce jobs to find out all possible pair of entitiesbetween two ontologies. Then, we calculate the simi-larity between them using the name similarity and thestructural similarity. CSE between a pair of ontolo-gies indicates the frequency of repetition of entities.Furthermore, we use the Entropy Based Distribution(EBD) technique to find the distance between eachpair of ontologies using the CSE. EBD values are usedfor ranking ontologies using the page rank idea.The contributions of our paper are as follows:
• Determining BET based on structure of individ-ual ontologies including the density, semanticsimilarity of terms in each ontology using iter-ative Map-Reduce Breath First Search algorithm.
• Finding the Common Set of Entities (CSE) acrossmultiple ontologies by Map-Reduce algorithm.The CSE is used for both ranking ontologies andfinding additional terms across ontologies callingNET.
• Defining a similarity measurement between on-tologies based on Entropy Based Distribution(EBD) of entities for ranking ontologies using theMap-Reduce CSE.
• Defining a novel weighting measurement for ex-tracting Robust Expansion Terms (RET) usinga heuristic. We use betweenness and centrality,density, semantic similarity, weight of semanticpaths measurements and alignment confidence tocalculate the weight the expansion terms. Thenwe use the ontology rank as a heuristic to calcu-late RET.
• Analyzing the improvement of our Map-Reducequery expansion algorithm and comparing itwith other existing methods [12].
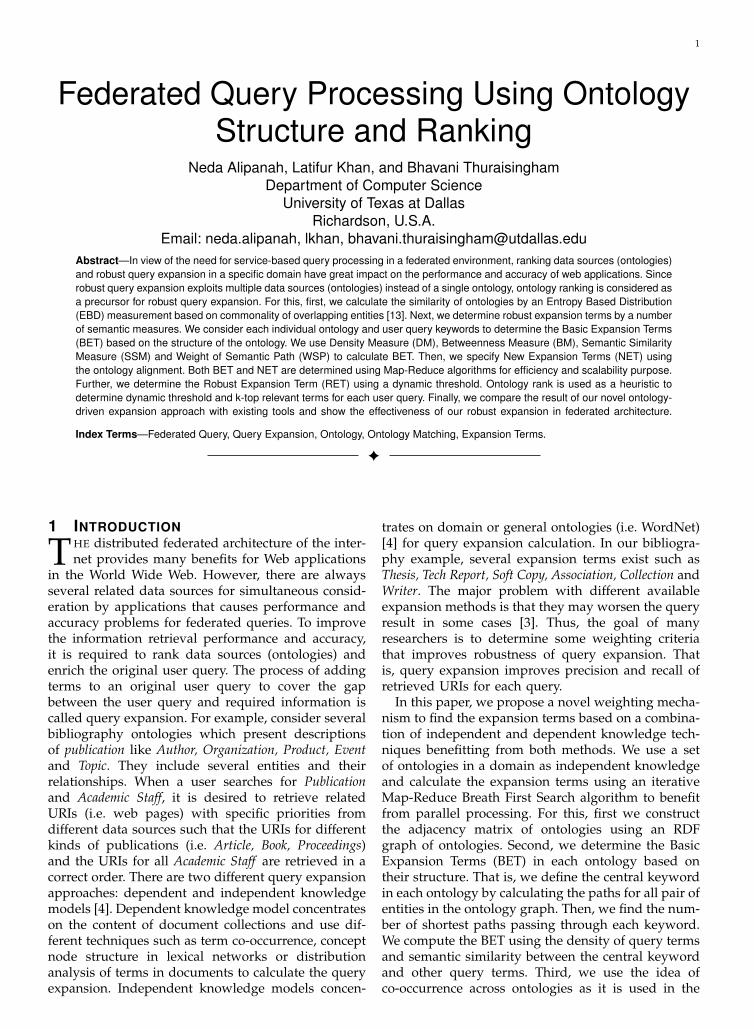
The rest of this paper is organized as follows. In sec-tion 2, we present the architecture of query processingas a web service. In section 3, the problem statement ispresented. In section 4, details of Map-Reduce ontol-ogy alignment and ranking are presented. In section5, details of robust query expansion are explained. Insections 6, 7 and 8, experimental results, related workand the conclusion are explained respectively.2 FEDERATED QUERY PROCESSING SER-VICEThe federated architecture of the Internet leads ustoward defining services for manipulating web ap-plication queries to eliminate technology dependency.Figure 1 presents the architecture of federated queryprocessing as a service for web applications. In oursystem, the user queries (keywords) are recieved bya Web application. The Web application invokes thefederated query processing service to compute ontol-ogy ranks and query expansion terms. This servicecomputes BET, NET and RET along with a dynamicthreshold for the query. It improves the performanceand accuracy of Web application result retrieval. De-tails of BET, NET and RET calculations are explainedin the next sections.
Fig. 1. Federated Query Service.3 ROBUST QUERY EXPANSION USING ON-TOLOGY RANK AND STRUCTURE3.1 Problem StatementGiven a query Q with m keywords and differentontologies {O1, . . . , On}, all describing semantic infor-mation on a particular domain with different levelsof coverage, the goal is to determine robust queryexpansion for Q based on the structure of ontologiessuch that if the number or the scale of ontologiesdramatically increases, expansion terms are calculatedefficiently . A query expansion for Q is a set of weightswi = (w1, w2, . . . , wm) over entities in a vocabularyV of several ontologies, where wi ∈ [0, 1]. Each wi
represents a weight for term vi ∈ V . Using a roundingsoft threshold, intuitively wi is an indicator to includeor exclude the term from expansion to retrieve themost relevant top-k terms. The key idea is to find ro-bust expansion terms including the best semanticallyrelated terms that improve the precision and recallof query retrieval in various ontologies with differentscales.
For instance, considering the Bibliography domain,suppose there are four bibliography ontologies includ-ing MIT, UMBC, Karlsruhe and INRIA ontologies [11]and a user searches for individuals and correspond-ing web URIs for Publication and Academic Staff. As
3
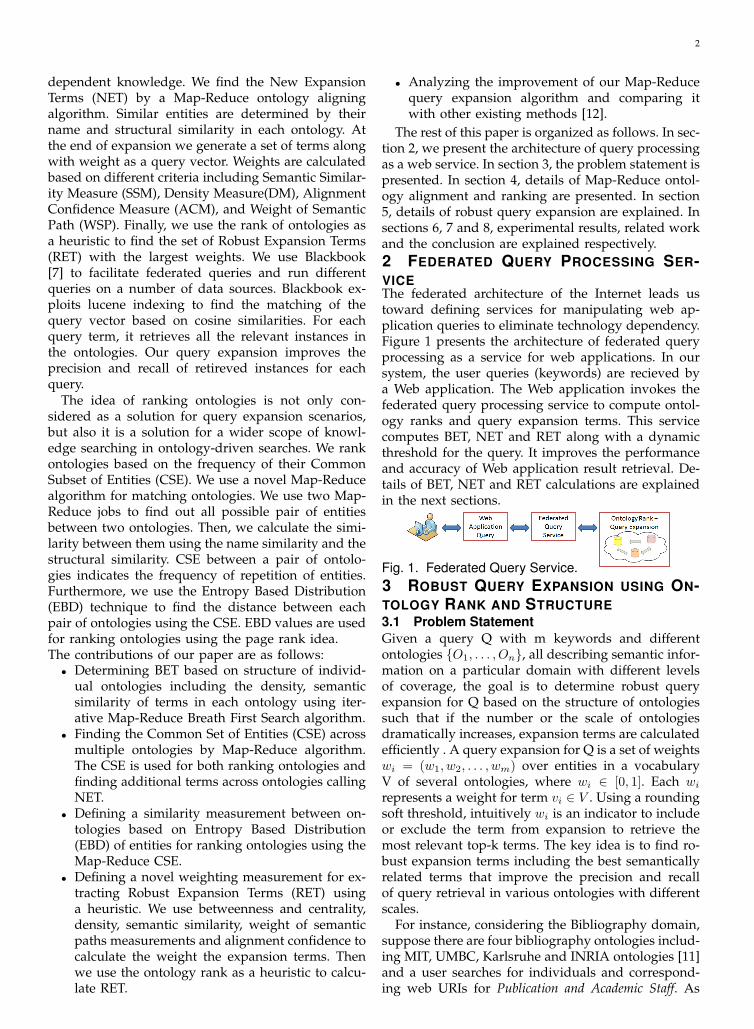
depicted in Figure 2, possible query expansion in theKarlsruhe ontology is defined as Publication = {Article,Book, Booklet, InBook, InCollection, InProceedings, Man-ual, Misc, Proceedings, Report, Technical Report, ProjectReport, Thesis, Master Thesis, PhD Thesis, Unpublished}and Academic Staff = {Faculty Member, Lecturer}, whilein UMBC ontology, possible expansion is specified asPublication = {Article, Book, InBook, InCollection, InPro-ceedings, Master Thesis, PhD Thesis, Misc, Proceedings,Tech Reports } and Academic Staff={} as presented inFigure 3. Thus, it is required to determine a mecha-nism to discriminate between the related terms thatimproves the query retrieval. For this, we concentrateon efficient scalable algorithms for expanding queriesusing ontology alignment, ontology rank and thestructure of ontology. Our query expansion method-ology uses the Map-Reduce paradigm for efficiencyand scalability purpose.
Fig. 2. Karlsruhe Bibliography Ontology.
Fig. 3. UMBC Bibliography Ontology.
4 RANKING ONTOLOGIES USING COMMONSUBSET OF ENTITIES
We rank ontologies by calculating the Common Sub-set of Entities (CSE) between them. CSE is used tomeasure the distance between the ontologies. Forlarge ontologies, CSE is computationally intensivewith a single processor. Thus, we propose a Map-Reduce algorithm to calculate the CSE as follows.Map-Reduce is a functional programming approachbenefiting from parallel and distributed processing.A computation is decomposed into a map operationfollowed by a reduce operation. These are specifiedby two functions,
Mapper :< kin, vin >→< kint, vint > (1)Reducer :< kint, V ≡ {vint} >→< kout, vout > (2)
Both Mapper and Reducer operate on key-value pairs,which we denote using angle brackets < k, v >.Mapper produces the intermediate key-value pairsand Reducer use them to compute the final key-value pairs. Keys are used in the reducer function forgrouping values.
4.1 Ontology Alignment using Map-ReduceIn our ontology alignment method, an RDF graph isused to exhibit the structure of ontologies. The RDFgraph of an OWL DL ontology presents necessaryelements for describing the semantic structure of on-tologies.
Definition 1 (Ontology Graph): The ontologygraph is a directed, acyclic and connected graph G =<V,E >, where V include all the entities of ontologyand E is a set of all properties between entities.
Definition 2 (Ontology Vocabulary): The ontologyvocabulary of an RDF graph is all subjects and objectsthat are RDF URI references and defined in RDFsentences. They cover all entities and properties of anontology including concepts, object properties, dataproperties and individuals. They do not belong to thebuilt-ins provided by Ontology Languages.
4.1.1 Common Subset of Entities (CSE) betweenOntologies using Map-Reduce Algorithm
Figure 4 presents the flow of Map-Reduce computa-tions. CSE calculation is performed in two phases bytwo Map-Reduce jobs.
Phase I: In this phase, the Map-Reduce algorithmtakes the adjacency matrix of each ontology separatelyand determine all possible comparisons between theentities of two ontologies. Details of the Map-Reducealgorithms are as follows.
Fig. 4. CSE Map-Reduce Computation Flow.Step 1: Given two ontologies Oi and Oj , the al-
gorithm constructs an adjacency matrix for both ofthem. That is, for any entity ei in the vocabularyof Oi or Oj , the algorithm creates a tuple in theformat of < kin, Vin ≡ ”ei|{(edge, neighbor)}” > wherekin is an integer counter to present the comparingorder of ontology nodes and Vin is the value thatincludes entity ei followed by a list of direct edgesand neighbors. Suppose that Oi and Oj have n andm entities respectively. Since it is required to compareall entities of Oi with all the entities of Oj , we have(n ∗m) pairs of < kin, Vin > for each ontology. Whena key value kin from Oi is the same as kin of Oj ,they are considered as comparable entities. Finally,the adjacency matrices of ontologies are used as input
4
for mappers. For example, considering the sample on-tology in Figure 2, the tuple for the TechnicalReportentity is < 1, ”TechnicalReport|(Subclass,Report)}” >.
Step 2: In this step, mappers produce intermediatevalues for all entities in the adjacency matrix of Oi
and Oj . That is for any < ki, ”ei|{(edge, neighbor)}” >, itproduces < ki, ”(ei, NULL)|{(edge, neighbor)}, {}” >. Map-pers actually construct a structure that enables thecomparison of two separate entities from Oi and Oj .Since there is no information about different entitiesof ontologies in memory, we only reserve space withNULL values for the comparison of correspondingentities. This structure is used as the input for reducerstep. For instance, considering the previous exam-ple from Figure 2, the new structure is as follows< 1, ”(TechnicalReport,NULL)|{(Subclass,Report)}, {}” >
Step 3: In this step, the reducer merges all compa-rable pairs of tuples from ontologies Oi and Oj withthe same keys. That is, the algorithm takes two com-parable tuples < ki, ”(ei, NULL)|{(edge, neighbor)}, {}” >
and < kj , ”(ej , NULL)|{(edge, neighbor)}, {}” >, fromOi and Oj , with ki = kj = k. It produces <
k, ”(ei, ej)|{(edgei, neighbori)}, {(edgej , neighborj)}” >. Theoutput size for reducer is (n ∗ m), since all thetuples with the same keys are already merged to-gether. For instance, an example of comparable en-tities from the Karlsruhe and UMBC ontologies is< 1, ”(TechnicalReport, TechReport)|{(Subclass,Report)},{(Subclass,Report)}” >
Phase II: In this phase, the second Map-Reduce jobtakes all comparable entities from phase I as its inputand determines the actual similarity between them inthe Map and Reduce steps.
Step 1: In the Map step, we calculate the similaritybetween all comparable entities. Similarity is calcu-lated based on the average of name and structuralsimilarity between entities from Oi and Oj . That isfor < k, ”(ei, ej)|{(edgei, neighbori)}, {(edgej , neighborj)}” >,name similarity is calculated by computing Jaro Win-kler between (ei, ej) [6]. The structural similarity iscalculated based on the neighbor similarities and dif-ferent edge type similarity. Details of the NeighborSimilarity calculation and Similarity of Relation Typesare as follows.
• Neighbors Similarity(NS): Output tuples result-ing from phase I, include the list of all theneighbors and the edge type for ei and ej . Theaverage of the similarities between neighbors oftwo entities is calculated as a Neighbor Similaritymeasurement. If the direct neighbors are the sameusing Jaro Winkler distance; we increase totalsimilarity value; and finally, we normalize thetotal similarity value.
• Similarity of Relation Types (SRT): Consideringthe resulting tuple from phase I, we define twoseparate Relation Type Vectors (RTV) correspond-ing to ei and ej . Each vector has ”n” entriesaccording to the relation types of the entity and
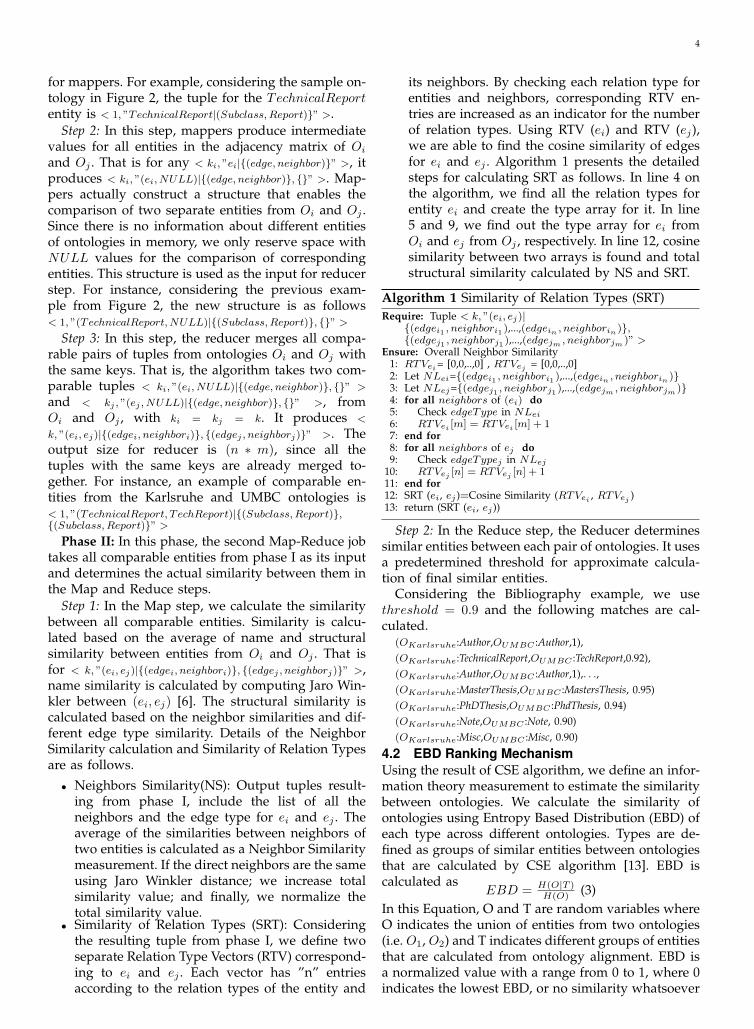
its neighbors. By checking each relation type forentities and neighbors, corresponding RTV en-tries are increased as an indicator for the numberof relation types. Using RTV (ei) and RTV (ej),we are able to find the cosine similarity of edgesfor ei and ej . Algorithm 1 presents the detailedsteps for calculating SRT as follows. In line 4 onthe algorithm, we find all the relation types forentity ei and create the type array for it. In line5 and 9, we find out the type array for ei fromOi and ej from Oj , respectively. In line 12, cosinesimilarity between two arrays is found and totalstructural similarity calculated by NS and SRT.
Algorithm 1 Similarity of Relation Types (SRT)Require: Tuple < k, ”(ei, ej)|
{(edgei1 , neighbori1 ),...,(edgein , neighborin )},{(edgej1 , neighborj1 ),...,(edgejm , neighborjm )” >
Ensure: Overall Neighbor Similarity1: RTVei= [0,0,..,0] , RTVej = [0,0,..,0]2: Let NLei={(edgei1 , neighbori1 ),...,(edgein , neighborin )}3: Let NLej={(edgej1 , neighborj1 ),...,(edgejm , neighborjm )}4: for all neighbors of (ei) do5: Check edgeType in NLei
6: RTVei [m] = RTVei [m] + 17: end for8: for all neighbors of ej do9: Check edgeTypej in NLej
10: RTVej [n] = RTVej [n] + 111: end for12: SRT (ei, ej )=Cosine Similarity (RTVei , RTVej )13: return (SRT (ei, ej ))
Step 2: In the Reduce step, the Reducer determinessimilar entities between each pair of ontologies. It usesa predetermined threshold for approximate calcula-tion of final similar entities.
Considering the Bibliography example, we usethreshold = 0.9 and the following matches are cal-culated.
(OKarlsruhe:Author,OUMBC :Author,1),(OKarlsruhe:TechnicalReport,OUMBC :TechReport,0.92),(OKarlsruhe:Author,OUMBC :Author,1),. . .,(OKarlsruhe:MasterThesis,OUMBC :MastersThesis, 0.95)(OKarlsruhe:PhDThesis,OUMBC :PhdThesis, 0.94)(OKarlsruhe:Note,OUMBC :Note, 0.90)(OKarlsruhe:Misc,OUMBC :Misc, 0.90)
4.2 EBD Ranking MechanismUsing the result of CSE algorithm, we define an infor-mation theory measurement to estimate the similaritybetween ontologies. We calculate the similarity ofontologies using Entropy Based Distribution (EBD) ofeach type across different ontologies. Types are de-fined as groups of similar entities between ontologiesthat are calculated by CSE algorithm [13]. EBD iscalculated as
EBD = H(O|T )H(O) (3)
In this Equation, O and T are random variables whereO indicates the union of entities from two ontologies(i.e. O1, O2) and T indicates different groups of entitiesthat are calculated from ontology alignment. EBD isa normalized value with a range from 0 to 1, where 0indicates the lowest EBD, or no similarity whatsoever
5
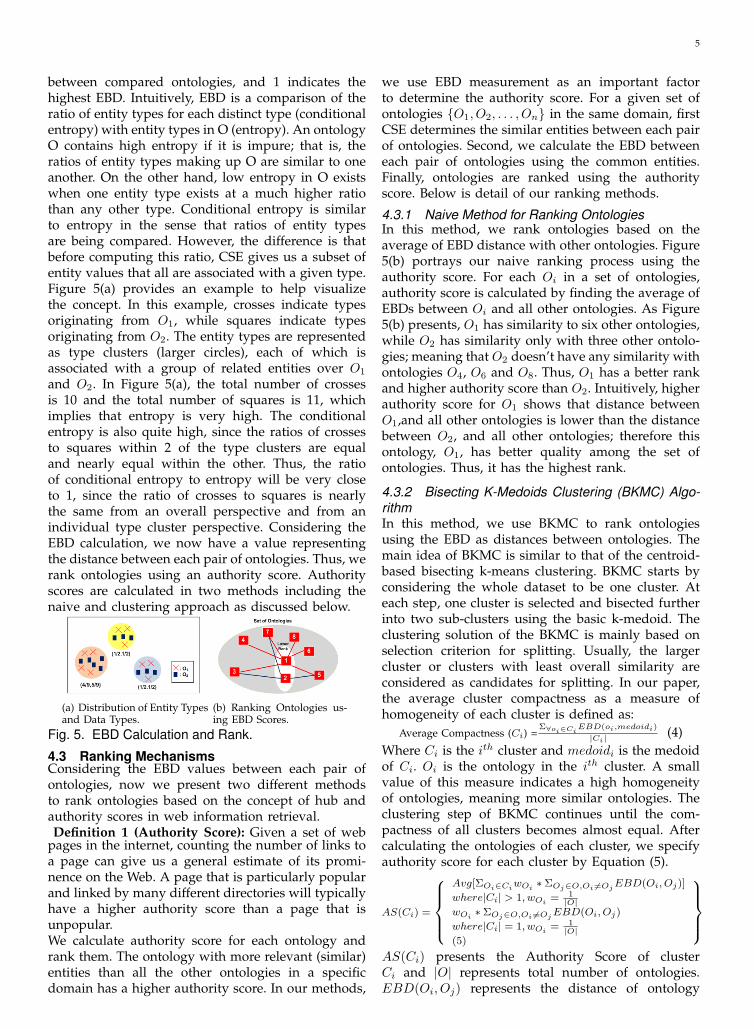
between compared ontologies, and 1 indicates thehighest EBD. Intuitively, EBD is a comparison of theratio of entity types for each distinct type (conditionalentropy) with entity types in O (entropy). An ontologyO contains high entropy if it is impure; that is, theratios of entity types making up O are similar to oneanother. On the other hand, low entropy in O existswhen one entity type exists at a much higher ratiothan any other type. Conditional entropy is similarto entropy in the sense that ratios of entity typesare being compared. However, the difference is thatbefore computing this ratio, CSE gives us a subset ofentity values that all are associated with a given type.Figure 5(a) provides an example to help visualizethe concept. In this example, crosses indicate typesoriginating from O1, while squares indicate typesoriginating from O2. The entity types are representedas type clusters (larger circles), each of which isassociated with a group of related entities over O1
and O2. In Figure 5(a), the total number of crossesis 10 and the total number of squares is 11, whichimplies that entropy is very high. The conditionalentropy is also quite high, since the ratios of crossesto squares within 2 of the type clusters are equaland nearly equal within the other. Thus, the ratioof conditional entropy to entropy will be very closeto 1, since the ratio of crosses to squares is nearlythe same from an overall perspective and from anindividual type cluster perspective. Considering theEBD calculation, we now have a value representingthe distance between each pair of ontologies. Thus, werank ontologies using an authority score. Authorityscores are calculated in two methods including thenaive and clustering approach as discussed below.
(a) Distribution of Entity Typesand Data Types.
(b) Ranking Ontologies us-ing EBD Scores.
Fig. 5. EBD Calculation and Rank.
4.3 Ranking MechanismsConsidering the EBD values between each pair ofontologies, now we present two different methodsto rank ontologies based on the concept of hub andauthority scores in web information retrieval.Definition 1 (Authority Score): Given a set of web
pages in the internet, counting the number of links toa page can give us a general estimate of its promi-nence on the Web. A page that is particularly popularand linked by many different directories will typicallyhave a higher authority score than a page that isunpopular.We calculate authority score for each ontology andrank them. The ontology with more relevant (similar)entities than all the other ontologies in a specificdomain has a higher authority score. In our methods,
we use EBD measurement as an important factorto determine the authority score. For a given set ofontologies {O1, O2, . . . , On} in the same domain, firstCSE determines the similar entities between each pairof ontologies. Second, we calculate the EBD betweeneach pair of ontologies using the common entities.Finally, ontologies are ranked using the authorityscore. Below is detail of our ranking methods.
4.3.1 Naive Method for Ranking OntologiesIn this method, we rank ontologies based on theaverage of EBD distance with other ontologies. Figure5(b) portrays our naive ranking process using theauthority score. For each Oi in a set of ontologies,authority score is calculated by finding the average ofEBDs between Oi and all other ontologies. As Figure5(b) presents, O1 has similarity to six other ontologies,while O2 has similarity only with three other ontolo-gies; meaning that O2 doesn’t have any similarity withontologies O4, O6 and O8. Thus, O1 has a better rankand higher authority score than O2. Intuitively, higherauthority score for O1 shows that distance betweenO1,and all other ontologies is lower than the distancebetween O2, and all other ontologies; therefore thisontology, O1, has better quality among the set ofontologies. Thus, it has the highest rank.
4.3.2 Bisecting K-Medoids Clustering (BKMC) Algo-rithmIn this method, we use BKMC to rank ontologiesusing the EBD as distances between ontologies. Themain idea of BKMC is similar to that of the centroid-based bisecting k-means clustering. BKMC starts byconsidering the whole dataset to be one cluster. Ateach step, one cluster is selected and bisected furtherinto two sub-clusters using the basic k-medoid. Theclustering solution of the BKMC is mainly based onselection criterion for splitting. Usually, the largercluster or clusters with least overall similarity areconsidered as candidates for splitting. In our paper,the average cluster compactness as a measure ofhomogeneity of each cluster is defined as:
Average Compactness (Ci) =Σ∀oi∈Ci
EBD(oi,medoidi)
|Ci|(4)
Where Ci is the ith cluster and medoidi is the medoidof Ci. Oi is the ontology in the ith cluster. A smallvalue of this measure indicates a high homogeneityof ontologies, meaning more similar ontologies. Theclustering step of BKMC continues until the com-pactness of all clusters becomes almost equal. Aftercalculating the ontologies of each cluster, we specifyauthority score for each cluster by Equation (5).
AS(Ci) =
Avg[ΣOi∈Ci
wOi∗ ΣOj∈O,Oi ̸=Oj
EBD(Oi, Oj)]
where|Ci| > 1, wOi= 1
|O|wOi
∗ ΣOj∈O,Oi ̸=OjEBD(Oi, Oj)
where|Ci| = 1, wOi= 1
|O|(5)
AS(Ci) presents the Authority Score of clusterCi and |O| represents total number of ontologies.EBD(Oi, Oj) represents the distance of ontology
6
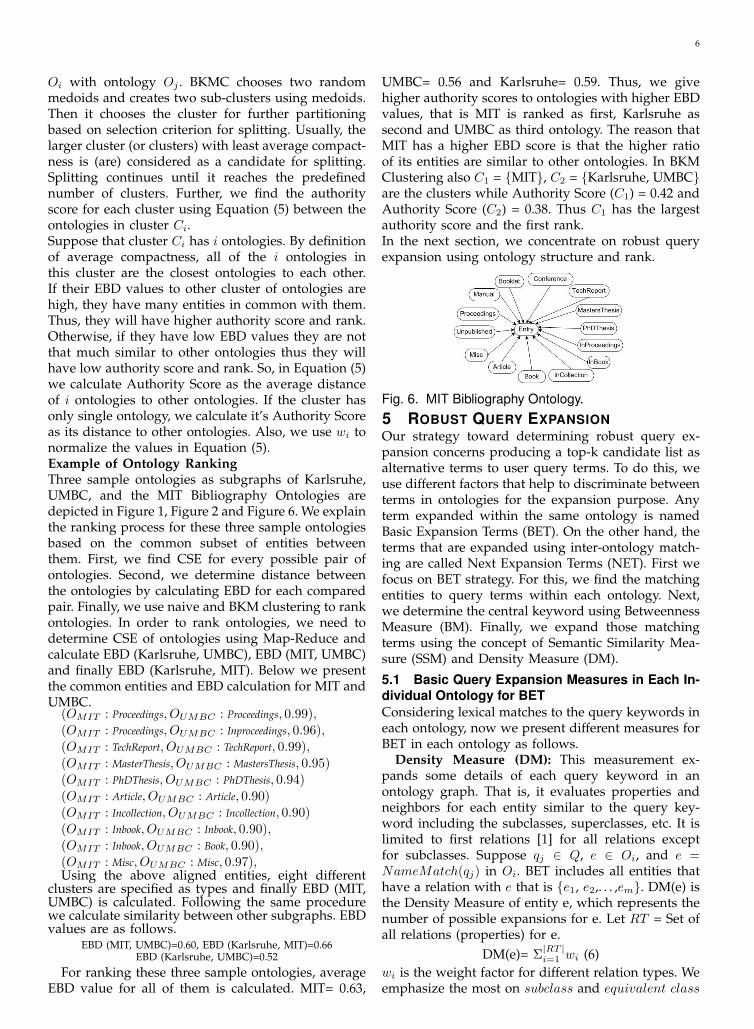
Oi with ontology Oj . BKMC chooses two randommedoids and creates two sub-clusters using medoids.Then it chooses the cluster for further partitioningbased on selection criterion for splitting. Usually, thelarger cluster (or clusters) with least average compact-ness is (are) considered as a candidate for splitting.Splitting continues until it reaches the predefinednumber of clusters. Further, we find the authorityscore for each cluster using Equation (5) between theontologies in cluster Ci.Suppose that cluster Ci has i ontologies. By definitionof average compactness, all of the i ontologies inthis cluster are the closest ontologies to each other.If their EBD values to other cluster of ontologies arehigh, they have many entities in common with them.Thus, they will have higher authority score and rank.Otherwise, if they have low EBD values they are notthat much similar to other ontologies thus they willhave low authority score and rank. So, in Equation (5)we calculate Authority Score as the average distanceof i ontologies to other ontologies. If the cluster hasonly single ontology, we calculate it’s Authority Scoreas its distance to other ontologies. Also, we use wi tonormalize the values in Equation (5).Example of Ontology RankingThree sample ontologies as subgraphs of Karlsruhe,UMBC, and the MIT Bibliography Ontologies aredepicted in Figure 1, Figure 2 and Figure 6. We explainthe ranking process for these three sample ontologiesbased on the common subset of entities betweenthem. First, we find CSE for every possible pair ofontologies. Second, we determine distance betweenthe ontologies by calculating EBD for each comparedpair. Finally, we use naive and BKM clustering to rankontologies. In order to rank ontologies, we need todetermine CSE of ontologies using Map-Reduce andcalculate EBD (Karlsruhe, UMBC), EBD (MIT, UMBC)and finally EBD (Karlsruhe, MIT). Below we presentthe common entities and EBD calculation for MIT andUMBC.(OMIT : Proceedings, OUMBC : Proceedings, 0.99),(OMIT : Proceedings, OUMBC : Inproceedings, 0.96),(OMIT : TechReport, OUMBC : TechReport, 0.99),(OMIT : MasterThesis, OUMBC : MastersThesis, 0.95)(OMIT : PhDThesis, OUMBC : PhDThesis, 0.94)(OMIT : Article, OUMBC : Article, 0.90)(OMIT : Incollection, OUMBC : Incollection, 0.90)(OMIT : Inbook, OUMBC : Inbook, 0.90),(OMIT : Inbook, OUMBC : Book, 0.90),(OMIT : Misc, OUMBC : Misc, 0.97),Using the above aligned entities, eight different
clusters are specified as types and finally EBD (MIT,UMBC) is calculated. Following the same procedurewe calculate similarity between other subgraphs. EBDvalues are as follows.
EBD (MIT, UMBC)=0.60, EBD (Karlsruhe, MIT)=0.66EBD (Karlsruhe, UMBC)=0.52
For ranking these three sample ontologies, averageEBD value for all of them is calculated. MIT= 0.63,
UMBC= 0.56 and Karlsruhe= 0.59. Thus, we givehigher authority scores to ontologies with higher EBDvalues, that is MIT is ranked as first, Karlsruhe assecond and UMBC as third ontology. The reason thatMIT has a higher EBD score is that the higher ratioof its entities are similar to other ontologies. In BKMClustering also C1 = {MIT}, C2 = {Karlsruhe, UMBC}are the clusters while Authority Score (C1) = 0.42 andAuthority Score (C2) = 0.38. Thus C1 has the largestauthority score and the first rank.In the next section, we concentrate on robust queryexpansion using ontology structure and rank.
Fig. 6. MIT Bibliography Ontology.
5 ROBUST QUERY EXPANSIONOur strategy toward determining robust query ex-pansion concerns producing a top-k candidate list asalternative terms to user query terms. To do this, weuse different factors that help to discriminate betweenterms in ontologies for the expansion purpose. Anyterm expanded within the same ontology is namedBasic Expansion Terms (BET). On the other hand, theterms that are expanded using inter-ontology match-ing are called Next Expansion Terms (NET). First wefocus on BET strategy. For this, we find the matchingentities to query terms within each ontology. Next,we determine the central keyword using BetweennessMeasure (BM). Finally, we expand those matchingterms using the concept of Semantic Similarity Mea-sure (SSM) and Density Measure (DM).
5.1 Basic Query Expansion Measures in Each In-dividual Ontology for BETConsidering lexical matches to the query keywords ineach ontology, now we present different measures forBET in each ontology as follows.
Density Measure (DM): This measurement ex-pands some details of each query keyword in anontology graph. That is, it evaluates properties andneighbors for each entity similar to the query key-word including the subclasses, superclasses, etc. It islimited to first relations [1] for all relations exceptfor subclasses. Suppose qj ∈ Q, e ∈ Oi, and e =NameMatch(qj) in Oi. BET includes all entities thathave a relation with e that is {e1, e2,. . . ,em}. DM(e) isthe Density Measure of entity e, which represents thenumber of possible expansions for e. Let RT = Set ofall relations (properties) for e.
DM(e)= Σ|RT |i=1 wi (6)
wi is the weight factor for different relation types. Weemphasize the most on subclass and equivalent class
7
with wi = 1, because a subclass is a specialization ofthe query keyword and an equivalent class presentsthe same classes. For the superclass relation, we usewi = 0.25 because it is a generalization of queryterms. For siblings of a query keyword, we choosethe average weight wi = 0.5 since they are in the samecategory as the query terms. For disjoint classes, weuse wi = 0 to exclude them from our expansion.
Betweenness Measure (BM) and Central Entity:This is the method that determines the centrality ofentities in a single ontology. It assigns the numberof shortest paths that pass through each node in thegraph when calculating expansion terms. The nodethat occurs on the most shortest paths for expandinguser terms is considered the central entity in eachontology [1]. Let ei, ej ∈ Ok, SP (ei, ej) = Shortest−Path−between (ei, ej) and SPT (ei, ej , e) = Shortest−Path−between
ei, ej passes-through e. BM(e) is the betweenness Measureof entity e.
BM(e)= Σ(ei ̸=ej ̸=e)|SPT (ei,ej ,e)||SP (ei,ej)| (7)
BM determines the central keyword that is used inSSM for finding BET. The central keyword has thehighest BM value among all keywords in the userquery.
Semantic Similarity Measurement (SSM): SSMuses an ontology graph as a semantic representationof a domain to determine weights for all expansionterms in every ontology. Entities that are closer tothe central keyword have more weight. SSM is cal-culated using the shortest-path measure. The morerelationships entities have in common, the closer theywill be in the ontology [1]. If any entity is positionedrelatively far from the central entity, then it is has asmaller weight. Therefore, we use the shortest pathmeasure as weights for the ontology vocabulary. Letentities ej , c ∈ Oi and len(SP (c, ej)) = length− Shortest−Path(c, ej).
SSM(c, ej) =
{ 1len(SP (c,ej))
c ̸= ej (8)
1 c = ej
}BET in this method, are all entities in the shortest-pathfrom the central keyword to ej .
Breath First Search (BFS) computes the fewestnumber of edges from any given entity to allreachable entities in an unweighted graph [5]. Thusfor BM and SSM calculations, we use an iterative BFSalgorithm to find the shortest paths from every entityto all the other entities in the ontologies. Path lengthsare calculated offline and once for each ontologyindependent of user query. Below is the detail of thealgorithm.Step 1: Given ontology Oi, the algorithm constructsan adjacency matrix for each entity ei ∈ Oi in theformat of < kin ≡ ei, vin ≡ ”NL,DFS, PFS,EC” > wherekin is the entity and Vin is built by the concatenationof NeighborsList(NL), Distance-From-Source(DFS), Path-From-Source(PFS) and EntityColor(EC) for eachentitiy. NeighborsList(NL) is a comma delimited of(edge, neighbor) that are connected to this entity. We use
DFS = 0 for the source entity and DFS = Int.Maxval
for other entities, because we are using BFS andupdate distances in different iterations of thealgorithm. Also, for the source entity PFS = ei
while PFS is empty for other entities. There arethree possible EntityColors(EC) values for each entity.Source entities are determined using Gray, whilevisited entities are defined by Black and unvisitedentities are defined by White. Considering theKarlsruhe ontology graph in Figure 2, suppose thatMasterThesis is the source entity in the graph; thussome sample keys and values are Masterthesis,”<(subClassOf, Thesis)|0|Masterthesis|Gray” >,< Author,”(range, Publication), (domain,AcademinStaff)|Int.Max| − |White” >,
< Report, ”(subClassOf, Publication)|Int.Max| − |White” >,< Thesis,”(subClassOf, Publication)|Int.Max| − |White” >
Step 2: In this step, mappers produce intermediatevalues for each source entity ei. For each sourceentity ei in the ontology graph with the Gray color,the mappers first change its color to Black. Then itcreates some new nodes based on the number ofneighbors with DFS = DFS + 1, PFS = ei
∪inkeynewnode
and Color=Gray. Since the mappers do not have theinformation about the next neighbors for new nodes,it considers the next neighbors as NULL. Also, itassumes PFS = ”− ” for non Gray nodes. Back to ourexample, below is the result after the first iteration: <
Masterthesis,”(subClassOf, Thesis)|0|Masterthesis|Black” >,< Thesis,”Null|1|Masterthesis − Thesis|Gray” >,<Author,”(range, Publication), (domain,AcademinStaff)
|Int.Max| − |White” >, <
Report,”(subClassOf, Publication)|Int.Max| − |White” >,< Thesis,”(subClassOf, Publication)|Int.Max| − |White” >.Step 3: In this step, the reducer use one eout and thelist of all intermediate values vint to calculate the finaleout. Each reducer takes all vint values of each key andconstructs a new node using the ”NonNull” list ofedges, the minimum DFS, ”NonNull” value for PFSand the darkest color. That is, for the above example< Thesis,”(subClassOf, Publication)|1|Masterthesis −Thesis|Gray” >.
BM and SSM Calculation using Map-ReduceComputation: Considering the above iterative Map-Reduce BFS algorithm, first we calculate BM foreach qi ∈ querykeywords using the frequency of qi inthe calculated shortest paths of the ontology. Themaximum value of BM measure determines thecentral entity qc among all querykeywords. Next, wedetermine the BM for all terms ∈ BET . As discussedin the Map-Reduce shortest path calculation, in eachiteration, intermediate value vint is updated and thePFS is determined. For the BM calculation of eachterms ∈ BET , we consider the last iteration result ofMap-Reduce shortest path algorithm, where no moreGray nodes exist. We consider all Black nodes’ PFSand calculate the frequency of each terms ∈ BET .
8
Using the central entity and DFS, we can easilycalculate the SSM for all terms ∈ BET . Back to ourbibliography example on the Karlsruhe and UMBContologies in section 3.1 and a query on Publicationand Academic Staff , first we find the lexical matches inboth ontologies. That is, {Publication, Academic Staff}in Karlsruhe ontology and the {Publication} in theUMBC ontology. Next, we find the central keyword ineach ontology. For this, we list all the entities of eachontology and calculate the number of times querykeywords are visited in the shortest path betweenpairs of entities. In both ontologies Publication is thecentral keyword because it has more relations withother entities in comparison to Academic Staff. Next,we complete the BET in each ontology using DM andSSM. In the Karlsruhe ontology BET={Technicalreport,Proceedings, Report, Inbook, Projectreport, Thesis,InCollection, PhdThesis, Associateprofessor, Lecturer,Booklet, Misc, Book, MasterThesis, Facultymember,Inproceedings, Manual, Article, Unpublished, Manager,Technicalstaff, Fullprofessor, Assistantprofessor,Employee, Academicstaff}, while in the UMBCBET={Mastersthesis, Techreport, Inproceedings, Inbook,MasterThesis, TechnicalReport, Misc, Person, Article,Incollection, Book, Phdthesis}. Further, we determinedifferent measures for each term t∈BET. For example,in Karlsruhe ontology, BM(Report)=2 because it is onthe shortest path from Technical Report and ProjectReport to Publication. SSM(Report)=1 because themimimum path from Report to Publication has thelength 1. DM(Report)= 2.25, because it has 2 subclassand 1 superclass.Considering the BET in each ontology, now we focuson NET strategy using an inter-ontology approach.For this, we align BET to semantically similar entitiesin other ontologies using the CSE algorithm. Thisenables us to find all appropriate expansion terms inrelevant ontologies. This operation continues betweenall possible pairs of ontologies.5.2 Query Expansion using Ontology Alignmentfor NETIn this section, we determine NET using the CSE algo-rithm explained in section 4.1.1. CSE aligns ontologiesusing the name and structural similarity of entities.Each entity ei ∈ O1 is compared with all other entitiesof the other ontology (O2) and the similar pairs aredetermined. Similar pairs of entities along with theirconfidence measure (ACM) are used to specify theNET between each pair of ontologies.
As explained in section 4.1, Karlsruhe-BET includesTechnicalReport, while UMBC BET includes TechRe-port. The CSE algorithm aligned {TechnicalReport} to{TechReport} with a confidence value of 0.92. Thus,NETUMBC = {TechnicalReport,MasterThesis}.After computing the NET for each pair of ontologies,we need to compute weights for them. Two possiblecases exist for calculating the NET weight. First, theNET of the source ontology is not included in the BET
of destination ontology. We solely rely on alignmentconfidence and the weight of the term in the sourceontology to calculate the NET weight. The reason isthat, either the destination ontology does not haveany match for the query terms or the NET term isnot included in DM or SSM of the query keywordsin the destination ontology. So we use the alignmentconfidence to calculate its weight. Second, the NETalready exists in BET of destination ontology; we relyon the semantic structure of the destination ontologyand use DM, SSM, BM and WSP to weight it. Relatedformulas are presented in Section 5.4.
5.3 Weighting the Semantic Path (WSP)We determine the weight of the semantic path forall terms ∈ BET
∪NET using the amount of infor-
mation contained in the properties of the path andthe characterizability of properties between entitiesincluding classes and object/data properties. We useinformation theory to measure the information con-tent of each property in the semantic path. Contentof a property is computed based on the occurrenceprobability of the property in the adjacency matrixof the ontology graph [2]. For a semantic path com-putation from the central entity c to an expandedterm ei ∈ BET
∪NET , weight of the path (c, ei)
is calculated based on the weight of the sequenceof properties from c to ei. In our work, for everyproperty p(a,b), a is an entity (subject) and b is eitheran object/data property in an ontology graph. Thusthe content of property p(a,b), is computed as
I(p(a, b)) = − log2 Pr(p(a, b)) (9)where Pr(p(a,b)) is the probability that a is the source(subject) of property p(a,b) in an ontology graph. Inthe adjacency matrix format of the ontology as definedin step 1 in section 5.1, for any subject a we can easilyfind the frequency of corresponding property p(a,b)by looking up the neighbors list NL of entry a. If aoccurs rarely as the subject in the RDF graph, it hasmore information.
Characterizability between entities (subject-object)of a property p(a,b) in an ontology graph is measuredby mutual information. Mutual information, MI, rep-resents the amount of information that a propertysubject has about the property object.
MI(p(a,b))= Pr(p(a, b)) ∗ log2Pr(p(a,b))Pr(a)Pr(b)
(10)
where Pr(a) is the probability that a is the subjectfor the property p in the graph and Pr(b) is the proba-bility that b is the object for the property p. Pr(p(a, b))is the probability that property p has a as its subjectand b as its object at the same time. In the adjacencymatrix implementation of the ontology, Pr(a) andPr(p(a, b)) are calculated by looking at a’s entry inthe matrix and checking the properties (edges) andneighbors in the NL list. For Pr(b) calculation, weneed to check the NL list of all entries and find thefrequency of having (p, b) in NL.
Using the above Equations, we compute the weightof property p(a,b) as follows.
9
W(p(a,b) )= α ∗ I(p(a, b)) + β ∗MI(p(a, b)) 0 < α, β < 1 andα+ β = 1 (11)
Therefore for a path in the graph from a centralentity (c) to expansion terms ei, the weight of semanticpath is as follows:
WSP(c, ei)=[∏
p(a,b)∈sp(c,ei)W (p(a, b))] ∗ δ(lenghtpath(sp(c,ei))−1) (12)
where lengthpath(sp(c, ei)) indicates the number ofproperties in the semantic path sp(c, ei) and δ is anattenuation parameter 0 < δ < 1. As the length of thesemantic path gets longer, the semantic relevance ofterms decreases.For example, in Karlsruhe bibliography ontology,
WSP(Technical Report,Publication)=W(p(Technical Report,Report))*W(p(Report,Publication))*δ(2−1)
Then, we need to calculate weight of each singlelenght path as follows:
W(p(Technical Report, Report))= α ∗ I(p(a, b)) + β ∗MI(p(a, b))
where p(a, b) = subclass, a = TechnicalReport and b =Report.In Karlsruhe example, there are 19 subclass relationsand 1 domain and 1 range relations. Thus I(p(a, b)) =0.043 and MI(p(a, b)) = 2.080. Using α = β = δ = 0.5, wehave
W(p(Technical Report, Report))= 1.061W(p(Report, Publication))= 0.82
Thus, WSP(Technical Report, Publication)= 0.435
5.4 Combining Different Weighting MethodsConsidering different weighting criteria for candidateterms including the SSM, BM, DM, WSP and ACMwe are able to determine the overall weight for eachterm as follows.If ei ∈ BET on an ontology i
W (ei) =[α ∗ SSM(ei, ci) + β ∗BM(ei) + γ ∗DM(ei) + δ ∗WSP (ei, ci)]
(13)SSM presents the semantic similarity between the
central keyword and expansion term, BM representsthe betweenness of expansion term and WSP showsthe weight of semantic path between central and ex-pansion terms. α, β, γ, δ are coefficients to put weightson some of the weighting methods, 0 < α, β, γ, δ < 1and α+ β + γ + δ = 1.If ej ∈ NET on an ontology j
W (ej) =
α ∗ SSM(ej , cj) + β ∗BM(ej)+ ej ∈ BETj
γ ∗DM(ej) + δ ∗WSP (ej , cj)
ACMj ∗W (ei) ej ̸∈ BETj
(14)
where ACMj represents the alignment confidence
measure of ej related to ei from ontology i.If ej ∈ BETj , ej is included in DM or SSM of
the query keyword in Oj . Thus, W (ej) is calculatedby SSM, DM, BM and WSP metrics. If ej ̸∈ BETj ,either Oj does not include any matches for querykeywords or ej is not involved in DM or SSM of querykeywords. Thus, it is not semantically relevant to thequery keyword in the structure of Oj . So we use theontology Oi and rely on NET alignment confidencefor its weight calculation.In the next section we explain the dynamic thresh-old calculation to determine the k-top most releventexpansion terms, namely the robust expansion terms.
5.5 Robust Expansion Terms using Dynamic In-terval (DI)Determining the optimal number of expansion termsis one of the fundamental questions in query expan-sion. In this section, we explain the heuristic met-ric that we use to calculate the Robust ExpansionTerms (RET). We determine the Dynamic Interval(DI) based on the Rank of Ontologies (RO). GivenS ={O1, O2, . . . , On}, a set of ontoloiges and theircorresponding rank, for each ontology we determineDI such that we have more expansion terms from theontologies with higher rank. That is, for the ontologywith the highest rank (i.e. Oi), we use a predeterminedInterval DI = 1. Further for other ontologies (i.e.Oj), we calculate the ratio between the highest rankand rank of other ontologies to calculate the DynamicInterval as follows.
DIj = DIi ∗ROj
ROi(15)
thresholdj = ⌈DIj * |BETj
∪NETj |⌉ (16)
Where |BETj
∪NETj | presents the number of expan-
sion terms ∈ BETj
∪NETj .
Suppose thresholdj = k for Oj . We calculate RET asRET = ΣjRETj (17)
RETj ={tj |Weight(tj) ∈ k-top-weights } (18)
For each ontology, we find the ratio of current ontol-ogy rank over highest rank and dynamically calculateintervals (DIj). Next, we find k-top rank terms basedon the term weights. Intuitively, we accept all theexpansion terms from the ontology with the highestrank (Oi) but discard the lowest weight candidatesfrom other ontologies (Oj) based on the ratio betweenthe value of the highest rank and the current ontologyrank (ROj
ROi). The number of RET depends on the query
keywords and the structure of the ontology. The moreuser keywords have density and semantic relations,the more we get expansion terms. That is, if thereare more relations or semantic paths between userkeywords, we get more expansion terms out of themin each ontology.
6 EXPERIMENTS
In this section, we present the result of our experi-ments on benchmark ontologies of I3CON [10] andOAEI [11]. We run our experiments on ontologies ofdifferent domains. In each domain, we classify ourexperiments into two sections. First, we rank ontolo-gies in each domain. Second, we expand queries oneach domain and show the effectiveness of our queryexpansion method. For the ontology ranking part,first we extract the RDF graph of ontologies by theJena API. Second, we use Map-Reduce CSE algorithmto find the common entities between each pair ofontologies and calculate EBD measurements betweenall pairs of ontologies in the same domain. Third, wedetermine authority scores for each ontology usingnaive and BKMC algorithms. For Map-Reduce exper-iments we used 7 nodes Hadoop cluster with theHadoop version 0.20.2. Each node is a Pentium IV 2.80GHz processor and 4 GB of main memory. For thequery expansion part, we determine correspondingterms ∈ BET
∪NET for different user queries and
10
calculate weights for terms. Based on the calculatedweights, we determine RET with DI values. Then, weuse the Blackbook environment to check the efficiencyof our weighting mechanism. Blackbook is a graphanalytic platform for semantic web data. It providesthe facility of retrieving data from different ontologies(RDB/SDB data stores) in a federated architecture[7]. Blackbook federates the keywords of the queryacross all the data sources and retrieve all the rele-vant instances (ontology individuals) in different datasources. It searches for keywords using the LuceneIndex algorithm.6.1 DatasetsWe test our ranking and expansion mechanism infour domains from OAEI and I3CON benchmarksincluding Bibliography, Russia, Food and Biomedicaldomains. There are 4 ontologies in the Bibliographydomain, 6 ontologies in the Russia domain, 2 on-tologies in the Food domain and 2 ontologies in thebiomedical domain. For ontology ranking purposes,we create 4 new ontologies in the Russia domainincluding Russia A10, Russia A50, Russia A70 andRussia A85 with respectively 10%, 50%, 70% and 85%difference from the original Russia A by removingand editing some entities. Also, we create one newsynthetic Food ontology by removing and editing 10%of the entities from the original Food ontology calledFood10% in the Food domain. For query expansionpurposes, we use non-synthetic and synthetic ontolo-gies in the Bibliography, Russia, and Food domains.We have added an average of 20 instances to each do-main. Different metrics of ontologies in each domainare presented in Table 1.
TABLE 1Average Metrics of Ontologies in Different Domains.
Ontology Class Object Data IndividualsProperties Properties
Russia Domain 109 45 14 121Bibliography Domain 32 30 19 1
Food Domain 140 16 1 218Biology Domain 6584 46 0 4010
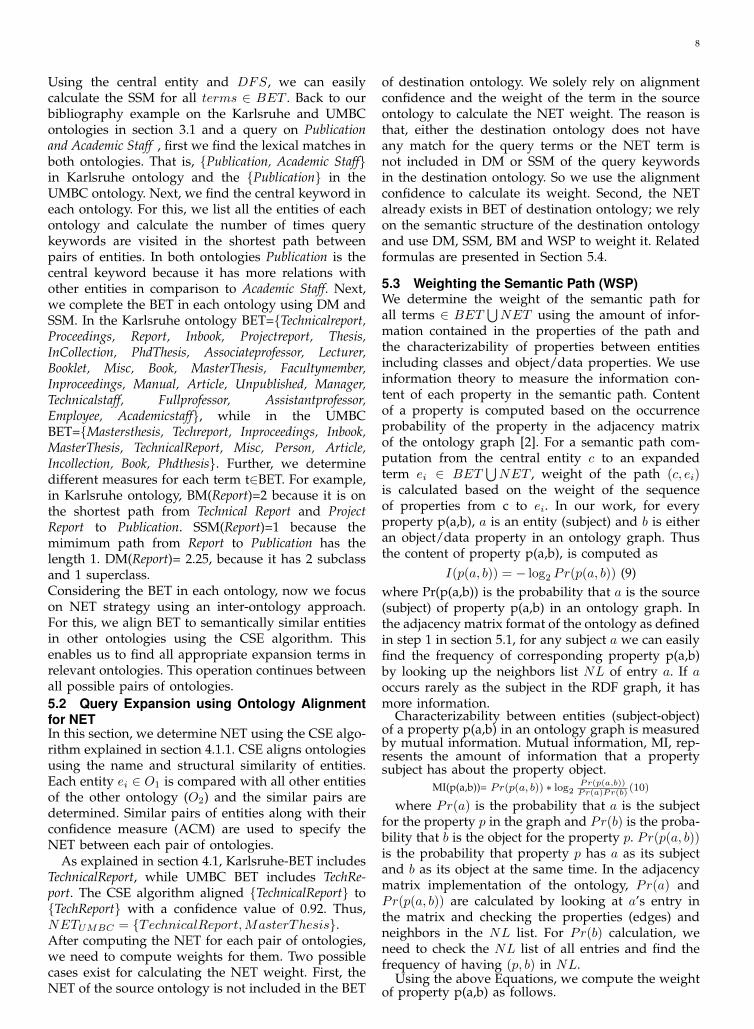
6.2 ResultsOur experiments are categorized as Ontology Rank-ing and Query Expansion phases. In the OntologyRanking phase, we find the Map-Reduce CSE betweenontologies and rank them. In the Query Expansionphase, we expand queries in each domain separatelyusing ontology structure and rank. Finally, we analyzethe improvement of query expansion in each domain.6.2.1 Rank of Different OntologiesWe ranked ontologies in the Russia domain fromI3CON benchmark as well as ontologies in the Bibli-ography and the Food domains from the OAEI bench-mark using the EBD ranking method [1]. First, weshow the correctness of EBD rank values on our syn-thetic ontologies by comparing our result with AktiveRanking method in Table 2(a). In this Table, the secondand third columns show EBD between Russia A with
their corresponding synthetic ontologies. The firstvalue denotes our method’s EBD value and the secondvalue denotes the AktiveRank value. For example,the EBD value between Russia A and Russia A50is 0.63, while AktiveRank value is 60.07 respectively.As it is presented in Table 2(a), both Aktive Rankand EBD Rank have compatible ranking results forthe synthetic Russia ontologies. For the AktiveRank
(a) EBD vs. Aktive RankEBD \ Russia AAktive
RussiaA10 0.79\ 96.02RussiaA50 0.63\ 60.07RussiaA70 0.69\ 24.78RussiaA85 0.13\ 21.43
(b) Russia Naive vs. BKMCRank Naive BKMC
Russia A 0.73 0.72Russia 1 0.7 0.72
Russia D 0.71 0.71Russia B 0.71 0.71Russia C 0.66 0.66Russia 2 0.49 0.49
(c) Food Naive vs. BKMCRank Naive\BKMCFood 0.94\0.94Wine 0.92\0.6
Food10 0.90\0.6
(d) Bibliography Naive vs. BKMCRank Naive BKMC
INRIA 0.52 0.52UMBC 0.414 0.413
MIT 0.412 0.413Karlsruhe 0.38 0.38
TABLE 2Rank of Ontologies in Different Domains
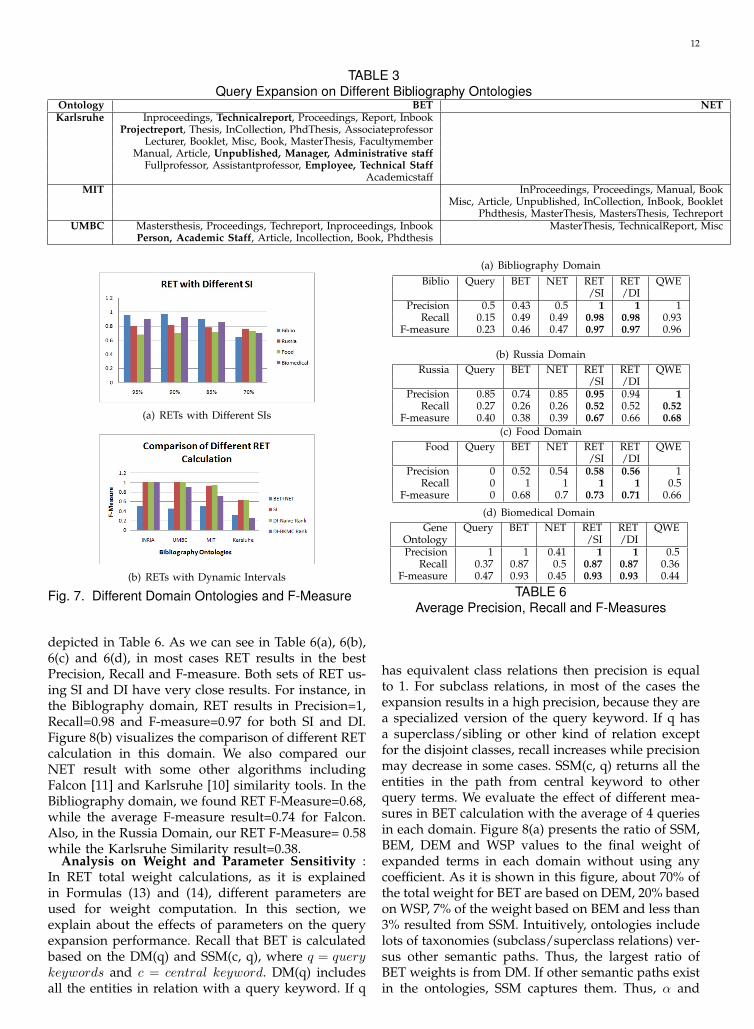
calculation, we use all entities of the original ontologyas keywords for ranking purposes, since AktiveRankrelies only on a list of keywords to rank ontologies. InTable 2(b), we present the rank of the non-syntheticRussia Ontologies in EBD naive and EBD BKMC.EBD BKMC finds five different clusters for Russiadomain including C1 = {Russia1, RussiaA}, C2 ={RussiaC}, C3 = {RussiaD}, C4 = {RussiaB} andC5 = {Russia2}. Also, Tables 2(c) and 2(d) presentthe EBD rank of the Bibliography and Food ontolo-gies. In the Bibliography domain, three clusters ex-ist including C1={UMBC,MIT}, C2={IRNIA} andC3={Karlsruhe}. In the Food Domain, two clustersexist including C1={Food} and C2={Wine, Food10}.Our experiments show that EBD Naive and BKMCranks are exactly compatible. For instance in theBibliography domain, the first ranked ontology isINRIA, Second ranked is UMBC, third ranked isMIT and fourth ranked is Karlsruhe in both EBDNaive and BKMC methods.6.2.2 Query Expansion on Different OntologiesWe expand several user queries on differentontologies of each domain from both I3CONand OAEI benchmarks. For this, first we expandqueries using BET and NET for each query. In BETcalculations, we calculate DM, SSM, BM and WSP.Next, we calculate RET by a heuristic metric basedon the rank of the original ontologies. Finally, weanalyze the effectiveness of our query expansionand dynamic threshold by presenting experimentalresults.Considering the query keywords={Academic Staff,Publication} from section 3, we present BET and NETin Table 3. Based on the structure of each ontologyand query keywords, different query expansions may
11
occur. In our example, three different cases exist forthis query.Case I: query is expanded by BET (i.e. in KarlsruheOntology, first row of table).Case II: query is expanded by NET (i.e. in MITOntology, second row of table).Case III: query is expanded by both NET and BET(i.e. in UMBC Ontology, third row of table).For each ontology, first we apply the RET calculationto all terms∈ BET
∪NET . Next, we find the union
of all expanded terms from different ontologies.Considering the terms∈ BET
∪NET , we use
the rank of ontologies as a heuristic metric tocalculate Dynamic Interval (DI) and find the setof highly weighted terms in each ontology. Inour previous work [8], we calculated the RETwithout using any heuristic. We use different SIvalues and the maximum weight of expansion termfor RET calculation. In different ontologies anddomains, we may have different optimal valuesfor SI. Therefore here for each query we calculatedynamic intervals and find the k-top highest rankedexpansion terms. For example, in the Bibliographydomain using different SI, we found SI=90% as anoptimal value for RET calculation, that eliminatesthe unrelated term (smallest weight) {Person} fromUMBC and {Manager, TechnicalStaff,Employee}from Karlsruhe-BET. While in our new work,we have a dynamic query threshold basedon the rank of the original ontology. That is,for UMBC Dynamic Interval DI=0.79 and forKarlsruhe DI=0.73. In our new heuristic method, weeliminate {Person,AcademicStaff} from UMBC and{Manager, TechnicalStaff,Employee, Unpublished, Project
Report, AdministrativeStaff, TechnicalReport} fromKarlsruhe-BET. While we calculate RET fordiffernt queries, some related expansion termsmay be eliminated in our RET calculation like inKarlsruheBET . But finding RET from differentdata sources finally results in only adding relatedterms to our final RET set from some other datasources (ontologies). This helps to improve theprecision calculation, when we are using the DIheuristic. For instance, in the above example,{TechnicalReport, Unpublished} are related termsand will be added to RET set later by UMBCNET
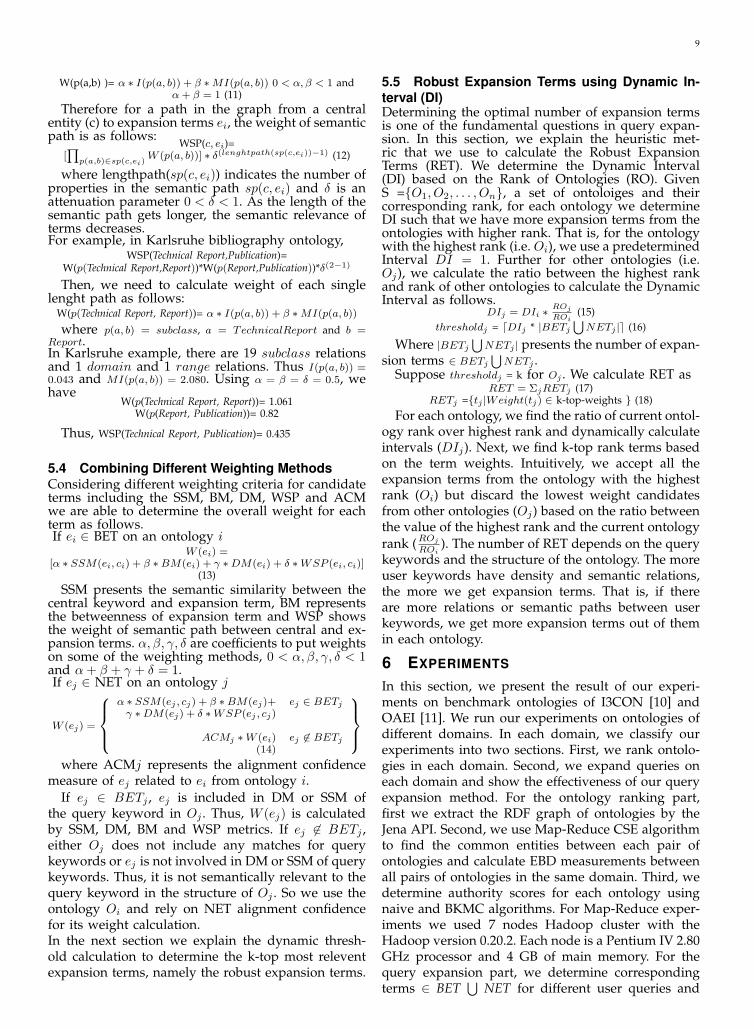
and MITNET calculations.Table 4(a) presents details of the dynamic query
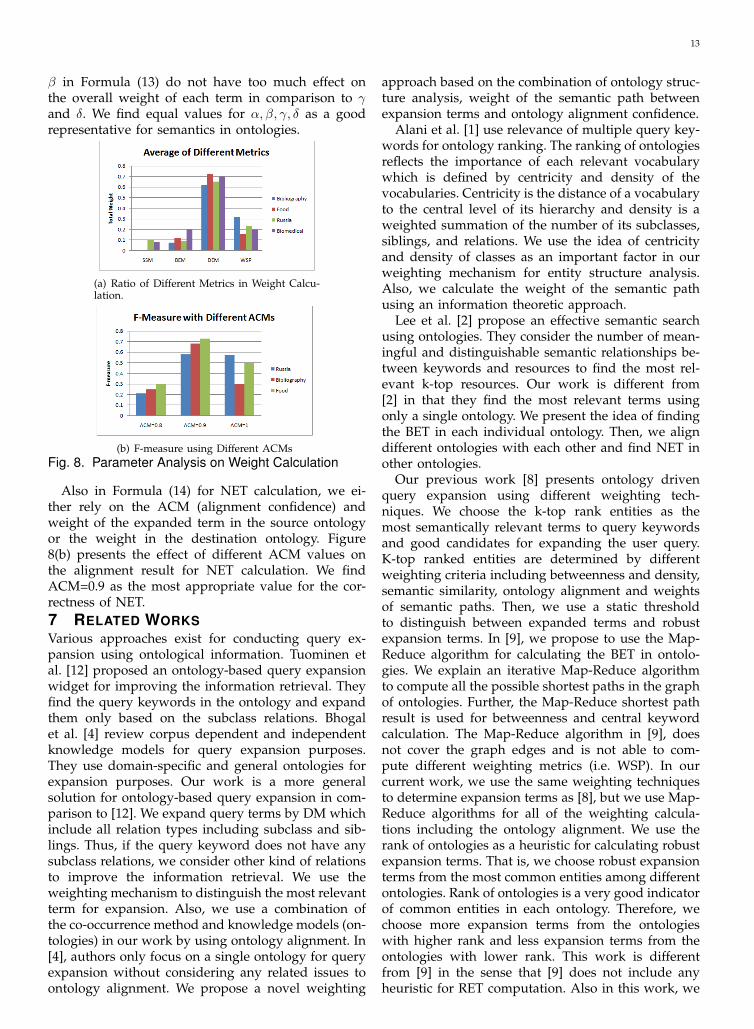
threshold calculation using Ontology Naive Ranks,while Table 4(b) presents details of the dynamic querythreshold calculation using BKMC Ranks in the Bib-liography domain. Results of using different DIs vs.SI are depicted in Figure 7(b). As we can see, DI-Naive and DI-BKMC ranks have very good resultsin comparison to SI. Intuitively, when we use BKMClustering to rank ontologies, we ignore the realdistance between ontologies, since it is not desirablefor dynamic interval calculation. Therefore, in our
further examples, we use naive ranks to calculatequery thresholds. We compare our method with(a) Naive Rank
Ontology Naive DI |BET∪
NET| QueryRank Threshold
INRIA 0.414 0.79 21 17UMBC 0.412 0.79 14 12
MIT 0.52 1 16 16Karlsruhe 0.38 0.73 27 20
(b) BKMC RankOntology BKMC DI |BET
∪NET| Query
Rank ThresholdINRIA 0.52 1 21 21UMBC 0.413 0.79 14 12
MIT 0.413 0.79 16 12Karlsruhe 0.34 0.65 27 18
TABLE 4Threshold for different Bibliographic Ontologies (OAEI)an Ontology-based Query Expansion Widget(QEW )as the baseline [12]. QEW expands queries using thesubclasses for keywords. For the Publication and Aca-demic Staff query, in UMBC the QEWUMBC={Article,Book,InBook, Incollection, InProceedings, Masterthesis, PhdThsis , Pro-ceedings, Techreport}. For Karlsruhe and MIT, it results
TABLE 5Russia A Synthetic Ontologies F-measure
Ontology A A10 A50 A70 A90Precision 0.59 0.58 0.67 0.75 0.67
Recall 0.7 0.7 0.5 0.6 0.54F-measure 0.64 0.63 0.57 0.66 0.6
in QEWKarlsruhe={Article, Book, Booklet,Inbook, InCollection,Inproceedings,Manual, Misc, Proceedings, Report, ProjectReport,Thesis, TechnicalReport, Masterthesis, PhDThesis, Unpublished}QEWMIT ={}. The QEW is exactly compatible to ourRET calculation in this example, except that they donot consider NET at all. In general, for comparing RETand QEW: following cases may occur.1- if the query keyword is a leaf in the ontologystructure with no children, QEW does not help forexpansion at all.2- if the query keyword has some children but nosiblings/parent, RET and QEW will be the same.3- if the query keyword is a node with a parent,siblings and children based on the number of relevantinstances and semantics between the siblings (i.e.disjoint), RET may improve precision and recall morethan QEW.We run user Query and ExpandedTerms in Blackbookfor both non-synthetic and synthetic ontologies indifferent domains. For non-synthetic (original) ontolo-gies, we analyze Precision, Recall and F-measure foruser Query, RET and QEW , while we analyze userQuery and BET for synthetic ontologies. Blackbookreturns all the individuals related to query keywordsin different ontologies. Each individual indicates acorresponding URI reference and presents the relatedWeb document to query keywords. For syntheticontologies, Table 5 presents the Precision, Recall andF-measure of Russia A synthetic ontologies. For non-synthetic ontologies, we calculate Precision, Recalland F-measure for all the retrieved individuals as
12
TABLE 3Query Expansion on Different Bibliography Ontologies
Ontology BET NETKarlsruhe Inproceedings, Technicalreport, Proceedings, Report, Inbook
Projectreport, Thesis, InCollection, PhdThesis, AssociateprofessorLecturer, Booklet, Misc, Book, MasterThesis, Facultymember
Manual, Article, Unpublished, Manager, Administrative staffFullprofessor, Assistantprofessor, Employee, Technical Staff
AcademicstaffMIT InProceedings, Proceedings, Manual, Book
Misc, Article, Unpublished, InCollection, InBook, BookletPhdthesis, MasterThesis, MastersThesis, Techreport
UMBC Mastersthesis, Proceedings, Techreport, Inproceedings, Inbook MasterThesis, TechnicalReport, MiscPerson, Academic Staff, Article, Incollection, Book, Phdthesis
(a) RETs with Different SIs
(b) RETs with Dynamic Intervals
Fig. 7. Different Domain Ontologies and F-Measure
depicted in Table 6. As we can see in Table 6(a), 6(b),6(c) and 6(d), in most cases RET results in the bestPrecision, Recall and F-measure. Both sets of RET us-ing SI and DI have very close results. For instance, inthe Biblography domain, RET results in Precision=1,Recall=0.98 and F-measure=0.97 for both SI and DI.Figure 8(b) visualizes the comparison of different RETcalculation in this domain. We also compared ourNET result with some other algorithms includingFalcon [11] and Karlsruhe [10] similarity tools. In theBibliography domain, we found RET F-Measure=0.68,while the average F-measure result=0.74 for Falcon.Also, in the Russia Domain, our RET F-Measure= 0.58while the Karlsruhe Similarity result=0.38.
Analysis on Weight and Parameter Sensitivity :In RET total weight calculations, as it is explainedin Formulas (13) and (14), different parameters areused for weight computation. In this section, weexplain about the effects of parameters on the queryexpansion performance. Recall that BET is calculatedbased on the DM(q) and SSM(c, q), where q = querykeywords and c = central keyword. DM(q) includesall the entities in relation with a query keyword. If q
(a) Bibliography DomainBiblio Query BET NET RET RET QWE
/SI /DIPrecision 0.5 0.43 0.5 1 1 1
Recall 0.15 0.49 0.49 0.98 0.98 0.93F-measure 0.23 0.46 0.47 0.97 0.97 0.96
(b) Russia DomainRussia Query BET NET RET RET QWE
/SI /DIPrecision 0.85 0.74 0.85 0.95 0.94 1
Recall 0.27 0.26 0.26 0.52 0.52 0.52F-measure 0.40 0.38 0.39 0.67 0.66 0.68
(c) Food DomainFood Query BET NET RET RET QWE
/SI /DIPrecision 0 0.52 0.54 0.58 0.56 1
Recall 0 1 1 1 1 0.5F-measure 0 0.68 0.7 0.73 0.71 0.66
(d) Biomedical DomainGene Query BET NET RET RET QWE
Ontology /SI /DIPrecision 1 1 0.41 1 1 0.5
Recall 0.37 0.87 0.5 0.87 0.87 0.36F-measure 0.47 0.93 0.45 0.93 0.93 0.44
TABLE 6Average Precision, Recall and F-Measures
has equivalent class relations then precision is equalto 1. For subclass relations, in most of the cases theexpansion results in a high precision, because they area specialized version of the query keyword. If q hasa superclass/sibling or other kind of relation exceptfor the disjoint classes, recall increases while precisionmay decrease in some cases. SSM(c, q) returns all theentities in the path from central keyword to otherquery terms. We evaluate the effect of different mea-sures in BET calculation with the average of 4 queriesin each domain. Figure 8(a) presents the ratio of SSM,BEM, DEM and WSP values to the final weight ofexpanded terms in each domain without using anycoefficient. As it is shown in this figure, about 70% ofthe total weight for BET are based on DEM, 20% basedon WSP, 7% of the weight based on BEM and less than3% resulted from SSM. Intuitively, ontologies includelots of taxonomies (subclass/superclass relations) ver-sus other semantic paths. Thus, the largest ratio ofBET weights is from DM. If other semantic paths existin the ontologies, SSM captures them. Thus, α and
13
β in Formula (13) do not have too much effect onthe overall weight of each term in comparison to γand δ. We find equal values for α, β, γ, δ as a goodrepresentative for semantics in ontologies.
(a) Ratio of Different Metrics in Weight Calcu-lation.
(b) F-measure using Different ACMsFig. 8. Parameter Analysis on Weight Calculation
Also in Formula (14) for NET calculation, we ei-ther rely on the ACM (alignment confidence) andweight of the expanded term in the source ontologyor the weight in the destination ontology. Figure8(b) presents the effect of different ACM values onthe alignment result for NET calculation. We findACM=0.9 as the most appropriate value for the cor-rectness of NET.7 RELATED WORKSVarious approaches exist for conducting query ex-pansion using ontological information. Tuominen etal. [12] proposed an ontology-based query expansionwidget for improving the information retrieval. Theyfind the query keywords in the ontology and expandthem only based on the subclass relations. Bhogalet al. [4] review corpus dependent and independentknowledge models for query expansion purposes.They use domain-specific and general ontologies forexpansion purposes. Our work is a more generalsolution for ontology-based query expansion in com-parison to [12]. We expand query terms by DM whichinclude all relation types including subclass and sib-lings. Thus, if the query keyword does not have anysubclass relations, we consider other kind of relationsto improve the information retrieval. We use theweighting mechanism to distinguish the most relevantterm for expansion. Also, we use a combination ofthe co-occurrence method and knowledge models (on-tologies) in our work by using ontology alignment. In[4], authors only focus on a single ontology for queryexpansion without considering any related issues toontology alignment. We propose a novel weighting
approach based on the combination of ontology struc-ture analysis, weight of the semantic path betweenexpansion terms and ontology alignment confidence.
Alani et al. [1] use relevance of multiple query key-words for ontology ranking. The ranking of ontologiesreflects the importance of each relevant vocabularywhich is defined by centricity and density of thevocabularies. Centricity is the distance of a vocabularyto the central level of its hierarchy and density is aweighted summation of the number of its subclasses,siblings, and relations. We use the idea of centricityand density of classes as an important factor in ourweighting mechanism for entity structure analysis.Also, we calculate the weight of the semantic pathusing an information theoretic approach.
Lee et al. [2] propose an effective semantic searchusing ontologies. They consider the number of mean-ingful and distinguishable semantic relationships be-tween keywords and resources to find the most rel-evant k-top resources. Our work is different from[2] in that they find the most relevant terms usingonly a single ontology. We present the idea of findingthe BET in each individual ontology. Then, we aligndifferent ontologies with each other and find NET inother ontologies.
Our previous work [8] presents ontology drivenquery expansion using different weighting tech-niques. We choose the k-top rank entities as themost semantically relevant terms to query keywordsand good candidates for expanding the user query.K-top ranked entities are determined by differentweighting criteria including betweenness and density,semantic similarity, ontology alignment and weightsof semantic paths. Then, we use a static thresholdto distinguish between expanded terms and robustexpansion terms. In [9], we propose to use the Map-Reduce algorithm for calculating the BET in ontolo-gies. We explain an iterative Map-Reduce algorithmto compute all the possible shortest paths in the graphof ontologies. Further, the Map-Reduce shortest pathresult is used for betweenness and central keywordcalculation. The Map-Reduce algorithm in [9], doesnot cover the graph edges and is not able to com-pute different weighting metrics (i.e. WSP). In ourcurrent work, we use the same weighting techniquesto determine expansion terms as [8], but we use Map-Reduce algorithms for all of the weighting calcula-tions including the ontology alignment. We use therank of ontologies as a heuristic for calculating robustexpansion terms. That is, we choose robust expansionterms from the most common entities among differentontologies. Rank of ontologies is a very good indicatorof common entities in each ontology. Therefore, wechoose more expansion terms from the ontologieswith higher rank and less expansion terms from theontologies with lower rank. This work is differentfrom [9] in the sense that [9] does not include anyheuristic for RET computation. Also in this work, we
14
use Map-Reduce algorithm in all steps of our compu-tation including BET, NET and weight calculation. Forinstance, in BET calculation we changed the structureof adjacency matrix so that it contains the edge ofeach neighbor. This enables us to compute WSP usingthe Map-Reduce results. Also, we explain a Map-Reduce algorithm for NET calculation. The previousversion of the CSE algorithm cannot be used for verylarge ontologies, while the new Map-Reduce versionis scalable and efficient for large ontologies.
8 CONCLUSIONSIn this paper, we have outlined a novel approachfor query expansion in a federated architecture. Thisis acheived in two phases. In phase I, we rank on-toliges using a Map-Reduce algorithm that finds theCommon Subset of Entities(CSE) on the graph ofontologies using the name and structural similarityof entities. Then, we define an EBD metric to find thedistance between ontologies. EBD values enable us torank ontologies. In phase II, we expand queries ineach ontology using a Map-Reduce algorithm basedon the structure of ontologies. Further, we expandqueries using the CSE algorithm between ontologies.All expansion terms are weighted using the weightsof semantic path, betweenness and the structure ofclasses in ontologies. Finally, we find robust expansionterms using heuristics. Ontology ranks are used tofind the dynamic threshold for robust query expan-sion. Our experiments show significant improvementof information retrieval for the expanded query versusthe original query.
9 ACKNOWLEDGEMENTThis material is based upon work supported by theAir Force Office of Scientific Research under awardnumber FA9550-08-1-0260. We thank Dr. Herklotz(AFOSR) for his support.
REFERENCES[1] Alani, H., Brewster, C.: ”Ontology ranking based on the analysis
of concept structures,” In Proceedings of Third International Con-ference on Knowledge Capture (K-Cap),pp. 51-58. Alberta, Canada.(2005).
[2] Lee, J., Min, J., Chung, C.: ”An Effective Semantic Search Tech-nique using Ontology,”In Proceedings of the 18th internationalconference on World Wide Web, pp. 1057-1058. Madrid, Spain(2009).
[3] Perez-Aguera, J. R., Araujo, L.: ”Comparing and CombiningMethods for Automatic Query Expansion,”In Proceedings ofAdvances in Natural Language Processing and Applications Researchin Computing Science 33,pp. 177-188. (2008).
[4] Bhogal, J., Macfarlane A., Smith P.: ”A review of ontologybased query expansion,”Information Processing and Management43, pp.866–886. (2007).
[5] Cormen, T., Leiserson, C. E., Rivest, R., Stein, C.: ”Introductionto Algorithms”, MIT Press 2001.
[6] Collehn, W.W., Ravikumar, P., Fienberg, S. E.: ”A Compari-son of String Distance Metrics for Name-Matching Tasks,”InProceedings of the IJCAI-2003 Workshop on Information, AmericanAssociation of Artificial Intelligence (2003).
[7] Blackbook, a graph analytic platform for semantic webdata, {http://ebiquity.umbc.edu/blogger/2009/10/03/blackbook-a-graph-analytic-platform-for-semantic-web-data/}
[8] Alipanah, N., Parveen, P., Khan, L., Thuraisingham, B.:”Ontology-driven Query Expansion Methods to Facilitate Fed-erated Queries,”2010 IEEE International Conference on ServiceOriented Computing and Applications (SOCA10), Perth, Australia(2010).
[9] Alipanah N., Parveen P., Khan L., Thuraisingham B.,”Ontology-Driven Query Expansion Using Map/ReduceFramework to Facilitate Federated Queries.”, IEEE InternationalConference on Web Services (ICWS), Washington DC 2011.
[10] Information Interpretation and Integration Conference, {http://www.atl.lmco.com/projects/ontology/i3con.html}
[11] Ontology Alignment Evaluation Initiative, {http://oaei.ontologymatching.org/2010/}
[12] Tuominen,J., Kauppinen,T., Viljanen, K., Hyvonen, E.:”Ontology-Based Query Expansion Widget for InformationRetrieval”, Proceedings of the 5th Workshop on Scripting andDevelopment for the Semantic Web (SFSW 2009), 6th EuropeanSemantic Web Conference Heraklion, Greece, (2009).
[13] Partyka, J., Alipanah, N., Khan,L., Thuraisingham, B., Shekhar,S.: ”Content-based ontology matching for GIS datasets”,16thACM SIGSPATIAL International Conference on Advances in Ge-ographic Information Systems (GIS 2008) pp.51
[14] Le, B.T., Dieng-Kuntz, Gandon, R.F.: ”On Ontology MatchingProblems - for Building a Corporate Semantic Web in a Multi-Communities Organization,” ICEIS (4), pp. 236-243. (2004).
[15] Qu, Y., Hu, W., Cheng, G.: ”Constructing Virtual Documentfor Ontology Matching,” In Proceeding. of the 15th Int. Conf. onWorld Wide Web, pp. 23-31., Scotland, UK. (2006).
[16] Collehn, W.W., Ravikumar, P., Fienberg, S. E.: ”A Comparisonof String Distance Metrics for Name-Matching Tasks,” AmericanAssociation of Artificial Intelligence (2003).
[17] Hoshiai, T., Yamane, Y., Nakamura, D., Tsuda, H.: ”A Seman-tic Category Matching Approach to Ontology Alignment,”InProceedings of the 3rd International Workshop on Evaluation ofOntology Based Tools (EON 2004). CEUR- WS Publication, pp.437-447.(2004).
[18] Kotis, K., Vouros, G.A., Stergiou, K.: ”Capturing Semantics To-wards Automatic Coordination of Domain Ontologies,”AIMSA2004, pp. 22-32.(2004).
Neda Alipanah is receiving her PhD in com-puter science from the University of Texas atDallas (UTD) in spring 2012. She also holdstwo masters in computer science and infor-mation technology from University of Texasat Dallas and University of Liverpool. Herwork area is in ontology driven query ex-pansion and ontology ranking. She is anassociate member of IEEE. Neda is going tojoin the University of California, San Diegoas a Postdoctoral researcher in Division of
Biomedical Informatics.Latifur Khan is currently an Associate Pro-fessor in the computer science departmentat the University of Texas at Dallas (UTD),where he has been teaching and conduct-ing research since September 2000. He re-cived his Ph.D. and M.S. degrees in Com-puter Science from the University of South-ern California. Dr. Khan’s research areascover data mining, multimedia informationmanagement, semantic web and databasesystems with the primary focus on first three
research discipline.
Bhavani Thuraisingham is the Louis A.Beecherl, Jr. I Distinguished Professor inthe Erik Jonsson School of Engineering andComputer Science (CS) at the Universityof Texas at Dallas (UTD) since September2010. She is an elected Fellow of IEEE, theAAAS and the British Computer Society. Sheis the reciepient of the IEEE CS 1997 Techni-cal Achievement Award, the 2010 ResearchLeadership Award presented by IEEE ITSand IEEE SMC and the 2010 ACM SIGSAC
Outstanding Contributions Award.
![Supporting Multi-Ontology Federated Queriesdig.csail.mit.edu/2011/yyyaron-uap/UAP-Report.pdf · the Friend of a Friend (FOAF) ontology [6], which contains predicates to establish](https://static.fdocuments.in/doc/165x107/600c3c52c762257f0012736c/supporting-multi-ontology-federated-the-friend-of-a-friend-foaf-ontology-6.jpg)