Federal Student Loan Programs Data Book
278
Federal Student Loan Programs Data Book Office of Postsecondary Education Policy, Planning, and Innovation Fiscal Years 1997-2000
Transcript of Federal Student Loan Programs Data Book

Federal StudentLoan Programs
Data BookOffice of Postsecondary Education
Policy, Planning, and Innovation
Fiscal Years 1997-2000

Federal StudentLoan Programs
Data BookOffice of Postsecondary Education
Policy, Planning, and Innovation
Policy, Budget and Analysis Staff
Policy and Budget Development Unit
Donald Conner
Fiscal Years 1997-2000

ii Federal Student Loan Programs Data Book � FY 1997-FY 2000
U.S. Department of EducationRod Paige
Secretary
Office of Postsecondary EducationSally L. Stroup
Assistant Secretary for Postsecondary Education
Policy & Budget Development UnitDavid Bergeron
Chief
April 2002
This report is in the public domain. Authorization to reproduce it in whole or in part is granted.
While permission to reprint this publication is not necessary, the citation should be: U.S. Department
of Education, Office of Postsecondary Education, Office of Policy, Planning & Innovation, Federal
Student Loan Programs Data Book, Fiscal Years 1997-2000, Washington, D.C., 2002.
To order copies of this report,
write to: ED Pubs, Education Publications Center, U.S. Department of Education,
P.O. Box 1398, Jessup, MD 20794-1398;
or fax your request to: (301) 470-1244;
or email your request to: [email protected].
or call in your request toll-free: 1-877-433-7827 (1-877-4-ED-PUBS). If 877 service is
not yet available in your area, call 1-800-872-5327 (1-800-USA-LEARN). Those who use a
telecommunication device for the deaf (TDD) or a teletypewriter (TTY) should call 1-800-437-0833.
or order online at: www.ed.gov/pubs/edpubs.html.
This report is also available on the Department’s Web site at:
www.ed.gov/offices/OPE/Data.
Federal Student Loan Programs Data Book � FY 1997-FY 2000 iii
The FY 1997-FY 2000 Federal Student Loan Programs Data Book (the Data Book) presents information on two
major federal loan programs: the Federal Family Education Loan (FFEL) program and the William D. Ford
Federal Direct Loan Program (FDLP). This publication is one of a number of publications produced by the
staff of the Office of Policy, Planning, and Innovation (PPI), Policy, Budget and Analysis staff.
The Data Book is designed to provide information on borrower and lender activity. As its name suggests the
Data Book provides a myriad of factual and statistical data on the various FFEL program and the FDLP loan
components that includes: Stafford Subsidized, Stafford Unsubsidized, Parent Loans for Undergraduate
Students (PLUS) and the Consolidation loan programs.
The FY 1997-FY 2000 Data Book is a continuation of data presented in earlier publications. The previous
edition, published in summer of 1997, contained data through FY 1996. The current edition presents new
information for FY 1997, FY 1998, FY 1999 and FY 2000. Like earlier editions, the FY 1997-FY 2000 Data Book
continues to include cumulative loan volume commitment data and loan portfolio data for the FFEL
program. Comparable data for the FDLP is presented, where available.
The data presented in this Data Book follows the format of the previous edition. First, the tables and graphs
were created to stand alone and not require a lot of narrative interpretation. Second, since several tables in this
edition contain cumulative data starting at the beginning of a particular loan program, the cumulative data
appears in an appendix. For example, the Stafford Subsidized Loan program began more than 30 years ago.
Therefore, cumulative data for this program since its inception is provided in Appendix I. All FY 1990-
FY 2000 data and related discussion appear in the body of the Data Book.
The information contained in this publication is also available at the PPI Web site. This site contains other
useful information such as the FFEL Program Quarterly Loan Volume Update, the Direct Loan Quarterly
Loan Volume Update and other pertinent information. Data Books for other Title IV programs are also
available on the Web site. The Web site address is: http://www.ed.gov/offices/OPE/Data
Questions and comments regarding the contents of this publication should be directed to:
Donald Conner
Management/Program Analyst
U.S. Department of Education
Office of Postsecondary Education
1990 K Street, N.W.
Washington, DC 20006
email: [email protected]
(202) 502-7818
Foreword

Federal Student Loan Programs Data Book � FY 1997-FY 2000 v
The author and the Policy & Budget Development Unit express our sincere appreciation and thanks to the
knowledgeable colleagues whose valuable contributions helped make the production of this edition of the
FY 1997-FY 2000 Federal Student Loan Programs Data Book a success.
I would especially like to thank Greg Senseney, from the Financial Partners Channel in Federal Student Aid
(FSA). Greg collected and provided data and contributed expert advice on several tables included in this
publication. I would also like to thank David Morgan also of FSA.
The Office of Postsecondary Education would also like to thank the Human Services staff of Westat for
producing the Data Book. Although Beth Sinclair and Patricia Troppe co-managed the preparation of the Data
Book and proofed the data tables, text, and graphs, numerous other Westat staff also contributed to this effort.
Acknowledgments

Federal Student Loan Programs Data Book � FY 1997-FY 2000 vii
Foreword . . . . . . . . . . . . . . . . . . . . . . . . . . . . . . . . . . . . . . . . . . . . . . . . . . . . . . . . . . . . . . . . . . . . . . . . . . . . . . . . iii
Acknowledgments. . . . . . . . . . . . . . . . . . . . . . . . . . . . . . . . . . . . . . . . . . . . . . . . . . . . . . . . . . . . . . . . . . . . . . . . . . v
List of Tables . . . . . . . . . . . . . . . . . . . . . . . . . . . . . . . . . . . . . . . . . . . . . . . . . . . . . . . . . . . . . . . . . . . . . . . . . . . . . ix
List of Appendix Tables . . . . . . . . . . . . . . . . . . . . . . . . . . . . . . . . . . . . . . . . . . . . . . . . . . . . . . . . . . . . . . . . . . . . xiv
List of Figures . . . . . . . . . . . . . . . . . . . . . . . . . . . . . . . . . . . . . . . . . . . . . . . . . . . . . . . . . . . . . . . . . . . . . . . . . . . xvii
Introduction . . . . . . . . . . . . . . . . . . . . . . . . . . . . . . . . . . . . . . . . . . . . . . . . . . . . . . . . . . . . . . . . . . . . . . . . . . . . . . 1
Part I – FFEL Program and FDLP Summary Information . . . . . . . . . . . . . . . . . . . . . . . . . . . . . . . . . . . . . . . . . 5
Part II – FFEL Program and FDLP Loan Volume Commitments. . . . . . . . . . . . . . . . . . . . . . . . . . . . . . . . . . . 23
Part III – FDLP and FFEL Program Dollars Outstanding and Guaranty Agency Characteristics . . . . . . . . 167
Part IV – FFEL Program and FDLP Defaults and Collections . . . . . . . . . . . . . . . . . . . . . . . . . . . . . . . . . . . . 185
Part V – Appendices
Appendix I: Tables. . . . . . . . . . . . . . . . . . . . . . . . . . . . . . . . . . . . . . . . . . . . . . . . . . . . . . . . . . . . . . I-1
Appendix II. Legislative History . . . . . . . . . . . . . . . . . . . . . . . . . . . . . . . . . . . . . . . . . . . . . . . . . . II-1
Appendix III. Glossary . . . . . . . . . . . . . . . . . . . . . . . . . . . . . . . . . . . . . . . . . . . . . . . . . . . . . . . . . III-1
Table of Contents

Federal Student Loan Programs Data Book � FY 1997-FY 2000 ix
Part I – FFEL Program and FDLP Summary Information
Table 1 Federal Family Education Loan (FFEL) program executive summary: FY 1966-FY 2000 . . . . . 11
Table 2 Federal Direct Loan Program (FDLP) cash flow as of September 30th:
FY 1994-FY 2000 . . . . . . . . . . . . . . . . . . . . . . . . . . . . . . . . . . . . . . . . . . . . . . . . . . . . . . . . . . . . . . . 16
Table 3 Federal Direct Loan program (FDLP) portfolio status as of September 30th:
FY 1994-FY 2000 . . . . . . . . . . . . . . . . . . . . . . . . . . . . . . . . . . . . . . . . . . . . . . . . . . . . . . . . . . . . . . . 19
Table 4 Federal Family Education Loan (FFEL) program and Federal Direct Loan Program (FDLP)
comparison of committed loan volume: FY 1997-FY 2000 . . . . . . . . . . . . . . . . . . . . . . . . . . . . . 21
Part II – FFEL Program and FDLP Loan Volume Commitments
Table 5 Federal Family Education Loan (FFEL) program annual and cumulative commitments,
by loan program type: FY 1966-FY 2000 . . . . . . . . . . . . . . . . . . . . . . . . . . . . . . . . . . . . . . . . . . . . 27
Table 6 Federal Direct Loan Program (FDLP) annual and cumulative commitments,
by loan program type: FY 1994-FY 2000 . . . . . . . . . . . . . . . . . . . . . . . . . . . . . . . . . . . . . . . . . . . . 31
Table 7 Federal Family Education Loan (FFEL) program number of borrowers and
dollar amount of Stafford Subsidized loans, by type of institution: FY 1990-FY 2000. . . . . . . . 34
Table 8 Federal Family Education Loan (FFEL) program number of borrowers and
dollar amount of Stafford Unsubsidized loans, by type of institution: FY 1993-FY 2000 . . . . . 37
Table 9 Federal Family Education Loan (FFEL) program number of borrowers and
dollar amounts of Parent Loans for Undergraduate Students (PLUS) loans,
by type of institution: FY 1990-FY 2000 . . . . . . . . . . . . . . . . . . . . . . . . . . . . . . . . . . . . . . . . . . . . 40
Table 10 Federal Family Education Loan (FFEL) program number of borrowers and
dollar amount of Stafford Subsidized, Stafford Unsubsidized, Parent Loans for
Undergraduate Students (PLUS), and Supplemental Loan for Students (SLS) loans,
by type of institution: FY 1990-FY 2000 . . . . . . . . . . . . . . . . . . . . . . . . . . . . . . . . . . . . . . . . . . . . 43
Table 11 Federal Direct Loan Program (FDLP) number of borrowers and dollar amount
of Stafford Subsidized, Stafford Unsubsidized, and Parent Loans for Undergraduate
Students (PLUS) loans, by type of institution: FY 1997-FY 2000. . . . . . . . . . . . . . . . . . . . . . . . . 46
Table 12 Federal Direct Loan Program (FDLP) number of loans and dollar amount
of Stafford Subsidized, Stafford Unsubsidized, and Parent Loans for Undergraduate
Students (PLUS) loans, by type of institution: FY 1997-FY 2000. . . . . . . . . . . . . . . . . . . . . . . . . 52
List of Tables
x Federal Student Loan Programs Data Book � FY 1997-FY 2000
Table 13 Federal Direct Loan Program (FDLP) number of borrowers and dollar amount of
Stafford Subsidized, Stafford Unsubsidized, and Parent Loans for Undergraduate Students
(PLUS) loans, by academic level: FY 1997-FY 2000. . . . . . . . . . . . . . . . . . . . . . . . . . . . . . . . . . . . 56
Table 14 Federal Family Education Loan (FFEL) program number of borrowers and dollar amount
of Stafford Subsidized, Stafford Unsubsidized, and Parent Loans for Undergraduate Student
(PLUS) loans, by academic level: FY 1997-FY 2000. . . . . . . . . . . . . . . . . . . . . . . . . . . . . . . . . . . . 60
Table 15 Federal Family Education Loan (FFEL) program top 100 originators: FY 1997-FY 2000 . . . . . 64
Table 16 Federal Family Education Loan (FFEL) program top 100 current holders of
loans as of September 30, 2000, September 30, 1999, September 30, 1998
and September 30, 1997. . . . . . . . . . . . . . . . . . . . . . . . . . . . . . . . . . . . . . . . . . . . . . . . . . . . . . . . . . 68
Table 17 Federal Family Education Loan (FFEL) program loan volume commitments
for Stafford Subsidized loans, by guaranty agency: FY 1997-FY 2000 . . . . . . . . . . . . . . . . . . . . . 72
Table 18 Federal Family Education Loan (FFEL) program loan volume commitments
for Stafford Unsubsidized loans, by guaranty agency: FY 1997-FY 2000. . . . . . . . . . . . . . . . . . . 75
Table 19 Federal Family Education Loan (FFEL) program loan volume commitments
for Parent Loans for Undergraduate Students (PLUS) loans, by guaranty
agency: FY 1997-FY 2000 . . . . . . . . . . . . . . . . . . . . . . . . . . . . . . . . . . . . . . . . . . . . . . . . . . . . . . . . 78
Table 20 Federal Family Education Loan (FFEL) program loan volume commitments
for Stafford Subsidized, Stafford Unsubsidized, and Parent Loans for Undergraduate
Students (PLUS) loans, by guaranty agency: FY 1997-FY 2000 . . . . . . . . . . . . . . . . . . . . . . . . . . 81
Table 21 Federal Family Education Loan (FFEL) program loan volume commitments
for Consolidation loans, by guaranty agency: FY 1997-FY 2000 . . . . . . . . . . . . . . . . . . . . . . . . . 85
Table 22 Federal Family Education Loan (FFEL) program loan volume commitments
for Stafford Subsidized, Stafford Unsubsidized, and Parent Loans for Undergraduate
Students (PLUS) borrowers, by state: FY 1997-FY 2000 . . . . . . . . . . . . . . . . . . . . . . . . . . . . . . . . 90
Table 23 Federal Family Education Loan (FFEL) program loan volume commitments
for Stafford Subsidized borrowers, by state and type of institution: FY 1997-FY 2000. . . . . . . . 91
Table 24 Federal Family Education Loan (FFEL) program loan volume commitments
for Stafford Unsubsidized borrowers, by state and type of institution: FY 1997-FY 2000 . . . . . 97
Table 25 Federal Family Education Loan (FFEL) program loan volume commitments
for Parent Loans for Undergraduate Students (PLUS) borrowers,
by state and type of institution: FY 1997-FY 2000. . . . . . . . . . . . . . . . . . . . . . . . . . . . . . . . . . . . 103
List of Tables (continued)

Federal Student Loan Programs Data Book � FY 1997-FY 2000 xi
Table 26 Federal Family Education Loan (FFEL) program loan volume commitments
for Stafford Subsidized, Stafford Unsubsidized, and Parent Loans for Undergraduate
Students (PLUS) borrowers, by state and type of institution: FY 1997-FY 2000. . . . . . . . . . . . 109
Table 27 Federal Direct Loan Program (FDLP) loan volume commitments for Stafford Subsidized,
Stafford Unsubsidized, and Parent Loans for Undergraduate Students (PLUS) borrowers,
by state: FY 1997-FY 2000 . . . . . . . . . . . . . . . . . . . . . . . . . . . . . . . . . . . . . . . . . . . . . . . . . . . . . . 118
Table 28 Federal Direct Loan Program (FDLP) loan volume commitments
for Stafford Subsidized borrowers, by state and type of institution: FY 1997-FY 2000. . . . . . . 119
Table 29 Federal Direct Loan Program (FDLP) loan volume commitments
for Stafford Unsubsidized borrowers, by state and type of institution: FY 1997-FY 2000 . . . . 125
Table 30 Federal Direct Loan Program (FDLP) loan volume commitments for Parent Loans for
Undergraduate Students (PLUS) borrowers, by state and type of institution:
FY 1997-FY 2000 . . . . . . . . . . . . . . . . . . . . . . . . . . . . . . . . . . . . . . . . . . . . . . . . . . . . . . . . . . . . . . 131
Table 31 Federal Direct Loan Program (FDLP) loan volume commitments for Stafford Subsidized,
Stafford Unsubsidized, Parent Loans for Undergraduate Students (PLUS) borrowers,
by state and type of institution: FY 1997-FY 2000. . . . . . . . . . . . . . . . . . . . . . . . . . . . . . . . . . . . 137
Table 32 Federal Direct Loan Program (FDLP) loan volume commitments
for Stafford Subsidized loans, by state: FY 1997-FY 2000 . . . . . . . . . . . . . . . . . . . . . . . . . . . . . . 145
Table 33 Federal Direct Loan Program (FDLP) loan volume commitments
for Stafford Unsubsidized loans, by state: FY 1997-FY 2000. . . . . . . . . . . . . . . . . . . . . . . . . . . . 147
Table 34 Federal Direct Loan Program (FDLP) loan volume commitments for Parent Loans
for Undergraduate Students (PLUS) loans, by state: FY 1997-FY 2000 . . . . . . . . . . . . . . . . . . . 149
Table 35 Federal Direct Loan Program (FDLP) loan volume commitments for Stafford Subsidized,
Stafford Unsubsidized, and Parent Loans for Undergraduate Students (PLUS) loans,
by state: FY 1997-FY 2000 . . . . . . . . . . . . . . . . . . . . . . . . . . . . . . . . . . . . . . . . . . . . . . . . . . . . . . . 151
Table 36 Federal Direct Loan Program (FDLP) annual and cumulative Consolidation volume:
FY 1995-FY 2000 . . . . . . . . . . . . . . . . . . . . . . . . . . . . . . . . . . . . . . . . . . . . . . . . . . . . . . . . . . . . . . 154
Table 37 Combinations of Federal Family Education Loan (FFEL) program participation among
Stafford Subsidized, Stafford Unsubsidized, and Parent Loans for Undergraduate Students
(PLUS) borrowers, by type of institution: FY 1997 . . . . . . . . . . . . . . . . . . . . . . . . . . . . . . . . . . . 156
Table 38 Combinations of Federal Family Education Loan (FFEL) program participation among
Stafford Subsidized, Stafford Unsubsidized, and Parent Loans for Undergraduate Students
(PLUS) borrowers, by type of institution: FY 1998 . . . . . . . . . . . . . . . . . . . . . . . . . . . . . . . . . . . 157
List of Tables (continued)

xii Federal Student Loan Programs Data Book � FY 1997-FY 2000
Table 39 Combinations of Federal Family Education Loan (FFEL) program participation among
Stafford Subsidized, Stafford Unsubsidized, and Parent Loans for Undergraduate Students
(PLUS) borrowers, by type of institution: FY 1999 . . . . . . . . . . . . . . . . . . . . . . . . . . . . . . . . . . . 158
Table 40 Combinations of Federal Family Education Loan (FFEL) program participation among
Stafford Subsidized, Stafford Unsubsidized, and Parent Loans for Undergraduate Students
(PLUS) borrowers, by type of institution: FY 2000 . . . . . . . . . . . . . . . . . . . . . . . . . . . . . . . . . . . 159
Table 41 Federal Direct Loan Program (FDLP) combinations of participation among
Stafford Subsidized, Stafford Unsubsidized, and Parent Loans for Undergraduate Students
(PLUS) borrowers, by type of institution: FY 1997-FY 2000. . . . . . . . . . . . . . . . . . . . . . . . . . . 163
Part III – FDLP and FFEL Program Dollars Outstanding and Guaranty Agency Characteristics
Table 42 Weekly average 91-day Treasury Bill (bond equivalent) rates, by quarter: FY 1986-FY 2000. . 170
Table 43 Federal Direct Loan Program (FDLP) estimated dollars outstanding,
as of September 30th of each fiscal year, by loan program type: FY 1997-FY 2000 . . . . . . . . . 172
Table 44 Federal Family Education Loan (FFEL) program estimated dollars outstanding,
as of September 30th of each fiscal year, by loan program type: FY 1990-FY 2000 . . . . . . . . . 175
Table 45 Sallie Mae loan purchases and warehousing advances: Calendar years 1973-00 . . . . . . . . . . . . 176
Table 46 Federal Family Education Loan (FFEL) program designated guarantor,
organizational type, and agency name, by state: Status as of September 30, 2000 . . . . . . . . . . 179
Table 47a Federal Family Education Loan (FFEL) program cumulative cash reserves and
reserve ratio, by guaranty agency: As of September 30, 1997 and September 30, 1998. . . . . . . 181
Table 47b Federal Family Education Loan (FFEL) program federal, operating, and restricted funds,
by guaranty agency: As of September 30, 1999 and September 30, 2000. . . . . . . . . . . . . . . . . . 183
Part IV – FFEL Program and FDLP Defaults and Collections
Table 48 Federal Family Education Loan (FFEL) program guaranty agency
reinsurance agreement default status: FY 1997-FY 2000. . . . . . . . . . . . . . . . . . . . . . . . . . . . . . . 188
Table 49 Federal Family Education Loan (FFEL) program annual and cumulative default dollars
and collections: FY 1986-FY 2000. . . . . . . . . . . . . . . . . . . . . . . . . . . . . . . . . . . . . . . . . . . . . . . . . 192
List of Tables (continued)
Federal Student Loan Programs Data Book � FY 1997-FY 2000 xiii
Table 50 Federal Direct Loan Program (FDLP) annual and cumulative default dollars
and collections: FY 1995-FY 2000. . . . . . . . . . . . . . . . . . . . . . . . . . . . . . . . . . . . . . . . . . . . . . . . . 198
Table 51 Federal Family Education Loan (FFEL) program and Federal Direct Loan
Program (FDLP) institutional default reduction initiative comparison
of cohort default rates: FY 1994-FY 1999. . . . . . . . . . . . . . . . . . . . . . . . . . . . . . . . . . . . . . . . . . . 200
Table 52a Federal Family Education Loan (FFEL) program cohort default rate
for guaranty agencies: FY 1997 . . . . . . . . . . . . . . . . . . . . . . . . . . . . . . . . . . . . . . . . . . . . . . . . . . . 203
Table 52b Federal Family Education Loan (FFEL) program cohort default rate
for guaranty agencies: FY 1998 . . . . . . . . . . . . . . . . . . . . . . . . . . . . . . . . . . . . . . . . . . . . . . . . . . . 204
Table 52c Federal Family Education Loan (FFEL) program cohort default rate
for guaranty agencies: FY 1999 . . . . . . . . . . . . . . . . . . . . . . . . . . . . . . . . . . . . . . . . . . . . . . . . . . . 205
Table 53 Federal Family Education Loan (FFEL) program default dollars paid to lenders
for Stafford Subsidized loans, by guaranty agency: FY 1997-FY 2000 . . . . . . . . . . . . . . . . . . . . 208
Table 54 Federal Family Education Loan (FFEL) program default dollars paid to lenders
for Stafford Unsubsidized loans, by guaranty agency: FY 1997-FY 2000. . . . . . . . . . . . . . . . . . 209
Table 55 Federal Family Education Loan (FFEL) program default dollars paid to lenders
for Parent Loans for Undergraduate Student (PLUS) loans,
by guaranty agency: FY 1997-FY 2000 . . . . . . . . . . . . . . . . . . . . . . . . . . . . . . . . . . . . . . . . . . . . . 210
Table 56 Federal Family Education Loan (FFEL) program default dollars paid to lenders
for Supplemental Loan for Students (SLS) loans, by guaranty agency: FY 1997-FY 2000 . . . . 211
Table 57 Federal Family Education Loan (FFEL) program default dollars paid to lenders
for Consolidation loans, by guaranty agency: FY 1997-FY 2000 . . . . . . . . . . . . . . . . . . . . . . . . 212
Table 58 Federal Family Education Loan (FFEL) program default dollars paid to lenders
for Stafford Subsidized, Stafford Unsubsidized, Parent Loans for Undergraduate Students
(PLUS), Supplemental Loan for Students (SLS), and Consolidation loans,
by guaranty agency: FY 1997-FY 2000 . . . . . . . . . . . . . . . . . . . . . . . . . . . . . . . . . . . . . . . . . . . . . 213
Table 59 Federal Family Education Loan (FFEL) program collections on defaulted loans
for Stafford Subsidized loans, by guaranty agency: FY 1997-FY 2000 . . . . . . . . . . . . . . . . . . . . 216
Table 60 Federal Family Education Loan (FFEL) program collections on defaulted loans
for Stafford Unsubsidized loans, by guaranty agency: FY 1997-FY 2000. . . . . . . . . . . . . . . . . . 217
List of Tables (continued)
xiv Federal Student Loan Programs Data Book � FY 1997-FY 2000
Table 61 Federal Family Education Loan (FFEL) program collections on defaulted loans
for Parent Loans for Undergraduate Students (PLUS) loans,
by guaranty agency: FY 1997-FY 2000 . . . . . . . . . . . . . . . . . . . . . . . . . . . . . . . . . . . . . . . . . . . . . 218
Table 62 Federal Family Education Loan (FFEL) program collections on defaulted loans
for Supplemental Loan for Students (SLS) loans, by guaranty agency: FY 1997-FY 2000 . . . . 219
Table 63 Federal Family Education Loan (FFEL) program collections on defaulted loans
for Consolidation loans, by guaranty agency: FY 1997-FY 2000 . . . . . . . . . . . . . . . . . . . . . . . . 220
Table 64 Federal Family Education Loan (FFEL) program collections on defaulted loans
for Stafford Subsidized, Stafford Unsubsidized, Parent Loans for Undergraduate
Students (PLUS), Supplemental Loan for Students (SLS), and Consolidation loans,
by guaranty agency: FY 1997-FY 2000 . . . . . . . . . . . . . . . . . . . . . . . . . . . . . . . . . . . . . . . . . . . . . 221
Part V – Appendix Tables
Table A-1 Federal Family Education Loan (FFEL) program executive summary: FY 1966-FY 2000. . . . . I-3
Table A-5 Federal Family Education Loan (FFEL) program annual and cumulative commitments,
by loan program type: FY 1966-FY 2000. . . . . . . . . . . . . . . . . . . . . . . . . . . . . . . . . . . . . . . . . . . . I-4
Table A-7 Federal Family Education Loan (FFEL) program number of borrowers and dollar amount
of Stafford Subsidized loans, by type of institution: FY 1968-FY 2000 . . . . . . . . . . . . . . . . . . . I-7
Table A-9 Federal Family Education Loan (FFEL) program number of borrowers and dollar amount
of Parent Loans for Undergraduate Students (PLUS) loans, by type of institution:
FY 1981-FY 2000. . . . . . . . . . . . . . . . . . . . . . . . . . . . . . . . . . . . . . . . . . . . . . . . . . . . . . . . . . . . . . . I-8
Table A-10 Federal Family Education Loan (FFEL) program number of borrowers and dollar amount
of Stafford Subsidized, Stafford Unsubsidized, Parent Loans for Undergraduate Students
(PLUS), and Supplemental Loan for Students (SLS) loans, by type of institution:
FY 1986-FY 2000. . . . . . . . . . . . . . . . . . . . . . . . . . . . . . . . . . . . . . . . . . . . . . . . . . . . . . . . . . . . . . . I-9
Table A-10 Supplemental
Federal Family Education Loan (FFEL) program number of borrowers and dollar amount
of Supplemental Loan for Students (SLS) loans, by type of institution: FY 1982-FY 1994 . . . I-10
Table A-11 Federal Direct Loan Program (FDLP) number of borrowers and dollar amount
of Stafford Subsidized, Stafford Unsubsidized, Parent Loans for Undergraduate Students
(PLUS) loans, by type of institution: FY 1994-FY 2000 . . . . . . . . . . . . . . . . . . . . . . . . . . . . . . . I-11
List of Tables (continued)

Federal Student Loan Programs Data Book � FY 1997-FY 2000 xv
Table A-12 Federal Direct Loan Program (FDLP) number of loans and dollar amount
of Stafford Subsidized, Stafford Unsubsidized, and Parent Loans for Undergraduate
Students (PLUS) loans, by type of institution: FY 1994-FY 2000 . . . . . . . . . . . . . . . . . . . . . . . I-13
Table A-13 Federal Direct Loan Program (FDLP) number of borrowers and dollar amount
of Stafford Subsidized, Stafford Unsubsidized, Parent Loans for Undergraduate
Students (PLUS) loans, by academic level: FY 1994-FY 2000 . . . . . . . . . . . . . . . . . . . . . . . . . . I-14
Table A-15 Federal Family Education Loans (FFEL) program annual number of
active lenders: FY 1966-FY 2000 . . . . . . . . . . . . . . . . . . . . . . . . . . . . . . . . . . . . . . . . . . . . . . . . . I-16
Table A-42 Weekly average 91-day Treasury Bill (bond equivalent) rates, by quarter:
FY 1977-FY 2000. . . . . . . . . . . . . . . . . . . . . . . . . . . . . . . . . . . . . . . . . . . . . . . . . . . . . . . . . . . . . . I-17
Table A-44 Federal Family Education Loan (FFEL) program estimated dollars outstanding,
as of September 30th of each fiscal year, by loan program type: FY 1979-FY 2000 . . . . . . . . . I-18
Table A-45 Sallie Mae loan purchases and warehousing advances: Calendar years 1973-00 . . . . . . . . . . . I-20
Table A-49 Federal Family Education Loan (FFEL) program annual and cumulative default dollars
and collections: FY 1966-FY 2000 . . . . . . . . . . . . . . . . . . . . . . . . . . . . . . . . . . . . . . . . . . . . . . . . I-21
List of Tables (continued)
Federal Student Loan Programs Data Book � FY 1997-FY 2000 xvii
List of Figures
Figure 1 Federal student loan program (FFEL program and FDLP combined) commitments:
FY 1997-FY 2000 . . . . . . . . . . . . . . . . . . . . . . . . . . . . . . . . . . . . . . . . . . . . . . . . . . . . . . . . . . . . . . . . 3
Part I – FFEL Program and FDLP Summary Information
Figure 2 Federal Family Education Loan (FFEL) program commitments: FY 1990-FY 2000 . . . . . . . . . 12
Figure 3 Federal Direct Loan Program (FDLP) commitments: FY 1994-FY 2000. . . . . . . . . . . . . . . . . . . 17
Figure 4 Federal Direct Loan Program (FDLP) loan volume as a percent of total student loan volume
for both the Federal Family Education Loan (FFEL) program and FDLP: FY 1997-FY 2000 . . 22
Part II – FFEL Program and FDLP Loan Volume Commitments
Figure 5 Federal Family Education Loan (FFEL) program annual commitments,
by loan program type: FY 1990-FY 2000 . . . . . . . . . . . . . . . . . . . . . . . . . . . . . . . . . . . . . . . . . . . . 29
Figure 6 Federal Direct Loan Program (FDLP) annual commitments, by loan program type:
FY 1994-FY 2000 . . . . . . . . . . . . . . . . . . . . . . . . . . . . . . . . . . . . . . . . . . . . . . . . . . . . . . . . . . . . . . . 32
Figure 7 Percentage distribution of Federal Family Education Loan (FFEL) program dollars,
by type of institution: FY 1990-FY 2000 (Stafford Subsidized) . . . . . . . . . . . . . . . . . . . . . . . . . . 35
Figure 8 Percentage distribution of Federal Family Education Loan (FFEL) program dollars,
by type of institution: FY 1990-FY 2000 (Stafford Unsubsidized) . . . . . . . . . . . . . . . . . . . . . . . . 38
Figure 9 Percentage distribution of Federal Family Education Loan (FFEL) program dollars,
by type of institution: FY 1990-FY 2000 (PLUS). . . . . . . . . . . . . . . . . . . . . . . . . . . . . . . . . . . . . . 41
Figure 10 Percentage distribution of Federal Family Education Loan (FFEL) program dollars,
by type of institution: FY 1990-FY 2000 (FFEL program total) . . . . . . . . . . . . . . . . . . . . . . . . . . 44
Figure 11 Percentage distribution of Federal Direct Loan Program (FDLP) dollars,
by type of institution: FY 1997-FY 2000 . . . . . . . . . . . . . . . . . . . . . . . . . . . . . . . . . . . . . . . . . . . . 47
Figure 12 Percentage distribution of Federal Direct Loan Program (FDLP) borrowers,
by type of institution: FY 1997-FY 2000 . . . . . . . . . . . . . . . . . . . . . . . . . . . . . . . . . . . . . . . . . . . . 49
Figure 13 Percentage distribution of Federal Direct Loan Program (FDLP) loans,
by type of institution: FY 1997-FY 2000 . . . . . . . . . . . . . . . . . . . . . . . . . . . . . . . . . . . . . . . . . . . . 53
Figure 14 Percentage distribution of Federal Direct Loan Program (FDLP) dollars,
by academic level: FY 1997-FY 2000. . . . . . . . . . . . . . . . . . . . . . . . . . . . . . . . . . . . . . . . . . . . . . . . 57
xviii Federal Student Loan Programs Data Book � FY 1997-FY 2000
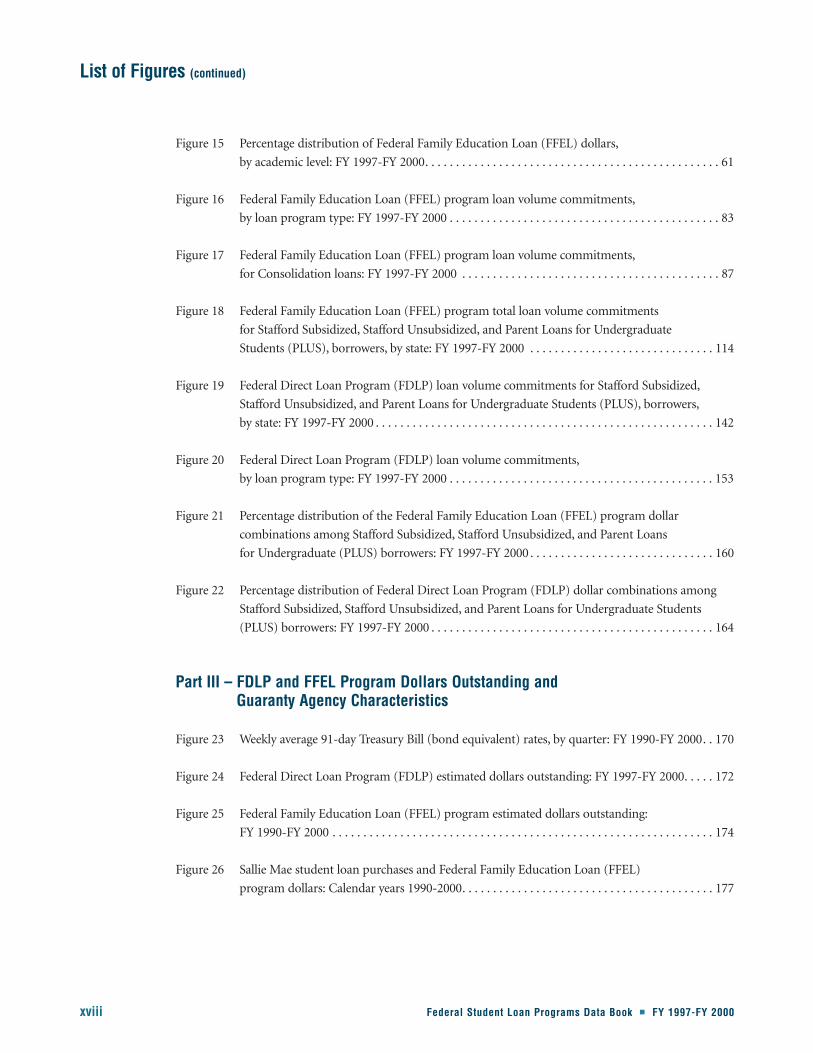
Figure 15 Percentage distribution of Federal Family Education Loan (FFEL) dollars,
by academic level: FY 1997-FY 2000. . . . . . . . . . . . . . . . . . . . . . . . . . . . . . . . . . . . . . . . . . . . . . . . 61
Figure 16 Federal Family Education Loan (FFEL) program loan volume commitments,
by loan program type: FY 1997-FY 2000 . . . . . . . . . . . . . . . . . . . . . . . . . . . . . . . . . . . . . . . . . . . . 83
Figure 17 Federal Family Education Loan (FFEL) program loan volume commitments,
for Consolidation loans: FY 1997-FY 2000 . . . . . . . . . . . . . . . . . . . . . . . . . . . . . . . . . . . . . . . . . . 87
Figure 18 Federal Family Education Loan (FFEL) program total loan volume commitments
for Stafford Subsidized, Stafford Unsubsidized, and Parent Loans for Undergraduate
Students (PLUS), borrowers, by state: FY 1997-FY 2000 . . . . . . . . . . . . . . . . . . . . . . . . . . . . . . 114
Figure 19 Federal Direct Loan Program (FDLP) loan volume commitments for Stafford Subsidized,
Stafford Unsubsidized, and Parent Loans for Undergraduate Students (PLUS), borrowers,
by state: FY 1997-FY 2000 . . . . . . . . . . . . . . . . . . . . . . . . . . . . . . . . . . . . . . . . . . . . . . . . . . . . . . . 142
Figure 20 Federal Direct Loan Program (FDLP) loan volume commitments,
by loan program type: FY 1997-FY 2000 . . . . . . . . . . . . . . . . . . . . . . . . . . . . . . . . . . . . . . . . . . . 153
Figure 21 Percentage distribution of the Federal Family Education Loan (FFEL) program dollar
combinations among Stafford Subsidized, Stafford Unsubsidized, and Parent Loans
for Undergraduate (PLUS) borrowers: FY 1997-FY 2000 . . . . . . . . . . . . . . . . . . . . . . . . . . . . . . 160
Figure 22 Percentage distribution of Federal Direct Loan Program (FDLP) dollar combinations among
Stafford Subsidized, Stafford Unsubsidized, and Parent Loans for Undergraduate Students
(PLUS) borrowers: FY 1997-FY 2000 . . . . . . . . . . . . . . . . . . . . . . . . . . . . . . . . . . . . . . . . . . . . . . 164
Part III – FDLP and FFEL Program Dollars Outstanding and Guaranty Agency Characteristics
Figure 23 Weekly average 91-day Treasury Bill (bond equivalent) rates, by quarter: FY 1990-FY 2000. . 170
Figure 24 Federal Direct Loan Program (FDLP) estimated dollars outstanding: FY 1997-FY 2000. . . . . 172
Figure 25 Federal Family Education Loan (FFEL) program estimated dollars outstanding:
FY 1990-FY 2000 . . . . . . . . . . . . . . . . . . . . . . . . . . . . . . . . . . . . . . . . . . . . . . . . . . . . . . . . . . . . . . 174
Figure 26 Sallie Mae student loan purchases and Federal Family Education Loan (FFEL)
program dollars: Calendar years 1990-2000. . . . . . . . . . . . . . . . . . . . . . . . . . . . . . . . . . . . . . . . . 177
List of Figures (continued)

Federal Student Loan Programs Data Book � FY 1997-FY 2000 xix
Part IV – FFEL Program and FDLP Defaults and Collections
Figure 27 Federal Family Education Loan (FFEL) program guaranty agency reinsurance agreement
default status: FY 1997-FY 2000 . . . . . . . . . . . . . . . . . . . . . . . . . . . . . . . . . . . . . . . . . . . . . . . . . . 190
Figure 28 Federal Family Education Loan (FFEL) program annual defaults and collections:
FY 1990-FY 2000 . . . . . . . . . . . . . . . . . . . . . . . . . . . . . . . . . . . . . . . . . . . . . . . . . . . . . . . . . . . . . . 194
Figure 29 Federal Direct Loan Program (FDLP) annual default and collections: FY 1996-FY 2000 . . . . 198
Figure 30 Federal Family Education Loan (FFEL) program and Federal Direct Loan Program (FDLP)
institutional default rates, by type of institution: FY 1994-FY 1999. . . . . . . . . . . . . . . . . . . . . . 201
List of Figures (continued)

Federal Student Loan Programs Data Book � FY 1997-FY 2000 1
The federal student financial assistance programs are administered by the Federal Student Aid (FSA) office
within the U.S. Department of Education. These programs provide funds to help students meet postsecondary
education costs. Often referred to as “Title IV programs” because the authorizing legislation is written in Title
IV of the Higher Education Act, FSA programs include loans, grants, and work-study programs. FSA
programs include Federal Pell Grants, Federal Perkins Loans, Supplemental Educational Opportunity Grants
(SEOG), the Federal Work-Study Program, the Federal Family Education Loan (FFEL) program, and the
William D. Ford Federal Direct Student Loan Program (FDLP).
The Data Book focuses on two of the FSA programs, the FFEL program and the FDLP. These two programs
are of particular interest because they are structured as entitlement programs. Under the FFEL program, the
entitlements accrue to lenders and guaranty agencies, while under the FDLP, entitlements accrue to individual
borrowers. This special status as an entitlement program explains some of the spectacular growth of the
FFEL program and the FDLP.
While the FFEL program began in FY 1966 and the FDLP began in FY 1994, both programs have grown
rapidly. The quantitative data that have been assembled in the Data Book reflect this growth and are of interest
to state officials, Congress, federal officials, postsecondary educational institutions, guaranty agencies, lenders,
parents, students, researchers, and policymakers.
The FFEL program was known formerly as the Guaranteed Student Loan (GSL) program. The GSL program,
originally authorized in the Higher Education Act of 1965, empowered state and private nonprofit agencies to
guarantee student loans and to establish loan insurance for lenders who did not have access to state or private
nonprofit agencies. The GSL program, renamed the FFEL program in the Higher Education Amendments
of 1992, has experienced enormous growth. Cumulative loan volume increased from $102 billion and
48 million loans at the end of FY 1989 to $317 billion and 110 million loans guaranteed at the end of FY 2000.
The Federal Direct Loan Demonstration Program was first authorized by the Higher Education Amendments
of 1992 as a pilot program. This program, which eventually became the FDLP, was designed to improve the
delivery of loans to postsecondary education students in need of financial assistance. The FDLP, authorized
by the Student Loan Reform Act of 1993 as part of the Omnibus Reconciliation Act of 1993, has grown rapidly
in the short time it has been operational. For example, during FY 1995, FDLP’s first full fiscal year of activity,
the program committed $5.1 billion through 1.3 million loans. By FY 2000, FDLP loan volume increased more
than 130 percent to $11.8 billion, while the number of loans more than doubled to 3.1 million.
In order to understand the data presented in this publication, it is important to know that the FFEL program
and the FDLP comprise the same loan program types: the Federal Stafford Loans (Subsidized and
Unsubsidized) and Parent Loans for Undergraduate Students (PLUS) loans. The Stafford Subsidized Loan is
awarded on the basis of the borrower’s financial need, while the Stafford Unsubsidized Loan is not based on
need. The PLUS loan is designed for parents who take out loans on behalf of dependent students. In addition,
both the FFEL program and FDLP offer Consolidation loans. It is important to note that the Supplemental
Loan to Students (SLS) program, established in 1981 under the FFEL program, was replaced by the FFEL
Stafford Unsubsidized loan program in FY 1994. Thus, the SLS program, while previously a component of the
FFEL program, has never been a component of the FDLP.
Introduction
Introduction

2 Federal Student Loan Programs Data Book � FY 1997-FY 2000
Although the FFEL program and the FDLP share similar program components, each disburses funds
differently. FFEL program loans are made through private lenders while FDLP loans are disbursed
directly from the U.S. government to postsecondary institutions. Eligible postsecondary institutions may
choose to provide borrowers access to federally supported loans through the FFEL program or the FDLP,
but not both.
Recent legislative activity has had an effect on borrower repayment activity for FFEL program and FDLP
loans. For example, the Higher Education Amendments of 1998 lengthened the amount of time before a loan
falls into default, extended repayment options for borrowers with large debt amounts, and instituted new loan
forgiveness provisions for borrowers who become teachers. Interested readers are encouraged to reference the
legislative history section in appendix II of this book for additional information.
Data Organization
The data assembled for this edition of the Data Book are from various sources. The primary source is the U.S.
Department of Education, Office of Postsecondary Education, National Student Loan Data System (NSLDS),
a live database of loan records. Other data have been assembled from data collected through the ED Form
1189, ED Form 1130, ED Form 799, Direct Loan/Loan Origination System, U.S. Department of Treasury,
Sallie Mae Annual Report, and Financial Partners Channel records.
It is important to note that data for the FDLP are limited to seven fiscal years (FY 1994-FY 2000). All other
loan programs are clearly marked to indicate the time period in which the program was operational. Where
data is not available, a notation appears in the footnote.
Loan volume commitments (dollars and loans) represent commitments by guaranty agencies for the FFEL
program. For the FDLP, loan volume commitments (dollars and loans) are listed by state. The publication
presents FFEL program and FDLP data by program component (loan program type) and as a FFEL program
total or FDLP total. Electronic copies of the data presented in these tables will be available through the Web
site at http:// www.ed.gov/offices/OPE/PPI.
The Office of Policy, Planning and Innovation publishes data on other Title IV programs. Information on the
Pell Grant Program can be found in the Title IV/Federal Pell Grant Program End of the Year Report and
information on the campus-based programs (Perkins Loans, Federal Work-Study, and the SEOG program)
can be found in the Federal Campus Based Programs Data Books. Both documents are available through the
website at http://www.ed.gov/offices/OPE/Data/index.html
Summary
Between FY 1997 and FY 2000, loan volume commitments for the FFEL program and FDLP grew 15 percent
from $32.5 billion to $37.5 billion. As illustrated in figure 1, much of this increase occurred between FY 1999
and FY 2000, when combined loan volume commitments jumped by more than $3 billion. From FY 1997 to
FY 2000, FFEL program commitments grew from $21.7 billion to $25.7 billion, while FDLP volume grew from
$10.9 billion to $11.8 billion.

Federa l S tuden t Loan P rog rams Da ta Book � FY 1997-FY 2000 3
Fiscal year
Number of loans
Loan
s (in
000
’s)
10,000
9,000
8,000
7,000
6,000
5,000
4,000
3,000
2,000
1,000
0
FDLP
FFEL Program
FY97
5,681
2,998
FY98
5,809
3,078
FY99
5,859
2,957
FY00
6,333
3,066
Fiscal year
Dollar amount
Dolla
rs (i
n 00
0,00
0’s)
$40,000
35,000
30,000
25,000
20,000
15,000
10,000
5,000
0
FDLP
FFEL Program
FY97
$21,659
$10,918
FY98
$22,497
$11,125
FY99
$23,324
$10,703
FY00
$25,656
$11,833
Figure 1. Federal student loan program (FFEL program and FDLP combined) commitments: FY 1997-FY 2000
SOURCE: U.S. Department of Education, Office of Postsecondary Education, National Student Loan Data System and Direct/Loan Origination System.
SOURCE: U.S. Department of Education, Office of Postsecondary Education, National Student Loan Data System and Direct/Loan Origination System.
Introduction
4 Federal Student Loan Programs Data Book � FY 1997-FY 2000
Data Book Organization
The Loan Programs Data Book is organized to help readers who want summary information and/or detailed
program information. The core of the volume consists of 64 tables, text summarizing highlights of the data in
each table, and graphs or charts, as required to assist readers. This edition also contains a legislative history of
the FFEL program and FDLP and a glossary of nearly 100 terms.
The 64 tables and companion text are organized into four sections:
� Part I – FFEL Program and FDLP Summary Information (Tables 1-4)
� Part II – FFEL Program and FDLP Loan Volume Commitments (Tables 5-41)
� Part III – FDLP and FFEL Program Dollars Outstanding and Guaranty Agency Characteristics
(Tables 42-47b)
� Part IV – FFEL Program and FDLP Defaults and Collections (Tables 48-64)
� Part V – Appendices
The information contained in each table is arranged in the following sequence:
� Text summarizing data highlights
� Table of data
� Graphs (as required)
When data are available for FFEL programs in existence prior to FY 1990, the entire data set is presented in a
corresponding table that appears in Appendix I. Since some FFEL programs began more than 35 years ago,
this cumulative data serves as a historical accounting of FFEL program activity.
Summ
ary Information
Federal Student Loan Programs Data Book � FY 1997-FY 2000 5
Part IFFEL Program and FDLP Summary Information

Federal Student Loan Programs Data Book � FY 1997-FY 2000 7
Summ
ary Information
This table provides summary information about FFEL program loan volume, defaults, expenditures, and receipts
for FY 1966-FY 2000. (See also figure 2 which follows table 1.)
Loan volume commitments
� Since its inception, 109.9 million loans worth nearly $317.0 billion have been committed through the FFEL
program. Approximately 56.2 percent of the loans and 67.9 percent of the dollar volume were committed
in FY 1990-FY 2000.
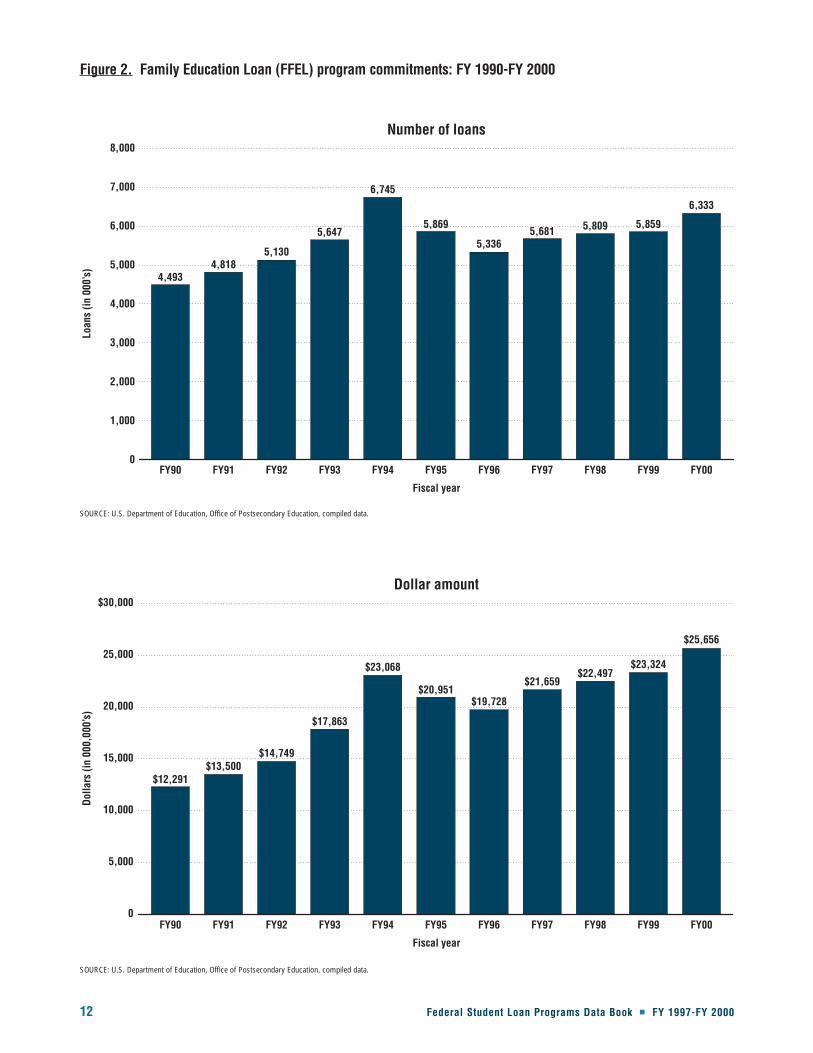
� Annual FFEL loan volume increased each year from $12.3 billion in FY 1990 to $23.1 billion in FY 1994,
but decreased in FY 1995 and FY 1996, to $21.0 and $19.7 billion, respectively. By FY 2000, annual loan
volume had grown to $25.7 billion.
� The number of loans also decreased in FY 1995 and FY 1996 to 5.9 and 5.3 million, respectively,
representing a 13.0 and 9.1 percent decrease from prior years. However, by FY 2000, the number of loans
increased to 6.3 million.
� FFEL program annual loan volume commitments reached its highest level in FY 2000 when $25.7 billion
were committed through 6.3 million loans. The annual number of FFEL loans reached its highest level in
FY 1994 when 6.7 million loans worth $23.1 billion were committed.
� Between FY 1990-FY 2000, the average loan increased 48.2 percent in current dollars from $2,734 to
$4,051. The typical annual increase in average loan amount was between 2.2 and 4.4 percent. But in FY
1993 and FY 1994, the average loan amount increased 10.0 and 8.1 percent, respectively, over prior years.
Defaults
� Cumulative guaranty agency (GA) payments made on defaulted loans to lenders were $38.9 billion in
FY 2000, 73.1 percent of which were made between FY 1990 and FY 2000.
� Annual GA default payments to lenders fluctuated between a low of $2.0 billion in FY 1999 to a high of
$3.2 billion in FY 1991.
Federal outlays
Federal outlays include payments made to lenders and guaranty agencies and the cost of collections. Major
FFEL program outlays include interest benefits paid to lenders and reinsurance default claims paid to guaranty
agencies. These two outlay components accounted for 68.4 percent of all FFEL program outlays in FY 2000.
� In FY 1990-FY 2000, the total federal outlays for the FFEL program fluctuated from a low of $5.1 billion
in FY 1993 to a high of $6.5 billion in FY 2000. The greatest annual increase occurred in FY 1996
(12.8 percent), while the greatest decrease occurred in FY 1993 (10.7 percent).
Table 1. Federal Family Education Loan (FFEL) program executive summary:FY 1966-FY 2000
Federal Student Loan Programs Data Book � FY 1997-FY 2000 7
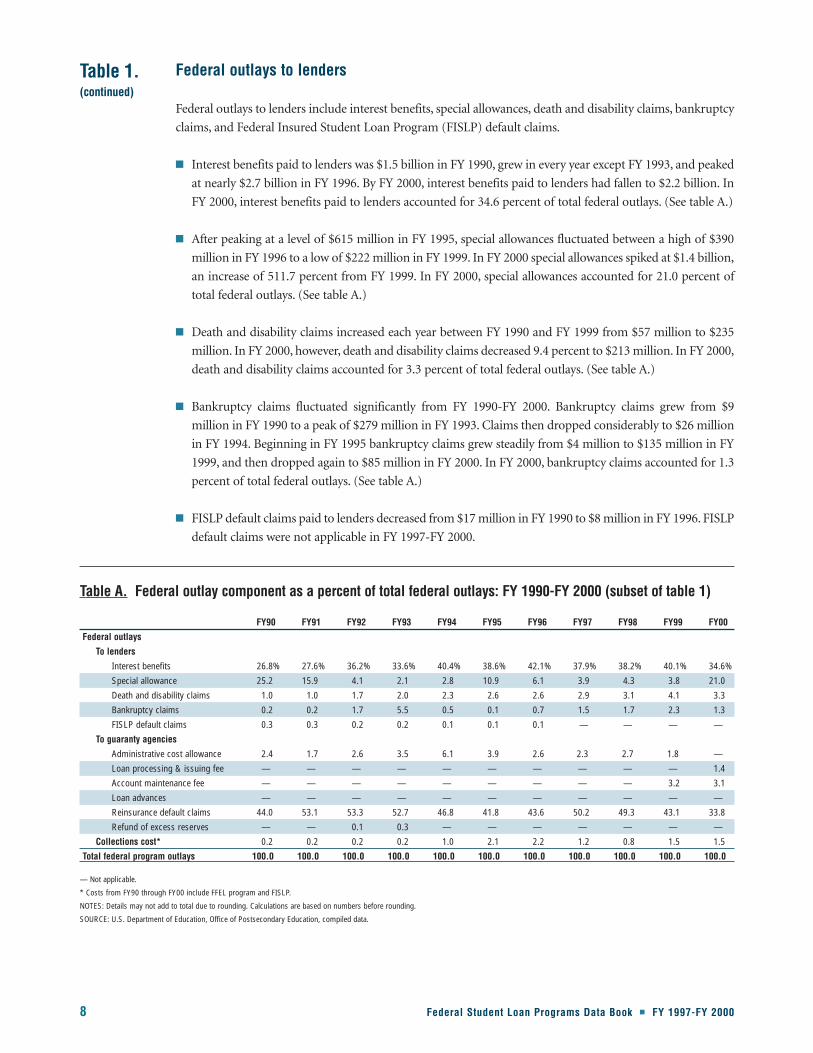
Federal outlays to lenders
Federal outlays to lenders include interest benefits, special allowances, death and disability claims, bankruptcy
claims, and Federal Insured Student Loan Program (FISLP) default claims.
� Interest benefits paid to lenders was $1.5 billion in FY 1990, grew in every year except FY 1993, and peaked
at nearly $2.7 billion in FY 1996. By FY 2000, interest benefits paid to lenders had fallen to $2.2 billion. In
FY 2000, interest benefits paid to lenders accounted for 34.6 percent of total federal outlays. (See table A.)
� After peaking at a level of $615 million in FY 1995, special allowances fluctuated between a high of $390
million in FY 1996 to a low of $222 million in FY 1999. In FY 2000 special allowances spiked at $1.4 billion,
an increase of 511.7 percent from FY 1999. In FY 2000, special allowances accounted for 21.0 percent of
total federal outlays. (See table A.)
� Death and disability claims increased each year between FY 1990 and FY 1999 from $57 million to $235
million. In FY 2000, however, death and disability claims decreased 9.4 percent to $213 million. In FY 2000,
death and disability claims accounted for 3.3 percent of total federal outlays. (See table A.)
� Bankruptcy claims fluctuated significantly from FY 1990-FY 2000. Bankruptcy claims grew from $9
million in FY 1990 to a peak of $279 million in FY 1993. Claims then dropped considerably to $26 million
in FY 1994. Beginning in FY 1995 bankruptcy claims grew steadily from $4 million to $135 million in FY
1999, and then dropped again to $85 million in FY 2000. In FY 2000, bankruptcy claims accounted for 1.3
percent of total federal outlays. (See table A.)
� FISLP default claims paid to lenders decreased from $17 million in FY 1990 to $8 million in FY 1996. FISLP
default claims were not applicable in FY 1997-FY 2000.
Table 1.(continued)
8 Federal Student Loan Programs Data Book � FY 1997-FY 2000
Table A. Federal outlay component as a percent of total federal outlays: FY 1990-FY 2000 (subset of table 1)
FY90 FY91 FY92 FY93 FY94 FY95 FY96 FY97 FY98 FY99 FY00
Federal outlays
To lenders
Interest benefits 26.8% 27.6% 36.2% 33.6% 40.4% 38.6% 42.1% 37.9% 38.2% 40.1% 34.6%
Special allowance 25.2 15.9 4.1 2.1 2.8 10.9 6.1 3.9 4.3 3.8 21.0
Death and disability claims 1.0 1.0 1.7 2.0 2.3 2.6 2.6 2.9 3.1 4.1 3.3
Bankruptcy claims 0.2 0.2 1.7 5.5 0.5 0.1 0.7 1.5 1.7 2.3 1.3
FISLP default claims 0.3 0.3 0.2 0.2 0.1 0.1 0.1 — — — —
To guaranty agencies
Administrative cost allowance 2.4 1.7 2.6 3.5 6.1 3.9 2.6 2.3 2.7 1.8 —
Loan processing & issuing fee — — — — — — — — — — 1.4
Account maintenance fee — — — — — — — — — 3.2 3.1
Loan advances — — — — — — — — — — —
Reinsurance default claims 44.0 53.1 53.3 52.7 46.8 41.8 43.6 50.2 49.3 43.1 33.8
Refund of excess reserves — — 0.1 0.3 — — — — — — —
Collections cost* 0.2 0.2 0.2 0.2 1.0 2.1 2.2 1.2 0.8 1.5 1.5
Total federal program outlays 100.0 100.0 100.0 100.0 100.0 100.0 100.0 100.0 100.0 100.0 100.0
— Not applicable.
* Costs from FY90 through FY00 include FFEL program and FISLP.
NOTES: Details may not add to total due to rounding. Calculations are based on numbers before rounding.
SOURCE: U.S. Department of Education, Office of Postsecondary Education, compiled data.
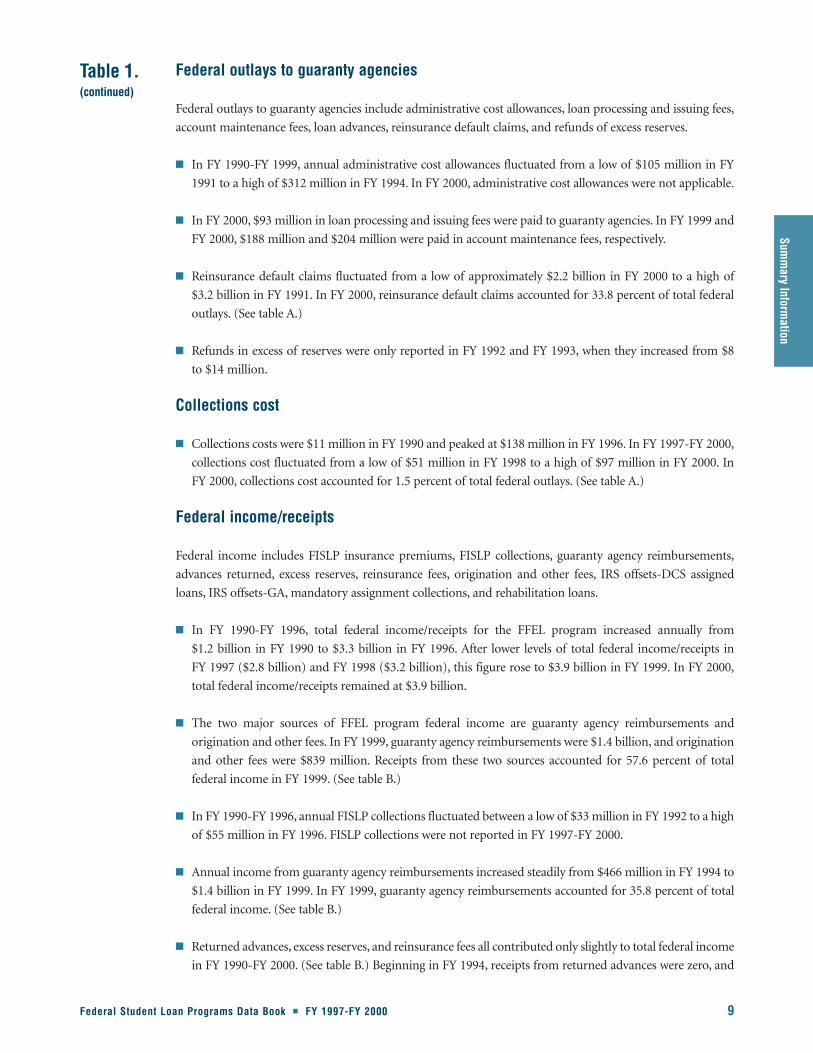
Federal outlays to guaranty agencies
Federal outlays to guaranty agencies include administrative cost allowances, loan processing and issuing fees,
account maintenance fees, loan advances, reinsurance default claims, and refunds of excess reserves.
� In FY 1990-FY 1999, annual administrative cost allowances fluctuated from a low of $105 million in FY
1991 to a high of $312 million in FY 1994. In FY 2000, administrative cost allowances were not applicable.
� In FY 2000, $93 million in loan processing and issuing fees were paid to guaranty agencies. In FY 1999 and
FY 2000, $188 million and $204 million were paid in account maintenance fees, respectively.
� Reinsurance default claims fluctuated from a low of approximately $2.2 billion in FY 2000 to a high of
$3.2 billion in FY 1991. In FY 2000, reinsurance default claims accounted for 33.8 percent of total federal
outlays. (See table A.)
� Refunds in excess of reserves were only reported in FY 1992 and FY 1993, when they increased from $8
to $14 million.
Collections cost
� Collections costs were $11 million in FY 1990 and peaked at $138 million in FY 1996. In FY 1997-FY 2000,
collections cost fluctuated from a low of $51 million in FY 1998 to a high of $97 million in FY 2000. In
FY 2000, collections cost accounted for 1.5 percent of total federal outlays. (See table A.)
Federal income/receipts
Federal income includes FISLP insurance premiums, FISLP collections, guaranty agency reimbursements,
advances returned, excess reserves, reinsurance fees, origination and other fees, IRS offsets-DCS assigned
loans, IRS offsets-GA, mandatory assignment collections, and rehabilitation loans.
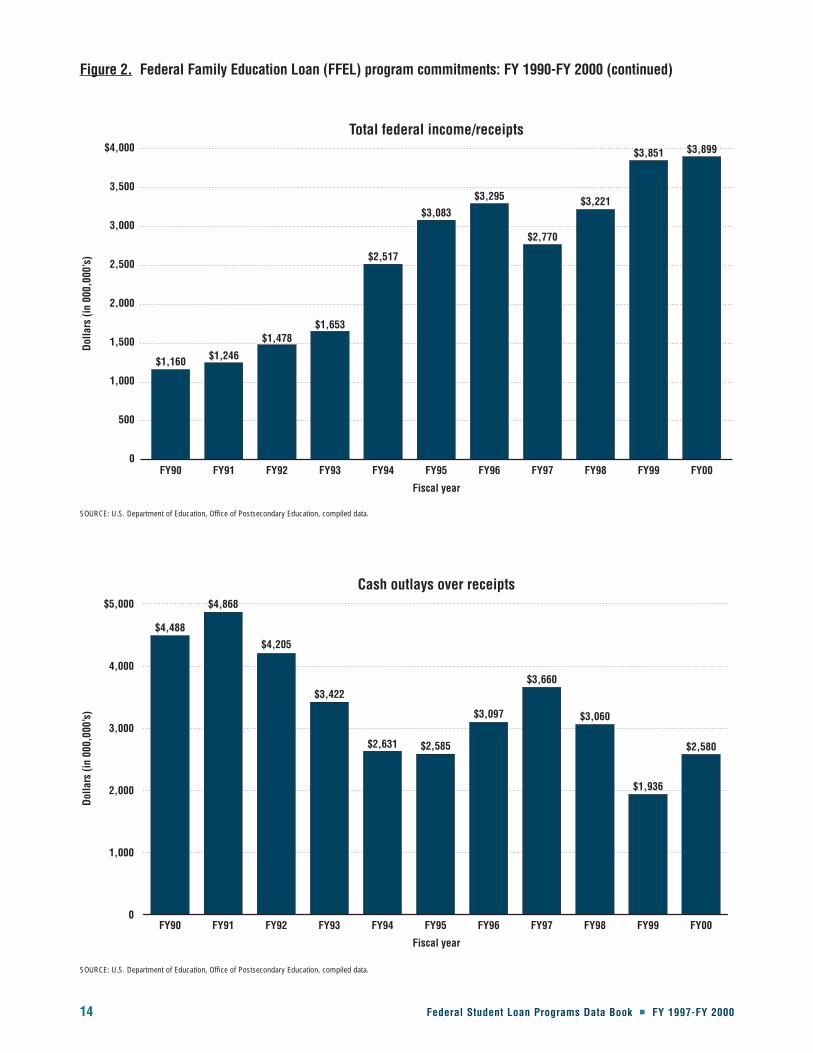
� In FY 1990-FY 1996, total federal income/receipts for the FFEL program increased annually from
$1.2 billion in FY 1990 to $3.3 billion in FY 1996. After lower levels of total federal income/receipts in
FY 1997 ($2.8 billion) and FY 1998 ($3.2 billion), this figure rose to $3.9 billion in FY 1999. In FY 2000,
total federal income/receipts remained at $3.9 billion.
� The two major sources of FFEL program federal income are guaranty agency reimbursements and
origination and other fees. In FY 1999, guaranty agency reimbursements were $1.4 billion, and origination
and other fees were $839 million. Receipts from these two sources accounted for 57.6 percent of total
federal income in FY 1999. (See table B.)
� In FY 1990-FY 1996, annual FISLP collections fluctuated between a low of $33 million in FY 1992 to a high
of $55 million in FY 1996. FISLP collections were not reported in FY 1997-FY 2000.
� Annual income from guaranty agency reimbursements increased steadily from $466 million in FY 1994 to
$1.4 billion in FY 1999. In FY 1999, guaranty agency reimbursements accounted for 35.8 percent of total
federal income. (See table B.)
� Returned advances, excess reserves, and reinsurance fees all contributed only slightly to total federal income
in FY 1990-FY 2000. (See table B.) Beginning in FY 1994, receipts from returned advances were zero, and
Table 1.(continued)
Federal Student Loan Programs Data Book � FY 1997-FY 2000 9
Summ
ary Information

10 Federal Student Loan Programs Data Book � FY 1997-FY 2000
Table 1.(continued)
beginning in FY 1992, receipts from excess reserves were zero. Beginning in FY 1996, receipts from
reinsurance fees were zero.
� Between FY 1990-FY 2000, annual receipts from origination and other fees fluctuated from a low of $395
million in FY 1990 to a high of $1.1 billion in FY 1994. In FY 2000, receipts from origination and other fees
was $941 million and accounted for 37.7 percent of annual federal income. (See table B.)
� Annual federal income from IRS offset-DCS fluctuated from $12 million to $35 million in FY 1990-
FY 1993 and then was much higher, fluctuating from $211 million to $452 million in FY 1994-FY 1999. In
FY 2000, federal income from IRS offset-DCS declined slightly to $411 million. However, IRS offset-DCS
accounted for an increasing proportion of annual federal income from FY 1996 (6.6 percent) to FY 2000
(16.4 percent). (See table B.)
� In FY 1990-FY 2000, annual federal income from IRS offset-GA fluctuated from a low of $216 million in
FY 1990 to a high of $570 million in FY 1999. In FY 2000, federal income from IRS offset-GA was
$482 million and accounted for 19.3 percent of federal income. (See table B.)
� Mandatory assignment collections increased dramatically from $5 million in FY 1990 to $799 in FY 1996.
Mandatory assignment collections then decreased in FY 1997 ($467 million) and FY 1998 ($428 million),
but increased in FY 1999 ($612 million) and FY 2000 ($665 million). Mandatory assignment collections
accounted for 26.6 percent of federal income in FY 2000 (see table B.)
Cash outlays over receipts
� The total cash outlays over receipts (total federal outlays minus total federal income) were approximately
$4.5 billion in FY 1990 and $2.6 billion in FY 2000. The highest level of outlays over receipts was $4.9 billion
in FY 1991, and the lowest level was $1.9 billion in FY 1999.
Table B. Federal income sources as a percent of total federal income/receipts: FY 1990-FY 2000 (subset of table 1)
FY90 FY91 FY92 FY93 FY94 FY95 FY96 FY97 FY98 FY99 FY00
Federal income/receipts
FISLP insurance premium — — — — — — — — — — —
FISLP collections 4.4% 3.5% 2.2% 2.6% 1.8% 1.5% 1.7% 0.0% 0.0% 0.0% 0.0%
Guaranty agency reimbursements 32.9 29.5 30.4 32.3 18.5 26.2 27.4 37.7 42.4 35.8 —
Advances returned 1.2 0.6 0.1 0.1 0.0 0.0 0.0 0.0 0.0 0.0 0.0
Excess reserves 2.9 0.1 0.0 0.0 0.0 0.0 0.0 0.0 0.0 0.0 0.0
Reinsurance fees 3.6 2.4 3.3 2.0 1.8 0.1 0.0 0.0 0.0 0.0 0.0
Origination and other fees 34.1 35.4 28.6 30.9 43.8 34.6 29.9 27.2 24.8 21.8 37.7
IRS offset – DCS assigned loans 1.6 1.0 1.5 2.1 8.4 7.7 6.6 8.3 8.2 11.7 16.4
IRS offset – GA 18.6 26.2 31.5 25.1 15.2 10.6 9.7 9.9 11.3 14.8 19.3
Mandatory assign. coll. 0.4 0.9 2.0 4.8 10.5 18.5 24.2 16.9 13.3 15.9 26.6
Rehabilitation loans 0.2 0.5 0.4 0.2 0.0 0.9 0.5 — — — —
Total federal income/receipts 100.0 100.0 100.0 100.0 100.0 100.0 100.0 100.0 100.0 100.0 100.0
— Not applicable.
* Costs from FY90 through FY00 include FFEL program and FISLP as well as computer costs and commissions on contract collections.
NOTES: DCS assigned loans are handled by OSFAP/Students Channel, collections. Details may not add to total due to rounding. Calculations are based on numbers before rounding.
SOURCE: U.S. Department of Education, Office of Postsecondary Education, compiled data.

Federal Student Loan Programs D
ata Book �
FY 1997-FY 2000 11
Summary Information
Table 1. Federal Family Education Loan (FFEL) program executive summary: FY 1966-FY 2000
($ in 000,000’s unless otherwise noted)
FY66-89 FY90 FY91 FY92 FY93 FY94 FY95 FY96 FY97 FY98 FY99 FY00 Cumulative
Loan volume commitments (excludes consolidations)
Number of loans (in 000’s) 48,156 4,493 4,818 5,130 5,647 6,745 5,869 5,336 5,681 5,809 5,859 6,333 109,875
Dollar amount $101,674 $12,291 $13,500 $14,749 $17,863 $23,068 $20,951 $19,728 $21,659 $22,497 $23,324 $25,656 $316,959
Actual average loan (in units) — 2,734 2,804 2,875 3,163 3,420 3,570 3,697 3,810 3,872 3,959 4,051 —
Defaults
FISLP/guaranty agency payments to lenders $10,470 $2,680 $3,223 $2,655 $2,497 $2,402 $2,293 $2,662 $2,990 $2,943 $2,027 $2,102 $38,945
Federal outlays
To lenders
Interest benefits $14,525 $1,512 $1,688 $2,056 $1,706 $2,082 $2,186 $2,688 $2,437 $2,397 $2,323 $2,240 $37,840
Special allowance 12,508 1,425 972 231 107 145 615 390 249 268 222 1,358 18,490
Death and disability claims 273 57 62 94 101 118 150 168 187 193 235 213 1,851
Bankruptcy claims 233 9 13 94 279 26 4 45 97 106 135 85 1,126
FISLP default claims 1,265 17 17 12 9 7 6 8 — — — — 1,340
To guaranty agencies
Administrative cost allowance $753 $133 $105 $145 $177 $312 $221 $167 $150 $170 $102 — $2,435
Loan processing & issuing fee — — — — — — — — — — — $93 93
Account maintenance fee — — — — — — — — — — $188 $204 392
Loan advances 205 — — — — — — — — — — — 205
Reinsurance default claims 8,624 2,484 3,245 3,031 2,674 2,408 2,367 2,788 3,231 3,096 2,494 2,189 38,631
Refund of excess reserves — — — 8 14 — — — — — — — 22
Collections cost* $166 $11 $12 $12 $8 $50 $119 $138 $79 $51 $88 $97 $831
Total FFEL program outlays 38,552 5,648 6,114 5,683 5,075 5,148 5,667 6,392 6,430 6,281 5,787 6,479 $103,256
Federal income/receipts
FISLP insurance premium $42 — — — — — — — — — — — $42
FISLP collections 708 51 43 33 43 44 47 55 0 0 0 0 1,024
Guaranty agency reimbursements 1,571 382 368 449 534 466 808 904 1,045 1,367 1,378 1,400 10,672
Advances returned 141 14 7 2 1 0 0 0 0 0 0 0 165
Excess reserves 138 34 1 0 0 0 0 0 0 0 0 0 173
Reinsurance fees 97 42 30 49 33 45 3 0 0 0 0 0 299
Origination and other fees 2,379 395 441 422 510 1,103 1,066 986 754 799 839 941 10,635
IRS offset – DCS assigned loans 120 19 12 22 35 211 236 216 231 263 452 411 2,228
IRS offset – GA 369 216 327 466 415 383 327 319 273 364 570 482 4,511
Mandatory assign. coll. — 5 11 29 79 265 569 799 467 428 612 665 3,929
Rehabilitation loans 1 2 6 6 3 0 27 16 — — — — 61
Total federal income/receipts 5,566 1,160 1,246 1,478 1,653 2,517 3,083 3,295 2,770 3,221 3,851 3,899 $33,739
Cash outlays over receipts 32,986 4,488 4,868 4,205 3,422 2,631 2,585 3,097 3,660 3,060 1,936 2,580 $69,517
— Not applicable.
* Costs from FY86 through FY00 include FFEL program and FISLP.
NOTES: Rehabilitation loans are included in the figures shown for guaranty agency reimbursements. DCS assigned loans are handled by OSFAP/Students Channel, Collections. Details may not add to total due to rounding. Calculations are based on numbers before rounding. 0 indicates a number less than 500,000. Data for earlier years appear in Table A-1 in appendix I.
SOURCE: U.S. Department of Education, Office of Postsecondary Education, compiled data.
Fiscal year
Number of loans
Loan
s (in
000
’s)
0
1,000
2,000
3,000
4,000
5,000
6,000
7,000
8,000
4,4934,818
5,130
5,647
6,745
5,869
5,3365,681 5,809 5,859
6,333
FY00FY99FY98FY97FY96FY95FY94FY93FY92FY91FY90
Fiscal year
Dollar amount
Dolla
rs (i
n 00
0,00
0’s)
0
5,000
10,000
15,000
20,000
25,000
$30,000
$12,291$13,500
$14,749
$17,863
$23,068
$20,951$19,728
$21,659$22,497
$23,324
$25,656
FY00FY99FY98FY97FY96FY95FY94FY93FY92FY91FY90
Figure 2. Family Education Loan (FFEL) program commitments: FY 1990-FY 2000
SOURCE: U.S. Department of Education, Office of Postsecondary Education, compiled data.
SOURCE: U.S. Department of Education, Office of Postsecondary Education, compiled data.
12 Federal Student Loan Programs Data Book � FY 1997-FY 2000

Fiscal year
Average loan
Dolla
rs
0
1,000
2,000
3,000
4,000
$5,000
$2,734 $2,804 $2,875
$3,163$3,420
$3,570$3,697
$3,810 $3,872 $3,959 $4,051
FY00FY99FY98FY97FY96FY95FY94FY93FY92FY91FY90
Fiscal year
Total federal outlays to lenders and to guaranty agencies
Dolla
rs (i
n 00
0,00
0’s)
0
1,000
2,000
3,000
4,000
5,000
6,000
$7,000
$5,648
$6,114
$5,683
$5,075 $5,148
$5,667
$6,392 $6,430$6,281
$5,787
$6,479
FY00FY99FY98FY97FY96FY95FY94FY93FY92FY91FY90
Figure 2. Federal Family Education Loan (FFEL) program commitments: FY 1990-FY 2000 (continued)
SOURCE: U.S. Department of Education, Office of Postsecondary Education, compiled data.
SOURCE: U.S. Department of Education, Office of Postsecondary Education, compiled data.
Federal Student Loan Programs Data Book � FY 1997-FY 2000 13
Summ
ary Information
Fiscal year
Total federal income/receipts
Dolla
rs (i
n 00
0,00
0’s)
0
500
1,000
1,500
2,000
2,500
3,000
3,500
$4,000
$1,160 $1,246
$1,478$1,653
$2,517
$3,083
$3,295
$2,770
$3,221
$3,851 $3,899
FY00FY99FY98FY97FY96FY95FY94FY93FY92FY91FY90
Fiscal year
Cash outlays over receipts
Dolla
rs (i
n 00
0,00
0’s)
0
1,000
2,000
3,000
4,000
$5,000
$4,488
$4,868
$4,205
$3,422
$2,631 $2,585
$3,097
$3,660
$3,060
$1,936
$2,580
FY00FY99FY98FY97FY96FY95FY94FY93FY92FY91FY90
Figure 2. Federal Family Education Loan (FFEL) program commitments: FY 1990-FY 2000 (continued)
SOURCE: U.S. Department of Education, Office of Postsecondary Education, compiled data.
SOURCE: U.S. Department of Education, Office of Postsecondary Education, compiled data.
14 Federal Student Loan Programs Data Book � FY 1997-FY 2000
Summ
ary Information
Federal Student Loan Programs Data Book � FY 1997-FY 2000 15
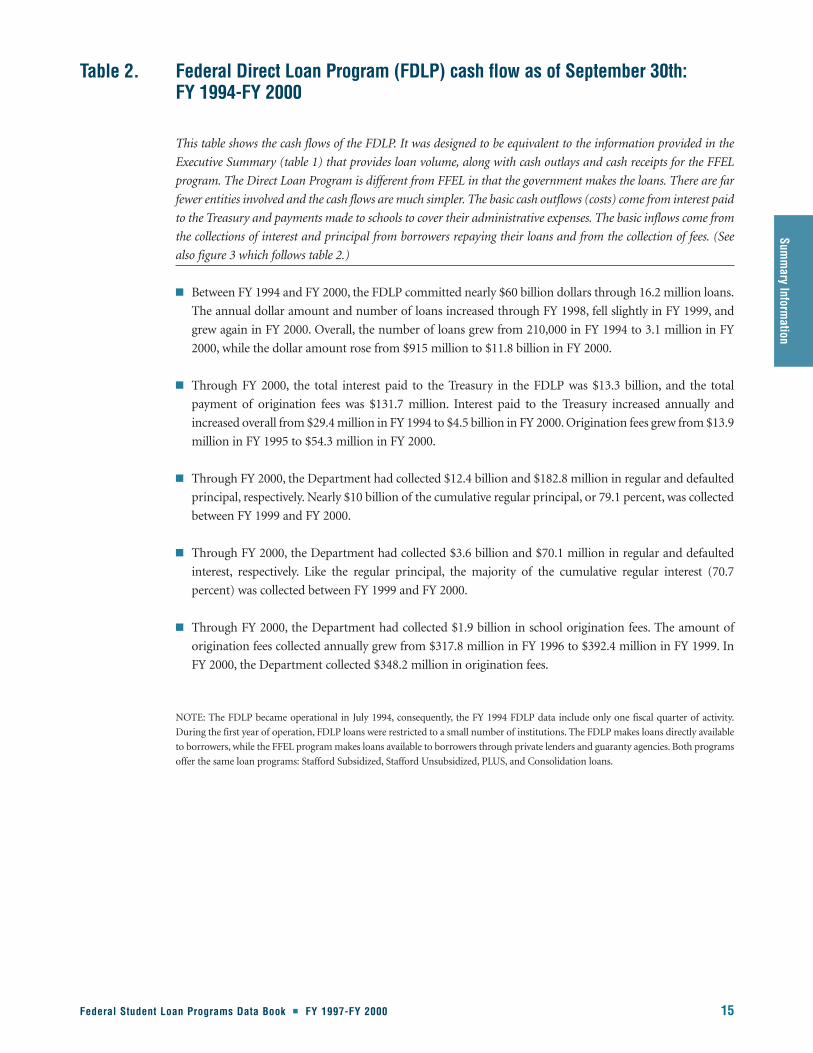
Table 2. Federal Direct Loan Program (FDLP) cash flow as of September 30th: FY 1994-FY 2000
This table shows the cash flows of the FDLP. It was designed to be equivalent to the information provided in the
Executive Summary (table 1) that provides loan volume, along with cash outlays and cash receipts for the FFEL
program. The Direct Loan Program is different from FFEL in that the government makes the loans. There are far
fewer entities involved and the cash flows are much simpler. The basic cash outflows (costs) come from interest paid
to the Treasury and payments made to schools to cover their administrative expenses. The basic inflows come from
the collections of interest and principal from borrowers repaying their loans and from the collection of fees. (See
also figure 3 which follows table 2.)
� Between FY 1994 and FY 2000, the FDLP committed nearly $60 billion dollars through 16.2 million loans.
The annual dollar amount and number of loans increased through FY 1998, fell slightly in FY 1999, and
grew again in FY 2000. Overall, the number of loans grew from 210,000 in FY 1994 to 3.1 million in FY
2000, while the dollar amount rose from $915 million to $11.8 billion in FY 2000.
� Through FY 2000, the total interest paid to the Treasury in the FDLP was $13.3 billion, and the total
payment of origination fees was $131.7 million. Interest paid to the Treasury increased annually and
increased overall from $29.4 million in FY 1994 to $4.5 billion in FY 2000. Origination fees grew from $13.9
million in FY 1995 to $54.3 million in FY 2000.
� Through FY 2000, the Department had collected $12.4 billion and $182.8 million in regular and defaulted
principal, respectively. Nearly $10 billion of the cumulative regular principal, or 79.1 percent, was collected
between FY 1999 and FY 2000.
� Through FY 2000, the Department had collected $3.6 billion and $70.1 million in regular and defaulted
interest, respectively. Like the regular principal, the majority of the cumulative regular interest (70.7
percent) was collected between FY 1999 and FY 2000.
� Through FY 2000, the Department had collected $1.9 billion in school origination fees. The amount of
origination fees collected annually grew from $317.8 million in FY 1996 to $392.4 million in FY 1999. In
FY 2000, the Department collected $348.2 million in origination fees.
NOTE: The FDLP became operational in July 1994, consequently, the FY 1994 FDLP data include only one fiscal quarter of activity.
During the first year of operation, FDLP loans were restricted to a small number of institutions. The FDLP makes loans directly available
to borrowers, while the FFEL program makes loans available to borrowers through private lenders and guaranty agencies. Both programs
offer the same loan programs: Stafford Subsidized, Stafford Unsubsidized, PLUS, and Consolidation loans.

16Federal Student Loan Program
s Data Book
�FY 1997-FY 2000
Table 2. Federal Direct Loan Program (FDLP) cash flow as of September 30th: FY 1994-FY 2000
($ in 000’s)
FY94 *FY95 *FY96 FY97 FY98 FY99 FY00 Cumulative
Loan volume commitments
Number of loans (in 000’s) 210 1,290 2,616 2,998 3,078 2,957 3,066 16,216
Dollar amount $915,024 $5,101,843 $9,371,572 $10,917,748 $11,125,252 $10,703,352 $11,833,438 $59,968,230
Costs+
Interest paid to Treasury 29,450 383,169 749,943 1,732,873 2,320,155 3,616,378 4,465,364 $13,297,332
Payment of origination fees to institutions — 13,928 13,345 6,966 14,042 29,195 54,262 $131,738
Inflows
Collections
Principal
Regular $34 $29,397 $211,480 $643,325 $1,718,290 $5,512,905 $4,329,019 $12,444,450
Defaulted — — 70 515 9,470 50,461 122,267 $182,782
Interest
Regular — $14,498 $114,768 $305,956 $605,530 $1,058,939 $1,453,886 $3,553,577
Defaulted — — 22 357 4,970 18,882 45,787 $70,018
Origination fees $15,266 $81,105 $317,758 $371,860 $389,288 $392,401 $348,224 $1,915,902
Other fees
Regular — — — — — — — —
Defaulted — — $14 $65 $1,016 $6,670 $16,100 $23,865
— Not applicable.
* The cost data for FY95 and FY96 have been revised from previously published figures.
+ Cost and collection data are from the financial statements and include Consolidations.
NOTES: The FDLP became operational in July 1994, consequently, the FY94 FDLP data include only one fiscal quarter of activity. During the first year of operation, FDLP loans were restricted to a small number of institutions.
SOURCE: U.S. Department of Education, Office of Postsecondary Education, Direct Loan/Loan Origination System.

Fiscal year
Number of loans
Loan
s (in
000
’s)
0
500
1,000
1,500
2,000
2,500
3,000
3,500
4,000
210
1,290
2,616
2,998 3,0782,957
3,066
FY00FY99FY98FY97FY96FY95FY94
Fiscal year
Dollar amount
Dolla
rs (i
n 00
0,00
0’s)
0
2,000
4,000
6,000
8,000
10,000
12,000
$14,000
$915
$5,102
$9,372
$10,918 $11,125$10,703
$11,833
FY00FY99FY98FY97FY96FY95FY94
Figure 3. Federal Direct Loan Program (FDLP) commitments: FY 1994-FY 2000
SOURCE: U.S. Department of Education, Office of Postsecondary Education, Direct Loan/Loan Origination System.
SOURCE: U.S. Department of Education, Office of Postsecondary Education, Direct Loan/Loan Origination System.
Federal Student Loan Programs Data Book � FY 1997-FY 2000 17
Summ
ary Information

Table 3. Federal Direct Loan Program (FDLP) portfolio status as of September 30th: FY 1994-FY 2000
18 Federal Student Loan Programs Data Book � FY 1997-FY 2000
This table shows the portfolio of the FDLP as it stood at the end of each fiscal year. It provides a summary of the
changes to the portfolio including disbursements, write-offs for death, disability and bankruptcy, collection of
principal, and capitalized interest. This table also provides the percentage outstanding by loan status. Finally, the
proportion of loans transferred to the Debt Collection System is shown.
� FDLP started in FY 1994 on a limited basis. In FY 1995, booked disbursements for the program totaled
$2.7 billion, but by FY 1999, booked disbursements had grown to $18.3 billion. In FY 2000 booked
disbursements fell to $16.5 billion.
� By FY 2000, the FDLP program had written off approximately $62 million for Death Disability and
Bankruptcy (DD&B), and collected principal of $4.3 billion.
� As of September 2000, approximately $1.4 billion in loans (or 8.4 percent) had defaulted and were
transferred to the Department’s Debt Collection System.
NOTE: FDLP loan data in FY 1994 only include one-quarter of that fiscal year, and FDLP loans were restricted to a small number of
institutions.

Federal Student Loan Programs D
ata Book �
FY 1997-FY 2000 19
Summary Information
Table 3. Federal Direct Loan Program (FDLP) portfolio status as of September 30th: FY 1994-FY 2000
($ in 000,000’s)
FY94 FY95 FY96 FY97 FY98 FY99 FY00
Booked disbursements1 $151 $2,721 $11,735 $10,451 $12,314 $18,267 $16,504
Less:
Loans written off (DD&B) — $0 $4 $13 $24 $39 $62
Collection of principal — 29 241 643 1,718 5,513 4,329
Plus:
Capitalized interest — $1 $30 $140 $359 $579 $723
Outstanding balance2 151 2,693 11,520 9,935 10,931 13,294 12,836
Percent outstanding by loan status
In school 91% 70% 61% 52% 43% 32% 28%
In grace 0 12 16 14 13 11 10
In repayment 9 18 23 34 44 56 63
Percent defaults transferred to debt collection3 0.00% 0.00% 0.02% 0.82% 2.40% 4.20% 8.37%
— Not applicable.1 Does not include funds drawn down, but not disbursed at the end of the fiscal year.2 The outstanding loan balance includes defaulted loans that have been transferred to the Department’s Debt Collection System.3 This represents the cumulative dollar amount of loans that have defaulted and have been transferred to our Debt Collection System as a proportion of the cumulative loans made to date (dollars disbursed).
As of September 2000, $1.38 billion in loans had defaulted and had been transferred.
NOTES: Includes Direct Consolidation loans. Details may not add to totals due to rounding. Calculations are based on numbers before rounding. $0 indicates a number less than $500,000.0% indicates a number less than 0.5%. 0.00% indicates a number less than 0.005%. FDLP loan data in FY94 only include one-quarter of that fiscal year, and FDLP loans were restricted to a small number of institutions.
SOURCE: U.S. Department of Education, Office of Postsecondary Education, Direct Loan/Loan Origination System.
20 Federal Student Loan Programs Data Book � FY 1997-FY 2000
Table 4. Federal Family Education Loan (FFEL) program and Federal Direct Loan Program (FDLP) comparison of committed loan volume: FY 1997-FY 2000
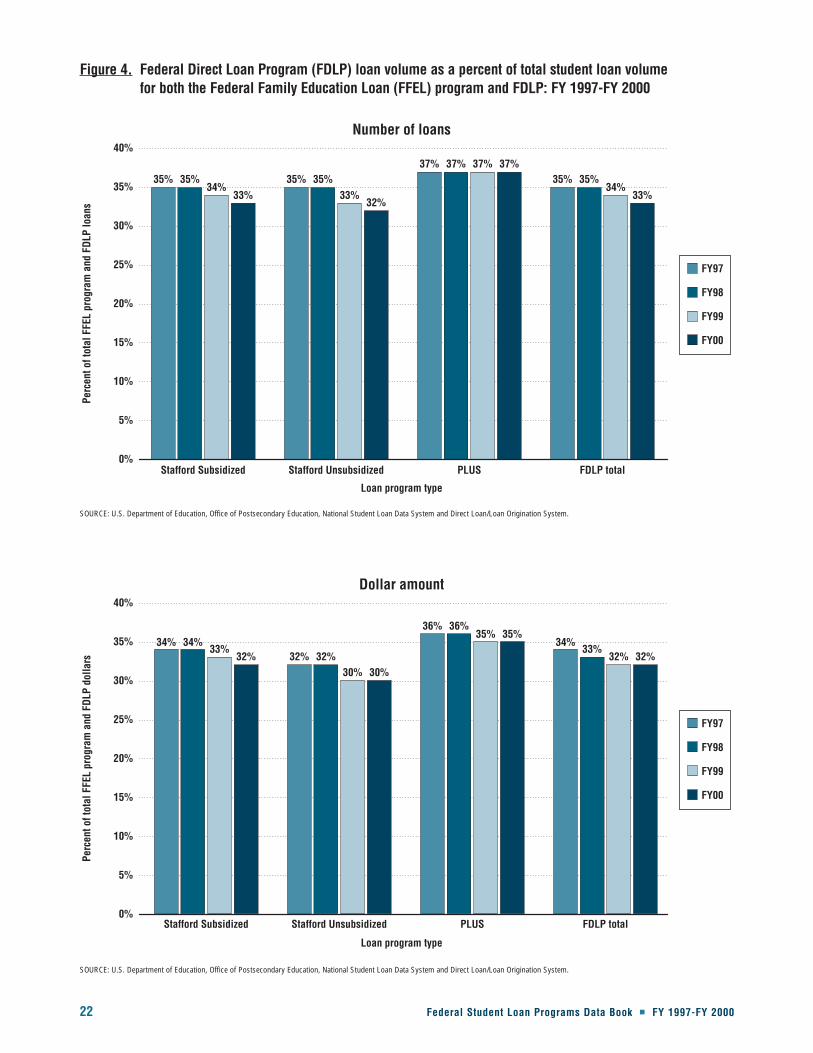
This table contrasts FFEL program and FDLP activity in FY 1997-FY 2000. It compares the number and dollar
amount of loans committed through Stafford Subsidized, Stafford Unsubsidized, and Parent Loans for
Undergraduate Students (PLUS) programs. FDLP loan volume is also reported as a percent of the total FFEL
program and FDLP loan volume committed. (See also figure 4 which follows table 4.)
� From FY 1997 to FY 2000, the number of FFEL loans increased from 5.7 million to 6.3 million, an increase
of 11.5 percent. The total FFEL dollar volume committed grew from $21.7 billion to $25.7 billion, an
increase of 18.5 percent. The FDLP program grew also, but at a slower rate. The number of FDLP loans
increased from 3.0 million to 3.1 million, an increase of 2.3 percent, and the total FDLP dollar volume
committed grew from $10.9 billion to $11.8 billion, an increase of 8.4 percent.
� For FY 1997-FY 2000, among the three types of loans, the Stafford Subsidized loan program committed
the most dollars annually. In FY 2000, the Stafford Subsidized loan program committed $18.6 billion in
both the FFEL program and the FDLP, while the Stafford Unsubsidized loan program committed $14.9
billion, and the PLUS program committed $4.0 billion.
� FDLP loan commitments as a proportion of total dollars committed fell slightly, from 33.8 percent in
FY 1997 to 31.6 percent in FY 2000.
� Overall, the total dollar amount committed through the FFEL program and the FDLP increased
15.1 percent between FY 1997 and FY 2000 from $32.6 billion to $37.5 billion. However, the total number
of loans increased by 8.3 percent during this time from 8.6 million to 9.4 million.

Federal Student Loan Programs D
ata Book �
FY 1997-FY 2000 21
Summary Information
Table 4. Federal Family Education Loan (FFEL) program and Federal Direct Loan Program (FDLP) comparison of committed loan volume: FY 1997-FY 2000
FFEL program FDLP
Loans Loans Total loans (FFEL program and FDLP) FDLP(in 000’s) (in 000’s) (in 000’s) as percent of total loans
Type of program FY97 FY98 FY99 FY00 FY97 FY98 FY99 FY00 FY97 FY98 FY99 FY00 FY97 FY98 FY99 FY00
Stafford Subsidized 3,401 3,408 3,339 3,520 1,792 1,803 1,691 1,709 5,194 5,210 5,030 5,229 34.7% 34.8% 33.8% 32.7%
Stafford Unsubsidized 1,968 2,068 2,175 2,456 1,025 1,081 1,079 1,148 2,993 3,149 3,254 3,604 34.5 34.5 33.3 31.9
PLUS 312 334 345 356 181 195 187 208 493 528 532 564 37.3 37.2 37.4 36.9
Total 5,681 5,809 5,859 6,333 2,998 3,078 2,957 3,066 8,679 8,887 8,816 9,398 34.8% 34.8% 33.8% 32.6%
Dollars Dollars Total dollars (FFEL program and FDLP) FDLP
(in 000,000’s) (in 000,000’s) (in 000,000’s) as percent of total dollars
FY97 FY98 FY99 FY00 FY97 FY98 FY99 FY00 FY97 FY98 FY99 FY00 FY97 FY98 FY99 FY00
Stafford Subsidized $11,985 $12,027 $11,862 $12,564 $6,233 $6,141 $5,686 $6,033 $18,218 $18,168 $17,548 $18,597 34.4% 34.0% 32.6% 32.4%
Stafford Unsubsidized 7,689 8,275 9,079 10,482 3,617 3,787 3,855 4,408 11,306 12,062 12,934 14,890 32.2 31.6 29.9 29.6
PLUS 1,985 2,194 2,383 2,610 1,068 1,198 1,162 1,393 3,053 3,392 3,545 4,003 35.6 35.7 35.2 34.8
Total $21,659 $22,497 $23,324 $25,656 $10,918 $11,125 $10,703 $11,833 $32,577 $33,623 $34,027 $37,490 33.8% 33.3% 31.8% 31.6%
NOTES: Details may not add to totals due to rounding. Calculations are based on numbers before rounding.
SOURCE: U.S. Department of Education, Office of Postsecondary Education, National Student Loan Data System and Direct Loan/Loan Origination System.
Loan program type
Number of loans
Perc
ent o
f tot
al F
FEL
prog
ram
and
FDL
P lo
ans
FY97
FY98
FY99
FY00
0%
5%
10%
15%
20%
25%
30%
35%
40%
33%32%
37%
33%34%
33%
37%
34%35% 35%
37%35%35% 35%
37%35%
FDLP totalPLUSStafford UnsubsidizedStafford Subsidized
Loan program type
Dollar amount
Perc
ent o
f tot
al F
FEL
prog
ram
and
FDL
P do
llars
FY97
FY98
FY99
FY00
0%
5%
10%
15%
20%
25%
30%
35%
40%
32%30%
35%
32%33%
30%
35%
32%34%
32%
36%
33%34%
32%
36%34%
FDLP totalPLUSStafford UnsubsidizedStafford Subsidized
Figure 4. Federal Direct Loan Program (FDLP) loan volume as a percent of total student loan volume for both the Federal Family Education Loan (FFEL) program and FDLP: FY 1997-FY 2000
SOURCE: U.S. Department of Education, Office of Postsecondary Education, National Student Loan Data System and Direct Loan/Loan Origination System.
SOURCE: U.S. Department of Education, Office of Postsecondary Education, National Student Loan Data System and Direct Loan/Loan Origination System.
22 Federal Student Loan Programs Data Book � FY 1997-FY 2000
Loan Volume Com
mitm
ents
Federal Student Loan Programs Data Book � FY 1997-FY 2000 23
Part IIFFEL Program and FDLP Loan Volume Commitments
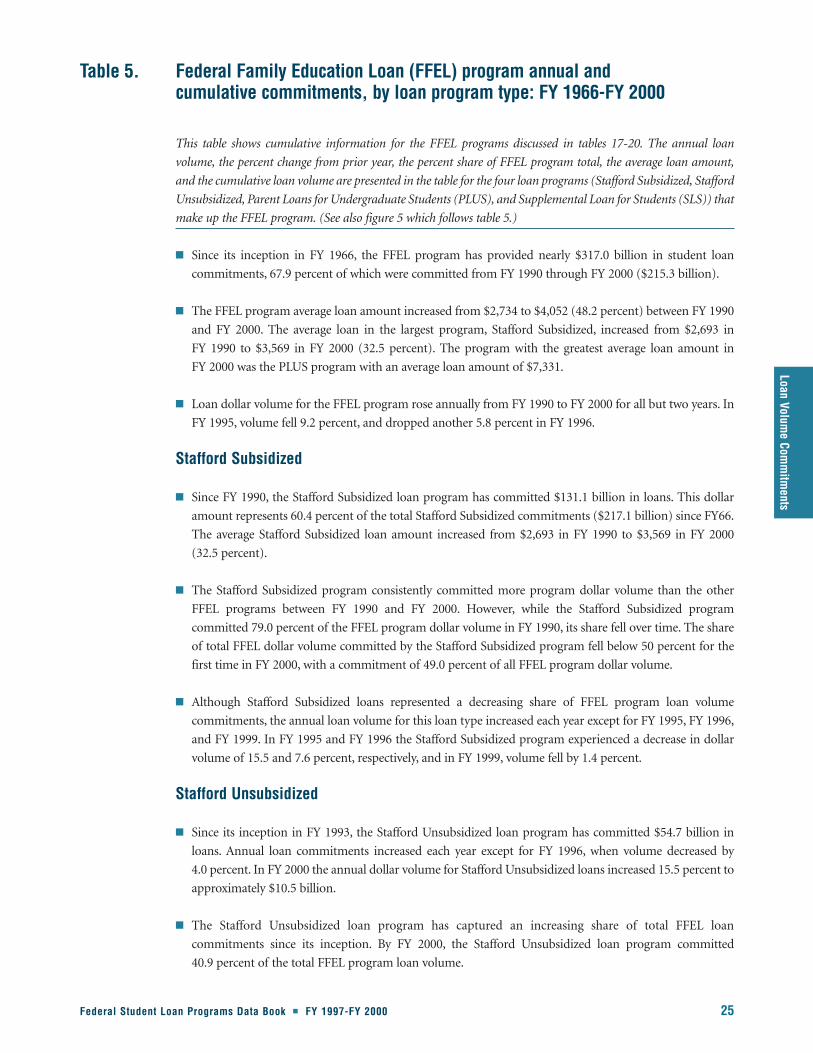
Loan Volume Com
mitm
ents
Federal Student Loan Programs Data Book � FY 1997-FY 2000 25
This table shows cumulative information for the FFEL programs discussed in tables 17-20. The annual loan
volume, the percent change from prior year, the percent share of FFEL program total, the average loan amount,
and the cumulative loan volume are presented in the table for the four loan programs (Stafford Subsidized, Stafford
Unsubsidized, Parent Loans for Undergraduate Students (PLUS), and Supplemental Loan for Students (SLS)) that
make up the FFEL program. (See also figure 5 which follows table 5.)
� Since its inception in FY 1966, the FFEL program has provided nearly $317.0 billion in student loan
commitments, 67.9 percent of which were committed from FY 1990 through FY 2000 ($215.3 billion).
� The FFEL program average loan amount increased from $2,734 to $4,052 (48.2 percent) between FY 1990
and FY 2000. The average loan in the largest program, Stafford Subsidized, increased from $2,693 in
FY 1990 to $3,569 in FY 2000 (32.5 percent). The program with the greatest average loan amount in
FY 2000 was the PLUS program with an average loan amount of $7,331.
� Loan dollar volume for the FFEL program rose annually from FY 1990 to FY 2000 for all but two years. In
FY 1995, volume fell 9.2 percent, and dropped another 5.8 percent in FY 1996.
Stafford Subsidized
� Since FY 1990, the Stafford Subsidized loan program has committed $131.1 billion in loans. This dollar
amount represents 60.4 percent of the total Stafford Subsidized commitments ($217.1 billion) since FY66.
The average Stafford Subsidized loan amount increased from $2,693 in FY 1990 to $3,569 in FY 2000
(32.5 percent).
� The Stafford Subsidized program consistently committed more program dollar volume than the other
FFEL programs between FY 1990 and FY 2000. However, while the Stafford Subsidized program
committed 79.0 percent of the FFEL program dollar volume in FY 1990, its share fell over time. The share
of total FFEL dollar volume committed by the Stafford Subsidized program fell below 50 percent for the
first time in FY 2000, with a commitment of 49.0 percent of all FFEL program dollar volume.
� Although Stafford Subsidized loans represented a decreasing share of FFEL program loan volume
commitments, the annual loan volume for this loan type increased each year except for FY 1995, FY 1996,
and FY 1999. In FY 1995 and FY 1996 the Stafford Subsidized program experienced a decrease in dollar
volume of 15.5 and 7.6 percent, respectively, and in FY 1999, volume fell by 1.4 percent.
Stafford Unsubsidized
� Since its inception in FY 1993, the Stafford Unsubsidized loan program has committed $54.7 billion in
loans. Annual loan commitments increased each year except for FY 1996, when volume decreased by
4.0 percent. In FY 2000 the annual dollar volume for Stafford Unsubsidized loans increased 15.5 percent to
approximately $10.5 billion.
� The Stafford Unsubsidized loan program has captured an increasing share of total FFEL loan
commitments since its inception. By FY 2000, the Stafford Unsubsidized loan program committed
40.9 percent of the total FFEL program loan volume.
Table 5. Federal Family Education Loan (FFEL) program annual and cumulative commitments, by loan program type: FY 1966-FY 2000
26 Federal Student Loan Programs Data Book � FY 1997-FY 2000
� From FY 1993 to FY 2000 the Stafford Unsubsidized average loan amount grew from $2,411 to $4,268—a
77.0 percent increase. In FY 2000 the average Stafford Unsubsidized loan was larger than Stafford
Subsidized loan ($4,268 vs. $3,569).
Parent Loans for Undergraduate Students (PLUS)
� Since FY 1990, the PLUS loan program has committed $21.3 billion in loans. This dollar amount represents
88.1 percent of the total PLUS commitments ($21.3 billion) since the program’s inception in FY 1981.
� Between FY 1990 and FY 2000, the PLUS loan program captured an increasing portion of the total FFEL
program commitments. In FY 1990, the PLUS program held 7.1 percent of total FFEL commitments. In
FY 2000 this figure had risen to 10.2 percent.
� The average PLUS loan amount increased from $3,210 in FY 1990 to $7,331 in FY 2000 (128.4 percent).
Supplemental Loan to Students (SLS)
� The Supplemental Loan to Students (SLS) program was discontinued at the end of FY 1994.
Table 5.(continued)

Federal Student Loan Programs Data Book � FY 1997-FY 2000 27
Loan Volume Com
mitm
ents
Table 5. Federal Family Education Loan (FFEL) program annual and cumulative commitments, by loan programtype: FY 1966-FY 2000
Annual Percent change Percent share Average Cumulativeloan volume from prior year of FFEL program loan loan volume
Loans Dollars Loans DollarsFiscal year (in 000’s) (in 000,000’s) Loans Dollars Loans Dollars Dollars (in 000’s) (in 000,000’s)
Stafford Subsidized
1966-89 39,689 $85,956 — — — — — 39,689 $85,956
1990 3,605 9,708 — — 80.3 79.0 2,693 43,294 95,664
1991 3,842 10,551 6.5 8.7 79.7 78.2 2,747 47,136 106,215
1992 3,997 11,249 4.0 6.6 77.9 76.3 2,815 51,133 117,464
1993 4,072 12,471 1.9 10.9 72.1 69.8 3,062 55,205 129,935
1994 4,523 14,735 11.1 18.1 67.1 63.9 3,258 59,728 144,670
1995 3,716 12,444 -17.8 -15.5 63.3 59.4 3,349 63,444 157,114
1996 3,288 11,501 -11.5 -7.6 61.6 58.3 3,498 66,732 168,616
1997 3,401 11,985 3.5 4.2 59.9 55.3 3,523 70,133 180,600
1998 3,408 12,027 0.2 0.4 58.7 53.5 3,531 73,541 192,628
1999 3,339 11,862 -2.0 -1.4 57.0 50.9 3,546 76,880 204,490
2000 3,520 12,564 5.4 5.9 55.6 49.0 3,569 80,400 217,053
Stafford Unsubsidized1
1993 423 $1,019 — — 7.5 5.7 2,411 423 $1,019
1994 1,319 4,739 212.0 365.0 19.6 20.5 3,593 1,742 5,758
1995 1,853 6,843 40.5 44.4 31.6 32.7 3,694 3,594 12,601
1996 1,769 6,568 -4.5 -4.0 33.2 33.3 3,712 5,364 19,169
1997 1,968 7,689 11.2 17.1 34.6 35.5 3,906 7,331 26,858
1998 2,068 8,275 5.1 7.6 35.6 36.8 4,003 9,399 35,134
1999 2,175 9,079 5.2 9.7 37.1 38.9 4,176 11,575 44,213
2000 2,456 10,482 12.9 15.5 38.8 40.9 4,268 14,031 54,695
PLUS
1981-89 882 $2,541 — — — — — 882 $2,541
1990 273 877 — — 6.1 7.1 3,210 1,155 3,419
1991 329 1,072 20.5 22.2 6.8 7.9 3,256 1,484 4,491
1992 393 1,293 19.4 20.6 7.7 8.8 3,289 1,878 5,784
1993 344 1,312 -12.6 1.5 6.1 7.3 3,817 2,222 7,096
1994 350 1,726 1.7 31.5 5.2 7.5 4,952 2,571 8,822
1995 300 1,663 -14.2 -3.6 5.1 7.9 5,544 2,871 10,485
1996 279 1,658 -7.0 -0.3 5.2 8.4 5,944 3,150 12,143
1997 312 1,985 11.7 19.7 5.5 9.2 6,368 3,462 14,128
1998 334 2,194 7.1 10.5 5.7 9.8 6,571 3,796 16,322
1999 345 2,383 3.3 8.6 5.9 10.2 6,837 4,140 18,705
2000 356 2,610 3.4 9.6 5.6 10.2 7,331 4,497 21,315
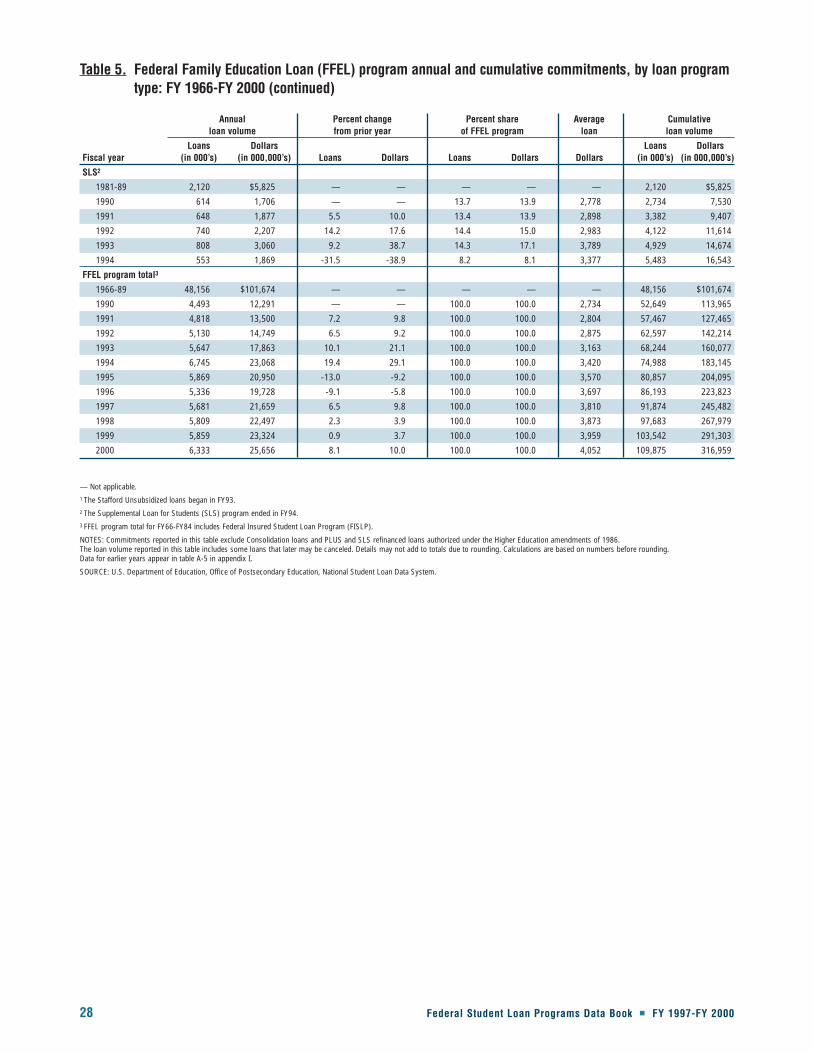
28 Federal Student Loan Programs Data Book � FY 1997-FY 2000
Table 5. Federal Family Education Loan (FFEL) program annual and cumulative commitments, by loan programtype: FY 1966-FY 2000 (continued)
Annual Percent change Percent share Average Cumulativeloan volume from prior year of FFEL program loan loan volume
Loans Dollars Loans DollarsFiscal year (in 000’s) (in 000,000’s) Loans Dollars Loans Dollars Dollars (in 000’s) (in 000,000’s)
SLS2
1981-89 2,120 $5,825 — — — — — 2,120 $5,825
1990 614 1,706 — — 13.7 13.9 2,778 2,734 7,530
1991 648 1,877 5.5 10.0 13.4 13.9 2,898 3,382 9,407
1992 740 2,207 14.2 17.6 14.4 15.0 2,983 4,122 11,614
1993 808 3,060 9.2 38.7 14.3 17.1 3,789 4,929 14,674
1994 553 1,869 -31.5 -38.9 8.2 8.1 3,377 5,483 16,543
FFEL program total3
1966-89 48,156 $101,674 — — — — — 48,156 $101,674
1990 4,493 12,291 — — 100.0 100.0 2,734 52,649 113,965
1991 4,818 13,500 7.2 9.8 100.0 100.0 2,804 57,467 127,465
1992 5,130 14,749 6.5 9.2 100.0 100.0 2,875 62,597 142,214
1993 5,647 17,863 10.1 21.1 100.0 100.0 3,163 68,244 160,077
1994 6,745 23,068 19.4 29.1 100.0 100.0 3,420 74,988 183,145
1995 5,869 20,950 -13.0 -9.2 100.0 100.0 3,570 80,857 204,095
1996 5,336 19,728 -9.1 -5.8 100.0 100.0 3,697 86,193 223,823
1997 5,681 21,659 6.5 9.8 100.0 100.0 3,810 91,874 245,482
1998 5,809 22,497 2.3 3.9 100.0 100.0 3,873 97,683 267,979
1999 5,859 23,324 0.9 3.7 100.0 100.0 3,959 103,542 291,303
2000 6,333 25,656 8.1 10.0 100.0 100.0 4,052 109,875 316,959
— Not applicable.1 The Stafford Unsubsidized loans began in FY93.2 The Supplemental Loan for Students (SLS) program ended in FY94.3 FFEL program total for FY66-FY84 includes Federal Insured Student Loan Program (FISLP).
NOTES: Commitments reported in this table exclude Consolidation loans and PLUS and SLS refinanced loans authorized under the Higher Education amendments of 1986.The loan volume reported in this table includes some loans that later may be canceled. Details may not add to totals due to rounding. Calculations are based on numbers before rounding. Data for earlier years appear in table A-5 in appendix I.
SOURCE: U.S. Department of Education, Office of Postsecondary Education, National Student Loan Data System.
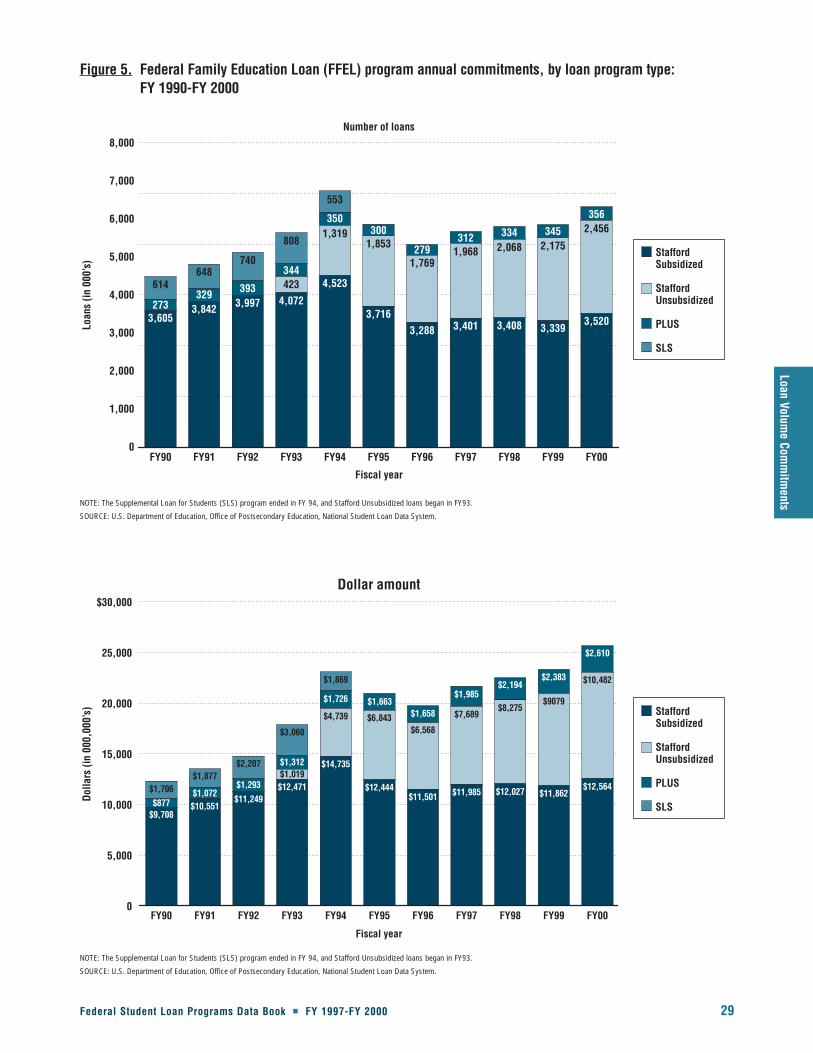
Loan Volume Com
mitm
ents
Federal Student Loan Programs Data Book � FY 1997-FY 2000 29
Fiscal year
Number of loans
Loan
s (in
000
’s)
Stafford Subsidized
Stafford Unsubsidized
PLUS
SLS
0
1,000
2,000
3,000
4,000
5,000
6,000
7,000
8,000
614648
740
808
553
273329 393
344
350300
279312 334 345
356
423
1,3191,853
1,7691,968 2,068 2,175
2,456
3,6053,842 3,997 4,072
4,523
3,7163,288 3,401 3,408 3,339
3,520
FY00FY99FY98FY97FY96FY95FY94FY93FY92FY91FY90
Fiscal year
Dollar amount
Dolla
rs (i
n 00
0,00
0’s) Stafford
Subsidized
Stafford Unsubsidized
PLUS
SLS
0
5,000
10,000
15,000
20,000
25,000
$30,000
$1,706$1,877
$2,207
$3,060
$1,869
$877$1,072
$1,293
$1,312
$1,726 $1,663$1,658
$1,985$2,194
$2,383
$2,610
$1,019
$4,739 $6,843$6,568
$7,689$8,275
$9079
$10,482
$9,708$10,551
$11,249$12,471
$14,735
$12,444$11,501 $11,985 $12,027 $11,862
$12,564
FY00FY99FY98FY97FY96FY95FY94FY93FY92FY91FY90
Figure 5. Federal Family Education Loan (FFEL) program annual commitments, by loan program type: FY 1990-FY 2000
NOTE: The Supplemental Loan for Students (SLS) program ended in FY 94, and Stafford Unsubsidized loans began in FY93.
SOURCE: U.S. Department of Education, Office of Postsecondary Education, National Student Loan Data System.
NOTE: The Supplemental Loan for Students (SLS) program ended in FY 94, and Stafford Unsubsidized loans began in FY93.
SOURCE: U.S. Department of Education, Office of Postsecondary Education, National Student Loan Data System.

30 Federal Student Loan Programs Data Book � FY 1997-FY 2000
This table shows summary information for tables 32-35. The annual loan volume, the percent change from prior
year, the percent share of FDLP total, the average student loan, and the cumulative loan volume are presented for
the FDLP program by the three loan types: Stafford Subsidized, Stafford Unsubsidized, and Parent Loans for
Undergraduate Students (PLUS) loans. (See also figure 6 which follows table 6.)
� Since its inception in FY 1994, the FDLP has made 16.2 million loans worth $60.0 billion.
� FDLP annual loan volume increased dramatically from $915 million in FY 1994 to $11.8 billion in FY 2000.
The total loan volume committed annually grew from $5.1 billion in FY 1995 to $11.1 billion in FY 1998.
This figure fell slightly in FY 1999 to $10.7 billion, but then rose again to $11.8 billion in FY 2000.
� While the Stafford Subsidized loan program continued to commit the majority of FDLP dollar volume
from FY 1994 to FY 2000, the share declined over time. In FY 1994, the Stafford Subsidized loan program
committed 64.0 percent of FDLP funds. This figure fell annually, and by FY 2000, the Stafford Subsidized
loan program had committed 51.0 percent of FDLP funds. The share of the Stafford Unsubsidized loan
program increased annually and grew from 26.2 percent in FY 1994 to 37.3 percent in FY 2000.
� Overall, the FDLP average loan amount from FY 1996 through FY 2000 fluctuated between $3,582 and
$3,860. The average loan amounts for each of the FDLP loan programs remained relatively stable during
the period.
NOTES: FDLP commitments in FY 1994 include only one-quarter of that fiscal year, and FDLP loans were restricted to a small number
of institutions. The FDLP makes loans directly available to students, while the FFEL program makes loans available to students through
private lenders and guaranty agencies. Both programs offer the same types of loans: Stafford Subsidized, Stafford Unsubsidized, PLUS,
and Consolidation loans.
Table 6. Federal Direct Loan Program (FDLP) annual and cumulative commitments, by loan program type: FY 1994-FY 2000
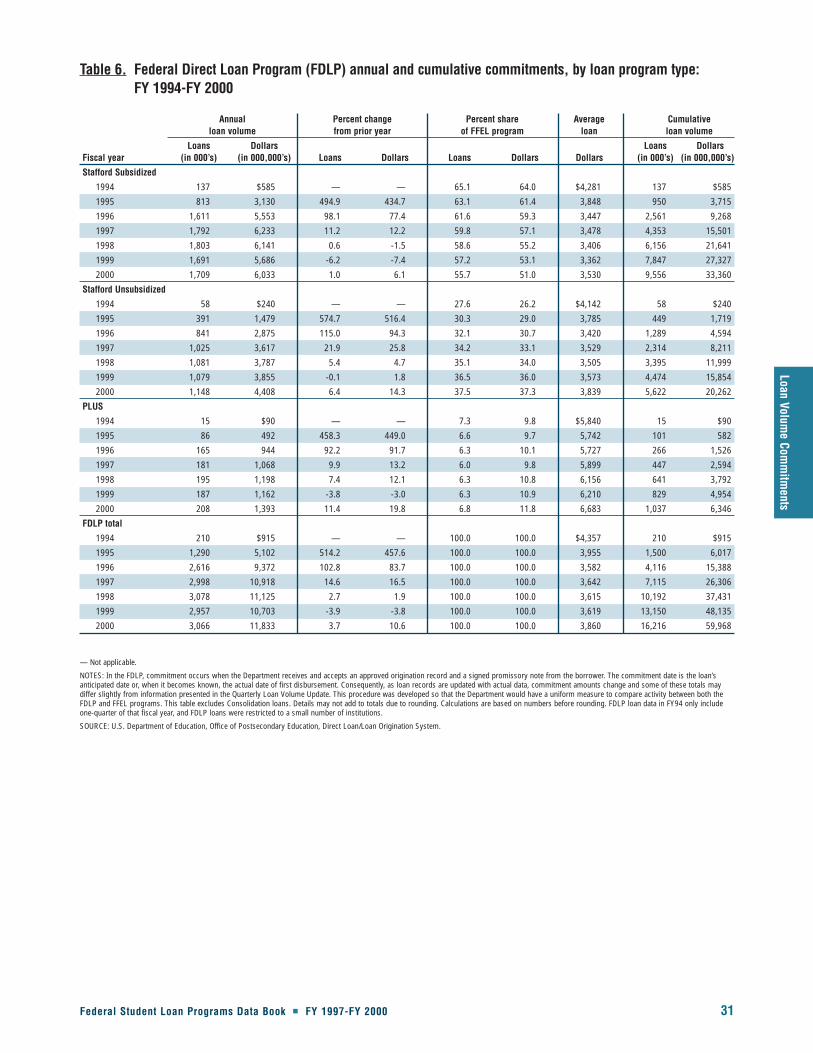
Federal Student Loan Programs Data Book � FY 1997-FY 2000 31
Loan Volume Com
mitm
ents
Table 6. Federal Direct Loan Program (FDLP) annual and cumulative commitments, by loan program type: FY 1994-FY 2000
Annual Percent change Percent share Average Cumulativeloan volume from prior year of FFEL program loan loan volume
Loans Dollars Loans DollarsFiscal year (in 000’s) (in 000,000’s) Loans Dollars Loans Dollars Dollars (in 000’s) (in 000,000’s)
Stafford Subsidized
1994 137 $585 — — 65.1 64.0 $4,281 137 $585
1995 813 3,130 494.9 434.7 63.1 61.4 3,848 950 3,715
1996 1,611 5,553 98.1 77.4 61.6 59.3 3,447 2,561 9,268
1997 1,792 6,233 11.2 12.2 59.8 57.1 3,478 4,353 15,501
1998 1,803 6,141 0.6 -1.5 58.6 55.2 3,406 6,156 21,641
1999 1,691 5,686 -6.2 -7.4 57.2 53.1 3,362 7,847 27,327
2000 1,709 6,033 1.0 6.1 55.7 51.0 3,530 9,556 33,360
Stafford Unsubsidized
1994 58 $240 — — 27.6 26.2 $4,142 58 $240
1995 391 1,479 574.7 516.4 30.3 29.0 3,785 449 1,719
1996 841 2,875 115.0 94.3 32.1 30.7 3,420 1,289 4,594
1997 1,025 3,617 21.9 25.8 34.2 33.1 3,529 2,314 8,211
1998 1,081 3,787 5.4 4.7 35.1 34.0 3,505 3,395 11,999
1999 1,079 3,855 -0.1 1.8 36.5 36.0 3,573 4,474 15,854
2000 1,148 4,408 6.4 14.3 37.5 37.3 3,839 5,622 20,262
PLUS
1994 15 $90 — — 7.3 9.8 $5,840 15 $90
1995 86 492 458.3 449.0 6.6 9.7 5,742 101 582
1996 165 944 92.2 91.7 6.3 10.1 5,727 266 1,526
1997 181 1,068 9.9 13.2 6.0 9.8 5,899 447 2,594
1998 195 1,198 7.4 12.1 6.3 10.8 6,156 641 3,792
1999 187 1,162 -3.8 -3.0 6.3 10.9 6,210 829 4,954
2000 208 1,393 11.4 19.8 6.8 11.8 6,683 1,037 6,346
FDLP total
1994 210 $915 — — 100.0 100.0 $4,357 210 $915
1995 1,290 5,102 514.2 457.6 100.0 100.0 3,955 1,500 6,017
1996 2,616 9,372 102.8 83.7 100.0 100.0 3,582 4,116 15,388
1997 2,998 10,918 14.6 16.5 100.0 100.0 3,642 7,115 26,306
1998 3,078 11,125 2.7 1.9 100.0 100.0 3,615 10,192 37,431
1999 2,957 10,703 -3.9 -3.8 100.0 100.0 3,619 13,150 48,135
2000 3,066 11,833 3.7 10.6 100.0 100.0 3,860 16,216 59,968
— Not applicable.
NOTES: In the FDLP, commitment occurs when the Department receives and accepts an approved origination record and a signed promissory note from the borrower. The commitment date is the loan’santicipated date or, when it becomes known, the actual date of first disbursement. Consequently, as loan records are updated with actual data, commitment amounts change and some of these totals maydiffer slightly from information presented in the Quarterly Loan Volume Update. This procedure was developed so that the Department would have a uniform measure to compare activity between both theFDLP and FFEL programs. This table excludes Consolidation loans. Details may not add to totals due to rounding. Calculations are based on numbers before rounding. FDLP loan data in FY94 only includeone-quarter of that fiscal year, and FDLP loans were restricted to a small number of institutions.
SOURCE: U.S. Department of Education, Office of Postsecondary Education, Direct Loan/Loan Origination System.

32 Federal Student Loan Programs Data Book � FY 1997-FY 2000
Fiscal year
Number of loans
Loan
s (in
000
’s)
Stafford Subsidized
Stafford Unsubsidized
PLUS
0
500
1,000
1,500
2,000
2,500
3,000
3,500
15
86
165
181195
187208
58
391
841
1,025 1,0811,079
1,148
137
813
1,6111,792 1,803
1,691 1,709
FY00FY99FY98FY97FY96FY95FY94
Fiscal year
Dollar amount
Dolla
rs (i
n 00
0,00
0’s) Stafford
Subsidized
Stafford Unsubsidized
PLUS
0
2,000
4,000
6,000
8,000
10,000
$12,000
$90
$492
$944
$1,068 $1,198$1,162
$1,393
$240
$1,479
$2,875
$3,617 $3,787$3,855
$4,408
$585
$3,130
$5,553
$6,233 $6,141$5,686
$6,033
FY00FY99FY98FY97FY96FY95FY94
Figure 6. Federal Direct Loan Program (FDLP) annual commitments, by loan program type: FY 1994-FY 2000
NOTE: FDLP loan data in FY94 only include one-quarter of that fiscal year, and FDLP loans were restricted to a small number of institutions.
SOURCE: U.S. Department of Education, Office of Postsecondary Education, Direct Loan/Loan Origination System.
NOTE: FDLP loan data in FY94 only include one-quarter of that fiscal year, and FDLP loans were restricted to a small number of institutions.
SOURCE: U.S. Department of Education, Office of Postsecondary Education, Direct Loan/Loan Origination System.
Loan Volume Com
mitm
ents
Federal Student Loan Programs Data Book � FY 1997-FY 2000 33
This table shows the number and percent of total FFEL program Stafford Subsidized loan program commitments
(numbers of borrowers and dollar amounts), by type of institution (public 2- and 4-year, private 2- and 4-year,
proprietary, and foreign). (See also figure 7 which follows table 7.)
� Since FY 1997, the proportion of Stafford Subsidized borrowers from public 4-year institutions is similar
to the proportion from private 4-year institutions—approximately 36 percent annually. In contrast,
borrowers from private 4-year institutions consistently borrowed a greater proportion of Stafford
Subsidized dollars during this time than borrowers from public 4-year institutions-approximately
43 percent vs. approximately 37 percent, respectively.
� From FY 1994-FY 2000, the percent of Stafford Subsidized dollars committed to borrowers at public 4-year
institutions decreased from 45.5 to 36.5 percent. The percent of Stafford Subsidized dollars committed to
borrowers from private 4-year institutions grew from 37.4 percent in FY 1994 to a high of 43.9 percent in
FY 1998. But in FY 1999 and FY 2000 this proportion dropped to 43.1 and 42.9 percent, respectively.
� From FY 1993 to FY 1998, the percent of Stafford Subsidized dollars committed to borrowers at both public
and private 4-year institutions held steady at about 82 percent annually. This figure fell to 79.4 percent in
FY 2000.
� From FY 1990 to FY 1997, the percent of Stafford Subsidized dollars committed to borrowers at proprietary
institutions fell from 21.6 percent to 9.5 percent. This figure began increasing again in FY 1998
(9.9 percent) and, in FY 2000, the percent committed to borrowers at proprietary institutions stood at
12.6 percent.
� From FY 1990 to FY 2000, the percent of Stafford Subsidized dollars committed to borrowers at public and
private 2-year institutions held fairly steady, with approximately 6 to 7 percent going to borrowers from
public 2-year institutions and one to two percent going to borrowers from private 2-year institutions.
� From FY 1990 to FY 2000, the proportion of Stafford Subsidized borrowers at proprietary institutions was
consistently lower than the proportion of Stafford Subsidized dollars they received. For instance, in
FY 1990, 27.0 percent of Stafford Subsidized borrowers were from proprietary schools, while only
21.6 percent of the Stafford Subsidized dollars were committed to them. In FY 2000, 16.2 percent of the
borrowers were from proprietary schools, but only 12.6 percent of dollars were committed to them.
� Borrowers attending foreign institutions represent a very small percentage of loan volume. For example,
between FY 1997 and FY 2000, borrowers at foreign institutions accounted for less than 0.5 percent of
Stafford Subsidized borrowers and approximately 1 percent of these dollars.
Table 7. Federal Family Education Loan (FFEL) program number of borrowers anddollar amount of Stafford Subsidized loans, by type of institution: FY 1990-FY 2000
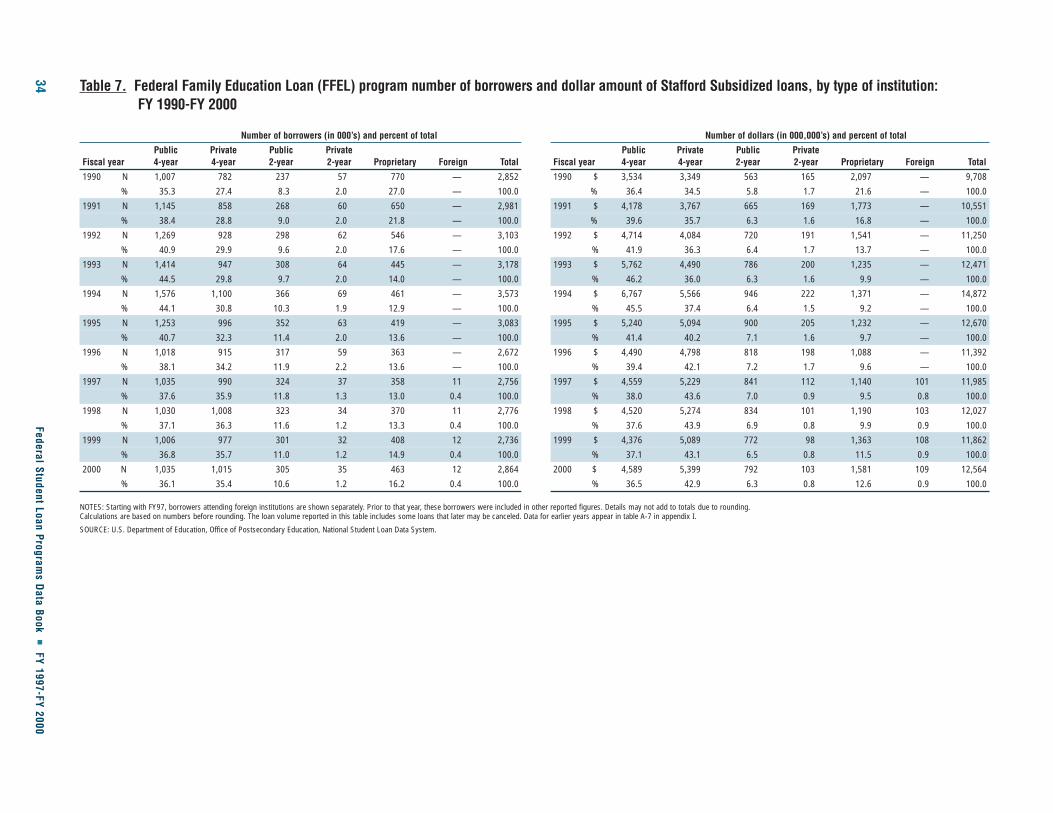
34Federal Student Loan Program
s Data Book
�FY 1997-FY 2000
Table 7. Federal Family Education Loan (FFEL) program number of borrowers and dollar amount of Stafford Subsidized loans, by type of institution:FY 1990-FY 2000
Number of borrowers (in 000’s) and percent of total Number of dollars (in 000,000’s) and percent of total
Public Private Public Private Public Private Public PrivateFiscal year 4-year 4-year 2-year 2-year Proprietary Foreign Total Fiscal year 4-year 4-year 2-year 2-year Proprietary Foreign Total
1990 N 1,007 782 237 57 770 — 2,852 1990 $ 3,534 3,349 563 165 2,097 — 9,708
% 35.3 27.4 8.3 2.0 27.0 — 100.0 % 36.4 34.5 5.8 1.7 21.6 — 100.0
1991 N 1,145 858 268 60 650 — 2,981 1991 $ 4,178 3,767 665 169 1,773 — 10,551
% 38.4 28.8 9.0 2.0 21.8 — 100.0 % 39.6 35.7 6.3 1.6 16.8 — 100.0
1992 N 1,269 928 298 62 546 — 3,103 1992 $ 4,714 4,084 720 191 1,541 — 11,250
% 40.9 29.9 9.6 2.0 17.6 — 100.0 % 41.9 36.3 6.4 1.7 13.7 — 100.0
1993 N 1,414 947 308 64 445 — 3,178 1993 $ 5,762 4,490 786 200 1,235 — 12,471
% 44.5 29.8 9.7 2.0 14.0 — 100.0 % 46.2 36.0 6.3 1.6 9.9 — 100.0
1994 N 1,576 1,100 366 69 461 — 3,573 1994 $ 6,767 5,566 946 222 1,371 — 14,872
% 44.1 30.8 10.3 1.9 12.9 — 100.0 % 45.5 37.4 6.4 1.5 9.2 — 100.0
1995 N 1,253 996 352 63 419 — 3,083 1995 $ 5,240 5,094 900 205 1,232 — 12,670
% 40.7 32.3 11.4 2.0 13.6 — 100.0 % 41.4 40.2 7.1 1.6 9.7 — 100.0
1996 N 1,018 915 317 59 363 — 2,672 1996 $ 4,490 4,798 818 198 1,088 — 11,392
% 38.1 34.2 11.9 2.2 13.6 — 100.0 % 39.4 42.1 7.2 1.7 9.6 — 100.0
1997 N 1,035 990 324 37 358 11 2,756 1997 $ 4,559 5,229 841 112 1,140 101 11,985
% 37.6 35.9 11.8 1.3 13.0 0.4 100.0 % 38.0 43.6 7.0 0.9 9.5 0.8 100.0
1998 N 1,030 1,008 323 34 370 11 2,776 1998 $ 4,520 5,274 834 101 1,190 103 12,027
% 37.1 36.3 11.6 1.2 13.3 0.4 100.0 % 37.6 43.9 6.9 0.8 9.9 0.9 100.0
1999 N 1,006 977 301 32 408 12 2,736 1999 $ 4,376 5,089 772 98 1,363 108 11,862
% 36.8 35.7 11.0 1.2 14.9 0.4 100.0 % 37.1 43.1 6.5 0.8 11.5 0.9 100.0
2000 N 1,035 1,015 305 35 463 12 2,864 2000 $ 4,589 5,399 792 103 1,581 109 12,564
% 36.1 35.4 10.6 1.2 16.2 0.4 100.0 % 36.5 42.9 6.3 0.8 12.6 0.9 100.0
NOTES: Starting with FY97, borrowers attending foreign institutions are shown separately. Prior to that year, these borrowers were included in other reported figures. Details may not add to totals due to rounding. Calculations are based on numbers before rounding. The loan volume reported in this table includes some loans that later may be canceled. Data for earlier years appear in table A-7 in appendix I.
SOURCE: U.S. Department of Education, Office of Postsecondary Education, National Student Loan Data System.

Loan Volume Com
mitm
ents
Federal Student Loan Programs Data Book � FY 1997-FY 2000 35
Percent of total Stafford Subsidized dollars
Stafford Subsidized
Fisc
al y
ear
Public 4-year
Private 4-year
Public 2-year
Proprietary
0 20% 40% 60% 80% 100%
36.5
37.1
37.6
38.0
39.4
41.4
45.5
46.2
41.9
39.6
36.4
42.9
43.1
43.9
43.6
42.1
40.2
37.4
36.0
36.3
35.7
34.5
6.3
6.5
6.9
7.0
7.2
7.1
6.4
6.3
6.4
6.3
5.8
12.6
11.5
9.9
9.5
9.6
9.7
9.2
9.9
13.7
16.8
21.6FY90
FY91
FY92
FY93
FY94
FY95
FY96
FY97
FY98
FY99
FY00
Figure 7. Percentage distribution of Federal Family Education Loan (FFEL) program dollars by type of institution: FY 1990-FY 2000
NOTE: Data for private 2-year and foreign institutions can be found in table 7.
SOURCE: U.S. Department of Education, Office of Postsecondary Education, National Student Loan Data System.
36 Federal Student Loan Programs Data Book � FY 1997-FY 2000
This table shows the number and percent of total FFEL program Stafford Unsubsidized loan commitments
(numbers of borrowers and dollar amounts), by type of institution (public 2- and 4-year, private 2- and 4-year,
proprietary, and foreign). (See also figure 8 which follows table 8.)
� From FY 1993 to FY 1996 the proportion of Stafford Unsubsidized dollars committed to borrowers from
public 4-year institutions fell dramatically from 59.6 percent to 33.5 percent. From FY 1997 through FY
2000 this figure held steady at about 32 percent. The proportion of Stafford Unsubsidized dollars
committed to borrowers from private 4-year institutions increased from 27.8 percent in FY 1993 to a high
of 48.1 percent in FY 1998. In FY 1999 and FY 2000, this proportion was 47.1 percent and 45.9 percent,
respectively.
� From FY 1995 to FY 2000, approximately 79 percent of Stafford Unsubsidized dollars were committed to
borrowers at public and private 4-year institutions. Between 12 and 15 percent of Stafford Unsubsidized
dollars were committed annually to borrowers at proprietary institutions over that time.
� In a pattern similar to previous years, in FY 2000, borrowers from private 4-year institutions made up 33.8
percent of all Stafford Unsubsidized borrowers but received 45.9 percent of the committed Stafford
Unsubsidized dollar commitments.
Table 8. Federal Family Education Loan (FFEL) program number of borrowers anddollar amount of Stafford Unsubsidized loans, by type of institution:FY 1993-FY 2000
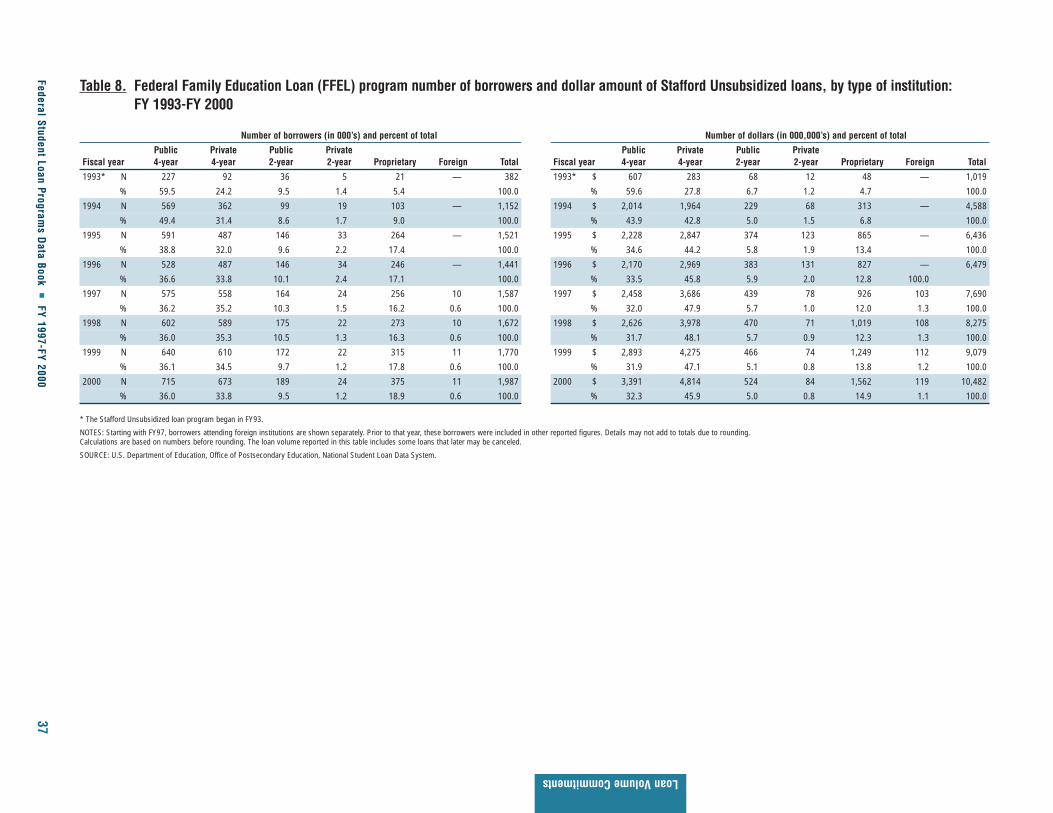
Federal Student Loan Programs D
ata Book �
FY 1997-FY 200037
Loan Volume Commitments
Table 8. Federal Family Education Loan (FFEL) program number of borrowers and dollar amount of Stafford Unsubsidized loans, by type of institution: FY 1993-FY 2000
Number of borrowers (in 000’s) and percent of total Number of dollars (in 000,000’s) and percent of total
Public Private Public Private Public Private Public PrivateFiscal year 4-year 4-year 2-year 2-year Proprietary Foreign Total Fiscal year 4-year 4-year 2-year 2-year Proprietary Foreign Total
1993* N 227 92 36 5 21 — 382 1993* $ 607 283 68 12 48 — 1,019
% 59.5 24.2 9.5 1.4 5.4 100.0 % 59.6 27.8 6.7 1.2 4.7 100.0
1994 N 569 362 99 19 103 — 1,152 1994 $ 2,014 1,964 229 68 313 — 4,588
% 49.4 31.4 8.6 1.7 9.0 100.0 % 43.9 42.8 5.0 1.5 6.8 100.0
1995 N 591 487 146 33 264 — 1,521 1995 $ 2,228 2,847 374 123 865 — 6,436
% 38.8 32.0 9.6 2.2 17.4 100.0 % 34.6 44.2 5.8 1.9 13.4 100.0
1996 N 528 487 146 34 246 — 1,441 1996 $ 2,170 2,969 383 131 827 — 6,479
% 36.6 33.8 10.1 2.4 17.1 100.0 % 33.5 45.8 5.9 2.0 12.8 100.0
1997 N 575 558 164 24 256 10 1,587 1997 $ 2,458 3,686 439 78 926 103 7,690
% 36.2 35.2 10.3 1.5 16.2 0.6 100.0 % 32.0 47.9 5.7 1.0 12.0 1.3 100.0
1998 N 602 589 175 22 273 10 1,672 1998 $ 2,626 3,978 470 71 1,019 108 8,275
% 36.0 35.3 10.5 1.3 16.3 0.6 100.0 % 31.7 48.1 5.7 0.9 12.3 1.3 100.0
1999 N 640 610 172 22 315 11 1,770 1999 $ 2,893 4,275 466 74 1,249 112 9,079
% 36.1 34.5 9.7 1.2 17.8 0.6 100.0 % 31.9 47.1 5.1 0.8 13.8 1.2 100.0
2000 N 715 673 189 24 375 11 1,987 2000 $ 3,391 4,814 524 84 1,562 119 10,482
% 36.0 33.8 9.5 1.2 18.9 0.6 100.0 % 32.3 45.9 5.0 0.8 14.9 1.1 100.0
* The Stafford Unsubsidized loan program began in FY93.
NOTES: Starting with FY97, borrowers attending foreign institutions are shown separately. Prior to that year, these borrowers were included in other reported figures. Details may not add to totals due to rounding. Calculations are based on numbers before rounding. The loan volume reported in this table includes some loans that later may be canceled.
SOURCE: U.S. Department of Education, Office of Postsecondary Education, National Student Loan Data System.

38 Federal Student Loan Programs Data Book � FY 1997-FY 2000
Percent of total Stafford Unsubsidized dollars
Stafford Unsubsidized
Fisc
al y
ear
Public 4-year
Private 4-year
Public 2-year
Proprietary
0 20 40 60 80 100
32.3
31.9
31.7
32.0
33.5
34.6
43.9
59.6
45.9
47.1
48.1
47.9
45.8
44.2
42.8
27.8
5.0
5.1
5.7
5.7
5.9
5.8
5.0
6.7
14.9
13.8
12.3
12.0
12.8
13.4
6.8
4.7FY93
FY94
FY95
FY96
FY97
FY98
FY99
FY00
Figure 8. Percentage distribution of Federal Family Education Loan (FFEL) program dollars by type ofinstitution: FY 1990-FY 2000
NOTES: The Stafford Unsubsidized loan program began in FY93. Data for private 2-year and foreign institutions can be found in table 8.
SOURCE: U.S. Department of Education, Office of Postsecondary Education, National Student Loan Data System.
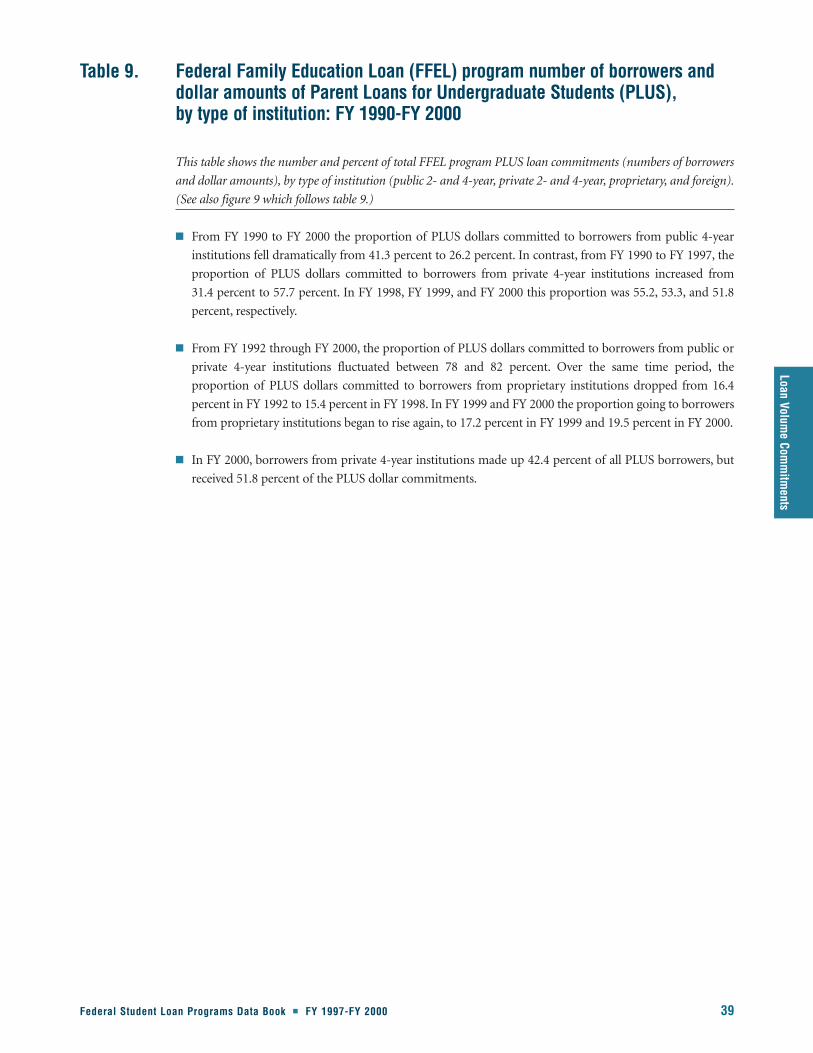
Loan Volume Com
mitm
ents
Federal Student Loan Programs Data Book � FY 1997-FY 2000 39
This table shows the number and percent of total FFEL program PLUS loan commitments (numbers of borrowers
and dollar amounts), by type of institution (public 2- and 4-year, private 2- and 4-year, proprietary, and foreign).
(See also figure 9 which follows table 9.)
� From FY 1990 to FY 2000 the proportion of PLUS dollars committed to borrowers from public 4-year
institutions fell dramatically from 41.3 percent to 26.2 percent. In contrast, from FY 1990 to FY 1997, the
proportion of PLUS dollars committed to borrowers from private 4-year institutions increased from
31.4 percent to 57.7 percent. In FY 1998, FY 1999, and FY 2000 this proportion was 55.2, 53.3, and 51.8
percent, respectively.
� From FY 1992 through FY 2000, the proportion of PLUS dollars committed to borrowers from public or
private 4-year institutions fluctuated between 78 and 82 percent. Over the same time period, the
proportion of PLUS dollars committed to borrowers from proprietary institutions dropped from 16.4
percent in FY 1992 to 15.4 percent in FY 1998. In FY 1999 and FY 2000 the proportion going to borrowers
from proprietary institutions began to rise again, to 17.2 percent in FY 1999 and 19.5 percent in FY 2000.
� In FY 2000, borrowers from private 4-year institutions made up 42.4 percent of all PLUS borrowers, but
received 51.8 percent of the PLUS dollar commitments.
Table 9. Federal Family Education Loan (FFEL) program number of borrowers and dollar amounts of Parent Loans for Undergraduate Students (PLUS), by type of institution: FY 1990-FY 2000

40Federal Student Loan Program
s Data Book
�FY 1997-FY 2000
Table 9. Federal Family Education Loan (FFEL) program number of borrowers and dollar amounts of Parent Loans for Undergraduate Students (PLUS)loans, by type of institution: FY 1990-FY 2000
Number of borrowers (in 000’s) and percent of total Number of dollars (in 000,000’s) and percent of total
Public Private Public Private Public Private Public PrivateFiscal year 4-year 4-year 2-year 2-year Proprietary Foreign Total Fiscal year 4-year 4-year 2-year 2-year Proprietary Foreign Total
1990 N 99 71 10 5 57 — 242 1990 $ 362 275 30 18 191 — 877
% 40.7 29.5 4.2 2.1 23.5 100.0 % 41.3 31.4 3.4 2.1 21.8 100.0
1991 N 124 91 13 6 57 — 291 1991 $ 459 356 39 21 197 — 1,072
% 42.6 31.4 4.4 2.1 19.5 100.0 % 42.8 33.2 3.6 2.0 18.4 100.0
1992 N 143 107 15 6 56 — 328 1992 $ 566 442 48 25 212 — 1,293
% 43.5 32.8 4.7 1.9 17.1 100.0 % 43.8 34.2 3.7 1.9 16.4 100.0
1993 N 118 100 11 6 50 — 285 1993 $ 505 525 38 28 216 — 1,312
% 41.3 35.2 3.8 2.1 17.6 100.0 % 38.5 40.0 2.9 2.1 16.5 100.0
1994 N 114 121 8 7 53 — 302 1994 $ 552 839 28 38 250 — 1,707
% 37.6 40.1 2.6 2.3 17.4 100.0 % 32.3 49.1 1.6 2.3 14.7 100.0
1995 N 86 118 7 7 50 — 267 1995 $ 451 899 28 38 238 — 1,655
% 32.2 44.1 2.7 2.5 18.6 100.0 % 27.2 54.4 1.7 2.3 14.4 100.0
1996 N 74 113 7 7 48 — 249 1996 $ 416 919 28 41 250 — 1,654
% 29.9 45.4 2.7 2.8 19.3 100.0 % 25.2 55.6 1.7 2.5 15.1 100.0
1997 N 83 130 6 4 51 0 276 1997 $ 496 1,145 26 23 291 3 1,985
% 30.2 47.2 2.3 1.6 18.6 0.1 100.0 % 25.0 57.7 1.3 1.2 14.7 0.2 100.0
1998 N 92 134 7 4 56 0 294 1998 $ 583 1,210 31 26 338 3 2,194
% 31.4 45.5 2.5 1.5 19.1 0.1 100.0 % 26.6 55.2 1.4 1.2 15.4 0.1 100.0
1999 N 97 133 7 4 62 0 303 1999 $ 638 1,265 31 29 409 4 2,383
% 32.0 43.7 2.3 1.5 20.4 0.1 100.0 % 26.8 53.3 1.3 1.2 17.2 0.2 100.0
2000 N 99 134 7 5 71 0 316 2000 $ 687 1,356 30 30 510 4 2,610
% 31.4 42.4 2.1 1.5 22.5 0.1 100.0 % 26.2 51.8 1.1 1.1 19.5 0.2 100.0
NOTES: Starting with FY97, borrowers attending foreign institutions are shown separately. Prior to that year, these borrowers were included in other reported figures. Details may not add to totals due to rounding. Calculations are based on numbers before rounding. The loan volume reported in this table includes some loans that later may be canceled. Data for earlier years appear in table A-9 in appendix I.
SOURCE: U.S. Department of Education, Office of Postsecondary Education, National Student Loan Data System.
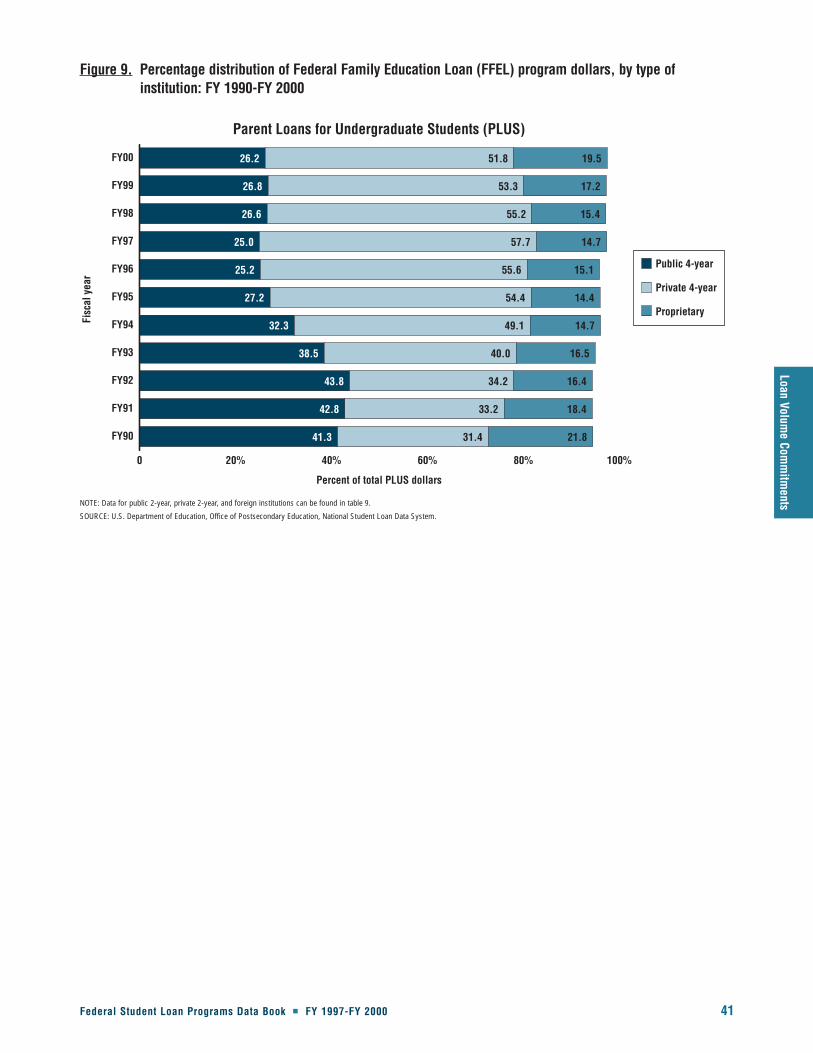
Loan Volume Com
mitm
ents
Federal Student Loan Programs Data Book � FY 1997-FY 2000 41
Percent of total PLUS dollars
Parent Loans for Undergraduate Students (PLUS)
Fisc
al y
ear
Public 4-year
Private 4-year
Proprietary
0 20% 40% 60% 80% 100%
26.2
26.8
26.6
25.0
25.2
27.2
32.3
38.5
43.8
42.8
41.3
51.8
53.3
55.2
57.7
55.6
54.4
49.1
40.0
34.2
33.2
31.4
19.5
17.2
15.4
14.7
15.1
14.4
14.7
16.5
16.4
18.4
21.8FY90
FY91
FY92
FY93
FY94
FY95
FY96
FY97
FY98
FY99
FY00
Figure 9. Percentage distribution of Federal Family Education Loan (FFEL) program dollars, by type ofinstitution: FY 1990-FY 2000
NOTE: Data for public 2-year, private 2-year, and foreign institutions can be found in table 9.
SOURCE: U.S. Department of Education, Office of Postsecondary Education, National Student Loan Data System.

42 Federal Student Loan Programs Data Book � FY 1997-FY 2000
This table shows the total number and percent of FFEL program Stafford Subsidized, Stafford Unsubsidized, Parent
Loans for Undergraduate Students (PLUS), and Supplemental Loan for Students (SLS) loan commitments
(numbers of borrowers and dollar amounts), by type of institution (public 2- and 4-year, private 2- and 4-year,
proprietary and foreign). (See also figure 10 which follows table 10.)
� The total number of FFEL borrowers decreased annually from FY 1993 to FY 1996. The number of
borrowers began increasing in FY 1997 and stood at 5.2 million in FY 2000.
� FFEL program borrowers at public 4-year institutions represented the largest group of borrowers in FY
2000 (35.8 percent) but they did not commit the largest proportion of dollars (33.7 percent). Borrowers
from private 4-year institutions made up 35.2 percent of borrowers, but 45.0 percent of dollar
commitments.
� The proportion of FFEL borrowers from proprietary institutions and the proportion of FFEL program
dollars committed to borrowers from proprietary institutions remained relatively stable from FY 1993
(15.2 and 11.5 percent, respectively) to FY 1999 (16.3 and 13.0 percent, respectively). But in FY 2000 the
proportion of FFEL borrowers from proprietary institutions grew to 17.6 percent and the proportion of
FFEL program dollars committed to borrowers from proprietary institutions increased to 14.2 percent.
� The proportion of FFEL program dollars committed to borrowers at public and private 4-year institutions
was relatively stable from FY 1994 to FY 1999 at about 81 percent. In FY 2000 the proportion dropped to
78.7 percent.
� The proportion of FFEL borrowers from public and private 2-year institutions was consistently less than
the proportion of FFEL program dollars going to borrowers at these institutions. For example, in FY 2000
the proportion of FFEL program borrowers at public 2-year and private 2-year institutions was 9.7 and 1.2
percent, respectively, while the proportion of total FFEL program dollars committed was 5.2 and 0.8
percent, respectively.
� Between FY 1997 and FY 2000, the number of FFEL borrowers from foreign institutions increased slightly
from 21,000 to 23,000. In addition, the FFEL program dollars committed to borrowers from these
institutions increased from $207 million to $232 million during this time. However, the proportion of
FFEL borrowers and dollars from foreign institutions remained extremely small overall with just 0.5
percent of FFEL borrowers and 1.0 percent of program dollars.
Table 10. Federal Family Education Loan (FFEL) program number of borrowers and dollar amount of Stafford Subsidized, Stafford Unsubsidized, Parent Loans for Undergraduate Students (PLUS), and Supplemental Loan For Students (SLS) loans, by type of institution: FY 1990-FY 2000
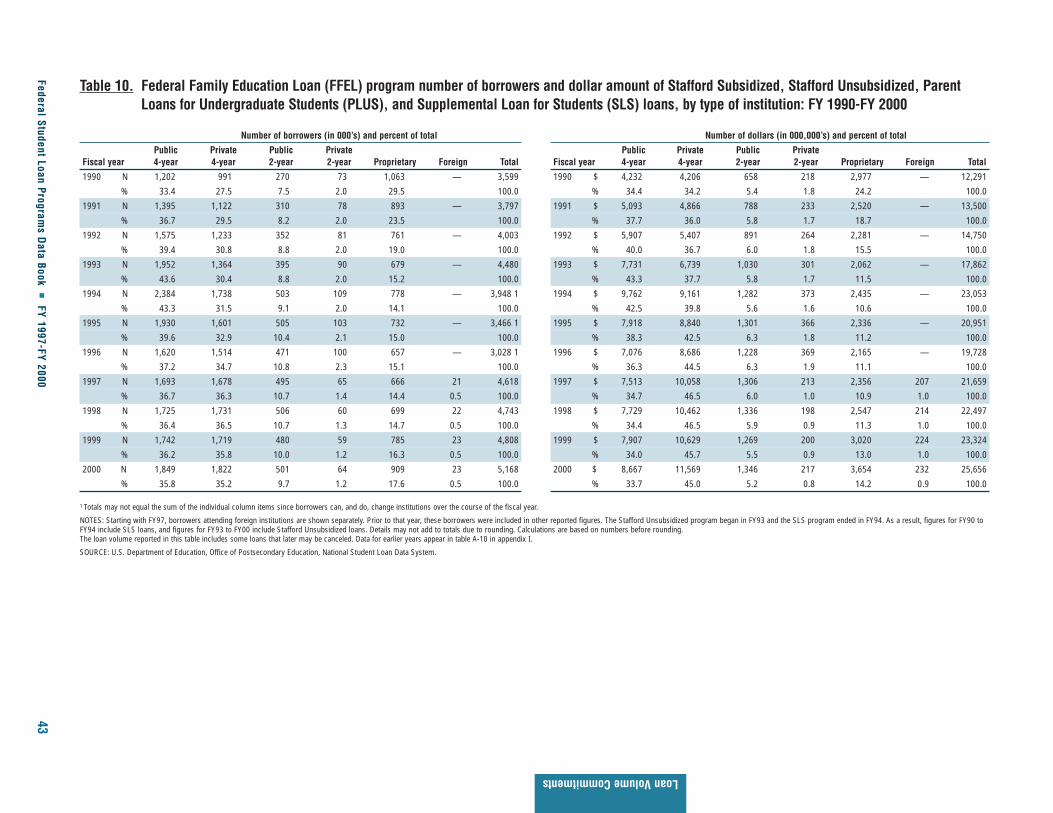
Federal Student Loan Programs D
ata Book �
FY 1997-FY 200043
Loan Volume Commitments
Table 10. Federal Family Education Loan (FFEL) program number of borrowers and dollar amount of Stafford Subsidized, Stafford Unsubsidized, ParentLoans for Undergraduate Students (PLUS), and Supplemental Loan for Students (SLS) loans, by type of institution: FY 1990-FY 2000
Number of borrowers (in 000’s) and percent of total Number of dollars (in 000,000’s) and percent of total
Public Private Public Private Public Private Public PrivateFiscal year 4-year 4-year 2-year 2-year Proprietary Foreign Total Fiscal year 4-year 4-year 2-year 2-year Proprietary Foreign Total
1990 N 1,202 991 270 73 1,063 — 3,599 1990 $ 4,232 4,206 658 218 2,977 — 12,291
% 33.4 27.5 7.5 2.0 29.5 100.0 % 34.4 34.2 5.4 1.8 24.2 100.0
1991 N 1,395 1,122 310 78 893 — 3,797 1991 $ 5,093 4,866 788 233 2,520 — 13,500
% 36.7 29.5 8.2 2.0 23.5 100.0 % 37.7 36.0 5.8 1.7 18.7 100.0
1992 N 1,575 1,233 352 81 761 — 4,003 1992 $ 5,907 5,407 891 264 2,281 — 14,750
% 39.4 30.8 8.8 2.0 19.0 100.0 % 40.0 36.7 6.0 1.8 15.5 100.0
1993 N 1,952 1,364 395 90 679 — 4,480 1993 $ 7,731 6,739 1,030 301 2,062 — 17,862
% 43.6 30.4 8.8 2.0 15.2 100.0 % 43.3 37.7 5.8 1.7 11.5 100.0
1994 N 2,384 1,738 503 109 778 — 3,948 1 1994 $ 9,762 9,161 1,282 373 2,435 — 23,053
% 43.3 31.5 9.1 2.0 14.1 100.0 % 42.5 39.8 5.6 1.6 10.6 100.0
1995 N 1,930 1,601 505 103 732 — 3,466 1 1995 $ 7,918 8,840 1,301 366 2,336 — 20,951
% 39.6 32.9 10.4 2.1 15.0 100.0 % 38.3 42.5 6.3 1.8 11.2 100.0
1996 N 1,620 1,514 471 100 657 — 3,028 1 1996 $ 7,076 8,686 1,228 369 2,165 — 19,728
% 37.2 34.7 10.8 2.3 15.1 100.0 % 36.3 44.5 6.3 1.9 11.1 100.0
1997 N 1,693 1,678 495 65 666 21 4,618 1997 $ 7,513 10,058 1,306 213 2,356 207 21,659
% 36.7 36.3 10.7 1.4 14.4 0.5 100.0 % 34.7 46.5 6.0 1.0 10.9 1.0 100.0
1998 N 1,725 1,731 506 60 699 22 4,743 1998 $ 7,729 10,462 1,336 198 2,547 214 22,497
% 36.4 36.5 10.7 1.3 14.7 0.5 100.0 % 34.4 46.5 5.9 0.9 11.3 1.0 100.0
1999 N 1,742 1,719 480 59 785 23 4,808 1999 $ 7,907 10,629 1,269 200 3,020 224 23,324
% 36.2 35.8 10.0 1.2 16.3 0.5 100.0 % 34.0 45.7 5.5 0.9 13.0 1.0 100.0
2000 N 1,849 1,822 501 64 909 23 5,168 2000 $ 8,667 11,569 1,346 217 3,654 232 25,656
% 35.8 35.2 9.7 1.2 17.6 0.5 100.0 % 33.7 45.0 5.2 0.8 14.2 0.9 100.0
1 Totals may not equal the sum of the individual column items since borrowers can, and do, change institutions over the course of the fiscal year.
NOTES: Starting with FY97, borrowers attending foreign institutions are shown separately. Prior to that year, these borrowers were included in other reported figures. The Stafford Unsubsidized program began in FY93 and the SLS program ended in FY94. As a result, figures for FY90 toFY94 include SLS loans, and figures for FY93 to FY00 include Stafford Unsubsidized loans. Details may not add to totals due to rounding. Calculations are based on numbers before rounding.The loan volume reported in this table includes some loans that later may be canceled. Data for earlier years appear in table A-10 in appendix I.
SOURCE: U.S. Department of Education, Office of Postsecondary Education, National Student Loan Data System.

44 Federal Student Loan Programs Data Book � FY 1997-FY 2000
Percent of total FFEL dollars
FFEL program total
Fisc
al y
ear
Public 4-year
Private 4-year
Public 2-year
Proprietary
0 20% 40% 60% 80% 100%
33.7
34.0
34.4
34.7
36.3
38.3
42.5
43.3
40.0
37.7
34.4
45.0
45.7
46.5
46.5
44.5
42.5
39.8
37.7
36.7
36.0
34.2
5.2
5.5
5.9
6.0
6.3
6.3
5.6
5.8
6.0
5.8
5.4
14.2
13.0
11.3
10.9
11.1
11.2
10.6
11.5
15.5
18.7
24.2FY90
FY91
FY92
FY93
FY94
FY95
FY96
FY97
FY98
FY99
FY00
Figure 10. Percentage distribution of Federal Family Education Loan (FFEL) program dollars, by type ofinstitution: FY 1990-FY 2000
NOTE: Data for private 2-year and foreign institutions can be found in table 10.
SOURCE: U.S. Department of Education, Office of Postsecondary Education, National Student Loan Data System.

Loan Volume Com
mitm
ents
Federal Student Loan Programs Data Book � FY 1997-FY 2000 45
This table shows the total number and percent of FDLP borrowers and dollar commitments made to postsecondary
education students between FY 1997 and FY 2000. Total FDLP commitments for all loan programs are shown in
addition to the commitments for each loan program: Stafford Subsidized, Stafford Unsubsidized, and PLUS, by
type of institution (public 2- and 4-year, private 2- and 4-year, and proprietary). (See also figures 11 and 12 which
follow table 11.)
� During FY 1997 and FY 2000, the majority of FDLP borrowers (approximately 65 percent) were from
public 4-year institutions. Another 20 percent of borrowers were from private 4-year institutions, while
10 percent were from proprietary institutions. Nearly all of the remaining borrowers (5 percent) were from
public 2-year institutions.
� The distribution of FDLP borrowers by institution type varies considerably from that of the FFEL program
during this time. For example, in constant to FDLP borrowers, the percentages of FFEL borrowers from
public and private 4-year institutions are similar at approximately 35 percent in FY 2000 (see table 10). In
addition, the percentages of FFEL borrowers at proprietary (18 percent) and public 2-year (10 percent)
institutions were higher than the percentages of FDLP borrowers at these institutions.
� Over the four years, approximately two-thirds of FDLP loan commitments went to borrowers from public
4-year institutions and nearly a quarter went to borrowers at private 4-year institutions. In contrast, one-
third of FFEL dollars went to borrowers in public 4-year institutions and 45 percent went to borrowers at
private 4-year institutions (see table 10).
� The distribution of dollars committed through the individual FDLP Stafford Subsidized, Stafford
Unsubsidized, and PLUS programs by institution type remained relatively stable between FY 1997 and FY
2000. More than 60 percent of FDLP dollars committed in the individual programs went to borrowers
from public 4-year institutions. Approximately 25 percent of FDLP dollars committed in the Stafford
Subsidized and Stafford Unsubsidized programs went to borrowers at private 4-year institutions and 30
percent of FDLP PLUS dollars went to these borrowers. Between 6 and 8 percent of FDLP dollars in the
individual programs went to borrowers at proprietary institutions.
Table 11. Federal Direct Loan Program (FDLP) number of borrowers and dollar amount of Stafford Subsidized, Stafford Unsubsidized, and Parent Loans for Undergraduates (PLUS), by type of institution: FY 1997-FY 2000
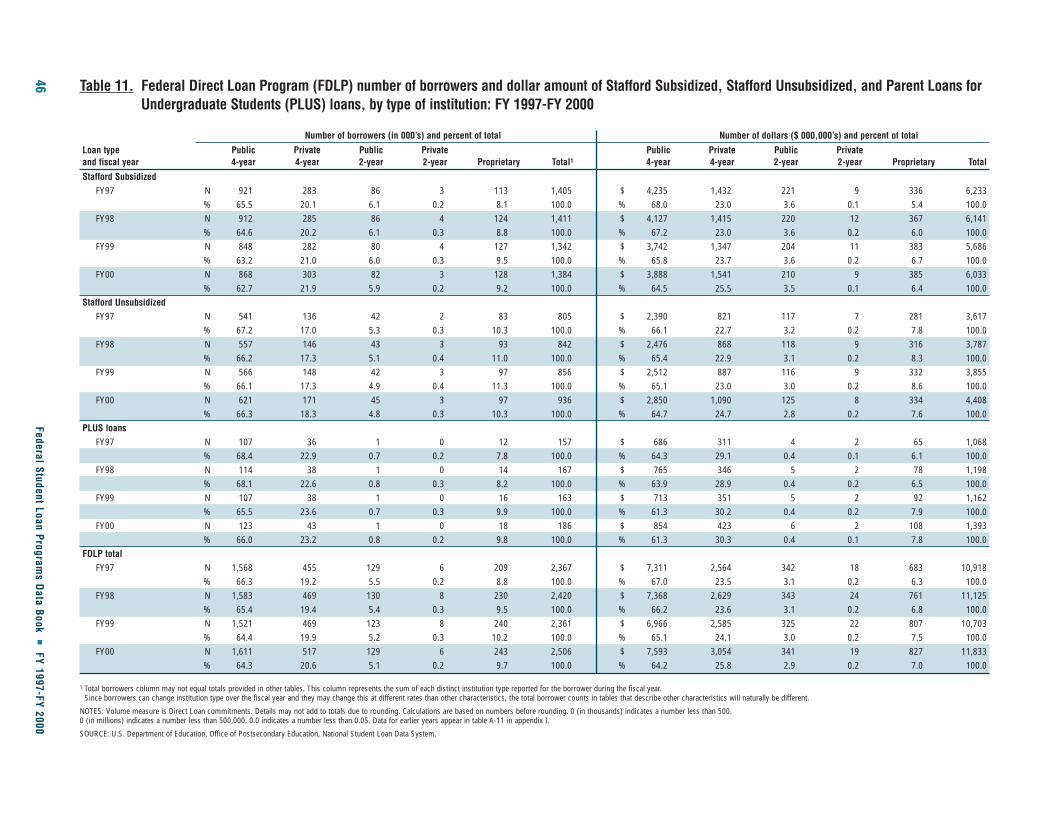
46Federal Student Loan Program
s Data Book
�FY 1997-FY 2000
Table 11. Federal Direct Loan Program (FDLP) number of borrowers and dollar amount of Stafford Subsidized, Stafford Unsubsidized, and Parent Loans forUndergraduate Students (PLUS) loans, by type of institution: FY 1997-FY 2000
Number of borrowers (in 000’s) and percent of total Number of dollars ($ 000,000’s) and percent of total
Loan type Public Private Public Private Public Private Public Private and fiscal year 4-year 4-year 2-year 2-year Proprietary Total1 4-year 4-year 2-year 2-year Proprietary Total
Stafford SubsidizedFY97 N 921 283 86 3 113 1,405 $ 4,235 1,432 221 9 336 6,233
% 65.5 20.1 6.1 0.2 8.1 100.0 % 68.0 23.0 3.6 0.1 5.4 100.0FY98 N 912 285 86 4 124 1,411 $ 4,127 1,415 220 12 367 6,141
% 64.6 20.2 6.1 0.3 8.8 100.0 % 67.2 23.0 3.6 0.2 6.0 100.0FY99 N 848 282 80 4 127 1,342 $ 3,742 1,347 204 11 383 5,686
% 63.2 21.0 6.0 0.3 9.5 100.0 % 65.8 23.7 3.6 0.2 6.7 100.0FY00 N 868 303 82 3 128 1,384 $ 3,888 1,541 210 9 385 6,033
% 62.7 21.9 5.9 0.2 9.2 100.0 % 64.5 25.5 3.5 0.1 6.4 100.0Stafford Unsubsidized
FY97 N 541 136 42 2 83 805 $ 2,390 821 117 7 281 3,617% 67.2 17.0 5.3 0.3 10.3 100.0 % 66.1 22.7 3.2 0.2 7.8 100.0
FY98 N 557 146 43 3 93 842 $ 2,476 868 118 9 316 3,787 % 66.2 17.3 5.1 0.4 11.0 100.0 % 65.4 22.9 3.1 0.2 8.3 100.0
FY99 N 566 148 42 3 97 856 $ 2,512 887 116 9 332 3,855 % 66.1 17.3 4.9 0.4 11.3 100.0 % 65.1 23.0 3.0 0.2 8.6 100.0
FY00 N 621 171 45 3 97 936 $ 2,850 1,090 125 8 334 4,408 % 66.3 18.3 4.8 0.3 10.3 100.0 % 64.7 24.7 2.8 0.2 7.6 100.0
PLUS loansFY97 N 107 36 1 0 12 157 $ 686 311 4 2 65 1,068
% 68.4 22.9 0.7 0.2 7.8 100.0 % 64.3 29.1 0.4 0.1 6.1 100.0 FY98 N 114 38 1 0 14 167 $ 765 346 5 2 78 1,198
% 68.1 22.6 0.8 0.3 8.2 100.0 % 63.9 28.9 0.4 0.2 6.5 100.0 FY99 N 107 38 1 0 16 163 $ 713 351 5 2 92 1,162
% 65.5 23.6 0.7 0.3 9.9 100.0 % 61.3 30.2 0.4 0.2 7.9 100.0 FY00 N 123 43 1 0 18 186 $ 854 423 6 2 108 1,393
% 66.0 23.2 0.8 0.2 9.8 100.0 % 61.3 30.3 0.4 0.1 7.8 100.0 FDLP total
FY97 N 1,568 455 129 6 209 2,367 $ 7,311 2,564 342 18 683 10,918% 66.3 19.2 5.5 0.2 8.8 100.0 % 67.0 23.5 3.1 0.2 6.3 100.0
FY98 N 1,583 469 130 8 230 2,420 $ 7,368 2,629 343 24 761 11,125% 65.4 19.4 5.4 0.3 9.5 100.0 % 66.2 23.6 3.1 0.2 6.8 100.0
FY99 N 1,521 469 123 8 240 2,361 $ 6,966 2,585 325 22 807 10,703% 64.4 19.9 5.2 0.3 10.2 100.0 % 65.1 24.1 3.0 0.2 7.5 100.0
FY00 N 1,611 517 129 6 243 2,506 $ 7,593 3,054 341 19 827 11,833% 64.3 20.6 5.1 0.2 9.7 100.0 % 64.2 25.8 2.9 0.2 7.0 100.0
1 Total borrowers column may not equal totals provided in other tables. This column represents the sum of each distinct institution type reported for the borrower during the fiscal year.Since borrowers can change institution type over the fiscal year and they may change this at different rates than other characteristics, the total borrower counts in tables that describe other characteristics will naturally be different.
NOTES: Volume measure is Direct Loan commitments. Details may not add to totals due to rounding. Calculations are based on numbers before rounding. 0 (in thousands) indicates a number less than 500. 0 (in millions) indicates a number less than 500,000. 0.0 indicates a number less than 0.05. Data for earlier years appear in table A-11 in appendix I.
SOURCE: U.S. Department of Education, Office of Postsecondary Education, National Student Loan Data System.

Loan Volume Com
mitm
ents
Federal Student Loan Programs Data Book � FY 1997-FY 2000 47
Percent of total Stafford Subsidized dollars
Stafford Subsidized (Dollars)
Fisc
al y
ear
Public 4-year
Private 4-year
Public 2-year
Proprietary
0 20% 40% 60% 80% 100%
FY97
FY98
FY99
FY00 64.5
65.8
67.2
68.0
25.5
23.7
23.0
23.0
3.5
3.6
3.6
3.6
6.4
6.7
6.0
5.4
Percent of total Stafford Unsubsidized dollars
Stafford Unsubsidized (Dollars)
Fisc
al y
ear
Public 4-year
Private 4-year
Public 2-year
Proprietary
0 20% 40% 60% 80% 100%
FY97
FY98
FY99
FY00 64.7
65.1
65.4
66.1
24.7
23.0
22.9
22.7
2.8
3.0
3.1
3.2
7.6
8.6
8.3
7.8
Figure 11. Percentage distribution of Federal Direct Loan Program (FDLP) dollars, by type of institution: FY 1997-FY 2000
NOTE: Due to low loan volume, data for private 2-year institutions are not shown in this figure. Data for these entities can be found in table 11.
SOURCE: U.S. Department of Education, Office of Postsecondary Education, National Student Loan Data System.
NOTE: Due to low loan volume, data for private 2-year institutions are not shown in this figure. Data for these entities can be found in table 11.
SOURCE: U.S. Department of Education, Office of Postsecondary Education, National Student Loan Data System.
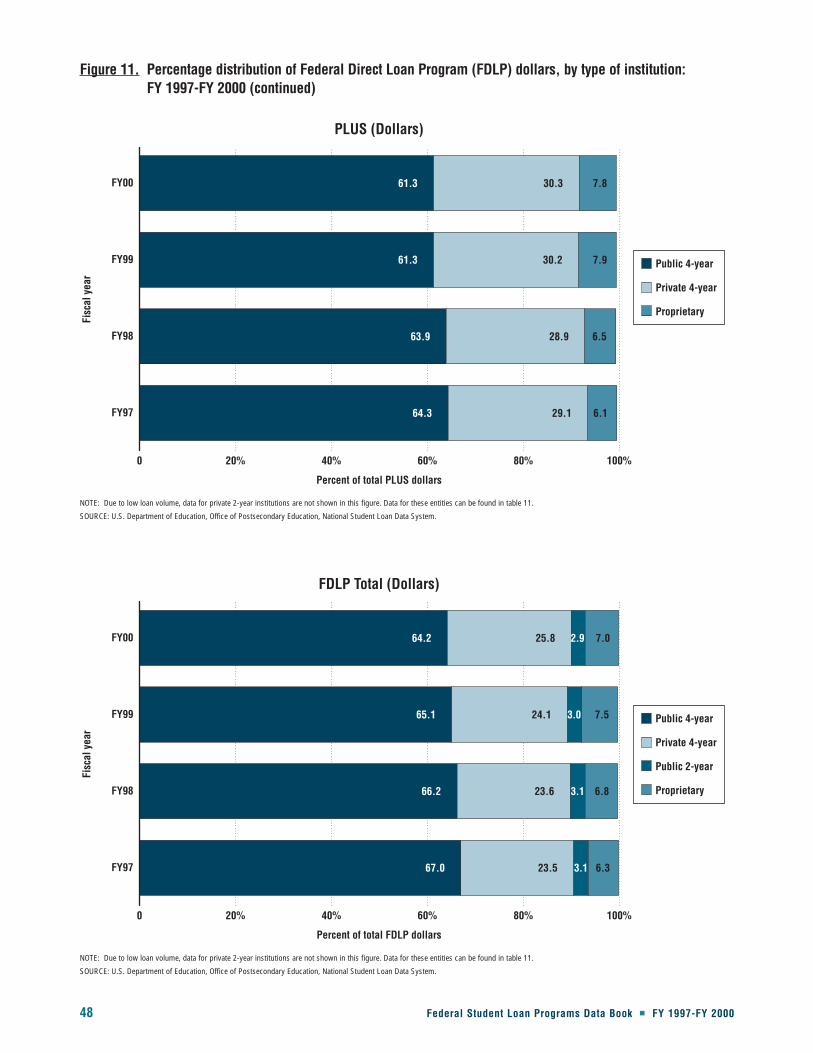
48 Federal Student Loan Programs Data Book � FY 1997-FY 2000
Percent of total PLUS dollars
PLUS (Dollars)
Fisc
al y
ear
Public 4-year
Private 4-year
Proprietary
0 20% 40% 60% 80% 100%
FY97
FY98
FY99
FY00 61.3
61.3
63.9
64.3
30.3
30.2
28.9
29.1
7.8
7.9
6.5
6.1
Percent of total FDLP dollars
FDLP Total (Dollars)
Fisc
al y
ear
Public 4-year
Private 4-year
Public 2-year
Proprietary
0 20% 40% 60% 80% 100%
FY97
FY98
FY99
FY00 64.2
65.1
66.2
67.0
25.8
24.1
23.6
23.5
2.9
3.0
3.1
3.1
7.0
7.5
6.8
6.3
Figure 11. Percentage distribution of Federal Direct Loan Program (FDLP) dollars, by type of institution: FY 1997-FY 2000 (continued)
NOTE: Due to low loan volume, data for private 2-year institutions are not shown in this figure. Data for these entities can be found in table 11.
SOURCE: U.S. Department of Education, Office of Postsecondary Education, National Student Loan Data System.
NOTE: Due to low loan volume, data for private 2-year institutions are not shown in this figure. Data for these entities can be found in table 11.
SOURCE: U.S. Department of Education, Office of Postsecondary Education, National Student Loan Data System.

Loan Volume Com
mitm
ents
Federal Student Loan Programs Data Book � FY 1997-FY 2000 49
Percent of total Stafford Subsidized borrowers
Stafford Subsidized (Borrowers)
Fisc
al y
ear
Public 4-year
Private 4-year
Public 2-year
Proprietary
0 20% 40% 60% 80% 100%
FY97
FY98
FY99
FY00 62.7
63.2
64.6
65.5
21.9
21.0
20.2
20.1
5.9
6.0
6.1
6.1
9.2
9.5
8.8
8.1
Percent of total Stafford Unsubsidized borrowers
Stafford Unsubsidized (Borrowers)
Fisc
al y
ear
Public 4-year
Private 4-year
Public 2-year
Proprietary
0 20% 40% 60% 80% 100%
FY97
FY98
FY99
FY00 66.3
66.1
66.2
67.2
18.3
17.3
17.3
17.0
4.8
4.9
5.1
5.3
10.3
11.3
11.0
10.3
Figure 12. Percentage distribution of Federal Direct Loan Program (FDLP) borrowers, by type of institution: FY 1997-FY 2000
NOTE: Due to low loan volume, data for private 2-year institutions are not shown in this figure. Data for these entities can be found in table 11.
SOURCE: U.S. Department of Education, Office of Postsecondary Education, National Student Loan Data System.
NOTE: Due to low loan volume, data for private 2-year institutions are not shown in this figure. Data for these entities can be found in table 11.
SOURCE: U.S. Department of Education, Office of Postsecondary Education, National Student Loan Data System.
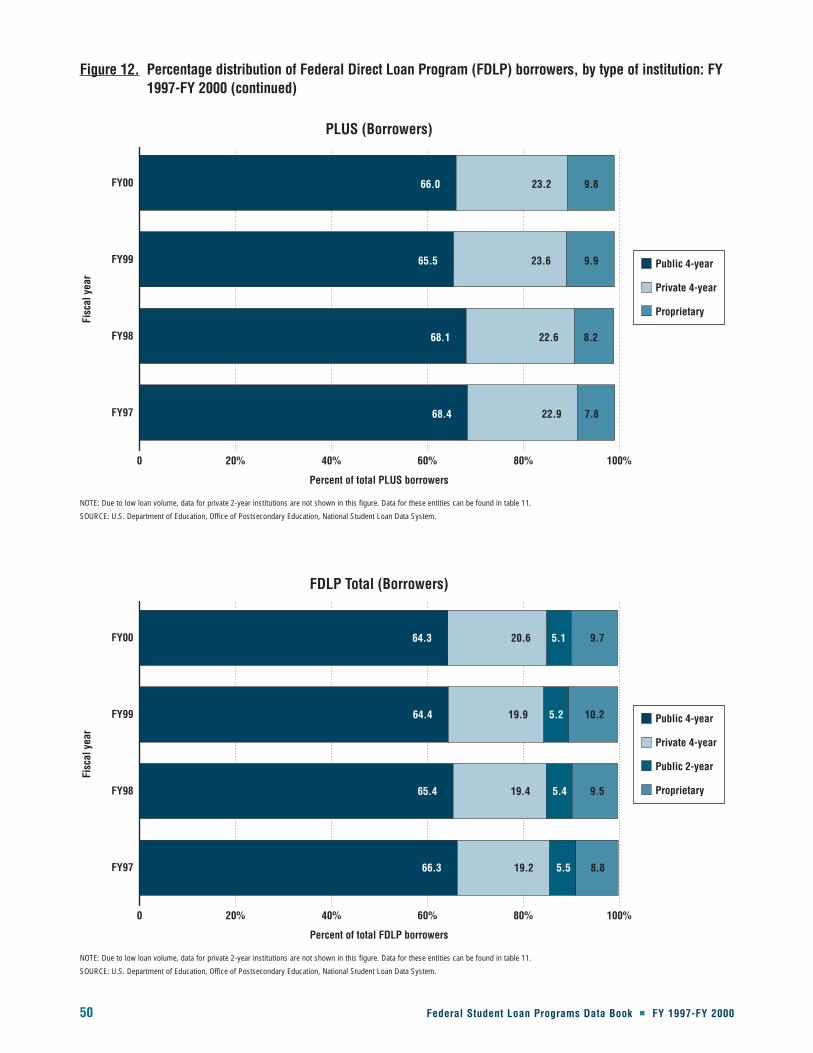
50 Federal Student Loan Programs Data Book � FY 1997-FY 2000
Percent of total PLUS borrowers
PLUS (Borrowers)
Fisc
al y
ear
Public 4-year
Private 4-year
Proprietary
0 20% 40% 60% 80% 100%
FY97
FY98
FY99
FY00 66.0
65.5
68.1
68.4
23.2
23.6
22.6
22.9
9.8
9.9
8.2
7.8
Percent of total FDLP borrowers
FDLP Total (Borrowers)
Fisc
al y
ear
Public 4-year
Private 4-year
Public 2-year
Proprietary
0 20% 40% 60% 80% 100%
FY97
FY98
FY99
FY00 64.3
64.4
65.4
66.3
20.6
19.9
19.4
19.2
5.1
5.2
5.4
5.5
9.7
10.2
9.5
8.8
Figure 12. Percentage distribution of Federal Direct Loan Program (FDLP) borrowers, by type of institution: FY1997-FY 2000 (continued)
NOTE: Due to low loan volume, data for private 2-year institutions are not shown in this figure. Data for these entities can be found in table 11.
SOURCE: U.S. Department of Education, Office of Postsecondary Education, National Student Loan Data System.
NOTE: Due to low loan volume, data for private 2-year institutions are not shown in this figure. Data for these entities can be found in table 11.
SOURCE: U.S. Department of Education, Office of Postsecondary Education, National Student Loan Data System.
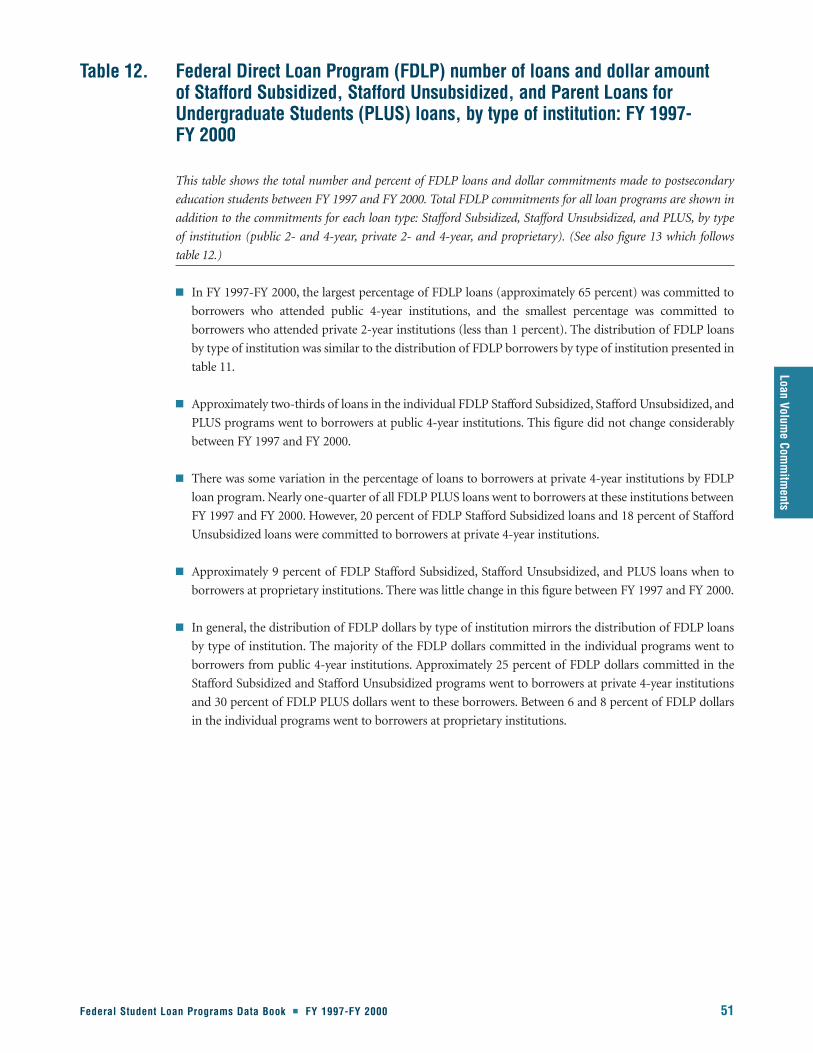
Loan Volume Com
mitm
ents
Federal Student Loan Programs Data Book � FY 1997-FY 2000 51
This table shows the total number and percent of FDLP loans and dollar commitments made to postsecondary
education students between FY 1997 and FY 2000. Total FDLP commitments for all loan programs are shown in
addition to the commitments for each loan type: Stafford Subsidized, Stafford Unsubsidized, and PLUS, by type
of institution (public 2- and 4-year, private 2- and 4-year, and proprietary). (See also figure 13 which follows
table 12.)
� In FY 1997-FY 2000, the largest percentage of FDLP loans (approximately 65 percent) was committed to
borrowers who attended public 4-year institutions, and the smallest percentage was committed to
borrowers who attended private 2-year institutions (less than 1 percent). The distribution of FDLP loans
by type of institution was similar to the distribution of FDLP borrowers by type of institution presented in
table 11.
� Approximately two-thirds of loans in the individual FDLP Stafford Subsidized, Stafford Unsubsidized, and
PLUS programs went to borrowers at public 4-year institutions. This figure did not change considerably
between FY 1997 and FY 2000.
� There was some variation in the percentage of loans to borrowers at private 4-year institutions by FDLP
loan program. Nearly one-quarter of all FDLP PLUS loans went to borrowers at these institutions between
FY 1997 and FY 2000. However, 20 percent of FDLP Stafford Subsidized loans and 18 percent of Stafford
Unsubsidized loans were committed to borrowers at private 4-year institutions.
� Approximately 9 percent of FDLP Stafford Subsidized, Stafford Unsubsidized, and PLUS loans when to
borrowers at proprietary institutions. There was little change in this figure between FY 1997 and FY 2000.
� In general, the distribution of FDLP dollars by type of institution mirrors the distribution of FDLP loans
by type of institution. The majority of the FDLP dollars committed in the individual programs went to
borrowers from public 4-year institutions. Approximately 25 percent of FDLP dollars committed in the
Stafford Subsidized and Stafford Unsubsidized programs went to borrowers at private 4-year institutions
and 30 percent of FDLP PLUS dollars went to these borrowers. Between 6 and 8 percent of FDLP dollars
in the individual programs went to borrowers at proprietary institutions.
Table 12. Federal Direct Loan Program (FDLP) number of loans and dollar amount of Stafford Subsidized, Stafford Unsubsidized, and Parent Loans for Undergraduate Students (PLUS) loans, by type of institution: FY 1997-FY 2000
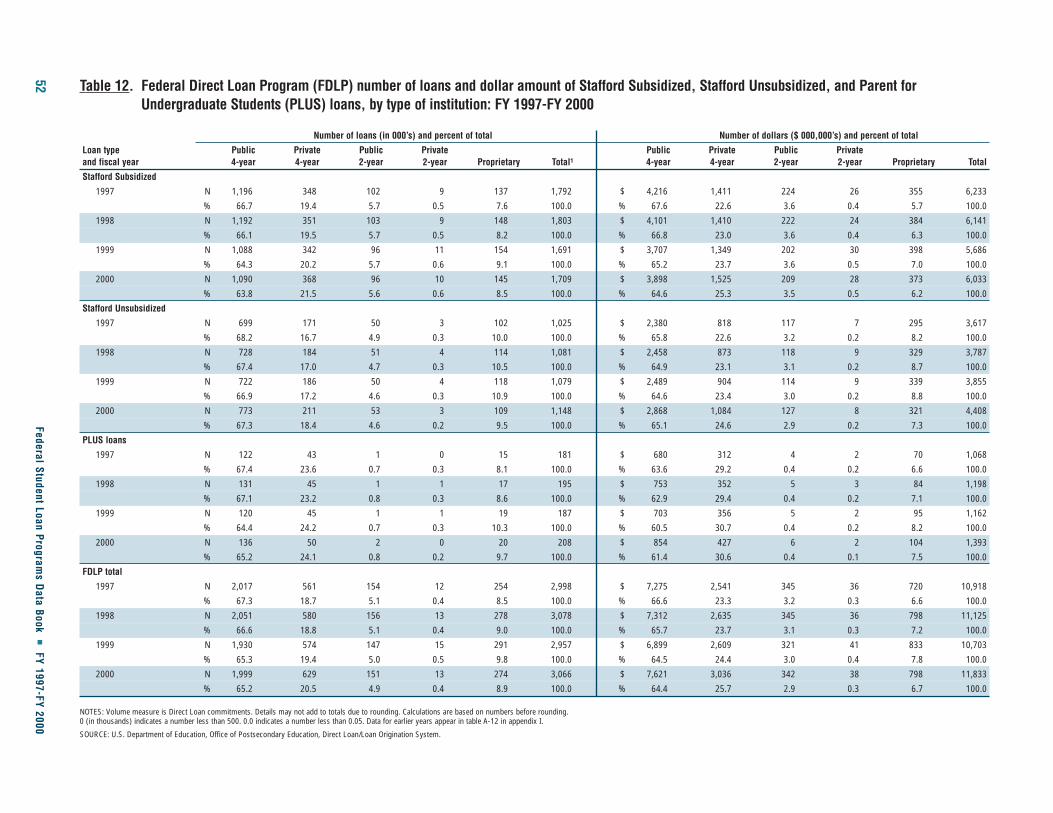
52Federal Student Loan Program
s Data Book
�FY 1997-FY 2000
Table 12. Federal Direct Loan Program (FDLP) number of loans and dollar amount of Stafford Subsidized, Stafford Unsubsidized, and Parent forUndergraduate Students (PLUS) loans, by type of institution: FY 1997-FY 2000
Number of loans (in 000’s) and percent of total Number of dollars ($ 000,000’s) and percent of total
Loan type Public Private Public Private Public Private Public Private and fiscal year 4-year 4-year 2-year 2-year Proprietary Total1 4-year 4-year 2-year 2-year Proprietary Total
Stafford Subsidized
1997 N 1,196 348 102 9 137 1,792 $ 4,216 1,411 224 26 355 6,233
% 66.7 19.4 5.7 0.5 7.6 100.0 % 67.6 22.6 3.6 0.4 5.7 100.0
1998 N 1,192 351 103 9 148 1,803 $ 4,101 1,410 222 24 384 6,141
% 66.1 19.5 5.7 0.5 8.2 100.0 % 66.8 23.0 3.6 0.4 6.3 100.0
1999 N 1,088 342 96 11 154 1,691 $ 3,707 1,349 202 30 398 5,686
% 64.3 20.2 5.7 0.6 9.1 100.0 % 65.2 23.7 3.6 0.5 7.0 100.0
2000 N 1,090 368 96 10 145 1,709 $ 3,898 1,525 209 28 373 6,033
% 63.8 21.5 5.6 0.6 8.5 100.0 % 64.6 25.3 3.5 0.5 6.2 100.0
Stafford Unsubsidized
1997 N 699 171 50 3 102 1,025 $ 2,380 818 117 7 295 3,617
% 68.2 16.7 4.9 0.3 10.0 100.0 % 65.8 22.6 3.2 0.2 8.2 100.0
1998 N 728 184 51 4 114 1,081 $ 2,458 873 118 9 329 3,787
% 67.4 17.0 4.7 0.3 10.5 100.0 % 64.9 23.1 3.1 0.2 8.7 100.0
1999 N 722 186 50 4 118 1,079 $ 2,489 904 114 9 339 3,855
% 66.9 17.2 4.6 0.3 10.9 100.0 % 64.6 23.4 3.0 0.2 8.8 100.0
2000 N 773 211 53 3 109 1,148 $ 2,868 1,084 127 8 321 4,408
% 67.3 18.4 4.6 0.2 9.5 100.0 % 65.1 24.6 2.9 0.2 7.3 100.0
PLUS loans
1997 N 122 43 1 0 15 181 $ 680 312 4 2 70 1,068
% 67.4 23.6 0.7 0.3 8.1 100.0 % 63.6 29.2 0.4 0.2 6.6 100.0
1998 N 131 45 1 1 17 195 $ 753 352 5 3 84 1,198
% 67.1 23.2 0.8 0.3 8.6 100.0 % 62.9 29.4 0.4 0.2 7.1 100.0
1999 N 120 45 1 1 19 187 $ 703 356 5 2 95 1,162
% 64.4 24.2 0.7 0.3 10.3 100.0 % 60.5 30.7 0.4 0.2 8.2 100.0
2000 N 136 50 2 0 20 208 $ 854 427 6 2 104 1,393
% 65.2 24.1 0.8 0.2 9.7 100.0 % 61.4 30.6 0.4 0.1 7.5 100.0
FDLP total
1997 N 2,017 561 154 12 254 2,998 $ 7,275 2,541 345 36 720 10,918
% 67.3 18.7 5.1 0.4 8.5 100.0 % 66.6 23.3 3.2 0.3 6.6 100.0
1998 N 2,051 580 156 13 278 3,078 $ 7,312 2,635 345 36 798 11,125
% 66.6 18.8 5.1 0.4 9.0 100.0 % 65.7 23.7 3.1 0.3 7.2 100.0
1999 N 1,930 574 147 15 291 2,957 $ 6,899 2,609 321 41 833 10,703
% 65.3 19.4 5.0 0.5 9.8 100.0 % 64.5 24.4 3.0 0.4 7.8 100.0
2000 N 1,999 629 151 13 274 3,066 $ 7,621 3,036 342 38 798 11,833
% 65.2 20.5 4.9 0.4 8.9 100.0 % 64.4 25.7 2.9 0.3 6.7 100.0
NOTES: Volume measure is Direct Loan commitments. Details may not add to totals due to rounding. Calculations are based on numbers before rounding. 0 (in thousands) indicates a number less than 500. 0.0 indicates a number less than 0.05. Data for earlier years appear in table A-12 in appendix I.
SOURCE: U.S. Department of Education, Office of Postsecondary Education, Direct Loan/Loan Origination System.

Loan Volume Com
mitm
ents
Federal Student Loan Programs Data Book � FY 1997-FY 2000 53
Percent of total Stafford Subsidized loans
Stafford Subsidized
Fisc
al y
ear
Public 4-year
Private 4-year
Public 2-year
Proprietary
0 20% 40% 60% 80% 100%
FY97
FY98
FY99
FY00 63.8
64.3
66.1
66.7
21.5
20.2
19.5
19.4
5.6
5.7
5.7
5.7
8.5
9.1
8.2
7.6
Percent of total Stafford Unsubsidized loans
Stafford Unsubsidized
Fisc
al y
ear
Public 4-year
Private 4-year
Public 2-year
Proprietary
0 20% 40% 60% 80% 100%
FY97
FY98
FY99
FY00 67.3
66.9
67.4
68.2
18.4
17.2
17.0
16.7
4.6
4.6
4.7
4.9
9.5
10.9
10.5
10.0
Figure 13. Percentage distribution of Federal Direct Loan Program (FDLP) loans, by type of institution: FY 1997-FY 2000
NOTE: Due to low loan volume, data for private 2-year institutions are not shown in this figure. Data for these entities can be found in table 12.
SOURCE: U.S. Department of Education, Office of Postsecondary Education, Direct Loan/Loan Origination System.
NOTE: Due to low loan volume, data for private 2-year institutions are not shown in this figure. Data for these entities can be found in table 12.
SOURCE: U.S. Department of Education, Office of Postsecondary Education, Direct Loan/Loan Origination System.
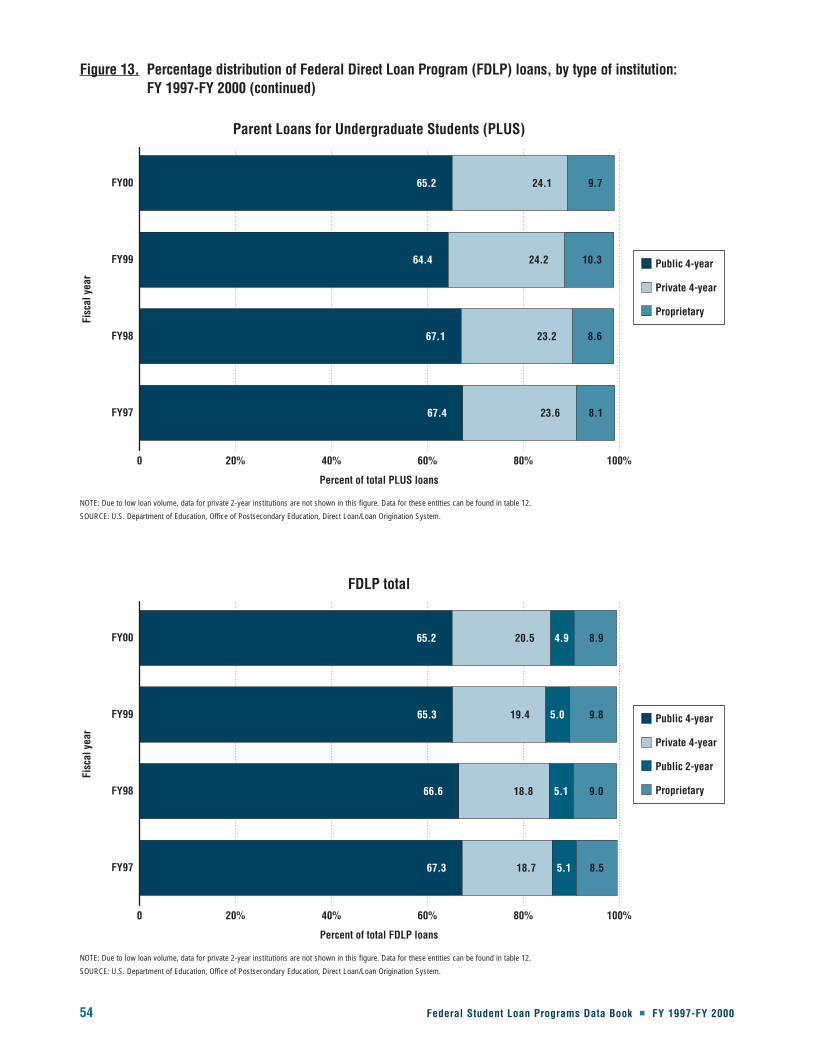
54 Federal Student Loan Programs Data Book � FY 1997-FY 2000
Percent of total PLUS loans
Parent Loans for Undergraduate Students (PLUS)
Fisc
al y
ear
Public 4-year
Private 4-year
Proprietary
0 20% 40% 60% 80% 100%
FY97
FY98
FY99
FY00 65.2
64.4
67.1
67.4
24.1
24.2
23.2
23.6
9.7
10.3
8.6
8.1
Percent of total FDLP loans
FDLP total
Fisc
al y
ear
Public 4-year
Private 4-year
Public 2-year
Proprietary
0 20% 40% 60% 80% 100%
FY97
FY98
FY99
FY00 65.2
65.3
66.6
67.3
20.5
19.4
18.8
18.7
4.9
5.0
5.1
5.1
8.9
9.8
9.0
8.5
Figure 13. Percentage distribution of Federal Direct Loan Program (FDLP) loans, by type of institution: FY 1997-FY 2000 (continued)
NOTE: Due to low loan volume, data for private 2-year institutions are not shown in this figure. Data for these entities can be found in table 12.
SOURCE: U.S. Department of Education, Office of Postsecondary Education, Direct Loan/Loan Origination System.
NOTE: Due to low loan volume, data for private 2-year institutions are not shown in this figure. Data for these entities can be found in table 12.
SOURCE: U.S. Department of Education, Office of Postsecondary Education, Direct Loan/Loan Origination System.

Loan Volume Com
mitm
ents
Federal Student Loan Programs Data Book � FY 1997-FY 2000 55
This table shows the number and percentage of FDLP borrowers and dollar commitments made to postsecondary
education students between FY 1997 and FY 2000, by academic level (freshman, sophomore, junior, senior, and
graduate students). Total FDLP commitments for all loan programs are shown in addition to the commitments
for each loan program: Stafford Subsidized, Stafford Unsubsidized, and PLUS. (See also figure 14 which follows
table 13.)
� The percent distribution of FDLP dollars by academic levels remained relatively stable from FY 1997
through FY 2000. Graduate students received the highest percentage of FDLP dollars over the period
(approximately 26 percent), followed by freshmen and seniors (approximately 20 percent each), juniors
(approximately 19 percent), and sophomores (approximately 14 percent).
� Within the Stafford Subsidized program, the percent distribution of dollar volume followed roughly the
same pattern as the overall FDLP, with one small exception. In the Stafford Subsidized program, freshmen
received a lower percentage (approximately 17 percent) and seniors received a higher percentage
(approximately 22 percent) than in the overall FDLP distribution.
� Within the Stafford Unsubsidized program, graduate students received the highest percentage of FDLP
dollars (approximately 33 percent). Each of the remaining academic levels had a slightly lower percentage
of Stafford Unsubsidized dollars than found in the overall FDLP distribution.
� Within the PLUS program the parents of dependent freshmen received the highest percentage of FDLP
dollars (approximately 45 percent), followed by the parents of dependent sophomores (approximately 24
percent), the parents of dependent juniors (approximately 17 percent), and the parents of dependent
seniors (approximately 13 percent). Graduate students are not eligible for PLUS loans.
Table 13. Federal Direct Loan Program (FDLP) number of borrowers and dollar amount of Stafford Subsidized, Stafford Unsubsidized, and Parent Loans for Undergraduate Students (PLUS) loans, by academic level: FY 1997-FY 2000

56Federal Student Loan Program
s Data Book
�FY 1997-FY 2000
Table 13. Federal Direct Loan Program (FDLP) number of borrowers and dollar amount of Stafford Subsidized, Stafford Unsubsidized, and Parent Loans for Undergraduate Students (PLUS) loans, by academic level: FY 1997-FY 2000
Loan type Number of borrowers (in 000’s) and percent of total Number of dollars ($ 000,000’s) and percent of total
and fiscal year Freshman Sophomore Junior Senior Graduate Total1 Freshman Sophomore Junior Senior Graduate Total
Stafford Subsidized1997 N 388 267 265 282 204 1,405 $ 1,067 909 1,293 1,357 1,607 6,233
% 27.6 19.0 18.8 20.1 14.5 100.0 % 17.1 14.6 20.7 21.8 25.8 100.01998 N 400 263 260 286 202 1,411 $ 1,095 874 1,238 1,342 1,592 6,141
% 28.3 18.6 18.4 20.3 14.3 100.0 % 17.8 14.2 20.2 21.9 25.9 100.01999 N 394 244 244 274 185 1,342 $ 1,052 795 1,127 1,248 1,464 5,686
% 29.4 18.2 18.2 20.4 13.8 100.0 % 18.5 14.0 19.8 22.0 25.7 100.02000 N 357 246 243 273 266 1,384 $ 974 828 1,160 1,277 1,794 6,033
% 25.8 17.8 17.5 19.7 19.2 100.0 % 16.1 13.7 19.2 21.2 29.7 100.0Stafford Unsubsidized
1997 N 201 136 147 168 154 805 $ 635 451 614 710 1,207 3,617% 24.9 16.8 18.3 20.9 19.1 100.0 % 17.5 12.5 17.0 19.6 33.4 100.0
1998 N 216 141 151 179 155 842 $ 685 466 628 750 1,259 3,787% 25.7 16.7 18.0 21.3 18.4 100.0 % 18.1 12.3 16.6 19.8 33.2 100.0
1999 N 224 139 154 187 152 856 $ 688 455 635 790 1,288 3,855% 26.2 16.3 17.9 21.8 17.8 100.0 % 17.8 11.8 16.5 20.5 33.4 100.0
2000 N 231 158 172 204 171 936 $ 723 530 745 898 1,512 4,408% 24.7 16.9 18.3 21.8 18.3 100.0 % 16.4 12.0 16.9 20.4 34.3 100.0
PLUS loans1997 N 71 38 27 19 — 157 $ 498 265 179 122 — 1,068
% 45.2 24.1 17.3 12.1 — 100.1 % 46.6 24.8 16.8 11.4 — 100.01998 N 73 39 30 23 — 167 $ 536 285 206 155 — 1,198
% 43.8 23.4 17.8 13.8 — 100.0 % 44.8 23.8 17.2 13.0 — 100.01999 N 73 37 29 24 — 163 $ 530 269 198 162 — 1,162
% 44.9 22.8 17.6 14.7 — 100.0 % 45.6 23.2 17.0 14.0 — 100.02000 N 82 43 32 27 — 186 $ 635 323 234 187 — 1,393
% 44.2 23.0 17.4 14.3 — 100.1 % 45.6 23.2 16.8 13.4 — 100.0FDLP total
1997 N 659 440 439 469 357 2,367 $ 2,169 1,614 2,089 2,198 2,842 10,918% 27.8 18.6 18.5 19.8 15.1 100.0 % 19.9 14.8 19.1 20.1 26.0 100.0
1998 N 689 443 441 488 357 2,420 $ 2,294 1,616 2,073 2,255 2,874 11,125 % 28.5 18.3 18.2 20.2 14.8 100.0 % 20.6 14.5 18.6 20.3 25.8 100.0
1999 N 691 421 426 485 338 2,361 $ 2,255 1,515 1,961 2,204 2,764 10,703% 29.3 17.8 18.1 20.5 14.3 100.0 % 21.1 14.2 18.3 20.6 25.8 100.0
2000 N 670 447 447 503 437 2,506 $ 2,310 1,675 2,141 2,367 3,327 11,833% 26.7 17.8 17.8 20.1 17.5 100.0 % 19.5 14.2 18.1 20.0 28.1 100.0
— Graduate students are not eligible to receive PLUS loans.1 Total borrowers column may not equal totals provided in other tables. This column represents the sum of each distinct academic level reported for the borrower during the fiscal year.
Since borrowers can change academic level over the fiscal year and they may change this at different rates than other characteristics, the total borrower counts in tables that describe other characteristics will naturally be different.
NOTES: Volume measure is Direct Loan commitments. Details may not add to totals due to rounding. Calculations are based on numbers before rounding.Data for earlier years appear in table A-13 in appendix I.
SOURCE: U.S. Department of Education, Office of Postsecondary Education, National Student Loan Data System.

Loan Volume Com
mitm
ents
Federal Student Loan Programs Data Book � FY 1997-FY 2000 57
Percent of total Stafford Subsidized dollars
Stafford Subsidized
Fisc
al y
ear
Freshman
Sophomore
Junior
Senior
Graduate
0 20% 40% 60% 80% 100%
FY97
FY98
FY99
FY00 16.1
18.5
17.8
17.1
13.7
14.0
14.2
14.6
19.2
19.8
20.2
20.7
21.2
22.0
21.9
21.8
29.7
25.7
25.9
25.8
Percent of total Stafford Unsubsidized dollars
Stafford Unsubsidized
Fisc
al y
ear
Freshman
Sophomore
Junior
Senior
Graduate
0 20% 40% 60% 80% 100%
FY97
FY98
FY99
FY00 16.4
17.8
18.1
17.5
12.0
11.8
12.3
12.5
16.9
16.5
16.6
17.0
20.4
20.5
19.8
19.6
34.3
33.4
33.2
33.4
Figure 14. Percentage distribution of Federal Direct Loan Program (FDLP) dollars, by academic level: FY 1997-FY 2000
SOURCE: U.S. Department of Education, Office of Postsecondary Education, Direct Loan/Loan Origination System.
SOURCE: U.S. Department of Education, Office of Postsecondary Education, Direct Loan/Loan Origination System.

58 Federal Student Loan Programs Data Book � FY 1997-FY 2000
Percent of total PLUS dollars
Parent Loans for Undergraduate Students (PLUS)
Fisc
al y
ear
Freshman
Sophomore
Junior
Senior
0 20% 40% 60% 80% 100%
FY97
FY98
FY99
FY00 45.6
45.6
44.8
46.6
23.2
23.2
23.8
24.8
16.8
17.0
17.2
16.8
13.4
14.0
13.0
11.4
Percent of total FDLP dollars
FDLP total
Fisc
al y
ear
Freshman
Sophomore
Junior
Senior
Graduate
0 20% 40% 60% 80% 100%
FY97
FY98
FY99
FY00 19.5
21.1
20.6
19.9
14.2
14.2
14.5
14.8
18.1
18.3
18.6
19.1
20.0
20.6
20.3
20.1
28.1
25.8
25.8
26.0
Figure 14. Percentage distribution of Federal Direct Loan Program (FDLP) dollars, by academic level: FY 1997-FY 2000 (continued)
NOTE: Graduate students are not eligible to receive PLUS loans.
SOURCE: U.S. Department of Education, Office of Postsecondary Education, Direct Loan/Loan Origination System.
SOURCE: U.S. Department of Education, Office of Postsecondary Education, Direct Loan/Loan Origination System.

Loan Volume Com
mitm
ents
Federal Student Loan Programs Data Book � FY 1997-FY 2000 59
This table shows the number and percentage of FFEL borrowers and dollar commitments made to postsecondary
education students between FY 1997 and FY 2000, by academic level (freshman, sophomore, junior, senior, and
graduate students). Total FFEL commitments for all loan programs are shown in addition to the commitments
for each loan program: Stafford Subsidized, Stafford Unsubsidized, and PLUS. (See also figure 15 which follows
table 14.)
� In FY 1997-FY 2000, the proportion of total FFEL dollars committed to each academic level remained
relatively stable. Graduate students received the largest proportion, about 32 percent annually, followed by
freshmen, who received about 23 percent of the total FFEL dollars committed annually. The remaining
committed dollars were spread fairly evenly across sophomores, juniors, and seniors, at about 15 percent
annually.
� Contrary to the Stafford Subsidized program, which generally mirrored the overall FFEL distribution, the
Stafford Unsubsidized program committed an even greater proportion of total FFEL dollars to graduate
students. About 43 percent of the total Stafford Unsubsidized dollars were committed to graduate students
annually from FY 1997 to FY 2000. The proportion of Stafford Unsubsidized dollars going to freshmen,
sophomores, juniors, and seniors was lower by two to four percentage points for each of the academic
levels.
� The parents of dependent freshmen received almost half of the PLUS program dollars, while the parents of
dependent sophomores received another quarter. The parents of dependent juniors and seniors received
about 15 and 12 percent of total PLUS program dollars, respectively. This pattern held each year from
FY 1997 to FY 2000.
Table 14. Federal Family Education Loan (FFEL) program number of borrowers and dollar amount of Stafford Subsidized, Stafford Unsubsidized, and Parent Loans for Undergraduate Students (PLUS) loans, by academic level: FY 1997-FY 2000

60Federal Student Loan Program
s Data Book
�FY 1997-FY 2000
Table 14. Federal Family Education Loan (FFEL) program number of borrowers and dollar amount of Stafford Subsidized, Stafford Unsubsidized, and ParentLoans for Undergraduate Students (PLUS) loans, by academic level:FY 1997-FY 2000
Loan type Number of borrowers (in 000’s) and percent of total Number of dollars ($ 000,000’s) and percent of total
and fiscal year Freshman Sophomore Junior Senior Graduate Total1 Freshman Sophomore Junior Senior Graduate Total
Stafford Subsidized1997 N 910 558 417 445 425 2,756 $ 2,470 1,840 2,038 2,093 3,538 11,985
% 33.0 20.2 15.1 16.2 15.4 100.0 % 20.6 15.4 17.0 17.5 29.5 100.01998 N 918 562 418 446 431 2,776 $ 2,485 1,841 2,031 2,087 3,578 12,027
% 33.1 20.2 15.1 16.1 15.5 100.0 % 20.7 15.3 16.9 17.4 29.8 100.01999 N 913 547 411 433 431 2,736 $ 2,462 1,788 1,975 2,004 3,575 11,862
% 33.4 20.0 15.0 15.8 15.8 100.0 % 20.8 15.1 16.6 16.9 30.1 100.02000 N 963 572 432 449 448 2,864 $ 2,632 1,897 2,114 2,116 3,804 12,564
% 33.6 20.0 15.1 15.7 15.6 100.0 % 20.9 15.1 16.8 16.8 30.3 100.0Stafford Unsubsidized
1997 N 472 285 225 254 350 1,587 $ 1,493 915 931 1,051 3,300 7,689% 29.8 18.0 14.2 16.0 22.1 100.0 % 19.4 11.9 12.1 13.7 42.9 100.0
1998 N 501 302 238 269 362 1,672 $ 1,602 974 996 1,129 3,571 8,275 % 30.0 18.0 14.2 16.1 21.7 100.0 % 19.4 11.8 12.0 13.6 43.2 100.0
1999 N 539 318 253 281 380 1,770 $ 1,745 1,047 1,082 1,215 3,980 9,079 % 30.5 18.0 14.3 15.9 21.4 100.0 % 19.2 11.5 11.9 13.4 43.8 100.0
2000 N 622 358 288 311 408 1,987 $ 2,081 1,219 1,280 1,400 4,502 10,482 % 31.3 18.0 14.5 15.6 20.5 100.0 % 19.9 11.6 12.2 13.4 42.9 100.0
PLUS loans1997 N 134 68 41 32 — 276 $ 952 487 304 239 — 1,985
% 48.6 24.8 14.8 11.8 100.0 % 48.0 24.5 15.3 12.0 100.01998 N 143 73 43 34 — 294 $ 1,059 541 331 259 — 2,194
% 48.6 24.9 14.7 11.7 100.0 % 48.3 24.7 15.1 11.8 100.01999 N 148 76 44 35 — 303 $ 1,162 590 351 272 — 2,383
% 48.8 25.2 14.6 11.4 100.0 % 48.9 24.8 14.8 11.5 100.02000 N 155 78 47 36 — 316 $ 1,298 630 387 295 — 2,610
% 49.0 24.8 14.9 11.4 100.0 % 49.7 24.1 14.8 11.3 100.0FFEL total
1997 N 1,517 911 683 732 776 4,618 $ 4,915 3,243 3,274 3,383 6,837 21,659 % 32.8 19.7 14.8 15.8 16.8 100.0 % 22.7 15.0 15.1 15.6 31.6 100.0
1998 N 1,563 936 700 750 793 4,743 $ 5,145 3,356 3,359 3,475 7,149 22,497 % 32.9 19.7 14.8 15.8 16.7 100.0 % 22.9 14.9 14.9 15.4 31.8 100.0
1999 N 1,600 941 708 748 811 4,808 $ 5,369 3,425 3,408 3,491 7,555 23,324 % 33.3 19.6 14.7 15.6 16.9 100.0 % 23.0 14.7 14.6 15.0 32.4 100.0
2000 N 1,740 1,009 767 796 856 5,168 $ 6,011 3,746 3,781 3,811 8,306 25,656 % 33.7 19.5 14.8 15.4 16.6 100.0 % 23.4 14.6 14.7 14.9 32.4 100.0
— Graduate students are not eligible to receive PLUS loans.1 Total borrowers column may not equal totals provided in other tables. This column represents the sum of each distinct academic level reported for the borrower during the fiscal year.
Since borrowers can change academic level over the fiscal year and they may change this at different rates than other characteristics, the total borrower counts in tables that describe other characteristics will naturally be different. Totals also include data from a small number of borrowers who were missing on academic level.
NOTES: Volume measure is FFEL commitments. Details may not add to totals due to rounding.Calculations are based on numbers before rounding.
SOURCE: U.S. Department of Education, Office of Postsecondary Education, National Student Loan Data System.

Percent of total Stafford Subsidized dollars
Stafford Subsidized
Fisc
al y
ear
Freshman
Sophomore
Junior
Senior
Graduate
0 20% 40% 60% 80% 100%
FY97
FY98
FY99
FY00 20.9
20.8
20.7
20.6
15.1
15.1
15.3
15.4
16.8
16.6
16.9
17.0
16.8
16.9
17.4
17.5
30.3
30.1
29.8
29.5
Percent of total Stafford Unsubsidized dollars
Stafford Unsubsidized
Fisc
al y
ear
Freshman
Sophomore
Junior
Senior
Graduate
0 20% 40% 60% 80% 100%
FY97
FY98
FY99
FY00 19.9
19.2
19.4
19.4
11.6
11.5
11.8
11.9
12.2
11.9
12.0
12.1
13.4
13.4
13.6
13.7
42.9
43.8
43.2
42.9
Figure 15. Percentage distribution of Federal Family Education Loan (FFEL) dollars, by academic level: FY 1997-FY 2000
SOURCE: U.S. Department of Education, Office of Postsecondary Education, National Student Loan Data System.
SOURCE: U.S. Department of Education, Office of Postsecondary Education, National Student Loan Data System.
Federal Student Loan Programs Data Book � FY 1997-FY 2000 61
Loan Volume Com
mitm
ents

Percent of total PLUS dollars
Parent Loans for Undergraduate Students (PLUS)
Fisc
al y
ear
Freshman
Sophomore
Junior
Senior
0 20% 40% 60% 80% 100%
FY97
FY98
FY99
FY00 49.7
48.9
48.3
48.0
24.1
24.8
24.7
24.5
14.8
14.8
15.1
15.3
11.3
11.5
11.8
12.0
Percent of total FFEL dollars
FFEL total
Fisc
al y
ear
Freshman
Sophomore
Junior
Senior
Graduate
0 20% 40% 60% 80% 100%
FY97
FY98
FY99
FY00 23.4
23.0
22.9
22.7
14.6
14.7
14.9
15.0
14.7
14.6
14.9
15.1
14.9
15.0
15.4
15.6
32.4
32.4
31.8
31.6
Figure 15. Percentage distribution of Federal Family Education Loan (FFEL) dollars, by academic level: FY 1997-FY 2000 (continued)
NOTE: Graduate students are not eligible to receive PLUS loans.
SOURCE: U.S. Department of Education, Office of Postsecondary Education, National Student Loan Data System.
SOURCE: U.S. Department of Education, Office of Postsecondary Education, National Student Loan Data System.
62 Federal Student Loan Programs Data Book � FY 1997-FY 2000
Loan Volume Com
mitm
ents
Federal Student Loan Programs Data Book � FY 1997-FY 2000 63
This table summarizes key information on the top 100 lenders of the FFEL program for FY 1997-FY 2000. Lenders
are ranked according to the dollar amount guaranteed in each fiscal year. The lender name, city, and state are also
reported as is the percent of the total FFEL program loan amount that is captured by the top 10, 25, 50, 75, and
100 guarantors nationally.
� In FY 2000, Citicorp was the largest originator of loans with $2.1 billion originated. Bank One was the
largest originator of FFEL program loans in FY 1998 and FY 1999, with $1.8 billion and $1.9 billion
originated, respectively. Chase Manhattan Bank was the largest originator of FFEL program loans in
FY 1997 ($1.7 billion).
� The top 100 lenders comprised 2.4, 2.4, 2.7, and 2.8 percent of all lenders from FY 1997 to FY 2000,
respectively. These same lenders comprised 87.1, 88.5, 89.7, and 90.1 percent of the national FFEL loan
volume from FY 1997-FY 2000, respectively.
� In each of the three years from FY 1998-FY 2000, the top 10 lenders originated about one-half of all dollars
committed to the FFEL program (51.8, 51.7, and 51.5 percent, respectively).
� From FY 1997-FY 2000, the top 50 lenders originated approximately 80 percent of all FFEL dollar
commitments (78.0, 79.3, 82.1, and 82.3 percent, respectively).
Table 15. Federal Family Education Loan (FFEL) program top 100 originators:FY 1997-FY 2000
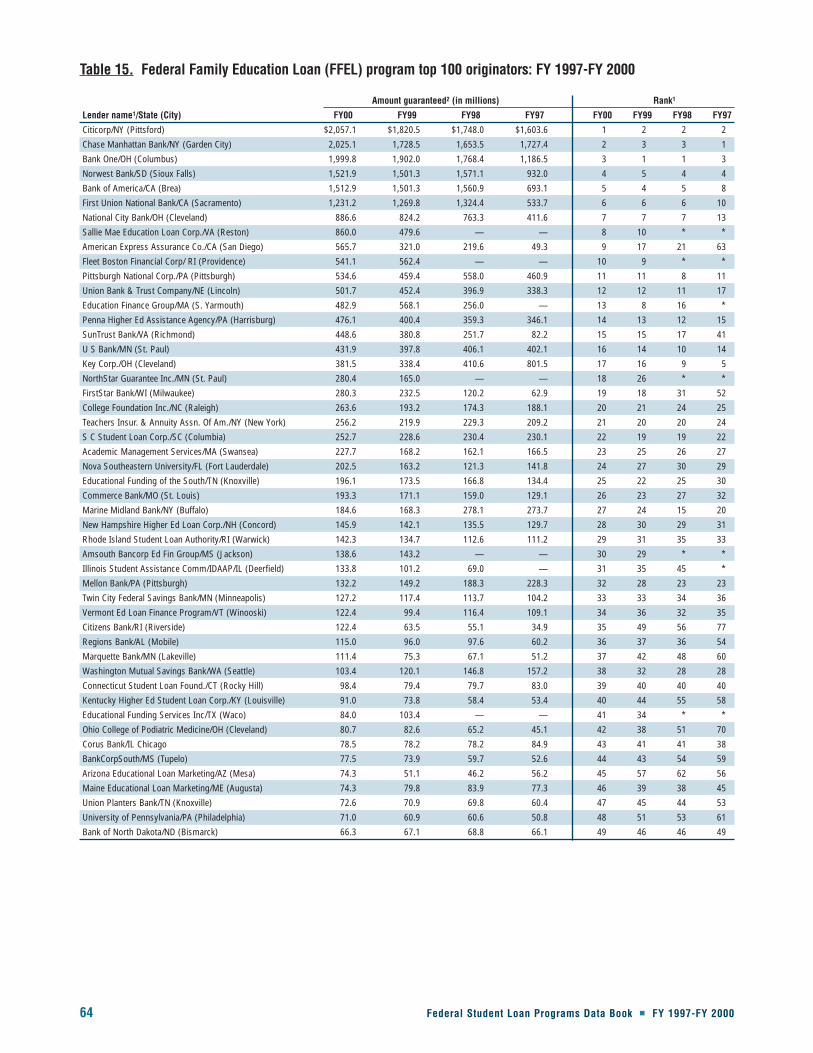
64 Federal Student Loan Programs Data Book � FY 1997-FY 2000
Table 15. Federal Family Education Loan (FFEL) program top 100 originators: FY 1997-FY 2000
Amount guaranteed2 (in millions) Rank1
Lender name1/State (City) FY00 FY99 FY98 FY97 FY00 FY99 FY98 FY97
Citicorp/NY (Pittsford) $2,057.1 $1,820.5 $1,748.0 $1,603.6 1 2 2 2
Chase Manhattan Bank/NY (Garden City) 2,025.1 1,728.5 1,653.5 1,727.4 2 3 3 1
Bank One/OH (Columbus) 1,999.8 1,902.0 1,768.4 1,186.5 3 1 1 3
Norwest Bank/SD (Sioux Falls) 1,521.9 1,501.3 1,571.1 932.0 4 5 4 4
Bank of America/CA (Brea) 1,512.9 1,501.3 1,560.9 693.1 5 4 5 8
First Union National Bank/CA (Sacramento) 1,231.2 1,269.8 1,324.4 533.7 6 6 6 10
National City Bank/OH (Cleveland) 886.6 824.2 763.3 411.6 7 7 7 13
Sallie Mae Education Loan Corp./VA (Reston) 860.0 479.6 — — 8 10 * *
American Express Assurance Co./CA (San Diego) 565.7 321.0 219.6 49.3 9 17 21 63
Fleet Boston Financial Corp/ RI (Providence) 541.1 562.4 — — 10 9 * *
Pittsburgh National Corp./PA (Pittsburgh) 534.6 459.4 558.0 460.9 11 11 8 11
Union Bank & Trust Company/NE (Lincoln) 501.7 452.4 396.9 338.3 12 12 11 17
Education Finance Group/MA (S. Yarmouth) 482.9 568.1 256.0 — 13 8 16 *
Penna Higher Ed Assistance Agency/PA (Harrisburg) 476.1 400.4 359.3 346.1 14 13 12 15
SunTrust Bank/VA (Richmond) 448.6 380.8 251.7 82.2 15 15 17 41
U S Bank/MN (St. Paul) 431.9 397.8 406.1 402.1 16 14 10 14
Key Corp./OH (Cleveland) 381.5 338.4 410.6 801.5 17 16 9 5
NorthStar Guarantee Inc./MN (St. Paul) 280.4 165.0 — — 18 26 * *
FirstStar Bank/WI (Milwaukee) 280.3 232.5 120.2 62.9 19 18 31 52
College Foundation Inc./NC (Raleigh) 263.6 193.2 174.3 188.1 20 21 24 25
Teachers Insur. & Annuity Assn. Of Am./NY (New York) 256.2 219.9 229.3 209.2 21 20 20 24
S C Student Loan Corp./SC (Columbia) 252.7 228.6 230.4 230.1 22 19 19 22
Academic Management Services/MA (Swansea) 227.7 168.2 162.1 166.5 23 25 26 27
Nova Southeastern University/FL (Fort Lauderdale) 202.5 163.2 121.3 141.8 24 27 30 29
Educational Funding of the South/TN (Knoxville) 196.1 173.5 166.8 134.4 25 22 25 30
Commerce Bank/MO (St. Louis) 193.3 171.1 159.0 129.1 26 23 27 32
Marine Midland Bank/NY (Buffalo) 184.6 168.3 278.1 273.7 27 24 15 20
New Hampshire Higher Ed Loan Corp./NH (Concord) 145.9 142.1 135.5 129.7 28 30 29 31
Rhode Island Student Loan Authority/RI (Warwick) 142.3 134.7 112.6 111.2 29 31 35 33
Amsouth Bancorp Ed Fin Group/MS (Jackson) 138.6 143.2 — — 30 29 * *
Illinois Student Assistance Comm/IDAAP/IL (Deerfield) 133.8 101.2 69.0 — 31 35 45 *
Mellon Bank/PA (Pittsburgh) 132.2 149.2 188.3 228.3 32 28 23 23
Twin City Federal Savings Bank/MN (Minneapolis) 127.2 117.4 113.7 104.2 33 33 34 36
Vermont Ed Loan Finance Program/VT (Winooski) 122.4 99.4 116.4 109.1 34 36 32 35
Citizens Bank/RI (Riverside) 122.4 63.5 55.1 34.9 35 49 56 77
Regions Bank/AL (Mobile) 115.0 96.0 97.6 60.2 36 37 36 54
Marquette Bank/MN (Lakeville) 111.4 75.3 67.1 51.2 37 42 48 60
Washington Mutual Savings Bank/WA (Seattle) 103.4 120.1 146.8 157.2 38 32 28 28
Connecticut Student Loan Found./CT (Rocky Hill) 98.4 79.4 79.7 83.0 39 40 40 40
Kentucky Higher Ed Student Loan Corp./KY (Louisville) 91.0 73.8 58.4 53.4 40 44 55 58
Educational Funding Services Inc/TX (Waco) 84.0 103.4 — — 41 34 * *
Ohio College of Podiatric Medicine/OH (Cleveland) 80.7 82.6 65.2 45.1 42 38 51 70
Corus Bank/IL Chicago 78.5 78.2 78.2 84.9 43 41 41 38
BankCorpSouth/MS (Tupelo) 77.5 73.9 59.7 52.6 44 43 54 59
Arizona Educational Loan Marketing/AZ (Mesa) 74.3 51.1 46.2 56.2 45 57 62 56
Maine Educational Loan Marketing/ME (Augusta) 74.3 79.8 83.9 77.3 46 39 38 45
Union Planters Bank/TN (Knoxville) 72.6 70.9 69.8 60.4 47 45 44 53
University of Pennsylvania/PA (Philadelphia) 71.0 60.9 60.6 50.8 48 51 53 61
Bank of North Dakota/ND (Bismarck) 66.3 67.1 68.8 66.1 49 46 46 49
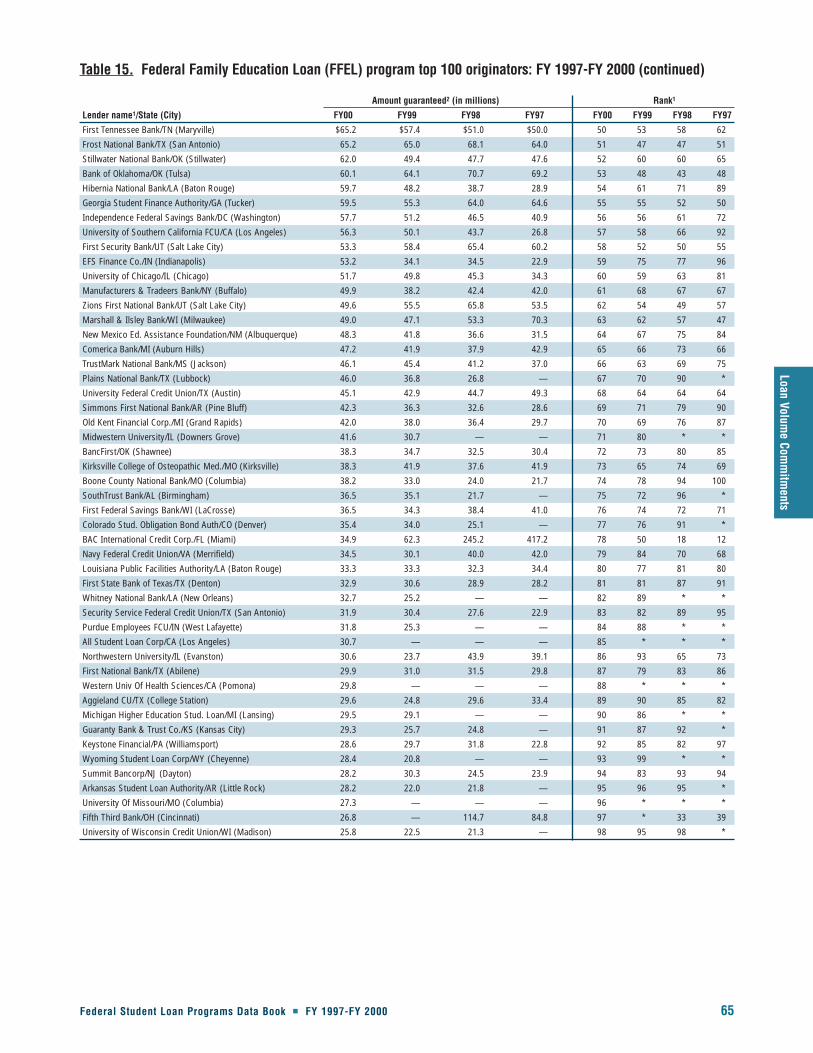
Federal Student Loan Programs Data Book � FY 1997-FY 2000 65
Loan Volume Com
mitm
ents
Table 15. Federal Family Education Loan (FFEL) program top 100 originators: FY 1997-FY 2000 (continued)
Amount guaranteed2 (in millions) Rank1
Lender name1/State (City) FY00 FY99 FY98 FY97 FY00 FY99 FY98 FY97
First Tennessee Bank/TN (Maryville) $65.2 $57.4 $51.0 $50.0 50 53 58 62
Frost National Bank/TX (San Antonio) 65.2 65.0 68.1 64.0 51 47 47 51
Stillwater National Bank/OK (Stillwater) 62.0 49.4 47.7 47.6 52 60 60 65
Bank of Oklahoma/OK (Tulsa) 60.1 64.1 70.7 69.2 53 48 43 48
Hibernia National Bank/LA (Baton Rouge) 59.7 48.2 38.7 28.9 54 61 71 89
Georgia Student Finance Authority/GA (Tucker) 59.5 55.3 64.0 64.6 55 55 52 50
Independence Federal Savings Bank/DC (Washington) 57.7 51.2 46.5 40.9 56 56 61 72
University of Southern California FCU/CA (Los Angeles) 56.3 50.1 43.7 26.8 57 58 66 92
First Security Bank/UT (Salt Lake City) 53.3 58.4 65.4 60.2 58 52 50 55
EFS Finance Co./IN (Indianapolis) 53.2 34.1 34.5 22.9 59 75 77 96
University of Chicago/IL (Chicago) 51.7 49.8 45.3 34.3 60 59 63 81
Manufacturers & Tradeers Bank/NY (Buffalo) 49.9 38.2 42.4 42.0 61 68 67 67
Zions First National Bank/UT (Salt Lake City) 49.6 55.5 65.8 53.5 62 54 49 57
Marshall & Ilsley Bank/WI (Milwaukee) 49.0 47.1 53.3 70.3 63 62 57 47
New Mexico Ed. Assistance Foundation/NM (Albuquerque) 48.3 41.8 36.6 31.5 64 67 75 84
Comerica Bank/MI (Auburn Hills) 47.2 41.9 37.9 42.9 65 66 73 66
TrustMark National Bank/MS (Jackson) 46.1 45.4 41.2 37.0 66 63 69 75
Plains National Bank/TX (Lubbock) 46.0 36.8 26.8 — 67 70 90 *
University Federal Credit Union/TX (Austin) 45.1 42.9 44.7 49.3 68 64 64 64
Simmons First National Bank/AR (Pine Bluff) 42.3 36.3 32.6 28.6 69 71 79 90
Old Kent Financial Corp./MI (Grand Rapids) 42.0 38.0 36.4 29.7 70 69 76 87
Midwestern University/IL (Downers Grove) 41.6 30.7 — — 71 80 * *
BancFirst/OK (Shawnee) 38.3 34.7 32.5 30.4 72 73 80 85
Kirksville College of Osteopathic Med./MO (Kirksville) 38.3 41.9 37.6 41.9 73 65 74 69
Boone County National Bank/MO (Columbia) 38.2 33.0 24.0 21.7 74 78 94 100
SouthTrust Bank/AL (Birmingham) 36.5 35.1 21.7 — 75 72 96 *
First Federal Savings Bank/WI (LaCrosse) 36.5 34.3 38.4 41.0 76 74 72 71
Colorado Stud. Obligation Bond Auth/CO (Denver) 35.4 34.0 25.1 — 77 76 91 *
BAC International Credit Corp./FL (Miami) 34.9 62.3 245.2 417.2 78 50 18 12
Navy Federal Credit Union/VA (Merrifield) 34.5 30.1 40.0 42.0 79 84 70 68
Louisiana Public Facilities Authority/LA (Baton Rouge) 33.3 33.3 32.3 34.4 80 77 81 80
First State Bank of Texas/TX (Denton) 32.9 30.6 28.9 28.2 81 81 87 91
Whitney National Bank/LA (New Orleans) 32.7 25.2 — — 82 89 * *
Security Service Federal Credit Union/TX (San Antonio) 31.9 30.4 27.6 22.9 83 82 89 95
Purdue Employees FCU/IN (West Lafayette) 31.8 25.3 — — 84 88 * *
All Student Loan Corp/CA (Los Angeles) 30.7 — — — 85 * * *
Northwestern University/IL (Evanston) 30.6 23.7 43.9 39.1 86 93 65 73
First National Bank/TX (Abilene) 29.9 31.0 31.5 29.8 87 79 83 86
Western Univ Of Health Sciences/CA (Pomona) 29.8 — — — 88 * * *
Aggieland CU/TX (College Station) 29.6 24.8 29.6 33.4 89 90 85 82
Michigan Higher Education Stud. Loan/MI (Lansing) 29.5 29.1 — — 90 86 * *
Guaranty Bank & Trust Co./KS (Kansas City) 29.3 25.7 24.8 — 91 87 92 *
Keystone Financial/PA (Williamsport) 28.6 29.7 31.8 22.8 92 85 82 97
Wyoming Student Loan Corp/WY (Cheyenne) 28.4 20.8 — — 93 99 * *
Summit Bancorp/NJ (Dayton) 28.2 30.3 24.5 23.9 94 83 93 94
Arkansas Student Loan Authority/AR (Little Rock) 28.2 22.0 21.8 — 95 96 95 *
University Of Missouri/MO (Columbia) 27.3 — — — 96 * * *
Fifth Third Bank/OH (Cincinnati) 26.8 — 114.7 84.8 97 * 33 39
University of Wisconsin Credit Union/WI (Madison) 25.8 22.5 21.3 — 98 95 98 *

66 Federal Student Loan Programs Data Book � FY 1997-FY 2000
Table 15. Federal Family Education Loan (FFEL) program top 100 originators: FY97-FY 2000 (continued)
Amount guaranteed2 (in millions) Rank1
Lender name1/State (City) FY00 FY99 FY98 FY97 FY00 FY99 FY98 FY97
Associated Bank/WI (Stevens Point) $25.4 $24.6 $28.2 — 99 91 88 *
Citizens State Bank/TX (Sealy) 25.3 22.0 — — 100 97 * *
One Valley Bank/WV (Charleston) — 21.0 20.3 — * 98 100 *
Guaranty Federal Bank/TX (Dallas) — 20.8 — — * 100 * *
Michigan National Corp./MI (Farmington Hills) — 24.0 29.2 $29.5 * 92 86 88
Oklahoma Student Loan Authority/OK (Oklahoma City) — 23.3 33.7 34.9 * 94 78 78
Fleet Bank/NY (Utica) — 329.2 330.1 340.2 * 15 13 16
Nellie Mae/MA (Braintree) — 311.4 294.1 230.7 * 17 14 21
Bank of Boston Corp./RI (Providence) — 233.2 202.9 176.1 * 19 22 26
Mercantile Bank/MO (St. Joseph) — 110.7 96.1 79.5 * 35 37 42
Deposit Guaranty National Bank/MS (Jackson) — 80.3 83.5 74.7 * 40 39 36
First American National Bank/TN (Nashville) — 62.9 72.3 84.9 * 52 42 44
Student Loan Funding Corp./OH (Cincinnati) — 23.9 48.6 109.5 * 96 59 34
Educaid, Trans World Insurance Co/CA (Sacramento) — — 748.7 627.1 * * 6 9
Nations Bank/MO (North Kansas City) — — 747.5 759.5 * * 7 6
Wells Fargo Bank/CA (Pleasant Hill) — — 693.4 699.9 * * 9 7
First Chicago NBD Corp/MI (Grand Blanc) — — 313.6 294.9 * * 17 18
Crestar Bank/VA (Richmond) — — 139.6 79.3 * * 32 43
SeaFirst Bank/WA (Seattle) — — 98.0 93.1 * * 40 37
Star Bank/OH (Cincinnati) — — 54.0 38.0 * * 62 74
Illinois Designated Acct Purch Prog/IL (Deerfield) — — 47.6 — * * 67 *
Wachovia Bank/NC (Winston—Salem) — — 41.2 35.4 * * 68 76
Bank of Hawaii/HI (Honolulu) — — 30.0 33.4 * * 84 83
First American Bank/TX (Bryan) — — 21.5 — * * 97 *
Household Bank/IL (Wood Dale) — — 20.6 277.5 * * 99 19
Meridian Bank/PA (Reading) — — — 34.5 * * * 79
San Antonio Federal Credit Union/TX (San Antonio) — — — 26.6 * * * 93
First Financial Bank/WI (Stevens Point) — — — 22.7 * * * 98
Bank of New York/NY (Harrison) — — — 21.8 * * * 99
Percent of amount guaranteed FY00 FY99 FY98 FY97
Top 10 as percent of Nation 51.5 51.7 51.8 44.5
Top 25 as percent of Nation 71.8 71.4 69.1 66.1
Top 50 as percent of Nation 82.3 82.1 79.3 78.0
Top 75 as percent of Nation 87.2 86.9 85.3 83.7
Top 100 as percent of Nation 90.1 89.7 88.5 87.1
— Not applicable.
* Lender was not ranked in top 100 in this fiscal year.1 Arranged from highest to lowest based on the dollar amount the lender guaranteed in FY00.2 Amount guaranteed includes Stafford Subsidized, Stafford Unsubsidized, and PLUS loans.
NOTES: The total number of lenders in FY97-FY00 were 4,252; 4,129; 3,761 and 3,592; respectively. Data for earlier years appear in table A-15 in appendix I.
SOURCE: U.S. Department of Education, Office of Postsecondary Education, National Student Loan Data System and Office of Student Financial Assistance Programs, Financial Partners Channel.
Loan Volume Com
mitm
ents
Federal Student Loan Programs Data Book � FY 1997-FY 2000 67
This table lists the top 100 holders (lender name, state, and city) of FFEL program loans for FY 1997-FY 2000
ranked by the dollar amount outstanding.
� Of the thousands of lenders who participated in the FFEL program in FY 1997-FY 2000 (4,252; 4,129;
3,761; and 3,592; respectively), the top 10 lenders held an increasing proportion of the outstanding loan
dollars (57.5, 57.5, 62.3, and 68.1, respectively). (See table A-15, “Federal Family Education Loan (FFEL)
program annual number of active lenders: FY66-FY 2000.”) The top holder, Sallie Mae, held about one-
third in FY 1997, FY 1998, and FY 1999. In FY 2000, Sallie Mae held 43.2 percent of all outstanding loan
dollars. (See table 44 for FFEL program amount outstanding.)
� The top 100 holders held an increasing proportion of all outstanding loan dollars from FY 1997 to FY 2000.
The top 100 holders held 94.6 percent in FY 1997, 94.7 percent in FY 1998, 95.3 percent in FY 1999 and
96.2 percent in FY 2000.
� Between FY 1998 and FY 2000, the outstanding dollar amount for Sallie Mae, the top holder, grew at a faster
rate than did the rate for the outstanding FFEL program dollar amount. While the overall FFEL
outstanding dollar amount increased from the previous year by 8.3 percent in FY 1999 and 10.6 percent in
FY 2000, the Sallie Mae outstanding dollar amount increased by 17.6 percent in FY 1999 and 35.4 percent
in FY 2000.
Table 16. Federal Family Education Loan (FFEL) program top 100 current holders of loans as of September 30, 2000, September 30, 1999, September 30, 1998,and September 30, 1997

68 Federal Student Loan Programs Data Book � FY 1997-FY 2000
Table 16. Federal Family Education Loan (FFEL) program top 100 current holders of loans as of September 30, 2000, September 30, 1999, September 30, 1998 and September 30, 1997
FY00 Amount FY99 Amount FY98 Amount FY97 Amountoutstanding1 FY00 outstanding1 FY99 outstanding1 FY98 outstanding1 FY97
Lender name/State (City) (in millions) Rank (in millions) Rank (in millions) Rank (in millions) Rank
Sallie Mae/VA (Reston) $61,058.5 1 $45,090.5 1 $38,351.1 1 $36,399.2 1
Citicorp/NY (Pittsford) 13,372.6 2 9,465.8 2 8,175.5 2 7,336.3 2
First Union National Bank/CA (Sacramento) 5,099.0 3 4,629.6 4 2,002.1 12 654.3 29
Norwest Bank Student Loan Center/SD (Sioux Falls) 5,064.4 4 4,157.0 5 2,655.4 7 2,055.7 6
Key Corp./OH (Cleveland) 2,929.3 5 2,926.8 7 2,962.8 4 3,035.1 4
Union Bank & Trust Company/NE (Lincoln) 2,888.8 6 2,133.8 11 1,306.5 18 593.2 31
Bank of America Corp./CA (Brea) 2,775.7 7 2,642.9 8 1,210.8 19 1,286.2 16
EFS Finance Co./IN (Indianapolis) 2,511.6 8 1,522.1 18 1,150.0 22 861.7 26
Penna Higher Ed Assistance Agency/PA (Harrisburg) 2,196.9 9 1,759.8 13 1,452.6 17 1,238.7 18
California Higher Ed Loan Authority/CA (San Francisco) 1,855.9 10 1,689.0 14 1,499.2 16 1,251.4 17
Pittsburgh National Corp./PA (Pittsburgh) 1,785.6 11 1,851.5 12 1,833.7 14 1,964.8 7
SunTrust Bank/VA (Richmond) 1,739.6 12 1,631.5 15 304.2 55 249.9 66
Mellon Bank/PA (Pittsburgh) 1,599.5 13 1,581.5 16 1,516.5 15 1,430.1 15
Missouri Higher Ed Loan Authority/MO (St. Louis) 1,480.4 14 1,274.4 20 1,056.0 24 905.5 24
Brazos Higher Ed Authority/TX (Waco) 1,378.6 15 743.5 27 416.1 44 503.0 38
South Carolina Student Loan Corp./SC (Columbia) 1,374.5 16 1,251.4 21 1,123.1 23 974.4 22
Brazos Student Finance Corp./TX (Waco) 1,318.7 17 930.2 26 914.2 28 483.2 40
National Higher Ed Loan Program/NE (Lincoln) 1,185.9 18 1,321.7 19 1,153.7 21 1,615.6 12
Ill. Designated Acct. Purchasing Prog./IL (Deerfield) 1,120.9 19 1,033.1 22 805.5 30 684.9 28
Bank One/OH (Columbus) 1,095.5 20 1,530.6 17 2,778.5 6 2,490.4 5
College Foundation Inc./NC (Raleigh) 1,078.5 21 978.4 25 901.3 29 846.2 27
Arizona Educational Loan Marketing/AZ (Mesa) 990.9 22 992.8 23 939.5 27 896.5 25
Fleet Bank/NY (Utica) 969.5 23 654.7 31 1,020.9 26 1,119.6 20
Education Finance Group/MA (S. Yarmouth) 941.5 24 987.5 24 525.7 41 — *
Educational Funding of the South/TN (Knoxville) 938.5 25 682.6 29 530.3 40 443.9 42
Utah State Board of Regents/UT (Salt Lake City) 830.1 26 741.0 28 646.4 33 582.5 32
Vermont Ed Loan Finance Program/VT (Winooski) 769.1 27 676.8 30 574.1 37 496.6 39
Education Loans Inc./SD (Aberdeen) 766.1 28 649.3 32 604.3 34 — *
Michigan Higher Ed Stud. Loan Auth./MI (Lansing) 693.7 29 588.7 36 584.9 35 468.9 41
Chase Manhattan Bank/NY (Garden City) 675.5 30 645.8 34 5,356.4 3 4,233.8 3
U S Bank/MN (St. Paul) 654.5 31 574.1 37 739.2 32 — *
Iowa Student Loan Liquidity Corp./IA (Des Moines) 608.0 32 553.8 38 539.7 39 526.9 37
New Hampshire Higher Ed Loan Corp./NH (Concord) 595.9 33 486.8 39 377.8 48 265.8 59
Colorado Stud. Obligation Bond Auth./CO (Denver) 591.6 34 589.5 35 581.3 36 581.3 33
Kentucky Higher Ed Stud. Loan Corp./KY (Louisville) 568.8 35 484.1 40 374.6 49 327.9 51
Greater Texas Higher Ed Authority/TX (Bryan) 566.9 36 395.6 49 337.0 52 — *
Mississippi Higher Ed Assist. Corp./MS (Jackson) 533.7 37 425.2 47 350.9 51 337.3 49
North Texas Higher Ed Auth./TX (Fort Worth) 524.8 38 474.0 41 426.8 42 394.0 45
Panhandle Plains Higher Ed Auth./TX (Canyon) 516.0 39 451.3 42 391.7 46 304.3 53
National City Bank/OH (Cleveland) 513.8 40 2,310.3 10 2,179.0 11 1,889.4 9
Rhode Island Student Loan Authority/RI (Warwick) 512.9 41 440.1 43 368.6 50 314.9 52
All Student Loan Corp./CA (Los Angeles) 510.8 42 341.5 52 — * — *
Bank of North Dakota/ND (Bismarck) 454.1 43 431.5 46 407.8 45 373.4 46
New Mexico Ed Assistance Foundation/NM (Albuquerque) 447.4 44 406.0 48 378.9 47 351.9 47
Corus Bank/IL (Chicago) 441.1 45 431.8 45 420.0 43 — *
Regions Bank/AL (Mobile) 429.1 46 355.0 51 260.4 62 213.4 69
Trinity Higher Ed Authority/TX (Waco) 422.5 47 — * — * — *
Maine Educational Loan Marketing/ME (Augusta) 420.8 48 381.8 50 336.3 53 286.5 55
Access Group/DE (Wilmington) 420.2 49 — * — * — *
Northstar Guarantee/MN (St. Paul) 410.8 50 194.1 66 — * — *

Federal Student Loan Programs Data Book � FY 1997-FY 2000 69
Loan Volume Com
mitm
ents
Table 16. Federal Family Education Loan (FFEL) program top 100 current holders of loans as of September 30, 2000, September 30, 1999, September 30, 1998 and September 30, 1997 (continued)
FY00 Amount FY99 Amount FY98 Amount FY97 Amountoutstanding1 FY00 outstanding1 FY99 outstanding1 FY98 outstanding1 FY97
Lender name/State (City) (in millions) Rank (in millions) Rank (in millions) Rank (in millions) Rank
Marine Midland Bank/NY (Buffalo) 396.1 51 438.4 44 542.9 38 550.5 36
Firstar Bank/WI (Milwaukee) 382.8 52 647.1 33 119.4 84 155.7 75
Connecticut Student Loan Found./CT (Rocky Hill) 344.3 53 318.5 54 292.2 56 251.3 64
Associated Bank/WI (Stevens Point) 338.8 54 331.1 53 — * — *
Oklahoma Student Loan Authority/OK (Oklahoma City) 337.1 55 245.7 62 198.1 69 162.7 73
First Tennessee Bank/TN (Maryville) 325.7 56 294.9 55 270.1 60 252.6 63
Montana Higher Ed Stud. Assist. Corp./MT (Helena) 311.3 57 290.1 56 284.7 57 274.1 57
Commerce Bank/MO (St. Louis) 309.0 58 276.0 57 281.7 58 241.2 68
Navy Federal Credit Union/VA (Merrifield) 271.5 59 267.2 58 261.6 61 245.1 67
Teachers Insur. & Annuity Assn. Of Am./NY (New York) 258.5 60 247.8 61 255.4 64 185.0 71
Arkansas Student Loan Authority/AR (Little Rock) 223.5 61 192.4 67 182.8 70 159.5 74
Wyoming Student Loan Corp./WY (Cheyenne) 207.0 62 154.6 72 141.4 75 123.1 85
South Texas Higher Ed Auth./TX (Austin) 205.5 63 190.1 68 145.2 74 129.5 84
Sovereign Bank/PA (Reading) 200.9 64 195.4 65 204.7 68 181.1 72
Knowledge Works Foundation/OH (Cleveland) 199.9 65 — * — * — *
First Federal Savings Bank/WI (LaCrosse) 196.7 66 186.8 69 175.1 71 150.9 77
Education Services Foundation/MS (Jackson) 187.4 67 109.1 83 100.8 89 — *
Education Services Foundation/MS (Jackson) 187.4 67 — * — * — *
Texas Higher Ed Coordinating Board/TX (Austin) 185.7 68 209.7 63 231.8 66 251.0 65
American Express Assurance Co./CA (San Diego) 181.5 69 120.2 79 77.8 100 — *
Manufacturers & Traders Bank/NY (Buffalo) 176.3 70 181.7 70 172.4 72 134.8 81
Louisiana Public Facilities Authority/LA (Baton Rouge) 171.7 71 156.7 71 139.6 76 118.8 87
San Antonio Federal Credit Union/TX (San Antonio) 153.6 72 149.2 73 149.5 73 149.1 79
Twin City Federal Savings Bank (TCF)/MN (Minneapolis) 153.3 73 141.2 74 124.7 81 133.3 82
Amsouth Bancorp/MS (Jackson) 149.9 74 — * — * — *
Stud. Loan Acquisition Auth. Of Arizona/AZ (Scottsdale) 139.6 75 118.3 80 127.1 80 102.5 90
Hibernia National Bank/LA (Baton Rouge) 134.0 76 91.7 91 — * — *
AnchorBank/WI (Madison) 128.8 77 129.9 75 124.5 82 117.4 88
Student Loan Finance Association/WA (Seattle) 127.2 78 99.0 85 — * 85.5 95
Union Planters Bank/TN (Knoxville) 122.4 79 120.7 78 121.7 83 — *
Citizens Bank/RI (Riverside) 121.0 80 82.5 97 — * — *
Marshall & Ilsley Bank/WI (Milwaukee) 116.4 81 257.9 60 257.8 63 270.8 58
University of Pennsylvania/PA (Philadelphia) 112.2 82 105.9 84 95.0 93 90.7 94
Frost National Bank/TX (San Antonio) 109.9 83 95.3 89 105.2 87 77.8 100
Marquette Bank/MN (Lakeville) 106.9 84 $89.7 92 — * — *
Charter One Bank/NY (Albany) 101.2 85 96.7 87 — * — *
Florida Educational Loan Marketing/FL (Tallahassee) 99.1 86 — * — * — *
University of Wisconsin Credit Union/WI (Madison) 98.9 87 94.8 90 84.6 96 — *
Abilene Higher Ed Authority/TX (Austin) 96.1 88 87.0 93 — * — *
Education Funding Association/ID (Fruitland) 95.9 89 — * — * — *
Fulton Financial Corp./PA (East Petersburg) 87.7 90 — * — * — *
Notre Dame Credit Union/IN (Notre Dame) $83.9 91 — * — * — *
Summit Bancorp/NJ (Dayton) 83.5 92 — * — * 83.3 99
Mission Federal Credit Union/CA (San Diego) 80.0 93 — * — * — *
Academic Management Services/MA (Swansea) 79.7 94 — * — * — *
Comerica Bank/MI (Auburn Hills) 78.6 95 84.6 96 — * 131.8 83
Zions First National Bank/UT (Salt Lake City) 78.6 96 81.7 98 81.9 98 — *
Northwest Savings Bank/PA (Warren) 73.8 97 — * — * — *
Central Texas Higher Ed Authority/TX (San Marcos) 71.2 98 — * — * 85.0 96
First Virginia Bank/VA (Falls Church) 65.9 99 — * — * — *
Simmons First National Bank/AR (Pine Bluff) 65.8 100 2.0 * — * — *

70 Federal Student Loan Programs Data Book � FY 1997-FY 2000
Table 16. Federal Family Education Loan (FFEL) program top 100 current holders of loans as of September 30, 2000, September 30, 1999, September 30, 1998 and September 30, 1997 (continued)
FY00 Amount FY99 Amount FY98 Amount FY97 Amountoutstanding1 FY00 outstanding1 FY99 outstanding1 FY98 outstanding1 FY97
Lender name/State (City) (in millions) Rank (in millions) Rank (in millions) Rank (in millions) Rank
Secondary Market Services/IN (Indianapolis) — * 5,236.8 3 2,894.4 5 1,880.2 11
Nellie Mae/MA (Braintree) — * 3,576.9 6 2,198.5 10 1,886.0 10
Student Loan Funding Corp./OH (Cincinnati) — * 2,629.1 9 2,230.2 9 1,889.9 8
Bank of Boston Corp./RI (Providence) — * 261.4 59 247.2 65 263.4 60
Guaranty Federal Bank/TX (Dallas) — * 201.1 64 — * — *
Mercantile Bank/MO (St. Joseph) — * 128.1 76 118.9 85 119.1 86
Washington Mutual Savings Bank/WA (Seattle) — * 126.3 77 113.4 86 — *
Old Kent Financial Corp./MI (Grand Rapids) — * 117.2 81 130.0 78 198.2 70
Deposit Guaranty National Bank/MS (Jackson) — * 110.5 82 133.3 77 141.7 80
Fifth Third Bank/OH (Cincinnati) — * 96.8 86 — * — *
BankCorpSouth Bank/MS (Tupelo) — * 96.1 88 95.5 92 — *
First American National Bank/TN (Nashville) — * 86.7 94 — * — *
Harvard University/MA (Cambridge) — * 85.4 95 $128.3 79 $153.6 76
Georgia Student Finance Authority/GA (Tucker) — * 80.0 99 83.2 97 — *
SouthTrust Bank/AL (Birmingham) — * 78.5 100 — * — *
Nations Bank/MO (North Kansas City) — * — * 2,361.4 8 — *
Student Ed Loan Marketing Corp/CA (Los Angeles) — * — * 311.7 54 99.0 91
First Financial Bank/WI (Stevens Point) — * — * 275.2 59 274.7 56
Educaid, TransWorld Insurance Co/CA (Sacramento) — * — * 1,963.4 13 1,477.9 14
Wells Fargo Bank/CA (Pleasant Hill) — * — * 1,175.4 20 1,074.4 21
Indiana Secondary Market/IN (Indianapolis) — * — * 229.9 67 256.1 61
Crestar Bank/VA (Richmond) — * — * 1,026.6 25 396.5 44
First Chicago NBD Corp/MI (Grand Blanc) — * — * 803.5 31 933.0 23
Albany Savings Bank/NY (Albany) — * — * 97.9 90 96.8 92
Barnett Bank/FL (Jacksonville) — * — * — * 1,592.1 13
Signet Bank/MD (Baltimore) — * — * — * 1,132.2 19
First Union National Bank/NJ (North Brunswick) — * — * — * 654.3 29
Household Bank/IL (Wood Dale) — * — * — * 612.9 30
First Bank System/MN (Minneapolis) — * — * — * 575.8 34
Student Loan Finance Corp/SD (Aberdeen) — * — * — * 573.4 35
Nations Bank/MO (St. Louis) — * — * — * 427.7 43
Corestates/DE (Wilmington) — * — * — * 337.1 50
BAC International Credit Corp/FL (Miami) — * — * — * 292.5 54
First National Bank of Commerce/LA (New Orleans) — * — * — * 254.1 62
Central Bank/LA (Monroe) — * — * — * 150.3 78
First of America Bank/MI (Kalamazoo) — * — * — * 105.1 89
Seattle First National Bank/WA (Seattle) — * — * — * 90.8 93
Bank of Mississippi/MS (Tupelo) — * — * — * 83.5 97
SLF of Idaho Marketing Assn., Inc./ID (Fruitland) — * — * — * 83.4 98
Total $141,242.7 $126,383.3 $114,788.9 $104,268.4
As of 9/30/00 As of 9/30/99 As of 9/30/98 As of 9/30/97
Top 10 as a percent of Nation 68.1 62.3 57.5 57.5
Top 25 as a percent of Nation 81.0 78.6 75.3 74.6
Top 50 as a percent of Nation 90.5 89.1 87.4 86.5
Top 75 as a percent of Nation 94.6 93.4 92.5 92.0
Top 100 as a percent of Nation 96.2 95.3 94.7 94.6
— Not applicable.
* Holder was not ranked in top 100 that year.1 Amount outstanding includes Stafford Subsidized, Stafford Unsubsidized, Parent Loans for Undergraduate Students (PLUS), Supplemental Loan for Students (SLS), and Consolidation loans.
NOTES: Details may not add to totals due to rounding. Securitized loans are reported under the original holder.
SOURCE: U.S. Department of Education, Office of Postsecondary Education, ED Form 799 and compiled data.

Loan Volume Com
mitm
ents
Federal Student Loan Programs Data Book � FY 1997-FY 2000 71
This table shows an accounting of Stafford Subsidized loan volume commitments for each guaranty agency for
FY 1997-FY 2000. The number of loans, dollar amount, percent change from prior year, percent share of total
Stafford Subsidized loans guaranteed, and rankings of all guaranty agencies are tabulated for each agency.
(Summary information for this table is discussed in table 5.)
� The dollar volume of Stafford Subsidized loan commitments held steady at approximately $12.0 billion in
FY 1997, FY 1998, and FY 1999. From FY 1999 to FY 2000 Stafford Subsidized loan commitments grew
5.9 percent to $12.6 billion.
� USAF (United Student Aid Funds), the guaranty agency with the largest Stafford Subsidized loan
commitments, guaranteed approximately 25 percent of the loan dollars for each of the four years from
FY 1997-FY 2000. Each year, USAF guaranteed more than $3 billion in Stafford Subsidized loans.
� Pennsylvania had the second largest Stafford Subsidized loan commitments in FY 1997. However,
California rose to second place thereafter, guaranteeing approximately $1.1 billion annually during
FY 1998-FY 2000.
� The guaranty agencies ranked as the top five each year (USAF, California, Pennsylvania, Wisconsin, New
York (FY 1997 and FY 2000 only), and Texas (FY 1998 and FY 1999 only)) accounted for over one-half of
the total amount of Stafford Subsidized volume in FY 1997-FY 2000. During these four years, the share that
the top five agencies guaranteed of the total Stafford Subsidized loan dollars was 57.9, 56.3, 56.2, and 56.3
percent, respectively.
� From FY 1997-FY 2000, three guaranty agencies (Nebraska, Oregon, and South Dakota) increased their
Stafford Subsidized loan dollar commitments more than 40 percent. Five guaranty agencies (Louisiana,
Maine, Montana, New Hampshire, and Washington) decreased their Stafford Subsidized loan dollar
commitments more than 10 percent.
Table 17. Federal Family Education Loan (FFEL) program loan volume commitments for Stafford Subsidized loans, by guaranty agency: FY 1997-FY 2000

72Federal Student Loan Program
s Data Book
�FY 1997-FY 2000
Table 17. Federal Family Education Loan (FFEL) program loan volume commitments for Stafford Subsidized loans, by guaranty agency: FY 1997-FY 2000
Percent change Percent changeFY97 FY98 FY99 FY00 FY99-FY00 FY97-FY00 Percent share of total
Guaranty Dollars Dollars Dollars Dollars Loans Dollars
agency1 Loans ($ 000’s) Loans ($ 000’s) Loans ($ 000’s) Loans ($ 000’s) Loans Dollars Loans Dollars FY97 FY98 FY99 FY00 FY97 FY98 FY99 FY00
Arkansas 29,338 $97,303 30,798 $99,749 29,345 $95,420 34,723 $116,268 18.3 21.8 18.4 19.5 0.9 0.9 0.9 1.0 0.8 0.8 0.8 0.9
California 230,910 905,659 253,740 1,045,553 262,975 1,061,455 297,574 1,155,828 13.2 8.9 28.9 27.6 6.8 7.4 7.9 8.5 7.6 8.7 8.9 9.2
Colorado 51,663 160,137 51,274 160,657 50,710 159,274 50,417 165,078 -0.6 3.6 -2.4 3.1 1.5 1.5 1.5 1.4 1.3 1.3 1.3 1.3
Connecticut 29,717 108,862 28,440 108,572 28,356 110,198 30,057 115,832 6.0 5.1 1.1 6.4 0.9 0.8 0.8 0.9 0.9 0.9 0.9 0.9
ECMC 31,832 89,909 33,055 92,148 33,376 93,572 34,243 98,631 2.6 5.4 7.6 9.7 0.9 1.0 1.0 1.0 0.8 0.8 0.8 0.8
Florida 110,772 344,167 114,897 351,952 119,727 357,017 134,449 391,285 12.3 9.6 21.4 13.7 3.3 3.4 3.6 3.8 2.9 2.9 3.0 3.1
Georgia 41,238 125,035 43,745 130,254 38,301 118,187 39,657 124,315 3.5 5.2 -3.8 -0.6 1.2 1.3 1.1 1.1 1.0 1.1 1.0 1.0
Illinois 87,457 322,169 89,001 333,008 87,540 324,154 84,794 314,261 -3.1 -3.1 -3.0 -2.5 2.6 2.6 2.6 2.4 2.7 2.8 2.7 2.5
Iowa 32,351 113,989 32,972 115,838 32,682 113,169 37,307 131,350 14.2 16.1 15.3 15.2 1.0 1.0 1.0 1.1 1.0 1.0 1.0 1.0
Kentucky 51,220 168,238 52,424 171,625 57,461 190,611 66,246 220,443 15.3 15.7 29.3 31.0 1.5 1.5 1.7 1.9 1.4 1.4 1.6 1.8
Louisiana 44,291 145,196 37,617 122,301 35,301 114,999 38,115 126,838 8.0 10.3 -13.9 -12.6 1.3 1.1 1.1 1.1 1.2 1.0 1.0 1.0
Maine 24,729 81,672 24,924 83,009 22,728 76,905 21,274 71,238 -6.4 -7.4 -14.0 -12.8 0.7 0.7 0.7 0.6 0.7 0.7 0.6 0.6
Massachusetts 83,219 373,543 77,777 352,928 76,288 356,541 80,350 368,572 5.3 3.4 -3.4 -1.3 2.4 2.3 2.3 2.3 3.1 2.9 3.0 2.9
Michigan 54,114 153,230 55,584 157,847 56,950 155,026 57,912 159,240 1.7 2.7 7.0 3.9 1.6 1.6 1.7 1.6 1.3 1.3 1.3 1.3
Missouri 46,706 149,106 55,940 185,147 56,943 190,318 59,986 203,914 5.3 7.1 28.4 36.8 1.4 1.6 1.7 1.7 1.2 1.5 1.6 1.6
Montana 20,449 64,594 19,213 60,877 18,550 59,544 16,060 50,838 -13.4 -14.6 -21.5 -21.3 0.6 0.6 0.6 0.5 0.5 0.5 0.5 0.4
Nebraska 48,263 189,248 66,061 290,789 71,345 300,274 80,462 342,743 12.8 14.1 66.7 81.1 1.4 1.9 2.1 2.3 1.6 2.4 2.5 2.7
New Hampshire 26,428 90,466 24,880 88,330 22,794 82,960 21,745 79,301 -4.6 -4.4 -17.7 -12.3 0.8 0.7 0.7 0.6 0.8 0.7 0.7 0.6
New Jersey 37,067 118,462 39,587 120,579 42,441 125,609 49,813 149,257 17.4 18.8 34.4 26.0 1.1 1.2 1.3 1.4 1.0 1.0 1.1 1.2
New Mexico 19,155 57,306 18,504 56,154 18,778 56,696 18,006 55,745 -4.1 -1.7 -6.0 -2.7 0.6 0.5 0.6 0.5 0.5 0.5 0.5 0.4
New York 239,909 865,438 229,459 837,460 220,337 814,995 251,505 951,938 14.1 16.8 4.8 10.0 7.1 6.7 6.6 7.1 7.2 7.0 6.9 7.6
North Carolina 30,342 99,016 31,905 102,567 31,474 101,058 37,599 127,742 19.5 26.4 23.9 29.0 0.9 0.9 0.9 1.1 0.8 0.9 0.9 1.0
North Dakota 18,013 51,337 19,989 57,253 20,143 57,735 19,490 57,558 -3.2 -0.3 8.2 12.1 0.5 0.6 0.6 0.6 0.4 0.5 0.5 0.5
Oklahoma 61,887 187,196 62,253 191,126 57,980 179,384 55,886 171,478 -3.6 -4.4 -9.7 -8.4 1.8 1.8 1.7 1.6 1.6 1.6 1.5 1.4
Oregon 12,791 39,030 15,899 49,908 18,574 59,258 19,122 60,687 3.0 2.4 49.5 55.5 0.4 0.5 0.6 0.5 0.3 0.4 0.5 0.5
Pennsylvania 290,713 1,024,516 282,133 959,592 262,294 896,043 282,734 980,043 7.8 9.4 -2.7 -4.3 8.5 8.3 7.9 8.0 8.5 8.0 7.6 7.8
Rhode Island 23,856 73,110 22,283 68,927 23,315 75,161 22,452 70,533 -3.7 -6.2 -5.9 -3.5 0.7 0.7 0.7 0.6 0.6 0.6 0.6 0.6
South Carolina 40,099 135,821 40,858 136,088 37,411 126,194 37,375 132,298 -0.1 4.8 -6.8 -2.6 1.2 1.2 1.1 1.1 1.1 1.1 1.1 1.1
South Dakota 32,922 100,791 42,560 126,941 43,643 132,829 47,960 148,509 9.9 11.8 45.7 47.3 1.0 1.2 1.3 1.4 0.8 1.1 1.1 1.2
Tennessee 59,217 189,294 61,223 197,664 65,394 214,313 70,400 235,186 7.7 9.7 18.9 24.2 1.7 1.8 2.0 2.0 1.6 1.6 1.8 1.9
Texas 244,510 827,023 248,393 843,484 247,689 846,834 255,485 878,258 3.1 3.7 4.5 6.2 7.2 7.3 7.4 7.3 6.9 7.0 7.1 7.0
USAF 840,353 3,166,761 810,433 3,044,368 793,321 3,028,715 806,174 3,090,905 1.6 2.1 -4.1 -2.4 24.7 23.8 23.8 22.9 26.4 25.3 25.5 24.6
Utah 36,978 128,798 44,845 160,283 38,712 133,928 38,751 131,385 0.1 -1.9 4.8 2.0 1.1 1.3 1.2 1.1 1.1 1.3 1.1 1.0
Vermont 14,433 52,577 14,492 52,711 14,066 52,120 17,143 64,165 21.9 23.1 18.8 22.0 0.4 0.4 0.4 0.5 0.4 0.4 0.4 0.5
Washington 60,701 208,494 57,099 194,318 48,912 164,316 39,496 129,641 -19.3 -21.1 -34.9 -37.8 1.8 1.7 1.5 1.1 1.7 1.6 1.4 1.0
Wisconsin 293,791 977,043 273,368 877,383 252,986 837,260 265,468 892,279 4.9 6.6 -9.6 -8.7 8.6 8.0 7.6 7.5 8.2 7.3 7.1 7.1
Total 3,401,434 $11,984,533 3,407,625 $12,027,391 3,338,842 $11,862,070 3,520,230 $12,563,582 5.4 5.9 3.5 4.8 100.0 100.0 100.0 100.0 100.0 100.0 100.0 100.0

Federal Student Loan Programs Data Book � FY 1997-FY 2000 73
Loan Volume Com
mitm
ents
Table 17. Federal Family Education Loan (FFEL) program loan volume commitments for Stafford Subsidizedloans, by guaranty agency: FY 1997-FY 2000 (continued)
Ranking in FY97-FY00 Rank
Rank FY97 FY98 FY99 FY00 Guaranty agency FY972 FY982 FY992 FY002
1 USAF USAF USAF USAF Arkansas 27 27 27 26
2 Pennsylvania California California California California 4 2 2 2
3 Wisconsin Pennsylvania Pennsylvania Pennsylvania Colorado 15 16 16 15
4 California Wisconsin Texas New York Connecticut 24 25 25 27
5 New York Texas Wisconsin Wisconsin ECMC 29 28 28 28
6 Texas New York New York Texas Florida 8 8 7 7
7 Massachusetts Massachusetts Florida Florida Georgia 21 20 22 25
8 Florida Florida Massachusetts Massachusetts Illinois 9 9 9 10
9 Illinois Illinois Illinois Nebraska Iowa 23 24 24 21
10 Washington Nebraska Nebraska Illinois Kentucky 14 15 12 12
11 Tennessee Tennessee Tennessee Tennessee Louisiana 18 22 23 24
12 Nebraska Washington Kentucky Kentucky Maine 30 30 30 30
13 Oklahoma Oklahoma Missouri Missouri Massachusetts 7 7 8 8
14 Kentucky Missouri Oklahoma Oklahoma Michigan 16 18 17 16
15 Colorado Kentucky Washington Colorado Missouri 17 14 13 13
16 Michigan Colorado Colorado Michigan Montana 32 32 32 36
17 Missouri Utah Michigan New Jersey Nebraska 12 10 10 9
18 Louisiana Michigan Utah South Dakota New Hampshire 28 29 29 29
19 South Carolina South Carolina South Dakota South Carolina New Jersey 22 23 21 17
20 Utah Georgia South Carolina Utah New Mexico 33 34 35 35
21 Georgia South Dakota New Jersey Iowa New York 5 6 6 4
22 New Jersey Louisiana Georgia Washington North Carolina 26 26 26 23
23 Iowa New Jersey Louisiana North Carolina North Dakota 35 33 34 34
24 Connecticut Iowa Iowa Louisiana Oklahoma 13 13 14 14
25 South Dakota Connecticut Connecticut Georgia Oregon 36 36 33 33
26 North Carolina North Carolina North Carolina Arkansas Pennsylvania 2 3 3 3
27 Arkansas Arkansas Arkansas Connecticut Rhode Island 31 31 31 31
28 New Hampshire ECMC ECMC ECMC South Carolina 19 19 20 19
29 ECMC New Hampshire New Hampshire New Hampshire South Dakota 25 21 19 18
30 Maine Maine Maine Maine Tennessee 11 11 11 11
31 Rhode Island Rhode Island Rhode Island Rhode Island Texas 6 5 4 6
32 Montana Montana Montana Vermont USAF 1 1 1 1
33 New Mexico North Dakota Oregon Oregon Utah 20 17 18 20
34 Vermont New Mexico North Dakota North Dakota Vermont 34 35 36 32
35 North Dakota Vermont New Mexico New Mexico Washington 10 12 15 22
36 Oregon Oregon Vermont Montana Wisconsin 3 4 5 5
1 From FY97 to FY00, USAF was the designated guarantor for AK, AZ, HI, IN, KS, MD, MS, NV, PI, and WY; MA was the designated guarantor for DC; WA for ID; WI for MN, OH, PR, and VI; KY for AL; PA for DE and WV; and ECMC for VA.
2 The lowest rank for all four years was 36.
NOTES: “Commitments” excludes Consolidation loans, PLUS, and SLS refinanced loans authorized under the Higher Education Amendments of 1986.The loan volume reported in this table includes some loans that later may be canceled. Rankings are based on dollar amounts. Details may not add tototals due to rounding. Calculations are based on numbers before rounding. 0.0 indicates a number less than 0.05.
SOURCE: U.S. Department of Education, Office of Postsecondary Education, National Student Loan Data System.

74 Federal Student Loan Programs Data Book � FY 1997-FY 2000
This table shows an accounting of Stafford Unsubsidized loan volume commitments for each guaranty agency for
FY 1997-FY 2000. The number of loans, dollar amount, percent change from prior year, percent share of total
Stafford Unsubsidized guaranteed, and rankings of all guaranty agencies are tabulated for each agency. The
Stafford Unsubsidized loan program was initiated in FY 1994 and replaced the Supplemental Loan for Students
(SLS) program. (Summary information for this table is discussed in table 5.)
� In its fourth year of operation (FY 1997), the Stafford Unsubsidized program guaranteed 2.0 million loans
with a dollar volume of $7.7 billion. By FY 2000, the number of Stafford Unsubsidized loans had increased
by 24.8 percent to 2.5 million, and the dollar volume increased by 36.3 percent to $10.5 billion.
� Although USAF guaranteed the largest number of Stafford Unsubsidized loans between FY 1997 and
FY 2000, its share of the total loan volume decreased during this time. USAF guaranteed 30.7 percent of
Stafford Unsubsidized loan volume in FY 1997 compared to 27.9 percent in FY 2000.
� Wisconsin guaranteed the second largest portion of Stafford Unsubsidized loan volume in FY 1997 with
nearly $650 million. From FY 1998 to FY 2000, California assumed this rank by guaranteeing $777 million
in FY 1998, $853 million in FY 1999, and $1.0 billion in FY 2000.
� From FY 1997 to FY 2000, the five guaranty agencies with the highest volume (USAF, California,
Pennsylvania, Wisconsin, and New York) guaranteed approximately 60 percent of Stafford Unsubsidized
dollars.
Table 18. Federal Family Education Loan (FFEL) program loan volume commitments for Stafford Unsubsidized loans, by guaranty agency: FY 1997-FY 2000

Federal Student Loan Programs D
ata Book �
FY 1997-FY 200075
Loan Volume Commitments
Table 18. Federal Family Education Loan (FFEL) program loan volume commitments for Stafford Unsubsidized loans, by guaranty agency: FY 1997-FY 2000
Percent change Percent changeFY97 FY98 FY99 FY00 FY99-FY00 FY97-FY00 Percent share of total
Guaranty Dollars Dollars Dollars Dollars Loans Dollars
agency1 Loans ($ 000’s) Loans ($ 000’s) Loans ($ 000’s) Loans ($ 000’s) Loans Dollars Loans Dollars FY97 FY98 FY99 FY00 FY97 FY98 FY99 FY00
Arkansas 16,809 $58,683 17,721 $59,916 17,437 $60,789 21,654 $80,572 24.2 32.5 28.8 37.3 0.9 0.9 0.8 0.9 0.8 0.7 0.7 0.8
California 129,980 576,070 157,150 777,145 175,558 852,884 211,858 1,001,977 20.7 17.5 63.0 73.9 6.6 7.6 8.1 8.6 7.5 9.4 9.4 9.6
Colorado 31,384 100,603 32,834 109,931 34,564 119,072 37,221 135,227 7.7 13.6 18.6 34.4 1.6 1.6 1.6 1.5 1.3 1.3 1.3 1.3
Connecticut 15,024 56,917 15,085 60,023 15,378 65,321 17,103 72,723 11.2 11.3 13.8 27.8 0.8 0.7 0.7 0.7 0.7 0.7 0.7 0.7
ECMC 20,722 56,494 21,992 60,860 25,065 72,570 27,730 85,196 10.6 17.4 33.8 50.8 1.1 1.1 1.2 1.1 0.7 0.7 0.8 0.8
Florida 59,565 180,554 66,183 197,493 73,923 222,503 86,888 262,247 17.5 17.9 45.9 45.2 3.0 3.2 3.4 3.5 2.3 2.4 2.5 2.5
Georgia 24,263 77,130 26,723 83,461 25,042 82,946 28,512 97,954 13.9 18.1 17.5 27.0 1.2 1.3 1.2 1.2 1.0 1.0 0.9 0.9
Illinois 44,207 180,137 48,372 208,915 50,206 217,583 53,412 239,011 6.4 9.8 20.8 32.7 2.2 2.3 2.3 2.2 2.3 2.5 2.4 2.3
Iowa 17,515 81,272 18,962 89,243 19,429 92,403 23,621 115,200 21.6 24.7 34.9 41.7 0.9 0.9 0.9 1.0 1.1 1.1 1.0 1.1
Kentucky 29,910 95,065 31,940 103,243 37,196 126,740 47,317 161,694 27.2 27.6 58.2 70.1 1.5 1.5 1.7 1.9 1.2 1.2 1.4 1.5
Louisiana 19,541 62,116 19,357 61,102 20,824 67,971 23,995 80,990 15.2 19.2 22.8 30.4 1.0 0.9 1.0 1.0 0.8 0.7 0.7 0.8
Maine 10,647 32,478 11,393 37,443 11,274 39,236 11,764 42,095 4.3 7.3 10.5 29.6 0.5 0.6 0.5 0.5 0.4 0.5 0.4 0.4
Massachusetts 46,733 248,349 46,183 250,326 47,112 271,885 51,605 292,440 9.5 7.6 10.4 17.8 2.4 2.2 2.2 2.1 3.2 3.0 3.0 2.8
Michigan 32,706 94,834 34,164 103,688 36,166 110,239 40,186 125,711 11.1 14.0 22.9 32.6 1.7 1.7 1.7 1.6 1.2 1.3 1.2 1.2
Missouri 22,926 73,876 29,611 103,076 33,548 120,460 38,072 138,800 13.5 15.2 66.1 87.9 1.2 1.4 1.5 1.6 1.0 1.2 1.3 1.3
Montana 11,327 34,334 10,678 32,008 10,838 33,288 9,779 29,960 -9.8 -10.0 -13.7 -12.7 0.6 0.5 0.5 0.4 0.4 0.4 0.4 0.3
Nebraska 31,586 178,169 50,351 309,399 56,373 338,665 68,563 426,819 21.6 26.0 117.1 139.6 1.6 2.4 2.6 2.8 2.3 3.7 3.7 4.1
New Hampshire 13,560 48,673 12,160 46,083 12,327 49,559 12,977 52,079 5.3 5.1 -4.3 7.0 0.7 0.6 0.6 0.5 0.6 0.6 0.5 0.5
New Jersey 19,759 65,529 22,920 75,745 28,014 91,388 34,024 114,885 21.5 25.7 72.2 75.3 1.0 1.1 1.3 1.4 0.9 0.9 1.0 1.1
New Mexico 8,315 23,908 8,710 26,287 8,719 27,349 9,063 30,694 3.9 12.2 9.0 28.4 0.4 0.4 0.4 0.4 0.3 0.3 0.3 0.3
New York 129,829 519,025 132,201 548,626 135,524 603,190 162,847 740,758 20.2 22.8 25.4 42.7 6.6 6.4 6.2 6.6 6.8 6.6 6.6 7.1
North Carolina 18,134 59,908 20,103 67,642 21,826 76,679 29,016 110,252 32.9 43.8 60.0 84.0 0.9 1.0 1.0 1.2 0.8 0.8 0.8 1.1
North Dakota 8,149 22,174 9,764 26,974 10,754 31,081 11,513 33,798 7.1 8.7 41.3 52.4 0.4 0.5 0.5 0.5 0.3 0.3 0.3 0.3
Oklahoma 35,175 107,688 37,744 120,173 37,097 124,011 36,772 125,535 -0.9 1.2 4.5 16.6 1.8 1.8 1.7 1.5 1.4 1.5 1.4 1.2
Oregon 8,109 26,530 10,028 34,590 13,005 46,571 13,896 49,441 6.9 6.2 71.4 86.4 0.4 0.5 0.6 0.6 0.3 0.4 0.5 0.5
Pennsylvania 171,500 648,469 170,018 618,260 175,453 660,130 203,684 811,793 16.1 23.0 18.8 25.2 8.7 8.2 8.1 8.3 8.4 7.5 7.3 7.7
Rhode Island 13,469 43,973 12,785 43,137 13,612 47,574 13,969 49,053 2.6 3.1 3.7 11.6 0.7 0.6 0.6 0.6 0.6 0.5 0.5 0.5
South Carolina 23,048 77,339 23,954 80,357 24,946 88,558 27,204 101,766 9.1 14.9 18.0 31.6 1.2 1.2 1.1 1.1 1.0 1.0 1.0 1.0
South Dakota 15,913 48,459 21,912 66,839 25,092 79,628 30,771 104,918 22.6 31.8 93.4 116.5 0.8 1.1 1.2 1.3 0.6 0.8 0.9 1.0
Tennessee 33,478 106,436 36,003 117,714 41,123 139,460 46,253 167,404 12.5 20.0 38.2 57.3 1.7 1.7 1.9 1.9 1.4 1.4 1.5 1.6
Texas 140,155 484,600 147,474 520,002 158,876 597,354 177,258 686,279 11.6 14.9 26.5 41.6 7.1 7.1 7.3 7.2 6.3 6.3 6.6 6.5
USAF 541,255 2,359,673 540,396 2,410,056 558,813 2,655,149 602,225 2,921,063 7.8 10.0 11.3 23.8 27.5 26.1 25.7 24.5 30.7 29.1 29.2 27.9
Utah 13,530 45,552 16,986 58,958 16,648 57,562 17,683 60,973 6.2 5.9 30.7 33.9 0.7 0.8 0.8 0.7 0.6 0.7 0.6 0.6
Vermont 7,724 34,409 8,205 37,807 8,120 38,544 10,393 47,987 28.0 24.5 34.6 39.5 0.4 0.4 0.4 0.4 0.4 0.5 0.4 0.5
Washington 37,175 130,592 36,937 128,359 32,162 114,528 27,153 99,627 -15.6 -13.0 -27.0 -23.7 1.9 1.8 1.5 1.1 1.7 1.6 1.3 1.0
Wisconsin 164,818 649,237 160,746 600,609 163,224 656,351 190,092 785,327 16.5 19.7 15.3 21.0 8.4 7.8 7.5 7.7 8.4 7.3 7.2 7.5
Total 1,967,940 $7,689,258 2,067,745 $8,275,488 2,175,268 $9,079,219 2,456,073 $10,482,251 12.9 15.5 24.8 36.3 100.0 100.0 100.0 100.0 100.0 100.0 100.0 100.0
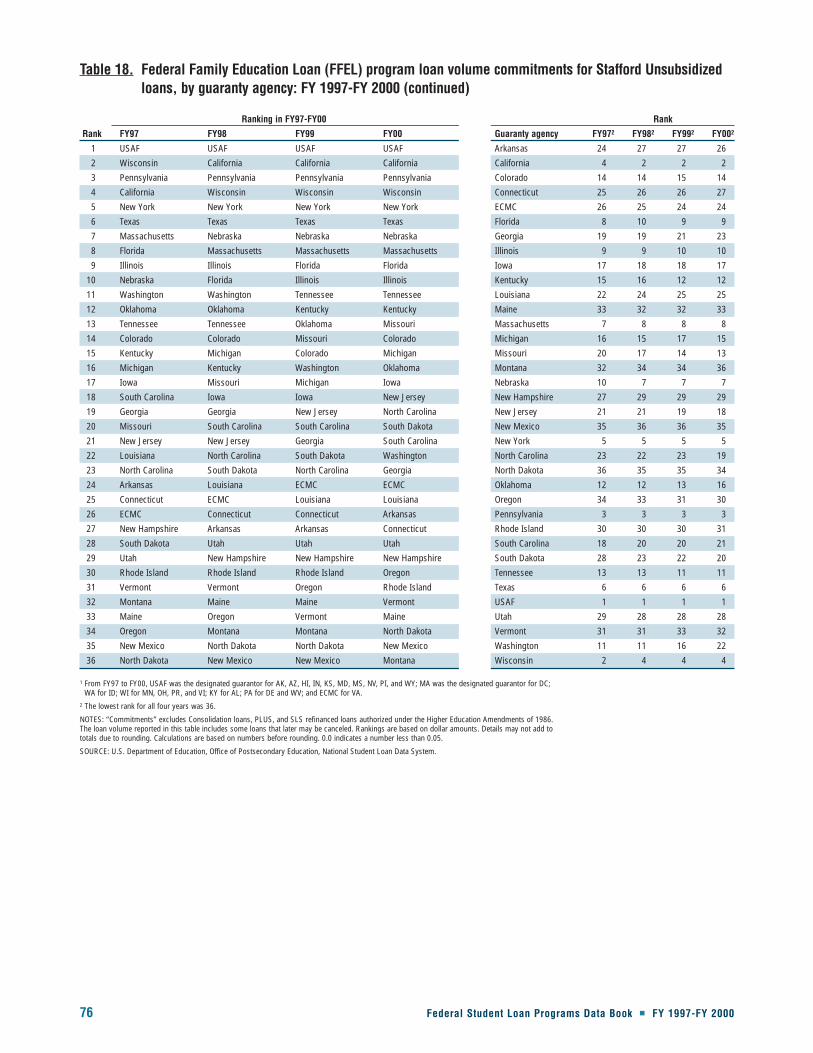
76 Federal Student Loan Programs Data Book � FY 1997-FY 2000
Table 18. Federal Family Education Loan (FFEL) program loan volume commitments for Stafford Unsubsidizedloans, by guaranty agency: FY 1997-FY 2000 (continued)
Ranking in FY97-FY00 Rank
Rank FY97 FY98 FY99 FY00 Guaranty agency FY972 FY982 FY992 FY002
1 USAF USAF USAF USAF Arkansas 24 27 27 26
2 Wisconsin California California California California 4 2 2 2
3 Pennsylvania Pennsylvania Pennsylvania Pennsylvania Colorado 14 14 15 14
4 California Wisconsin Wisconsin Wisconsin Connecticut 25 26 26 27
5 New York New York New York New York ECMC 26 25 24 24
6 Texas Texas Texas Texas Florida 8 10 9 9
7 Massachusetts Nebraska Nebraska Nebraska Georgia 19 19 21 23
8 Florida Massachusetts Massachusetts Massachusetts Illinois 9 9 10 10
9 Illinois Illinois Florida Florida Iowa 17 18 18 17
10 Nebraska Florida Illinois Illinois Kentucky 15 16 12 12
11 Washington Washington Tennessee Tennessee Louisiana 22 24 25 25
12 Oklahoma Oklahoma Kentucky Kentucky Maine 33 32 32 33
13 Tennessee Tennessee Oklahoma Missouri Massachusetts 7 8 8 8
14 Colorado Colorado Missouri Colorado Michigan 16 15 17 15
15 Kentucky Michigan Colorado Michigan Missouri 20 17 14 13
16 Michigan Kentucky Washington Oklahoma Montana 32 34 34 36
17 Iowa Missouri Michigan Iowa Nebraska 10 7 7 7
18 South Carolina Iowa Iowa New Jersey New Hampshire 27 29 29 29
19 Georgia Georgia New Jersey North Carolina New Jersey 21 21 19 18
20 Missouri South Carolina South Carolina South Dakota New Mexico 35 36 36 35
21 New Jersey New Jersey Georgia South Carolina New York 5 5 5 5
22 Louisiana North Carolina South Dakota Washington North Carolina 23 22 23 19
23 North Carolina South Dakota North Carolina Georgia North Dakota 36 35 35 34
24 Arkansas Louisiana ECMC ECMC Oklahoma 12 12 13 16
25 Connecticut ECMC Louisiana Louisiana Oregon 34 33 31 30
26 ECMC Connecticut Connecticut Arkansas Pennsylvania 3 3 3 3
27 New Hampshire Arkansas Arkansas Connecticut Rhode Island 30 30 30 31
28 South Dakota Utah Utah Utah South Carolina 18 20 20 21
29 Utah New Hampshire New Hampshire New Hampshire South Dakota 28 23 22 20
30 Rhode Island Rhode Island Rhode Island Oregon Tennessee 13 13 11 11
31 Vermont Vermont Oregon Rhode Island Texas 6 6 6 6
32 Montana Maine Maine Vermont USAF 1 1 1 1
33 Maine Oregon Vermont Maine Utah 29 28 28 28
34 Oregon Montana Montana North Dakota Vermont 31 31 33 32
35 New Mexico North Dakota North Dakota New Mexico Washington 11 11 16 22
36 North Dakota New Mexico New Mexico Montana Wisconsin 2 4 4 4
1 From FY97 to FY00, USAF was the designated guarantor for AK, AZ, HI, IN, KS, MD, MS, NV, PI, and WY; MA was the designated guarantor for DC; WA for ID; WI for MN, OH, PR, and VI; KY for AL; PA for DE and WV; and ECMC for VA.
2 The lowest rank for all four years was 36.
NOTES: “Commitments” excludes Consolidation loans, PLUS, and SLS refinanced loans authorized under the Higher Education Amendments of 1986.The loan volume reported in this table includes some loans that later may be canceled. Rankings are based on dollar amounts. Details may not add to totals due to rounding. Calculations are based on numbers before rounding. 0.0 indicates a number less than 0.05.
SOURCE: U.S. Department of Education, Office of Postsecondary Education, National Student Loan Data System.

Loan Volume Com
mitm
ents
Federal Student Loan Programs Data Book � FY 1997-FY 2000 77
This table shows an accounting of PLUS loan volume commitments for each guaranty agency for FY 1997-
FY 2000. The number of loans, dollar amount, percent change from prior year, percent share of total PLUS loans
guaranteed, and rankings of all guaranty agencies are tabulated for each agency. The PLUS loan program was
initiated in FY 1981. (Summary information for this table is discussed in table 5).
� PLUS loan volume commitments grew nearly 10 percent each year between FY 1997 and FY 2000. Overall,
PLUS loan volume increased by 31.5 percent from $1.9 billion in FY 1997 to $2.6 billion in FY 2000.
� USAF, the guaranty agency with the largest volume of loan commitments, guaranteed a decreasing
proportion of the total PLUS loan commitments from FY 1997 to FY 2000. USAF committed 35.2 percent
of total PLUS loan commitments in FY 1997 and 31.7 percent in FY 2000.
� Pennsylvania had the second largest PLUS loan commitments between FY 1998 and FY 2000 guaranteeing
approximately 10 percent of this volume each year.
� The five guaranty agencies with the highest volume (USAF, Pennsylvania, New York, California, and
Wisconsin) consistently guaranteed approximately two-thirds of the total PLUS loan volume each year
between FY 1997 and FY 2000. From FY 1997 - FY 2000, the share these five agencies guaranteed of the
total PLUS loan dollar volume was 67.1, 66.7, 65.2, and 66.3 percent, respectively.
� Between FY 1997 and FY 2000, PLUS loan volume commitments decreased for 10 guaranty agencies and
increased for 26 agencies. The four agencies where PLUS loan commitments increased over 100 percent
during this time were California (118.6 percent), North Carolina (116.6 percent), and Kentucky
(100.8 percent).
Table 19. Federal Family Education Loan (FFEL) program loan volume commitments for Parent Loans for Undergraduate Students (PLUS) loans, by guaranty agency: FY 1997-FY 2000
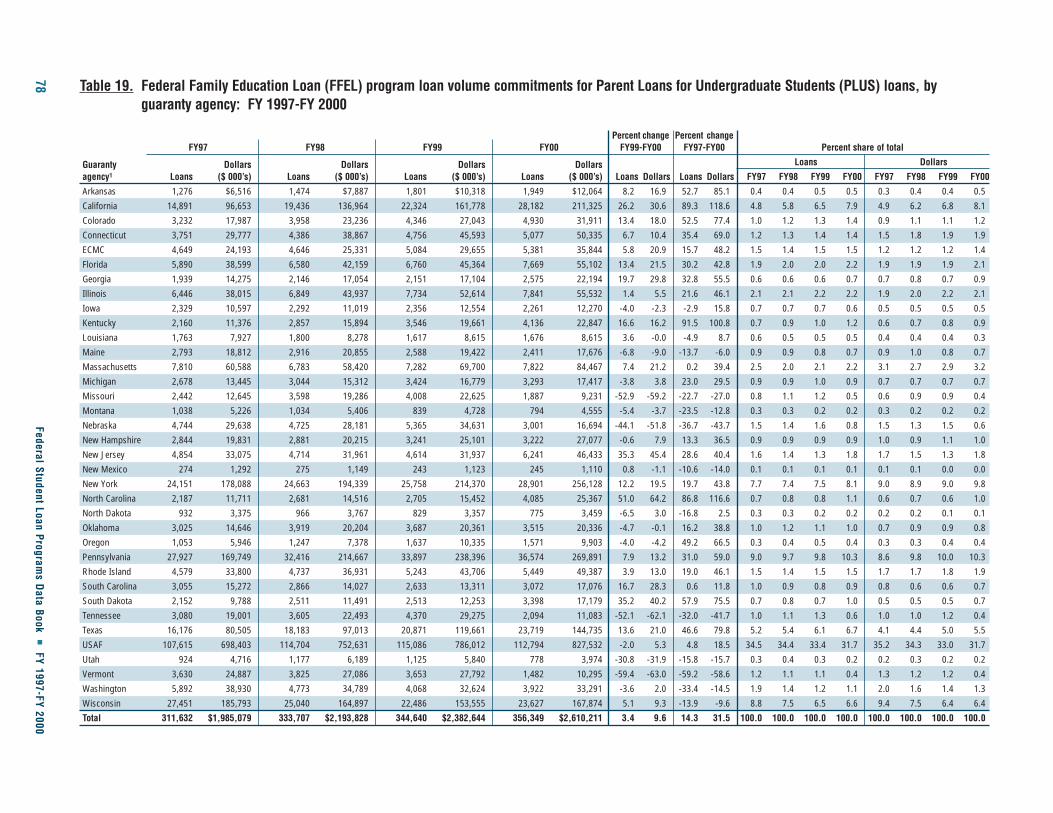
78Federal Student Loan Program
s Data Book
�FY 1997-FY 2000
Table 19. Federal Family Education Loan (FFEL) program loan volume commitments for Parent Loans for Undergraduate Students (PLUS) loans, byguaranty agency: FY 1997-FY 2000
Percent change Percent changeFY97 FY98 FY99 FY00 FY99-FY00 FY97-FY00 Percent share of total
Guaranty Dollars Dollars Dollars Dollars Loans Dollars
agency1 Loans ($ 000’s) Loans ($ 000’s) Loans ($ 000’s) Loans ($ 000’s) Loans Dollars Loans Dollars FY97 FY98 FY99 FY00 FY97 FY98 FY99 FY00
Arkansas 1,276 $6,516 1,474 $7,887 1,801 $10,318 1,949 $12,064 8.2 16.9 52.7 85.1 0.4 0.4 0.5 0.5 0.3 0.4 0.4 0.5
California 14,891 96,653 19,436 136,964 22,324 161,778 28,182 211,325 26.2 30.6 89.3 118.6 4.8 5.8 6.5 7.9 4.9 6.2 6.8 8.1
Colorado 3,232 17,987 3,958 23,236 4,346 27,043 4,930 31,911 13.4 18.0 52.5 77.4 1.0 1.2 1.3 1.4 0.9 1.1 1.1 1.2
Connecticut 3,751 29,777 4,386 38,867 4,756 45,593 5,077 50,335 6.7 10.4 35.4 69.0 1.2 1.3 1.4 1.4 1.5 1.8 1.9 1.9
ECMC 4,649 24,193 4,646 25,331 5,084 29,655 5,381 35,844 5.8 20.9 15.7 48.2 1.5 1.4 1.5 1.5 1.2 1.2 1.2 1.4
Florida 5,890 38,599 6,580 42,159 6,760 45,364 7,669 55,102 13.4 21.5 30.2 42.8 1.9 2.0 2.0 2.2 1.9 1.9 1.9 2.1
Georgia 1,939 14,275 2,146 17,054 2,151 17,104 2,575 22,194 19.7 29.8 32.8 55.5 0.6 0.6 0.6 0.7 0.7 0.8 0.7 0.9
Illinois 6,446 38,015 6,849 43,937 7,734 52,614 7,841 55,532 1.4 5.5 21.6 46.1 2.1 2.1 2.2 2.2 1.9 2.0 2.2 2.1
Iowa 2,329 10,597 2,292 11,019 2,356 12,554 2,261 12,270 -4.0 -2.3 -2.9 15.8 0.7 0.7 0.7 0.6 0.5 0.5 0.5 0.5
Kentucky 2,160 11,376 2,857 15,894 3,546 19,661 4,136 22,847 16.6 16.2 91.5 100.8 0.7 0.9 1.0 1.2 0.6 0.7 0.8 0.9
Louisiana 1,763 7,927 1,800 8,278 1,617 8,615 1,676 8,615 3.6 -0.0 -4.9 8.7 0.6 0.5 0.5 0.5 0.4 0.4 0.4 0.3
Maine 2,793 18,812 2,916 20,855 2,588 19,422 2,411 17,676 -6.8 -9.0 -13.7 -6.0 0.9 0.9 0.8 0.7 0.9 1.0 0.8 0.7
Massachusetts 7,810 60,588 6,783 58,420 7,282 69,700 7,822 84,467 7.4 21.2 0.2 39.4 2.5 2.0 2.1 2.2 3.1 2.7 2.9 3.2
Michigan 2,678 13,445 3,044 15,312 3,424 16,779 3,293 17,417 -3.8 3.8 23.0 29.5 0.9 0.9 1.0 0.9 0.7 0.7 0.7 0.7
Missouri 2,442 12,645 3,598 19,286 4,008 22,625 1,887 9,231 -52.9 -59.2 -22.7 -27.0 0.8 1.1 1.2 0.5 0.6 0.9 0.9 0.4
Montana 1,038 5,226 1,034 5,406 839 4,728 794 4,555 -5.4 -3.7 -23.5 -12.8 0.3 0.3 0.2 0.2 0.3 0.2 0.2 0.2
Nebraska 4,744 29,638 4,725 28,181 5,365 34,631 3,001 16,694 -44.1 -51.8 -36.7 -43.7 1.5 1.4 1.6 0.8 1.5 1.3 1.5 0.6
New Hampshire 2,844 19,831 2,881 20,215 3,241 25,101 3,222 27,077 -0.6 7.9 13.3 36.5 0.9 0.9 0.9 0.9 1.0 0.9 1.1 1.0
New Jersey 4,854 33,075 4,714 31,961 4,614 31,937 6,241 46,433 35.3 45.4 28.6 40.4 1.6 1.4 1.3 1.8 1.7 1.5 1.3 1.8
New Mexico 274 1,292 275 1,149 243 1,123 245 1,110 0.8 -1.1 -10.6 -14.0 0.1 0.1 0.1 0.1 0.1 0.1 0.0 0.0
New York 24,151 178,088 24,663 194,339 25,758 214,370 28,901 256,128 12.2 19.5 19.7 43.8 7.7 7.4 7.5 8.1 9.0 8.9 9.0 9.8
North Carolina 2,187 11,711 2,681 14,516 2,705 15,452 4,085 25,367 51.0 64.2 86.8 116.6 0.7 0.8 0.8 1.1 0.6 0.7 0.6 1.0
North Dakota 932 3,375 966 3,767 829 3,357 775 3,459 -6.5 3.0 -16.8 2.5 0.3 0.3 0.2 0.2 0.2 0.2 0.1 0.1
Oklahoma 3,025 14,646 3,919 20,204 3,687 20,361 3,515 20,336 -4.7 -0.1 16.2 38.8 1.0 1.2 1.1 1.0 0.7 0.9 0.9 0.8
Oregon 1,053 5,946 1,247 7,378 1,637 10,335 1,571 9,903 -4.0 -4.2 49.2 66.5 0.3 0.4 0.5 0.4 0.3 0.3 0.4 0.4
Pennsylvania 27,927 169,749 32,416 214,667 33,897 238,396 36,574 269,891 7.9 13.2 31.0 59.0 9.0 9.7 9.8 10.3 8.6 9.8 10.0 10.3
Rhode Island 4,579 33,800 4,737 36,931 5,243 43,706 5,449 49,387 3.9 13.0 19.0 46.1 1.5 1.4 1.5 1.5 1.7 1.7 1.8 1.9
South Carolina 3,055 15,272 2,866 14,027 2,633 13,311 3,072 17,076 16.7 28.3 0.6 11.8 1.0 0.9 0.8 0.9 0.8 0.6 0.6 0.7
South Dakota 2,152 9,788 2,511 11,491 2,513 12,253 3,398 17,179 35.2 40.2 57.9 75.5 0.7 0.8 0.7 1.0 0.5 0.5 0.5 0.7
Tennessee 3,080 19,001 3,605 22,493 4,370 29,275 2,094 11,083 -52.1 -62.1 -32.0 -41.7 1.0 1.1 1.3 0.6 1.0 1.0 1.2 0.4
Texas 16,176 80,505 18,183 97,013 20,871 119,661 23,719 144,735 13.6 21.0 46.6 79.8 5.2 5.4 6.1 6.7 4.1 4.4 5.0 5.5
USAF 107,615 698,403 114,704 752,631 115,086 786,012 112,794 827,532 -2.0 5.3 4.8 18.5 34.5 34.4 33.4 31.7 35.2 34.3 33.0 31.7
Utah 924 4,716 1,177 6,189 1,125 5,840 778 3,974 -30.8 -31.9 -15.8 -15.7 0.3 0.4 0.3 0.2 0.2 0.3 0.2 0.2
Vermont 3,630 24,887 3,825 27,086 3,653 27,792 1,482 10,295 -59.4 -63.0 -59.2 -58.6 1.2 1.1 1.1 0.4 1.3 1.2 1.2 0.4
Washington 5,892 38,930 4,773 34,789 4,068 32,624 3,922 33,291 -3.6 2.0 -33.4 -14.5 1.9 1.4 1.2 1.1 2.0 1.6 1.4 1.3
Wisconsin 27,451 185,793 25,040 164,897 22,486 153,555 23,627 167,874 5.1 9.3 -13.9 -9.6 8.8 7.5 6.5 6.6 9.4 7.5 6.4 6.4
Total 311,632 $1,985,079 333,707 $2,193,828 344,640 $2,382,644 356,349 $2,610,211 3.4 9.6 14.3 31.5 100.0 100.0 100.0 100.0 100.0 100.0 100.0 100.0
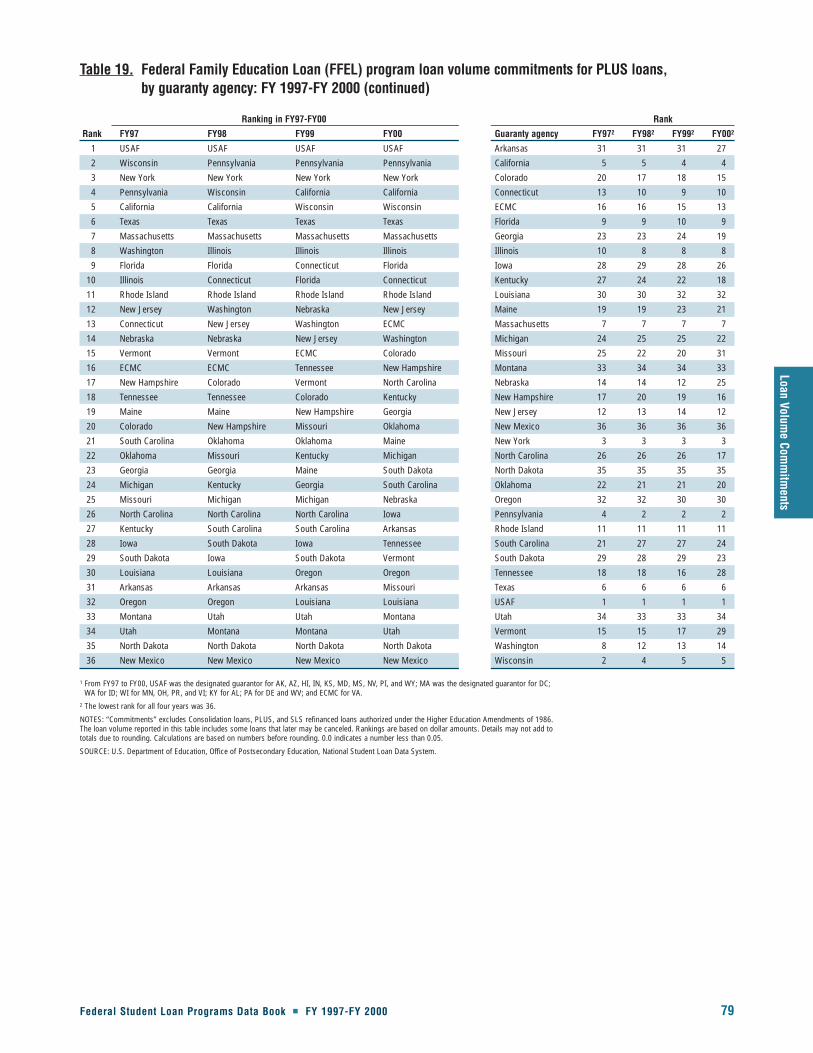
Federal Student Loan Programs Data Book � FY 1997-FY 2000 79
Loan Volume Com
mitm
ents
Table 19. Federal Family Education Loan (FFEL) program loan volume commitments for PLUS loans, by guaranty agency: FY 1997-FY 2000 (continued)
Ranking in FY97-FY00 Rank
Rank FY97 FY98 FY99 FY00 Guaranty agency FY972 FY982 FY992 FY002
1 USAF USAF USAF USAF Arkansas 31 31 31 27
2 Wisconsin Pennsylvania Pennsylvania Pennsylvania California 5 5 4 4
3 New York New York New York New York Colorado 20 17 18 15
4 Pennsylvania Wisconsin California California Connecticut 13 10 9 10
5 California California Wisconsin Wisconsin ECMC 16 16 15 13
6 Texas Texas Texas Texas Florida 9 9 10 9
7 Massachusetts Massachusetts Massachusetts Massachusetts Georgia 23 23 24 19
8 Washington Illinois Illinois Illinois Illinois 10 8 8 8
9 Florida Florida Connecticut Florida Iowa 28 29 28 26
10 Illinois Connecticut Florida Connecticut Kentucky 27 24 22 18
11 Rhode Island Rhode Island Rhode Island Rhode Island Louisiana 30 30 32 32
12 New Jersey Washington Nebraska New Jersey Maine 19 19 23 21
13 Connecticut New Jersey Washington ECMC Massachusetts 7 7 7 7
14 Nebraska Nebraska New Jersey Washington Michigan 24 25 25 22
15 Vermont Vermont ECMC Colorado Missouri 25 22 20 31
16 ECMC ECMC Tennessee New Hampshire Montana 33 34 34 33
17 New Hampshire Colorado Vermont North Carolina Nebraska 14 14 12 25
18 Tennessee Tennessee Colorado Kentucky New Hampshire 17 20 19 16
19 Maine Maine New Hampshire Georgia New Jersey 12 13 14 12
20 Colorado New Hampshire Missouri Oklahoma New Mexico 36 36 36 36
21 South Carolina Oklahoma Oklahoma Maine New York 3 3 3 3
22 Oklahoma Missouri Kentucky Michigan North Carolina 26 26 26 17
23 Georgia Georgia Maine South Dakota North Dakota 35 35 35 35
24 Michigan Kentucky Georgia South Carolina Oklahoma 22 21 21 20
25 Missouri Michigan Michigan Nebraska Oregon 32 32 30 30
26 North Carolina North Carolina North Carolina Iowa Pennsylvania 4 2 2 2
27 Kentucky South Carolina South Carolina Arkansas Rhode Island 11 11 11 11
28 Iowa South Dakota Iowa Tennessee South Carolina 21 27 27 24
29 South Dakota Iowa South Dakota Vermont South Dakota 29 28 29 23
30 Louisiana Louisiana Oregon Oregon Tennessee 18 18 16 28
31 Arkansas Arkansas Arkansas Missouri Texas 6 6 6 6
32 Oregon Oregon Louisiana Louisiana USAF 1 1 1 1
33 Montana Utah Utah Montana Utah 34 33 33 34
34 Utah Montana Montana Utah Vermont 15 15 17 29
35 North Dakota North Dakota North Dakota North Dakota Washington 8 12 13 14
36 New Mexico New Mexico New Mexico New Mexico Wisconsin 2 4 5 5
1 From FY97 to FY00, USAF was the designated guarantor for AK, AZ, HI, IN, KS, MD, MS, NV, PI, and WY; MA was the designated guarantor for DC; WA for ID; WI for MN, OH, PR, and VI; KY for AL; PA for DE and WV; and ECMC for VA.
2 The lowest rank for all four years was 36.
NOTES: “Commitments” excludes Consolidation loans, PLUS, and SLS refinanced loans authorized under the Higher Education Amendments of 1986.The loan volume reported in this table includes some loans that later may be canceled. Rankings are based on dollar amounts. Details may not add tototals due to rounding. Calculations are based on numbers before rounding. 0.0 indicates a number less than 0.05.
SOURCE: U.S. Department of Education, Office of Postsecondary Education, National Student Loan Data System.

80 Federal Student Loan Programs Data Book � FY 1997-FY 2000
This table shows a summary of the total volume for the overall FFEL program for each guaranty agency for
FY 1997-FY 2000. The number of loans, dollar amount, percent change from prior year, percent share of total FFEL
program volume, and rankings of all guaranty agencies are tabulated for each agency. (Summary information for
this table is discussed in table 5). (See also figure 16 which follows table 20.)
� Guaranty agencies that participated in the FFEL program reported an 18.5 percent increase in total dollar
volume commitments between FY 1997 and FY 2000 (from $21.7 to $25.7 billion). Most of this increase
occurred between FY 1999 and FY 2000 when FFEL program dollar volume commitments increased by
10.0 percent.
� USAF, the guaranty agency with the largest dollar volume commitments by far, guaranteed between
26.7 and 28.7 percent of FFEL program dollars between FY 1997 and FY 2000.
� California guaranteed the second largest portion of FFEL loan commitments between FY 1998 and
FY 1999 with 9 percent of this volume each year. Pennsylvania guaranteed the third largest portion during
this time with 8 percent of the volume each year.
� The five guaranty agencies with the highest volume (USAF, California, Pennsylvania, New York, and
Wisconsin) guaranteed 60.1, 58.6, 58.4, and 58.7 percent of total FFEL program loan dollars in FY 1997-
FY 2000, respectively.
� Four guaranty agencies reported decreases in FFEL program loan volume commitments from FY 1997 to
FY 2000. Washington, Montana, Maine, and New Hampshire reported decreases in FFEL program volume
of 30.5, 18.1, 1.5, and 0.3, respectively.
� Two guaranty agencies reported increases in FFEL program loan volume commitments from FY 1997 to
FY 2000 of over 70 percent. Nebraska and South Dakota reported increases in FFEL program volume of
98.0 and 70.2 percent, respectively.
Table 20. Federal Family Education Loan (FFEL) program loan volume commitments for Stafford Subsidized, Stafford Unsubsidized, and Parent Loans for Undergraduate Students (PLUS) loans, by guaranty agency: FY 1997-FY 2000
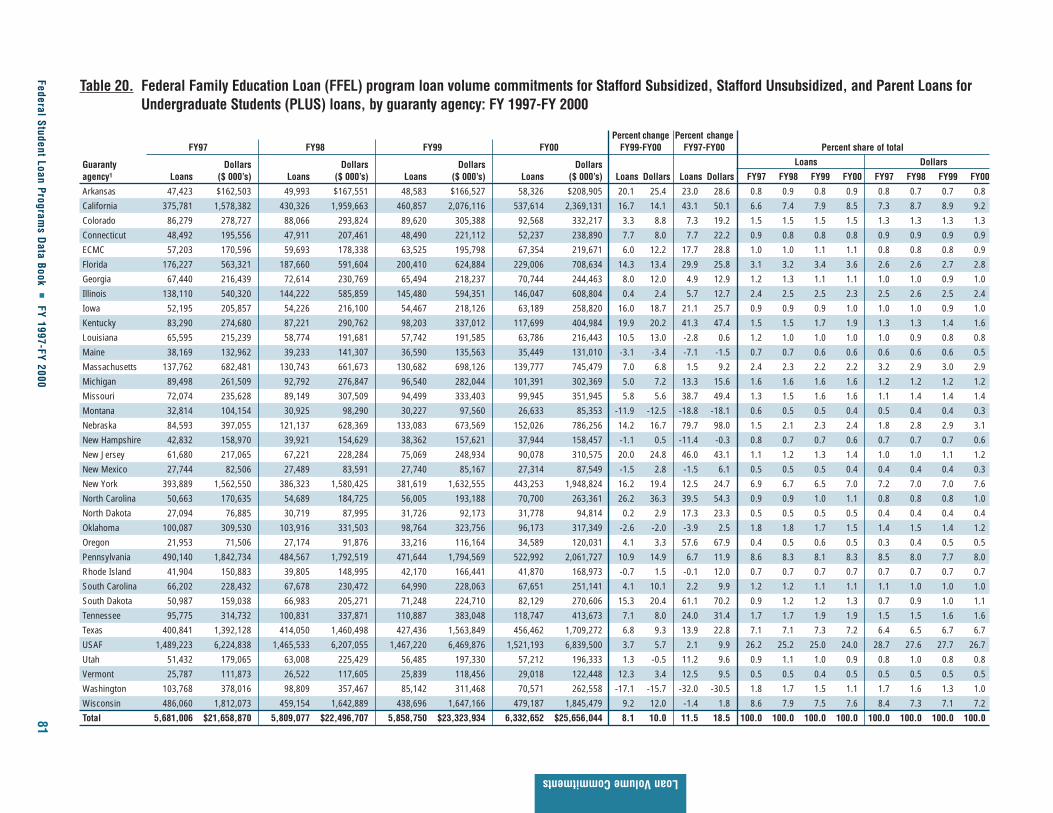
Federal Student Loan Programs D
ata Book �
FY 1997-FY 200081
Loan Volume Commitments
Table 20. Federal Family Education Loan (FFEL) program loan volume commitments for Stafford Subsidized, Stafford Unsubsidized, and Parent Loans forUndergraduate Students (PLUS) loans, by guaranty agency: FY 1997-FY 2000
Percent change Percent changeFY97 FY98 FY99 FY00 FY99-FY00 FY97-FY00 Percent share of total
Guaranty Dollars Dollars Dollars Dollars Loans Dollars
agency1 Loans ($ 000’s) Loans ($ 000’s) Loans ($ 000’s) Loans ($ 000’s) Loans Dollars Loans Dollars FY97 FY98 FY99 FY00 FY97 FY98 FY99 FY00
Arkansas 47,423 $162,503 49,993 $167,551 48,583 $166,527 58,326 $208,905 20.1 25.4 23.0 28.6 0.8 0.9 0.8 0.9 0.8 0.7 0.7 0.8
California 375,781 1,578,382 430,326 1,959,663 460,857 2,076,116 537,614 2,369,131 16.7 14.1 43.1 50.1 6.6 7.4 7.9 8.5 7.3 8.7 8.9 9.2
Colorado 86,279 278,727 88,066 293,824 89,620 305,388 92,568 332,217 3.3 8.8 7.3 19.2 1.5 1.5 1.5 1.5 1.3 1.3 1.3 1.3
Connecticut 48,492 195,556 47,911 207,461 48,490 221,112 52,237 238,890 7.7 8.0 7.7 22.2 0.9 0.8 0.8 0.8 0.9 0.9 0.9 0.9
ECMC 57,203 170,596 59,693 178,338 63,525 195,798 67,354 219,671 6.0 12.2 17.7 28.8 1.0 1.0 1.1 1.1 0.8 0.8 0.8 0.9
Florida 176,227 563,321 187,660 591,604 200,410 624,884 229,006 708,634 14.3 13.4 29.9 25.8 3.1 3.2 3.4 3.6 2.6 2.6 2.7 2.8
Georgia 67,440 216,439 72,614 230,769 65,494 218,237 70,744 244,463 8.0 12.0 4.9 12.9 1.2 1.3 1.1 1.1 1.0 1.0 0.9 1.0
Illinois 138,110 540,320 144,222 585,859 145,480 594,351 146,047 608,804 0.4 2.4 5.7 12.7 2.4 2.5 2.5 2.3 2.5 2.6 2.5 2.4
Iowa 52,195 205,857 54,226 216,100 54,467 218,126 63,189 258,820 16.0 18.7 21.1 25.7 0.9 0.9 0.9 1.0 1.0 1.0 0.9 1.0
Kentucky 83,290 274,680 87,221 290,762 98,203 337,012 117,699 404,984 19.9 20.2 41.3 47.4 1.5 1.5 1.7 1.9 1.3 1.3 1.4 1.6
Louisiana 65,595 215,239 58,774 191,681 57,742 191,585 63,786 216,443 10.5 13.0 -2.8 0.6 1.2 1.0 1.0 1.0 1.0 0.9 0.8 0.8
Maine 38,169 132,962 39,233 141,307 36,590 135,563 35,449 131,010 -3.1 -3.4 -7.1 -1.5 0.7 0.7 0.6 0.6 0.6 0.6 0.6 0.5
Massachusetts 137,762 682,481 130,743 661,673 130,682 698,126 139,777 745,479 7.0 6.8 1.5 9.2 2.4 2.3 2.2 2.2 3.2 2.9 3.0 2.9
Michigan 89,498 261,509 92,792 276,847 96,540 282,044 101,391 302,369 5.0 7.2 13.3 15.6 1.6 1.6 1.6 1.6 1.2 1.2 1.2 1.2
Missouri 72,074 235,628 89,149 307,509 94,499 333,403 99,945 351,945 5.8 5.6 38.7 49.4 1.3 1.5 1.6 1.6 1.1 1.4 1.4 1.4
Montana 32,814 104,154 30,925 98,290 30,227 97,560 26,633 85,353 -11.9 -12.5 -18.8 -18.1 0.6 0.5 0.5 0.4 0.5 0.4 0.4 0.3
Nebraska 84,593 397,055 121,137 628,369 133,083 673,569 152,026 786,256 14.2 16.7 79.7 98.0 1.5 2.1 2.3 2.4 1.8 2.8 2.9 3.1
New Hampshire 42,832 158,970 39,921 154,629 38,362 157,621 37,944 158,457 -1.1 0.5 -11.4 -0.3 0.8 0.7 0.7 0.6 0.7 0.7 0.7 0.6
New Jersey 61,680 217,065 67,221 228,284 75,069 248,934 90,078 310,575 20.0 24.8 46.0 43.1 1.1 1.2 1.3 1.4 1.0 1.0 1.1 1.2
New Mexico 27,744 82,506 27,489 83,591 27,740 85,167 27,314 87,549 -1.5 2.8 -1.5 6.1 0.5 0.5 0.5 0.4 0.4 0.4 0.4 0.3
New York 393,889 1,562,550 386,323 1,580,425 381,619 1,632,555 443,253 1,948,824 16.2 19.4 12.5 24.7 6.9 6.7 6.5 7.0 7.2 7.0 7.0 7.6
North Carolina 50,663 170,635 54,689 184,725 56,005 193,188 70,700 263,361 26.2 36.3 39.5 54.3 0.9 0.9 1.0 1.1 0.8 0.8 0.8 1.0
North Dakota 27,094 76,885 30,719 87,995 31,726 92,173 31,778 94,814 0.2 2.9 17.3 23.3 0.5 0.5 0.5 0.5 0.4 0.4 0.4 0.4
Oklahoma 100,087 309,530 103,916 331,503 98,764 323,756 96,173 317,349 -2.6 -2.0 -3.9 2.5 1.8 1.8 1.7 1.5 1.4 1.5 1.4 1.2
Oregon 21,953 71,506 27,174 91,876 33,216 116,164 34,589 120,031 4.1 3.3 57.6 67.9 0.4 0.5 0.6 0.5 0.3 0.4 0.5 0.5
Pennsylvania 490,140 1,842,734 484,567 1,792,519 471,644 1,794,569 522,992 2,061,727 10.9 14.9 6.7 11.9 8.6 8.3 8.1 8.3 8.5 8.0 7.7 8.0
Rhode Island 41,904 150,883 39,805 148,995 42,170 166,441 41,870 168,973 -0.7 1.5 -0.1 12.0 0.7 0.7 0.7 0.7 0.7 0.7 0.7 0.7
South Carolina 66,202 228,432 67,678 230,472 64,990 228,063 67,651 251,141 4.1 10.1 2.2 9.9 1.2 1.2 1.1 1.1 1.1 1.0 1.0 1.0
South Dakota 50,987 159,038 66,983 205,271 71,248 224,710 82,129 270,606 15.3 20.4 61.1 70.2 0.9 1.2 1.2 1.3 0.7 0.9 1.0 1.1
Tennessee 95,775 314,732 100,831 337,871 110,887 383,048 118,747 413,673 7.1 8.0 24.0 31.4 1.7 1.7 1.9 1.9 1.5 1.5 1.6 1.6
Texas 400,841 1,392,128 414,050 1,460,498 427,436 1,563,849 456,462 1,709,272 6.8 9.3 13.9 22.8 7.1 7.1 7.3 7.2 6.4 6.5 6.7 6.7
USAF 1,489,223 6,224,838 1,465,533 6,207,055 1,467,220 6,469,876 1,521,193 6,839,500 3.7 5.7 2.1 9.9 26.2 25.2 25.0 24.0 28.7 27.6 27.7 26.7
Utah 51,432 179,065 63,008 225,429 56,485 197,330 57,212 196,333 1.3 -0.5 11.2 9.6 0.9 1.1 1.0 0.9 0.8 1.0 0.8 0.8
Vermont 25,787 111,873 26,522 117,605 25,839 118,456 29,018 122,448 12.3 3.4 12.5 9.5 0.5 0.5 0.4 0.5 0.5 0.5 0.5 0.5
Washington 103,768 378,016 98,809 357,467 85,142 311,468 70,571 262,558 -17.1 -15.7 -32.0 -30.5 1.8 1.7 1.5 1.1 1.7 1.6 1.3 1.0
Wisconsin 486,060 1,812,073 459,154 1,642,889 438,696 1,647,166 479,187 1,845,479 9.2 12.0 -1.4 1.8 8.6 7.9 7.5 7.6 8.4 7.3 7.1 7.2
Total 5,681,006 $21,658,870 5,809,077 $22,496,707 5,858,750 $23,323,934 6,332,652 $25,656,044 8.1 10.0 11.5 18.5 100.0 100.0 100.0 100.0 100.0 100.0 100.0 100.0

82 Federal Student Loan Programs Data Book � FY 1997-FY 2000
Table 20. Federal Family Education Loan (FFEL) program loan volume commitments for Stafford Subsidized,Stafford Unsubsidized, and PLUS loans, by guaranty agency: FY 1997-FY 2000 (continued)
Ranking in FY97-FY00 Rank
Rank FY97 FY98 FY99 FY00 Guaranty agency FY972 FY982 FY992 FY002
1 USAF USAF USAF USAF Arkansas 27 28 28 27
2 Pennsylvania California California California California 4 2 2 2
3 Wisconsin Pennsylvania Pennsylvania Pennsylvania Colorado 14 15 16 14
4 California Wisconsin Wisconsin New York Connecticut 23 23 21 24
5 New York New York New York Wisconsin ECMC 26 27 25 25
6 Texas Texas Texas Texas Florida 8 9 9 9
7 Massachusetts Massachusetts Massachusetts Nebraska Georgia 20 18 22 23
8 Florida Nebraska Nebraska Massachusetts Illinois 9 10 10 10
9 Illinois Florida Florida Florida Iowa 22 22 23 21
10 Nebraska Illinois Illinois Illinois Kentucky 15 16 12 12
11 Washington Washington Tennessee Tennessee Louisiana 21 25 27 26
12 Tennessee Tennessee Kentucky Kentucky Maine 31 31 31 31
13 Oklahoma Oklahoma Missouri Missouri Massachusetts 7 7 7 8
14 Colorado Missouri Oklahoma Colorado Michigan 16 17 17 17
15 Kentucky Colorado Washington Oklahoma Missouri 17 14 13 13
16 Michigan Kentucky Colorado New Jersey Montana 33 33 34 36
17 Missouri Michigan Michigan Michigan Nebraska 10 8 8 7
18 South Carolina Georgia New Jersey South Dakota New Hampshire 29 29 30 30
19 New Jersey South Carolina South Carolina North Carolina New Jersey 19 20 18 16
20 Georgia New Jersey South Dakota Washington New Mexico 34 36 36 35
21 Louisiana Utah Connecticut Iowa New York 5 5 5 4
22 Iowa Iowa Georgia South Carolina North Carolina 25 26 26 19
23 Connecticut Connecticut Iowa Georgia North Dakota 35 35 35 34
24 Utah South Dakota Utah Connecticut Oklahoma 13 13 14 15
25 North Carolina Louisiana ECMC ECMC Oregon 36 34 33 33
26 ECMC North Carolina North Carolina Louisiana Pennsylvania 2 3 3 3
27 Arkansas ECMC Louisiana Arkansas Rhode Island 30 30 29 29
28 South Dakota Arkansas Arkansas Utah South Carolina 18 19 19 22
29 New Hampshire New Hampshire Rhode Island Rhode Island South Dakota 28 24 20 18
30 Rhode Island Rhode Island New Hampshire New Hampshire Tennessee 12 12 11 11
31 Maine Maine Maine Maine Texas 6 6 6 6
32 Vermont Vermont Vermont Vermont USAF 1 1 1 1
33 Montana Montana Oregon Oregon Utah 24 21 24 28
34 New Mexico Oregon Montana North Dakota Vermont 32 32 32 32
35 North Dakota North Dakota North Dakota New Mexico Washington 11 11 15 20
36 Oregon New Mexico New Mexico Montana Wisconsin 3 4 4 5
1 From FY97 to FY00, USAF was the designated guarantor for AK, AZ, HI, IN, KS, MD, MS, NV, PI, and WY; MA was the designated guarantor for DC; WA for ID; WI for MN, OH, PR, and VI; KY for AL; PA for DE and WV; and ECMC for VA.
2 The lowest rank for all four years was 36.
NOTES: “Commitments” excludes Consolidation loans, PLUS, and SLS refinanced loans authorized under the Higher Education Amendments of 1986. The loan volume reported in this table includes some loans that later may be canceled. Rankings are based on dollar amounts. Details may not add to totals due to rounding. Calculations are based on numbers before rounding. 0.0 indicates a number less than 0.05.
SOURCE: U.S. Department of Education, Office of Postsecondary Education, National Student Loan Data System.

Loan program type
Number of loans
Loan
s (in
000
’s)
FY97
FY98
FY99
FY00
0
1,000
2,000
3,000
4,000
5000,
6,000
7,000
FFEL totalPLUSStafford UnsubsidizedStafford Subsidized
3,5203,3393,4083,401
2,4562,1752,0681,968
356345334312
6,333
5,8595,8095,681
Loan program type
Dollar amount
Dolla
rs (i
n 00
0,00
0’s) FY97
FY98
FY99
FY00
FFEL totalPLUSStafford UnsubsidizedStafford Subsidized0
5,000
10,000
15,000
20,000
25,000
$30,000
$12,564
$10,482
$2,610
$25,656
$11,862
$9,079
$2,383
$23,324
$12,027
$8,275
$2,194
$22,497
$11,985
$7,689
$1,985
$21,659
Figure 16. Federal Family Education Loan (FFEL) program loan volume commitments, by loan program type: FY 1997-FY 2000
SOURCE: U.S. Department of Education, Office of Postsecondary Education, National Student Loan Data System.
SOURCE: U.S. Department of Education, Office of Postsecondary Education, National Student Loan Data System.
Federal Student Loan Programs Data Book � FY 1997-FY 2000 83
Loan Volume Com
mitm
ents
84 Federal Student Loan Programs Data Book � FY 1997-FY 2000
This table shows Consolidation loan volume commitment totals for each guaranty agency for FY 1997-FY 2000.
The number of loans, dollar amount, percent change from prior year, percent share of total Consolidation loans
guaranteed, and rankings of all guaranty agencies are tabulated for each agency. (See also figure 17 which follows
table 21.)
� Between FY 1997 and FY 2000, consolidation loan dollar commitments increased 50.1 percent from
$4.0 billion to $6.0 billion. After a 16.2 percent decrease in dollar volume from FY 1997 to FY 1998,
Consolidation loan commitments increased considerably by 49.3 percent from FY 1998 to FY 1999.
Consolidation loan volume increased another 20 percent between FY 1999 and FY 2000 to a high of
$6.0 billion.
� USAF, the guaranty agency with the largest number of Consolidation loan commitments, guaranteed
25.1 percent of Consolidation loan dollars in FY 1997. In FY 1998-FY 2000, USAF guaranteed 29.2, 28.5,
and 35.3 percent of the total for Consolidation loans, respectively.
� From FY 1997 to FY 2000, several guaranty agencies experienced dramatic growth in their Consolidation
loan dollar commitments. Ten guaranty agencies experienced an increase in this volume of more than 100
percent. These were Arkansas (144.0 percent), Educational Credit Management Corporation (ECMC)
(1,254.1 percent), Louisiana (155.9 percent), Maine (109.9 percent), Montana (151.6 percent), New
Hampshire (103.7 percent), New York (121.7 percent), South Carolina (224.6 percent), USAF
(111.2 percent), and Vermont (496.4 percent).
NOTES: Consolidation loans are not reported as commitments in the same manner as are other FFEL program loan types. They are not
included in table 20 that summarizes the loan volume commitments for the FFEL program. Consolidation occurs when a borrower with
multiple loans requests that all of his or her loans be consolidated into one loan. This is advantageous to the borrower because he or she
can now make one payment to a single lender.
Table 21. Federal Family Education Loan (FFEL) program loan volume commitments for Consolidation loans, by guaranty agency: FY 1997-FY 2000
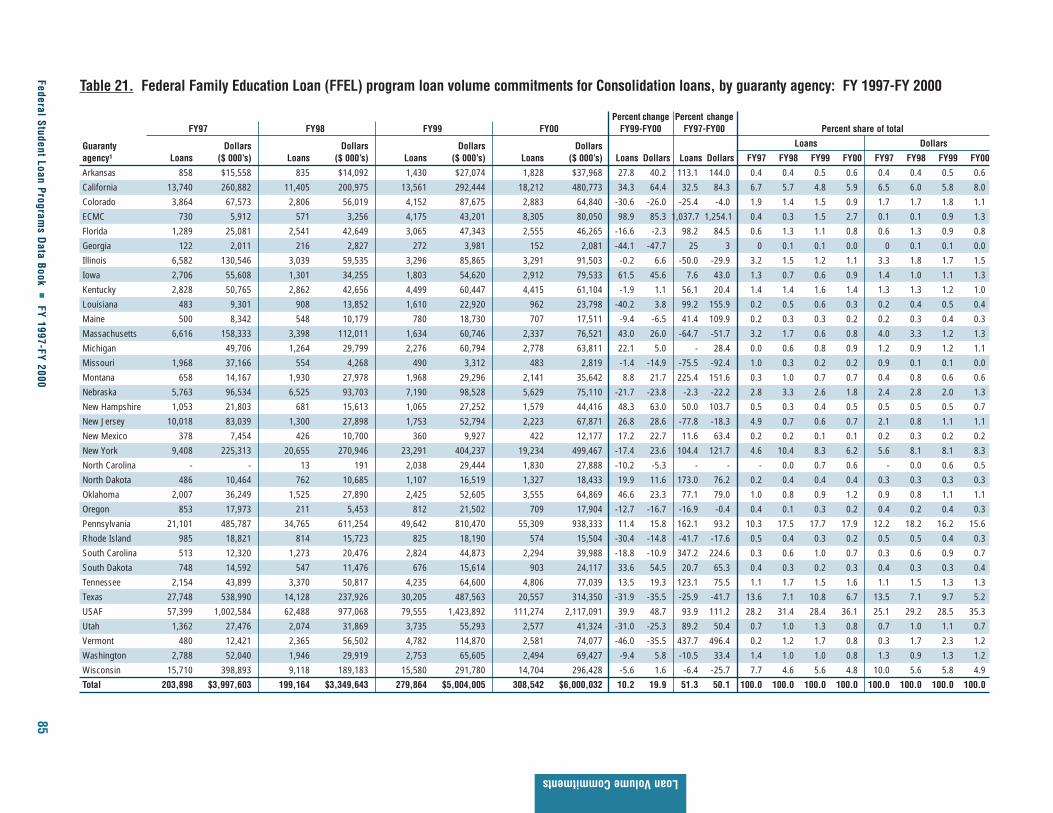
Federal Student Loan Programs D
ata Book �
FY 1997-FY 200085
Loan Volume Commitments
Table 21. Federal Family Education Loan (FFEL) program loan volume commitments for Consolidation loans, by guaranty agency: FY 1997-FY 2000
Percent change Percent changeFY97 FY98 FY99 FY00 FY99-FY00 FY97-FY00 Percent share of total
Guaranty Dollars Dollars Dollars Dollars Loans Dollars
agency1 Loans ($ 000’s) Loans ($ 000’s) Loans ($ 000’s) Loans ($ 000’s) Loans Dollars Loans Dollars FY97 FY98 FY99 FY00 FY97 FY98 FY99 FY00
Arkansas 858 $15,558 835 $14,092 1,430 $27,074 1,828 $37,968 27.8 40.2 113.1 144.0 0.4 0.4 0.5 0.6 0.4 0.4 0.5 0.6
California 13,740 260,882 11,405 200,975 13,561 292,444 18,212 480,773 34.3 64.4 32.5 84.3 6.7 5.7 4.8 5.9 6.5 6.0 5.8 8.0
Colorado 3,864 67,573 2,806 56,019 4,152 87,675 2,883 64,840 -30.6 -26.0 -25.4 -4.0 1.9 1.4 1.5 0.9 1.7 1.7 1.8 1.1
ECMC 730 5,912 571 3,256 4,175 43,201 8,305 80,050 98.9 85.3 1,037.7 1,254.1 0.4 0.3 1.5 2.7 0.1 0.1 0.9 1.3
Florida 1,289 25,081 2,541 42,649 3,065 47,343 2,555 46,265 -16.6 -2.3 98.2 84.5 0.6 1.3 1.1 0.8 0.6 1.3 0.9 0.8
Georgia 122 2,011 216 2,827 272 3,981 152 2,081 -44.1 -47.7 25 3 0 0.1 0.1 0.0 0 0.1 0.1 0.0
Illinois 6,582 130,546 3,039 59,535 3,296 85,865 3,291 91,503 -0.2 6.6 -50.0 -29.9 3.2 1.5 1.2 1.1 3.3 1.8 1.7 1.5
Iowa 2,706 55,608 1,301 34,255 1,803 54,620 2,912 79,533 61.5 45.6 7.6 43.0 1.3 0.7 0.6 0.9 1.4 1.0 1.1 1.3
Kentucky 2,828 50,765 2,862 42,656 4,499 60,447 4,415 61,104 -1.9 1.1 56.1 20.4 1.4 1.4 1.6 1.4 1.3 1.3 1.2 1.0
Louisiana 483 9,301 908 13,852 1,610 22,920 962 23,798 -40.2 3.8 99.2 155.9 0.2 0.5 0.6 0.3 0.2 0.4 0.5 0.4
Maine 500 8,342 548 10,179 780 18,730 707 17,511 -9.4 -6.5 41.4 109.9 0.2 0.3 0.3 0.2 0.2 0.3 0.4 0.3
Massachusetts 6,616 158,333 3,398 112,011 1,634 60,746 2,337 76,521 43.0 26.0 -64.7 -51.7 3.2 1.7 0.6 0.8 4.0 3.3 1.2 1.3
Michigan 49,706 1,264 29,799 2,276 60,794 2,778 63,811 22.1 5.0 - 28.4 0.0 0.6 0.8 0.9 1.2 0.9 1.2 1.1
Missouri 1,968 37,166 554 4,268 490 3,312 483 2,819 -1.4 -14.9 -75.5 -92.4 1.0 0.3 0.2 0.2 0.9 0.1 0.1 0.0
Montana 658 14,167 1,930 27,978 1,968 29,296 2,141 35,642 8.8 21.7 225.4 151.6 0.3 1.0 0.7 0.7 0.4 0.8 0.6 0.6
Nebraska 5,763 96,534 6,525 93,703 7,190 98,528 5,629 75,110 -21.7 -23.8 -2.3 -22.2 2.8 3.3 2.6 1.8 2.4 2.8 2.0 1.3
New Hampshire 1,053 21,803 681 15,613 1,065 27,252 1,579 44,416 48.3 63.0 50.0 103.7 0.5 0.3 0.4 0.5 0.5 0.5 0.5 0.7
New Jersey 10,018 83,039 1,300 27,898 1,753 52,794 2,223 67,871 26.8 28.6 -77.8 -18.3 4.9 0.7 0.6 0.7 2.1 0.8 1.1 1.1
New Mexico 378 7,454 426 10,700 360 9,927 422 12,177 17.2 22.7 11.6 63.4 0.2 0.2 0.1 0.1 0.2 0.3 0.2 0.2
New York 9,408 225,313 20,655 270,946 23,291 404,237 19,234 499,467 -17.4 23.6 104.4 121.7 4.6 10.4 8.3 6.2 5.6 8.1 8.1 8.3
North Carolina - - 13 191 2,038 29,444 1,830 27,888 -10.2 -5.3 - - - 0.0 0.7 0.6 - 0.0 0.6 0.5
North Dakota 486 10,464 762 10,685 1,107 16,519 1,327 18,433 19.9 11.6 173.0 76.2 0.2 0.4 0.4 0.4 0.3 0.3 0.3 0.3
Oklahoma 2,007 36,249 1,525 27,890 2,425 52,605 3,555 64,869 46.6 23.3 77.1 79.0 1.0 0.8 0.9 1.2 0.9 0.8 1.1 1.1
Oregon 853 17,973 211 5,453 812 21,502 709 17,904 -12.7 -16.7 -16.9 -0.4 0.4 0.1 0.3 0.2 0.4 0.2 0.4 0.3
Pennsylvania 21,101 485,787 34,765 611,254 49,642 810,470 55,309 938,333 11.4 15.8 162.1 93.2 10.3 17.5 17.7 17.9 12.2 18.2 16.2 15.6
Rhode Island 985 18,821 814 15,723 825 18,190 574 15,504 -30.4 -14.8 -41.7 -17.6 0.5 0.4 0.3 0.2 0.5 0.5 0.4 0.3
South Carolina 513 12,320 1,273 20,476 2,824 44,873 2,294 39,988 -18.8 -10.9 347.2 224.6 0.3 0.6 1.0 0.7 0.3 0.6 0.9 0.7
South Dakota 748 14,592 547 11,476 676 15,614 903 24,117 33.6 54.5 20.7 65.3 0.4 0.3 0.2 0.3 0.4 0.3 0.3 0.4
Tennessee 2,154 43,899 3,370 50,817 4,235 64,600 4,806 77,039 13.5 19.3 123.1 75.5 1.1 1.7 1.5 1.6 1.1 1.5 1.3 1.3
Texas 27,748 538,990 14,128 237,926 30,205 487,563 20,557 314,350 -31.9 -35.5 -25.9 -41.7 13.6 7.1 10.8 6.7 13.5 7.1 9.7 5.2
USAF 57,399 1,002,584 62,488 977,068 79,555 1,423,892 111,274 2,117,091 39.9 48.7 93.9 111.2 28.2 31.4 28.4 36.1 25.1 29.2 28.5 35.3
Utah 1,362 27,476 2,074 31,869 3,735 55,293 2,577 41,324 -31.0 -25.3 89.2 50.4 0.7 1.0 1.3 0.8 0.7 1.0 1.1 0.7
Vermont 480 12,421 2,365 56,502 4,782 114,870 2,581 74,077 -46.0 -35.5 437.7 496.4 0.2 1.2 1.7 0.8 0.3 1.7 2.3 1.2
Washington 2,788 52,040 1,946 29,919 2,753 65,605 2,494 69,427 -9.4 5.8 -10.5 33.4 1.4 1.0 1.0 0.8 1.3 0.9 1.3 1.2
Wisconsin 15,710 398,893 9,118 189,183 15,580 291,780 14,704 296,428 -5.6 1.6 -6.4 -25.7 7.7 4.6 5.6 4.8 10.0 5.6 5.8 4.9
Total 203,898 $3,997,603 199,164 $3,349,643 279,864 $5,004,005 308,542 $6,000,032 10.2 19.9 51.3 50.1 100.0 100.0 100.0 100.0 100.0 100.0 100.0 100.0

86 Federal Student Loan Programs Data Book � FY 1997-FY 2000
Table 21. Federal Family Education Loan (FFEL) program loan volume commitments for Consolidation loans, byguaranty agency: FY 1997-FY 2000 (continued)
Ranking in FY97-FY00 Rank
Rank FY97 FY98 FY99 FY00 Guaranty agency FY972 FY982 FY992 FY002
1 USAF USAF USAF USAF Arkansas 24 25 26 24
2 Texas Pennsylvania Pennsylvania Pennsylvania California 5 5 5 4
3 Pennsylvania New York Texas New York Colorado 11 11 9 17
4 Wisconsin Texas New York California ECMC 33 33 22 8
5 California California California Texas Florida 20 14 20 20
6 New York Wisconsin Wisconsin Wisconsin Georgia 34 34 34 35
7 Massachusetts Massachusetts Vermont Illinois Illinois 8 9 10 7
8 Illinois Nebraska Nebraska ECMC Iowa 12 15 17 9
9 Nebraska Illinois Colorado Iowa Kentucky 14 13 15 19
10 New Jersey Vermont Illinois Tennessee Louisiana 30 26 27 28
11 Colorado Colorado Washington Massachusetts Maine 31 30 29 31
12 Iowa Tennessee Tennessee Nebraska Massachusetts 7 7 14 11
13 Washington Kentucky Michigan Vermont Michigan 15 18 13 18
14 Kentucky Florida Massachusetts Washington Missouri 17 32 35 34
15 Michigan Iowa Kentucky New Jersey Montana 26 19 24 25
16 Tennessee Utah Utah Oklahoma Nebraska 9 8 8 12
17 Missouri Washington Iowa Colorado New Hampshire 21 24 25 21
18 Oklahoma Michigan New Jersey Michigan New Jersey 10 20 18 15
19 Utah Montana Oklahoma Kentucky New Mexico 32 28 33 33
20 Florida New Jersey Florida Florida New York 6 3 4 3
21 New Hampshire Oklahoma South Carolina New Hampshire North Carolina — 35 23 26
22 Rhode Island South Carolina ECMC Utah North Dakota 29 29 31 29
23 Oregon Rhode Island North Carolina South Carolina Oklahoma 18 21 19 16
24 Arkansas New Hampshire Montana Arkansas Oregon 23 31 28 30
25 South Dakota Arkansas New Hampshire Montana Pennsylvania 3 2 2 2
26 Montana Louisiana Arkansas North Carolina Rhode Island 22 23 30 32
27 Vermont South Dakota Louisiana South Dakota South Carolina 28 22 21 23
28 South Carolina New Mexico Oregon Louisiana South Dakota 25 27 32 27
29 North Dakota North Dakota Maine North Dakota Tennessee 16 12 12 10
30 Louisiana Maine Rhode Island Oregon Texas 2 4 3 5
31 Maine Oregon North Dakota Maine USAF 1 1 1 1
32 New Mexico Missouri South Dakota Rhode Island Utah 19 16 16 22
33 ECMC ECMC New Mexico New Mexico Vermont 27 10 7 13
34 Georgia Georgia Georgia Missouri Washington 13 17 11 14
35 North Carolina Missouri Georgia Wisconsin 4 6 6 6
1 From FY97 to FY00, USAF was the designated guarantor for AK, AZ, HI, IN, KS, MD, MS, NV, PI, and WY; MA was the designated guarantor for DC; WA for ID; WI for MN, OH, PR, and VI; KY for AL; PA for DE and WV; and ECMC for VA.2 The lowest rank for FY97 was 33 while the lowest ranks for FY98, FY99, and FY00 was 35.
NOTES: “Commitments” excludes Consolidation loans, PLUS, and SLS refinanced loans authorized under the Higher Education Amendments of 1986. The loan volume reported in this table includes some loans that later may be canceled. Rankings are based on dollar amounts. Details may not add tototals due to rounding. Calculations are based on numbers before rounding. 0.0 indicates a number less than 0.05.
SOURCE: U.S. Department of Education, Office of Postsecondary Education, National Student Loan Data System.

Fiscal year
Number of loans
Loan
s (in
000
’s)
0
50
100
150
200
250
300
350
204 199
280
309
FY00FY99FY98FY97
Fiscal year
Dollar amount
Dolla
rs (i
n 00
0,00
0’s)
0
1,000
2,000
3,000
4,000
5000
6,000
$7,000
$3,998
$3,350
$5,004
$6,000
FY00FY99FY98FY97
Figure 17. Federal Family Education Loan (FFEL) program loan volume commitments, for Consolidation loans:FY 1997-FY 2000
SOURCE: U.S. Department of Education, Office of Postsecondary Education, National Student Loan Data System.
SOURCE: U.S. Department of Education, Office of Postsecondary Education, National Student Loan Data System.
Federal Student Loan Programs Data Book � FY 1997-FY 2000 87
Loan Volume Com
mitm
ents
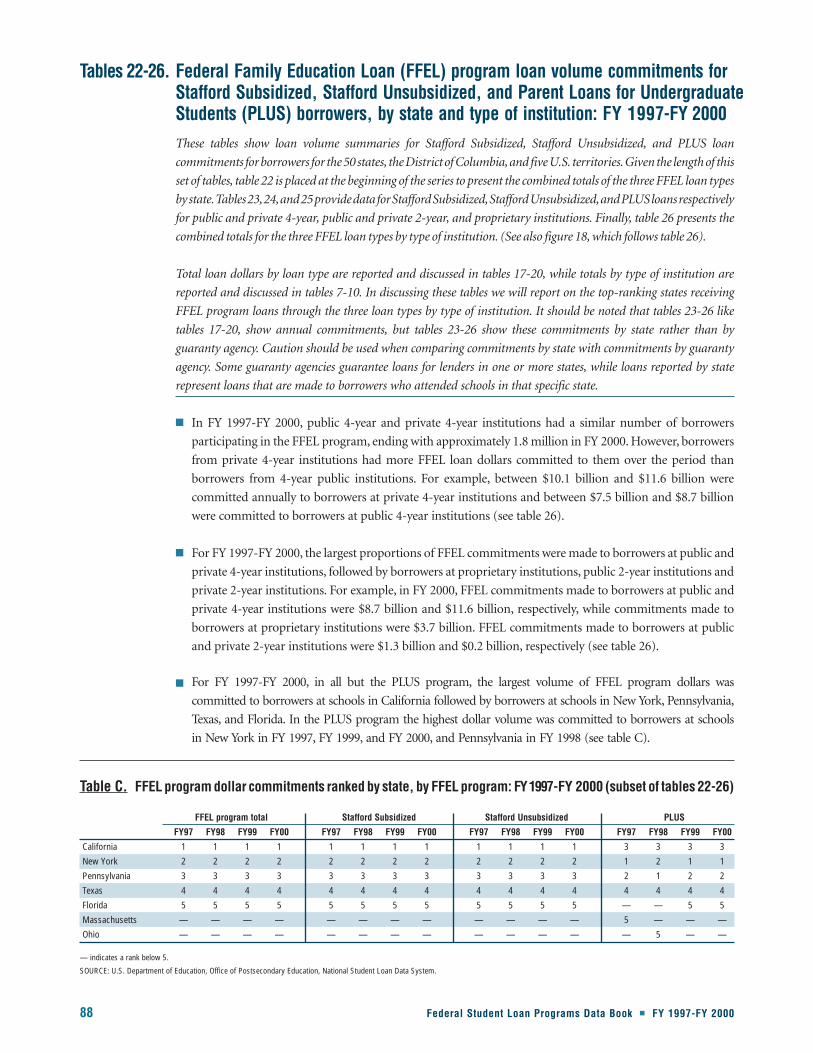
88 Federal Student Loan Programs Data Book � FY 1997-FY 2000
These tables show loan volume summaries for Stafford Subsidized, Stafford Unsubsidized, and PLUS loan
commitments forborrowers for the50states, theDistrictof Columbia,and fiveU.S. territories.Given the lengthof this
set of tables, table 22 is placed at the beginning of the series to present the combined totals of the three FFEL loan types
bystate.Tables23,24,and25providedataforStaffordSubsidized,StaffordUnsubsidized,andPLUSloansrespectively
for public and private 4-year, public and private 2-year, and proprietary institutions. Finally, table 26 presents the
combined totals for the three FFEL loan types by type of institution. (See also figure 18, which follows table 26).
Total loan dollars by loan type are reported and discussed in tables 17-20, while totals by type of institution are
reported and discussed in tables 7-10. In discussing these tables we will report on the top-ranking states receiving
FFEL program loans through the three loan types by type of institution. It should be noted that tables 23-26 like
tables 17-20, show annual commitments, but tables 23-26 show these commitments by state rather than by
guaranty agency. Caution should be used when comparing commitments by state with commitments by guaranty
agency. Some guaranty agencies guarantee loans for lenders in one or more states, while loans reported by state
represent loans that are made to borrowers who attended schools in that specific state.
� In FY 1997-FY 2000, public 4-year and private 4-year institutions had a similar number of borrowers
participating in the FFEL program, ending with approximately 1.8 million in FY 2000. However, borrowers
from private 4-year institutions had more FFEL loan dollars committed to them over the period than
borrowers from 4-year public institutions. For example, between $10.1 billion and $11.6 billion were
committed annually to borrowers at private 4-year institutions and between $7.5 billion and $8.7 billion
were committed to borrowers at public 4-year institutions (see table 26).
� For FY 1997-FY 2000, the largest proportions of FFEL commitments were made to borrowers at public and
private 4-year institutions, followed by borrowers at proprietary institutions, public 2-year institutions and
private 2-year institutions. For example, in FY 2000, FFEL commitments made to borrowers at public and
private 4-year institutions were $8.7 billion and $11.6 billion, respectively, while commitments made to
borrowers at proprietary institutions were $3.7 billion. FFEL commitments made to borrowers at public
and private 2-year institutions were $1.3 billion and $0.2 billion, respectively (see table 26).
� For FY 1997-FY 2000, in all but the PLUS program, the largest volume of FFEL program dollars was
committed to borrowers at schools in California followed by borrowers at schools in New York, Pennsylvania,
Texas, and Florida. In the PLUS program the highest dollar volume was committed to borrowers at schools
in New York in FY 1997, FY 1999, and FY 2000, and Pennsylvania in FY 1998 (see table C).
Tables 22-26. Federal Family Education Loan (FFEL) program loan volume commitments forStafford Subsidized, Stafford Unsubsidized, and Parent Loans for UndergraduateStudents (PLUS) borrowers, by state and type of institution: FY 1997-FY 2000
Table C. FFEL program dollar commitments ranked by state, by FFEL program: FY1997-FY 2000 (subset of tables 22-26)
FFEL program total Stafford Subsidized Stafford Unsubsidized PLUS
FY97 FY98 FY99 FY00 FY97 FY98 FY99 FY00 FY97 FY98 FY99 FY00 FY97 FY98 FY99 FY00
California 1 1 1 1 1 1 1 1 1 1 1 1 3 3 3 3
New York 2 2 2 2 2 2 2 2 2 2 2 2 1 2 1 1
Pennsylvania 3 3 3 3 3 3 3 3 3 3 3 3 2 1 2 2
Texas 4 4 4 4 4 4 4 4 4 4 4 4 4 4 4 4
Florida 5 5 5 5 5 5 5 5 5 5 5 5 — — 5 5
Massachusetts — — — — — — — — — — — — 5 — — —
Ohio — — — — — — — — — — — — — 5 — —
— indicates a rank below 5.
SOURCE: U.S. Department of Education, Office of Postsecondary Education, National Student Loan Data System.

Loan Volume Com
mitm
ents
Federal Student Loan Programs Data Book � FY 1997-FY 2000 89
� From FY 1997 to FY 2000, the largest portion of FFEL funds for public 4-year institutions went to
borrowers in Texas. The largest volume of dollar commitments to private 4-year institutions went to
borrowers in New York (see table D).
� The state with the largest volume of FFEL loan commitments going to borrowers at public 2-year
institutions was Texas in FY 1997 and Florida in FY 1998, FY 1999, and FY 2000. For private 2-year
institutions, California was the state with the highest dollar volume commitments. The state with the
largest volume of FFEL loan commitments going to borrowers at proprietary institutions was California in
FY 1997 and Arizona in FY 1998, FY 1999, and FY 2000 (see table D).
� The preceding bullets describe the proportion of total FFEL program commitments made to borrowers at
each postsecondary institution type. However, some of these states differ when examining commitments
by loan program type. For example:
� During FY 1997-FY 2000, borrowers in Texas received the largest share of Stafford Subsidized and
Unsubsidized loan volume committed to public 4-year institutions. However, borrowers in
Pennsylvania received the largest share of PLUS dollars committed to public 4-year institutions during
this time (see table D).
� Borrowers in New York received the largest share of Stafford Subsidized and PLUS loan volume
committed to private 4-year institutions in all years. California borrowers had the largest portion of
Stafford Unsubsidized commitments three years in a row, FY 1997-FY 1999. By FY 2000, borrowers in
New York also received the largest share of Stafford Unsubsidized commitments (see table D).
� In FY 1997 and FY 1998 borrowers in Texas received the largest share of PLUS dollar volume commitment
going to public 2-year institutions. But in FY 1999, Indiana took over the top spot as the state with the
highest proportion of PLUS dollar commitments going to borrowers from public 2-year institutions (see
table D). This figure for Indiana grew quickly from only $1.4 million in FY 1997 to $2.5 million in FY 1998,
$3.4 million in FY 1999, and $3.5 million in FY 2000 (see table 25).
� Although borrowers in California received the largest share of Stafford Subsidized and Unsubsidized loan
commitments made to private 2-year institutions in all years, borrowers in New York received the largest share
of PLUS loan volume for these institutions in FY 1997 and FY 1998. However, by FY 1999, borrowers in
California also received the largest share of PLUS commitments for private 2-year institutions (see table D).
� Although borrowers in California received the largest portion of PLUS commitments for proprietary
schools in all four years, borrowers in Arizona received the largest share of Stafford Subsidized and
Unsubsidized loan volume for these institutions each year (see table D).
Tables 22-26.(continued)
Table D. States that had borrowers who received the largest commitments of FFEL program funds, by loan program and type of institution: FY 1997-FY 2000 (subset of tables 22-26)
FFELprogram total Stafford Subsidized Stafford Unsubsidized PLUS
Type of institution FY97 FY98 FY99 FY00 FY97 FY98 FY99 FY00 FY97 FY98 FY99 FY00 FY97 FY98 FY99 FY00
Public 4-year TX TX TX TX TX TX TX TX TX TX TX TX PA PA PA PA
Private 4-year NY NY NY NY NY NY NY NY CA CA CA NY NY NY NY NY
Public 2-year TX FL FL FL TX FL FL FL FL FL FL FL TX TX IN IN
Private 2-year CA CA CA CA CA CA CA CA CA CA CA CA NY NY CA CA
Proprietary CA AZ AZ AZ AZ AZ AZ AZ AZ AZ AZ AZ CA CA CA CA
SOURCE: U.S. Department of Education, Office of Postsecondary Education, National Student Loan Data System.
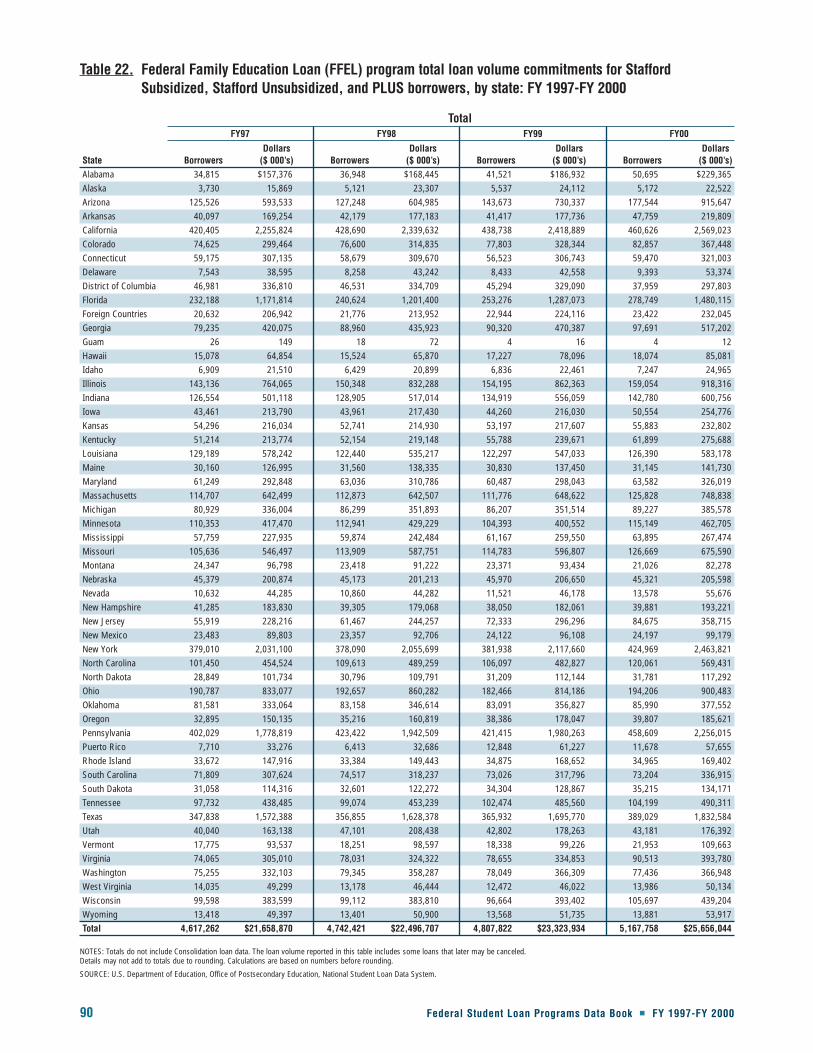
90 Federal Student Loan Programs Data Book � FY 1997-FY 2000
Table 22. Federal Family Education Loan (FFEL) program total loan volume commitments for StaffordSubsidized, Stafford Unsubsidized, and PLUS borrowers, by state: FY 1997-FY 2000
TotalFY97 FY98 FY99 FY00
Dollars Dollars Dollars DollarsState Borrowers ($ 000’s) Borrowers ($ 000’s) Borrowers ($ 000’s) Borrowers ($ 000’s)Alabama 34,815 $157,376 36,948 $168,445 41,521 $186,932 50,695 $229,365 Alaska 3,730 15,869 5,121 23,307 5,537 24,112 5,172 22,522 Arizona 125,526 593,533 127,248 604,985 143,673 730,337 177,544 915,647 Arkansas 40,097 169,254 42,179 177,183 41,417 177,736 47,759 219,809 California 420,405 2,255,824 428,690 2,339,632 438,738 2,418,889 460,626 2,569,023 Colorado 74,625 299,464 76,600 314,835 77,803 328,344 82,857 367,448 Connecticut 59,175 307,135 58,679 309,670 56,523 306,743 59,470 321,003 Delaware 7,543 38,595 8,258 43,242 8,433 42,558 9,393 53,374 District of Columbia 46,981 336,810 46,531 334,709 45,294 329,090 37,959 297,803 Florida 232,188 1,171,814 240,624 1,201,400 253,276 1,287,073 278,749 1,480,115 Foreign Countries 20,632 206,942 21,776 213,952 22,944 224,116 23,422 232,045 Georgia 79,235 420,075 88,960 435,923 90,320 470,387 97,691 517,202 Guam 26 149 18 72 4 16 4 12 Hawaii 15,078 64,854 15,524 65,870 17,227 78,096 18,074 85,081 Idaho 6,909 21,510 6,429 20,899 6,836 22,461 7,247 24,965 Illinois 143,136 764,065 150,348 832,288 154,195 862,363 159,054 918,316 Indiana 126,554 501,118 128,905 517,014 134,919 556,059 142,780 600,756 Iowa 43,461 213,790 43,961 217,430 44,260 216,030 50,554 254,776 Kansas 54,296 216,034 52,741 214,930 53,197 217,607 55,883 232,802 Kentucky 51,214 213,774 52,154 219,148 55,788 239,671 61,899 275,688 Louisiana 129,189 578,242 122,440 535,217 122,297 547,033 126,390 583,178 Maine 30,160 126,995 31,560 138,335 30,830 137,450 31,145 141,730 Maryland 61,249 292,848 63,036 310,786 60,487 298,043 63,582 326,019 Massachusetts 114,707 642,499 112,873 642,507 111,776 648,622 125,828 748,838 Michigan 80,929 336,004 86,299 351,893 86,207 351,514 89,227 385,578 Minnesota 110,353 417,470 112,941 429,229 104,393 400,552 115,149 462,705 Mississippi 57,759 227,935 59,874 242,484 61,167 259,550 63,895 267,474 Missouri 105,636 546,497 113,909 587,751 114,783 596,807 126,669 675,590 Montana 24,347 96,798 23,418 91,222 23,371 93,434 21,026 82,278 Nebraska 45,379 200,874 45,173 201,213 45,970 206,650 45,321 205,598 Nevada 10,632 44,285 10,860 44,282 11,521 46,178 13,578 55,676 New Hampshire 41,285 183,830 39,305 179,068 38,050 182,061 39,881 193,221 New Jersey 55,919 228,216 61,467 244,257 72,333 296,296 84,675 358,715 New Mexico 23,483 89,803 23,357 92,706 24,122 96,108 24,197 99,179 New York 379,010 2,031,100 378,090 2,055,699 381,938 2,117,660 424,969 2,463,821 North Carolina 101,450 454,524 109,613 489,259 106,097 482,827 120,061 569,431 North Dakota 28,849 101,734 30,796 109,791 31,209 112,144 31,781 117,292 Ohio 190,787 833,077 192,657 860,282 182,466 814,186 194,206 900,483 Oklahoma 81,581 333,064 83,158 346,614 83,091 356,827 85,990 377,552 Oregon 32,895 150,135 35,216 160,819 38,386 178,047 39,807 185,621 Pennsylvania 402,029 1,778,819 423,422 1,942,509 421,415 1,980,263 458,609 2,256,015 Puerto Rico 7,710 33,276 6,413 32,686 12,848 61,227 11,678 57,655 Rhode Island 33,672 147,916 33,384 149,443 34,875 168,652 34,965 169,402 South Carolina 71,809 307,624 74,517 318,237 73,026 317,796 73,204 336,915 South Dakota 31,058 114,316 32,601 122,272 34,304 128,867 35,215 134,171 Tennessee 97,732 438,485 99,074 453,239 102,474 485,560 104,199 490,311 Texas 347,838 1,572,388 356,855 1,628,378 365,932 1,695,770 389,029 1,832,584 Utah 40,040 163,138 47,101 208,438 42,802 178,263 43,181 176,392 Vermont 17,775 93,537 18,251 98,597 18,338 99,226 21,953 109,663 Virginia 74,065 305,010 78,031 324,322 78,655 334,853 90,513 393,780 Washington 75,255 332,103 79,345 358,287 78,049 366,309 77,436 366,948 West Virginia 14,035 49,299 13,178 46,444 12,472 46,022 13,986 50,134 Wisconsin 99,598 383,599 99,112 383,810 96,664 393,402 105,697 439,204 Wyoming 13,418 49,397 13,401 50,900 13,568 51,735 13,881 53,917 Total 4,617,262 $21,658,870 4,742,421 $22,496,707 4,807,822 $23,323,934 5,167,758 $25,656,044
NOTES: Totals do not include Consolidation loan data. The loan volume reported in this table includes some loans that later may be canceled. Details may not add to totals due to rounding. Calculations are based on numbers before rounding.
SOURCE: U.S. Department of Education, Office of Postsecondary Education, National Student Loan Data System.

Federal Student Loan Programs Data Book � FY 1997-FY 2000 91
Loan Volume Com
mitm
ents
Table 23. Federal Family Education Loan (FFEL) program loan volume commitments for Stafford Subsidizedborrowers, by state and type of institution: FY 1997-FY 2000
Public 4-yearFY97 FY98 FY99 FY00
Dollars Dollars Dollars DollarsState Borrowers ($ 000’s) Borrowers ($ 000’s) Borrowers ($ 000’s) Borrowers ($ 000’s)Alabama 10,648 $47,241 11,212 $49,604 13,401 $57,528 17,410 $75,207 Alaska 1,999 8,795 2,681 12,358 2,833 12,240 2,549 11,130 Arizona 11,680 60,555 10,678 55,283 9,824 49,654 8,883 45,052 Arkansas 18,024 78,884 18,786 81,401 17,929 77,140 21,382 99,004 California 79,738 383,160 75,202 358,719 72,859 340,657 72,850 341,909 Colorado 23,335 95,940 22,574 91,832 21,663 88,244 21,263 89,143 Connecticut 11,081 51,385 10,893 48,255 10,727 45,750 11,214 46,577 Delaware 1,688 5,963 1,824 6,778 1,636 5,928 1,683 6,291 District of Columbia 196 2,119 171 1,654 187 1,796 849 4,452 Florida 44,577 229,073 45,958 231,533 45,643 218,431 47,683 234,348 Georgia 15,039 63,491 16,591 69,880 15,650 66,464 14,662 62,814 Guam 20 108 11 42 4 16 3 8 Hawaii 3,567 17,308 3,384 15,977 3,906 19,014 3,446 16,119 Idaho 471 1,450 9 21 — — — — Illinois 15,986 65,935 16,596 69,475 17,128 72,269 16,444 69,473 Indiana 35,926 142,705 34,190 135,917 34,576 139,681 33,705 139,629 Iowa — — — — 1 2 — — Kansas 16,233 75,519 15,294 69,928 13,932 62,461 14,469 65,540 Kentucky 17,383 77,188 16,875 73,923 18,679 80,172 19,530 88,642 Louisiana 61,515 274,526 55,614 235,738 52,209 222,515 51,979 228,752 Maine 10,670 42,797 11,105 44,991 10,664 42,300 10,340 39,409 Maryland 20,122 105,850 19,326 104,541 17,993 92,490 17,210 90,880 Massachusetts 7,620 31,772 8,271 33,873 7,461 28,590 8,254 32,820 Michigan 10,998 49,353 10,129 44,586 7,792 34,504 7,168 35,911 Minnesota 16,665 55,422 15,826 52,156 13,012 40,350 13,816 48,368 Mississippi 22,750 101,160 23,222 106,961 23,205 109,509 23,667 109,112 Missouri 14,289 58,698 14,851 61,821 13,975 56,679 17,157 77,589 Montana 10,131 41,669 10,241 40,534 10,361 42,776 9,248 36,538 Nebraska 11,061 42,764 10,544 41,083 9,904 38,334 9,549 37,100 Nevada 2,661 14,681 2,771 13,766 2,582 12,390 2,591 12,529 New Hampshire 10,975 44,991 10,929 45,026 10,914 44,507 10,326 41,437 New Jersey 2,848 19,520 3,169 20,005 5,960 32,559 11,999 56,010 New Mexico 10,044 41,256 9,496 38,810 9,676 39,909 9,160 36,107 New York 47,759 218,465 46,254 204,713 48,181 209,585 51,687 233,634 North Carolina 29,716 124,025 30,361 126,243 27,280 116,075 31,483 137,716 North Dakota 13,280 49,315 13,534 50,691 13,238 49,664 13,147 51,031 Ohio 40,875 179,239 37,679 170,831 34,874 154,046 36,552 167,921 Oklahoma 25,351 111,898 25,474 113,050 24,970 109,885 24,618 109,714 Oregon 1,911 7,040 2,497 10,028 2,587 10,037 2,567 10,971 Pennsylvania 93,150 354,001 94,733 359,512 88,485 341,433 92,316 373,586 Puerto Rico 62 222 904 4,783 7,425 26,143 6,793 23,938 Rhode Island 2,631 9,674 2,455 8,889 2,309 8,139 1,228 3,981 South Carolina 27,428 123,657 27,155 122,713 25,057 114,658 24,440 114,947 South Dakota 12,558 47,731 12,706 48,849 12,819 49,810 12,374 47,597 Tennessee 23,920 108,706 24,457 111,882 26,123 118,350 26,322 119,543 Texas 117,591 561,876 119,861 569,884 117,662 559,688 120,024 573,026 Utah 15,786 67,483 19,698 96,723 16,391 71,514 16,306 68,996 Vermont 313 2,913 300 2,646 811 4,498 3,909 17,077 Virginia 12,448 50,457 13,177 53,699 13,432 55,958 13,117 54,237 Washington 13,337 63,863 13,920 65,420 13,539 64,185 13,053 62,150 West Virginia 2,646 9,371 2,603 8,555 2,381 8,239 2,395 8,472 Wisconsin 30,473 119,573 30,303 117,526 27,974 113,170 28,193 117,017 Wyoming 4,115 18,042 3,979 17,067 3,805 16,381 3,621 15,487 Total 1,035,292 $4,558,829 1,030,473 $4,520,176 1,005,629 $4,376,315 1,034,635 $4,588,951
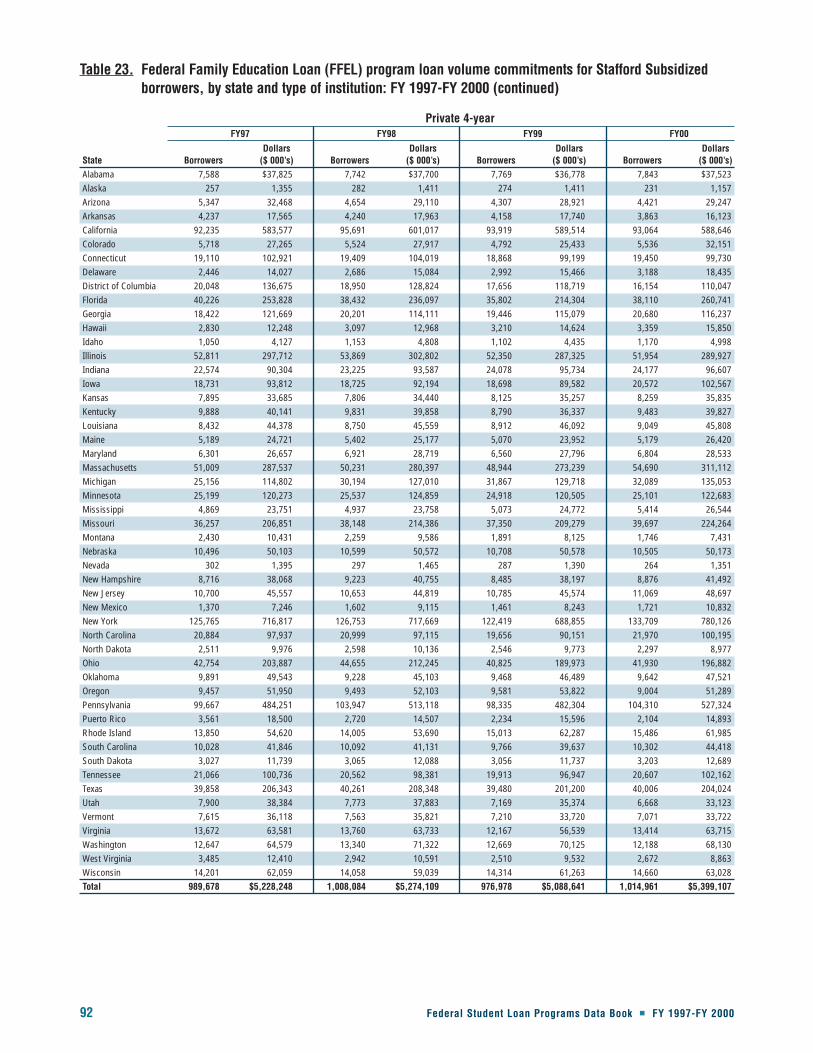
92 Federal Student Loan Programs Data Book � FY 1997-FY 2000
Table 23. Federal Family Education Loan (FFEL) program loan volume commitments for Stafford Subsidizedborrowers, by state and type of institution: FY 1997-FY 2000 (continued)
Private 4-yearFY97 FY98 FY99 FY00
Dollars Dollars Dollars DollarsState Borrowers ($ 000’s) Borrowers ($ 000’s) Borrowers ($ 000’s) Borrowers ($ 000’s)Alabama 7,588 $37,825 7,742 $37,700 7,769 $36,778 7,843 $37,523 Alaska 257 1,355 282 1,411 274 1,411 231 1,157 Arizona 5,347 32,468 4,654 29,110 4,307 28,921 4,421 29,247 Arkansas 4,237 17,565 4,240 17,963 4,158 17,740 3,863 16,123 California 92,235 583,577 95,691 601,017 93,919 589,514 93,064 588,646 Colorado 5,718 27,265 5,524 27,917 4,792 25,433 5,536 32,151 Connecticut 19,110 102,921 19,409 104,019 18,868 99,199 19,450 99,730 Delaware 2,446 14,027 2,686 15,084 2,992 15,466 3,188 18,435 District of Columbia 20,048 136,675 18,950 128,824 17,656 118,719 16,154 110,047 Florida 40,226 253,828 38,432 236,097 35,802 214,304 38,110 260,741 Georgia 18,422 121,669 20,201 114,111 19,446 115,079 20,680 116,237 Hawaii 2,830 12,248 3,097 12,968 3,210 14,624 3,359 15,850 Idaho 1,050 4,127 1,153 4,808 1,102 4,435 1,170 4,998 Illinois 52,811 297,712 53,869 302,802 52,350 287,325 51,954 289,927 Indiana 22,574 90,304 23,225 93,587 24,078 95,734 24,177 96,607 Iowa 18,731 93,812 18,725 92,194 18,698 89,582 20,572 102,567 Kansas 7,895 33,685 7,806 34,440 8,125 35,257 8,259 35,835 Kentucky 9,888 40,141 9,831 39,858 8,790 36,337 9,483 39,827 Louisiana 8,432 44,378 8,750 45,559 8,912 46,092 9,049 45,808 Maine 5,189 24,721 5,402 25,177 5,070 23,952 5,179 26,420 Maryland 6,301 26,657 6,921 28,719 6,560 27,796 6,804 28,533 Massachusetts 51,009 287,537 50,231 280,397 48,944 273,239 54,690 311,112 Michigan 25,156 114,802 30,194 127,010 31,867 129,718 32,089 135,053 Minnesota 25,199 120,273 25,537 124,859 24,918 120,505 25,101 122,683 Mississippi 4,869 23,751 4,937 23,758 5,073 24,772 5,414 26,544 Missouri 36,257 206,851 38,148 214,386 37,350 209,279 39,697 224,264 Montana 2,430 10,431 2,259 9,586 1,891 8,125 1,746 7,431 Nebraska 10,496 50,103 10,599 50,572 10,708 50,578 10,505 50,173 Nevada 302 1,395 297 1,465 287 1,390 264 1,351 New Hampshire 8,716 38,068 9,223 40,755 8,485 38,197 8,876 41,492 New Jersey 10,700 45,557 10,653 44,819 10,785 45,574 11,069 48,697 New Mexico 1,370 7,246 1,602 9,115 1,461 8,243 1,721 10,832 New York 125,765 716,817 126,753 717,669 122,419 688,855 133,709 780,126 North Carolina 20,884 97,937 20,999 97,115 19,656 90,151 21,970 100,195 North Dakota 2,511 9,976 2,598 10,136 2,546 9,773 2,297 8,977 Ohio 42,754 203,887 44,655 212,245 40,825 189,973 41,930 196,882 Oklahoma 9,891 49,543 9,228 45,103 9,468 46,489 9,642 47,521 Oregon 9,457 51,950 9,493 52,103 9,581 53,822 9,004 51,289 Pennsylvania 99,667 484,251 103,947 513,118 98,335 482,304 104,310 527,324 Puerto Rico 3,561 18,500 2,720 14,507 2,234 15,596 2,104 14,893 Rhode Island 13,850 54,620 14,005 53,690 15,013 62,287 15,486 61,985 South Carolina 10,028 41,846 10,092 41,131 9,766 39,637 10,302 44,418 South Dakota 3,027 11,739 3,065 12,088 3,056 11,737 3,203 12,689 Tennessee 21,066 100,736 20,562 98,381 19,913 96,947 20,607 102,162 Texas 39,858 206,343 40,261 208,348 39,480 201,200 40,006 204,024 Utah 7,900 38,384 7,773 37,883 7,169 35,374 6,668 33,123 Vermont 7,615 36,118 7,563 35,821 7,210 33,720 7,071 33,722 Virginia 13,672 63,581 13,760 63,733 12,167 56,539 13,414 63,715 Washington 12,647 64,579 13,340 71,322 12,669 70,125 12,188 68,130 West Virginia 3,485 12,410 2,942 10,591 2,510 9,532 2,672 8,863 Wisconsin 14,201 62,059 14,058 59,039 14,314 61,263 14,660 63,028 Total 989,678 $5,228,248 1,008,084 $5,274,109 976,978 $5,088,641 1,014,961 $5,399,107
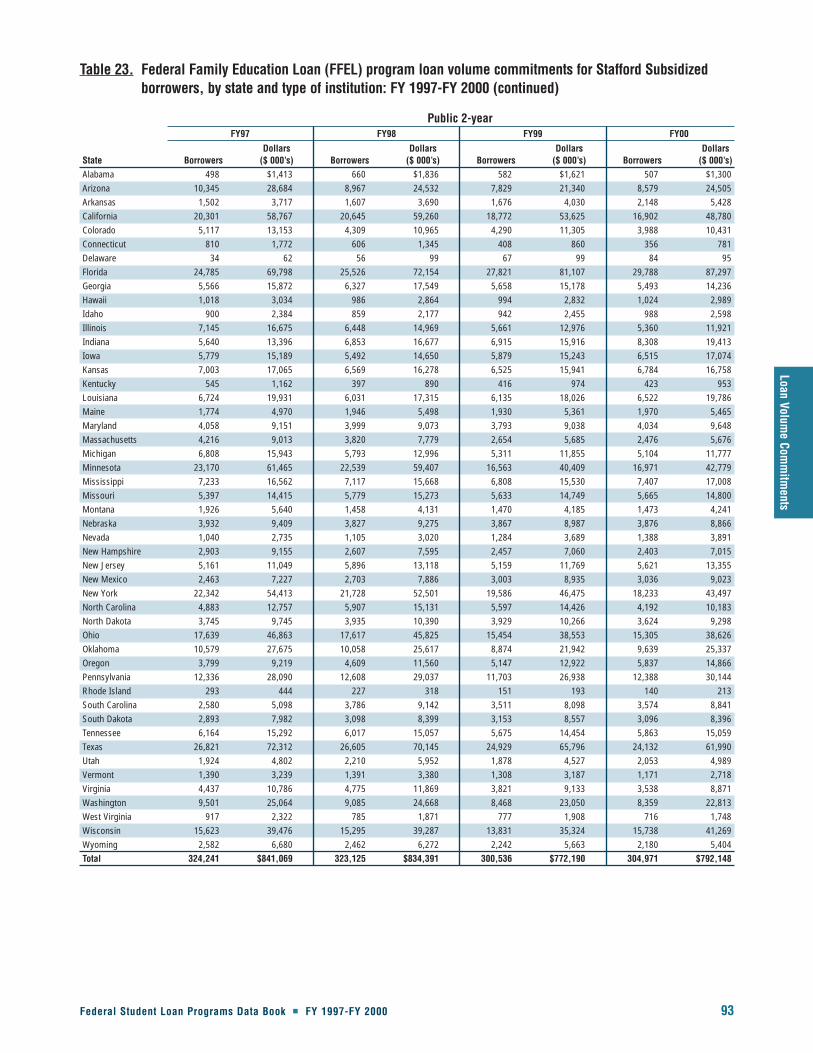
Federal Student Loan Programs Data Book � FY 1997-FY 2000 93
Loan Volume Com
mitm
ents
Table 23. Federal Family Education Loan (FFEL) program loan volume commitments for Stafford Subsidizedborrowers, by state and type of institution: FY 1997-FY 2000 (continued)
Public 2-yearFY97 FY98 FY99 FY00
Dollars Dollars Dollars DollarsState Borrowers ($ 000’s) Borrowers ($ 000’s) Borrowers ($ 000’s) Borrowers ($ 000’s)Alabama 498 $1,413 660 $1,836 582 $1,621 507 $1,300 Arizona 10,345 28,684 8,967 24,532 7,829 21,340 8,579 24,505 Arkansas 1,502 3,717 1,607 3,690 1,676 4,030 2,148 5,428 California 20,301 58,767 20,645 59,260 18,772 53,625 16,902 48,780 Colorado 5,117 13,153 4,309 10,965 4,290 11,305 3,988 10,431 Connecticut 810 1,772 606 1,345 408 860 356 781 Delaware 34 62 56 99 67 99 84 95 Florida 24,785 69,798 25,526 72,154 27,821 81,107 29,788 87,297 Georgia 5,566 15,872 6,327 17,549 5,658 15,178 5,493 14,236 Hawaii 1,018 3,034 986 2,864 994 2,832 1,024 2,989 Idaho 900 2,384 859 2,177 942 2,455 988 2,598 Illinois 7,145 16,675 6,448 14,969 5,661 12,976 5,360 11,921 Indiana 5,640 13,396 6,853 16,677 6,915 15,916 8,308 19,413 Iowa 5,779 15,189 5,492 14,650 5,879 15,243 6,515 17,074 Kansas 7,003 17,065 6,569 16,278 6,525 15,941 6,784 16,758 Kentucky 545 1,162 397 890 416 974 423 953 Louisiana 6,724 19,931 6,031 17,315 6,135 18,026 6,522 19,786 Maine 1,774 4,970 1,946 5,498 1,930 5,361 1,970 5,465 Maryland 4,058 9,151 3,999 9,073 3,793 9,038 4,034 9,648 Massachusetts 4,216 9,013 3,820 7,779 2,654 5,685 2,476 5,676 Michigan 6,808 15,943 5,793 12,996 5,311 11,855 5,104 11,777 Minnesota 23,170 61,465 22,539 59,407 16,563 40,409 16,971 42,779 Mississippi 7,233 16,562 7,117 15,668 6,808 15,530 7,407 17,008 Missouri 5,397 14,415 5,779 15,273 5,633 14,749 5,665 14,800 Montana 1,926 5,640 1,458 4,131 1,470 4,185 1,473 4,241 Nebraska 3,932 9,409 3,827 9,275 3,867 8,987 3,876 8,866 Nevada 1,040 2,735 1,105 3,020 1,284 3,689 1,388 3,891 New Hampshire 2,903 9,155 2,607 7,595 2,457 7,060 2,403 7,015 New Jersey 5,161 11,049 5,896 13,118 5,159 11,769 5,621 13,355 New Mexico 2,463 7,227 2,703 7,886 3,003 8,935 3,036 9,023 New York 22,342 54,413 21,728 52,501 19,586 46,475 18,233 43,497 North Carolina 4,883 12,757 5,907 15,131 5,597 14,426 4,192 10,183 North Dakota 3,745 9,745 3,935 10,390 3,929 10,266 3,624 9,298 Ohio 17,639 46,863 17,617 45,825 15,454 38,553 15,305 38,626 Oklahoma 10,579 27,675 10,058 25,617 8,874 21,942 9,639 25,337 Oregon 3,799 9,219 4,609 11,560 5,147 12,922 5,837 14,866 Pennsylvania 12,336 28,090 12,608 29,037 11,703 26,938 12,388 30,144 Rhode Island 293 444 227 318 151 193 140 213 South Carolina 2,580 5,098 3,786 9,142 3,511 8,098 3,574 8,841 South Dakota 2,893 7,982 3,098 8,399 3,153 8,557 3,096 8,396 Tennessee 6,164 15,292 6,017 15,057 5,675 14,454 5,863 15,059 Texas 26,821 72,312 26,605 70,145 24,929 65,796 24,132 61,990 Utah 1,924 4,802 2,210 5,952 1,878 4,527 2,053 4,989 Vermont 1,390 3,239 1,391 3,380 1,308 3,187 1,171 2,718 Virginia 4,437 10,786 4,775 11,869 3,821 9,133 3,538 8,871 Washington 9,501 25,064 9,085 24,668 8,468 23,050 8,359 22,813 West Virginia 917 2,322 785 1,871 777 1,908 716 1,748 Wisconsin 15,623 39,476 15,295 39,287 13,831 35,324 15,738 41,269 Wyoming 2,582 6,680 2,462 6,272 2,242 5,663 2,180 5,404 Total 324,241 $841,069 323,125 $834,391 300,536 $772,190 304,971 $792,148

94 Federal Student Loan Programs Data Book � FY 1997-FY 2000
Table 23. Federal Family Education Loan (FFEL) program loan volume commitments for Stafford Subsidizedborrowers, by state and type of institution: FY 1997-FY 2000 (continued)
Private 2-yearFY97 FY98 FY99 FY00
Dollars Dollars Dollars DollarsState Borrowers ($ 000’s) Borrowers ($ 000’s) Borrowers ($ 000’s) Borrowers ($ 000’s)Alabama 40 $107 28 $82 35 $80 24 $63 Arizona 1,040 2,711 303 952 72 127 861 2,420 Arkansas 371 924 133 333 119 299 121 331 California 8,722 27,545 8,982 29,155 8,897 28,523 9,537 29,535 Colorado 110 291 130 377 126 348 196 519 Connecticut 279 925 185 619 180 568 260 780 Delaware 10 41 11 42 13 46 8 28 District of Columbia 32 122 2 6 — — — — Florida 490 1,599 671 2,045 1,019 3,414 1,148 3,392 Georgia 924 2,344 867 2,094 891 2,433 901 2,339 Hawaii 915 2,895 1,024 3,266 1,089 3,526 1,244 3,959 Idaho 1,665 4,280 1,803 4,646 1,815 4,826 1,705 4,569 Illinois 971 2,852 1,164 3,410 1,016 2,953 1,134 3,170 Indiana 320 859 304 816 322 850 375 1,073 Iowa 901 2,526 853 2,292 786 1,904 807 2,102 Kansas 1,293 3,394 1,215 3,253 1,355 3,615 1,459 3,943 Kentucky 128 330 141 376 120 325 173 443 Louisiana 53 148 62 168 68 172 61 141 Maine 79 213 82 235 76 260 84 215 Maryland 67 197 34 80 44 113 71 204 Massachusetts 1,985 6,178 1,437 4,353 1,830 5,957 1,640 5,384 Michigan 44 126 8 11 4 7 3 10 Minnesota 708 1,996 914 2,651 842 2,380 885 2,433 Mississippi 488 1,243 504 1,356 337 837 384 1,091 Missouri 1,278 4,412 999 3,202 923 2,766 851 2,476 Montana 16 55 11 36 9 30 16 61 Nebraska 263 1,027 230 820 195 729 137 510 Nevada 1 1 — — — — — — New Hampshire 246 591 166 357 90 163 83 184 New Jersey 640 2,012 552 1,913 430 1,466 358 1,167 New York 4,931 14,435 3,849 11,664 3,489 10,446 3,353 10,262 North Carolina 430 1,249 377 1,158 355 1,058 315 901 Ohio 1,073 2,915 880 2,494 742 2,209 716 2,031 Oklahoma 165 394 142 333 158 403 220 581 Oregon 135 434 95 371 16 40 — — Pennsylvania 3,517 12,771 3,113 9,782 2,817 8,709 2,970 9,546 Puerto Rico 184 370 159 333 105 223 211 430 Rhode Island 59 207 49 193 40 139 39 120 South Carolina 318 784 270 694 196 492 219 591 South Dakota 225 645 235 699 219 631 253 709 Tennessee 423 1,309 263 719 228 715 307 852 Texas 603 1,801 498 1,411 517 1,545 391 1,125 Utah 200 522 200 565 186 467 170 455 Vermont 80 211 104 276 102 267 106 299 Virginia 307 890 283 866 285 956 296 999 Washington 114 326 107 301 137 391 352 1,026 West Virginia 60 149 63 144 29 79 33 87 Wisconsin 62 196 78 174 14 42 27 97 Total 36,965 $111,556 33,580 $101,124 32,338 $97,527 34,504 $102,653
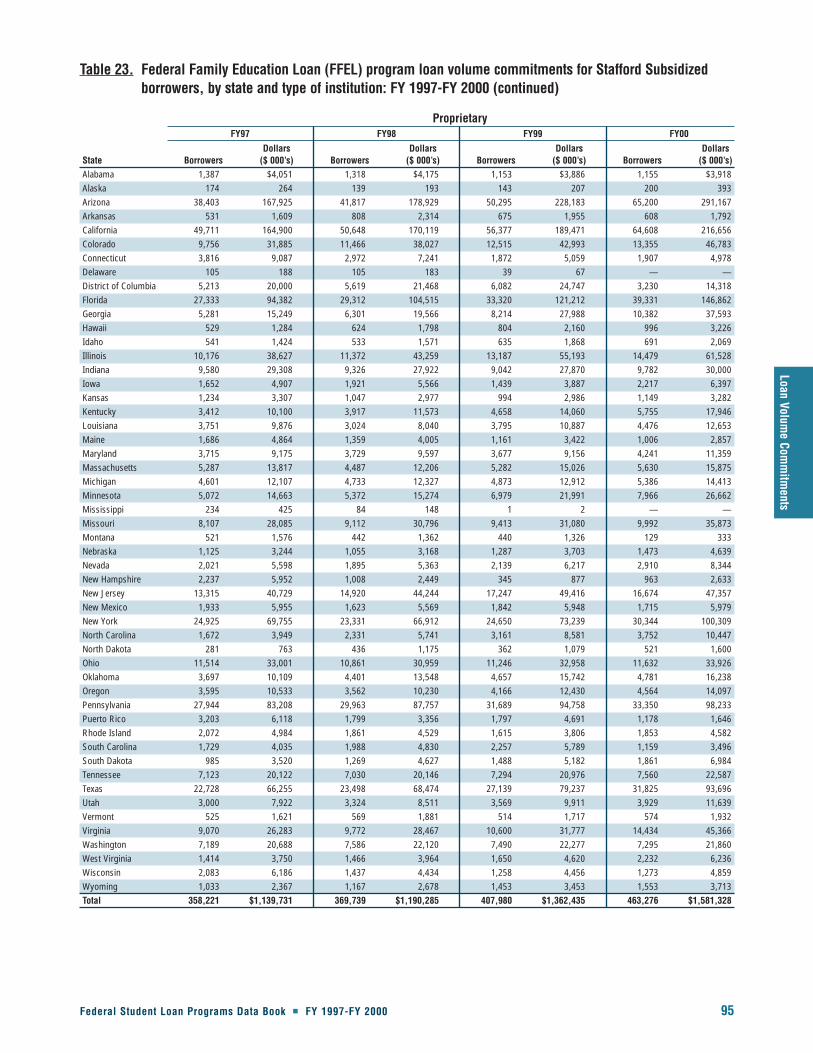
Federal Student Loan Programs Data Book � FY 1997-FY 2000 95
Loan Volume Com
mitm
ents
Table 23. Federal Family Education Loan (FFEL) program loan volume commitments for Stafford Subsidizedborrowers, by state and type of institution: FY 1997-FY 2000 (continued)
ProprietaryFY97 FY98 FY99 FY00
Dollars Dollars Dollars DollarsState Borrowers ($ 000’s) Borrowers ($ 000’s) Borrowers ($ 000’s) Borrowers ($ 000’s)Alabama 1,387 $4,051 1,318 $4,175 1,153 $3,886 1,155 $3,918 Alaska 174 264 139 193 143 207 200 393 Arizona 38,403 167,925 41,817 178,929 50,295 228,183 65,200 291,167 Arkansas 531 1,609 808 2,314 675 1,955 608 1,792 California 49,711 164,900 50,648 170,119 56,377 189,471 64,608 216,656 Colorado 9,756 31,885 11,466 38,027 12,515 42,993 13,355 46,783 Connecticut 3,816 9,087 2,972 7,241 1,872 5,059 1,907 4,978 Delaware 105 188 105 183 39 67 — — District of Columbia 5,213 20,000 5,619 21,468 6,082 24,747 3,230 14,318 Florida 27,333 94,382 29,312 104,515 33,320 121,212 39,331 146,862 Georgia 5,281 15,249 6,301 19,566 8,214 27,988 10,382 37,593 Hawaii 529 1,284 624 1,798 804 2,160 996 3,226 Idaho 541 1,424 533 1,571 635 1,868 691 2,069 Illinois 10,176 38,627 11,372 43,259 13,187 55,193 14,479 61,528 Indiana 9,580 29,308 9,326 27,922 9,042 27,870 9,782 30,000 Iowa 1,652 4,907 1,921 5,566 1,439 3,887 2,217 6,397 Kansas 1,234 3,307 1,047 2,977 994 2,986 1,149 3,282 Kentucky 3,412 10,100 3,917 11,573 4,658 14,060 5,755 17,946 Louisiana 3,751 9,876 3,024 8,040 3,795 10,887 4,476 12,653 Maine 1,686 4,864 1,359 4,005 1,161 3,422 1,006 2,857 Maryland 3,715 9,175 3,729 9,597 3,677 9,156 4,241 11,359 Massachusetts 5,287 13,817 4,487 12,206 5,282 15,026 5,630 15,875 Michigan 4,601 12,107 4,733 12,327 4,873 12,912 5,386 14,413 Minnesota 5,072 14,663 5,372 15,274 6,979 21,991 7,966 26,662 Mississippi 234 425 84 148 1 2 — — Missouri 8,107 28,085 9,112 30,796 9,413 31,080 9,992 35,873 Montana 521 1,576 442 1,362 440 1,326 129 333 Nebraska 1,125 3,244 1,055 3,168 1,287 3,703 1,473 4,639 Nevada 2,021 5,598 1,895 5,363 2,139 6,217 2,910 8,344 New Hampshire 2,237 5,952 1,008 2,449 345 877 963 2,633 New Jersey 13,315 40,729 14,920 44,244 17,247 49,416 16,674 47,357 New Mexico 1,933 5,955 1,623 5,569 1,842 5,948 1,715 5,979 New York 24,925 69,755 23,331 66,912 24,650 73,239 30,344 100,309 North Carolina 1,672 3,949 2,331 5,741 3,161 8,581 3,752 10,447 North Dakota 281 763 436 1,175 362 1,079 521 1,600 Ohio 11,514 33,001 10,861 30,959 11,246 32,958 11,632 33,926 Oklahoma 3,697 10,109 4,401 13,548 4,657 15,742 4,781 16,238 Oregon 3,595 10,533 3,562 10,230 4,166 12,430 4,564 14,097 Pennsylvania 27,944 83,208 29,963 87,757 31,689 94,758 33,350 98,233 Puerto Rico 3,203 6,118 1,799 3,356 1,797 4,691 1,178 1,646 Rhode Island 2,072 4,984 1,861 4,529 1,615 3,806 1,853 4,582 South Carolina 1,729 4,035 1,988 4,830 2,257 5,789 1,159 3,496 South Dakota 985 3,520 1,269 4,627 1,488 5,182 1,861 6,984 Tennessee 7,123 20,122 7,030 20,146 7,294 20,976 7,560 22,587 Texas 22,728 66,255 23,498 68,474 27,139 79,237 31,825 93,696 Utah 3,000 7,922 3,324 8,511 3,569 9,911 3,929 11,639 Vermont 525 1,621 569 1,881 514 1,717 574 1,932 Virginia 9,070 26,283 9,772 28,467 10,600 31,777 14,434 45,366 Washington 7,189 20,688 7,586 22,120 7,490 22,277 7,295 21,860 West Virginia 1,414 3,750 1,466 3,964 1,650 4,620 2,232 6,236 Wisconsin 2,083 6,186 1,437 4,434 1,258 4,456 1,273 4,859 Wyoming 1,033 2,367 1,167 2,678 1,453 3,453 1,553 3,713 Total 358,221 $1,139,731 369,739 $1,190,285 407,980 $1,362,435 463,276 $1,581,328
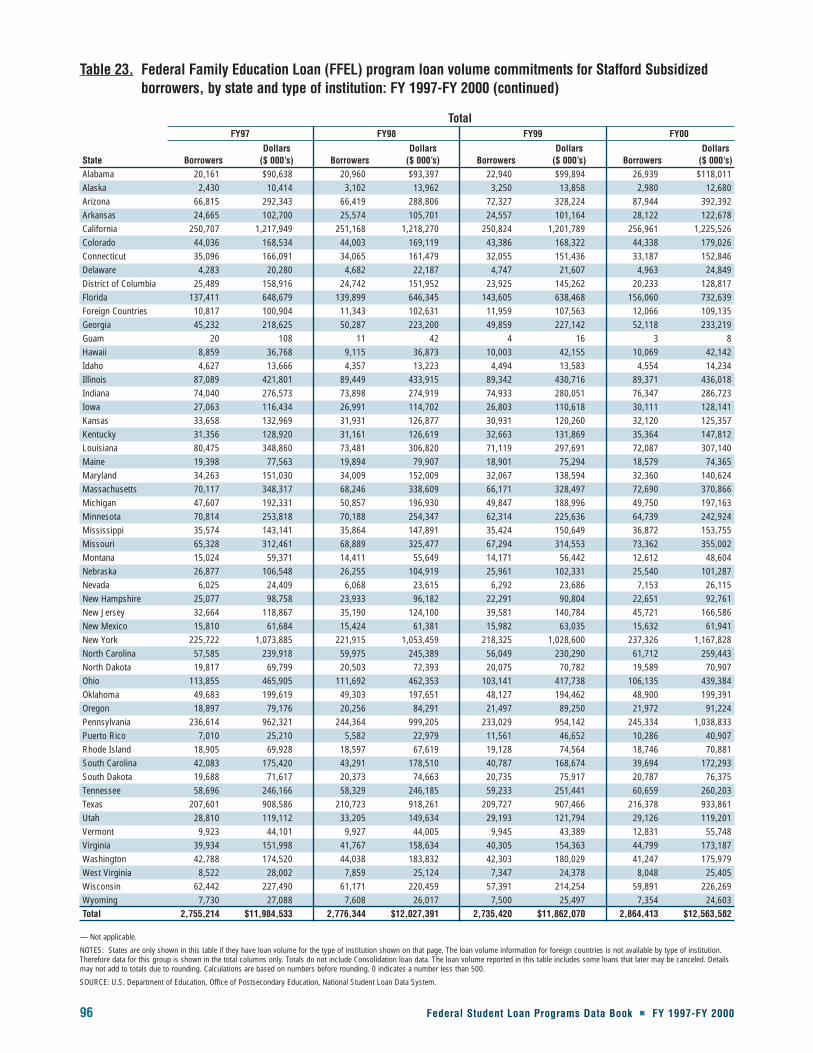
96 Federal Student Loan Programs Data Book � FY 1997-FY 2000
Table 23. Federal Family Education Loan (FFEL) program loan volume commitments for Stafford Subsidizedborrowers, by state and type of institution: FY 1997-FY 2000 (continued)
TotalFY97 FY98 FY99 FY00
Dollars Dollars Dollars DollarsState Borrowers ($ 000’s) Borrowers ($ 000’s) Borrowers ($ 000’s) Borrowers ($ 000’s)Alabama 20,161 $90,638 20,960 $93,397 22,940 $99,894 26,939 $118,011 Alaska 2,430 10,414 3,102 13,962 3,250 13,858 2,980 12,680 Arizona 66,815 292,343 66,419 288,806 72,327 328,224 87,944 392,392 Arkansas 24,665 102,700 25,574 105,701 24,557 101,164 28,122 122,678 California 250,707 1,217,949 251,168 1,218,270 250,824 1,201,789 256,961 1,225,526 Colorado 44,036 168,534 44,003 169,119 43,386 168,322 44,338 179,026 Connecticut 35,096 166,091 34,065 161,479 32,055 151,436 33,187 152,846 Delaware 4,283 20,280 4,682 22,187 4,747 21,607 4,963 24,849 District of Columbia 25,489 158,916 24,742 151,952 23,925 145,262 20,233 128,817 Florida 137,411 648,679 139,899 646,345 143,605 638,468 156,060 732,639 Foreign Countries 10,817 100,904 11,343 102,631 11,959 107,563 12,066 109,135 Georgia 45,232 218,625 50,287 223,200 49,859 227,142 52,118 233,219 Guam 20 108 11 42 4 16 3 8 Hawaii 8,859 36,768 9,115 36,873 10,003 42,155 10,069 42,142 Idaho 4,627 13,666 4,357 13,223 4,494 13,583 4,554 14,234 Illinois 87,089 421,801 89,449 433,915 89,342 430,716 89,371 436,018 Indiana 74,040 276,573 73,898 274,919 74,933 280,051 76,347 286,723 Iowa 27,063 116,434 26,991 114,702 26,803 110,618 30,111 128,141 Kansas 33,658 132,969 31,931 126,877 30,931 120,260 32,120 125,357 Kentucky 31,356 128,920 31,161 126,619 32,663 131,869 35,364 147,812 Louisiana 80,475 348,860 73,481 306,820 71,119 297,691 72,087 307,140 Maine 19,398 77,563 19,894 79,907 18,901 75,294 18,579 74,365 Maryland 34,263 151,030 34,009 152,009 32,067 138,594 32,360 140,624 Massachusetts 70,117 348,317 68,246 338,609 66,171 328,497 72,690 370,866 Michigan 47,607 192,331 50,857 196,930 49,847 188,996 49,750 197,163 Minnesota 70,814 253,818 70,188 254,347 62,314 225,636 64,739 242,924 Mississippi 35,574 143,141 35,864 147,891 35,424 150,649 36,872 153,755 Missouri 65,328 312,461 68,889 325,477 67,294 314,553 73,362 355,002 Montana 15,024 59,371 14,411 55,649 14,171 56,442 12,612 48,604 Nebraska 26,877 106,548 26,255 104,919 25,961 102,331 25,540 101,287 Nevada 6,025 24,409 6,068 23,615 6,292 23,686 7,153 26,115 New Hampshire 25,077 98,758 23,933 96,182 22,291 90,804 22,651 92,761 New Jersey 32,664 118,867 35,190 124,100 39,581 140,784 45,721 166,586 New Mexico 15,810 61,684 15,424 61,381 15,982 63,035 15,632 61,941 New York 225,722 1,073,885 221,915 1,053,459 218,325 1,028,600 237,326 1,167,828 North Carolina 57,585 239,918 59,975 245,389 56,049 230,290 61,712 259,443 North Dakota 19,817 69,799 20,503 72,393 20,075 70,782 19,589 70,907 Ohio 113,855 465,905 111,692 462,353 103,141 417,738 106,135 439,384 Oklahoma 49,683 199,619 49,303 197,651 48,127 194,462 48,900 199,391 Oregon 18,897 79,176 20,256 84,291 21,497 89,250 21,972 91,224 Pennsylvania 236,614 962,321 244,364 999,205 233,029 954,142 245,334 1,038,833 Puerto Rico 7,010 25,210 5,582 22,979 11,561 46,652 10,286 40,907 Rhode Island 18,905 69,928 18,597 67,619 19,128 74,564 18,746 70,881 South Carolina 42,083 175,420 43,291 178,510 40,787 168,674 39,694 172,293 South Dakota 19,688 71,617 20,373 74,663 20,735 75,917 20,787 76,375 Tennessee 58,696 246,166 58,329 246,185 59,233 251,441 60,659 260,203 Texas 207,601 908,586 210,723 918,261 209,727 907,466 216,378 933,861 Utah 28,810 119,112 33,205 149,634 29,193 121,794 29,126 119,201 Vermont 9,923 44,101 9,927 44,005 9,945 43,389 12,831 55,748 Virginia 39,934 151,998 41,767 158,634 40,305 154,363 44,799 173,187 Washington 42,788 174,520 44,038 183,832 42,303 180,029 41,247 175,979 West Virginia 8,522 28,002 7,859 25,124 7,347 24,378 8,048 25,405 Wisconsin 62,442 227,490 61,171 220,459 57,391 214,254 59,891 226,269 Wyoming 7,730 27,088 7,608 26,017 7,500 25,497 7,354 24,603 Total 2,755,214 $11,984,533 2,776,344 $12,027,391 2,735,420 $11,862,070 2,864,413 $12,563,582
— Not applicable.
NOTES: States are only shown in this table if they have loan volume for the type of institution shown on that page. The loan volume information for foreign countries is not available by type of institution.Therefore data for this group is shown in the total columns only. Totals do not include Consolidation loan data. The loan volume reported in this table includes some loans that later may be canceled. Detailsmay not add to totals due to rounding. Calculations are based on numbers before rounding. 0 indicates a number less than 500.
SOURCE: U.S. Department of Education, Office of Postsecondary Education, National Student Loan Data System.
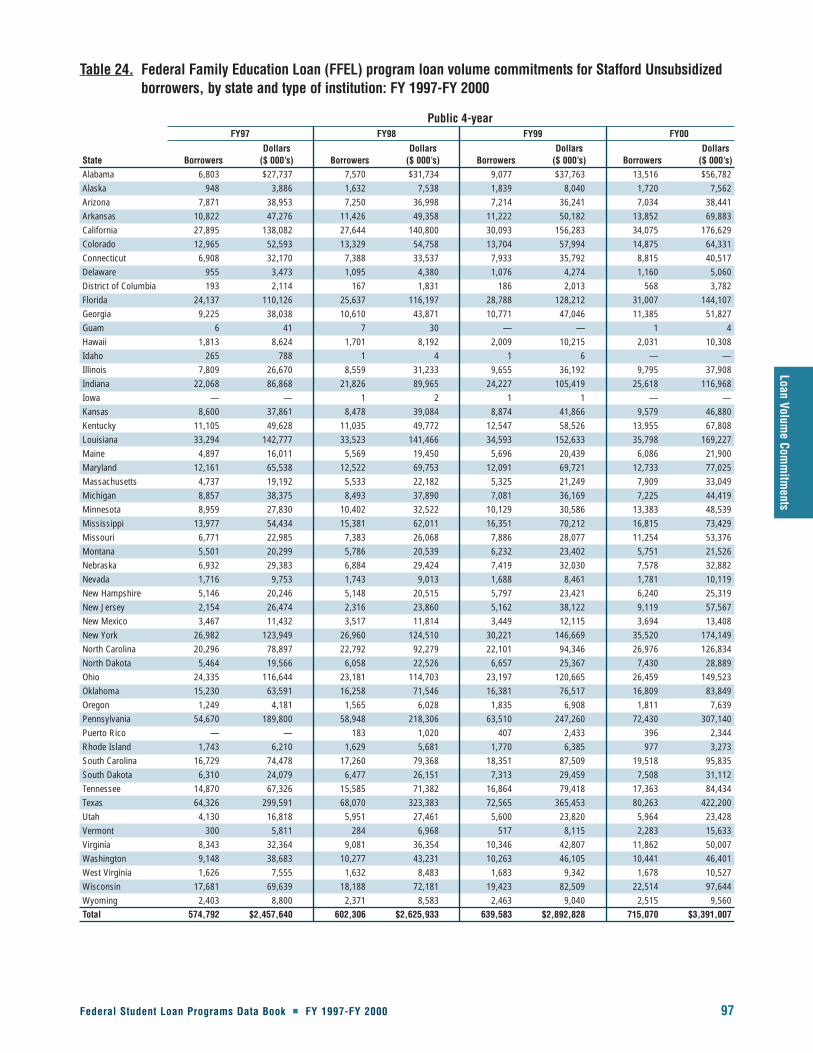
Federal Student Loan Programs Data Book � FY 1997-FY 2000 97
Loan Volume Com
mitm
ents
Table 24. Federal Family Education Loan (FFEL) program loan volume commitments for Stafford Unsubsidizedborrowers, by state and type of institution: FY 1997-FY 2000
Public 4-yearFY97 FY98 FY99 FY00
Dollars Dollars Dollars DollarsState Borrowers ($ 000’s) Borrowers ($ 000’s) Borrowers ($ 000’s) Borrowers ($ 000’s)Alabama 6,803 $27,737 7,570 $31,734 9,077 $37,763 13,516 $56,782 Alaska 948 3,886 1,632 7,538 1,839 8,040 1,720 7,562 Arizona 7,871 38,953 7,250 36,998 7,214 36,241 7,034 38,441 Arkansas 10,822 47,276 11,426 49,358 11,222 50,182 13,852 69,883 California 27,895 138,082 27,644 140,800 30,093 156,283 34,075 176,629 Colorado 12,965 52,593 13,329 54,758 13,704 57,994 14,875 64,331 Connecticut 6,908 32,170 7,388 33,537 7,933 35,792 8,815 40,517 Delaware 955 3,473 1,095 4,380 1,076 4,274 1,160 5,060 District of Columbia 193 2,114 167 1,831 186 2,013 568 3,782 Florida 24,137 110,126 25,637 116,197 28,788 128,212 31,007 144,107 Georgia 9,225 38,038 10,610 43,871 10,771 47,046 11,385 51,827 Guam 6 41 7 30 — — 1 4 Hawaii 1,813 8,624 1,701 8,192 2,009 10,215 2,031 10,308 Idaho 265 788 1 4 1 6 — — Illinois 7,809 26,670 8,559 31,233 9,655 36,192 9,795 37,908 Indiana 22,068 86,868 21,826 89,965 24,227 105,419 25,618 116,968 Iowa — — 1 2 1 1 — — Kansas 8,600 37,861 8,478 39,084 8,874 41,866 9,579 46,880 Kentucky 11,105 49,628 11,035 49,772 12,547 58,526 13,955 67,808 Louisiana 33,294 142,777 33,523 141,466 34,593 152,633 35,798 169,227 Maine 4,897 16,011 5,569 19,450 5,696 20,439 6,086 21,900 Maryland 12,161 65,538 12,522 69,753 12,091 69,721 12,733 77,025 Massachusetts 4,737 19,192 5,533 22,182 5,325 21,249 7,909 33,049 Michigan 8,857 38,375 8,493 37,890 7,081 36,169 7,225 44,419 Minnesota 8,959 27,830 10,402 32,522 10,129 30,586 13,383 48,539 Mississippi 13,977 54,434 15,381 62,011 16,351 70,212 16,815 73,429 Missouri 6,771 22,985 7,383 26,068 7,886 28,077 11,254 53,376 Montana 5,501 20,299 5,786 20,539 6,232 23,402 5,751 21,526 Nebraska 6,932 29,383 6,884 29,424 7,419 32,030 7,578 32,882 Nevada 1,716 9,753 1,743 9,013 1,688 8,461 1,781 10,119 New Hampshire 5,146 20,246 5,148 20,515 5,797 23,421 6,240 25,319 New Jersey 2,154 26,474 2,316 23,860 5,162 38,122 9,119 57,567 New Mexico 3,467 11,432 3,517 11,814 3,449 12,115 3,694 13,408 New York 26,982 123,949 26,960 124,510 30,221 146,669 35,520 174,149 North Carolina 20,296 78,897 22,792 92,279 22,101 94,346 26,976 126,834 North Dakota 5,464 19,566 6,058 22,526 6,657 25,367 7,430 28,889 Ohio 24,335 116,644 23,181 114,703 23,197 120,665 26,459 149,523 Oklahoma 15,230 63,591 16,258 71,546 16,381 76,517 16,809 83,849 Oregon 1,249 4,181 1,565 6,028 1,835 6,908 1,811 7,639 Pennsylvania 54,670 189,800 58,948 218,306 63,510 247,260 72,430 307,140 Puerto Rico — — 183 1,020 407 2,433 396 2,344 Rhode Island 1,743 6,210 1,629 5,681 1,770 6,385 977 3,273 South Carolina 16,729 74,478 17,260 79,368 18,351 87,509 19,518 95,835 South Dakota 6,310 24,079 6,477 26,151 7,313 29,459 7,508 31,112 Tennessee 14,870 67,326 15,585 71,382 16,864 79,418 17,363 84,434 Texas 64,326 299,591 68,070 323,383 72,565 365,453 80,263 422,200 Utah 4,130 16,818 5,951 27,461 5,600 23,820 5,964 23,428 Vermont 300 5,811 284 6,968 517 8,115 2,283 15,633 Virginia 8,343 32,364 9,081 36,354 10,346 42,807 11,862 50,007 Washington 9,148 38,683 10,277 43,231 10,263 46,105 10,441 46,401 West Virginia 1,626 7,555 1,632 8,483 1,683 9,342 1,678 10,527 Wisconsin 17,681 69,639 18,188 72,181 19,423 82,509 22,514 97,644 Wyoming 2,403 8,800 2,371 8,583 2,463 9,040 2,515 9,560 Total 574,792 $2,457,640 602,306 $2,625,933 639,583 $2,892,828 715,070 $3,391,007
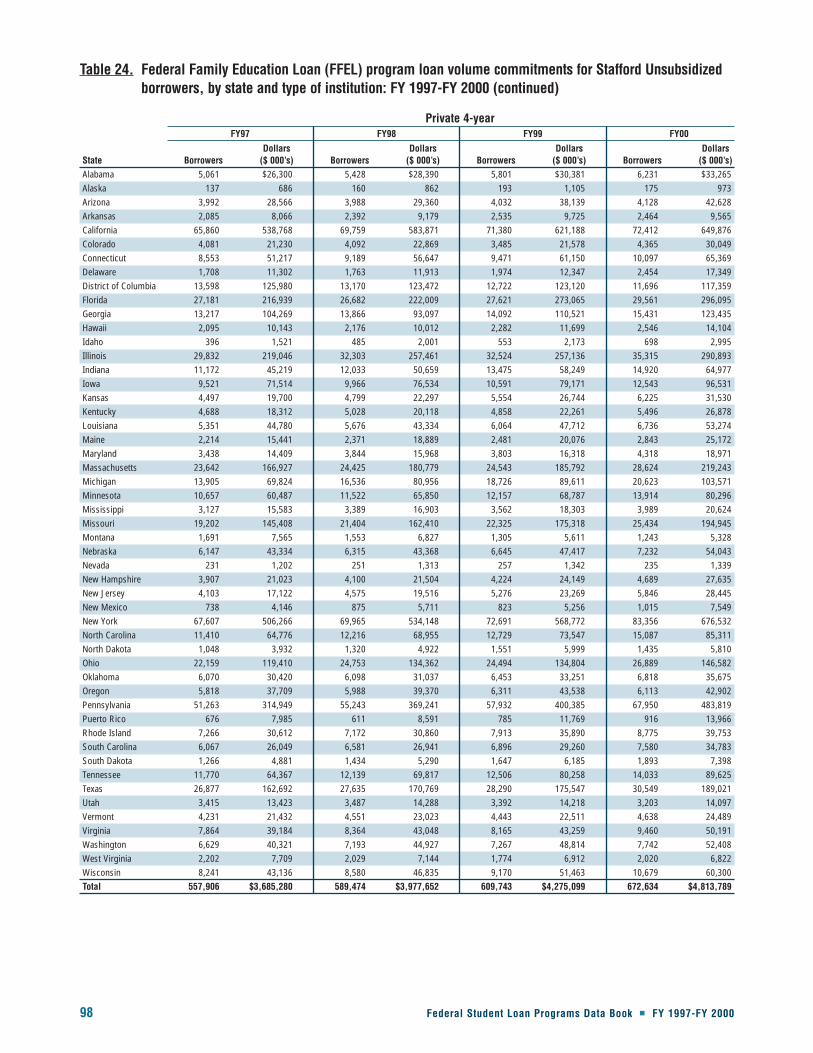
98 Federal Student Loan Programs Data Book � FY 1997-FY 2000
Table 24. Federal Family Education Loan (FFEL) program loan volume commitments for Stafford Unsubsidizedborrowers, by state and type of institution: FY 1997-FY 2000 (continued)
Private 4-yearFY97 FY98 FY99 FY00
Dollars Dollars Dollars DollarsState Borrowers ($ 000’s) Borrowers ($ 000’s) Borrowers ($ 000’s) Borrowers ($ 000’s)Alabama 5,061 $26,300 5,428 $28,390 5,801 $30,381 6,231 $33,265 Alaska 137 686 160 862 193 1,105 175 973 Arizona 3,992 28,566 3,988 29,360 4,032 38,139 4,128 42,628 Arkansas 2,085 8,066 2,392 9,179 2,535 9,725 2,464 9,565 California 65,860 538,768 69,759 583,871 71,380 621,188 72,412 649,876 Colorado 4,081 21,230 4,092 22,869 3,485 21,578 4,365 30,049 Connecticut 8,553 51,217 9,189 56,647 9,471 61,150 10,097 65,369 Delaware 1,708 11,302 1,763 11,913 1,974 12,347 2,454 17,349 District of Columbia 13,598 125,980 13,170 123,472 12,722 123,120 11,696 117,359 Florida 27,181 216,939 26,682 222,009 27,621 273,065 29,561 296,095 Georgia 13,217 104,269 13,866 93,097 14,092 110,521 15,431 123,435 Hawaii 2,095 10,143 2,176 10,012 2,282 11,699 2,546 14,104 Idaho 396 1,521 485 2,001 553 2,173 698 2,995 Illinois 29,832 219,046 32,303 257,461 32,524 257,136 35,315 290,893 Indiana 11,172 45,219 12,033 50,659 13,475 58,249 14,920 64,977 Iowa 9,521 71,514 9,966 76,534 10,591 79,171 12,543 96,531 Kansas 4,497 19,700 4,799 22,297 5,554 26,744 6,225 31,530 Kentucky 4,688 18,312 5,028 20,118 4,858 22,261 5,496 26,878 Louisiana 5,351 44,780 5,676 43,334 6,064 47,712 6,736 53,274 Maine 2,214 15,441 2,371 18,889 2,481 20,076 2,843 25,172 Maryland 3,438 14,409 3,844 15,968 3,803 16,318 4,318 18,971 Massachusetts 23,642 166,927 24,425 180,779 24,543 185,792 28,624 219,243 Michigan 13,905 69,824 16,536 80,956 18,726 89,611 20,623 103,571 Minnesota 10,657 60,487 11,522 65,850 12,157 68,787 13,914 80,296 Mississippi 3,127 15,583 3,389 16,903 3,562 18,303 3,989 20,624 Missouri 19,202 145,408 21,404 162,410 22,325 175,318 25,434 194,945 Montana 1,691 7,565 1,553 6,827 1,305 5,611 1,243 5,328 Nebraska 6,147 43,334 6,315 43,368 6,645 47,417 7,232 54,043 Nevada 231 1,202 251 1,313 257 1,342 235 1,339 New Hampshire 3,907 21,023 4,100 21,504 4,224 24,149 4,689 27,635 New Jersey 4,103 17,122 4,575 19,516 5,276 23,269 5,846 28,445 New Mexico 738 4,146 875 5,711 823 5,256 1,015 7,549 New York 67,607 506,266 69,965 534,148 72,691 568,772 83,356 676,532 North Carolina 11,410 64,776 12,216 68,955 12,729 73,547 15,087 85,311 North Dakota 1,048 3,932 1,320 4,922 1,551 5,999 1,435 5,810 Ohio 22,159 119,410 24,753 134,362 24,494 134,804 26,889 146,582 Oklahoma 6,070 30,420 6,098 31,037 6,453 33,251 6,818 35,675 Oregon 5,818 37,709 5,988 39,370 6,311 43,538 6,113 42,902 Pennsylvania 51,263 314,949 55,243 369,241 57,932 400,385 67,950 483,819 Puerto Rico 676 7,985 611 8,591 785 11,769 916 13,966 Rhode Island 7,266 30,612 7,172 30,860 7,913 35,890 8,775 39,753 South Carolina 6,067 26,049 6,581 26,941 6,896 29,260 7,580 34,783 South Dakota 1,266 4,881 1,434 5,290 1,647 6,185 1,893 7,398 Tennessee 11,770 64,367 12,139 69,817 12,506 80,258 14,033 89,625 Texas 26,877 162,692 27,635 170,769 28,290 175,547 30,549 189,021 Utah 3,415 13,423 3,487 14,288 3,392 14,218 3,203 14,097 Vermont 4,231 21,432 4,551 23,023 4,443 22,511 4,638 24,489 Virginia 7,864 39,184 8,364 43,048 8,165 43,259 9,460 50,191 Washington 6,629 40,321 7,193 44,927 7,267 48,814 7,742 52,408 West Virginia 2,202 7,709 2,029 7,144 1,774 6,912 2,020 6,822 Wisconsin 8,241 43,136 8,580 46,835 9,170 51,463 10,679 60,300 Total 557,906 $3,685,280 589,474 $3,977,652 609,743 $4,275,099 672,634 $4,813,789
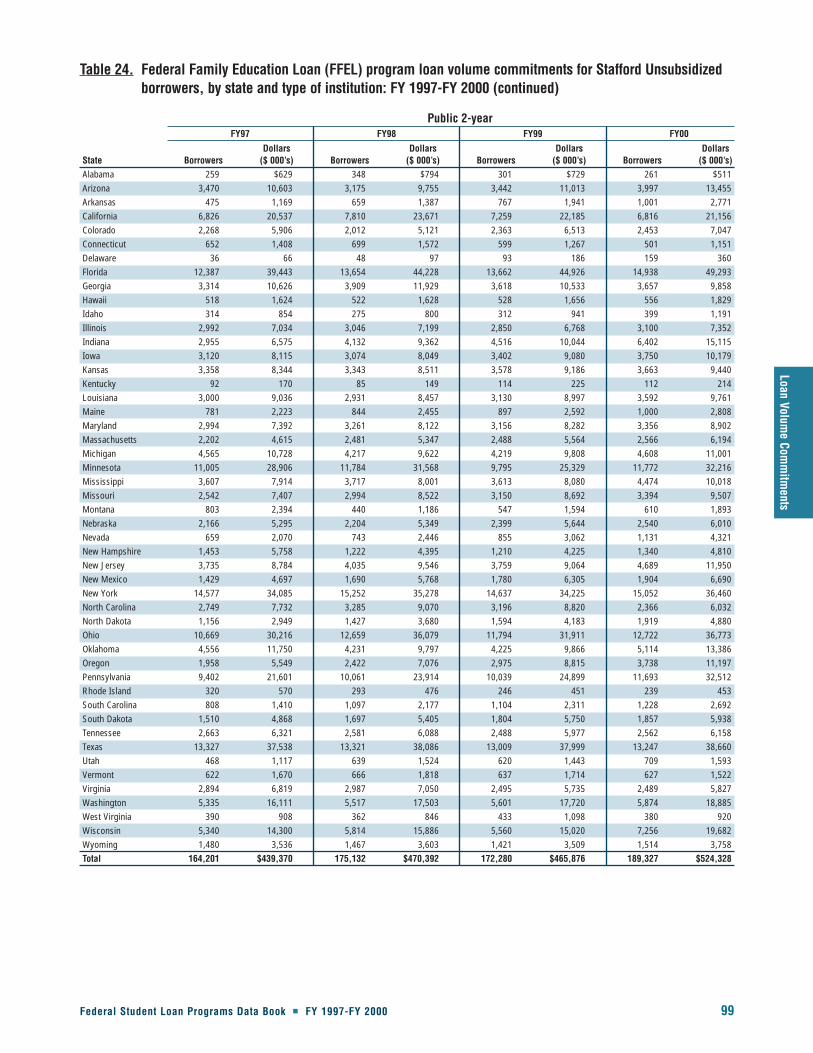
Federal Student Loan Programs Data Book � FY 1997-FY 2000 99
Loan Volume Com
mitm
ents
Table 24. Federal Family Education Loan (FFEL) program loan volume commitments for Stafford Unsubsidizedborrowers, by state and type of institution: FY 1997-FY 2000 (continued)
Public 2-yearFY97 FY98 FY99 FY00
Dollars Dollars Dollars DollarsState Borrowers ($ 000’s) Borrowers ($ 000’s) Borrowers ($ 000’s) Borrowers ($ 000’s)Alabama 259 $629 348 $794 301 $729 261 $511 Arizona 3,470 10,603 3,175 9,755 3,442 11,013 3,997 13,455 Arkansas 475 1,169 659 1,387 767 1,941 1,001 2,771 California 6,826 20,537 7,810 23,671 7,259 22,185 6,816 21,156 Colorado 2,268 5,906 2,012 5,121 2,363 6,513 2,453 7,047 Connecticut 652 1,408 699 1,572 599 1,267 501 1,151 Delaware 36 66 48 97 93 186 159 360 Florida 12,387 39,443 13,654 44,228 13,662 44,926 14,938 49,293 Georgia 3,314 10,626 3,909 11,929 3,618 10,533 3,657 9,858 Hawaii 518 1,624 522 1,628 528 1,656 556 1,829 Idaho 314 854 275 800 312 941 399 1,191 Illinois 2,992 7,034 3,046 7,199 2,850 6,768 3,100 7,352 Indiana 2,955 6,575 4,132 9,362 4,516 10,044 6,402 15,115 Iowa 3,120 8,115 3,074 8,049 3,402 9,080 3,750 10,179 Kansas 3,358 8,344 3,343 8,511 3,578 9,186 3,663 9,440 Kentucky 92 170 85 149 114 225 112 214 Louisiana 3,000 9,036 2,931 8,457 3,130 8,997 3,592 9,761 Maine 781 2,223 844 2,455 897 2,592 1,000 2,808 Maryland 2,994 7,392 3,261 8,122 3,156 8,282 3,356 8,902 Massachusetts 2,202 4,615 2,481 5,347 2,488 5,564 2,566 6,194 Michigan 4,565 10,728 4,217 9,622 4,219 9,808 4,608 11,001 Minnesota 11,005 28,906 11,784 31,568 9,795 25,329 11,772 32,216 Mississippi 3,607 7,914 3,717 8,001 3,613 8,080 4,474 10,018 Missouri 2,542 7,407 2,994 8,522 3,150 8,692 3,394 9,507 Montana 803 2,394 440 1,186 547 1,594 610 1,893 Nebraska 2,166 5,295 2,204 5,349 2,399 5,644 2,540 6,010 Nevada 659 2,070 743 2,446 855 3,062 1,131 4,321 New Hampshire 1,453 5,758 1,222 4,395 1,210 4,225 1,340 4,810 New Jersey 3,735 8,784 4,035 9,546 3,759 9,064 4,689 11,950 New Mexico 1,429 4,697 1,690 5,768 1,780 6,305 1,904 6,690 New York 14,577 34,085 15,252 35,278 14,637 34,225 15,052 36,460 North Carolina 2,749 7,732 3,285 9,070 3,196 8,820 2,366 6,032 North Dakota 1,156 2,949 1,427 3,680 1,594 4,183 1,919 4,880 Ohio 10,669 30,216 12,659 36,079 11,794 31,911 12,722 36,773 Oklahoma 4,556 11,750 4,231 9,797 4,225 9,866 5,114 13,386 Oregon 1,958 5,549 2,422 7,076 2,975 8,815 3,738 11,197 Pennsylvania 9,402 21,601 10,061 23,914 10,039 24,899 11,693 32,512 Rhode Island 320 570 293 476 246 451 239 453 South Carolina 808 1,410 1,097 2,177 1,104 2,311 1,228 2,692 South Dakota 1,510 4,868 1,697 5,405 1,804 5,750 1,857 5,938 Tennessee 2,663 6,321 2,581 6,088 2,488 5,977 2,562 6,158 Texas 13,327 37,538 13,321 38,086 13,009 37,999 13,247 38,660 Utah 468 1,117 639 1,524 620 1,443 709 1,593 Vermont 622 1,670 666 1,818 637 1,714 627 1,522 Virginia 2,894 6,819 2,987 7,050 2,495 5,735 2,489 5,827 Washington 5,335 16,111 5,517 17,503 5,601 17,720 5,874 18,885 West Virginia 390 908 362 846 433 1,098 380 920 Wisconsin 5,340 14,300 5,814 15,886 5,560 15,020 7,256 19,682 Wyoming 1,480 3,536 1,467 3,603 1,421 3,509 1,514 3,758 Total 164,201 $439,370 175,132 $470,392 172,280 $465,876 189,327 $524,328
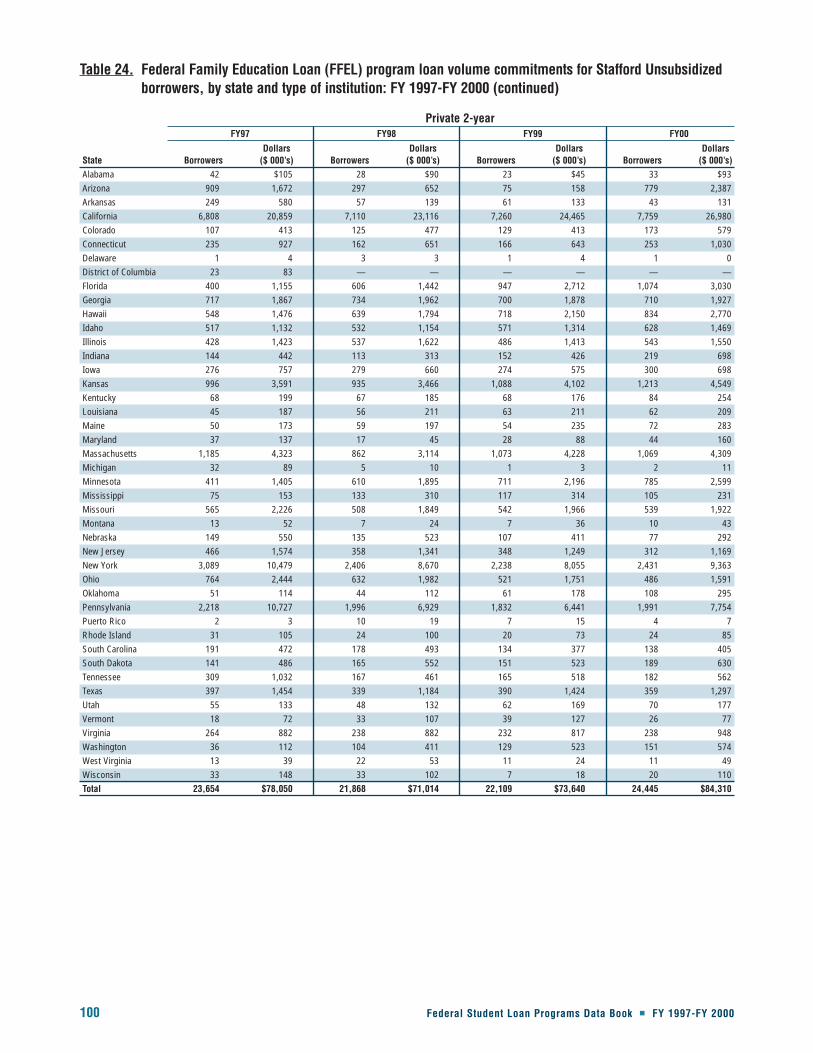
100 Federal Student Loan Programs Data Book � FY 1997-FY 2000
Table 24. Federal Family Education Loan (FFEL) program loan volume commitments for Stafford Unsubsidizedborrowers, by state and type of institution: FY 1997-FY 2000 (continued)
Private 2-yearFY97 FY98 FY99 FY00
Dollars Dollars Dollars DollarsState Borrowers ($ 000’s) Borrowers ($ 000’s) Borrowers ($ 000’s) Borrowers ($ 000’s)Alabama 42 $105 28 $90 23 $45 33 $93 Arizona 909 1,672 297 652 75 158 779 2,387 Arkansas 249 580 57 139 61 133 43 131 California 6,808 20,859 7,110 23,116 7,260 24,465 7,759 26,980 Colorado 107 413 125 477 129 413 173 579 Connecticut 235 927 162 651 166 643 253 1,030 Delaware 1 4 3 3 1 4 1 0 District of Columbia 23 83 — — — — — — Florida 400 1,155 606 1,442 947 2,712 1,074 3,030 Georgia 717 1,867 734 1,962 700 1,878 710 1,927 Hawaii 548 1,476 639 1,794 718 2,150 834 2,770 Idaho 517 1,132 532 1,154 571 1,314 628 1,469 Illinois 428 1,423 537 1,622 486 1,413 543 1,550 Indiana 144 442 113 313 152 426 219 698 Iowa 276 757 279 660 274 575 300 698 Kansas 996 3,591 935 3,466 1,088 4,102 1,213 4,549 Kentucky 68 199 67 185 68 176 84 254 Louisiana 45 187 56 211 63 211 62 209 Maine 50 173 59 197 54 235 72 283 Maryland 37 137 17 45 28 88 44 160 Massachusetts 1,185 4,323 862 3,114 1,073 4,228 1,069 4,309 Michigan 32 89 5 10 1 3 2 11 Minnesota 411 1,405 610 1,895 711 2,196 785 2,599 Mississippi 75 153 133 310 117 314 105 231 Missouri 565 2,226 508 1,849 542 1,966 539 1,922 Montana 13 52 7 24 7 36 10 43 Nebraska 149 550 135 523 107 411 77 292 New Jersey 466 1,574 358 1,341 348 1,249 312 1,169 New York 3,089 10,479 2,406 8,670 2,238 8,055 2,431 9,363 Ohio 764 2,444 632 1,982 521 1,751 486 1,591 Oklahoma 51 114 44 112 61 178 108 295 Pennsylvania 2,218 10,727 1,996 6,929 1,832 6,441 1,991 7,754 Puerto Rico 2 3 10 19 7 15 4 7 Rhode Island 31 105 24 100 20 73 24 85 South Carolina 191 472 178 493 134 377 138 405 South Dakota 141 486 165 552 151 523 189 630 Tennessee 309 1,032 167 461 165 518 182 562 Texas 397 1,454 339 1,184 390 1,424 359 1,297 Utah 55 133 48 132 62 169 70 177 Vermont 18 72 33 107 39 127 26 77 Virginia 264 882 238 882 232 817 238 948 Washington 36 112 104 411 129 523 151 574 West Virginia 13 39 22 53 11 24 11 49 Wisconsin 33 148 33 102 7 18 20 110 Total 23,654 $78,050 21,868 $71,014 22,109 $73,640 24,445 $84,310
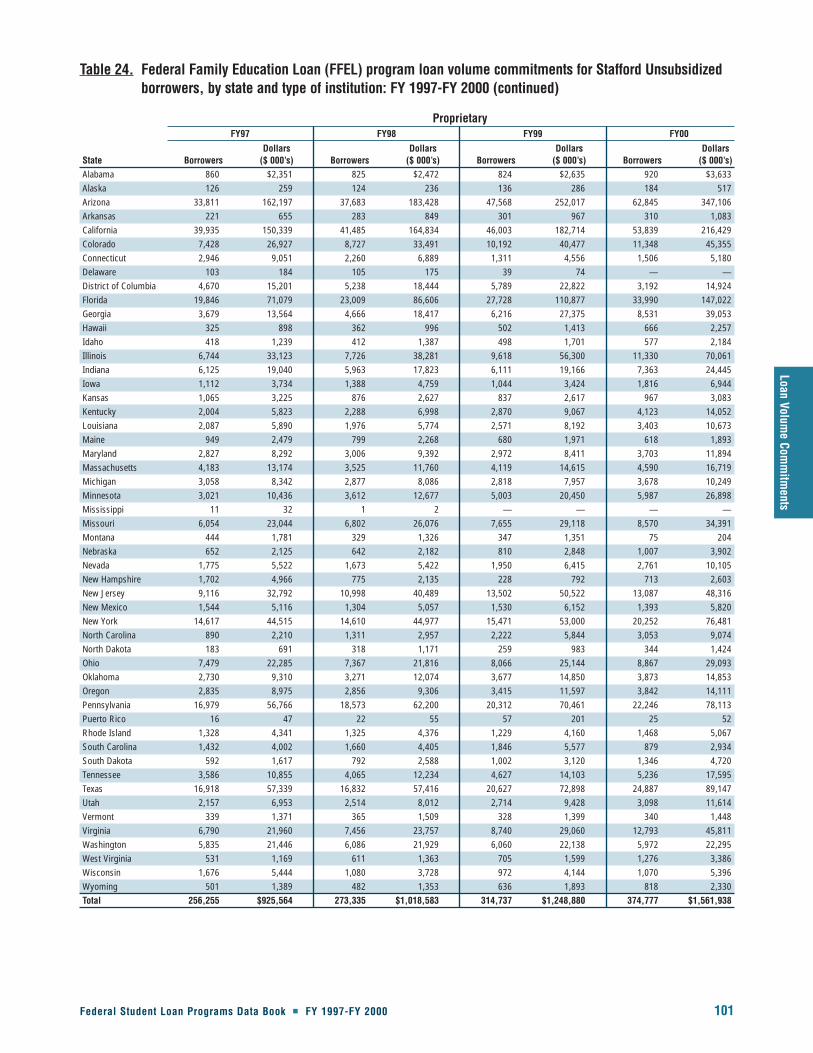
Federal Student Loan Programs Data Book � FY 1997-FY 2000 101
Loan Volume Com
mitm
ents
Table 24. Federal Family Education Loan (FFEL) program loan volume commitments for Stafford Unsubsidizedborrowers, by state and type of institution: FY 1997-FY 2000 (continued)
ProprietaryFY97 FY98 FY99 FY00
Dollars Dollars Dollars DollarsState Borrowers ($ 000’s) Borrowers ($ 000’s) Borrowers ($ 000’s) Borrowers ($ 000’s)Alabama 860 $2,351 825 $2,472 824 $2,635 920 $3,633 Alaska 126 259 124 236 136 286 184 517 Arizona 33,811 162,197 37,683 183,428 47,568 252,017 62,845 347,106 Arkansas 221 655 283 849 301 967 310 1,083 California 39,935 150,339 41,485 164,834 46,003 182,714 53,839 216,429 Colorado 7,428 26,927 8,727 33,491 10,192 40,477 11,348 45,355 Connecticut 2,946 9,051 2,260 6,889 1,311 4,556 1,506 5,180 Delaware 103 184 105 175 39 74 — — District of Columbia 4,670 15,201 5,238 18,444 5,789 22,822 3,192 14,924 Florida 19,846 71,079 23,009 86,606 27,728 110,877 33,990 147,022 Georgia 3,679 13,564 4,666 18,417 6,216 27,375 8,531 39,053 Hawaii 325 898 362 996 502 1,413 666 2,257 Idaho 418 1,239 412 1,387 498 1,701 577 2,184 Illinois 6,744 33,123 7,726 38,281 9,618 56,300 11,330 70,061 Indiana 6,125 19,040 5,963 17,823 6,111 19,166 7,363 24,445 Iowa 1,112 3,734 1,388 4,759 1,044 3,424 1,816 6,944 Kansas 1,065 3,225 876 2,627 837 2,617 967 3,083 Kentucky 2,004 5,823 2,288 6,998 2,870 9,067 4,123 14,052 Louisiana 2,087 5,890 1,976 5,774 2,571 8,192 3,403 10,673 Maine 949 2,479 799 2,268 680 1,971 618 1,893 Maryland 2,827 8,292 3,006 9,392 2,972 8,411 3,703 11,894 Massachusetts 4,183 13,174 3,525 11,760 4,119 14,615 4,590 16,719 Michigan 3,058 8,342 2,877 8,086 2,818 7,957 3,678 10,249 Minnesota 3,021 10,436 3,612 12,677 5,003 20,450 5,987 26,898 Mississippi 11 32 1 2 — — — — Missouri 6,054 23,044 6,802 26,076 7,655 29,118 8,570 34,391 Montana 444 1,781 329 1,326 347 1,351 75 204 Nebraska 652 2,125 642 2,182 810 2,848 1,007 3,902 Nevada 1,775 5,522 1,673 5,422 1,950 6,415 2,761 10,105 New Hampshire 1,702 4,966 775 2,135 228 792 713 2,603 New Jersey 9,116 32,792 10,998 40,489 13,502 50,522 13,087 48,316 New Mexico 1,544 5,116 1,304 5,057 1,530 6,152 1,393 5,820 New York 14,617 44,515 14,610 44,977 15,471 53,000 20,252 76,481 North Carolina 890 2,210 1,311 2,957 2,222 5,844 3,053 9,074 North Dakota 183 691 318 1,171 259 983 344 1,424 Ohio 7,479 22,285 7,367 21,816 8,066 25,144 8,867 29,093 Oklahoma 2,730 9,310 3,271 12,074 3,677 14,850 3,873 14,853 Oregon 2,835 8,975 2,856 9,306 3,415 11,597 3,842 14,111 Pennsylvania 16,979 56,766 18,573 62,200 20,312 70,461 22,246 78,113 Puerto Rico 16 47 22 55 57 201 25 52 Rhode Island 1,328 4,341 1,325 4,376 1,229 4,160 1,468 5,067 South Carolina 1,432 4,002 1,660 4,405 1,846 5,577 879 2,934 South Dakota 592 1,617 792 2,588 1,002 3,120 1,346 4,720 Tennessee 3,586 10,855 4,065 12,234 4,627 14,103 5,236 17,595 Texas 16,918 57,339 16,832 57,416 20,627 72,898 24,887 89,147 Utah 2,157 6,953 2,514 8,012 2,714 9,428 3,098 11,614 Vermont 339 1,371 365 1,509 328 1,399 340 1,448 Virginia 6,790 21,960 7,456 23,757 8,740 29,060 12,793 45,811 Washington 5,835 21,446 6,086 21,929 6,060 22,138 5,972 22,295 West Virginia 531 1,169 611 1,363 705 1,599 1,276 3,386 Wisconsin 1,676 5,444 1,080 3,728 972 4,144 1,070 5,396 Wyoming 501 1,389 482 1,353 636 1,893 818 2,330 Total 256,255 $925,564 273,335 $1,018,583 314,737 $1,248,880 374,777 $1,561,938
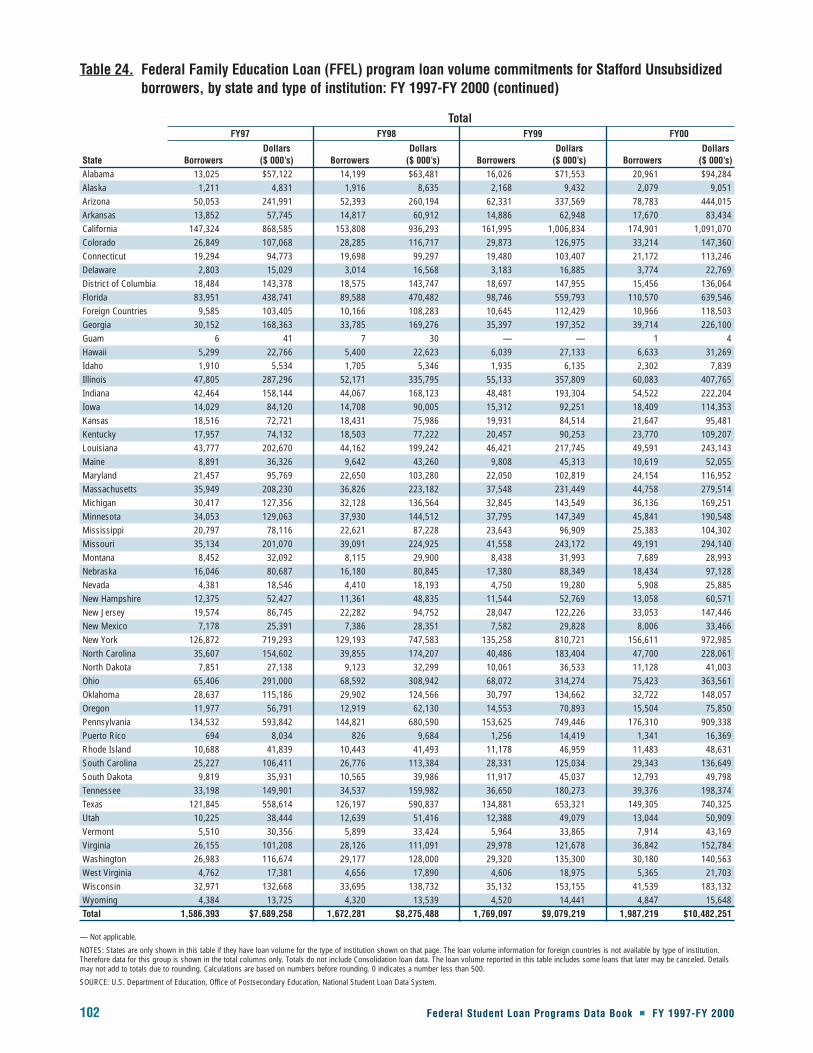
102 Federal Student Loan Programs Data Book � FY 1997-FY 2000
Table 24. Federal Family Education Loan (FFEL) program loan volume commitments for Stafford Unsubsidizedborrowers, by state and type of institution: FY 1997-FY 2000 (continued)
TotalFY97 FY98 FY99 FY00
Dollars Dollars Dollars DollarsState Borrowers ($ 000’s) Borrowers ($ 000’s) Borrowers ($ 000’s) Borrowers ($ 000’s)Alabama 13,025 $57,122 14,199 $63,481 16,026 $71,553 20,961 $94,284 Alaska 1,211 4,831 1,916 8,635 2,168 9,432 2,079 9,051 Arizona 50,053 241,991 52,393 260,194 62,331 337,569 78,783 444,015 Arkansas 13,852 57,745 14,817 60,912 14,886 62,948 17,670 83,434 California 147,324 868,585 153,808 936,293 161,995 1,006,834 174,901 1,091,070 Colorado 26,849 107,068 28,285 116,717 29,873 126,975 33,214 147,360 Connecticut 19,294 94,773 19,698 99,297 19,480 103,407 21,172 113,246 Delaware 2,803 15,029 3,014 16,568 3,183 16,885 3,774 22,769 District of Columbia 18,484 143,378 18,575 143,747 18,697 147,955 15,456 136,064 Florida 83,951 438,741 89,588 470,482 98,746 559,793 110,570 639,546 Foreign Countries 9,585 103,405 10,166 108,283 10,645 112,429 10,966 118,503 Georgia 30,152 168,363 33,785 169,276 35,397 197,352 39,714 226,100 Guam 6 41 7 30 — — 1 4 Hawaii 5,299 22,766 5,400 22,623 6,039 27,133 6,633 31,269 Idaho 1,910 5,534 1,705 5,346 1,935 6,135 2,302 7,839 Illinois 47,805 287,296 52,171 335,795 55,133 357,809 60,083 407,765 Indiana 42,464 158,144 44,067 168,123 48,481 193,304 54,522 222,204 Iowa 14,029 84,120 14,708 90,005 15,312 92,251 18,409 114,353 Kansas 18,516 72,721 18,431 75,986 19,931 84,514 21,647 95,481 Kentucky 17,957 74,132 18,503 77,222 20,457 90,253 23,770 109,207 Louisiana 43,777 202,670 44,162 199,242 46,421 217,745 49,591 243,143 Maine 8,891 36,326 9,642 43,260 9,808 45,313 10,619 52,055 Maryland 21,457 95,769 22,650 103,280 22,050 102,819 24,154 116,952 Massachusetts 35,949 208,230 36,826 223,182 37,548 231,449 44,758 279,514 Michigan 30,417 127,356 32,128 136,564 32,845 143,549 36,136 169,251 Minnesota 34,053 129,063 37,930 144,512 37,795 147,349 45,841 190,548 Mississippi 20,797 78,116 22,621 87,228 23,643 96,909 25,383 104,302 Missouri 35,134 201,070 39,091 224,925 41,558 243,172 49,191 294,140 Montana 8,452 32,092 8,115 29,900 8,438 31,993 7,689 28,993 Nebraska 16,046 80,687 16,180 80,845 17,380 88,349 18,434 97,128 Nevada 4,381 18,546 4,410 18,193 4,750 19,280 5,908 25,885 New Hampshire 12,375 52,427 11,361 48,835 11,544 52,769 13,058 60,571 New Jersey 19,574 86,745 22,282 94,752 28,047 122,226 33,053 147,446 New Mexico 7,178 25,391 7,386 28,351 7,582 29,828 8,006 33,466 New York 126,872 719,293 129,193 747,583 135,258 810,721 156,611 972,985 North Carolina 35,607 154,602 39,855 174,207 40,486 183,404 47,700 228,061 North Dakota 7,851 27,138 9,123 32,299 10,061 36,533 11,128 41,003 Ohio 65,406 291,000 68,592 308,942 68,072 314,274 75,423 363,561 Oklahoma 28,637 115,186 29,902 124,566 30,797 134,662 32,722 148,057 Oregon 11,977 56,791 12,919 62,130 14,553 70,893 15,504 75,850 Pennsylvania 134,532 593,842 144,821 680,590 153,625 749,446 176,310 909,338 Puerto Rico 694 8,034 826 9,684 1,256 14,419 1,341 16,369 Rhode Island 10,688 41,839 10,443 41,493 11,178 46,959 11,483 48,631 South Carolina 25,227 106,411 26,776 113,384 28,331 125,034 29,343 136,649 South Dakota 9,819 35,931 10,565 39,986 11,917 45,037 12,793 49,798 Tennessee 33,198 149,901 34,537 159,982 36,650 180,273 39,376 198,374 Texas 121,845 558,614 126,197 590,837 134,881 653,321 149,305 740,325 Utah 10,225 38,444 12,639 51,416 12,388 49,079 13,044 50,909 Vermont 5,510 30,356 5,899 33,424 5,964 33,865 7,914 43,169 Virginia 26,155 101,208 28,126 111,091 29,978 121,678 36,842 152,784 Washington 26,983 116,674 29,177 128,000 29,320 135,300 30,180 140,563 West Virginia 4,762 17,381 4,656 17,890 4,606 18,975 5,365 21,703 Wisconsin 32,971 132,668 33,695 138,732 35,132 153,155 41,539 183,132 Wyoming 4,384 13,725 4,320 13,539 4,520 14,441 4,847 15,648 Total 1,586,393 $7,689,258 1,672,281 $8,275,488 1,769,097 $9,079,219 1,987,219 $10,482,251
— Not applicable.
NOTES: States are only shown in this table if they have loan volume for the type of institution shown on that page. The loan volume information for foreign countries is not available by type of institution.Therefore data for this group is shown in the total columns only. Totals do not include Consolidation loan data. The loan volume reported in this table includes some loans that later may be canceled. Detailsmay not add to totals due to rounding. Calculations are based on numbers before rounding. 0 indicates a number less than 500.
SOURCE: U.S. Department of Education, Office of Postsecondary Education, National Student Loan Data System.

Federal Student Loan Programs Data Book � FY 1997-FY 2000 103
Loan Volume Com
mitm
ents
Table 25. Federal Family Education Loan (FFEL) program loan volume commitments for Parent Loans forUndergraduate Students (PLUS) borrowers, by state and type of institution: FY 1997-FY 2000
Public 4-yearFY97 FY98 FY99 FY00
Dollars Dollars Dollars DollarsState Borrowers ($ 000’s) Borrowers ($ 000’s) Borrowers ($ 000’s) Borrowers ($ 000’s)Alabama 337 $1,523 377 $1,829 1,073 $5,414 1,279 $6,354 Alaska 55 428 62 422 92 684 75 540 Arizona 3,586 29,978 3,219 27,584 3,813 34,141 3,433 32,911 Arkansas 538 2,483 683 3,405 737 4,063 822 5,234 California 4,250 28,039 4,581 31,710 4,535 32,752 4,830 37,720 Colorado 1,913 11,678 2,067 13,009 2,199 14,522 2,497 17,072 Connecticut 1,143 7,370 1,207 8,057 1,384 9,839 1,556 11,463 Delaware 281 2,139 353 3,006 231 2,121 335 3,171 District of Columbia — — — — — — 1 3 Florida 2,896 19,824 3,317 22,513 2,714 18,820 2,788 21,739 Georgia 727 5,597 908 7,434 1,137 10,417 1,133 10,435 Hawaii 128 834 197 1,510 343 2,520 317 2,438 Idaho 34 175 23 133 23 119 16 69 Illinois 1,000 4,864 1,202 6,475 1,405 8,194 1,615 10,332 Indiana 3,406 21,197 3,769 25,017 4,223 29,947 4,543 34,096 Iowa — — — — 1 12 — — Kansas 915 4,296 1,034 5,291 1,047 5,763 886 4,879 Kentucky 505 2,244 631 3,162 748 3,970 784 4,135 Louisiana 3,855 18,045 3,557 18,136 3,496 19,622 2,988 17,253 Maine 669 3,350 838 4,741 962 5,563 876 5,113 Maryland 3,155 24,113 3,891 32,662 3,748 31,225 3,869 33,366 Massachusetts 303 1,359 364 1,767 405 2,212 356 1,962 Michigan 730 3,288 741 3,748 902 4,471 730 3,989 Minnesota 592 2,270 546 2,384 418 1,951 428 1,969 Mississippi 1,077 5,134 1,019 5,444 1,719 9,895 1,311 7,543 Missouri 633 2,816 993 5,167 1,083 5,441 498 2,359 Montana 559 3,390 604 3,741 508 3,246 488 3,067 Nebraska 411 1,536 462 1,875 454 2,130 228 858 Nevada 77 544 218 1,573 276 2,092 243 1,996 New Hampshire 1,775 13,031 2,031 15,855 2,210 17,849 2,084 17,380 New Jersey 80 325 94 446 184 1,253 920 6,437 New Mexico 176 887 202 977 204 1,058 221 1,317 New York 4,684 26,934 4,934 29,168 5,643 35,321 6,024 38,725 North Carolina 3,955 23,403 5,097 30,720 4,784 28,882 5,261 33,891 North Dakota 684 2,956 587 2,713 595 2,960 590 3,403 Ohio 2,887 17,889 3,600 26,859 3,155 22,366 3,800 28,196 Oklahoma 1,411 7,285 1,416 7,771 1,289 7,803 1,270 7,785 Oregon 184 932 173 986 253 1,617 272 1,804 Pennsylvania 11,478 67,599 13,021 81,444 13,113 84,141 13,963 94,486 Puerto Rico — — 1 5 4 32 2 8 Rhode Island 85 411 96 490 120 671 49 271 South Carolina 2,513 14,688 2,408 14,037 2,016 12,215 2,175 14,224 South Dakota 830 3,175 800 3,336 758 3,267 770 3,441 Tennessee 1,476 8,262 1,833 11,218 2,204 14,926 1,056 6,622 Texas 9,072 49,260 10,055 57,887 10,820 66,427 12,190 78,399 Utah 208 1,402 297 2,136 335 2,267 251 1,684 Vermont 3 38 1 4 253 1,644 211 1,253 Virginia 3,258 20,483 3,432 22,224 3,886 26,913 4,071 29,641 Washington 2,405 15,943 2,892 19,036 3,103 21,096 2,786 19,615 West Virginia 158 659 150 684 137 701 156 739 Wisconsin 1,898 10,348 2,141 12,134 2,067 12,156 2,130 14,424 Wyoming 295 1,616 211 1,180 205 1,008 209 1,132 Total 83,291 $496,049 92,335 $583,104 97,015 $637,725 99,387 $686,947

104 Federal Student Loan Programs Data Book � FY 1997-FY 2000
Table 25. Federal Family Education Loan (FFEL) program loan volume commitments for Parent Loans forUndergraduate Students (PLUS) borrowers, by state and type of institution: FY 1997-FY 2000 (continued)
Private 4-yearFY97 FY98 FY99 FY00
Dollars Dollars Dollars DollarsState Borrowers ($ 000’s) Borrowers ($ 000’s) Borrowers ($ 000’s) Borrowers ($ 000’s)Alabama 1,067 $7,202 1,181 $8,726 1,226 $8,931 1,222 $9,057 Alaska 24 159 33 265 23 115 31 208 Arizona 670 8,210 383 3,147 260 2,210 215 2,151 Arkansas 970 6,067 1,022 6,876 1,155 9,261 1,071 8,128 California 9,367 93,171 9,462 96,091 9,988 105,123 10,161 117,464 Colorado 452 4,430 443 4,675 427 4,931 545 6,528 Connecticut 3,010 34,854 3,164 37,660 3,182 39,395 3,115 40,186 Delaware 175 1,143 205 1,469 271 1,940 320 2,580 District of Columbia 2,776 33,654 3,026 38,296 2,477 35,020 2,161 32,386 Florida 4,181 35,850 3,611 29,965 3,307 29,325 3,319 31,283 Georgia 2,336 22,072 3,108 29,464 2,847 27,394 3,372 36,576 Hawaii 490 3,523 513 3,895 585 5,319 738 7,876 Idaho 226 1,652 217 1,661 253 2,027 286 2,440 Illinois 4,615 36,304 4,711 40,372 5,147 45,585 4,843 43,398 Indiana 3,876 31,706 4,155 33,698 4,178 35,810 4,503 40,673 Iowa 1,919 11,546 1,857 11,098 1,765 11,544 1,606 10,348 Kansas 906 4,787 1,039 5,635 992 5,796 955 5,932 Kentucky 956 5,774 991 6,237 958 6,433 1,035 7,425 Louisiana 905 7,988 1,108 10,486 1,110 11,191 1,221 13,149 Maine 960 8,923 949 9,544 952 10,338 859 9,237 Maryland 1,728 18,685 1,792 18,975 1,917 21,663 2,576 31,611 Massachusetts 7,413 79,361 6,511 73,256 6,505 78,234 6,663 85,526 Michigan 1,553 10,460 1,982 12,041 2,004 11,771 1,957 12,012 Minnesota 3,508 25,747 3,031 21,940 2,572 18,844 2,551 18,965 Mississippi 281 1,470 331 1,824 335 1,954 292 1,771 Missouri 2,793 20,298 2,897 20,737 2,746 21,381 1,877 13,336 Montana 256 1,694 232 1,662 193 1,460 179 1,378 Nebraska 1,634 10,292 1,795 11,492 1,669 11,604 695 4,249 Nevada 33 315 33 360 37 382 25 271 New Hampshire 1,685 17,660 1,728 16,945 1,820 19,702 1,838 20,956 New Jersey 1,124 9,592 1,170 10,389 1,221 11,684 1,468 15,386 New Mexico 95 833 122 1,002 121 1,102 106 1,333 New York 17,843 187,810 18,279 200,489 18,662 214,836 20,166 246,645 North Carolina 3,660 33,387 3,939 35,631 4,013 36,429 4,552 43,595 North Dakota 153 606 140 588 132 506 128 489 Ohio 7,161 51,468 7,205 54,451 6,503 51,614 7,159 59,704 Oklahoma 1,366 8,068 1,774 11,245 1,883 12,599 2,018 14,988 Oregon 1,247 10,330 1,232 10,289 1,355 12,207 1,278 11,311 Pennsylvania 13,502 120,353 14,574 139,694 14,363 141,020 15,036 153,342 Puerto Rico 6 32 4 18 27 125 48 365 Rhode Island 3,859 34,836 4,058 38,515 4,287 45,246 4,435 47,340 South Carolina 1,754 10,070 1,776 11,143 1,611 10,217 1,744 11,943 South Dakota 307 1,567 316 1,650 325 1,758 340 2,015 Tennessee 3,000 24,846 3,133 26,683 3,076 28,456 1,899 15,260 Texas 5,230 37,268 5,255 39,395 5,200 40,567 5,533 46,791 Utah 378 2,228 419 2,552 383 2,551 179 1,238 Vermont 2,081 15,097 2,150 16,884 1,934 16,047 759 5,669 Virginia 3,318 25,213 3,267 25,187 3,278 25,784 3,561 31,409 Washington 1,442 13,712 1,479 14,681 1,436 14,955 1,398 15,538 West Virginia 418 2,468 353 2,020 222 1,289 218 1,316 Wisconsin 1,532 9,813 1,393 9,337 1,576 11,535 1,677 13,144 Total 130,241 $1,144,596 133,548 $1,210,334 132,509 $1,265,208 133,933 $1,355,921

Federal Student Loan Programs Data Book � FY 1997-FY 2000 105
Loan Volume Com
mitm
ents
Table 25. Federal Family Education Loan (FFEL) program loan volume commitments for Parent Loans forUndergraduate Students (PLUS) borrowers, by state and type of institution: FY 1997-FY 2000 (continued)
Public 2-yearFY97 FY98 FY99 FY00
Dollars Dollars Dollars DollarsState Borrowers ($ 000’s) Borrowers ($ 000’s) Borrowers ($ 000’s) Borrowers ($ 000’s)Alabama 5 $26 3 $22 6 $29 3 $16 Arizona 167 837 155 753 137 657 115 628 Arkansas 2 7 3 12 3 8 7 31 California 117 514 129 596 128 625 151 849 Colorado 223 1,095 251 1,363 191 1,070 191 1,125 Connecticut 1 8 3 7 8 27 3 12 Delaware — — — — — — 1 6 Florida 296 1,380 364 1,674 443 2,152 421 2,076 Georgia 85 347 105 440 93 429 101 461 Hawaii 6 32 15 68 15 64 21 122 Idaho 22 90 16 65 16 56 19 77 Illinois 97 308 124 499 125 454 106 437 Indiana 332 1,399 552 2,520 712 3,375 704 3,530 Iowa 211 682 205 706 206 749 179 650 Kansas 180 636 209 684 181 676 176 625 Kentucky — — 1 3 — — — — Louisiana 18 47 12 34 9 34 9 25 Maine 93 329 127 504 126 575 138 624 Maryland 138 498 168 661 202 807 166 634 Massachusetts 46 161 50 237 44 197 46 149 Michigan 95 355 87 361 112 451 84 339 Minnesota 446 1,702 397 1,612 250 1,059 257 1,010 Mississippi 21 49 25 57 28 65 28 79 Missouri 106 445 121 493 121 441 69 232 Montana 31 136 34 162 44 202 52 212 Nebraska 174 747 220 876 209 805 156 627 Nevada 27 123 19 62 49 186 44 207 New Hampshire 105 577 117 628 132 686 114 558 New Jersey 125 462 143 541 119 494 147 541 New Mexico 22 227 22 222 13 137 13 101 New York 432 1,481 464 1,669 423 1,581 381 1,438 North Carolina 62 259 94 403 76 289 79 333 North Dakota 302 1,045 372 1,442 277 1,077 251 957 Ohio 226 938 233 885 205 843 175 651 Oklahoma 119 370 111 365 85 301 144 565 Oregon 88 398 106 505 127 590 137 695 Pennsylvania 258 952 317 1,246 309 1,381 334 1,521 Rhode Island — — 1 8 — — — — South Carolina 13 31 50 203 52 197 33 127 South Dakota 352 1,729 417 2,029 416 2,077 356 1,628 Tennessee 15 54 27 78 31 113 17 42 Texas 581 2,139 715 2,865 764 3,253 761 3,481 Utah 15 58 33 130 24 116 10 46 Vermont 13 33 14 27 15 60 11 34 Virginia 58 205 87 301 79 253 67 245 Washington 104 579 96 523 110 661 128 787 West Virginia 92 505 76 481 74 447 65 401 Wisconsin 373 1,605 356 1,519 201 843 178 748 Wyoming 90 250 90 281 93 298 82 298 Total 6,384 $25,847 7,336 $30,821 7,083 $30,890 6,730 $29,982

106 Federal Student Loan Programs Data Book � FY 1997-FY 2000
Table 25. Federal Family Education Loan (FFEL) program loan volume commitments for Parent Loans forUndergraduate Students (PLUS) borrowers, by state and type of institution: FY 1997-FY 2000 (continued)
Private 2-yearFY97 FY98 FY99 FY00
Dollars Dollars Dollars DollarsState Borrowers ($ 000’s) Borrowers ($ 000’s) Borrowers ($ 000’s) Borrowers ($ 000’s)Alabama 31 $140 6 $28 11 $43 13 $70 Arizona 46 123 18 42 4 14 49 192 Arkansas 8 26 21 82 18 50 15 45 California 1,289 5,159 1,357 6,095 1,569 7,521 1,913 9,653 Colorado 15 123 19 157 22 172 25 192 Connecticut 22 141 18 122 10 66 21 141 District of Columbia 1 5 1 5 — — — — Florida 18 57 44 111 50 200 60 240 Georgia 102 480 126 676 144 751 153 951 Hawaii 204 679 205 661 159 622 167 698 Idaho 53 227 76 323 71 359 29 129 Illinois 165 1,010 185 1,124 177 1,187 209 1,513 Indiana 58 392 58 480 64 554 74 698 Iowa 87 296 67 290 70 332 52 239 Kansas 60 344 35 202 41 273 44 271 Kentucky 5 20 4 12 4 15 9 56 Louisiana — — — — 1 1 — — Maine 9 88 10 71 8 93 2 13 Maryland 14 73 11 64 21 159 20 157 Massachusetts 173 1,116 169 1,248 257 2,229 212 2,280 Michigan 2 15 — — — — 1 5 Minnesota 59 200 68 238 43 160 46 236 Mississippi 9 25 14 41 18 78 9 24 Missouri 346 1,863 329 1,884 329 2,004 121 486 Nebraska 45 234 45 257 38 176 16 71 New Hampshire 8 33 13 48 12 42 12 49 New Jersey 30 116 22 113 13 64 9 52 New York 761 5,693 656 6,163 601 6,141 549 5,818 North Carolina 78 442 71 357 77 531 88 604 Ohio 66 443 97 652 72 412 88 544 Oklahoma 11 33 7 24 5 13 6 16 Oregon 13 49 9 60 3 11 — — Pennsylvania 226 964 294 1,482 239 1,273 294 1,904 Rhode Island 1 4 — — — — 4 16 South Carolina 45 189 75 331 65 308 66 403 South Dakota 5 25 14 57 10 32 9 44 Tennessee 12 40 14 46 15 67 33 130 Texas 62 346 52 249 58 323 52 307 Utah 6 27 5 20 5 16 — — Vermont 82 1,549 77 1,672 68 1,938 56 1,234 Virginia 8 25 9 24 4 10 3 8 Washington 33 182 34 221 50 329 70 430 West Virginia 2 12 2 7 — — — — Wisconsin 10 57 10 42 — — — — Total 4,280 $23,063 4,347 $25,785 4,426 $28,569 4,599 $29,921
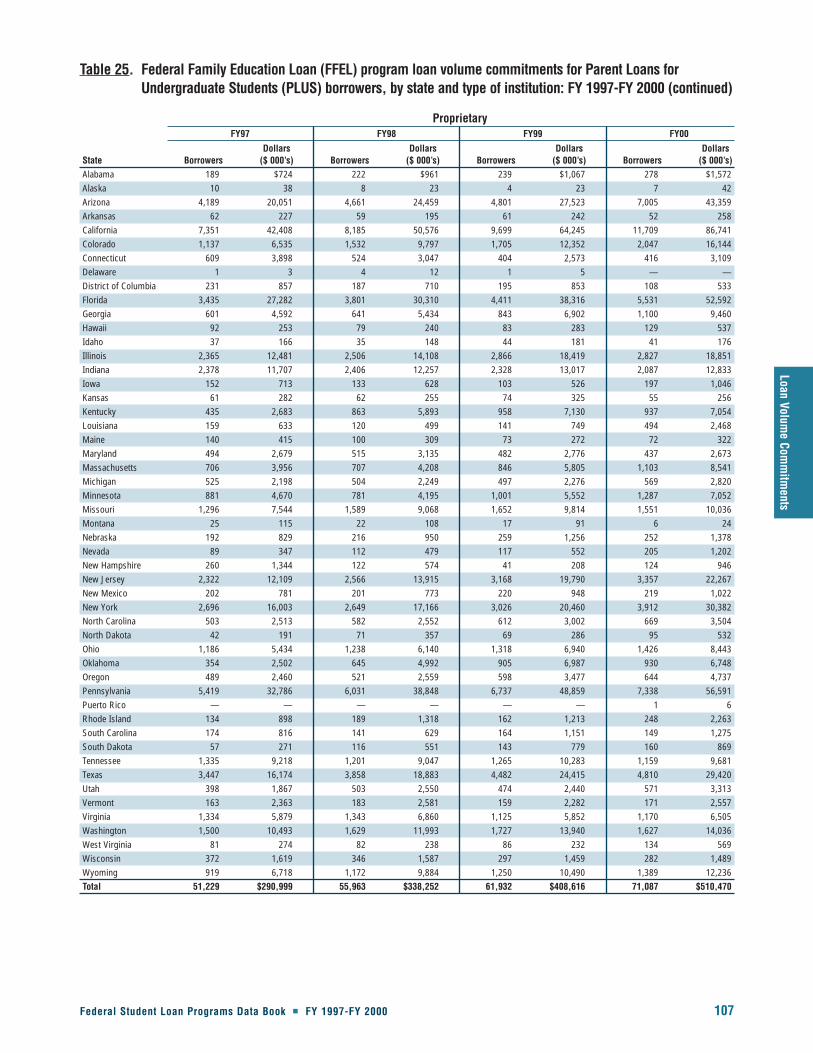
Federal Student Loan Programs Data Book � FY 1997-FY 2000 107
Loan Volume Com
mitm
ents
Table 25. Federal Family Education Loan (FFEL) program loan volume commitments for Parent Loans forUndergraduate Students (PLUS) borrowers, by state and type of institution: FY 1997-FY 2000 (continued)
ProprietaryFY97 FY98 FY99 FY00
Dollars Dollars Dollars DollarsState Borrowers ($ 000’s) Borrowers ($ 000’s) Borrowers ($ 000’s) Borrowers ($ 000’s)Alabama 189 $724 222 $961 239 $1,067 278 $1,572 Alaska 10 38 8 23 4 23 7 42 Arizona 4,189 20,051 4,661 24,459 4,801 27,523 7,005 43,359 Arkansas 62 227 59 195 61 242 52 258 California 7,351 42,408 8,185 50,576 9,699 64,245 11,709 86,741 Colorado 1,137 6,535 1,532 9,797 1,705 12,352 2,047 16,144 Connecticut 609 3,898 524 3,047 404 2,573 416 3,109 Delaware 1 3 4 12 1 5 — — District of Columbia 231 857 187 710 195 853 108 533 Florida 3,435 27,282 3,801 30,310 4,411 38,316 5,531 52,592 Georgia 601 4,592 641 5,434 843 6,902 1,100 9,460 Hawaii 92 253 79 240 83 283 129 537 Idaho 37 166 35 148 44 181 41 176 Illinois 2,365 12,481 2,506 14,108 2,866 18,419 2,827 18,851 Indiana 2,378 11,707 2,406 12,257 2,328 13,017 2,087 12,833 Iowa 152 713 133 628 103 526 197 1,046 Kansas 61 282 62 255 74 325 55 256 Kentucky 435 2,683 863 5,893 958 7,130 937 7,054 Louisiana 159 633 120 499 141 749 494 2,468 Maine 140 415 100 309 73 272 72 322 Maryland 494 2,679 515 3,135 482 2,776 437 2,673 Massachusetts 706 3,956 707 4,208 846 5,805 1,103 8,541 Michigan 525 2,198 504 2,249 497 2,276 569 2,820 Minnesota 881 4,670 781 4,195 1,001 5,552 1,287 7,052 Missouri 1,296 7,544 1,589 9,068 1,652 9,814 1,551 10,036 Montana 25 115 22 108 17 91 6 24 Nebraska 192 829 216 950 259 1,256 252 1,378 Nevada 89 347 112 479 117 552 205 1,202 New Hampshire 260 1,344 122 574 41 208 124 946 New Jersey 2,322 12,109 2,566 13,915 3,168 19,790 3,357 22,267 New Mexico 202 781 201 773 220 948 219 1,022 New York 2,696 16,003 2,649 17,166 3,026 20,460 3,912 30,382 North Carolina 503 2,513 582 2,552 612 3,002 669 3,504 North Dakota 42 191 71 357 69 286 95 532 Ohio 1,186 5,434 1,238 6,140 1,318 6,940 1,426 8,443 Oklahoma 354 2,502 645 4,992 905 6,987 930 6,748 Oregon 489 2,460 521 2,559 598 3,477 644 4,737 Pennsylvania 5,419 32,786 6,031 38,848 6,737 48,859 7,338 56,591 Puerto Rico — — — — — — 1 6 Rhode Island 134 898 189 1,318 162 1,213 248 2,263 South Carolina 174 816 141 629 164 1,151 149 1,275 South Dakota 57 271 116 551 143 779 160 869 Tennessee 1,335 9,218 1,201 9,047 1,265 10,283 1,159 9,681 Texas 3,447 16,174 3,858 18,883 4,482 24,415 4,810 29,420 Utah 398 1,867 503 2,550 474 2,440 571 3,313 Vermont 163 2,363 183 2,581 159 2,282 171 2,557 Virginia 1,334 5,879 1,343 6,860 1,125 5,852 1,170 6,505 Washington 1,500 10,493 1,629 11,993 1,727 13,940 1,627 14,036 West Virginia 81 274 82 238 86 232 134 569 Wisconsin 372 1,619 346 1,587 297 1,459 282 1,489 Wyoming 919 6,718 1,172 9,884 1,250 10,490 1,389 12,236 Total 51,229 $290,999 55,963 $338,252 61,932 $408,616 71,087 $510,470
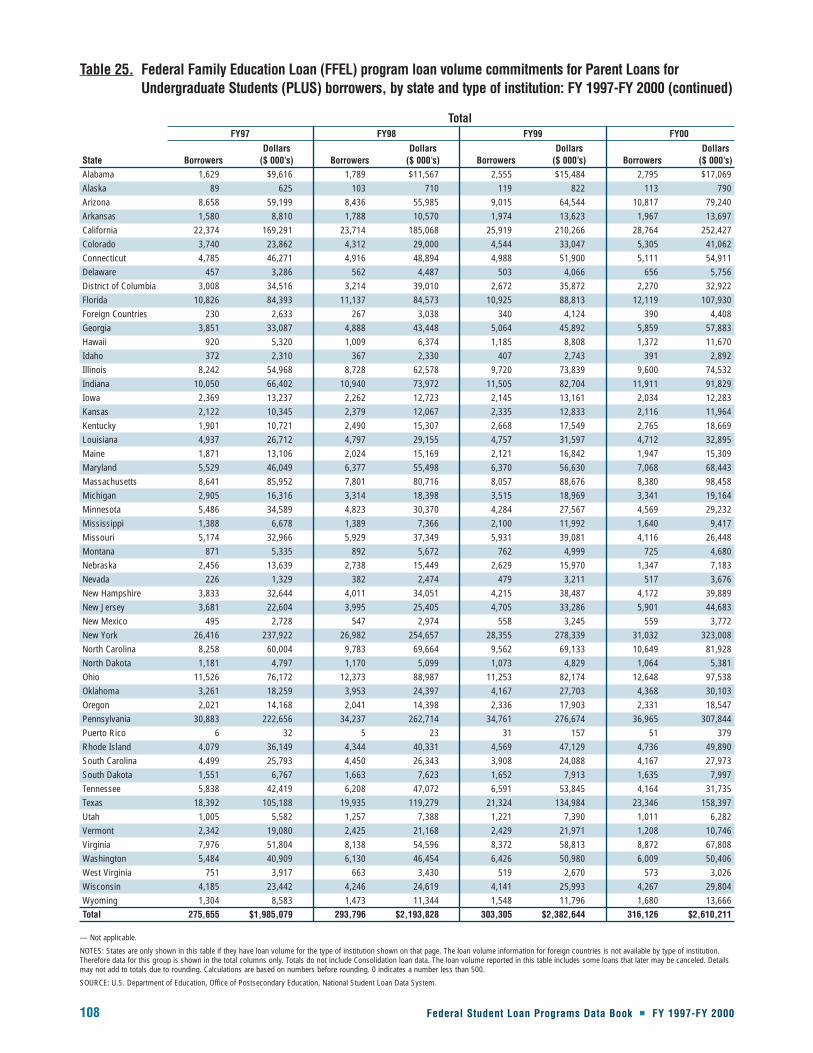
108 Federal Student Loan Programs Data Book � FY 1997-FY 2000
Table 25. Federal Family Education Loan (FFEL) program loan volume commitments for Parent Loans forUndergraduate Students (PLUS) borrowers, by state and type of institution: FY 1997-FY 2000 (continued)
TotalFY97 FY98 FY99 FY00
Dollars Dollars Dollars DollarsState Borrowers ($ 000’s) Borrowers ($ 000’s) Borrowers ($ 000’s) Borrowers ($ 000’s)Alabama 1,629 $9,616 1,789 $11,567 2,555 $15,484 2,795 $17,069 Alaska 89 625 103 710 119 822 113 790 Arizona 8,658 59,199 8,436 55,985 9,015 64,544 10,817 79,240 Arkansas 1,580 8,810 1,788 10,570 1,974 13,623 1,967 13,697 California 22,374 169,291 23,714 185,068 25,919 210,266 28,764 252,427 Colorado 3,740 23,862 4,312 29,000 4,544 33,047 5,305 41,062 Connecticut 4,785 46,271 4,916 48,894 4,988 51,900 5,111 54,911 Delaware 457 3,286 562 4,487 503 4,066 656 5,756 District of Columbia 3,008 34,516 3,214 39,010 2,672 35,872 2,270 32,922 Florida 10,826 84,393 11,137 84,573 10,925 88,813 12,119 107,930 Foreign Countries 230 2,633 267 3,038 340 4,124 390 4,408 Georgia 3,851 33,087 4,888 43,448 5,064 45,892 5,859 57,883 Hawaii 920 5,320 1,009 6,374 1,185 8,808 1,372 11,670 Idaho 372 2,310 367 2,330 407 2,743 391 2,892 Illinois 8,242 54,968 8,728 62,578 9,720 73,839 9,600 74,532 Indiana 10,050 66,402 10,940 73,972 11,505 82,704 11,911 91,829 Iowa 2,369 13,237 2,262 12,723 2,145 13,161 2,034 12,283 Kansas 2,122 10,345 2,379 12,067 2,335 12,833 2,116 11,964 Kentucky 1,901 10,721 2,490 15,307 2,668 17,549 2,765 18,669 Louisiana 4,937 26,712 4,797 29,155 4,757 31,597 4,712 32,895 Maine 1,871 13,106 2,024 15,169 2,121 16,842 1,947 15,309 Maryland 5,529 46,049 6,377 55,498 6,370 56,630 7,068 68,443 Massachusetts 8,641 85,952 7,801 80,716 8,057 88,676 8,380 98,458 Michigan 2,905 16,316 3,314 18,398 3,515 18,969 3,341 19,164 Minnesota 5,486 34,589 4,823 30,370 4,284 27,567 4,569 29,232 Mississippi 1,388 6,678 1,389 7,366 2,100 11,992 1,640 9,417 Missouri 5,174 32,966 5,929 37,349 5,931 39,081 4,116 26,448 Montana 871 5,335 892 5,672 762 4,999 725 4,680 Nebraska 2,456 13,639 2,738 15,449 2,629 15,970 1,347 7,183 Nevada 226 1,329 382 2,474 479 3,211 517 3,676 New Hampshire 3,833 32,644 4,011 34,051 4,215 38,487 4,172 39,889 New Jersey 3,681 22,604 3,995 25,405 4,705 33,286 5,901 44,683 New Mexico 495 2,728 547 2,974 558 3,245 559 3,772 New York 26,416 237,922 26,982 254,657 28,355 278,339 31,032 323,008 North Carolina 8,258 60,004 9,783 69,664 9,562 69,133 10,649 81,928 North Dakota 1,181 4,797 1,170 5,099 1,073 4,829 1,064 5,381 Ohio 11,526 76,172 12,373 88,987 11,253 82,174 12,648 97,538 Oklahoma 3,261 18,259 3,953 24,397 4,167 27,703 4,368 30,103 Oregon 2,021 14,168 2,041 14,398 2,336 17,903 2,331 18,547 Pennsylvania 30,883 222,656 34,237 262,714 34,761 276,674 36,965 307,844 Puerto Rico 6 32 5 23 31 157 51 379 Rhode Island 4,079 36,149 4,344 40,331 4,569 47,129 4,736 49,890 South Carolina 4,499 25,793 4,450 26,343 3,908 24,088 4,167 27,973 South Dakota 1,551 6,767 1,663 7,623 1,652 7,913 1,635 7,997 Tennessee 5,838 42,419 6,208 47,072 6,591 53,845 4,164 31,735 Texas 18,392 105,188 19,935 119,279 21,324 134,984 23,346 158,397 Utah 1,005 5,582 1,257 7,388 1,221 7,390 1,011 6,282 Vermont 2,342 19,080 2,425 21,168 2,429 21,971 1,208 10,746 Virginia 7,976 51,804 8,138 54,596 8,372 58,813 8,872 67,808 Washington 5,484 40,909 6,130 46,454 6,426 50,980 6,009 50,406 West Virginia 751 3,917 663 3,430 519 2,670 573 3,026 Wisconsin 4,185 23,442 4,246 24,619 4,141 25,993 4,267 29,804 Wyoming 1,304 8,583 1,473 11,344 1,548 11,796 1,680 13,666 Total 275,655 $1,985,079 293,796 $2,193,828 303,305 $2,382,644 316,126 $2,610,211
— Not applicable.
NOTES: States are only shown in this table if they have loan volume for the type of institution shown on that page. The loan volume information for foreign countries is not available by type of institution.Therefore data for this group is shown in the total columns only. Totals do not include Consolidation loan data. The loan volume reported in this table includes some loans that later may be canceled. Detailsmay not add to totals due to rounding. Calculations are based on numbers before rounding. 0 indicates a number less than 500.
SOURCE: U.S. Department of Education, Office of Postsecondary Education, National Student Loan Data System.

Federal Student Loan Programs Data Book � FY 1997-FY 2000 109
Loan Volume Com
mitm
ents
Table 26. Federal Family Education Loan (FFEL) program loan volume commitments for Stafford Subsidized,Stafford Unsubsidized, and PLUS borrowers, by state and type of institution: FY 1997-FY 2000
Public 4-yearFY97 FY98 FY99 FY00
Dollars Dollars Dollars DollarsState Borrowers ($ 000’s) Borrowers ($ 000’s) Borrowers ($ 000’s) Borrowers ($ 000’s)Alabama 17,788 $76,501 19,159 $83,168 23,551 $100,706 32,205 $138,343 Alaska 3,002 13,109 4,375 20,318 4,764 20,965 4,344 19,231 Arizona 23,137 129,486 21,147 119,866 20,851 120,035 19,350 116,404 Arkansas 29,384 128,643 30,895 134,163 29,888 131,385 36,056 174,121 California 111,883 549,281 107,427 531,229 107,487 529,691 111,755 556,258 Colorado 38,213 160,211 37,970 159,599 37,566 160,760 38,635 170,546 Connecticut 19,132 90,925 19,488 89,849 20,044 91,381 21,585 98,556 Delaware 2,924 11,575 3,272 14,164 2,943 12,324 3,178 14,521 District of Columbia 389 4,233 338 3,485 373 3,809 1,418 8,236 Florida 71,610 359,023 74,912 370,243 77,145 365,463 81,478 400,193 Georgia 24,991 107,125 28,109 121,185 27,558 123,926 27,180 125,076 Guam 26 149 18 72 4 16 4 12 Hawaii 5,508 26,766 5,282 25,679 6,258 31,748 5,794 28,865 Idaho 770 2,413 33 157 24 125 16 69 Illinois 24,795 97,469 26,357 107,183 28,188 116,654 27,854 117,714 Indiana 61,400 250,770 59,785 250,900 63,026 275,047 63,866 290,693 Iowa — — 1 2 3 14 — — Kansas 25,748 117,676 24,806 114,303 23,853 110,090 24,934 117,300 Kentucky 28,993 129,060 28,541 126,858 31,974 142,668 34,269 160,585 Louisiana 98,664 435,348 92,694 395,340 90,298 394,770 90,765 415,231 Maine 16,236 62,158 17,512 69,182 17,322 68,302 17,302 66,422 Maryland 35,438 195,502 35,739 206,956 33,832 193,436 33,812 201,272 Massachusetts 12,660 52,322 14,168 57,822 13,191 52,051 16,519 67,830 Michigan 20,585 91,015 19,363 86,224 15,775 75,144 15,123 84,319 Minnesota 26,216 85,522 26,774 87,062 23,559 72,887 27,627 98,876 Mississippi 37,804 160,729 39,622 174,416 41,275 189,615 41,793 190,084 Missouri 21,693 84,499 23,227 93,056 22,944 90,198 28,909 133,323 Montana 16,191 65,359 16,631 64,813 17,101 69,425 15,487 61,131 Nebraska 18,404 73,684 17,890 72,382 17,777 72,493 17,355 70,839 Nevada 4,454 24,979 4,732 24,352 4,546 22,943 4,615 24,645 New Hampshire 17,896 78,268 18,108 81,397 18,921 85,778 18,650 84,136 New Jersey 5,082 46,319 5,579 44,312 11,306 71,934 22,038 120,014 New Mexico 13,687 53,575 13,215 51,601 13,329 53,081 13,075 50,832 New York 79,425 369,348 78,148 358,390 84,045 391,575 93,231 446,508 North Carolina 53,967 226,326 58,250 249,243 54,165 239,303 63,720 298,441 North Dakota 19,428 71,836 20,179 75,930 20,490 77,991 21,167 83,323 Ohio 68,097 313,772 64,460 312,393 61,226 297,076 66,811 345,639 Oklahoma 41,992 182,774 43,148 192,367 42,640 194,206 42,697 201,348 Oregon 3,344 12,152 4,235 17,042 4,675 18,562 4,650 20,414 Pennsylvania 159,298 611,400 166,702 659,261 165,108 672,834 178,709 775,212 Puerto Rico 62 222 1,088 5,807 7,836 28,607 7,191 26,290 Rhode Island 4,459 16,295 4,180 15,060 4,199 15,195 2,254 7,525 South Carolina 46,670 212,823 46,823 216,117 45,424 214,383 46,133 225,006 South Dakota 19,698 74,985 19,983 78,335 20,890 82,537 20,652 82,150 Tennessee 40,266 184,293 41,875 194,482 45,191 212,694 44,741 210,599 Texas 190,989 910,727 197,986 951,154 201,047 991,567 212,477 1,073,625 Utah 20,124 85,704 25,946 126,320 22,326 97,602 22,521 94,108 Vermont 616 8,762 585 9,619 1,581 14,257 6,403 33,963 Virginia 24,049 103,304 25,690 112,277 27,664 125,677 29,050 133,885 Washington 24,890 118,489 27,089 127,687 26,905 131,386 26,280 128,166 West Virginia 4,430 17,585 4,385 17,722 4,201 18,282 4,229 19,738 Wisconsin 50,052 199,560 50,632 201,841 49,464 207,835 52,837 229,084 Wyoming 6,813 28,458 6,561 26,829 6,473 26,429 6,345 26,179 Total 1,693,375 $7,512,518 1,725,114 $7,729,214 1,742,227 $7,906,868 1,849,092 $8,666,905
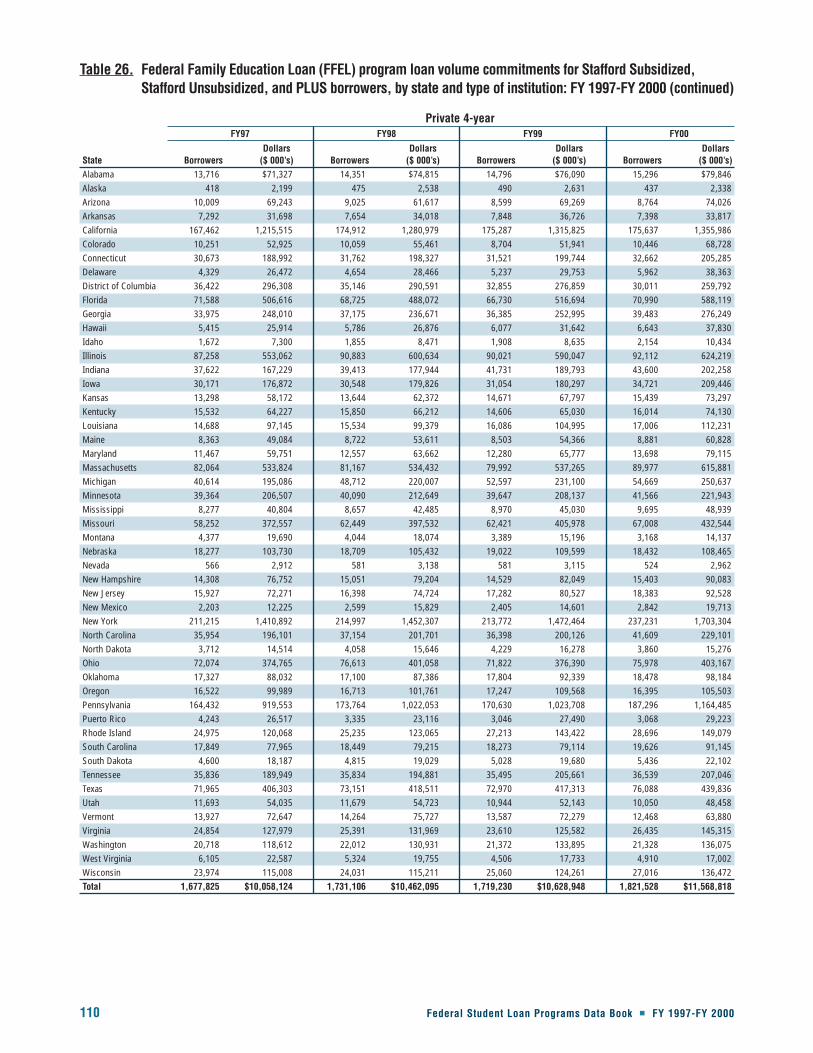
110 Federal Student Loan Programs Data Book � FY 1997-FY 2000
Table 26. Federal Family Education Loan (FFEL) program loan volume commitments for Stafford Subsidized,Stafford Unsubsidized, and PLUS borrowers, by state and type of institution: FY 1997-FY 2000 (continued)
Private 4-yearFY97 FY98 FY99 FY00
Dollars Dollars Dollars DollarsState Borrowers ($ 000’s) Borrowers ($ 000’s) Borrowers ($ 000’s) Borrowers ($ 000’s)Alabama 13,716 $71,327 14,351 $74,815 14,796 $76,090 15,296 $79,846 Alaska 418 2,199 475 2,538 490 2,631 437 2,338 Arizona 10,009 69,243 9,025 61,617 8,599 69,269 8,764 74,026 Arkansas 7,292 31,698 7,654 34,018 7,848 36,726 7,398 33,817 California 167,462 1,215,515 174,912 1,280,979 175,287 1,315,825 175,637 1,355,986 Colorado 10,251 52,925 10,059 55,461 8,704 51,941 10,446 68,728 Connecticut 30,673 188,992 31,762 198,327 31,521 199,744 32,662 205,285 Delaware 4,329 26,472 4,654 28,466 5,237 29,753 5,962 38,363 District of Columbia 36,422 296,308 35,146 290,591 32,855 276,859 30,011 259,792 Florida 71,588 506,616 68,725 488,072 66,730 516,694 70,990 588,119 Georgia 33,975 248,010 37,175 236,671 36,385 252,995 39,483 276,249 Hawaii 5,415 25,914 5,786 26,876 6,077 31,642 6,643 37,830 Idaho 1,672 7,300 1,855 8,471 1,908 8,635 2,154 10,434 Illinois 87,258 553,062 90,883 600,634 90,021 590,047 92,112 624,219 Indiana 37,622 167,229 39,413 177,944 41,731 189,793 43,600 202,258 Iowa 30,171 176,872 30,548 179,826 31,054 180,297 34,721 209,446 Kansas 13,298 58,172 13,644 62,372 14,671 67,797 15,439 73,297 Kentucky 15,532 64,227 15,850 66,212 14,606 65,030 16,014 74,130 Louisiana 14,688 97,145 15,534 99,379 16,086 104,995 17,006 112,231 Maine 8,363 49,084 8,722 53,611 8,503 54,366 8,881 60,828 Maryland 11,467 59,751 12,557 63,662 12,280 65,777 13,698 79,115 Massachusetts 82,064 533,824 81,167 534,432 79,992 537,265 89,977 615,881 Michigan 40,614 195,086 48,712 220,007 52,597 231,100 54,669 250,637 Minnesota 39,364 206,507 40,090 212,649 39,647 208,137 41,566 221,943 Mississippi 8,277 40,804 8,657 42,485 8,970 45,030 9,695 48,939 Missouri 58,252 372,557 62,449 397,532 62,421 405,978 67,008 432,544 Montana 4,377 19,690 4,044 18,074 3,389 15,196 3,168 14,137 Nebraska 18,277 103,730 18,709 105,432 19,022 109,599 18,432 108,465 Nevada 566 2,912 581 3,138 581 3,115 524 2,962 New Hampshire 14,308 76,752 15,051 79,204 14,529 82,049 15,403 90,083 New Jersey 15,927 72,271 16,398 74,724 17,282 80,527 18,383 92,528 New Mexico 2,203 12,225 2,599 15,829 2,405 14,601 2,842 19,713 New York 211,215 1,410,892 214,997 1,452,307 213,772 1,472,464 237,231 1,703,304 North Carolina 35,954 196,101 37,154 201,701 36,398 200,126 41,609 229,101 North Dakota 3,712 14,514 4,058 15,646 4,229 16,278 3,860 15,276 Ohio 72,074 374,765 76,613 401,058 71,822 376,390 75,978 403,167 Oklahoma 17,327 88,032 17,100 87,386 17,804 92,339 18,478 98,184 Oregon 16,522 99,989 16,713 101,761 17,247 109,568 16,395 105,503 Pennsylvania 164,432 919,553 173,764 1,022,053 170,630 1,023,708 187,296 1,164,485 Puerto Rico 4,243 26,517 3,335 23,116 3,046 27,490 3,068 29,223 Rhode Island 24,975 120,068 25,235 123,065 27,213 143,422 28,696 149,079 South Carolina 17,849 77,965 18,449 79,215 18,273 79,114 19,626 91,145 South Dakota 4,600 18,187 4,815 19,029 5,028 19,680 5,436 22,102 Tennessee 35,836 189,949 35,834 194,881 35,495 205,661 36,539 207,046 Texas 71,965 406,303 73,151 418,511 72,970 417,313 76,088 439,836 Utah 11,693 54,035 11,679 54,723 10,944 52,143 10,050 48,458 Vermont 13,927 72,647 14,264 75,727 13,587 72,279 12,468 63,880 Virginia 24,854 127,979 25,391 131,969 23,610 125,582 26,435 145,315 Washington 20,718 118,612 22,012 130,931 21,372 133,895 21,328 136,075 West Virginia 6,105 22,587 5,324 19,755 4,506 17,733 4,910 17,002 Wisconsin 23,974 115,008 24,031 115,211 25,060 124,261 27,016 136,472 Total 1,677,825 $10,058,124 1,731,106 $10,462,095 1,719,230 $10,628,948 1,821,528 $11,568,818

Federal Student Loan Programs Data Book � FY 1997-FY 2000 111
Loan Volume Com
mitm
ents
Table 26. Federal Family Education Loan (FFEL) program loan volume commitments for Stafford Subsidized,Stafford Unsubsidized, and PLUS borrowers, by state and type of institution: FY 1997-FY 2000 (continued)
Public 2-yearFY97 FY98 FY99 FY00
Dollars Dollars Dollars DollarsState Borrowers ($ 000’s) Borrowers ($ 000’s) Borrowers ($ 000’s) Borrowers ($ 000’s)Alabama 762 $2,069 1,011 $2,653 889 $2,379 771 $1,827 Arizona 13,982 40,124 12,297 35,039 11,408 33,010 12,691 38,587 Arkansas 1,979 4,893 2,269 5,089 2,446 5,979 3,156 8,230 California 27,244 79,819 28,584 83,527 26,159 76,435 23,869 70,785 Colorado 7,608 20,154 6,572 17,450 6,844 18,889 6,632 18,603 Connecticut 1,463 3,187 1,308 2,925 1,015 2,154 860 1,944 Delaware 70 128 104 196 160 285 244 461 Florida 37,468 110,621 39,544 118,056 41,926 128,184 45,147 138,666 Georgia 8,965 26,845 10,341 29,918 9,369 26,139 9,251 24,554 Hawaii 1,542 4,690 1,523 4,560 1,537 4,552 1,601 4,940 Idaho 1,236 3,328 1,150 3,041 1,270 3,451 1,406 3,865 Illinois 10,234 24,017 9,618 22,667 8,636 20,198 8,566 19,710 Indiana 8,927 21,371 11,537 28,559 12,143 29,335 15,414 38,058 Iowa 9,110 23,986 8,771 23,405 9,487 25,072 10,444 27,904 Kansas 10,541 26,044 10,121 25,473 10,284 25,803 10,623 26,822 Kentucky 637 1,332 483 1,041 530 1,199 535 1,167 Louisiana 9,742 29,013 8,974 25,806 9,274 27,057 10,123 29,573 Maine 2,648 7,522 2,917 8,457 2,953 8,528 3,108 8,896 Maryland 7,190 17,042 7,428 17,856 7,151 18,128 7,556 19,185 Massachusetts 6,464 13,789 6,351 13,363 5,186 11,447 5,088 12,019 Michigan 11,468 27,026 10,097 22,979 9,642 22,114 9,796 23,117 Minnesota 34,621 92,073 34,720 92,587 26,608 66,798 29,000 76,005 Mississippi 10,861 24,524 10,859 23,726 10,449 23,675 11,909 27,105 Missouri 8,045 22,267 8,894 24,288 8,904 23,881 9,128 24,539 Montana 2,760 8,171 1,932 5,478 2,061 5,981 2,135 6,346 Nebraska 6,272 15,451 6,251 15,499 6,475 15,435 6,572 15,503 Nevada 1,726 4,928 1,867 5,528 2,188 6,937 2,563 8,419 New Hampshire 4,461 15,490 3,946 12,618 3,799 11,970 3,857 12,382 New Jersey 9,021 20,295 10,074 23,206 9,037 21,327 10,457 25,845 New Mexico 3,914 12,150 4,415 13,876 4,796 15,377 4,953 15,813 New York 37,351 89,979 37,444 89,449 34,646 82,281 33,666 81,395 North Carolina 7,694 20,749 9,286 24,604 8,869 23,535 6,637 16,548 North Dakota 5,203 13,739 5,734 15,512 5,800 15,526 5,794 15,136 Ohio 28,534 78,017 30,509 82,789 27,453 71,306 28,202 76,049 Oklahoma 15,254 39,795 14,400 35,779 13,184 32,109 14,897 39,288 Oregon 5,845 15,165 7,137 19,141 8,249 22,327 9,712 26,758 Pennsylvania 21,996 50,643 22,986 54,197 22,051 53,219 24,415 64,177 Rhode Island 613 1,014 521 802 397 644 379 666 South Carolina 3,401 6,539 4,933 11,522 4,667 10,606 4,835 11,660 South Dakota 4,755 14,579 5,212 15,833 5,373 16,383 5,309 15,962 Tennessee 8,842 21,667 8,625 21,223 8,194 20,544 8,442 21,258 Texas 40,729 111,989 40,641 111,096 38,702 107,048 38,140 104,131 Utah 2,407 5,977 2,882 7,606 2,522 6,086 2,772 6,629 Vermont 2,025 4,941 2,071 5,225 1,960 4,961 1,809 4,274 Virginia 7,389 17,809 7,849 19,220 6,395 15,122 6,094 14,943 Washington 14,940 41,755 14,698 42,694 14,179 41,431 14,361 42,485 West Virginia 1,399 3,734 1,223 3,198 1,284 3,453 1,161 3,069 Wisconsin 21,336 55,381 21,465 56,691 19,592 51,187 23,172 61,698 Wyoming 4,152 10,466 4,019 10,156 3,756 9,470 3,776 9,460 Total 494,826 $1,306,286 505,593 $1,335,604 479,899 $1,268,957 501,028 $1,346,458
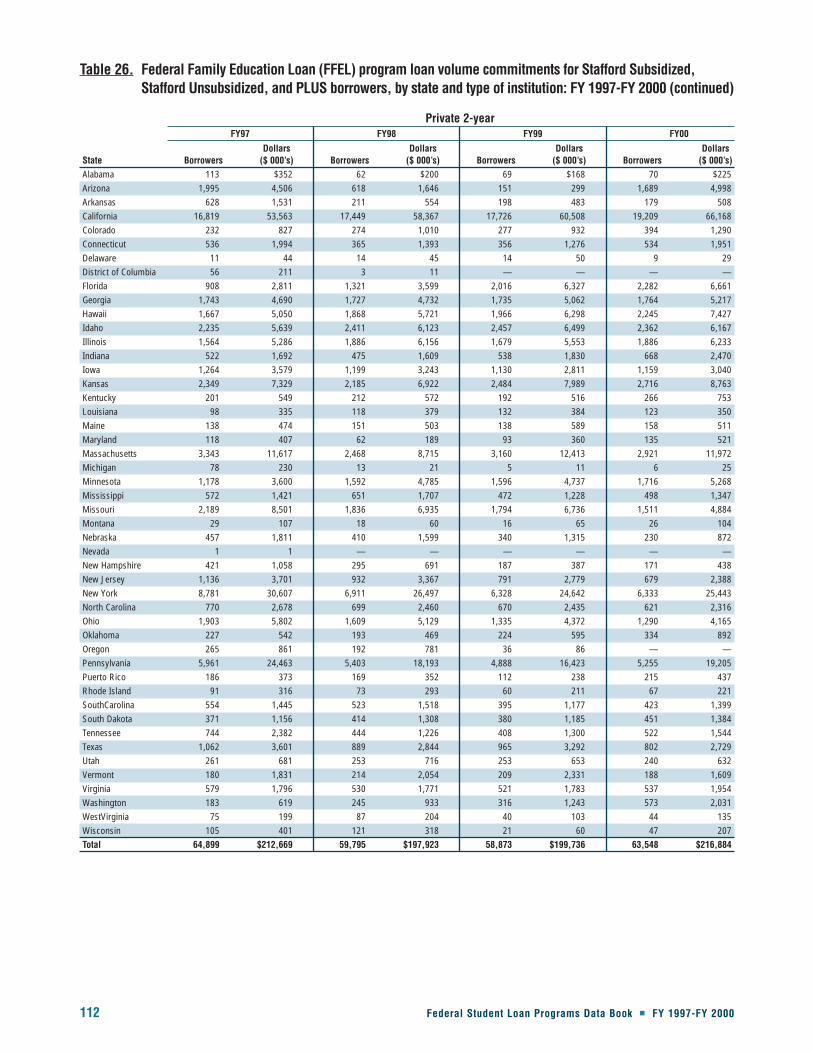
112 Federal Student Loan Programs Data Book � FY 1997-FY 2000
Table 26. Federal Family Education Loan (FFEL) program loan volume commitments for Stafford Subsidized,Stafford Unsubsidized, and PLUS borrowers, by state and type of institution: FY 1997-FY 2000 (continued)
Private 2-yearFY97 FY98 FY99 FY00
Dollars Dollars Dollars DollarsState Borrowers ($ 000’s) Borrowers ($ 000’s) Borrowers ($ 000’s) Borrowers ($ 000’s)Alabama 113 $352 62 $200 69 $168 70 $225Arizona 1,995 4,506 618 1,646 151 299 1,689 4,998Arkansas 628 1,531 211 554 198 483 179 508California 16,819 53,563 17,449 58,367 17,726 60,508 19,209 66,168Colorado 232 827 274 1,010 277 932 394 1,290Connecticut 536 1,994 365 1,393 356 1,276 534 1,951Delaware 11 44 14 45 14 50 9 29District of Columbia 56 211 3 11 — — — —Florida 908 2,811 1,321 3,599 2,016 6,327 2,282 6,661Georgia 1,743 4,690 1,727 4,732 1,735 5,062 1,764 5,217Hawaii 1,667 5,050 1,868 5,721 1,966 6,298 2,245 7,427Idaho 2,235 5,639 2,411 6,123 2,457 6,499 2,362 6,167Illinois 1,564 5,286 1,886 6,156 1,679 5,553 1,886 6,233Indiana 522 1,692 475 1,609 538 1,830 668 2,470Iowa 1,264 3,579 1,199 3,243 1,130 2,811 1,159 3,040Kansas 2,349 7,329 2,185 6,922 2,484 7,989 2,716 8,763Kentucky 201 549 212 572 192 516 266 753Louisiana 98 335 118 379 132 384 123 350Maine 138 474 151 503 138 589 158 511Maryland 118 407 62 189 93 360 135 521Massachusetts 3,343 11,617 2,468 8,715 3,160 12,413 2,921 11,972Michigan 78 230 13 21 5 11 6 25Minnesota 1,178 3,600 1,592 4,785 1,596 4,737 1,716 5,268Mississippi 572 1,421 651 1,707 472 1,228 498 1,347Missouri 2,189 8,501 1,836 6,935 1,794 6,736 1,511 4,884Montana 29 107 18 60 16 65 26 104Nebraska 457 1,811 410 1,599 340 1,315 230 872Nevada 1 1 — — — — — —New Hampshire 421 1,058 295 691 187 387 171 438New Jersey 1,136 3,701 932 3,367 791 2,779 679 2,388New York 8,781 30,607 6,911 26,497 6,328 24,642 6,333 25,443North Carolina 770 2,678 699 2,460 670 2,435 621 2,316Ohio 1,903 5,802 1,609 5,129 1,335 4,372 1,290 4,165Oklahoma 227 542 193 469 224 595 334 892Oregon 265 861 192 781 36 86 — —Pennsylvania 5,961 24,463 5,403 18,193 4,888 16,423 5,255 19,205Puerto Rico 186 373 169 352 112 238 215 437Rhode Island 91 316 73 293 60 211 67 221SouthCarolina 554 1,445 523 1,518 395 1,177 423 1,399South Dakota 371 1,156 414 1,308 380 1,185 451 1,384Tennessee 744 2,382 444 1,226 408 1,300 522 1,544Texas 1,062 3,601 889 2,844 965 3,292 802 2,729Utah 261 681 253 716 253 653 240 632Vermont 180 1,831 214 2,054 209 2,331 188 1,609Virginia 579 1,796 530 1,771 521 1,783 537 1,954Washington 183 619 245 933 316 1,243 573 2,031WestVirginia 75 199 87 204 40 103 44 135Wisconsin 105 401 121 318 21 60 47 207Total 64,899 $212,669 59,795 $197,923 58,873 $199,736 63,548 $216,884

Federal Student Loan Programs Data Book � FY 1997-FY 2000 113
Loan Volume Com
mitm
ents
Table 26. Federal Family Education Loan (FFEL) program loan volume commitments for Stafford Subsidized,Stafford Unsubsidized, and PLUS borrowers, by state and type of institution: FY 1997-FY 2000 (continued)
ProprietaryFY97 FY98 FY99 FY00
Dollars Dollars Dollars DollarsState Borrowers ($ 000’s) Borrowers ($ 000’s) Borrowers ($ 000’s) Borrowers ($ 000’s)Alabama 2,436 $7,127 2,365 $7,609 2,216 $7,588 2,353 $9,124Alaska 310 561 271 452 283 516 391 952Arizona 76,403 350,173 84,161 386,816 102,664 507,723 135,050 681,632Arkansas 814 2,490 1,150 3,359 1,037 3,164 970 3,133California 96,997 357,647 100,318 385,530 112,079 436,430 130,156 519,826Colorado 18,321 65,347 21,725 81,315 24,412 95,822 26,750 108,282Connecticut 7,371 22,036 5,756 17,177 3,587 12,188 3,829 13,267Delaware 209 375 214 371 79 146 - -District of Columbia 10,114 36,058 11,044 40,622 12,066 48,422 6,530 29,775Florida 50,614 192,743 56,122 221,431 65,459 270,405 78,852 346,476Georgia 9,561 33,404 11,608 43,417 15,273 62,265 20,013 86,106Hawaii 946 2,435 1,065 3,034 1,389 3,856 1,791 6,019Idaho 996 2,830 980 3,107 1,177 3,750 1,309 4,429Illinois 19,285 84,231 21,604 95,648 25,671 129,912 28,636 150,440Indiana 18,083 60,056 17,695 58,002 17,481 60,053 19,232 67,277Iowa 2,916 9,353 3,442 10,954 2,586 7,836 4,230 14,387Kansas 2,360 6,813 1,985 5,859 1,905 5,928 2,171 6,620Kentucky 5,851 18,606 7,068 24,464 8,486 30,257 10,815 39,052Louisiana 5,997 16,400 5,120 14,313 6,507 19,827 8,373 25,793Maine 2,775 7,757 2,258 6,582 1,914 5,665 1,696 5,073Maryland 7,036 20,146 7,250 22,124 7,131 20,343 8,381 25,926Massachusetts 10,176 30,947 8,719 28,174 10,247 35,446 11,323 41,135Michigan 8,184 22,646 8,114 22,662 8,188 23,145 9,633 27,481Minnesota 8,974 29,769 9,765 32,145 12,983 47,993 15,240 60,612Mississippi 245 457 85 150 1 2 - -Missouri 15,457 58,673 17,503 65,939 18,720 70,013 20,113 80,300Montana 990 3,472 793 2,796 804 2,767 210 560Nebraska 1,969 6,198 1,913 6,301 2,356 7,807 2,732 9,919Nevada 3,885 11,466 3,680 11,264 4,206 13,183 5,876 19,651New Hampshire 4,199 12,262 1,905 5,159 614 1,877 1,800 6,182New Jersey 24,753 85,630 28,484 98,648 33,917 119,729 33,118 117,940New Mexico 3,679 11,853 3,128 11,400 3,592 13,048 3,327 12,821New York 42,238 130,273 40,590 129,056 43,147 146,699 54,508 207,172North Carolina 3,065 8,671 4,224 11,250 5,995 17,428 7,474 23,025North Dakota 506 1,645 825 2,703 690 2,349 960 3,556Ohio 20,179 60,721 19,466 58,914 20,630 65,041 21,925 71,462Oklahoma 6,781 21,921 8,317 30,613 9,239 37,579 9,584 37,839Oregon 6,919 21,968 6,939 22,094 8,179 27,504 9,050 32,946Pennsylvania 50,342 172,760 54,567 188,805 58,738 214,079 62,934 232,937Puerto Rico 3,219 6,165 1,821 3,411 1,854 4,892 1,204 1,704RhodeIsland 3,534 10,223 3,375 10,223 3,006 9,179 3,569 11,912South Carolina 3,335 8,853 3,789 9,864 4,267 12,517 2,187 7,705South Dakota 1,634 5,409 2,177 7,767 2,633 9,081 3,367 12,573Tennessee 12,044 40,195 12,296 41,427 13,186 45,361 13,955 49,863Texas 43,093 139,767 44,188 144,773 52,248 176,550 61,522 212,263Utah 5,555 16,741 6,341 19,073 6,757 21,779 7,598 26,566Vermont 1,027 5,355 1,117 5,971 1,001 5,398 1,085 5,937Virginia 17,194 54,122 18,571 59,084 20,465 66,689 28,397 97,682Washington 14,524 52,628 15,301 56,042 15,277 58,355 14,894 58,190WestVirginia 2,026 5,193 2,159 5,565 2,441 6,451 3,642 10,191Wisconsin 4,131 13,250 2,863 9,749 2,527 10,059 2,625 11,743Wyoming 2,453 10,474 2,821 13,914 3,339 15,836 3,760 18,278Total 665,705 $2,356,294 699,037 $2,547,120 784,649 $3,019,930 909,140 $3,653,735
— Not applicable.
Totals may not equal the sum of the individual column items since borrowers can, and do, change institutions over the course of the fiscal year.
NOTES: States are only shown in this table if they have loan volume for the type of institution shown on that page. The loan volume information for foreign countries is not available by type of institution.Therefore data for this group is shown in the total columns only. Totals do not include Consolidation loan data. The loan volume reported in this table includes some loans that later may be canceled. Detailsmay not add to totals due to rounding. Calculations are based on numbers before rounding. 0 indicates a number less than 500.
SOURCE: U.S. Department of Education, Office of Postsecondary Education, National Student Loan Data System.

114 Federal Student Loan Programs Data Book � FY 1997-FY 2000
$2,000-$2,600
$1,500-$1,999
$1,000-$1,499
$500-$999
0-$499
FFEL dollars (in 000,000’s)
FY00
FY00
WA
AK
HI
OR
NVUT
AZ
CO
NM
WYID
MTND
MN
WI
MI
IL
KY
TN
MS ALGA
FL
SC
NC
VAWV
IN OHPA
NJDEMDDC
NY
ME
MA
RICT
VTNH
IA
MO
LA
AR
SD
NE
KS
OK
TX
CA
$2,000-$2,500
$1,500-$1,999
$1,000-$1,499
$500-$999
0-$499
FFEL dollars (in 000,000’s)
FY99
FY99
WA
AK
HI
OR
NVUT
AZ
CO
NM
WYID
MTND
MN
WI
MI
IL
KY
TN
MS ALGA
FL
SC
NC
VAWV
IN OHPA
NJDEMDDC
NY
ME
MA
RICT
VTNH
IA
MO
LA
AR
SD
NE
KS
OK
TX
CA
SOURCE: U.S. Department of Education, Office of Postsecondary Education, National Student Loan Data System.
SOURCE: U.S. Department of Education, Office of Postsecondary Education, National Student Loan Data System.
Figure 18. Federal Family Education Loan (FFEL) program loan volume commitments for Stafford Subsidized,Stafford Unsubsidized, and Parent Loans for Undergraduate Students (PLUS), borrowers, by state: FY 1997-FY 2000
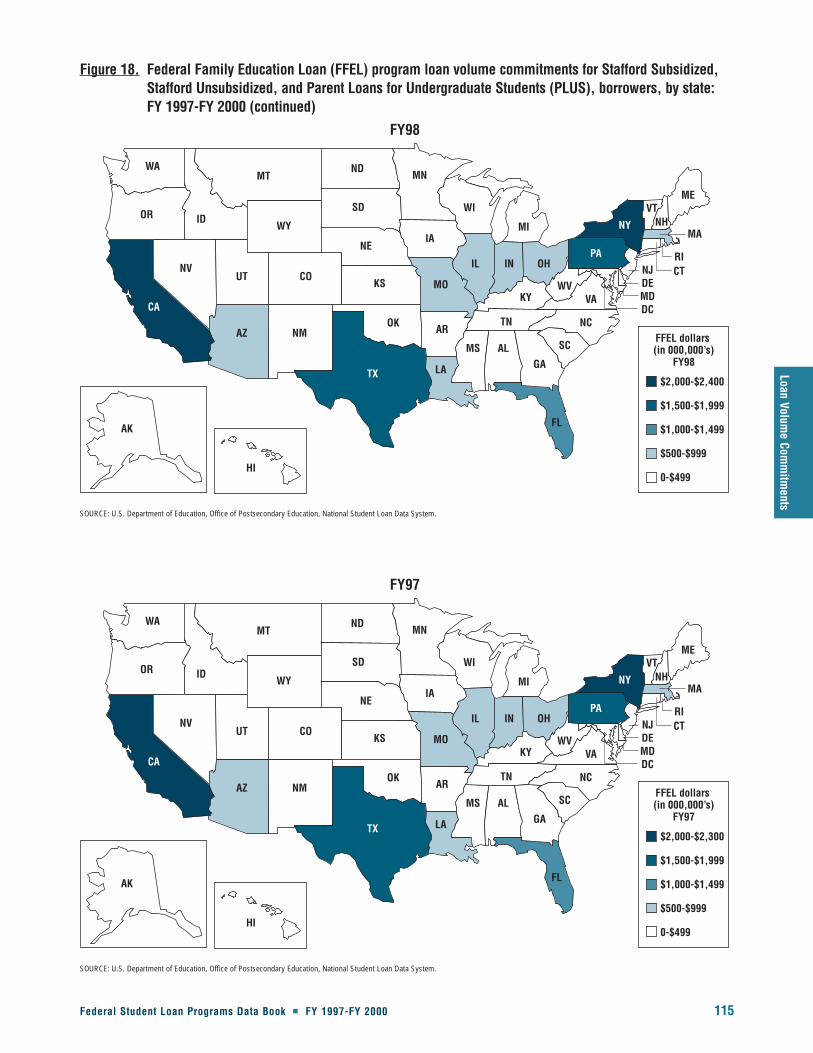
Loan Volume Com
mitm
ents
Federal Student Loan Programs Data Book � FY 1997-FY 2000 115
$2,000-$2,400
$1,500-$1,999
$1,000-$1,499
$500-$999
0-$499
FFEL dollars (in 000,000’s)
FY98
FY98
WA
AK
HI
OR
NVUT
AZ
CO
NM
WYID
MTND
MN
WI
MI
IL
KY
TN
MS ALGA
FL
SC
NC
VAWV
IN OHPA
NJDEMDDC
NY
ME
MA
RICT
VTNH
IA
MO
LA
AR
SD
NE
KS
OK
TX
CA
$2,000-$2,300
$1,500-$1,999
$1,000-$1,499
$500-$999
0-$499
FFEL dollars (in 000,000’s)
FY97
FY97
WA
AK
HI
OR
NVUT
AZ
CO
NM
WYID
MTND
MN
WI
MI
IL
KY
TN
MS ALGA
FL
SC
NC
VAWV
IN OHPA
NJDEMDDC
NY
ME
MA
RICT
VTNH
IA
MO
LA
AR
SD
NE
KS
OK
TX
CA
SOURCE: U.S. Department of Education, Office of Postsecondary Education, National Student Loan Data System.
SOURCE: U.S. Department of Education, Office of Postsecondary Education, National Student Loan Data System.
Figure 18. Federal Family Education Loan (FFEL) program loan volume commitments for Stafford Subsidized,Stafford Unsubsidized, and Parent Loans for Undergraduate Students (PLUS), borrowers, by state: FY 1997-FY 2000 (continued)
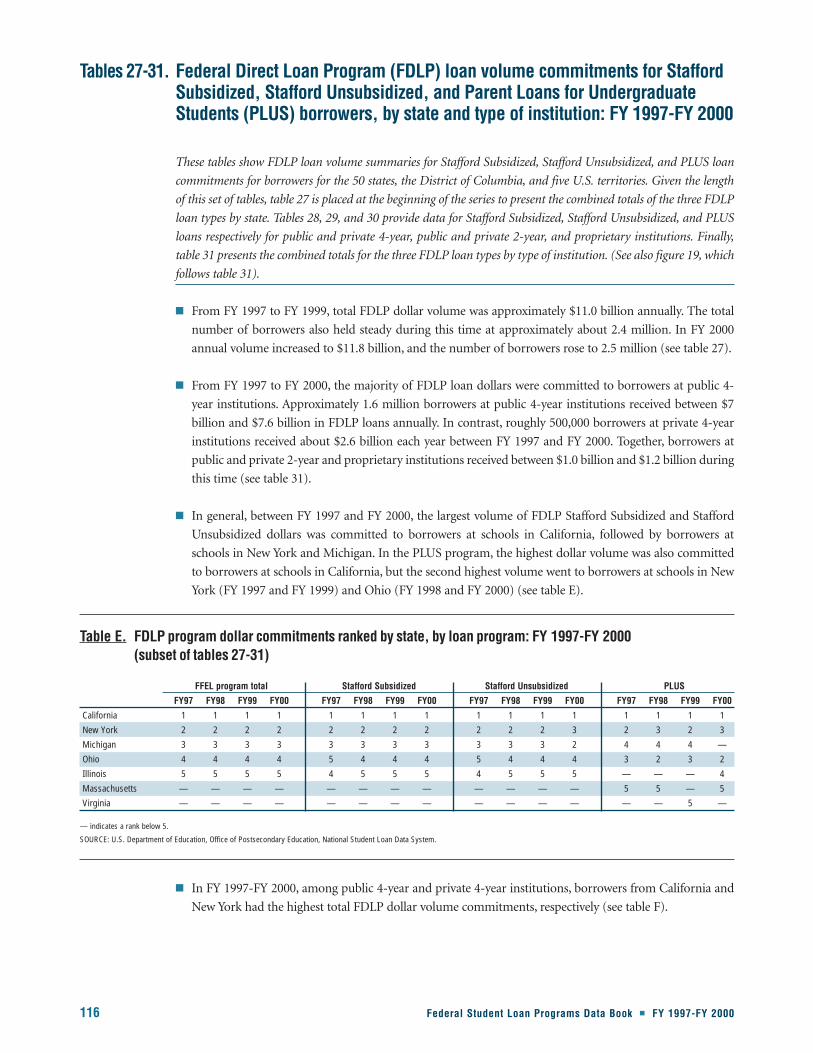
116 Federal Student Loan Programs Data Book � FY 1997-FY 2000
These tables show FDLP loan volume summaries for Stafford Subsidized, Stafford Unsubsidized, and PLUS loan
commitments for borrowers for the 50 states, the District of Columbia, and five U.S. territories. Given the length
of this set of tables, table 27 is placed at the beginning of the series to present the combined totals of the three FDLP
loan types by state. Tables 28, 29, and 30 provide data for Stafford Subsidized, Stafford Unsubsidized, and PLUS
loans respectively for public and private 4-year, public and private 2-year, and proprietary institutions. Finally,
table 31 presents the combined totals for the three FDLP loan types by type of institution. (See also figure 19, which
follows table 31).
� From FY 1997 to FY 1999, total FDLP dollar volume was approximately $11.0 billion annually. The total
number of borrowers also held steady during this time at approximately about 2.4 million. In FY 2000
annual volume increased to $11.8 billion, and the number of borrowers rose to 2.5 million (see table 27).
� From FY 1997 to FY 2000, the majority of FDLP loan dollars were committed to borrowers at public 4-
year institutions. Approximately 1.6 million borrowers at public 4-year institutions received between $7
billion and $7.6 billion in FDLP loans annually. In contrast, roughly 500,000 borrowers at private 4-year
institutions received about $2.6 billion each year between FY 1997 and FY 2000. Together, borrowers at
public and private 2-year and proprietary institutions received between $1.0 billion and $1.2 billion during
this time (see table 31).
� In general, between FY 1997 and FY 2000, the largest volume of FDLP Stafford Subsidized and Stafford
Unsubsidized dollars was committed to borrowers at schools in California, followed by borrowers at
schools in New York and Michigan. In the PLUS program, the highest dollar volume was also committed
to borrowers at schools in California, but the second highest volume went to borrowers at schools in New
York (FY 1997 and FY 1999) and Ohio (FY 1998 and FY 2000) (see table E).
� In FY 1997-FY 2000, among public 4-year and private 4-year institutions, borrowers from California and
New York had the highest total FDLP dollar volume commitments, respectively (see table F).
Tables 27-31. Federal Direct Loan Program (FDLP) loan volume commitments for StaffordSubsidized, Stafford Unsubsidized, and Parent Loans for UndergraduateStudents (PLUS) borrowers, by state and type of institution: FY 1997-FY 2000
Table E. FDLP program dollar commitments ranked by state, by loan program: FY 1997-FY 2000(subset of tables 27-31)
FFEL program total Stafford Subsidized Stafford Unsubsidized PLUS
FY97 FY98 FY99 FY00 FY97 FY98 FY99 FY00 FY97 FY98 FY99 FY00 FY97 FY98 FY99 FY00
California 1 1 1 1 1 1 1 1 1 1 1 1 1 1 1 1
New York 2 2 2 2 2 2 2 2 2 2 2 3 2 3 2 3
Michigan 3 3 3 3 3 3 3 3 3 3 3 2 4 4 4 —
Ohio 4 4 4 4 5 4 4 4 5 4 4 4 3 2 3 2
Illinois 5 5 5 5 4 5 5 5 4 5 5 5 — — — 4
Massachusetts — — — — — — — — — — — — 5 5 — 5
Virginia — — — — — — — — — — — — — — 5 —
— indicates a rank below 5.
SOURCE: U.S. Department of Education, Office of Postsecondary Education, National Student Loan Data System.

Loan Volume Com
mitm
ents
Federal Student Loan Programs Data Book � FY 1997-FY 2000 117
� Among private 2-year institutions, borrowers attending school in California, in FY 1997-FY 1998, and
Arizona, in FY 1999-FY 2000, had the highest FDLP dollar volume commitments. Among proprietary
institutions, borrowers attending school in California had the highest FDLP dollar volume commitments
in FY 1997-FY 2000 (see table F).
� There is some variation in the states with the largest commitments made to borrowers at each
postsecondary institution type by loan program type, particularly within the PLUS program. For example:
� Although borrowers in California received the largest share of Stafford Subsidized commitments to
public 4-year institutions between FY 1997 and FY 2000, borrowers in Michigan had the largest portion
of Stafford Unsubsidized commitments for these institutions during this time. Borrowers in California
also received the largest share of PLUS commitments to public 4-year institutions in FY 1997 and FY
1998. However, borrowers in Ohio received the largest share of PLUS commitments to these institutions
in FY 1999 and FY 2000 (see table F).
� Borrowers in Iowa received the largest share of PLUS commitments to borrowers at public 2-year
institutions between FY 1997 and FY 2000. However, borrowers in New York received the largest share
of Stafford Subsidized and Unsubsidized dollars going to these institutions (see table F).
� Borrowers in Pennsylvania received the largest portion of PLUS dollars going to private 2-year
institutions all four years (see table F).
Tables 27-31.(continued)
Table F. States that had borrowers who received the largest commitments of FDLP program funds, by loan program and type of institution: FY 1997-FY 2000 (subset of tables 27-31)
FFEL program total Stafford Subsidized Stafford Unsubsidized PLUS
Type of institution FY97 FY98 FY99 FY00 FY97 FY98 FY99 FY00 FY97 FY98 FY99 FY00 FY97 FY98 FY99 FY00
Public 4-year CA CA CA CA CA CA CA CA MI MI MI MI CA CA OH OH
Private 4-year NY NY NY NY NY NY NY NY NY NY NY NY NY MA NY NY
Public 2-year NY NY NY NY NY NY NY NY NY NY NY NY IA IA IA IA
Private 2-year CA CA AZ AZ CA CA AZ AZ CA CA AZ AZ PA PA PA PA
Proprietary CA CA CA CA CA CA CA CA CA CA CA CA CA CA CA CA
SOURCE: U.S. Department of Education, Office of Postsecondary Education, National Student Loan Data System.

118 Federal Student Loan Programs Data Book � FY 1997-FY 2000
Table 27. Federal Direct Loan Program (FDLP) total loan volume commitments for Stafford Subsidized, StaffordUnsubsidized, and Parent Loans for Undergraduate Students (PLUS) borrowers, by state: FY 1997-FY 2000
TotalFY97 FY98 FY99 FY00
Dollars Dollars Dollars DollarsState Borrowers ($ 000’s) Borrowers ($ 000’s) Borrowers ($ 000’s) Borrowers ($ 000’s)Alabama 66,765 $314,228 64,610 $310,806 70,585 $325,100 69,354 $336,496Alaska 687 2,365 833 3,088 1,004 3,924 989 3,707Arizona 52,718 240,922 56,523 248,399 59,388 264,139 55,747 249,580Arkansas 6,434 22,527 7,297 27,051 7,114 26,992 7,481 27,386California 211,374 1,004,523 226,371 1,061,136 216,321 1,000,578 219,532 1,035,021Colorado 46,904 258,166 44,734 246,858 43,810 244,520 48,109 241,249Connecticut 11,662 42,564 13,503 52,570 15,645 59,489 15,293 54,957Delaware 10,145 47,204 10,643 52,232 11,630 53,267 13,714 54,877District of Columbia 13,115 99,624 16,304 118,830 14,461 91,774 23,162 192,898Florida 63,911 284,856 70,932 317,027 74,478 343,941 80,664 380,194Georgia 97,423 455,752 110,201 525,620 96,293 447,584 94,907 466,641Guam 316 1,344 416 1,790 738 3,036 1,119 4,486Hawaii 192 378 330 715 367 893 342 837Idaho 28,349 115,756 28,377 113,874 26,657 106,793 27,651 110,732Illinois 129,704 620,001 129,468 611,965 127,401 594,313 143,556 672,818Indiana 51,288 237,369 51,353 232,776 50,682 233,487 53,450 249,102Iowa 82,338 322,109 82,620 325,103 78,674 307,649 83,499 345,752Kansas 28,114 111,104 29,385 116,849 31,273 128,092 32,754 135,469Kentucky 42,012 154,446 39,740 145,764 31,528 113,261 30,184 113,843Louisiana 10,402 49,833 9,453 44,477 10,090 51,371 9,618 45,693Maine 3,686 13,058 5,695 22,505 4,948 18,947 5,138 19,715Maryland 41,955 199,663 44,923 220,607 47,128 220,977 56,414 270,757Massachusetts 109,078 588,997 99,351 547,443 99,625 522,725 100,669 576,720Michigan 160,580 718,653 164,505 727,820 160,939 729,910 170,956 792,225Minnesota 40,299 180,275 43,474 200,124 32,534 116,800 62,695 323,803Mississippi 6,077 20,915 5,206 18,276 6,437 27,242 5,442 21,645Missouri 53,247 244,374 54,677 253,491 53,794 252,177 53,301 238,962Montana 8,893 34,117 8,687 33,398 8,237 31,092 8,044 32,884Nebraska 16,523 60,376 16,817 61,180 17,030 63,523 17,908 70,269Nevada 7,718 33,580 8,592 38,686 8,685 39,678 9,300 44,362New Hampshire 2,001 10,356 1,963 9,421 5,735 24,224 7,117 26,916New Jersey 79,759 347,927 80,456 350,634 72,968 322,175 84,932 389,512New Mexico 13,335 63,366 14,867 74,731 13,905 70,420 13,785 68,203New York 190,163 913,125 192,406 910,182 188,820 886,583 191,616 944,141North Carolina 47,004 200,099 46,050 192,638 48,461 194,035 49,318 210,757North Dakota 1,197 4,463 85 244 — — 2 7Ohio 140,367 637,381 153,468 684,565 144,951 635,707 158,034 724,189Oklahoma 13,543 59,233 13,982 61,613 12,509 53,587 13,611 61,068Oregon 48,980 248,532 50,498 263,598 50,804 267,955 56,941 297,409Pennsylvania 32,815 122,490 35,746 138,650 35,253 131,151 32,983 128,359Puerto Rico 29,177 106,937 29,894 102,474 24,359 87,450 28,221 108,592Rhode Island 16,263 94,239 15,123 82,306 13,539 70,510 15,433 88,073South Carolina 22,299 85,524 22,467 91,571 24,450 95,183 29,310 127,340South Dakota 1,558 5,181 2,293 7,665 1,945 6,745 1,017 3,620Tennessee 41,764 216,620 28,285 121,350 28,543 118,103 24,821 103,896Texas 37,179 155,514 37,509 156,640 38,546 157,719 38,833 159,018Utah 1,866 6,403 2,183 6,866 3,249 10,543 2,328 8,191Vermont 13,403 66,051 14,350 71,622 11,498 54,102 8,241 39,506Virgin Islands 431 1,651 329 1,084 402 1,073 404 1,069Virginia 102,269 516,325 102,442 519,857 97,384 480,548 103,760 552,529Washington 52,062 251,104 52,831 264,636 50,028 243,799 54,109 282,719West Virginia 37,189 154,441 38,677 161,177 42,184 177,347 43,722 191,888Wisconsin 40,121 171,628 39,376 171,220 44,062 191,004 46,759 203,354Wyoming 27 70 21 47 26 117 — —Total 2,366,683 $10,917,748 2,420,325 $11,125,252 2,361,118 $10,703,352 2,506,292 $11,833,438
— Not applicable.
NOTES: Totals do not include Consolidation loan data. The loan volume reported in this table includes some loans that later may be canceled. Details may not add to totals due to rounding. Calculations arebased on numbers before rounding.
SOURCE: U.S. Department of Education, Office of Postsecondary Education, National Student Loan Data System.
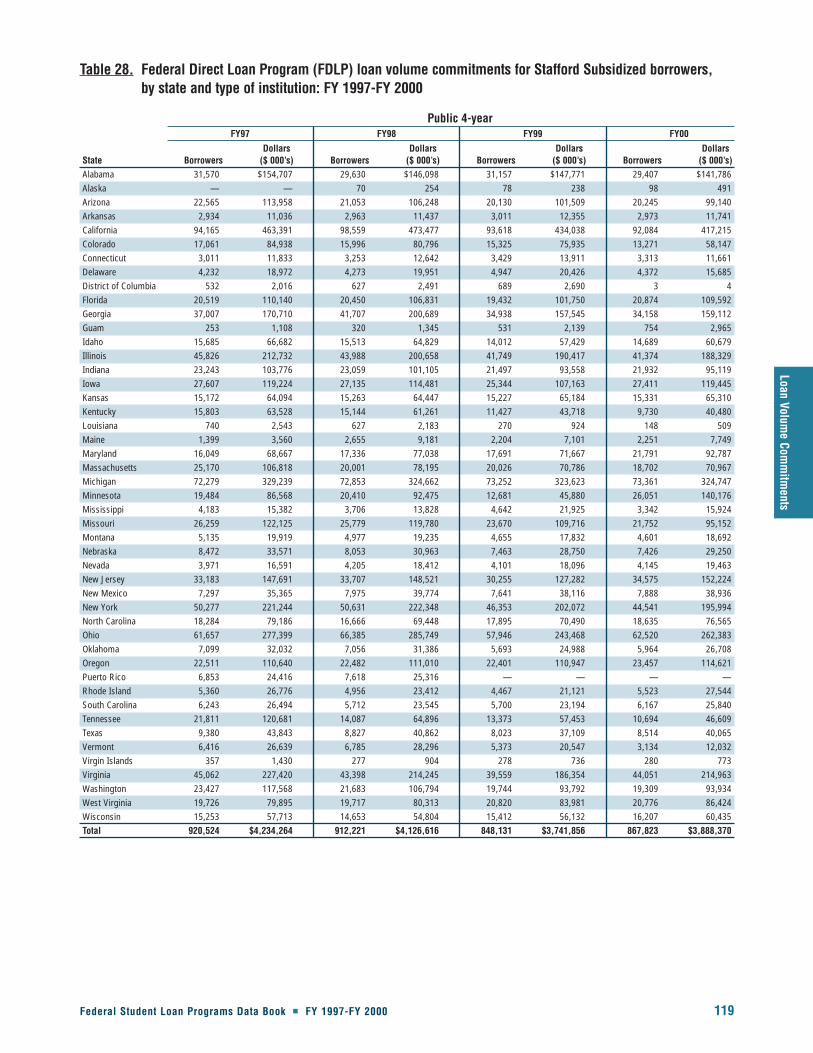
Federal Student Loan Programs Data Book � FY 1997-FY 2000 119
Loan Volume Com
mitm
ents
Table 28. Federal Direct Loan Program (FDLP) loan volume commitments for Stafford Subsidized borrowers, by state and type of institution: FY 1997-FY 2000
Public 4-yearFY97 FY98 FY99 FY00
Dollars Dollars Dollars DollarsState Borrowers ($ 000’s) Borrowers ($ 000’s) Borrowers ($ 000’s) Borrowers ($ 000’s)Alabama 31,570 $154,707 29,630 $146,098 31,157 $147,771 29,407 $141,786Alaska — — 70 254 78 238 98 491Arizona 22,565 113,958 21,053 106,248 20,130 101,509 20,245 99,140Arkansas 2,934 11,036 2,963 11,437 3,011 12,355 2,973 11,741California 94,165 463,391 98,559 473,477 93,618 434,038 92,084 417,215Colorado 17,061 84,938 15,996 80,796 15,325 75,935 13,271 58,147Connecticut 3,011 11,833 3,253 12,642 3,429 13,911 3,313 11,661Delaware 4,232 18,972 4,273 19,951 4,947 20,426 4,372 15,685District of Columbia 532 2,016 627 2,491 689 2,690 3 4Florida 20,519 110,140 20,450 106,831 19,432 101,750 20,874 109,592Georgia 37,007 170,710 41,707 200,689 34,938 157,545 34,158 159,112Guam 253 1,108 320 1,345 531 2,139 754 2,965Idaho 15,685 66,682 15,513 64,829 14,012 57,429 14,689 60,679Illinois 45,826 212,732 43,988 200,658 41,749 190,417 41,374 188,329Indiana 23,243 103,776 23,059 101,105 21,497 93,558 21,932 95,119Iowa 27,607 119,224 27,135 114,481 25,344 107,163 27,411 119,445Kansas 15,172 64,094 15,263 64,447 15,227 65,184 15,331 65,310Kentucky 15,803 63,528 15,144 61,261 11,427 43,718 9,730 40,480Louisiana 740 2,543 627 2,183 270 924 148 509Maine 1,399 3,560 2,655 9,181 2,204 7,101 2,251 7,749Maryland 16,049 68,667 17,336 77,038 17,691 71,667 21,791 92,787Massachusetts 25,170 106,818 20,001 78,195 20,026 70,786 18,702 70,967Michigan 72,279 329,239 72,853 324,662 73,252 323,623 73,361 324,747Minnesota 19,484 86,568 20,410 92,475 12,681 45,880 26,051 140,176Mississippi 4,183 15,382 3,706 13,828 4,642 21,925 3,342 15,924Missouri 26,259 122,125 25,779 119,780 23,670 109,716 21,752 95,152Montana 5,135 19,919 4,977 19,235 4,655 17,832 4,601 18,692Nebraska 8,472 33,571 8,053 30,963 7,463 28,750 7,426 29,250Nevada 3,971 16,591 4,205 18,412 4,101 18,096 4,145 19,463New Jersey 33,183 147,691 33,707 148,521 30,255 127,282 34,575 152,224New Mexico 7,297 35,365 7,975 39,774 7,641 38,116 7,888 38,936New York 50,277 221,244 50,631 222,348 46,353 202,072 44,541 195,994North Carolina 18,284 79,186 16,666 69,448 17,895 70,490 18,635 76,565Ohio 61,657 277,399 66,385 285,749 57,946 243,468 62,520 262,383Oklahoma 7,099 32,032 7,056 31,386 5,693 24,988 5,964 26,708Oregon 22,511 110,640 22,482 111,010 22,401 110,947 23,457 114,621Puerto Rico 6,853 24,416 7,618 25,316 — — — —Rhode Island 5,360 26,776 4,956 23,412 4,467 21,121 5,523 27,544South Carolina 6,243 26,494 5,712 23,545 5,700 23,194 6,167 25,840Tennessee 21,811 120,681 14,087 64,896 13,373 57,453 10,694 46,609Texas 9,380 43,843 8,827 40,862 8,023 37,109 8,514 40,065Vermont 6,416 26,639 6,785 28,296 5,373 20,547 3,134 12,032Virgin Islands 357 1,430 277 904 278 736 280 773Virginia 45,062 227,420 43,398 214,245 39,559 186,354 44,051 214,963Washington 23,427 117,568 21,683 106,794 19,744 93,792 19,309 93,934West Virginia 19,726 79,895 19,717 80,313 20,820 83,981 20,776 86,424Wisconsin 15,253 57,713 14,653 54,804 15,412 56,132 16,207 60,435Total 920,524 $4,234,264 912,221 $4,126,616 848,131 $3,741,856 867,823 $3,888,370

120 Federal Student Loan Programs Data Book � FY 1997-FY 2000
Table 28. Federal Direct Loan Program (FDLP) loan volume commitments for Stafford Subsidized borrowers, by state and type of institution: FY 1997-FY 2000 (continued)
Private 4-yearFY97 FY98 FY99 FY00
Dollars Dollars Dollars DollarsState Borrowers ($ 000’s) Borrowers ($ 000’s) Borrowers ($ 000’s) Borrowers ($ 000’s)Alabama 4,211 $17,598 3,797 $16,189 4,149 $16,759 4,278 $18,145Arkansas 958 3,599 990 4,821 753 2,832 662 2,287California 9,758 58,041 9,738 56,009 8,983 51,767 11,348 69,408Colorado 3,521 26,316 3,476 25,647 3,718 26,296 4,547 31,022Connecticut 954 4,149 1,016 6,511 876 4,462 633 3,074District of Columbia 6,850 47,539 8,156 54,143 6,729 40,998 11,922 81,645Florida 5,794 24,443 8,905 35,359 11,626 48,715 12,430 54,586Georgia 10,464 52,283 10,313 50,109 9,923 45,825 10,308 52,596Illinois 18,830 103,741 19,098 100,026 19,336 94,668 22,054 112,064Indiana 4,893 21,624 4,922 21,367 4,473 19,708 4,077 18,258Iowa 6,991 31,087 7,251 33,419 6,721 27,374 6,255 26,332Kansas 576 2,100 573 2,050 615 2,246 781 2,906Louisiana 3,907 20,180 3,211 16,993 4,009 21,027 2,982 15,776Maine 976 4,299 1,027 4,602 915 4,010 872 3,644Maryland 5,492 33,156 5,816 33,692 5,805 32,106 6,841 38,152Massachusetts 37,819 216,114 37,330 207,374 36,762 193,650 36,666 204,239Michigan 15,305 60,227 14,788 54,582 9,252 40,511 10,732 52,107Minnesota 1,006 4,665 1,014 3,859 554 1,441 1,548 7,902Mississippi 253 1,202 236 1,137 45 140 91 367Missouri 1,926 8,186 2,104 8,902 1,802 7,414 1,836 8,276New Hampshire 377 1,922 404 1,936 396 1,824 552 2,532New Jersey 6,981 36,300 5,807 30,925 6,414 34,055 7,026 38,905New York 49,913 279,042 48,285 262,276 48,939 250,917 49,049 269,325North Carolina 8,533 34,317 8,572 34,506 8,143 31,750 6,804 27,047Ohio 10,292 48,624 11,358 52,350 10,926 49,450 12,492 60,201Oklahoma 157 432 219 735 172 597 201 789Oregon 2,869 16,754 2,850 17,797 3,241 19,023 3,471 20,516Pennsylvania 7,985 33,437 8,810 38,008 8,269 32,767 8,231 33,451Puerto Rico 19,734 71,912 19,448 65,975 21,864 76,693 24,756 93,716Rhode Island 5,263 29,441 4,539 23,084 3,950 19,863 4,001 21,048South Carolina 3,902 14,814 3,729 15,551 3,800 13,653 5,759 27,959Tennessee 2,157 9,111 1,782 6,486 2,109 7,954 2,029 7,715Texas 3,463 18,048 3,386 16,926 2,821 12,660 2,593 10,361Utah — — — — — — 1 9Vermont 850 3,451 822 3,240 658 2,231 942 4,347Virginia 8,040 37,704 8,624 39,746 9,070 41,167 9,020 41,602Washington 1,656 10,269 3,322 22,146 3,526 19,248 4,685 30,780West Virginia 2,080 10,056 2,605 11,167 2,816 11,069 3,070 12,935Wisconsin 7,883 36,122 7,166 35,363 8,313 39,687 7,598 34,941Total 282,623 $1,432,303 285,486 $1,415,007 282,470 $1,346,558 303,143 $1,540,964

Federal Student Loan Programs Data Book � FY 1997-FY 2000 121
Loan Volume Com
mitm
ents
Table 28. Federal Direct Loan Program (FDLP) loan volume commitments for Stafford Subsidized borrowers, by state and type of institution: FY 1997-FY 2000 (continued)
Public 2-yearFY97 FY98 FY99 FY00
Dollars Dollars Dollars DollarsState Borrowers ($ 000’s) Borrowers ($ 000’s) Borrowers ($ 000’s) Borrowers ($ 000’s)Alabama 957 $2,790 1,228 $3,708 1,405 $4,053 1,158 $3,078Arizona 2,834 8,879 3,693 10,905 3,689 10,281 3,234 7,816Arkansas 525 1,097 496 1,015 238 507 316 614California 12,086 33,832 11,385 31,317 8,893 24,397 8,401 23,978Colorado 2,096 5,375 2,924 7,532 2,266 5,684 3,505 9,125Delaware 379 684 451 774 360 634 863 1,463Florida 3,248 9,160 3,174 8,998 2,952 8,385 3,403 10,224Idaho 1,055 3,168 1,081 3,189 890 2,545 1,048 3,111Illinois 2,994 6,795 2,707 6,084 2,468 5,540 3,059 6,697Iowa 11,888 31,141 11,899 31,718 11,117 30,311 11,051 29,815Kansas 1,347 3,160 1,242 2,836 1,277 2,829 1,409 3,168Kentucky 6,257 17,685 5,000 12,660 3,866 9,118 4,356 11,016Louisiana 757 2,071 859 2,258 709 1,809 1,229 3,690Maryland 848 1,995 817 1,902 691 1,514 254 587Massachusetts 1,689 2,882 1,651 2,867 1,009 1,652 928 1,535Michigan 3,866 10,376 4,478 11,936 4,894 13,097 4,450 11,231Minnesota — — — — 1,903 4,777 2,584 6,898Missouri 330 800 248 601 257 644 390 1,022Nebraska 1 2 1 1 — — — —New Jersey 452 771 376 842 162 276 332 687New Mexico 367 941 313 759 227 567 348 982New York 15,474 37,181 16,033 39,325 15,754 37,462 15,298 36,751North Carolina 83 190 111 294 140 377 191 547Ohio 3,811 9,282 4,574 11,204 3,875 9,159 3,183 7,672Oregon 2,252 5,991 2,708 7,143 2,905 8,076 3,756 10,476Pennsylvania 958 2,019 677 1,301 521 998 449 815South Carolina 3,395 8,647 3,112 8,008 3,504 8,653 3,176 7,498Tennessee 657 2,218 381 975 386 917 435 1,160Texas 2,069 4,293 1,300 2,565 1,606 3,538 1,355 2,879Virginia 1,001 2,422 878 2,069 623 1,329 374 750Washington 1,983 5,465 1,856 5,285 1,646 4,488 1,818 4,775Total 85,660 $221,313 85,652 $220,072 80,232 $203,617 82,352 $210,059

122 Federal Student Loan Programs Data Book � FY 1997-FY 2000
Table 28. Federal Direct Loan Program (FDLP) loan volume commitments for Stafford Subsidized borrowers, by state and type of institution: FY 1997-FY 2000 (continued)
Private 2-yearFY97 FY98 FY99 FY00
Dollars Dollars Dollars DollarsState Borrowers ($ 000’s) Borrowers ($ 000’s) Borrowers ($ 000’s) Borrowers ($ 000’s)Arizona 241 $587 1,133 $2,932 1,563 $4,242 1,041 $2,995California 1,104 3,323 1,259 3,763 874 2,539 366 824Florida — — 144 350 219 706 476 1,232Illinois 61 100 5 5 — — — —Iowa 9 22 — — — — — —Massachusetts 54 114 — — — — — —Michigan — — — — — — 7 14Mississippi 49 78 — — — — — —Nevada 1 4 — — — — — —NewYork 240 355 134 235 29 85 42 107Ohio 244 732 176 557 212 619 221 670Pennsylvania 888 2,541 1,039 2,999 859 2,187 847 2,216PuertoRico 143 483 21 57 — — — —Tennessee 3 7 22 56 16 45 52 115Washington 123 374 203 642 260 828 239 565Total 3,160 $8,720 4,138 $11,595 4,032 $11,251 3,290 $8,738
NOTE: States are only shown in this table if they have loan volume for the type of institution shown on this page.

Federal Student Loan Programs Data Book � FY 1997-FY 2000 123
Loan Volume Com
mitm
ents
Table 28. Federal Direct Loan Program (FDLP) loan volume commitments for Stafford Subsidized borrowers, by state and type of institution: FY 1997-FY 2000 (continued)
ProprietaryFY97 FY98 FY99 FY00
Dollars Dollars Dollars DollarsState Borrowers ($ 000’s) Borrowers ($ 000’s) Borrowers ($ 000’s) Borrowers ($ 000’s)Alabama 1,786 $5,292 1,984 $5,963 2,741 $9,013 3,436 $10,776Alaska 443 1,421 465 1,594 509 1,847 468 1,374Arizona 4,192 13,207 5,422 17,097 6,704 21,884 5,487 18,542Arkansas — — — — 214 563 400 1,187California 15,233 48,361 18,022 56,577 18,201 57,634 18,144 56,511Colorado 1,873 5,760 1,406 4,134 1,330 3,895 2,231 5,939Connecticut 2,744 6,529 3,419 8,271 4,269 10,566 4,195 10,371Delaware 487 1,153 394 946 408 972 944 2,269District of Columbia 21 51 288 746 444 1,154 503 1,321Florida 6,630 18,549 7,244 19,612 6,743 17,698 6,719 17,372Georgia 6,700 22,837 7,777 26,336 6,870 24,024 5,152 18,308Hawaii 123 220 214 402 232 484 220 451Idaho 573 1,927 554 1,978 548 2,125 556 2,013Illinois 9,834 37,116 9,982 36,272 9,472 32,867 11,565 41,905Indiana 843 2,128 1,079 2,831 1,214 3,330 1,376 3,880Iowa 1,150 3,244 1,280 3,567 1,335 3,910 1,600 4,770Kansas 528 1,315 679 1,835 853 2,283 820 2,215Kentucky 3,191 9,764 3,296 10,116 2,674 8,667 2,380 7,448Louisiana 837 1,956 807 1,988 802 1,984 1,016 2,393Maine 49 127 62 152 130 329 235 577Maryland 2,128 5,363 2,021 5,354 2,173 5,657 2,403 6,133Massachusetts 2,119 5,023 1,267 3,044 1,578 3,920 857 2,049Michigan 180 343 213 317 254 410 274 459Minnesota 2,594 7,645 2,823 8,302 2,809 7,763 3,060 8,703Mississippi 92 171 7 18 100 116 321 325Missouri 1,849 5,773 2,181 7,079 2,511 8,214 2,769 9,176Nebraska 831 2,119 1,158 3,457 1,406 4,398 1,384 4,649Nevada 146 424 317 995 376 986 613 1,660New Hampshire 677 2,426 654 2,216 2,628 8,959 3,260 8,742New Jersey 6,091 14,179 6,258 14,724 4,457 10,769 4,966 12,116New Mexico 202 466 102 227 98 247 44 117New York 2,475 6,085 3,670 8,631 3,689 9,113 3,509 9,411North Carolina 688 1,658 751 1,824 626 1,629 682 1,740North Dakota 601 1,916 45 119 — — 1 3Ohio 6,310 20,374 6,630 21,671 6,998 23,244 7,834 27,496Oklahoma 136 300 263 662 480 1,475 588 1,832Oregon 607 1,495 644 1,649 566 1,621 722 2,076Pennsylvania 7,920 21,610 8,781 26,337 8,817 25,379 7,392 21,085Puerto Rico 961 2,000 977 1,684 821 1,298 858 1,137Rhode Island 6 16 118 259 256 505 107 180South Carolina 257 523 180 322 104 155 117 221South Dakota 828 2,668 1,278 4,401 1,074 3,937 557 2,131Tennessee 1,875 5,555 1,240 3,332 1,240 3,495 1,204 3,446Texas 7,749 23,898 8,683 26,152 9,616 30,004 9,271 29,724Utah 936 3,038 1,089 3,202 1,625 4,805 1,142 3,602Virginia 4,154 10,226 4,081 10,024 3,507 8,772 2,375 5,932Washington 2,603 6,540 2,618 6,706 2,290 5,941 2,277 5,984West Virginia 430 1,110 417 1,077 370 990 327 853Wisconsin 702 2,097 1,035 3,022 1,240 3,615 1,409 3,917Wyoming 12 25 11 22 11 34 — —Total 113,392 $336,021 123,887 $367,247 127,413 $382,678 127,772 $384,519
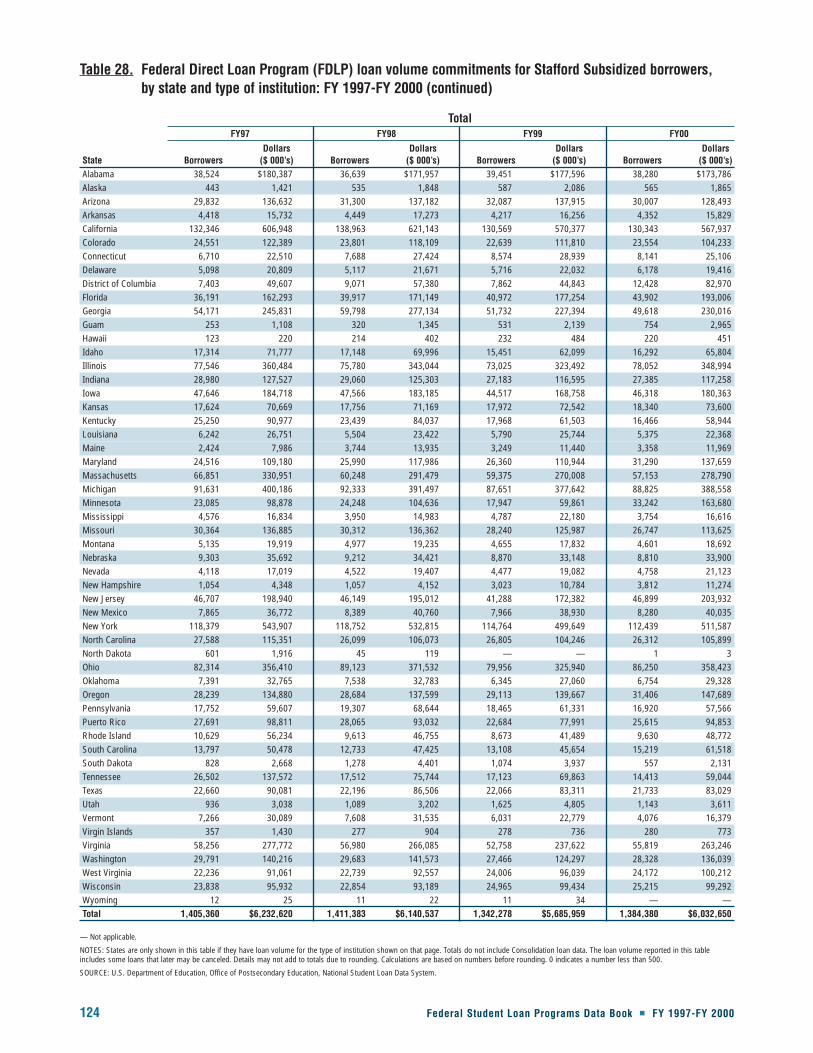
124 Federal Student Loan Programs Data Book � FY 1997-FY 2000
Table 28. Federal Direct Loan Program (FDLP) loan volume commitments for Stafford Subsidized borrowers, by state and type of institution: FY 1997-FY 2000 (continued)
TotalFY97 FY98 FY99 FY00
Dollars Dollars Dollars DollarsState Borrowers ($ 000’s) Borrowers ($ 000’s) Borrowers ($ 000’s) Borrowers ($ 000’s)Alabama 38,524 $180,387 36,639 $171,957 39,451 $177,596 38,280 $173,786Alaska 443 1,421 535 1,848 587 2,086 565 1,865Arizona 29,832 136,632 31,300 137,182 32,087 137,915 30,007 128,493Arkansas 4,418 15,732 4,449 17,273 4,217 16,256 4,352 15,829California 132,346 606,948 138,963 621,143 130,569 570,377 130,343 567,937Colorado 24,551 122,389 23,801 118,109 22,639 111,810 23,554 104,233Connecticut 6,710 22,510 7,688 27,424 8,574 28,939 8,141 25,106Delaware 5,098 20,809 5,117 21,671 5,716 22,032 6,178 19,416District of Columbia 7,403 49,607 9,071 57,380 7,862 44,843 12,428 82,970Florida 36,191 162,293 39,917 171,149 40,972 177,254 43,902 193,006Georgia 54,171 245,831 59,798 277,134 51,732 227,394 49,618 230,016Guam 253 1,108 320 1,345 531 2,139 754 2,965Hawaii 123 220 214 402 232 484 220 451Idaho 17,314 71,777 17,148 69,996 15,451 62,099 16,292 65,804Illinois 77,546 360,484 75,780 343,044 73,025 323,492 78,052 348,994Indiana 28,980 127,527 29,060 125,303 27,183 116,595 27,385 117,258Iowa 47,646 184,718 47,566 183,185 44,517 168,758 46,318 180,363Kansas 17,624 70,669 17,756 71,169 17,972 72,542 18,340 73,600Kentucky 25,250 90,977 23,439 84,037 17,968 61,503 16,466 58,944Louisiana 6,242 26,751 5,504 23,422 5,790 25,744 5,375 22,368Maine 2,424 7,986 3,744 13,935 3,249 11,440 3,358 11,969Maryland 24,516 109,180 25,990 117,986 26,360 110,944 31,290 137,659Massachusetts 66,851 330,951 60,248 291,479 59,375 270,008 57,153 278,790Michigan 91,631 400,186 92,333 391,497 87,651 377,642 88,825 388,558Minnesota 23,085 98,878 24,248 104,636 17,947 59,861 33,242 163,680Mississippi 4,576 16,834 3,950 14,983 4,787 22,180 3,754 16,616Missouri 30,364 136,885 30,312 136,362 28,240 125,987 26,747 113,625Montana 5,135 19,919 4,977 19,235 4,655 17,832 4,601 18,692Nebraska 9,303 35,692 9,212 34,421 8,870 33,148 8,810 33,900Nevada 4,118 17,019 4,522 19,407 4,477 19,082 4,758 21,123New Hampshire 1,054 4,348 1,057 4,152 3,023 10,784 3,812 11,274New Jersey 46,707 198,940 46,149 195,012 41,288 172,382 46,899 203,932New Mexico 7,865 36,772 8,389 40,760 7,966 38,930 8,280 40,035New York 118,379 543,907 118,752 532,815 114,764 499,649 112,439 511,587North Carolina 27,588 115,351 26,099 106,073 26,805 104,246 26,312 105,899North Dakota 601 1,916 45 119 — — 1 3Ohio 82,314 356,410 89,123 371,532 79,956 325,940 86,250 358,423Oklahoma 7,391 32,765 7,538 32,783 6,345 27,060 6,754 29,328Oregon 28,239 134,880 28,684 137,599 29,113 139,667 31,406 147,689Pennsylvania 17,752 59,607 19,307 68,644 18,465 61,331 16,920 57,566Puerto Rico 27,691 98,811 28,065 93,032 22,684 77,991 25,615 94,853Rhode Island 10,629 56,234 9,613 46,755 8,673 41,489 9,630 48,772South Carolina 13,797 50,478 12,733 47,425 13,108 45,654 15,219 61,518South Dakota 828 2,668 1,278 4,401 1,074 3,937 557 2,131Tennessee 26,502 137,572 17,512 75,744 17,123 69,863 14,413 59,044Texas 22,660 90,081 22,196 86,506 22,066 83,311 21,733 83,029Utah 936 3,038 1,089 3,202 1,625 4,805 1,143 3,611Vermont 7,266 30,089 7,608 31,535 6,031 22,779 4,076 16,379Virgin Islands 357 1,430 277 904 278 736 280 773Virginia 58,256 277,772 56,980 266,085 52,758 237,622 55,819 263,246Washington 29,791 140,216 29,683 141,573 27,466 124,297 28,328 136,039West Virginia 22,236 91,061 22,739 92,557 24,006 96,039 24,172 100,212Wisconsin 23,838 95,932 22,854 93,189 24,965 99,434 25,215 99,292Wyoming 12 25 11 22 11 34 — —Total 1,405,360 $6,232,620 1,411,383 $6,140,537 1,342,278 $5,685,959 1,384,380 $6,032,650
— Not applicable.
NOTES: States are only shown in this table if they have loan volume for the type of institution shown on that page. Totals do not include Consolidation loan data. The loan volume reported in this tableincludes some loans that later may be canceled. Details may not add to totals due to rounding. Calculations are based on numbers before rounding. 0 indicates a number less than 500.
SOURCE: U.S. Department of Education, Office of Postsecondary Education, National Student Loan Data System.

Federal Student Loan Programs Data Book � FY 1997-FY 2000 125
Loan Volume Com
mitm
ents
Table 29. Federal Direct Loan Program (FDLP) loan volume commitments for Stafford Unsubsidized borrowers,by state and type of institution: FY 1997-FY 2000
Public 4-yearFY97 FY98 FY99 FY00
Dollars Dollars Dollars DollarsState Borrowers ($ 000’s) Borrowers ($ 000’s) Borrowers ($ 000’s) Borrowers ($ 000’s)Alabama 19,664 $89,986 19,488 $93,544 22,082 $104,249 21,648 $113,803Alaska — — 36 128 52 139 58 299Arizona 16,595 81,287 15,964 77,702 16,044 83,527 16,712 84,307Arkansas 1,404 5,124 2,151 7,620 1,976 7,682 1,968 7,723California 41,713 190,888 45,923 210,188 47,058 213,454 49,477 216,438Colorado 12,873 66,064 11,854 61,881 12,114 64,155 11,759 51,384Connecticut 1,738 6,373 1,644 6,428 1,907 7,619 2,216 8,291Delaware 2,934 12,798 3,329 14,963 3,636 15,159 4,198 15,504District of Columbia 266 1,055 328 1,402 373 1,733 — —Florida 14,310 67,216 14,494 72,224 14,431 74,796 16,171 88,463Georgia 24,777 107,026 29,700 132,981 26,451 114,711 28,298 127,610Guam 63 236 97 445 207 897 365 1,520Idaho 9,907 39,368 10,123 39,362 10,201 40,394 10,221 39,905Illinois 24,609 107,403 25,228 109,824 26,374 117,434 29,222 121,852Indiana 14,539 60,400 14,877 61,240 15,652 65,680 17,235 73,193Iowa 17,079 65,831 17,383 66,098 17,956 69,024 20,340 88,590Kansas 7,710 28,811 8,580 32,092 9,879 40,252 10,695 44,484Kentucky 10,351 38,308 10,362 39,468 8,459 32,020 7,921 31,772Louisiana 272 931 253 820 185 521 125 331Maine 621 1,488 1,198 3,870 915 2,958 946 3,228Maryland 9,778 40,581 10,511 46,051 11,820 49,674 15,473 69,746Massachusetts 15,763 59,920 13,036 48,337 14,639 50,412 16,097 62,224Michigan 48,273 217,150 50,662 228,048 54,833 253,261 62,016 292,870Minnesota 11,841 54,412 12,692 60,585 9,492 35,172 20,252 110,397Mississippi 1,029 2,796 962 2,459 1,278 4,151 1,131 3,817Missouri 17,392 82,481 18,029 87,422 18,420 92,647 17,997 83,375Montana 3,074 10,244 3,069 10,376 3,112 10,476 2,967 11,139Nebraska 5,720 19,419 5,761 19,743 5,833 20,380 6,285 23,283Nevada 3,017 13,056 3,194 14,427 3,293 15,802 3,279 16,640New Jersey 19,165 81,444 20,406 89,906 19,135 82,013 23,250 105,233New Mexico 5,280 26,016 6,286 33,435 5,706 30,913 5,147 26,682New York 25,038 102,450 26,043 108,074 25,647 108,785 27,072 123,259North Carolina 10,732 45,893 10,643 45,439 12,468 49,549 13,322 55,738Ohio 36,293 157,819 39,280 167,490 39,387 164,516 41,886 183,546Oklahoma 4,481 17,208 4,709 19,110 4,240 16,840 4,526 18,647Oregon 14,485 74,600 15,291 80,643 15,104 82,987 16,891 92,587Puerto Rico 267 1,319 310 1,274 — — — —Rhode Island 2,207 9,203 2,201 9,037 2,053 8,257 2,457 10,798South Carolina 3,735 15,475 3,656 14,788 3,857 15,519 4,671 19,457Tennessee 12,534 69,787 8,489 38,360 8,567 38,076 7,486 34,329Texas 4,568 20,327 4,297 19,062 4,451 20,454 4,896 21,460Vermont 2,966 11,511 3,453 13,284 2,848 10,596 2,038 7,444Virgin Islands 73 220 43 131 119 317 107 246Virginia 26,323 141,011 26,380 142,078 26,074 133,668 30,487 176,865Washington 13,911 66,572 13,369 63,776 13,339 65,879 14,155 70,611West Virginia 11,429 43,435 11,721 44,505 13,392 53,321 14,400 60,582Wisconsin 9,784 35,556 9,816 35,711 11,168 41,448 12,975 50,659Total 540,582 $2,390,494 557,319 $2,475,832 566,228 $2,511,514 620,843 $2,850,332

126 Federal Student Loan Programs Data Book � FY 1997-FY 2000
Table 29. Federal Direct Loan Program (FDLP) loan volume commitments for Stafford Unsubsidized borrowers,by state and type of institution: FY 1997-FY 2000 (continued)
Private 4-yearFY97 FY98 FY99 FY00
Dollars Dollars Dollars DollarsState Borrowers ($ 000’s) Borrowers ($ 000’s) Borrowers ($ 000’s) Borrowers ($ 000’s)Alabama 1,494 $6,077 1,652 $7,812 1,754 $7,370 2,264 $10,167Arkansas 239 689 314 1,066 236 751 195 682California 6,452 51,714 6,627 50,760 6,423 48,830 7,688 65,026Colorado 2,773 23,668 2,714 23,218 2,889 24,774 3,651 31,215Connecticut 169 740 236 1,166 247 1,306 216 1,100District of Columbia 4,671 39,849 5,741 47,604 5,232 38,101 8,402 87,417Florida 3,542 15,714 5,151 21,253 7,634 35,005 8,705 40,784Georgia 6,585 37,653 6,792 37,726 6,215 36,863 6,902 44,477Illinois 11,332 70,895 11,727 72,012 11,993 71,108 15,108 89,814Indiana 1,974 9,261 2,072 9,217 2,065 9,333 2,153 10,414Iowa 2,910 10,362 3,186 12,219 3,062 10,964 3,058 10,978Kansas 374 1,282 379 1,286 361 1,211 473 1,726Louisiana 2,219 13,914 2,015 12,240 2,619 16,830 2,194 14,031Maine 422 1,555 444 1,607 405 1,360 430 1,690Maryland 2,832 21,402 3,139 23,507 3,304 23,132 4,055 28,680Massachusetts 16,609 124,226 17,346 131,678 17,704 139,237 19,431 158,649Michigan 7,503 27,916 7,378 29,068 4,672 21,647 5,547 28,812Minnesota 523 1,719 815 2,911 394 996 1,067 4,433Mississippi 93 252 124 377 21 69 32 112Missouri 1,117 4,344 1,228 4,743 1,082 4,178 1,340 5,818New Hampshire 213 1,198 268 1,420 253 1,331 332 1,701New Jersey 2,975 19,713 3,015 17,522 3,567 25,975 4,148 27,878New York 23,523 148,817 23,687 147,356 24,148 151,869 26,416 170,261North Carolina 4,370 15,124 4,786 16,591 4,632 15,951 4,383 16,280Ohio 4,766 26,891 5,376 29,135 5,924 31,122 7,095 39,151Oklahoma 78 215 132 411 100 351 121 482Oregon 1,738 13,767 1,878 17,096 1,932 16,701 2,254 19,324Pennsylvania 4,964 20,924 5,337 23,563 5,429 22,825 5,652 24,222Puerto Rico 1,212 6,770 1,493 8,122 1,664 9,443 2,597 13,720Rhode Island 1,865 11,941 1,577 8,451 1,306 6,694 1,480 7,875South Carolina 1,654 6,038 1,999 8,155 2,384 8,521 3,911 16,846Tennessee 994 3,726 967 3,510 1,364 5,192 1,349 5,155Texas 2,302 13,295 2,218 12,411 2,144 11,656 1,817 8,937Vermont 370 1,176 394 967 439 1,341 703 2,699Virginia 4,733 25,040 5,506 29,319 5,877 31,658 5,995 33,173Washington 1,657 12,498 2,585 20,926 2,435 16,564 3,330 28,010West Virginia 984 4,933 1,165 5,265 1,354 5,841 1,476 7,044Wisconsin 4,196 25,762 4,107 26,476 4,961 31,223 5,085 31,625Total 136,425 $821,060 145,573 $868,165 148,225 $887,323 171,057 $1,090,409

Federal Student Loan Programs Data Book � FY 1997-FY 2000 127
Loan Volume Com
mitm
ents
Table 29. Federal Direct Loan Program (FDLP) loan volume commitments for Stafford Unsubsidized borrowers,by state and type of institution: FY 1997-FY 2000 (continued)
Public 2-yearFY97 FY98 FY99 FY00
Dollars Dollars Dollars DollarsState Borrowers ($ 000’s) Borrowers ($ 000’s) Borrowers ($ 000’s) Borrowers ($ 000’s)Alabama 478 $1,341 597 $1,644 819 $2,170 485 $1,196Arizona 1,553 5,755 2,214 8,414 2,377 8,737 1,985 6,212Arkansas 254 578 226 511 135 254 103 208California 4,172 11,821 4,018 11,259 3,051 8,415 1,396 4,079Colorado 557 1,367 932 2,179 779 1,970 1,478 3,923Delaware 367 787 386 865 376 909 796 2,040Florida 1,867 5,583 1,918 5,891 1,810 5,636 2,232 7,202Idaho 299 1,068 302 1,104 238 818 309 1,043Illinois 1,343 3,150 1,070 2,432 919 2,108 1,367 2,938Iowa 6,815 20,253 6,523 19,251 5,724 17,449 6,073 18,364Kansas 676 1,507 691 1,573 799 1,901 886 2,163Kentucky 2,719 8,014 2,356 6,091 1,932 5,066 2,578 7,130Louisiana 252 1,038 398 1,540 348 1,333 713 3,149Maryland 441 1,140 452 1,232 385 944 77 212Massachusetts 704 1,282 738 1,365 705 1,394 739 1,507Michigan 2,153 5,922 2,469 6,893 2,994 8,230 3,205 8,887Minnesota — — — — 760 2,261 1,398 4,036Missouri 194 540 136 346 162 446 274 794Nebraska 2 3 — — — — — —New Jersey 287 594 264 722 117 259 305 701New Mexico 124 425 129 404 112 304 167 512New York 8,603 21,338 8,579 21,013 9,106 22,738 10,040 25,496North Carolina 36 108 53 178 66 250 126 511Ohio 1,926 4,831 2,550 6,484 2,481 5,951 2,504 6,364Oregon 1,347 4,255 964 3,162 1,010 3,444 1,388 4,626Pennsylvania 802 1,894 583 1,396 378 821 316 660South Carolina 1,685 4,992 1,866 5,699 2,261 6,641 1,959 5,242Tennessee 249 1,036 134 283 108 243 165 475Texas 480 891 356 646 422 917 429 873Virginia 742 1,897 724 1,989 551 1,355 365 860Washington 1,287 3,726 1,227 3,487 1,064 3,231 1,271 3,671Total 42,414 $117,138 42,854 $118,053 41,990 $116,196 45,129 $125,074
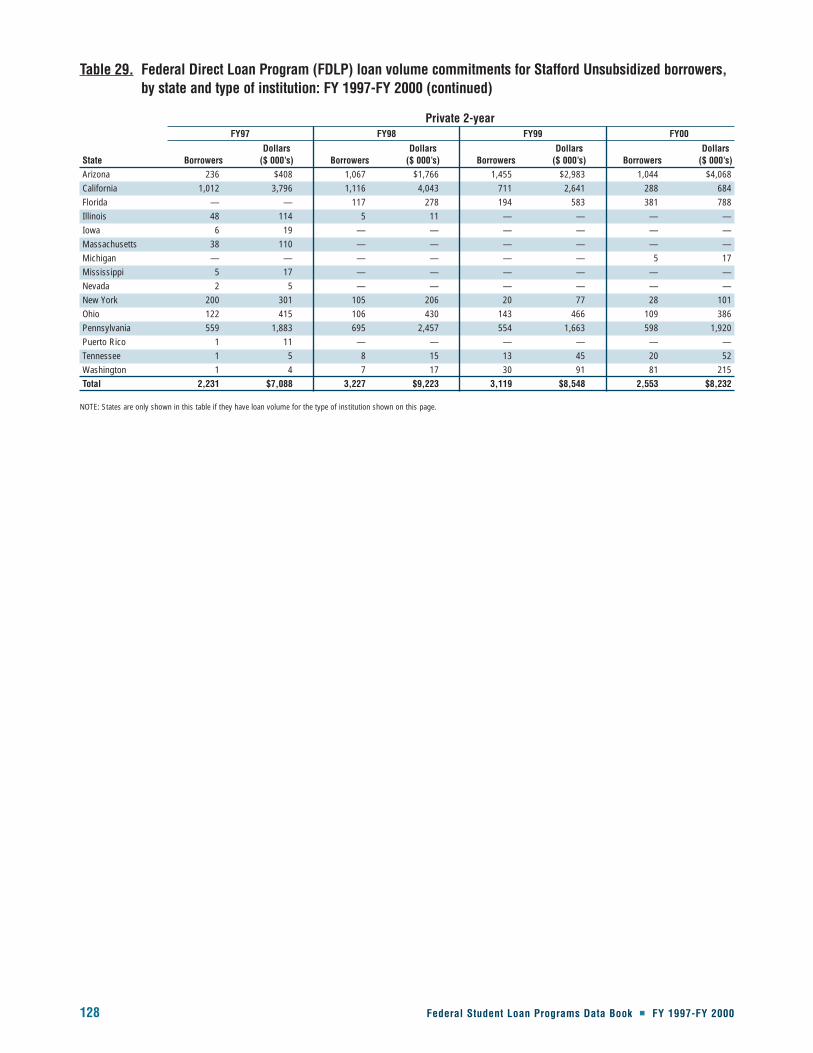
128 Federal Student Loan Programs Data Book � FY 1997-FY 2000
Table 29. Federal Direct Loan Program (FDLP) loan volume commitments for Stafford Unsubsidized borrowers,by state and type of institution: FY 1997-FY 2000 (continued)
Private 2-yearFY97 FY98 FY99 FY00
Dollars Dollars Dollars DollarsState Borrowers ($ 000’s) Borrowers ($ 000’s) Borrowers ($ 000’s) Borrowers ($ 000’s)Arizona 236 $408 1,067 $1,766 1,455 $2,983 1,044 $4,068 California 1,012 3,796 1,116 4,043 711 2,641 288 684 Florida — — 117 278 194 583 381 788 Illinois 48 114 5 11 — — — — Iowa 6 19 — — — — — — Massachusetts 38 110 — — — — — — Michigan — — — — — — 5 17 Mississippi 5 17 — — — — — — Nevada 2 5 — — — — — — New York 200 301 105 206 20 77 28 101 Ohio 122 415 106 430 143 466 109 386 Pennsylvania 559 1,883 695 2,457 554 1,663 598 1,920 Puerto Rico 1 11 — — — — — — Tennessee 1 5 8 15 13 45 20 52 Washington 1 4 7 17 30 91 81 215 Total 2,231 $7,088 3,227 $9,223 3,119 $8,548 2,553 $8,232
NOTE: States are only shown in this table if they have loan volume for the type of institution shown on this page.

Federal Student Loan Programs Data Book � FY 1997-FY 2000 129
Loan Volume Com
mitm
ents
Table 29. Federal Direct Loan Program (FDLP) loan volume commitments for Stafford Unsubsidized borrowers,by state and type of institution: FY 1997-FY 2000 (continued)
ProprietaryFY97 FY98 FY99 FY00
Dollars Dollars Dollars DollarsState Borrowers ($ 000’s) Borrowers ($ 000’s) Borrowers ($ 000’s) Borrowers ($ 000’s)Alabama 1,144 $3,306 1,671 $5,044 2,236 $8,129 2,666 $9,556Alaska 244 944 261 1,108 362 1,684 366 1,543Arizona 3,488 11,479 4,281 14,801 5,243 19,288 4,364 17,011Arkansas — — — — 163 303 306 621California 12,325 46,081 14,741 55,393 14,351 54,284 14,128 54,596Colorado 1,523 5,670 1,216 3,855 1,161 3,356 1,905 5,045Connecticut 2,310 7,500 3,034 10,140 3,743 12,501 3,794 13,063Delaware 456 855 358 693 402 865 943 2,203District of Columbia 10 15 233 358 393 599 388 774Florida 5,124 17,111 5,283 17,179 4,852 15,287 4,398 13,424Georgia 4,706 17,839 5,848 22,812 5,101 20,320 3,771 14,127Hawaii 69 159 115 312 135 409 121 382Idaho 466 1,750 439 1,646 444 1,765 492 2,018Illinois 6,719 26,841 6,968 27,564 6,663 24,378 8,005 29,539Indiana 430 899 693 1,661 964 2,807 1,225 3,690Iowa 733 2,355 836 2,794 912 3,051 1,177 4,138Kansas 474 1,307 594 1,792 694 2,086 633 2,195Kentucky 2,286 7,891 2,357 8,217 2,015 7,196 1,897 6,701Louisiana 574 1,106 627 1,164 469 1,015 704 1,658Maine 34 112 40 87 94 216 185 656Maryland 1,476 4,799 1,426 4,458 1,595 5,040 1,776 5,717Massachusetts 1,728 5,591 934 2,945 1,154 3,866 642 2,015Michigan 80 146 129 235 142 234 206 381Minnesota 1,696 5,655 1,894 6,608 1,967 6,560 2,107 7,636Mississippi 86 259 7 27 88 142 289 413Missouri 1,249 4,066 1,543 5,259 1,999 6,849 2,347 8,402Nebraska 561 1,321 855 2,328 1,064 3,604 1,178 4,488Nevada 91 253 253 635 343 836 554 1,632New Hampshire 488 2,027 451 1,834 1,826 6,570 2,270 7,108New Jersey 5,229 14,962 5,486 15,797 3,853 10,725 4,351 12,674New Mexico 63 146 61 123 106 267 — —New York 1,616 4,735 2,487 6,536 2,441 6,644 2,313 6,578North Carolina 534 1,391 626 1,684 495 1,286 438 1,294North Dakota 469 1,901 29 92 — — 1 4Ohio 3,389 9,919 3,612 11,428 4,335 14,372 4,824 16,886Oklahoma 53 148 88 204 320 912 425 1,403Oregon 539 1,555 589 1,783 479 1,498 663 1,989Pennsylvania 5,646 18,527 6,533 22,145 6,777 22,085 5,766 18,487Puerto Rico 1 5 20 27 8 5 1 0Rhode Island 6 25 97 312 220 594 92 211South Carolina 83 157 56 107 36 57 38 81South Dakota 567 1,648 825 2,452 759 2,252 406 1,238Tennessee 1,089 2,556 891 2,144 935 2,510 879 2,512Texas 5,543 21,361 6,206 23,054 7,133 27,346 7,172 26,699Utah 789 2,734 974 3,147 1,426 4,756 1,019 3,655Virginia 3,499 10,558 3,571 11,032 3,299 10,542 2,041 6,317Washington 2,659 9,947 2,684 10,267 2,385 9,315 2,336 9,361West Virginia 227 393 217 438 146 328 181 387Wisconsin 363 1,235 654 2,151 867 2,961 1,005 3,531Wyoming 12 30 9 21 12 72 — —Total 82,946 $281,271 92,799 $315,893 96,611 $331,771 96,789 $334,040
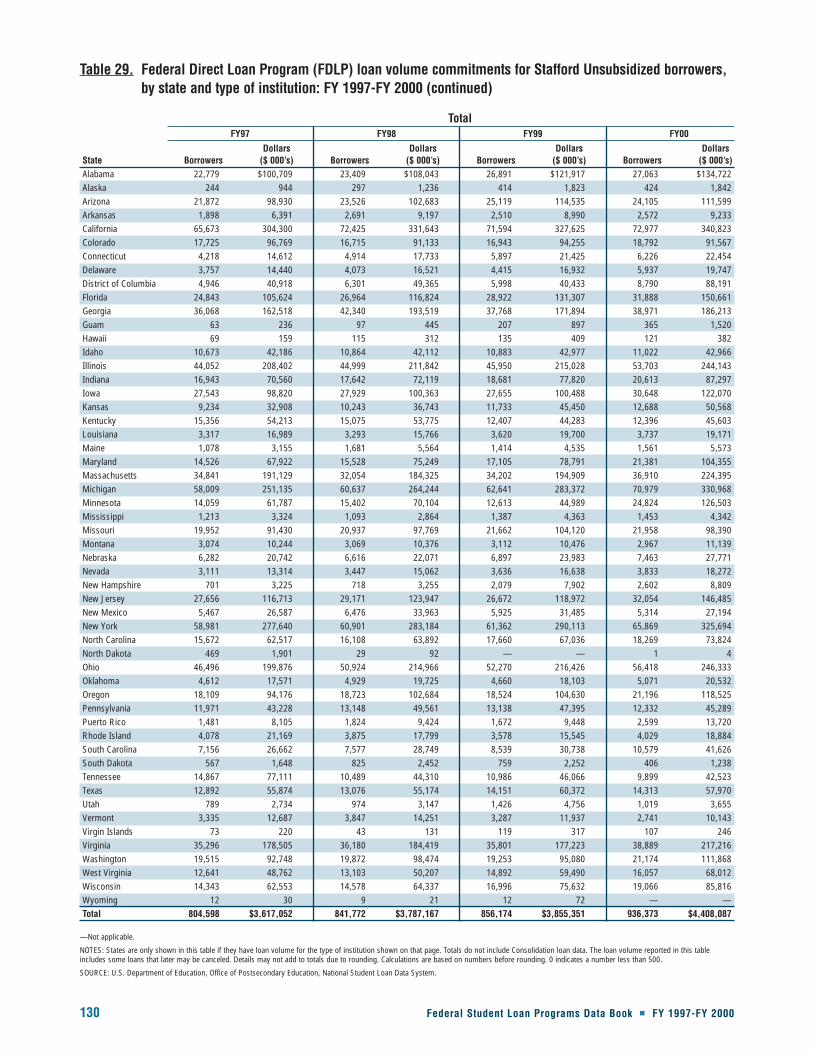
130 Federal Student Loan Programs Data Book � FY 1997-FY 2000
Table 29. Federal Direct Loan Program (FDLP) loan volume commitments for Stafford Unsubsidized borrowers,by state and type of institution: FY 1997-FY 2000 (continued)
TotalFY97 FY98 FY99 FY00
Dollars Dollars Dollars DollarsState Borrowers ($ 000’s) Borrowers ($ 000’s) Borrowers ($ 000’s) Borrowers ($ 000’s)Alabama 22,779 $100,709 23,409 $108,043 26,891 $121,917 27,063 $134,722Alaska 244 944 297 1,236 414 1,823 424 1,842Arizona 21,872 98,930 23,526 102,683 25,119 114,535 24,105 111,599Arkansas 1,898 6,391 2,691 9,197 2,510 8,990 2,572 9,233California 65,673 304,300 72,425 331,643 71,594 327,625 72,977 340,823Colorado 17,725 96,769 16,715 91,133 16,943 94,255 18,792 91,567Connecticut 4,218 14,612 4,914 17,733 5,897 21,425 6,226 22,454Delaware 3,757 14,440 4,073 16,521 4,415 16,932 5,937 19,747District of Columbia 4,946 40,918 6,301 49,365 5,998 40,433 8,790 88,191Florida 24,843 105,624 26,964 116,824 28,922 131,307 31,888 150,661Georgia 36,068 162,518 42,340 193,519 37,768 171,894 38,971 186,213Guam 63 236 97 445 207 897 365 1,520Hawaii 69 159 115 312 135 409 121 382Idaho 10,673 42,186 10,864 42,112 10,883 42,977 11,022 42,966Illinois 44,052 208,402 44,999 211,842 45,950 215,028 53,703 244,143Indiana 16,943 70,560 17,642 72,119 18,681 77,820 20,613 87,297Iowa 27,543 98,820 27,929 100,363 27,655 100,488 30,648 122,070Kansas 9,234 32,908 10,243 36,743 11,733 45,450 12,688 50,568Kentucky 15,356 54,213 15,075 53,775 12,407 44,283 12,396 45,603Louisiana 3,317 16,989 3,293 15,766 3,620 19,700 3,737 19,171Maine 1,078 3,155 1,681 5,564 1,414 4,535 1,561 5,573Maryland 14,526 67,922 15,528 75,249 17,105 78,791 21,381 104,355Massachusetts 34,841 191,129 32,054 184,325 34,202 194,909 36,910 224,395Michigan 58,009 251,135 60,637 264,244 62,641 283,372 70,979 330,968Minnesota 14,059 61,787 15,402 70,104 12,613 44,989 24,824 126,503Mississippi 1,213 3,324 1,093 2,864 1,387 4,363 1,453 4,342Missouri 19,952 91,430 20,937 97,769 21,662 104,120 21,958 98,390Montana 3,074 10,244 3,069 10,376 3,112 10,476 2,967 11,139Nebraska 6,282 20,742 6,616 22,071 6,897 23,983 7,463 27,771Nevada 3,111 13,314 3,447 15,062 3,636 16,638 3,833 18,272New Hampshire 701 3,225 718 3,255 2,079 7,902 2,602 8,809New Jersey 27,656 116,713 29,171 123,947 26,672 118,972 32,054 146,485New Mexico 5,467 26,587 6,476 33,963 5,925 31,485 5,314 27,194New York 58,981 277,640 60,901 283,184 61,362 290,113 65,869 325,694North Carolina 15,672 62,517 16,108 63,892 17,660 67,036 18,269 73,824North Dakota 469 1,901 29 92 — — 1 4Ohio 46,496 199,876 50,924 214,966 52,270 216,426 56,418 246,333Oklahoma 4,612 17,571 4,929 19,725 4,660 18,103 5,071 20,532Oregon 18,109 94,176 18,723 102,684 18,524 104,630 21,196 118,525Pennsylvania 11,971 43,228 13,148 49,561 13,138 47,395 12,332 45,289Puerto Rico 1,481 8,105 1,824 9,424 1,672 9,448 2,599 13,720Rhode Island 4,078 21,169 3,875 17,799 3,578 15,545 4,029 18,884South Carolina 7,156 26,662 7,577 28,749 8,539 30,738 10,579 41,626South Dakota 567 1,648 825 2,452 759 2,252 406 1,238Tennessee 14,867 77,111 10,489 44,310 10,986 46,066 9,899 42,523Texas 12,892 55,874 13,076 55,174 14,151 60,372 14,313 57,970Utah 789 2,734 974 3,147 1,426 4,756 1,019 3,655Vermont 3,335 12,687 3,847 14,251 3,287 11,937 2,741 10,143Virgin Islands 73 220 43 131 119 317 107 246Virginia 35,296 178,505 36,180 184,419 35,801 177,223 38,889 217,216Washington 19,515 92,748 19,872 98,474 19,253 95,080 21,174 111,868West Virginia 12,641 48,762 13,103 50,207 14,892 59,490 16,057 68,012Wisconsin 14,343 62,553 14,578 64,337 16,996 75,632 19,066 85,816Wyoming 12 30 9 21 12 72 — —Total 804,598 $3,617,052 841,772 $3,787,167 856,174 $3,855,351 936,373 $4,408,087
—Not applicable.
NOTES: States are only shown in this table if they have loan volume for the type of institution shown on that page. Totals do not include Consolidation loan data. The loan volume reported in this tableincludes some loans that later may be canceled. Details may not add to totals due to rounding. Calculations are based on numbers before rounding. 0 indicates a number less than 500.
SOURCE: U.S. Department of Education, Office of Postsecondary Education, National Student Loan Data System.
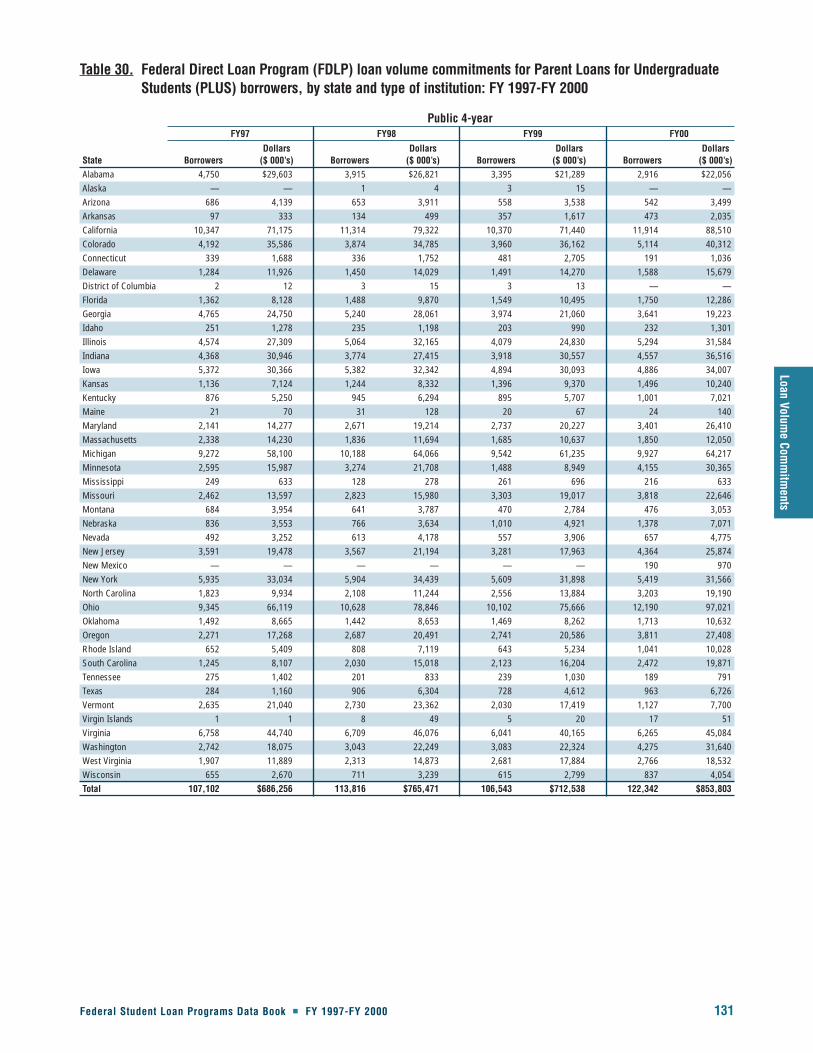
Federal Student Loan Programs Data Book � FY 1997-FY 2000 131
Loan Volume Com
mitm
ents
Table 30. Federal Direct Loan Program (FDLP) loan volume commitments for Parent Loans for UndergraduateStudents (PLUS) borrowers, by state and type of institution: FY 1997-FY 2000
Public 4-yearFY97 FY98 FY99 FY00
Dollars Dollars Dollars DollarsState Borrowers ($ 000’s) Borrowers ($ 000’s) Borrowers ($ 000’s) Borrowers ($ 000’s)Alabama 4,750 $29,603 3,915 $26,821 3,395 $21,289 2,916 $22,056Alaska — — 1 4 3 15 — —Arizona 686 4,139 653 3,911 558 3,538 542 3,499Arkansas 97 333 134 499 357 1,617 473 2,035California 10,347 71,175 11,314 79,322 10,370 71,440 11,914 88,510Colorado 4,192 35,586 3,874 34,785 3,960 36,162 5,114 40,312Connecticut 339 1,688 336 1,752 481 2,705 191 1,036Delaware 1,284 11,926 1,450 14,029 1,491 14,270 1,588 15,679District of Columbia 2 12 3 15 3 13 — —Florida 1,362 8,128 1,488 9,870 1,549 10,495 1,750 12,286Georgia 4,765 24,750 5,240 28,061 3,974 21,060 3,641 19,223Idaho 251 1,278 235 1,198 203 990 232 1,301Illinois 4,574 27,309 5,064 32,165 4,079 24,830 5,294 31,584Indiana 4,368 30,946 3,774 27,415 3,918 30,557 4,557 36,516Iowa 5,372 30,366 5,382 32,342 4,894 30,093 4,886 34,007Kansas 1,136 7,124 1,244 8,332 1,396 9,370 1,496 10,240Kentucky 876 5,250 945 6,294 895 5,707 1,001 7,021Maine 21 70 31 128 20 67 24 140Maryland 2,141 14,277 2,671 19,214 2,737 20,227 3,401 26,410Massachusetts 2,338 14,230 1,836 11,694 1,685 10,637 1,850 12,050Michigan 9,272 58,100 10,188 64,066 9,542 61,235 9,927 64,217Minnesota 2,595 15,987 3,274 21,708 1,488 8,949 4,155 30,365Mississippi 249 633 128 278 261 696 216 633Missouri 2,462 13,597 2,823 15,980 3,303 19,017 3,818 22,646Montana 684 3,954 641 3,787 470 2,784 476 3,053Nebraska 836 3,553 766 3,634 1,010 4,921 1,378 7,071Nevada 492 3,252 613 4,178 557 3,906 657 4,775New Jersey 3,591 19,478 3,567 21,194 3,281 17,963 4,364 25,874New Mexico — — — — — — 190 970New York 5,935 33,034 5,904 34,439 5,609 31,898 5,419 31,566North Carolina 1,823 9,934 2,108 11,244 2,556 13,884 3,203 19,190Ohio 9,345 66,119 10,628 78,846 10,102 75,666 12,190 97,021Oklahoma 1,492 8,665 1,442 8,653 1,469 8,262 1,713 10,632Oregon 2,271 17,268 2,687 20,491 2,741 20,586 3,811 27,408Rhode Island 652 5,409 808 7,119 643 5,234 1,041 10,028South Carolina 1,245 8,107 2,030 15,018 2,123 16,204 2,472 19,871Tennessee 275 1,402 201 833 239 1,030 189 791Texas 284 1,160 906 6,304 728 4,612 963 6,726Vermont 2,635 21,040 2,730 23,362 2,030 17,419 1,127 7,700Virgin Islands 1 1 8 49 5 20 17 51Virginia 6,758 44,740 6,709 46,076 6,041 40,165 6,265 45,084Washington 2,742 18,075 3,043 22,249 3,083 22,324 4,275 31,640West Virginia 1,907 11,889 2,313 14,873 2,681 17,884 2,766 18,532Wisconsin 655 2,670 711 3,239 615 2,799 837 4,054Total 107,102 $686,256 113,816 $765,471 106,543 $712,538 122,342 $853,803

132 Federal Student Loan Programs Data Book � FY 1997-FY 2000
Table 30. Federal Direct Loan Program (FDLP) loan volume commitments for Parent Loans for UndergraduateStudents (PLUS) borrowers, by state and type of institution: FY 1997-FY 2000 (continued)
Private 4-yearFY97 FY98 FY99 FY00
Dollars Dollars Dollars DollarsState Borrowers ($ 000’s) Borrowers ($ 000’s) Borrowers ($ 000’s) Borrowers ($ 000’s)Alabama 671 $3,422 598 $3,789 712 $3,773 768 $4,573Arkansas 22 71 22 83 30 129 36 148California 1,088 11,280 941 9,820 1,076 12,720 1,215 14,990Colorado 180 1,782 202 2,065 180 1,859 328 3,901Connecticut 208 2,698 227 3,395 242 3,621 169 2,732District of Columbia 761 9,082 910 12,040 556 6,397 1,880 21,561Florida 659 3,987 1,780 14,934 2,210 20,200 2,314 19,905Georgia 1,933 19,855 2,189 22,626 2,164 22,569 2,220 27,844Illinois 2,308 17,456 2,380 18,242 2,842 22,584 3,906 33,338Indiana 967 8,242 845 7,837 808 8,110 727 7,226Iowa 1,107 5,920 1,091 6,866 943 5,681 977 6,594Kansas 53 228 81 410 83 427 118 612Louisiana 773 5,858 606 5,097 646 5,834 462 4,014Maine 162 1,844 239 2,878 251 2,859 166 1,934Maryland 532 7,270 526 7,272 663 9,770 146 1,301Massachusetts 4,700 50,344 5,001 58,194 4,088 44,687 4,560 59,483Michigan 1,576 8,891 1,241 7,567 1,016 7,324 1,094 8,004Minnesota 239 1,843 164 1,166 140 1,051 155 1,275Mississippi 25 89 35 152 1 2 15 49Missouri 361 1,948 437 2,439 355 1,902 444 2,509NewHampshire 207 2,623 141 1,808 157 2,319 203 3,667NewJersey 1,096 9,700 792 6,895 1,064 9,706 1,019 10,330NewYork 6,117 55,208 6,080 56,551 6,269 61,264 6,820 70,109North Carolina 1,874 12,133 1,692 11,275 1,394 8,714 1,506 11,744Ohio 1,405 10,610 1,777 13,755 1,529 11,566 1,700 13,431Oklahoma 45 219 66 424 23 120 56 461Oregon 290 1,937 335 2,552 367 2,839 418 3,426Pennsylvania 1,499 10,790 1,352 9,066 1,666 11,964 1,783 14,092Puerto Rico 5 21 6 19 3 10 7 20Rhode Island 904 11,427 821 10,568 613 8,055 724 10,352South Carolina 82 232 111 340 659 2,519 1,013 4,226Tennessee 80 414 71 412 150 1,017 187 1,077Texas 630 4,936 697 5,501 628 4,478 701 5,510Vermont 166 2,235 165 2,473 150 1,967 298 5,284Virginia 1,665 13,913 2,323 21,845 2,624 24,748 2,635 26,272Washington 3 13 234 2,341 222 2,087 319 3,093West Virginia 383 2,441 510 3,374 587 3,707 686 4,614Wisconsin 1,173 9,921 1,140 10,003 1,297 12,109 1,417 12,903Total 35,949 $310,878 37,827 $346,074 38,409 $350,688 43,189 $422,601
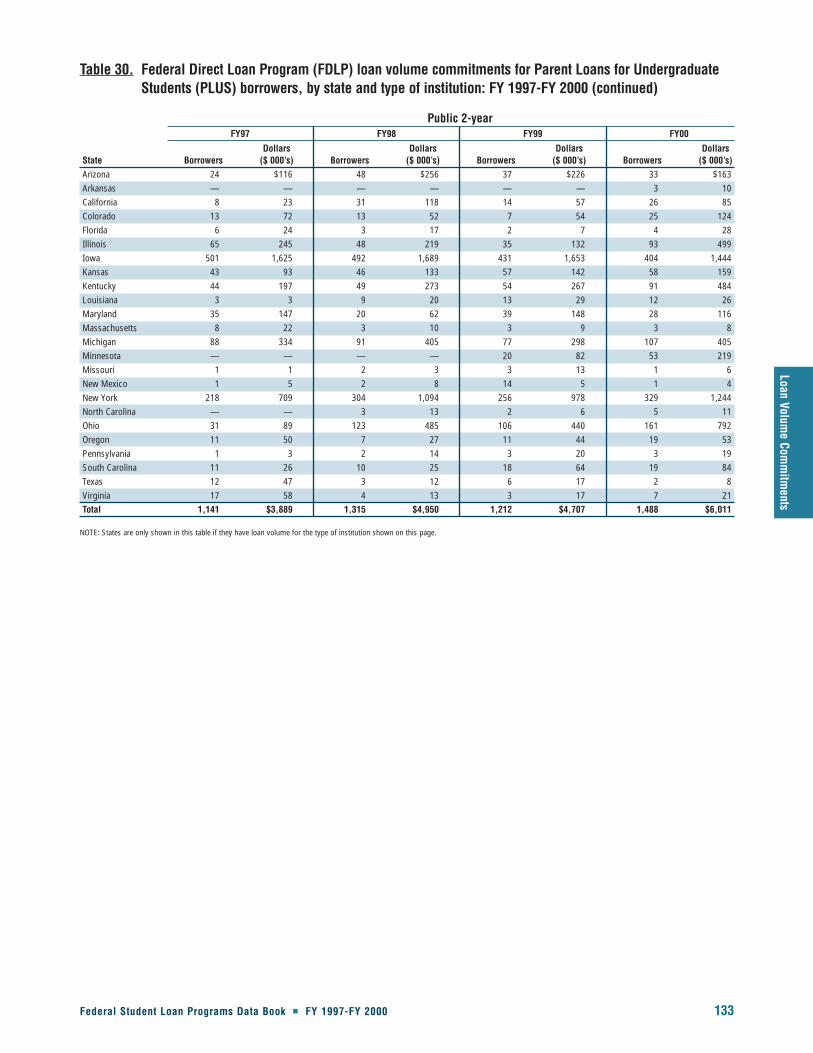
Federal Student Loan Programs Data Book � FY 1997-FY 2000 133
Loan Volume Com
mitm
ents
Table 30. Federal Direct Loan Program (FDLP) loan volume commitments for Parent Loans for UndergraduateStudents (PLUS) borrowers, by state and type of institution: FY 1997-FY 2000 (continued)
Public 2-yearFY97 FY98 FY99 FY00
Dollars Dollars Dollars DollarsState Borrowers ($ 000’s) Borrowers ($ 000’s) Borrowers ($ 000’s) Borrowers ($ 000’s)Arizona 24 $116 48 $256 37 $226 33 $163Arkansas — — — — — — 3 10California 8 23 31 118 14 57 26 85Colorado 13 72 13 52 7 54 25 124Florida 6 24 3 17 2 7 4 28Illinois 65 245 48 219 35 132 93 499Iowa 501 1,625 492 1,689 431 1,653 404 1,444Kansas 43 93 46 133 57 142 58 159Kentucky 44 197 49 273 54 267 91 484Louisiana 3 3 9 20 13 29 12 26Maryland 35 147 20 62 39 148 28 116Massachusetts 8 22 3 10 3 9 3 8Michigan 88 334 91 405 77 298 107 405Minnesota — — — — 20 82 53 219Missouri 1 1 2 3 3 13 1 6New Mexico 1 5 2 8 14 5 1 4New York 218 709 304 1,094 256 978 329 1,244North Carolina — — 3 13 2 6 5 11Ohio 31 89 123 485 106 440 161 792Oregon 11 50 7 27 11 44 19 53Pennsylvania 1 3 2 14 3 20 3 19South Carolina 11 26 10 25 18 64 19 84Texas 12 47 3 12 6 17 2 8Virginia 17 58 4 13 3 17 7 21Total 1,141 $3,889 1,315 $4,950 1,212 $4,707 1,488 $6,011
NOTE: States are only shown in this table if they have loan volume for the type of institution shown on this page.

134 Federal Student Loan Programs Data Book � FY 1997-FY 2000
Table 30. Federal Direct Loan Program (FDLP) loan volume commitments for Parent Loans for UndergraduateStudents (PLUS) borrowers, by state and type of institution: FY 1997-FY 2000 (continued)
Private 2-yearFY97 FY98 FY99 FY00
Dollars Dollars Dollars DollarsState Borrowers ($ 000’s) Borrowers ($ 000’s) Borrowers ($ 000’s) Borrowers ($ 000’s)Arizona — — 51 $146 125 $264 97 $391California 135 $582 237 1,103 145 682 32 100Florida — — — — 8 35 25 61Illinois 1 5 — — — — — —Iowa 2 9 — — — — — —Massachusetts 3 13 — — — — — —Mississippi 6 21 — — — — — —NewYork 19 39 9 46 2 16 2 10Ohio 31 147 11 45 10 31 — —Pennsylvania 173 1,011 232 1,389 191 992 192 1,256Tennessee — — — — 1 3 1 1Total 371 $1,827 540 $2,729 482 $2,023 349 $1,819
NOTE: States are only shown in this table if they have loan volume for the type of institution shown on this page.

Federal Student Loan Programs Data Book � FY 1997-FY 2000 135
Loan Volume Com
mitm
ents
Table 30. Federal Direct Loan Program (FDLP) loan volume commitments for Parent Loans for UndergraduateStudents (PLUS) borrowers, by state and type of institution: FY 1997-FY 2000 (continued)
ProprietaryFY97 FY98 FY99 FY00
Dollars Dollars Dollars DollarsState Borrowers ($ 000’s) Borrowers ($ 000’s) Borrowers ($ 000’s) Borrowers ($ 000’s)Alabama 40 $108 50 $195 136 $526 327 $1,360Arizona 304 1,105 946 4,221 1,461 7,661 963 5,435Arkansas — — — — — — 45 131California 1,776 10,215 2,460 17,987 2,552 17,677 3,025 22,576Colorado 243 1,569 129 714 80 380 296 1,112Connecticut 187 1,056 338 2,266 451 2,799 567 3,629Delaware 7 28 3 10 8 33 10 34District of Columbia 2 6 19 30 43 89 66 175Florida 850 4,801 781 4,232 816 4,644 782 4,247Georgia 485 2,798 634 4,280 654 4,667 457 3,345Hawaii — — — — — — 1 5Idaho 112 514 130 568 121 727 105 660Illinois 1,158 6,101 1,198 6,453 1,471 8,248 2,508 14,260Indiana 30 95 33 103 93 405 169 805Iowa 167 652 159 658 233 977 266 1,274Kansas 25 82 15 63 32 162 54 290Kentucky 486 3,809 232 1,385 204 1,501 230 1,790Louisiana 67 232 41 172 20 63 32 114Maine 1 4 — — 14 46 28 98Maryland 204 867 188 823 224 1,097 170 917Massachusetts 337 2,308 209 1,741 272 2,475 193 1,995Michigan 5 9 15 40 12 39 25 74Minnesota 322 1,780 386 2,510 326 1,869 266 1,762Mississippi 8 13 — — 1 1 4 5Missouri 106 513 165 938 231 1,138 333 1,786Nebraska 101 388 223 1,054 254 1,471 257 1,527Nevada 1 3 10 40 15 52 52 192New Hampshire 38 160 46 206 476 3,220 500 3,166New Jersey 709 3,096 777 3,585 663 3,152 596 2,891New Mexico 1 3 — — — — — —New York 515 2,588 455 2,052 558 2,664 738 3,933North Carolina 46 165 40 142 44 149 24 89North Dakota 128 646 12 33 — — — —Ohio 746 4,130 882 4,935 979 5,639 1,315 8,189Oklahoma 4 14 8 28 13 42 17 115Oregon 59 221 62 244 47 190 90 308Pennsylvania 1,419 7,850 1,704 9,975 1,790 9,449 1,753 10,137Rhode Island — — 7 65 31 187 9 37South Carolina 8 20 6 14 3 4 7 14South Dakota 164 865 191 811 112 556 54 251Tennessee 40 121 13 50 42 124 131 459Texas 700 3,416 630 3,144 968 4,928 1,121 5,775Utah 140 631 120 517 198 982 167 925Virginia 277 1,338 245 1,418 157 774 144 691Washington 12 53 — — 3 12 14 79West Virginia 22 288 12 165 18 227 41 517Wisconsin 111 552 93 452 189 1,030 224 1,289Wyoming 3 15 1 5 3 12 — —Total 12,167 $65,226 13,671 $78,324 16,019 $92,086 18,170 $108,467

136 Federal Student Loan Programs Data Book � FY 1997-FY 2000
Table 30. Federal Direct Loan Program (FDLP) loan volume commitments for Parent Loans for UndergraduateStudents (PLUS) borrowers, by state and type of institution: FY 1997-FY 2000 (continued)
TotalFY97 FY98 FY99 FY00
Dollars Dollars Dollars DollarsState Borrowers ($ 000’s) Borrowers ($ 000’s) Borrowers ($ 000’s) Borrowers ($ 000’s)Alabama 5,462 $33,132 4,562 $30,805 4,242 $25,587 4,011 $27,988Alaska — — 1 4 3 15 — —Arizona 1,014 5,361 1,698 8,534 2,181 11,689 1,635 9,488Arkansas 119 403 156 582 387 1,746 557 2,324California 13,354 93,274 14,982 108,349 14,157 102,576 16,213 126,261Colorado 4,628 39,009 4,218 37,616 4,228 38,455 5,763 45,449Connecticut 734 5,442 901 7,413 1,174 9,125 926 7,397Delaware 1,291 11,954 1,453 14,039 1,500 14,303 1,598 15,713District of Columbia 765 9,100 932 12,085 602 6,499 1,945 21,737Florida 2,877 16,939 4,052 29,053 4,584 35,380 4,875 36,527Georgia 7,183 47,403 8,063 54,966 6,793 48,295 6,318 50,412Hawaii — — — — — — 1 5Idaho 362 1,793 366 1,766 324 1,717 337 1,962Illinois 8,106 51,115 8,689 57,079 8,426 55,794 11,801 79,680Indiana 5,365 39,282 4,651 35,355 4,818 39,072 5,452 44,547Iowa 7,149 38,572 7,125 41,555 6,502 38,403 6,533 43,320Kansas 1,256 7,527 1,386 8,938 1,568 10,100 1,726 11,302Kentucky 1,406 9,256 1,227 7,952 1,153 7,476 1,322 9,295Louisiana 843 6,093 657 5,290 679 5,927 506 4,154Maine 184 1,917 270 3,006 285 2,972 218 2,172Maryland 2,912 22,561 3,405 27,372 3,663 31,242 3,743 28,744Massachusetts 7,386 66,917 7,049 71,638 6,048 57,808 6,606 73,535Michigan 10,941 67,333 11,535 72,079 10,647 68,896 11,153 72,699Minnesota 3,155 19,610 3,824 25,384 1,975 11,951 4,629 33,620Mississippi 288 757 162 429 264 699 236 688Missouri 2,931 16,059 3,428 19,360 3,892 22,070 4,596 26,947Montana 684 3,954 641 3,787 470 2,784 476 3,053Nebraska 938 3,941 989 4,688 1,264 6,392 1,635 8,598Nevada 493 3,255 623 4,218 572 3,958 709 4,967New Hampshire 245 2,783 187 2,015 633 5,538 703 6,833New Jersey 5,396 32,274 5,136 31,674 5,007 30,821 5,979 39,095New Mexico 3 7 2 8 14 5 191 974New York 12,803 91,578 12,753 94,183 12,694 96,820 13,308 106,861North Carolina 3,744 22,231 3,843 22,674 3,996 22,753 4,737 31,034North Dakota 128 646 12 33 — — — —Ohio 11,557 81,095 13,421 98,067 12,725 93,342 15,365 119,433Oklahoma 1,540 8,898 1,515 9,105 1,504 8,424 1,786 11,208Oregon 2,632 19,476 3,091 23,315 3,167 23,659 4,338 31,195Pennsylvania 3,092 19,654 3,291 20,444 3,650 22,425 3,732 25,503PuertoRico 5 21 6 19 3 10 7 20Rhode Island 1,555 16,836 1,636 17,752 1,288 13,476 1,774 20,417South Carolina 1,346 8,384 2,158 15,397 2,803 18,790 3,511 24,196South Dakota 164 865 191 811 112 556 54 251Tennessee 395 1,937 285 1,296 433 2,174 509 2,328Texas 1,626 9,559 2,237 14,961 2,330 14,035 2,787 18,019Utah 140 631 120 517 198 982 167 925Vermont 2,801 23,275 2,895 25,835 2,180 19,386 1,424 12,984Virgin Islands 1 1 8 49 5 20 17 51Virginia 8,717 60,049 9,281 69,353 8,825 65,704 9,051 72,067Washington 2,756 18,141 3,276 24,589 3,308 24,423 4,608 34,812West Virginia 2,312 14,618 2,836 18,413 3,286 21,817 3,492 23,664Wisconsin 1,940 13,143 1,945 13,694 2,102 15,938 2,479 18,247Wyoming 3 15 1 5 3 12 — —Total 156,729 $1,068,076 167,170 $1,197,548 162,665 $1,162,042 185,539 $1,392,701
—Not applicable.
NOTES: States are only shown in this table if they have loan volume for the type of institution shown on that page. Totals do not include Consolidation loan data. The loan volume reported in this tableincludes some loans that later may be canceled. Details may not add to totals due to rounding. Calculations are based on numbers before rounding. 0 indicates a number less than 500.
SOURCE: U.S. Department of Education, Office of Postsecondary Education, National Student Loan Data System.
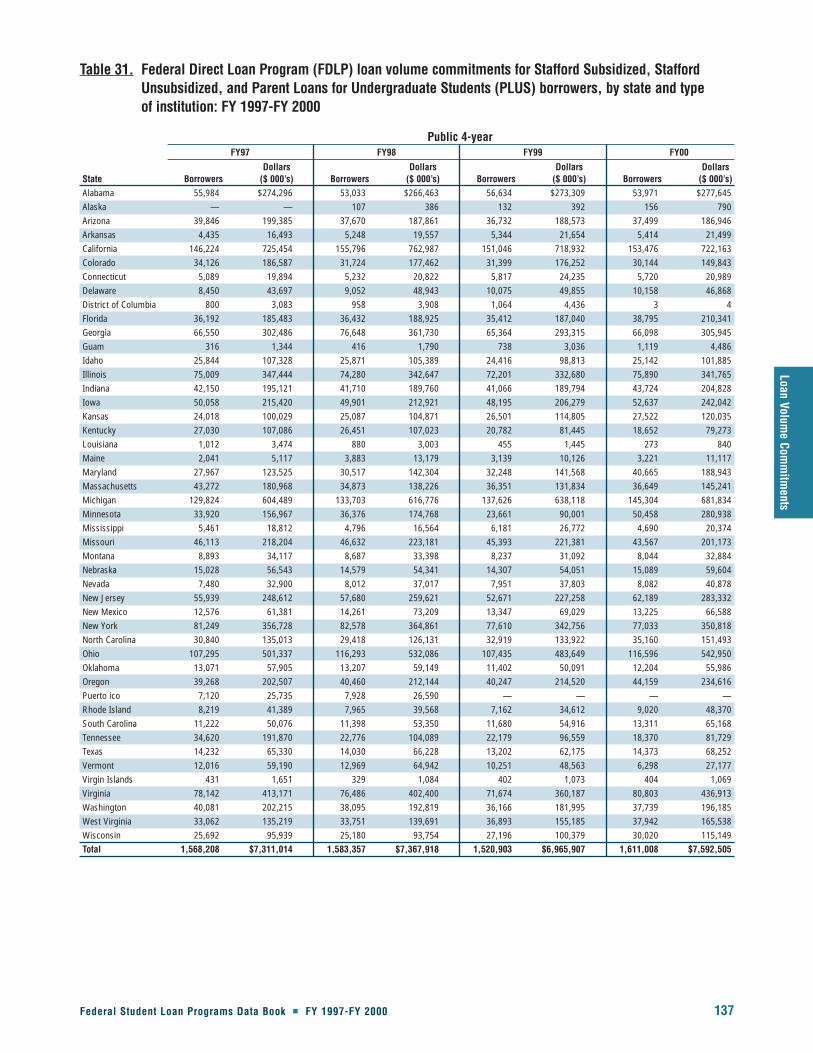
Federal Student Loan Programs Data Book � FY 1997-FY 2000 137
Loan Volume Com
mitm
ents
Table 31. Federal Direct Loan Program (FDLP) loan volume commitments for Stafford Subsidized, StaffordUnsubsidized, and Parent Loans for Undergraduate Students (PLUS) borrowers, by state and type of institution: FY 1997-FY 2000
Public 4-yearFY97 FY98 FY99 FY00
Dollars Dollars Dollars DollarsState Borrowers ($ 000’s) Borrowers ($ 000’s) Borrowers ($ 000’s) Borrowers ($ 000’s)Alabama 55,984 $274,296 53,033 $266,463 56,634 $273,309 53,971 $277,645Alaska — — 107 386 132 392 156 790Arizona 39,846 199,385 37,670 187,861 36,732 188,573 37,499 186,946Arkansas 4,435 16,493 5,248 19,557 5,344 21,654 5,414 21,499California 146,224 725,454 155,796 762,987 151,046 718,932 153,476 722,163Colorado 34,126 186,587 31,724 177,462 31,399 176,252 30,144 149,843Connecticut 5,089 19,894 5,232 20,822 5,817 24,235 5,720 20,989Delaware 8,450 43,697 9,052 48,943 10,075 49,855 10,158 46,868District of Columbia 800 3,083 958 3,908 1,064 4,436 3 4Florida 36,192 185,483 36,432 188,925 35,412 187,040 38,795 210,341Georgia 66,550 302,486 76,648 361,730 65,364 293,315 66,098 305,945Guam 316 1,344 416 1,790 738 3,036 1,119 4,486Idaho 25,844 107,328 25,871 105,389 24,416 98,813 25,142 101,885Illinois 75,009 347,444 74,280 342,647 72,201 332,680 75,890 341,765Indiana 42,150 195,121 41,710 189,760 41,066 189,794 43,724 204,828Iowa 50,058 215,420 49,901 212,921 48,195 206,279 52,637 242,042Kansas 24,018 100,029 25,087 104,871 26,501 114,805 27,522 120,035Kentucky 27,030 107,086 26,451 107,023 20,782 81,445 18,652 79,273Louisiana 1,012 3,474 880 3,003 455 1,445 273 840Maine 2,041 5,117 3,883 13,179 3,139 10,126 3,221 11,117Maryland 27,967 123,525 30,517 142,304 32,248 141,568 40,665 188,943Massachusetts 43,272 180,968 34,873 138,226 36,351 131,834 36,649 145,241Michigan 129,824 604,489 133,703 616,776 137,626 638,118 145,304 681,834Minnesota 33,920 156,967 36,376 174,768 23,661 90,001 50,458 280,938Mississippi 5,461 18,812 4,796 16,564 6,181 26,772 4,690 20,374Missouri 46,113 218,204 46,632 223,181 45,393 221,381 43,567 201,173Montana 8,893 34,117 8,687 33,398 8,237 31,092 8,044 32,884Nebraska 15,028 56,543 14,579 54,341 14,307 54,051 15,089 59,604Nevada 7,480 32,900 8,012 37,017 7,951 37,803 8,082 40,878New Jersey 55,939 248,612 57,680 259,621 52,671 227,258 62,189 283,332New Mexico 12,576 61,381 14,261 73,209 13,347 69,029 13,225 66,588New York 81,249 356,728 82,578 364,861 77,610 342,756 77,033 350,818North Carolina 30,840 135,013 29,418 126,131 32,919 133,922 35,160 151,493Ohio 107,295 501,337 116,293 532,086 107,435 483,649 116,596 542,950Oklahoma 13,071 57,905 13,207 59,149 11,402 50,091 12,204 55,986Oregon 39,268 202,507 40,460 212,144 40,247 214,520 44,159 234,616Puerto ico 7,120 25,735 7,928 26,590 — — — —Rhode Island 8,219 41,389 7,965 39,568 7,162 34,612 9,020 48,370South Carolina 11,222 50,076 11,398 53,350 11,680 54,916 13,311 65,168Tennessee 34,620 191,870 22,776 104,089 22,179 96,559 18,370 81,729Texas 14,232 65,330 14,030 66,228 13,202 62,175 14,373 68,252Vermont 12,016 59,190 12,969 64,942 10,251 48,563 6,298 27,177Virgin Islands 431 1,651 329 1,084 402 1,073 404 1,069Virginia 78,142 413,171 76,486 402,400 71,674 360,187 80,803 436,913Washington 40,081 202,215 38,095 192,819 36,166 181,995 37,739 196,185West Virginia 33,062 135,219 33,751 139,691 36,893 155,185 37,942 165,538Wisconsin 25,692 95,939 25,180 93,754 27,196 100,379 30,020 115,149Total 1,568,208 $7,311,014 1,583,357 $7,367,918 1,520,903 $6,965,907 1,611,008 $7,592,505
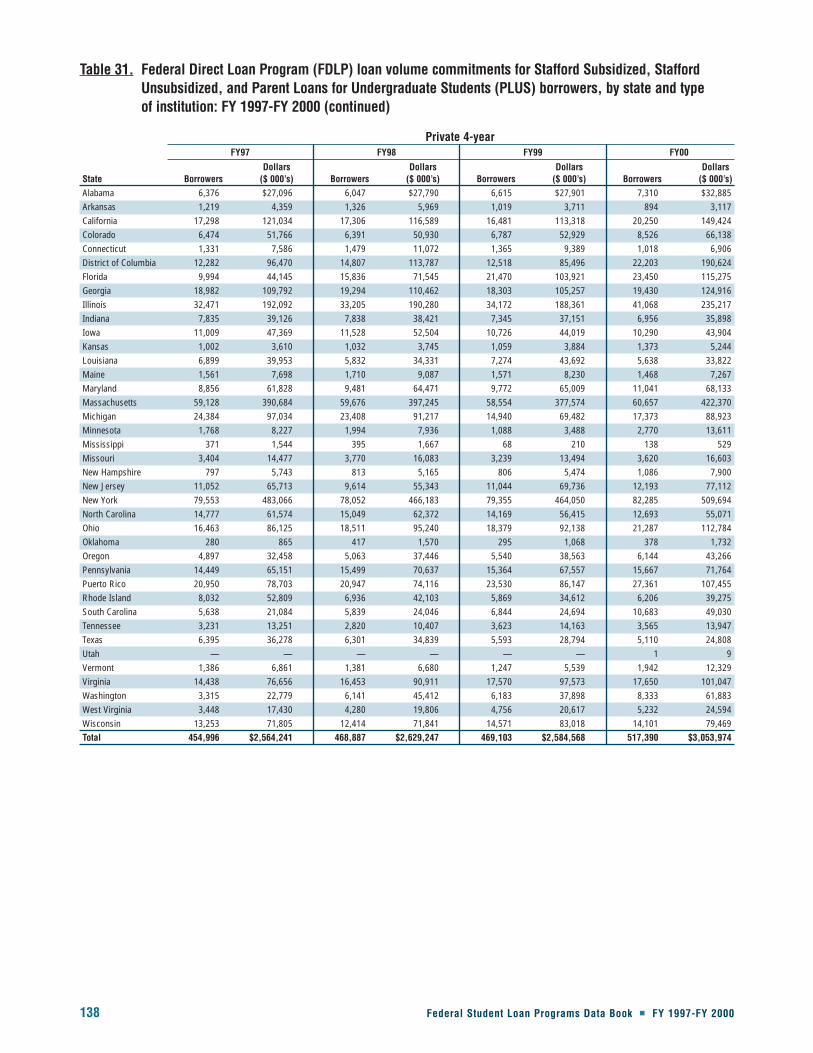
138 Federal Student Loan Programs Data Book � FY 1997-FY 2000
Table 31. Federal Direct Loan Program (FDLP) loan volume commitments for Stafford Subsidized, StaffordUnsubsidized, and Parent Loans for Undergraduate Students (PLUS) borrowers, by state and type of institution: FY 1997-FY 2000 (continued)
Private 4-yearFY97 FY98 FY99 FY00
Dollars Dollars Dollars DollarsState Borrowers ($ 000’s) Borrowers ($ 000’s) Borrowers ($ 000’s) Borrowers ($ 000’s)Alabama 6,376 $27,096 6,047 $27,790 6,615 $27,901 7,310 $32,885Arkansas 1,219 4,359 1,326 5,969 1,019 3,711 894 3,117California 17,298 121,034 17,306 116,589 16,481 113,318 20,250 149,424Colorado 6,474 51,766 6,391 50,930 6,787 52,929 8,526 66,138Connecticut 1,331 7,586 1,479 11,072 1,365 9,389 1,018 6,906District of Columbia 12,282 96,470 14,807 113,787 12,518 85,496 22,203 190,624Florida 9,994 44,145 15,836 71,545 21,470 103,921 23,450 115,275Georgia 18,982 109,792 19,294 110,462 18,303 105,257 19,430 124,916Illinois 32,471 192,092 33,205 190,280 34,172 188,361 41,068 235,217Indiana 7,835 39,126 7,838 38,421 7,345 37,151 6,956 35,898Iowa 11,009 47,369 11,528 52,504 10,726 44,019 10,290 43,904Kansas 1,002 3,610 1,032 3,745 1,059 3,884 1,373 5,244Louisiana 6,899 39,953 5,832 34,331 7,274 43,692 5,638 33,822Maine 1,561 7,698 1,710 9,087 1,571 8,230 1,468 7,267Maryland 8,856 61,828 9,481 64,471 9,772 65,009 11,041 68,133Massachusetts 59,128 390,684 59,676 397,245 58,554 377,574 60,657 422,370Michigan 24,384 97,034 23,408 91,217 14,940 69,482 17,373 88,923Minnesota 1,768 8,227 1,994 7,936 1,088 3,488 2,770 13,611Mississippi 371 1,544 395 1,667 68 210 138 529Missouri 3,404 14,477 3,770 16,083 3,239 13,494 3,620 16,603New Hampshire 797 5,743 813 5,165 806 5,474 1,086 7,900New Jersey 11,052 65,713 9,614 55,343 11,044 69,736 12,193 77,112New York 79,553 483,066 78,052 466,183 79,355 464,050 82,285 509,694North Carolina 14,777 61,574 15,049 62,372 14,169 56,415 12,693 55,071Ohio 16,463 86,125 18,511 95,240 18,379 92,138 21,287 112,784Oklahoma 280 865 417 1,570 295 1,068 378 1,732Oregon 4,897 32,458 5,063 37,446 5,540 38,563 6,144 43,266Pennsylvania 14,449 65,151 15,499 70,637 15,364 67,557 15,667 71,764Puerto Rico 20,950 78,703 20,947 74,116 23,530 86,147 27,361 107,455Rhode Island 8,032 52,809 6,936 42,103 5,869 34,612 6,206 39,275South Carolina 5,638 21,084 5,839 24,046 6,844 24,694 10,683 49,030Tennessee 3,231 13,251 2,820 10,407 3,623 14,163 3,565 13,947Texas 6,395 36,278 6,301 34,839 5,593 28,794 5,110 24,808Utah — — — — — — 1 9Vermont 1,386 6,861 1,381 6,680 1,247 5,539 1,942 12,329Virginia 14,438 76,656 16,453 90,911 17,570 97,573 17,650 101,047Washington 3,315 22,779 6,141 45,412 6,183 37,898 8,333 61,883West Virginia 3,448 17,430 4,280 19,806 4,756 20,617 5,232 24,594Wisconsin 13,253 71,805 12,414 71,841 14,571 83,018 14,101 79,469Total 454,996 $2,564,241 468,887 $2,629,247 469,103 $2,584,568 517,390 $3,053,974
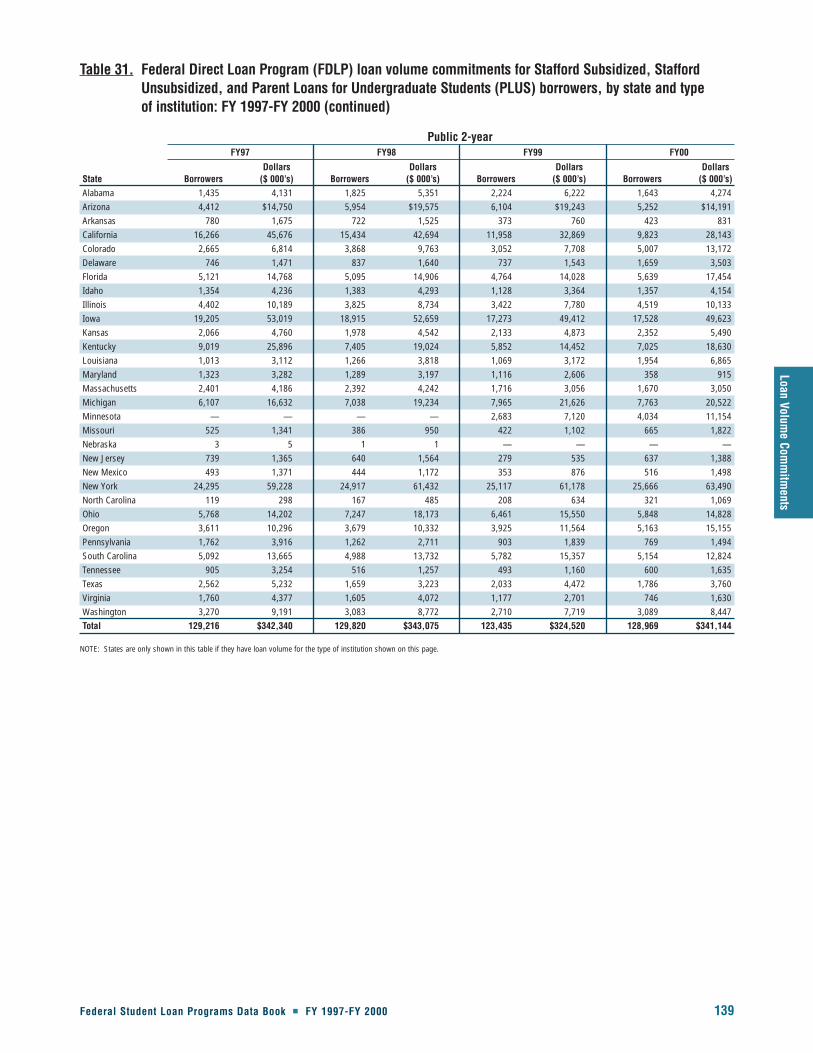
Federal Student Loan Programs Data Book � FY 1997-FY 2000 139
Loan Volume Com
mitm
ents
Table 31. Federal Direct Loan Program (FDLP) loan volume commitments for Stafford Subsidized, StaffordUnsubsidized, and Parent Loans for Undergraduate Students (PLUS) borrowers, by state and type of institution: FY 1997-FY 2000 (continued)
Public 2-yearFY97 FY98 FY99 FY00
Dollars Dollars Dollars DollarsState Borrowers ($ 000’s) Borrowers ($ 000’s) Borrowers ($ 000’s) Borrowers ($ 000’s)Alabama 1,435 4,131 1,825 5,351 2,224 6,222 1,643 4,274Arizona 4,412 $14,750 5,954 $19,575 6,104 $19,243 5,252 $14,191Arkansas 780 1,675 722 1,525 373 760 423 831California 16,266 45,676 15,434 42,694 11,958 32,869 9,823 28,143Colorado 2,665 6,814 3,868 9,763 3,052 7,708 5,007 13,172Delaware 746 1,471 837 1,640 737 1,543 1,659 3,503Florida 5,121 14,768 5,095 14,906 4,764 14,028 5,639 17,454Idaho 1,354 4,236 1,383 4,293 1,128 3,364 1,357 4,154Illinois 4,402 10,189 3,825 8,734 3,422 7,780 4,519 10,133Iowa 19,205 53,019 18,915 52,659 17,273 49,412 17,528 49,623Kansas 2,066 4,760 1,978 4,542 2,133 4,873 2,352 5,490Kentucky 9,019 25,896 7,405 19,024 5,852 14,452 7,025 18,630Louisiana 1,013 3,112 1,266 3,818 1,069 3,172 1,954 6,865Maryland 1,323 3,282 1,289 3,197 1,116 2,606 358 915Massachusetts 2,401 4,186 2,392 4,242 1,716 3,056 1,670 3,050Michigan 6,107 16,632 7,038 19,234 7,965 21,626 7,763 20,522Minnesota — — — — 2,683 7,120 4,034 11,154Missouri 525 1,341 386 950 422 1,102 665 1,822Nebraska 3 5 1 1 — — — —New Jersey 739 1,365 640 1,564 279 535 637 1,388New Mexico 493 1,371 444 1,172 353 876 516 1,498New York 24,295 59,228 24,917 61,432 25,117 61,178 25,666 63,490North Carolina 119 298 167 485 208 634 321 1,069Ohio 5,768 14,202 7,247 18,173 6,461 15,550 5,848 14,828Oregon 3,611 10,296 3,679 10,332 3,925 11,564 5,163 15,155Pennsylvania 1,762 3,916 1,262 2,711 903 1,839 769 1,494South Carolina 5,092 13,665 4,988 13,732 5,782 15,357 5,154 12,824Tennessee 905 3,254 516 1,257 493 1,160 600 1,635Texas 2,562 5,232 1,659 3,223 2,033 4,472 1,786 3,760Virginia 1,760 4,377 1,605 4,072 1,177 2,701 746 1,630Washington 3,270 9,191 3,083 8,772 2,710 7,719 3,089 8,447Total 129,216 $342,340 129,820 $343,075 123,435 $324,520 128,969 $341,144
NOTE: States are only shown in this table if they have loan volume for the type of institution shown on this page.

140 Federal Student Loan Programs Data Book � FY 1997-FY 2000
Table 31. Federal Direct Loan Program (FDLP) loan volume commitments for Stafford Subsidized, StaffordUnsubsidized, and Parent Loans for Undergraduate Students (PLUS) borrowers, by state and type of institution: FY 1997-FY 2000 (continued)
Private 2-yearFY97 FY98 FY99 FY00
Dollars Dollars Dollars DollarsState Borrowers ($ 000’s) Borrowers ($ 000’s) Borrowers ($ 000’s) Borrowers ($ 000’s)Arizona 476 $996 2,251 $4,844 3,143 $7,489 2,182 $7,455California 2,251 7,701 2,612 8,910 1,731 5,863 687 1,608Florida — — 262 628 421 1,324 881 2,081Illinois 110 218 10 17 — — — —Iowa 18 50 — — — — — —Massachusetts 94 236 — — — — — —Michigan — — — — — — 11 31Mississippi 60 116 — — — — — —New York 460 695 247 487 51 178 72 217Ohio 397 1,293 294 1,032 364 1,116 330 1,057Pennsylvania 1,620 5,436 1,967 6,845 1,604 4,842 1,637 5,392Puerto Rico 144 494 21 57 — — — —Tennessee 4 13 30 71 30 92 72 169Washington 124 378 210 659 290 919 320 781Total 5,759 $17,626 7,904 $23,548 7,634 $21,822 6,193 $18,789
NOTE: States are only shown in this table if they have loan volume for the type of institution shown on this page.
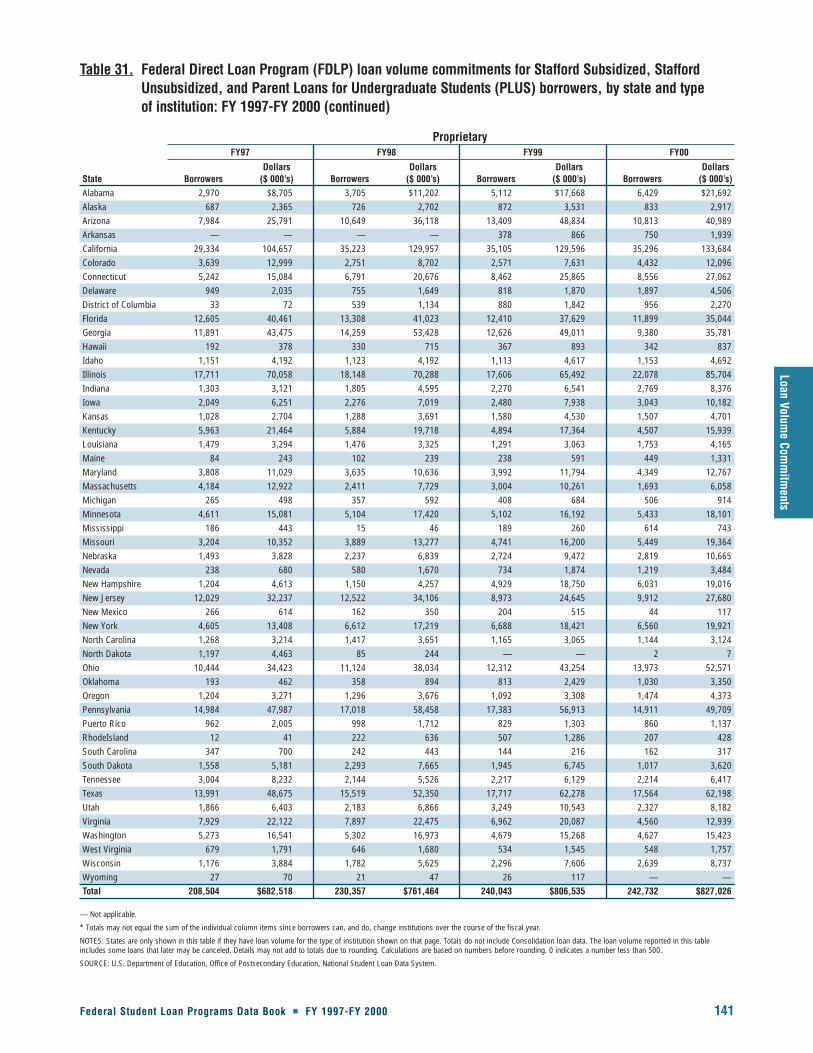
Federal Student Loan Programs Data Book � FY 1997-FY 2000 141
Loan Volume Com
mitm
ents
Table 31. Federal Direct Loan Program (FDLP) loan volume commitments for Stafford Subsidized, StaffordUnsubsidized, and Parent Loans for Undergraduate Students (PLUS) borrowers, by state and type of institution: FY 1997-FY 2000 (continued)
ProprietaryFY97 FY98 FY99 FY00
Dollars Dollars Dollars DollarsState Borrowers ($ 000’s) Borrowers ($ 000’s) Borrowers ($ 000’s) Borrowers ($ 000’s)Alabama 2,970 $8,705 3,705 $11,202 5,112 $17,668 6,429 $21,692Alaska 687 2,365 726 2,702 872 3,531 833 2,917Arizona 7,984 25,791 10,649 36,118 13,409 48,834 10,813 40,989Arkansas — — — — 378 866 750 1,939California 29,334 104,657 35,223 129,957 35,105 129,596 35,296 133,684Colorado 3,639 12,999 2,751 8,702 2,571 7,631 4,432 12,096Connecticut 5,242 15,084 6,791 20,676 8,462 25,865 8,556 27,062Delaware 949 2,035 755 1,649 818 1,870 1,897 4,506District of Columbia 33 72 539 1,134 880 1,842 956 2,270Florida 12,605 40,461 13,308 41,023 12,410 37,629 11,899 35,044Georgia 11,891 43,475 14,259 53,428 12,626 49,011 9,380 35,781Hawaii 192 378 330 715 367 893 342 837Idaho 1,151 4,192 1,123 4,192 1,113 4,617 1,153 4,692Illinois 17,711 70,058 18,148 70,288 17,606 65,492 22,078 85,704Indiana 1,303 3,121 1,805 4,595 2,270 6,541 2,769 8,376Iowa 2,049 6,251 2,276 7,019 2,480 7,938 3,043 10,182Kansas 1,028 2,704 1,288 3,691 1,580 4,530 1,507 4,701Kentucky 5,963 21,464 5,884 19,718 4,894 17,364 4,507 15,939Louisiana 1,479 3,294 1,476 3,325 1,291 3,063 1,753 4,165Maine 84 243 102 239 238 591 449 1,331Maryland 3,808 11,029 3,635 10,636 3,992 11,794 4,349 12,767Massachusetts 4,184 12,922 2,411 7,729 3,004 10,261 1,693 6,058Michigan 265 498 357 592 408 684 506 914Minnesota 4,611 15,081 5,104 17,420 5,102 16,192 5,433 18,101Mississippi 186 443 15 46 189 260 614 743Missouri 3,204 10,352 3,889 13,277 4,741 16,200 5,449 19,364Nebraska 1,493 3,828 2,237 6,839 2,724 9,472 2,819 10,665Nevada 238 680 580 1,670 734 1,874 1,219 3,484New Hampshire 1,204 4,613 1,150 4,257 4,929 18,750 6,031 19,016New Jersey 12,029 32,237 12,522 34,106 8,973 24,645 9,912 27,680New Mexico 266 614 162 350 204 515 44 117New York 4,605 13,408 6,612 17,219 6,688 18,421 6,560 19,921North Carolina 1,268 3,214 1,417 3,651 1,165 3,065 1,144 3,124North Dakota 1,197 4,463 85 244 — — 2 7Ohio 10,444 34,423 11,124 38,034 12,312 43,254 13,973 52,571Oklahoma 193 462 358 894 813 2,429 1,030 3,350Oregon 1,204 3,271 1,296 3,676 1,092 3,308 1,474 4,373Pennsylvania 14,984 47,987 17,018 58,458 17,383 56,913 14,911 49,709Puerto Rico 962 2,005 998 1,712 829 1,303 860 1,137RhodeIsland 12 41 222 636 507 1,286 207 428South Carolina 347 700 242 443 144 216 162 317South Dakota 1,558 5,181 2,293 7,665 1,945 6,745 1,017 3,620Tennessee 3,004 8,232 2,144 5,526 2,217 6,129 2,214 6,417Texas 13,991 48,675 15,519 52,350 17,717 62,278 17,564 62,198Utah 1,866 6,403 2,183 6,866 3,249 10,543 2,327 8,182Virginia 7,929 22,122 7,897 22,475 6,962 20,087 4,560 12,939Washington 5,273 16,541 5,302 16,973 4,679 15,268 4,627 15,423West Virginia 679 1,791 646 1,680 534 1,545 548 1,757Wisconsin 1,176 3,884 1,782 5,625 2,296 7,606 2,639 8,737Wyoming 27 70 21 47 26 117 — —Total 208,504 $682,518 230,357 $761,464 240,043 $806,535 242,732 $827,026
— Not applicable.
* Totals may not equal the sum of the individual column items since borrowers can, and do, change institutions over the course of the fiscal year.
NOTES: States are only shown in this table if they have loan volume for the type of institution shown on that page. Totals do not include Consolidation loan data. The loan volume reported in this tableincludes some loans that later may be canceled. Details may not add to totals due to rounding. Calculations are based on numbers before rounding. 0 indicates a number less than 500.
SOURCE: U.S. Department of Education, Office of Postsecondary Education, National Student Loan Data System.
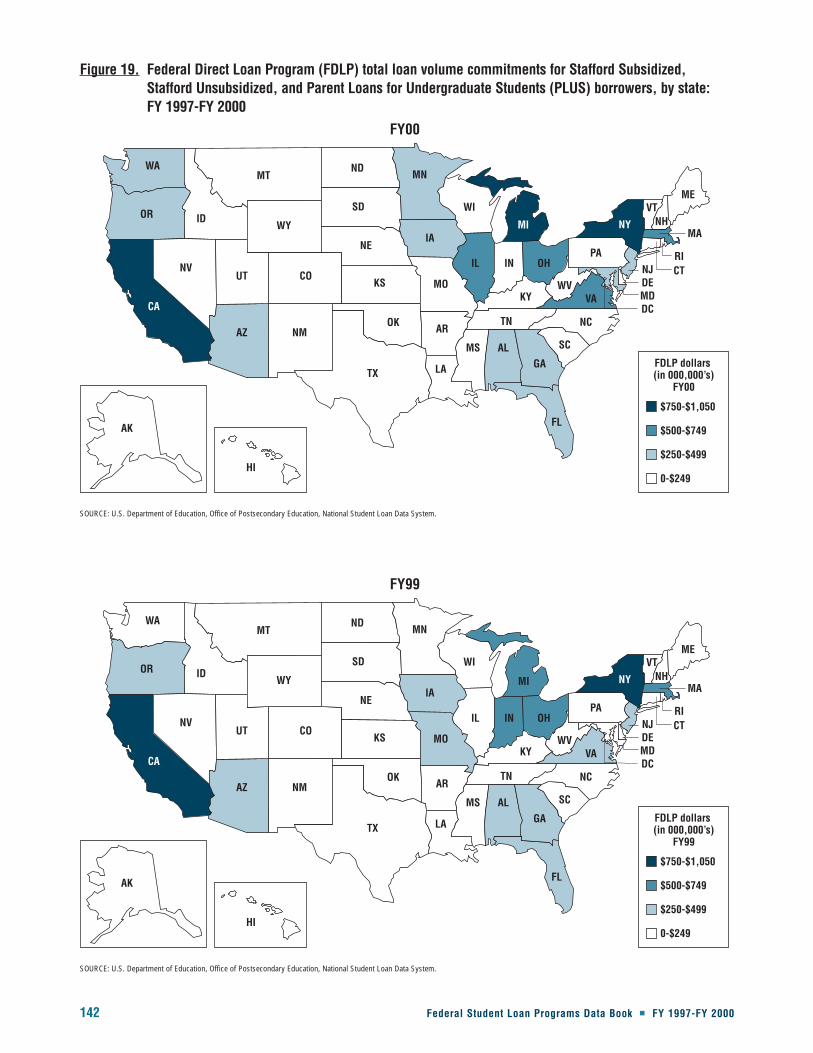
142 Federal Student Loan Programs Data Book � FY 1997-FY 2000
$750-$1,050
$500-$749
$250-$499
0-$249
FDLP dollars (in 000,000’s)
FY00
FY00
WA
AK
HI
OR
NVUT
AZ
CO
NM
WYID
MTND
MN
WI
MI
IL
KY
TN
MS ALGA
FL
SC
NC
VAWV
IN OHPA
NJDEMDDC
NY
ME
MA
RICT
VTNH
IA
MO
LA
AR
SD
NE
KS
OK
TX
CA
$750-$1,050
$500-$749
$250-$499
0-$249
FDLP dollars (in 000,000’s)
FY99
FY99
WA
AK
HI
OR
NVUT
AZ
CO
NM
WYID
MTND
MN
WI
MI
IL
KY
TN
MS ALGA
FL
SC
NC
VAWV
IN OHPA
NJDEMDDC
NY
ME
MA
RICT
VTNH
IA
MO
LA
AR
SD
NE
KS
OK
TX
CA
SOURCE: U.S. Department of Education, Office of Postsecondary Education, National Student Loan Data System.
SOURCE: U.S. Department of Education, Office of Postsecondary Education, National Student Loan Data System.
Figure 19. Federal Direct Loan Program (FDLP) total loan volume commitments for Stafford Subsidized,Stafford Unsubsidized, and Parent Loans for Undergraduate Students (PLUS) borrowers, by state: FY 1997-FY 2000
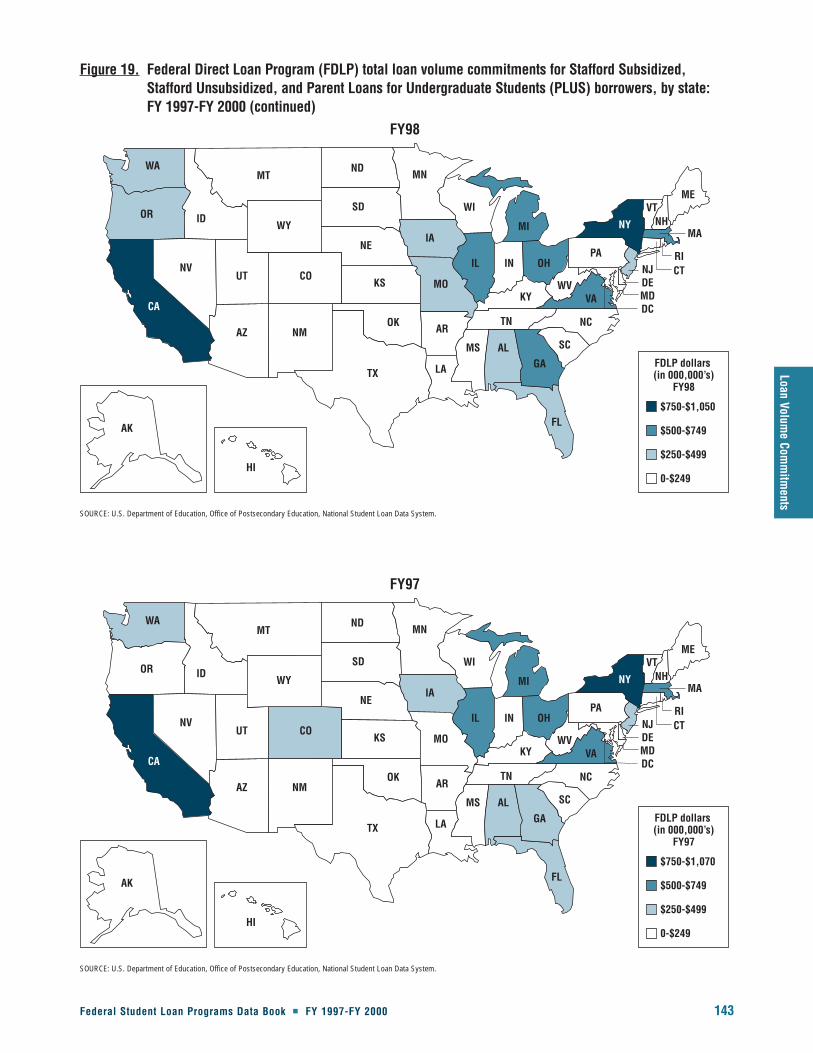
Loan Volume Com
mitm
ents
Federal Student Loan Programs Data Book � FY 1997-FY 2000 143
$750-$1,050
$500-$749
$250-$499
0-$249
FDLP dollars (in 000,000’s)
FY98
FY98
WA
AK
HI
OR
NVUT
AZ
CO
NM
WYID
MTND
MN
WI
MI
IL
KY
TN
MS ALGA
FL
SC
NC
VAWV
IN OHPA
NJDEMDDC
NY
ME
MA
RICT
VTNH
IA
MO
LA
AR
SD
NE
KS
OK
TX
CA
$750-$1,070
$500-$749
$250-$499
0-$249
FDLP dollars (in 000,000’s)
FY97
FY97
WA
AK
HI
OR
NVUT
AZ
CO
NM
WYID
MTND
MN
WI
MI
IL
KY
TN
MS ALGA
FL
SC
NC
VAWV
IN OHPA
NJDEMDDC
NY
ME
MA
RICT
VTNH
IA
MO
LA
AR
SD
NE
KS
OK
TX
CA
SOURCE: U.S. Department of Education, Office of Postsecondary Education, National Student Loan Data System.
SOURCE: U.S. Department of Education, Office of Postsecondary Education, National Student Loan Data System.
Figure 19. Federal Direct Loan Program (FDLP) total loan volume commitments for Stafford Subsidized,Stafford Unsubsidized, and Parent Loans for Undergraduate Students (PLUS) borrowers, by state: FY 1997-FY 2000 (continued)
144 Federal Student Loan Programs Data Book � FY 1997-FY 2000
These tables show summaries of loan volume for Stafford Subsidized, Stafford Unsubsidized, and PLUS loans for
the 50 states, the District of Columbia, and three U.S. territories. The percent change and percent share of total,
rank, and rank comparison for each state are shown. (A summary of FDLP loan volume is presented in table 6.).
(See also figure 20 which follows tables 32-35.)
� Total FDLP loan volume commitments was between $11 billion and $12 billion from FY 1997 to FY 2000.
California held the largest share of FDLP dollar volume each year with 9.2, 9.5, 9.3, and 8.7 percent,
respectively (see table 35).
� Five states increased their FDLP dollar volume commitments by more than 70 percent from FY 1997 to
FY 2000. Two states (Minnesota and New Hampshire), and the District of Columbia increased FDLP dollar
volume commitments by 79.6, 159.9, and 93.6 percent, respectively. Guam and Hawaii increased FDLP
dollar volume commitments by 233.7 and 121.3 percent, respectively. However, they participated at such
low levels that their proportion of FDLP dollar volume was less than one-tenth of one percent each year
(see table 35).
� Five states with the highest FDLP dollar volume maintained their positions from FY 1997 to FY 2000.
California, New York, Michigan, Ohio, and Illinois ranked one through five, respectively, in FDLP dollar
volume each year from FY 1997 to FY 2000. In FY 2000, California committed $1.0 billion and New York
$0.9 billion. Michigan, Ohio, and Illinois committed $0.8, $0.7, and $0.7 billion, respectively, in FDLP
dollar volume (see table 35).
Tables 32-35. Federal Direct Loan Program (FDLP) loan volume commitments for Stafford Subsidized, Stafford Unsubsidized, and Parent Loans forUndergraduate Students (PLUS) loans, by state: FY 1997-FY 2000
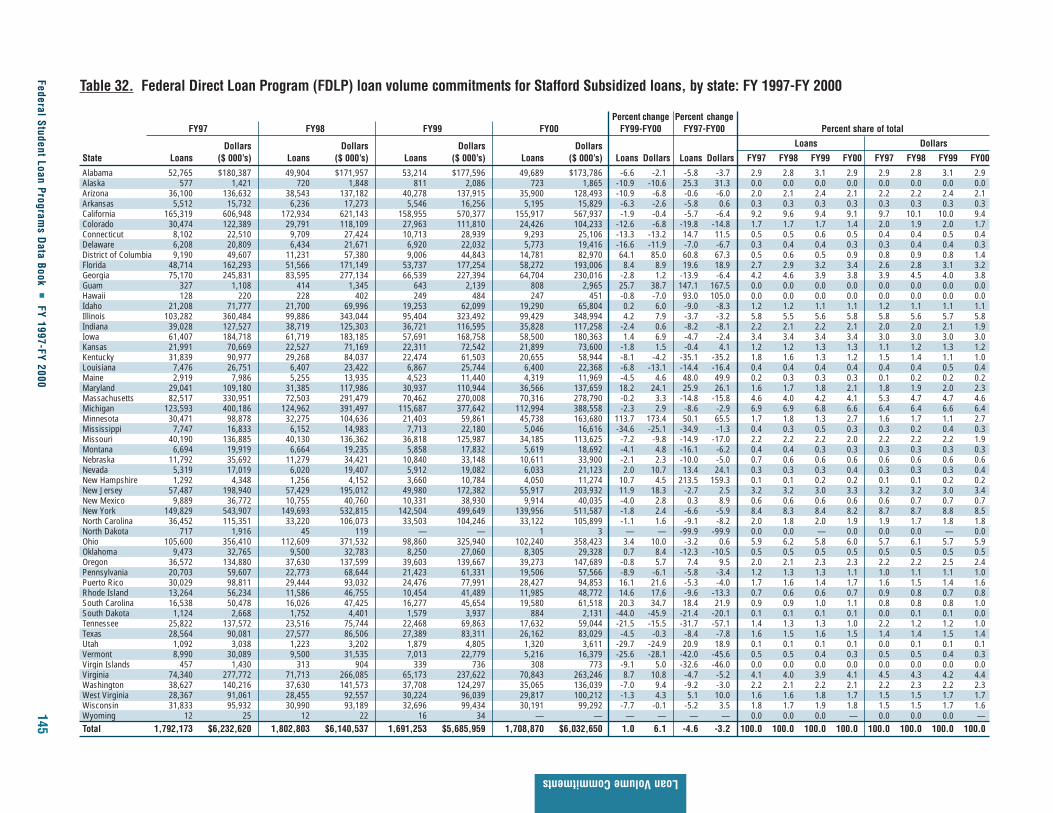
Federal Student Loan Programs D
ata Book �
FY 1997-FY 2000145
Loan Volume Commitments
Table 32. Federal Direct Loan Program (FDLP) loan volume commitments for Stafford Subsidized loans, by state: FY 1997-FY 2000
Percent change Percent changeFY97 FY98 FY99 FY00 FY99-FY00 FY97-FY00 Percent share of total
Dollars Dollars Dollars Dollars Loans Dollars
State Loans ($ 000’s) Loans ($ 000’s) Loans ($ 000’s) Loans ($ 000’s) Loans Dollars Loans Dollars FY97 FY98 FY99 FY00 FY97 FY98 FY99 FY00
Alabama 52,765 $180,387 49,904 $171,957 53,214 $177,596 49,689 $173,786 -6.6 -2.1 -5.8 -3.7 2.9 2.8 3.1 2.9 2.9 2.8 3.1 2.9Alaska 577 1,421 720 1,848 811 2,086 723 1,865 -10.9 -10.6 25.3 31.3 0.0 0.0 0.0 0.0 0.0 0.0 0.0 0.0Arizona 36,100 136,632 38,543 137,182 40,278 137,915 35,900 128,493 -10.9 -6.8 -0.6 -6.0 2.0 2.1 2.4 2.1 2.2 2.2 2.4 2.1Arkansas 5,512 15,732 6,236 17,273 5,546 16,256 5,195 15,829 -6.3 -2.6 -5.8 0.6 0.3 0.3 0.3 0.3 0.3 0.3 0.3 0.3California 165,319 606,948 172,934 621,143 158,955 570,377 155,917 567,937 -1.9 -0.4 -5.7 -6.4 9.2 9.6 9.4 9.1 9.7 10.1 10.0 9.4Colorado 30,474 122,389 29,791 118,109 27,963 111,810 24,426 104,233 -12.6 -6.8 -19.8 -14.8 1.7 1.7 1.7 1.4 2.0 1.9 2.0 1.7Connecticut 8,102 22,510 9,709 27,424 10,713 28,939 9,293 25,106 -13.3 -13.2 14.7 11.5 0.5 0.5 0.6 0.5 0.4 0.4 0.5 0.4Delaware 6,208 20,809 6,434 21,671 6,920 22,032 5,773 19,416 -16.6 -11.9 -7.0 -6.7 0.3 0.4 0.4 0.3 0.3 0.4 0.4 0.3District of Columbia 9,190 49,607 11,231 57,380 9,006 44,843 14,781 82,970 64.1 85.0 60.8 67.3 0.5 0.6 0.5 0.9 0.8 0.9 0.8 1.4Florida 48,714 162,293 51,566 171,149 53,737 177,254 58,272 193,006 8.4 8.9 19.6 18.9 2.7 2.9 3.2 3.4 2.6 2.8 3.1 3.2Georgia 75,170 245,831 83,595 277,134 66,539 227,394 64,704 230,016 -2.8 1.2 -13.9 -6.4 4.2 4.6 3.9 3.8 3.9 4.5 4.0 3.8Guam 327 1,108 414 1,345 643 2,139 808 2,965 25.7 38.7 147.1 167.5 0.0 0.0 0.0 0.0 0.0 0.0 0.0 0.0Hawaii 128 220 228 402 249 484 247 451 -0.8 -7.0 93.0 105.0 0.0 0.0 0.0 0.0 0.0 0.0 0.0 0.0Idaho 21,208 71,777 21,700 69,996 19,253 62,099 19,290 65,804 0.2 6.0 -9.0 -8.3 1.2 1.2 1.1 1.1 1.2 1.1 1.1 1.1Illinois 103,282 360,484 99,886 343,044 95,404 323,492 99,429 348,994 4.2 7.9 -3.7 -3.2 5.8 5.5 5.6 5.8 5.8 5.6 5.7 5.8Indiana 39,028 127,527 38,719 125,303 36,721 116,595 35,828 117,258 -2.4 0.6 -8.2 -8.1 2.2 2.1 2.2 2.1 2.0 2.0 2.1 1.9Iowa 61,407 184,718 61,719 183,185 57,691 168,758 58,500 180,363 1.4 6.9 -4.7 -2.4 3.4 3.4 3.4 3.4 3.0 3.0 3.0 3.0Kansas 21,991 70,669 22,527 71,169 22,311 72,542 21,899 73,600 -1.8 1.5 -0.4 4.1 1.2 1.2 1.3 1.3 1.1 1.2 1.3 1.2Kentucky 31,839 90,977 29,268 84,037 22,474 61,503 20,655 58,944 -8.1 -4.2 -35.1 -35.2 1.8 1.6 1.3 1.2 1.5 1.4 1.1 1.0Louisiana 7,476 26,751 6,407 23,422 6,867 25,744 6,400 22,368 -6.8 -13.1 -14.4 -16.4 0.4 0.4 0.4 0.4 0.4 0.4 0.5 0.4Maine 2,919 7,986 5,255 13,935 4,523 11,440 4,319 11,969 -4.5 4.6 48.0 49.9 0.2 0.3 0.3 0.3 0.1 0.2 0.2 0.2Maryland 29,041 109,180 31,385 117,986 30,937 110,944 36,566 137,659 18.2 24.1 25.9 26.1 1.6 1.7 1.8 2.1 1.8 1.9 2.0 2.3Massachusetts 82,517 330,951 72,503 291,479 70,462 270,008 70,316 278,790 -0.2 3.3 -14.8 -15.8 4.6 4.0 4.2 4.1 5.3 4.7 4.7 4.6Michigan 123,593 400,186 124,962 391,497 115,687 377,642 112,994 388,558 -2.3 2.9 -8.6 -2.9 6.9 6.9 6.8 6.6 6.4 6.4 6.6 6.4Minnesota 30,471 98,878 32,275 104,636 21,403 59,861 45,738 163,680 113.7 173.4 50.1 65.5 1.7 1.8 1.3 2.7 1.6 1.7 1.1 2.7Mississippi 7,747 16,833 6,152 14,983 7,713 22,180 5,046 16,616 -34.6 -25.1 -34.9 -1.3 0.4 0.3 0.5 0.3 0.3 0.2 0.4 0.3Missouri 40,190 136,885 40,130 136,362 36,818 125,987 34,185 113,625 -7.2 -9.8 -14.9 -17.0 2.2 2.2 2.2 2.0 2.2 2.2 2.2 1.9Montana 6,694 19,919 6,664 19,235 5,858 17,832 5,619 18,692 -4.1 4.8 -16.1 -6.2 0.4 0.4 0.3 0.3 0.3 0.3 0.3 0.3Nebraska 11,792 35,692 11,279 34,421 10,840 33,148 10,611 33,900 -2.1 2.3 -10.0 -5.0 0.7 0.6 0.6 0.6 0.6 0.6 0.6 0.6Nevada 5,319 17,019 6,020 19,407 5,912 19,082 6,033 21,123 2.0 10.7 13.4 24.1 0.3 0.3 0.3 0.4 0.3 0.3 0.3 0.4New Hampshire 1,292 4,348 1,256 4,152 3,660 10,784 4,050 11,274 10.7 4.5 213.5 159.3 0.1 0.1 0.2 0.2 0.1 0.1 0.2 0.2New Jersey 57,487 198,940 57,429 195,012 49,980 172,382 55,917 203,932 11.9 18.3 -2.7 2.5 3.2 3.2 3.0 3.3 3.2 3.2 3.0 3.4New Mexico 9,889 36,772 10,755 40,760 10,331 38,930 9,914 40,035 -4.0 2.8 0.3 8.9 0.6 0.6 0.6 0.6 0.6 0.7 0.7 0.7New York 149,829 543,907 149,693 532,815 142,504 499,649 139,956 511,587 -1.8 2.4 -6.6 -5.9 8.4 8.3 8.4 8.2 8.7 8.7 8.8 8.5North Carolina 36,452 115,351 33,220 106,073 33,503 104,246 33,122 105,899 -1.1 1.6 -9.1 -8.2 2.0 1.8 2.0 1.9 1.9 1.7 1.8 1.8North Dakota 717 1,916 45 119 — — 1 3 — — -99.9 -99.9 0.0 0.0 — 0.0 0.0 0.0 — 0.0Ohio 105,600 356,410 112,609 371,532 98,860 325,940 102,240 358,423 3.4 10.0 -3.2 0.6 5.9 6.2 5.8 6.0 5.7 6.1 5.7 5.9Oklahoma 9,473 32,765 9,500 32,783 8,250 27,060 8,305 29,328 0.7 8.4 -12.3 -10.5 0.5 0.5 0.5 0.5 0.5 0.5 0.5 0.5Oregon 36,572 134,880 37,630 137,599 39,603 139,667 39,273 147,689 -0.8 5.7 7.4 9.5 2.0 2.1 2.3 2.3 2.2 2.2 2.5 2.4Pennsylvania 20,703 59,607 22,773 68,644 21,423 61,331 19,506 57,566 -8.9 -6.1 -5.8 -3.4 1.2 1.3 1.3 1.1 1.0 1.1 1.1 1.0Puerto Rico 30,029 98,811 29,444 93,032 24,476 77,991 28,427 94,853 16.1 21.6 -5.3 -4.0 1.7 1.6 1.4 1.7 1.6 1.5 1.4 1.6Rhode Island 13,264 56,234 11,586 46,755 10,454 41,489 11,985 48,772 14.6 17.6 -9.6 -13.3 0.7 0.6 0.6 0.7 0.9 0.8 0.7 0.8South Carolina 16,538 50,478 16,026 47,425 16,277 45,654 19,580 61,518 20.3 34.7 18.4 21.9 0.9 0.9 1.0 1.1 0.8 0.8 0.8 1.0South Dakota 1,124 2,668 1,752 4,401 1,579 3,937 884 2,131 -44.0 -45.9 -21.4 -20.1 0.1 0.1 0.1 0.1 0.0 0.1 0.1 0.0Tennessee 25,822 137,572 23,516 75,744 22,468 69,863 17,632 59,044 -21.5 -15.5 -31.7 -57.1 1.4 1.3 1.3 1.0 2.2 1.2 1.2 1.0Texas 28,564 90,081 27,577 86,506 27,389 83,311 26,162 83,029 -4.5 -0.3 -8.4 -7.8 1.6 1.5 1.6 1.5 1.4 1.4 1.5 1.4Utah 1,092 3,038 1,223 3,202 1,879 4,805 1,320 3,611 -29.7 -24.9 20.9 18.9 0.1 0.1 0.1 0.1 0.0 0.1 0.1 0.1Vermont 8,990 30,089 9,500 31,535 7,013 22,779 5,216 16,379 -25.6 -28.1 -42.0 -45.6 0.5 0.5 0.4 0.3 0.5 0.5 0.4 0.3Virgin Islands 457 1,430 313 904 339 736 308 773 -9.1 5.0 -32.6 -46.0 0.0 0.0 0.0 0.0 0.0 0.0 0.0 0.0Virginia 74,340 277,772 71,713 266,085 65,173 237,622 70,843 263,246 8.7 10.8 -4.7 -5.2 4.1 4.0 3.9 4.1 4.5 4.3 4.2 4.4Washington 38,627 140,216 37,630 141,573 37,708 124,297 35,065 136,039 -7.0 9.4 -9.2 -3.0 2.2 2.1 2.2 2.1 2.2 2.3 2.2 2.3West Virginia 28,367 91,061 28,455 92,557 30,224 96,039 29,817 100,212 -1.3 4.3 5.1 10.0 1.6 1.6 1.8 1.7 1.5 1.5 1.7 1.7Wisconsin 31,833 95,932 30,990 93,189 32,696 99,434 30,191 99,292 -7.7 -0.1 -5.2 3.5 1.8 1.7 1.9 1.8 1.5 1.5 1.7 1.6Wyoming 12 25 12 22 16 34 — — — — — — 0.0 0.0 0.0 — 0.0 0.0 0.0 — Total 1,792,173 $6,232,620 1,802,803 $6,140,537 1,691,253 $5,685,959 1,708,870 $6,032,650 1.0 6.1 -4.6 -3.2 100.0 100.0 100.0 100.0 100.0 100.0 100.0 100.0

146 Federal Student Loan Programs Data Book � FY 1997-FY 2000
Table 32. Federal Direct Loan Program (FDLP) loan volume commitments for Stafford Subsidized loans, by state: FY 1997-FY 2000 (continued)
Ranking in FY97-FY00 Rank
Rank FY97 FY98 FY99 FY00 Guaranty agency FY971 FY981 FY991 FY001
1 California California California California Alabama 11 11 9 122 New York New York New York New York Alaska 51 49 50 503 Michigan Michigan Michigan Michigan Arizona 16 15 14 174 Illinois Ohio Ohio Ohio Arkansas 44 43 44 445 Ohio Illinois Illinois Illinois California 1 1 1 16 Massachusetts Massachusetts Massachusetts Massachusetts Colorado 19 18 18 217 Virginia Georgia Virginia Virginia Connecticut 39 38 36 378 Georgia Virginia Georgia Georgia Delaware 40 40 41 409 New Jersey New Jersey Alabama New Jersey District of Columbia 33 31 32 26
10 Iowa Iowa Florida Florida Florida 12 12 10 1011 Alabama Alabama New Jersey Iowa Georgia 8 7 8 812 Florida Florida Iowa Alabama Guam 52 50 49 4813 Washington Washington Oregon Minnesota Hawaii 53 52 52 5214 Tennessee Oregon Arizona Oregon Idaho 28 29 27 2815 Missouri Arizona Missouri Maryland Illinois 4 5 5 516 Arizona Missouri Washington Washington Indiana 18 17 17 1817 Oregon Indiana Indiana Arizona Iowa 10 10 12 1118 Indiana Colorado Colorado Indiana Kansas 29 28 25 2719 Colorado Maryland Maryland Missouri Kentucky 26 26 28 3120 North Carolina North Carolina North Carolina North Carolina Louisiana 38 39 38 3821 Maryland Minnesota Wisconsin Colorado Maine 45 45 45 4522 Minnesota Wisconsin West Virginia West Virginia Maryland 21 19 19 1523 Puerto Rico Puerto Rico Texas Wisconsin Massachusetts 6 6 6 624 Wisconsin West Virginia Puerto Rico Puerto Rico Michigan 3 3 3 325 West Virginia Texas Kansas Texas Minnesota 22 21 30 1326 Kentucky Kentucky Tennessee District of Columbia Mississippi 43 44 40 4227 Texas Tennessee Idaho Kansas Missouri 15 16 15 1928 Idaho Kansas Kentucky Idaho Montana 41 42 43 4129 Kansas Idaho Pennsylvania South Carolina Nebraska 35 35 35 3530 Pennsylvania Pennsylvania Minnesota Tennessee Nevada 42 41 42 3931 Rhode Island District of Columbia South Carolina Kentucky New Hampshire 46 47 46 4632 South Carolina South Carolina District of Columbia Pennsylvania New Jersey 9 9 11 933 District of Columbia Rhode Island Rhode Island Rhode Island New Mexico 34 34 34 3434 New Mexico New Mexico New Mexico New Mexico New York 2 2 2 235 Nebraska Nebraska Nebraska Nebraska North Carolina 20 20 20 2036 Oklahoma Oklahoma Connecticut Oklahoma North Dakota 49 53 — 5337 Vermont Vermont Oklahoma Connecticut Ohio 5 4 4 438 Louisiana Connecticut Louisiana Louisiana Oklahoma 36 36 37 3639 Connecticut Louisiana Vermont Nevada Oregon 17 14 13 1440 Delaware Delaware Mississippi Delaware Pennsylvania 30 30 29 3241 Montana Nevada Delaware Montana Puerto Rico 23 23 24 2442 Nevada Montana Nevada Mississippi Rhode Island 31 33 33 3343 Mississippi Arkansas Montana Vermont South Carolina 32 32 31 2944 Arkansas Mississippi Arkansas Arkansas South Dakota 48 46 48 4945 Maine Maine Maine Maine Tennessee 14 27 26 3046 New Hampshire South Dakota New Hampshire New Hampshire Texas 27 25 23 2547 Utah New Hampshire Utah Utah Utah 47 48 47 4748 South Dakota Utah South Dakota Guam Vermont 37 37 39 4349 North Dakota Alaska Guam South Dakota Virgin Islands 50 51 51 5150 Virgin Islands Guam Alaska Alaska Virginia 7 8 7 751 Alaska Virgin Islands Virgin Islands Virgin Islands Washington 13 13 16 1652 Guam Hawaii Hawaii Hawaii West Virginia 25 24 22 2253 Hawaii North Dakota Wyoming North Dakota Wisconsin 24 22 21 2354 Wyoming Wyoming — — Wyoming 54 54 53 —
— Not applicable.1 The lowest rank for FY97 and FY98 was 54, while the lowest rank for FY99 and FY00 was 53.
NOTES: All rankings are based on dollar amounts. Volume measure is Direct Loan commitments. State is determined by the state location of the school that a Direct Loan borrower attends. Details may not add to totals due to rounding. Calculations are based on numbers before rounding. 0.0 indicates a number less than 0.05.
SOURCE: U.S. Department of Education, Office of Postsecondary Education, Direct Loan/Loan Origination System.
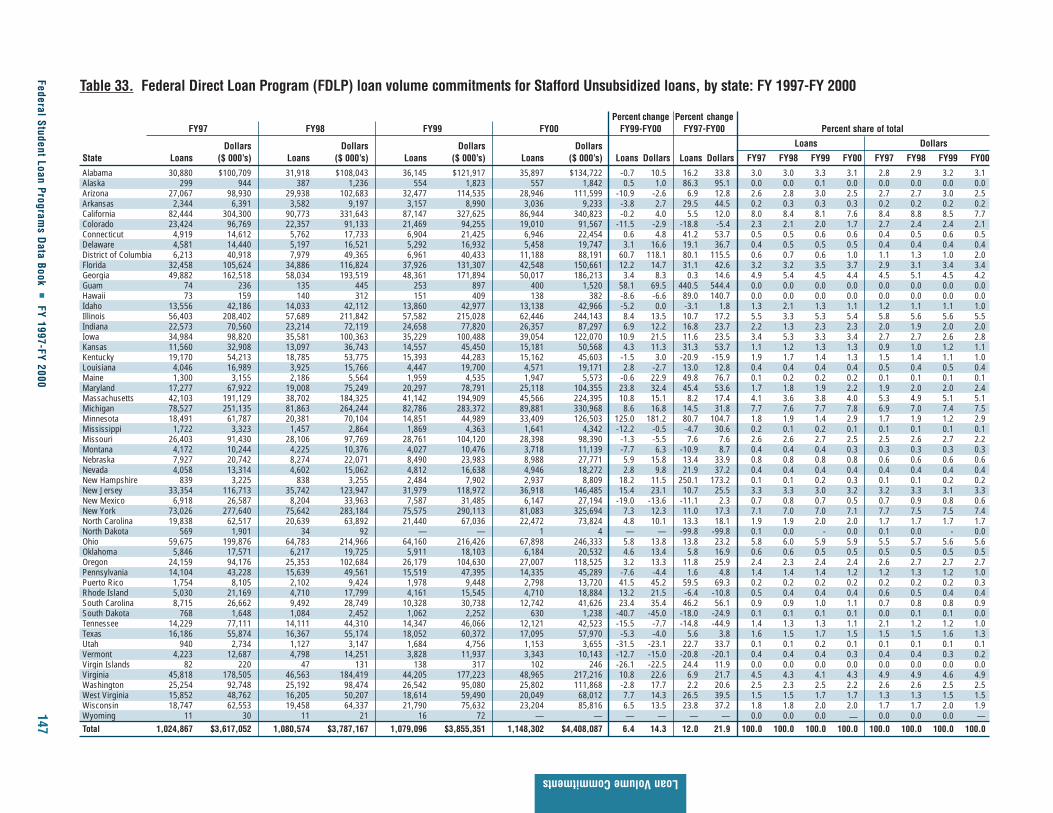
Federal Student Loan Programs D
ata Book �
FY 1997-FY 2000147
Loan Volume Commitments
Table 33. Federal Direct Loan Program (FDLP) loan volume commitments for Stafford Unsubsidized loans, by state: FY 1997-FY 2000
Percent change Percent changeFY97 FY98 FY99 FY00 FY99-FY00 FY97-FY00 Percent share of total
Dollars Dollars Dollars Dollars Loans Dollars
State Loans ($ 000’s) Loans ($ 000’s) Loans ($ 000’s) Loans ($ 000’s) Loans Dollars Loans Dollars FY97 FY98 FY99 FY00 FY97 FY98 FY99 FY00
Alabama 30,880 $100,709 31,918 $108,043 36,145 $121,917 35,897 $134,722 -0.7 10.5 16.2 33.8 3.0 3.0 3.3 3.1 2.8 2.9 3.2 3.1Alaska 299 944 387 1,236 554 1,823 557 1,842 0.5 1.0 86.3 95.1 0.0 0.0 0.1 0.0 0.0 0.0 0.0 0.0Arizona 27,067 98,930 29,938 102,683 32,477 114,535 28,946 111,599 -10.9 -2.6 6.9 12.8 2.6 2.8 3.0 2.5 2.7 2.7 3.0 2.5Arkansas 2,344 6,391 3,582 9,197 3,157 8,990 3,036 9,233 -3.8 2.7 29.5 44.5 0.2 0.3 0.3 0.3 0.2 0.2 0.2 0.2California 82,444 304,300 90,773 331,643 87,147 327,625 86,944 340,823 -0.2 4.0 5.5 12.0 8.0 8.4 8.1 7.6 8.4 8.8 8.5 7.7Colorado 23,424 96,769 22,357 91,133 21,469 94,255 19,010 91,567 -11.5 -2.9 -18.8 -5.4 2.3 2.1 2.0 1.7 2.7 2.4 2.4 2.1Connecticut 4,919 14,612 5,762 17,733 6,904 21,425 6,946 22,454 0.6 4.8 41.2 53.7 0.5 0.5 0.6 0.6 0.4 0.5 0.6 0.5Delaware 4,581 14,440 5,197 16,521 5,292 16,932 5,458 19,747 3.1 16.6 19.1 36.7 0.4 0.5 0.5 0.5 0.4 0.4 0.4 0.4District of Columbia 6,213 40,918 7,979 49,365 6,961 40,433 11,188 88,191 60.7 118.1 80.1 115.5 0.6 0.7 0.6 1.0 1.1 1.3 1.0 2.0Florida 32,458 105,624 34,886 116,824 37,926 131,307 42,548 150,661 12.2 14.7 31.1 42.6 3.2 3.2 3.5 3.7 2.9 3.1 3.4 3.4Georgia 49,882 162,518 58,034 193,519 48,361 171,894 50,017 186,213 3.4 8.3 0.3 14.6 4.9 5.4 4.5 4.4 4.5 5.1 4.5 4.2Guam 74 236 135 445 253 897 400 1,520 58.1 69.5 440.5 544.4 0.0 0.0 0.0 0.0 0.0 0.0 0.0 0.0Hawaii 73 159 140 312 151 409 138 382 -8.6 -6.6 89.0 140.7 0.0 0.0 0.0 0.0 0.0 0.0 0.0 0.0Idaho 13,556 42,186 14,033 42,112 13,860 42,977 13,138 42,966 -5.2 0.0 -3.1 1.8 1.3 2.1 1.3 1.1 1.2 1.1 1.1 1.0Illinois 56,403 208,402 57,689 211,842 57,582 215,028 62,446 244,143 8.4 13.5 10.7 17.2 5.5 3.3 5.3 5.4 5.8 5.6 5.6 5.5Indiana 22,573 70,560 23,214 72,119 24,658 77,820 26,357 87,297 6.9 12.2 16.8 23.7 2.2 1.3 2.3 2.3 2.0 1.9 2.0 2.0Iowa 34,984 98,820 35,581 100,363 35,229 100,488 39,054 122,070 10.9 21.5 11.6 23.5 3.4 5.3 3.3 3.4 2.7 2.7 2.6 2.8Kansas 11,560 32,908 13,097 36,743 14,557 45,450 15,181 50,568 4.3 11.3 31.3 53.7 1.1 1.2 1.3 1.3 0.9 1.0 1.2 1.1Kentucky 19,170 54,213 18,785 53,775 15,393 44,283 15,162 45,603 -1.5 3.0 -20.9 -15.9 1.9 1.7 1.4 1.3 1.5 1.4 1.1 1.0Louisiana 4,046 16,989 3,925 15,766 4,447 19,700 4,571 19,171 2.8 -2.7 13.0 12.8 0.4 0.4 0.4 0.4 0.5 0.4 0.5 0.4Maine 1,300 3,155 2,186 5,564 1,959 4,535 1,947 5,573 -0.6 22.9 49.8 76.7 0.1 0.2 0.2 0.2 0.1 0.1 0.1 0.1Maryland 17,277 67,922 19,008 75,249 20,297 78,791 25,118 104,355 23.8 32.4 45.4 53.6 1.7 1.8 1.9 2.2 1.9 2.0 2.0 2.4Massachusetts 42,103 191,129 38,702 184,325 41,142 194,909 45,566 224,395 10.8 15.1 8.2 17.4 4.1 3.6 3.8 4.0 5.3 4.9 5.1 5.1Michigan 78,527 251,135 81,863 264,244 82,786 283,372 89,881 330,968 8.6 16.8 14.5 31.8 7.7 7.6 7.7 7.8 6.9 7.0 7.4 7.5Minnesota 18,491 61,787 20,381 70,104 14,851 44,989 33,409 126,503 125.0 181.2 80.7 104.7 1.8 1.9 1.4 2.9 1.7 1.9 1.2 2.9Mississippi 1,722 3,323 1,457 2,864 1,869 4,363 1,641 4,342 -12.2 -0.5 -4.7 30.6 0.2 0.1 0.2 0.1 0.1 0.1 0.1 0.1Missouri 26,403 91,430 28,106 97,769 28,761 104,120 28,398 98,390 -1.3 -5.5 7.6 7.6 2.6 2.6 2.7 2.5 2.5 2.6 2.7 2.2Montana 4,172 10,244 4,225 10,376 4,027 10,476 3,718 11,139 -7.7 6.3 -10.9 8.7 0.4 0.4 0.4 0.3 0.3 0.3 0.3 0.3Nebraska 7,927 20,742 8,274 22,071 8,490 23,983 8,988 27,771 5.9 15.8 13.4 33.9 0.8 0.8 0.8 0.8 0.6 0.6 0.6 0.6Nevada 4,058 13,314 4,602 15,062 4,812 16,638 4,946 18,272 2.8 9.8 21.9 37.2 0.4 0.4 0.4 0.4 0.4 0.4 0.4 0.4New Hampshire 839 3,225 838 3,255 2,484 7,902 2,937 8,809 18.2 11.5 250.1 173.2 0.1 0.1 0.2 0.3 0.1 0.1 0.2 0.2New Jersey 33,354 116,713 35,742 123,947 31,979 118,972 36,918 146,485 15.4 23.1 10.7 25.5 3.3 3.3 3.0 3.2 3.2 3.3 3.1 3.3New Mexico 6,918 26,587 8,204 33,963 7,587 31,485 6,147 27,194 -19.0 -13.6 -11.1 2.3 0.7 0.8 0.7 0.5 0.7 0.9 0.8 0.6New York 73,026 277,640 75,642 283,184 75,575 290,113 81,083 325,694 7.3 12.3 11.0 17.3 7.1 7.0 7.0 7.1 7.7 7.5 7.5 7.4North Carolina 19,838 62,517 20,639 63,892 21,440 67,036 22,472 73,824 4.8 10.1 13.3 18.1 1.9 1.9 2.0 2.0 1.7 1.7 1.7 1.7North Dakota 569 1,901 34 92 — — 1 4 — — -99.8 -99.8 0.1 0.0 - 0.0 0.1 0.0 - 0.0Ohio 59,675 199,876 64,783 214,966 64,160 216,426 67,898 246,333 5.8 13.8 13.8 23.2 5.8 6.0 5.9 5.9 5.5 5.7 5.6 5.6Oklahoma 5,846 17,571 6,217 19,725 5,911 18,103 6,184 20,532 4.6 13.4 5.8 16.9 0.6 0.6 0.5 0.5 0.5 0.5 0.5 0.5Oregon 24,159 94,176 25,353 102,684 26,179 104,630 27,007 118,525 3.2 13.3 11.8 25.9 2.4 2.3 2.4 2.4 2.6 2.7 2.7 2.7Pennsylvania 14,104 43,228 15,639 49,561 15,519 47,395 14,335 45,289 -7.6 -4.4 1.6 4.8 1.4 1.4 1.4 1.2 1.2 1.3 1.2 1.0Puerto Rico 1,754 8,105 2,102 9,424 1,978 9,448 2,798 13,720 41.5 45.2 59.5 69.3 0.2 0.2 0.2 0.2 0.2 0.2 0.2 0.3Rhode Island 5,030 21,169 4,710 17,799 4,161 15,545 4,710 18,884 13.2 21.5 -6.4 -10.8 0.5 0.4 0.4 0.4 0.6 0.5 0.4 0.4South Carolina 8,715 26,662 9,492 28,749 10,328 30,738 12,742 41,626 23.4 35.4 46.2 56.1 0.9 0.9 1.0 1.1 0.7 0.8 0.8 0.9South Dakota 768 1,648 1,084 2,452 1,062 2,252 630 1,238 -40.7 -45.0 -18.0 -24.9 0.1 0.1 0.1 0.1 0.0 0.1 0.1 0.0Tennessee 14,229 77,111 14,111 44,310 14,347 46,066 12,121 42,523 -15.5 -7.7 -14.8 -44.9 1.4 1.3 1.3 1.1 2.1 1.2 1.2 1.0Texas 16,186 55,874 16,367 55,174 18,052 60,372 17,095 57,970 -5.3 -4.0 5.6 3.8 1.6 1.5 1.7 1.5 1.5 1.5 1.6 1.3Utah 940 2,734 1,127 3,147 1,684 4,756 1,153 3,655 -31.5 -23.1 22.7 33.7 0.1 0.1 0.2 0.1 0.1 0.1 0.1 0.1Vermont 4,223 12,687 4,798 14,251 3,828 11,937 3,343 10,143 -12.7 -15.0 -20.8 -20.1 0.4 0.4 0.4 0.3 0.4 0.4 0.3 0.2Virgin Islands 82 220 47 131 138 317 102 246 -26.1 -22.5 24.4 11.9 0.0 0.0 0.0 0.0 0.0 0.0 0.0 0.0Virginia 45,818 178,505 46,563 184,419 44,205 177,223 48,965 217,216 10.8 22.6 6.9 21.7 4.5 4.3 4.1 4.3 4.9 4.9 4.6 4.9Washington 25,254 92,748 25,192 98,474 26,542 95,080 25,802 111,868 -2.8 17.7 2.2 20.6 2.5 2.3 2.5 2.2 2.6 2.6 2.5 2.5West Virginia 15,852 48,762 16,205 50,207 18,614 59,490 20,049 68,012 7.7 14.3 26.5 39.5 1.5 1.5 1.7 1.7 1.3 1.3 1.5 1.5Wisconsin 18,747 62,553 19,458 64,337 21,790 75,632 23,204 85,816 6.5 13.5 23.8 37.2 1.8 1.8 2.0 2.0 1.7 1.7 2.0 1.9Wyoming 11 30 11 21 16 72 — — — — — — 0.0 0.0 0.0 — 0.0 0.0 0.0 —Total 1,024,867 $3,617,052 1,080,574 $3,787,167 1,079,096 $3,855,351 1,148,302 $4,408,087 6.4 14.3 12.0 21.9 100.0 100.0 100.0 100.0 100.0 100.0 100.0 100.0

148 Federal Student Loan Programs Data Book � FY 1997-FY 2000
Table 33. Federal Direct Loan Program (FDLP) loan volume commitments for Stafford Unsubsidized loans, by state: FY 1997-FY 2000 (continued)
Ranking in FY97-FY00 Rank
Rank FY97 FY98 FY99 FY00 Guaranty agency FY971 FY981 FY991 FY001
1 California California California California Alabama 11 11 10 112 New York New York New York Michigan Alaska 50 49 49 483 Michigan Michigan Michigan New York Arizona 12 13 12 164 Illinois Ohio Ohio Ohio Arkansas 43 43 43 435 Ohio Illinois Illinois Illinois California 1 1 1 16 Massachusetts Georgia Massachusetts Massachusetts Colorado 14 17 17 197 Virginia Virginia Virginia Virginia Connecticut 37 36 34 348 Georgia Massachusetts Georgia Georgia Delaware 38 37 37 369 New Jersey New Jersey Florida Florida District Columbia 29 27 30 20
10 Florida Florida Alabama New Jersey Florida 10 10 9 911 Alabama Alabama New Jersey Alabama Georgia 8 6 8 812 Arizona Oregon Arizona Minnesota Guam 51 50 50 4913 Iowa Arizona Oregon Iowa Hawaii 53 51 51 5114 Colorado Iowa Missouri Oregon Idaho 28 29 29 2915 Oregon Washington Iowa Washington Illinois 4 5 5 516 Washington Missouri Washington Arizona Indiana 19 19 19 2117 Missouri Colorado Colorado Maryland Iowa 13 14 15 1318 Tennessee Maryland Maryland Missouri Kansas 30 30 26 2619 Indiana Indiana Indiana Colorado Kentucky 25 24 28 2720 Maryland Minnesota Wisconsin District of Columbia Louisiana 36 38 35 3721 Wisconsin Wisconsin North Carolina Indiana Maine 46 44 46 4522 North Carolina North Carolina Texas Wisconsin Maryland 20 18 18 1723 Minnesota Texas West Virginia North Carolina Massachusetts 6 8 6 624 Texas Kentucky Pennsylvania West Virginia Michigan 3 3 3 225 Kentucky West Virginia Tennessee Texas Minnesota 23 20 27 1226 West Virginia Pennsylvania Kansas Kansas Mississippi 44 47 47 4627 Pennsylvania District of Columbia Minnesota Kentucky Missouri 17 16 14 1828 Idaho Tennessee Kentucky Pennsylvania Montana 41 41 41 4129 District of Columbia Idaho Idaho Idaho Nebraska 34 33 33 3230 Kansas Kansas District of Columbia Tennessee Nevada 39 39 38 3931 South Carolina New Mexico New Mexico South Carolina New Hampshire 45 45 44 4432 New Mexico South Carolina South Carolina Nebraska New Jersey 9 9 11 1033 Rhode Island Nebraska Nebraska New Mexico New Mexico 32 31 31 3334 Nebraska Oklahoma Connecticut Connecticut New York 2 2 2 335 Oklahoma Rhode Island Louisiana Oklahoma North Carolina 22 22 21 2336 Louisiana Connecticut Oklahoma Delaware North Dakota 48 53 — 5337 Connecticut Delaware Delaware Louisiana Ohio 5 4 4 438 Delaware Louisiana Nevada Rhode Island Oklahoma 35 34 36 3539 Nevada Nevada Rhode Island Nevada Oregon 15 12 13 1440 Vermont Vermont Vermont Puerto Rico Pennsylvania 27 26 24 2841 Montana Montana Montana Montana Puerto Rico 42 42 42 4042 Puerto Rico Puerto Rico Puerto Rico Vermont Rhode Island 33 35 39 3843 Arkansas Arkansas Arkansas Arkansas South Carolina 31 32 32 3144 Mississippi Maine New Hampshire New Hampshire South Dakota 49 48 48 5045 New Hampshire New Hampshire Utah Maine Tennessee 18 28 25 3046 Maine Utah Maine Mississippi Texas 24 23 22 2547 Utah Mississippi Mississippi Utah Utah 47 46 45 4748 North Dakota South Dakota South Dakota Alaska Vermont 40 40 40 4249 South Dakota Alaska Alaska Guam Virgin Islands 52 52 52 5250 Alaska Guam Guam South Dakota Virginia 7 7 7 751 Guam Hawaii Hawaii Hawaii Washington 16 15 16 1552 Virgin Islands Virgin Islands Virgin Islands Virgin Islands West Virginia 26 25 23 2453 Hawaii North Dakota Wyoming North Dakota Wisconsin 21 21 20 2254 Wyoming Wyoming — — Wyoming 54 54 53 —
— Not applicable1 The lowest rank for FY97 and FY98 was 54, while the lowest rank for FY99 and FY00 was 53.
NOTES: All rankings are based on dollar amounts. Volume measure is Direct Loan commitments. State is determined by the state location of the school that a Direct Loan borrower attends. Details may not add to totals due to rounding. Calculations are based on numbers before rounding. 0.0 indicates a number less than 0.05.
SOURCE: U.S. Department of Education, Office of Postecondary Education, Direct Loan/Loan Origination System.

Federal Student Loan Programs D
ata Book �
FY 1997-FY 2000149
Loan Volume Commitments
Table 34. Federal Direct Loan Program (FDLP) loan volume commitments for Parent Loans for Undergraduate Students (PLUS) loans, by state: FY 1997-FY 2000
Percent change Percent changeFY97 FY98 FY99 FY00 FY99-FY00 FY97-FY00 Percent share of total
Dollars Dollars Dollars Dollars Loans Dollars
State Loans ($ 000’s) Loans ($ 000’s) Loans ($ 000’s) Loans ($ 000’s) Loans Dollars Loans Dollars FY97 FY98 FY99 FY00 FY97 FY98 FY99 FY00
Alabama 6,601 $33,132 6,090 $30,805 5,232 $25,587 5,039 $27,988 -3.7 9.4 -23.7 -15.5 3.6 3.1 2.8 2.4 3.1 2.6 2.2 2.0Alaska — — 1 4 2 15 — — — — — — — 0.0 0.0 — — 0.0 0.0 — Arizona 1,137 5,361 1,890 8,534 2,553 11,689 1,919 9,488 -24.8 -18.8 68.8 77.0 0.6 1.0 1.4 0.9 0.5 0.7 1.0 0.7Arkansas 132 403 171 582 438 1,746 590 2,324 34.7 33.1 347.0 476.2 0.1 0.1 0.2 0.3 0.0 0.0 0.2 0.2California 15,862 93,274 17,739 108,349 16,585 102,576 18,579 126,261 12.0 23.1 17.1 35.4 8.8 9.1 8.9 8.9 8.7 9.0 8.8 9.1Colorado 5,235 39,009 4,925 37,616 4,887 38,455 5,306 45,449 8.6 18.2 1.4 16.5 2.9 2.5 2.6 2.5 3.7 3.1 3.3 3.3Connecticut 786 5,442 1,052 7,413 1,343 9,125 1,014 7,397 -24.5 -18.9 29.0 35.9 0.4 0.5 0.7 0.5 0.5 0.6 0.8 0.5Delaware 1,521 11,954 1,733 14,039 1,828 14,303 1,883 15,713 3.0 9.9 23.8 31.4 0.8 0.9 1.0 0.9 1.1 1.2 1.2 1.1District of Columbia 994 9,100 1,196 12,085 687 6,499 2,038 21,737 196.7 234.5 105.0 138.9 0.5 0.6 0.4 1.0 0.9 1.0 0.6 1.6Florida 3,331 16,939 4,568 29,053 5,487 35,380 5,444 36,527 -0.8 3.2 63.4 115.6 1.8 2.3 2.9 2.6 1.6 2.4 3.0 2.6Georgia 8,655 47,403 9,639 54,966 7,958 48,295 7,165 50,412 -10.0 4.4 -17.2 6.3 4.8 5.0 4.3 3.4 4.4 4.6 4.2 3.6Hawaii — — — — — — 1 5 — — — — — — — 0.0 — — — 0.0Idaho 423 1,793 408 1,766 377 1,717 390 1,962 3.4 14.2 -7.8 9.4 0.2 0.2 0.2 0.2 0.2 0.1 0.1 0.1Illinois 9,553 51,115 10,122 57,079 9,558 55,794 12,507 79,680 30.9 42.8 30.9 55.9 5.3 5.2 5.1 6.0 4.8 4.8 4.8 5.7Indiana 6,134 39,282 5,341 35,355 5,725 39,072 6,182 44,547 8.0 14.0 0.8 13.4 3.4 2.7 3.1 3.0 3.7 3.0 3.4 3.2Iowa 7,888 38,572 8,131 41,555 7,470 38,403 7,553 43,320 1.1 12.8 -4.2 12.3 4.4 4.2 4.0 3.6 3.6 3.5 3.3 3.1Kansas 1,449 7,527 1,581 8,938 1,784 10,100 1,930 11,302 8.2 11.9 33.2 50.2 0.8 0.8 1.0 0.9 0.7 0.7 0.9 0.8Kentucky 1,601 9,256 1,416 7,952 1,273 7,476 1,444 9,295 13.4 24.3 -9.8 0.4 0.9 0.7 0.7 0.7 0.9 0.7 0.6 0.7Louisiana 1,002 6,093 755 5,290 798 5,927 569 4,154 -28.7 -29.9 -43.2 -31.8 0.6 0.4 0.4 0.3 0.6 0.4 0.5 0.3Maine 206 1,917 326 3,006 330 2,972 269 2,172 -18.5 -26.9 30.6 13.3 0.1 0.2 0.2 0.1 0.2 0.3 0.3 0.2Maryland 3,373 22,561 3,900 27,372 4,166 31,242 4,081 28,744 -2.0 -8.0 21.0 27.4 1.9 2.0 2.2 2.0 2.1 2.3 2.7 2.1Massachusetts 8,186 66,917 8,192 71,638 6,805 57,808 7,672 73,535 12.7 27.2 -6.3 9.9 4.5 4.2 3.6 3.7 6.3 6.0 5.0 5.3Michigan 12,518 67,333 13,387 72,079 12,193 68,896 12,572 72,699 3.1 5.5 0.4 8.0 6.9 6.9 6.5 6.0 6.3 6.0 5.9 5.2Minnesota 3,619 19,610 4,528 25,384 2,182 11,951 5,316 33,620 143.6 181.3 46.9 71.4 2.0 2.3 1.2 2.6 1.8 2.1 1.0 2.4Mississippi 298 757 187 429 297 699 264 688 -11.1 -1.6 -11.4 -9.2 0.2 0.1 0.2 0.1 0.1 0.0 0.1 0.0Missouri 3,407 16,059 3,989 19,360 4,392 22,070 5,237 26,947 19.2 22.1 53.7 67.8 1.9 2.1 2.3 2.5 1.5 1.6 1.9 1.9Montana 794 3,954 754 3,787 550 2,784 544 3,053 -1.1 9.7 -31.5 -22.8 0.4 0.4 0.3 0.3 0.4 0.3 0.2 0.2Nebraska 1,042 3,941 1,146 4,688 1,453 6,392 1,824 8,598 25.5 34.5 75.0 118.2 0.6 0.6 0.8 0.9 0.4 0.4 0.6 0.6Nevada 553 3,255 737 4,218 684 3,958 818 4,967 19.6 25.5 47.9 52.6 0.3 0.4 0.4 0.4 0.3 0.4 0.3 0.4New Hampshire 326 2,783 226 2,015 765 5,538 866 6,833 13.2 23.4 165.6 145.5 0.2 0.1 0.4 0.4 0.3 0.2 0.5 0.5New Jersey 6,284 32,274 6,072 31,674 5,691 30,821 6,783 39,095 19.2 26.8 7.9 21.1 3.5 3.1 3.0 3.3 3.0 2.6 2.7 2.8New Mexico 3 7 2 8 5 5 205 974 4000.0 21528.2 6733.3 12969.8 0.0 0.0 0.0 0.1 0.0 0.0 0.0 0.1New York 14,545 91,578 14,499 94,183 14,389 96,820 15,024 106,861 4.4 10.4 3.3 16.7 8.0 7.5 7.7 7.2 8.6 7.9 8.3 7.7North Carolina 4,568 22,231 4,513 22,674 4,550 22,753 5,411 31,034 18.9 36.4 18.5 39.6 2.5 2.3 2.4 2.6 2.1 1.9 2.0 2.2North Dakota 143 646 7 33 — — — — — — — — 0.1 0.0 — — 0.1 0.0 — — Ohio 13,319 81,095 15,441 98,067 14,403 93,342 16,894 119,433 17.3 28.0 26.8 47.3 7.4 7.9 7.7 8.1 7.6 8.2 8.0 8.6Oklahoma 1,711 8,898 1,673 9,105 1,710 8,424 1,990 11,208 16.4 33.0 16.3 26.0 0.9 0.9 0.9 1.0 0.8 0.8 0.7 0.8Oregon 3,008 19,476 3,615 23,315 3,706 23,659 4,736 31,195 27.8 31.9 57.4 60.2 1.7 1.9 2.0 2.3 1.8 1.9 2.0 2.2Pennsylvania 3,703 19,654 3,889 20,444 4,275 22,425 4,537 25,503 6.1 13.7 22.5 29.8 2.0 2.0 2.3 2.2 1.8 1.7 1.9 1.8Puerto Rico 5 21 6 19 3 10 7 20 133.3 89.0 40.0 -6.0 0.0 0.0 0.0 0.0 0.0 0.0 0.0 0.0Rhode Island 1,808 16,836 1,891 17,752 1,452 13,476 2,068 20,417 42.4 51.5 14.4 21.3 1.0 1.0 0.8 1.0 1.6 1.5 1.2 1.5South Carolina 1,573 8,384 2,509 15,397 3,275 18,790 4,278 24,196 30.6 28.8 172.0 188.6 0.9 1.3 1.8 2.1 0.8 1.3 1.6 1.7South Dakota 187 865 229 811 145 556 68 251 -53.1 -54.8 -63.6 -70.9 0.1 0.1 0.1 0.0 0.1 0.1 0.0 0.0Tennessee 333 1,937 322 1,296 480 2,174 515 2,328 7.3 7.1 54.7 20.2 0.2 0.2 0.3 0.2 0.2 0.1 0.2 0.2Texas 1,895 9,559 2,752 14,961 2,670 14,035 3,121 18,019 16.9 28.4 64.7 88.5 1.0 1.4 1.4 1.5 0.9 1.2 1.2 1.3Utah 167 631 137 517 230 982 178 925 -22.6 -5.8 6.6 46.6 0.1 0.1 0.1 0.1 0.1 0.0 0.1 0.1Vermont 3,231 23,275 3,423 25,835 2,532 19,386 1,676 12,984 -33.8 -33.0 -48.1 -44.2 1.8 1.8 1.4 0.8 2.2 2.2 1.7 0.9Virgin Islands 1 1 9 49 5 20 12 51 140.0 157.3 1100.0 3749.5 0.0 0.0 0.0 0.0 0.0 0.0 0.0 0.0Virginia 9,944 60,049 10,201 69,353 9,833 65,704 9,968 72,067 1.4 9.7 0.2 20.0 5.5 5.2 5.3 4.8 5.6 5.8 5.7 5.2Washington 3,142 18,141 3,796 24,589 3,825 24,423 5,323 34,812 39.2 42.5 69.4 91.9 1.7 2.0 2.0 2.6 1.7 2.1 2.1 2.5West Virginia 2,584 14,618 3,126 18,413 3,722 21,817 3,891 23,664 4.5 8.5 50.6 61.9 1.4 1.6 2.0 1.9 1.4 1.5 1.9 1.7Wisconsin 2,285 13,143 2,292 13,694 2,415 15,938 2,708 18,247 12.1 14.5 18.5 38.8 1.3 1.2 1.3 1.3 1.2 1.1 1.4 1.3Wyoming 3 15 1 5 3 12 — — — — — — 0.0 0.0 0.0 — 0.0 0.0 0.0 — Total 181,068 $1,068,076 194,535 $1,197,548 187,121 $1,162,042 208,409 $1,392,701 11.4 19.8 15.1 30.4 100.0 100.0 100.0 100.0 100.0 100.0 100.0 100.0

150 Federal Student Loan Programs Data Book � FY 1997-FY 2000
Table 34. Federal Direct Loan Program (FDLP) loan volume commitments for PLUS loans, by state: FY 1997-FY 2000 (continued)
Ranking in FY97-FY00 Rank
Rank FY97 FY98 FY99 FY00 Guaranty agency FY971 FY981 FY991 FY001
1 California California California California Alabama 12 13 15 192 New York Ohio New York Ohio Alaska — 52 48 —3 Ohio New York Ohio New York Arizona 35 32 29 324 Michigan Michigan Michigan Illinois Arkansas 47 44 42 415 Massachusetts Massachusetts Virginia Massachusetts California 1 1 1 16 Virginia Virginia Massachusetts Michigan Colorado 10 10 10 97 Illinois Illinois Illinois Virginia Connecticut 34 34 31 358 Georgia Georgia Georgia Georgia Delaware 26 27 25 289 Indiana Iowa Indiana Colorado District of Columbia 29 29 34 24
10 Colorado Colorado Colorado Indiana Florida 21 14 12 1311 Iowa Indiana Iowa Iowa Georgia 8 8 8 812 Alabama New Jersey Florida New Jersey Hawaii — — — 5013 New Jersey Alabama Maryland Florida Idaho 42 41 43 4314 Vermont Florida New Jersey Washington Illinois 7 7 7 415 Maryland Maryland Alabama Minnesota Indiana 9 11 9 1016 North Carolina Vermont Washington Oregon Iowa 11 9 11 1117 Pennsylvania Minnesota Oregon North Carolina Kansas 32 31 30 3018 Minnesota Washington North Carolina Maryland Kentucky 28 33 33 3319 Oregon Oregon Pennsylvania Alabama Louisiana 33 35 36 3820 Washington North Carolina Missouri Missouri Maine 41 39 39 4221 Florida Pennsylvania West Virginia Pennsylvania Maryland 15 15 13 1822 Rhode Island Missouri Vermont South Carolina Massachusetts 5 5 6 523 Missouri West Virginia South Carolina West Virginia Michigan 4 4 4 624 West Virginia Rhode Island Wisconsin District of Columbia Minnesota 18 17 28 1525 Wisconsin South Carolina Delaware Rhode Island Mississippi 44 46 45 4626 Delaware Texas Texas Wisconsin Missouri 23 22 20 2027 Texas Delaware Rhode Island Texas Montana 36 38 40 3928 Kentucky Wisconsin Minnesota Delaware Nebraska 37 36 35 3429 District of Columbia District of Columbia Arizona Vermont Nevada 38 37 38 3730 Oklahoma Oklahoma Kansas Kansas New Hampshire 39 40 37 3631 South Carolina Kansas Connecticut Oklahoma New Jersey 13 12 14 1232 Kansas Arizona Oklahoma Arizona New Mexico 50 50 51 4433 Louisiana Kentucky Kentucky Kentucky New York 2 3 2 334 Connecticut Connecticut District of Columbia Nebraska North Carolina 16 20 18 1735 Arizona Louisiana Nebraska Connecticut North Dakota 45 48 — —36 Montana Nebraska Louisiana New Hampshire Ohio 3 2 3 237 Nebraska Nevada New Hampshire Nevada Oklahoma 30 30 32 3138 Nevada Montana Nevada Louisiana Oregon 19 19 17 1639 New Hampshire Maine Maine Montana Pennsylvania 17 21 19 2140 Tennessee New Hampshire Montana Tennessee Puerto Rico 48 49 50 4941 Maine Idaho Tennessee Arkansas Rhode Island 22 24 27 2542 Idaho Tennessee Arkansas Maine South Carolina 31 25 23 2243 South Dakota South Dakota Idaho Idaho South Dakota 43 43 46 4744 Mississippi Arkansas Utah New Mexico Tennessee 40 42 41 4045 North Dakota Utah Mississippi Utah Texas 27 26 26 2746 Utah Mississippi South Dakota Mississippi Utah 46 45 44 4547 Arkansas Virgin Islands Virgin Islands South Dakota Vermont 14 16 22 2948 Puerto Rico North Dakota Alaska Virgin Islands Virgin Islands 51 47 47 4849 Wyoming Puerto Rico Wyoming Puerto Rico Virginia 6 6 5 750 New Mexico New Mexico Puerto Rico Hawaii Washington 20 18 16 1451 Virgin Islands Wyoming New Mexico — West Virginia 24 23 21 2352 — Alaska — — Wisconsin 25 28 24 2653 — — — — Wyoming 49 51 49 —
— Not applicable.1 The lowest rank for FY97 and FY99 was 51, while the lowest rank for FY98 was 52, and the lowest rank for FY00 was 50.
NOTES: All rankings are based on dollar amounts. Volume measure is Direct Loan commitments. State is determined by the state location of the school that a Direct Loan borrower attends. Details may not add to totals due to rounding. Calculations are based on numbers before rounding. 0.0 indicates a number less than 0.05.
SOURCE: U.S. Department of Education, Office of Postsecondary Education, Direct Loan/Loan Origination System.

Federal Student Loan Programs D
ata Book �
FY 1997-FY 2000151
Loan Volume Commitments
Table 35. Federal Direct Loan Program (FDLP) loan volume commitments for Stafford Subsidized, Stafford Unsubsidized, and Parent Loans forUndergraduate Students (PLUS) loans, by state: FY 1997-FY 2000
Percent change Percent changeFY97 FY98 FY99 FY00 FY99-FY00 FY97-FY00 Percent share of total
Dollars Dollars Dollars Dollars Loans Dollars
State Loans ($ 000’s) Loans ($ 000’s) Loans ($ 000’s) Loans ($ 000’s) Loans Dollars Loans Dollars FY97 FY98 FY99 FY00 FY97 FY98 FY99 FY00
Alabama 90,246 $314,228 87,912 $310,806 94,591 $325,100 90,625 336,496 -4.2 3.5 0.4 7.1 3.0 2.9 3.2 3.0 2.9 2.8 3.0 2.8Alaska 876 2,365 1,108 3,088 1,367 3,924 1,280 3,707 -6.4 -5.5 46.1 56.8 0.0 0.0 0.0 0.0 0.0 0.0 0.0 0.0Arizona 64,304 240,922 70,371 248,399 75,308 264,139 66,765 249,580 -11.3 -5.5 3.8 3.6 2.1 2.3 2.5 2.2 2.2 2.2 2.5 2.1Arkansas 7,988 22,527 9,989 27,051 9,141 26,992 8,821 27,386 -3.5 1.5 10.4 21.6 0.3 0.3 0.3 0.3 0.2 0.2 0.3 0.2California 263,625 1,004,523 281,446 1,061,136 262,687 1,000,578 261,440 1,035,021 -0.5 3.4 -0.8 3.0 8.8 9.1 8.9 8.5 9.2 9.5 9.3 8.7Colorado 59,133 258,166 57,073 246,858 54,319 244,520 48,742 241,249 -10.3 -1.3 -17.6 -6.6 2.0 1.9 1.8 1.6 2.4 2.2 2.3 2.0Connecticut 13,807 42,564 16,523 52,570 18,960 59,489 17,253 54,957 -9.0 -7.6 25.0 29.1 0.5 0.5 0.6 0.6 0.4 0.5 0.6 0.5Delaware 12,310 47,204 13,364 52,232 14,040 53,267 13,114 54,877 -6.6 3.0 6.5 16.3 0.4 0.4 0.5 0.4 0.4 0.5 0.5 0.5District of Columbia 16,397 99,624 20,406 118,830 16,654 91,774 28,007 192,898 68.2 110.2 70.8 93.6 0.5 0.7 0.6 0.9 0.9 1.1 0.9 1.6Florida 84,503 284,856 91,020 317,027 97,150 343,941 106,264 380,194 9.4 10.5 25.8 33.5 2.8 3.0 3.3 3.5 2.6 2.8 3.2 3.2Georgia 133,707 455,752 151,268 525,620 122,858 447,584 121,886 466,641 -0.8 4.3 -8.8 2.4 4.5 4.9 4.2 4.0 4.2 4.7 4.2 3.9Guam 401 1,344 549 1,790 896 3,036 1,208 4,486 34.8 47.8 201.2 233.7 0.0 0.0 0.0 0.0 0.0 0.0 0.0 0.0Hawaii 201 378 368 715 400 893 386 837 -3.5 -6.2 92.0 121.3 0.0 0.0 0.0 0.0 0.0 0.0 0.0 0.0Idaho 35,187 115,756 36,141 113,874 33,490 106,793 32,818 110,732 -2.0 3.7 -6.7 -4.3 1.2 1.2 1.1 1.1 1.1 1.0 1.0 0.9Illinois 169,238 620,001 167,697 611,965 162,544 594,313 174,382 672,818 7.3 13.2 3.0 8.5 5.6 5.4 5.5 5.7 5.7 5.5 5.6 5.7Indiana 67,735 237,369 67,274 232,776 67,104 233,487 68,367 249,102 1.9 6.7 0.9 4.9 2.3 2.2 2.3 2.2 2.2 2.1 2.2 2.1Iowa 104,279 322,109 105,431 325,103 100,390 307,649 105,107 345,752 4.7 12.4 0.8 7.3 3.5 3.4 3.4 3.4 3.0 2.9 2.9 2.9Kansas 35,000 111,104 37,205 116,849 38,652 128,092 39,010 135,469 0.9 5.8 11.5 21.9 1.2 1.2 1.3 1.3 1.0 1.1 1.2 1.1Kentucky 52,610 154,446 49,469 145,764 39,140 113,261 37,261 113,843 -4.8 0.5 -29.2 -26.3 1.8 1.6 1.3 1.2 1.4 1.3 1.1 1.0Louisiana 12,524 49,833 11,087 44,477 12,112 51,371 11,540 45,693 -4.7 -11.1 -7.9 -8.3 0.4 0.4 0.4 0.4 0.5 0.4 0.5 0.4Maine 4,425 13,058 7,767 22,505 6,812 18,947 6,535 19,715 -4.1 4.1 47.7 51.0 0.1 0.3 0.2 0.2 0.1 0.2 0.2 0.2Maryland 49,691 199,663 54,293 220,607 55,400 220,977 65,765 270,757 18.7 22.5 32.3 35.6 1.7 1.8 1.9 2.1 1.8 2.0 2.1 2.3Massachusetts 132,806 588,997 119,397 547,443 118,409 522,725 123,554 576,720 4.3 10.3 -7.0 -2.1 4.4 3.9 4.0 4.0 5.4 4.9 4.9 4.9Michigan 214,638 718,653 220,212 727,820 210,666 729,910 215,447 792,225 2.3 8.5 0.4 10.2 7.2 7.2 7.1 7.0 6.6 6.5 6.8 6.7Minnesota 52,581 180,275 57,184 200,124 38,436 116,800 84,463 323,803 119.7 177.2 60.6 79.6 1.8 1.9 1.3 2.8 1.7 1.8 1.1 2.7Mississippi 9,767 20,914 7,796 18,276 9,879 27,242 6,951 21,645 -29.6 -20.5 -28.8 3.5 0.3 0.3 0.3 0.2 0.2 0.2 0.3 0.2Missouri 70,000 244,374 72,225 253,491 69,971 252,177 67,820 238,962 -3.1 -5.2 -3.1 -2.2 2.3 2.3 2.4 2.2 2.2 2.3 2.4 2.0Montana 11,660 34,117 11,643 33,398 10,435 31,092 9,881 32,884 -5.3 5.8 -15.3 -3.6 0.4 0.4 0.4 0.3 0.3 0.3 0.3 0.3Nebraska 20,761 60,376 20,699 61,180 20,783 63,523 21,423 70,269 3.1 10.6 3.2 16.4 0.7 0.7 0.7 0.7 0.6 0.5 0.6 0.6Nevada 9,930 33,588 11,359 38,686 11,408 39,678 11,797 44,362 3.4 11.8 18.8 32.1 0.3 0.4 0.4 0.4 0.3 0.3 0.4 0.4New Hampshire 2,457 10,356 2,320 9,421 6,909 24,224 7,853 26,916 13.7 11.1 219.6 159.9 0.1 0.1 0.2 0.3 0.1 0.1 0.2 0.2New Jersey 97,125 347,927 99,243 350,634 87,650 322,175 99,618 389,512 13.7 20.9 2.6 12.0 3.2 3.2 3.0 3.2 3.2 3.2 3.0 3.3New Mexico 16,810 63,366 18,961 74,731 17,923 70,420 16,266 68,203 -9.2 -3.1 -3.2 7.6 0.6 0.6 0.6 0.5 0.6 0.7 0.7 0.6New York 237,400 913,125 239,834 910,182 232,468 886,583 236,063 944,141 1.5 6.5 -0.6 3.4 7.9 7.8 7.9 7.7 8.4 8.2 8.3 8.0North Carolina 60,858 200,099 58,372 192,638 59,493 194,035 61,005 210,757 2.5 8.6 0.2 5.3 2.0 1.9 2.0 2.0 1.8 1.7 1.8 1.8North Dakota 1,429 4,463 86 244 — — 2 7 — — —99.9 —99.9 0.0 0.0 — 0.0 0.0 0.0 — 0.0Ohio 178,594 637,381 192,833 684,565 177,423 635,707 187,032 724,189 5.4 13.9 4.7 13.6 6.0 6.3 6.0 6.1 5.8 6.2 5.9 6.1Oklahoma 17,030 59,233 17,390 61,613 15,871 53,587 16,479 61,068 3.8 14.0 -3.2 3.1 0.6 0.6 0.5 0.5 0.5 0.6 0.5 0.5Oregon 63,739 248,532 66,598 263,598 69,488 267,955 71,016 297,409 2.2 11.0 11.4 19.7 2.1 2.2 2.3 2.3 2.3 2.4 2.5 2.5Pennsylvania 38,510 122,490 42,301 138,650 41,217 131,151 38,378 128,359 -6.9 -2.1 -0.3 4.8 1.3 1.4 1.4 1.3 1.1 1.2 1.2 1.1Puerto Rico 31,788 106,937 31,552 102,474 26,457 87,450 31,232 108,592 18.0 24.2 -1.7 1.5 1.1 1.0 0.9 1.0 1.0 0.9 0.8 0.9Rhode Island 20,102 94,239 18,187 82,306 16,067 70,510 18,763 88,073 16.8 24.9 -6.7 -6.5 0.7 0.6 0.5 0.6 0.9 0.7 0.7 0.7South Carolina 26,826 85,524 28,027 91,571 29,880 95,183 36,600 127,340 22.5 33.8 36.4 48.9 0.9 0.9 1.0 1.2 0.8 0.8 0.9 1.1South Dakota 2,079 5,181 3,065 7,665 2,786 6,745 1,582 3,620 -43.2 -46.3 -23.9 -30.1 0.1 0.1 0.1 0.1 0.0 0.1 0.1 0.0Tennessee 40,384 216,620 37,949 121,350 37,295 118,103 30,268 103,896 -18.8 -12.0 -25.0 -52.0 1.3 1.2 1.3 1.0 2.0 1.1 1.1 0.9Texas 46,645 155,514 46,696 156,640 48,111 157,719 46,378 159,018 -3.6 0.8 -0.6 2.3 1.6 1.5 1.6 1.5 1.4 1.4 1.5 1.3Utah 2,199 6,403 2,487 6,866 3,793 10,543 2,651 8,191 -30.1 -22.3 20.6 27.9 0.1 0.1 0.1 0.1 0.1 0.1 0.1 0.1Vermont 16,444 66,051 17,721 71,622 13,373 54,102 10,235 39,506 -23.5 -27.0 -37.8 -40.2 0.5 0.6 0.5 0.3 0.6 0.6 0.5 0.3Virgin Islands 540 1,651 369 1,084 482 1,073 422 1,069 -12.4 -0.3 -21.9 -35.2 0.0 0.0 0.0 0.0 0.0 0.0 0.0 0.0Virginia 130,102 516,325 128,477 519,857 119,211 480,548 129,776 552,529 8.9 15.0 -0.3 7.0 4.3 4.2 4.0 4.2 4.7 4.7 4.5 4.7Washington 67,023 251,104 66,618 264,636 68,075 243,799 66,190 282,719 -2.8 16.0 -1.2 12.6 2.2 2.2 2.3 2.2 2.3 2.4 2.3 2.4West Virginia 46,803 154,441 47,786 161,177 52,560 177,347 53,757 191,888 2.3 8.2 14.9 24.2 1.6 1.6 1.8 1.8 1.4 1.4 1.7 1.6Wisconsin 52,865 171,628 52,740 171,220 56,901 191,004 56,103 203,354 -1.4 6.5 6.1 18.5 1.8 1.7 1.9 1.8 1.6 1.5 1.8 1.7Wyoming 26 70 24 47 35 117 — — — — — — 0.0 0.0 0.0 — 0.0 0.0 0.0 —Total 2,998,108 $10,917,748 3,077,912 $11,125,252 2,957,470 $10,703,352 3,065,581 $11,833,438 3.7 10.6 2.3 8.4 100.0 100.0 100.0 100.0 100.0 100.0 100.0 100.0
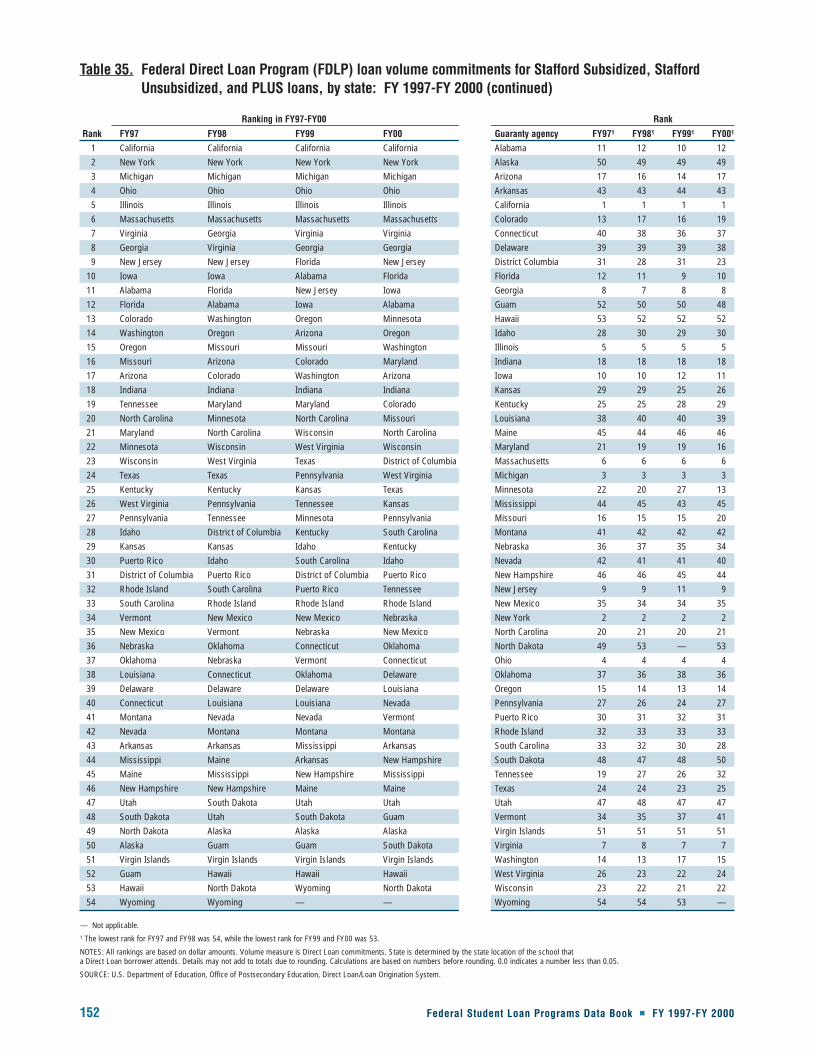
152 Federal Student Loan Programs Data Book � FY 1997-FY 2000
Table 35. Federal Direct Loan Program (FDLP) loan volume commitments for Stafford Subsidized, StaffordUnsubsidized, and PLUS loans, by state: FY 1997-FY 2000 (continued)
Ranking in FY97-FY00 Rank
Rank FY97 FY98 FY99 FY00 Guaranty agency FY971 FY981 FY991 FY001
1 California California California California Alabama 11 12 10 122 New York New York New York New York Alaska 50 49 49 493 Michigan Michigan Michigan Michigan Arizona 17 16 14 174 Ohio Ohio Ohio Ohio Arkansas 43 43 44 435 Illinois Illinois Illinois Illinois California 1 1 1 16 Massachusetts Massachusetts Massachusetts Massachusetts Colorado 13 17 16 197 Virginia Georgia Virginia Virginia Connecticut 40 38 36 378 Georgia Virginia Georgia Georgia Delaware 39 39 39 389 New Jersey New Jersey Florida New Jersey District Columbia 31 28 31 23
10 Iowa Iowa Alabama Florida Florida 12 11 9 1011 Alabama Florida New Jersey Iowa Georgia 8 7 8 812 Florida Alabama Iowa Alabama Guam 52 50 50 4813 Colorado Washington Oregon Minnesota Hawaii 53 52 52 5214 Washington Oregon Arizona Oregon Idaho 28 30 29 3015 Oregon Missouri Missouri Washington Illinois 5 5 5 516 Missouri Arizona Colorado Maryland Indiana 18 18 18 1817 Arizona Colorado Washington Arizona Iowa 10 10 12 1118 Indiana Indiana Indiana Indiana Kansas 29 29 25 2619 Tennessee Maryland Maryland Colorado Kentucky 25 25 28 2920 North Carolina Minnesota North Carolina Missouri Louisiana 38 40 40 3921 Maryland North Carolina Wisconsin North Carolina Maine 45 44 46 4622 Minnesota Wisconsin West Virginia Wisconsin Maryland 21 19 19 1623 Wisconsin West Virginia Texas District of Columbia Massachusetts 6 6 6 624 Texas Texas Pennsylvania West Virginia Michigan 3 3 3 325 Kentucky Kentucky Kansas Texas Minnesota 22 20 27 1326 West Virginia Pennsylvania Tennessee Kansas Mississippi 44 45 43 4527 Pennsylvania Tennessee Minnesota Pennsylvania Missouri 16 15 15 2028 Idaho District of Columbia Kentucky South Carolina Montana 41 42 42 4229 Kansas Kansas Idaho Kentucky Nebraska 36 37 35 3430 Puerto Rico Idaho South Carolina Idaho Nevada 42 41 41 4031 District of Columbia Puerto Rico District of Columbia Puerto Rico New Hampshire 46 46 45 4432 Rhode Island South Carolina Puerto Rico Tennessee New Jersey 9 9 11 933 South Carolina Rhode Island Rhode Island Rhode Island New Mexico 35 34 34 3534 Vermont New Mexico New Mexico Nebraska New York 2 2 2 235 New Mexico Vermont Nebraska New Mexico North Carolina 20 21 20 2136 Nebraska Oklahoma Connecticut Oklahoma North Dakota 49 53 — 5337 Oklahoma Nebraska Vermont Connecticut Ohio 4 4 4 438 Louisiana Connecticut Oklahoma Delaware Oklahoma 37 36 38 3639 Delaware Delaware Delaware Louisiana Oregon 15 14 13 1440 Connecticut Louisiana Louisiana Nevada Pennsylvania 27 26 24 2741 Montana Nevada Nevada Vermont Puerto Rico 30 31 32 3142 Nevada Montana Montana Montana Rhode Island 32 33 33 3343 Arkansas Arkansas Mississippi Arkansas South Carolina 33 32 30 2844 Mississippi Maine Arkansas New Hampshire South Dakota 48 47 48 5045 Maine Mississippi New Hampshire Mississippi Tennessee 19 27 26 3246 New Hampshire New Hampshire Maine Maine Texas 24 24 23 2547 Utah South Dakota Utah Utah Utah 47 48 47 4748 South Dakota Utah South Dakota Guam Vermont 34 35 37 4149 North Dakota Alaska Alaska Alaska Virgin Islands 51 51 51 5150 Alaska Guam Guam South Dakota Virginia 7 8 7 751 Virgin Islands Virgin Islands Virgin Islands Virgin Islands Washington 14 13 17 1552 Guam Hawaii Hawaii Hawaii West Virginia 26 23 22 2453 Hawaii North Dakota Wyoming North Dakota Wisconsin 23 22 21 2254 Wyoming Wyoming — — Wyoming 54 54 53 —
— Not applicable.1 The lowest rank for FY97 and FY98 was 54, while the lowest rank for FY99 and FY00 was 53.
NOTES: All rankings are based on dollar amounts. Volume measure is Direct Loan commitments. State is determined by the state location of the school that a Direct Loan borrower attends. Details may not add to totals due to rounding. Calculations are based on numbers before rounding. 0.0 indicates a number less than 0.05.
SOURCE: U.S. Department of Education, Office of Postsecondary Education, Direct Loan/Loan Origination System.

Loan program type
Number of loans
Loan
s (in
000
’s)
FY97
FY98
FY99
FY00
FFEL totalPLUSStafford UnsubsidizedStafford Subsidized0
500
1,000
1,500
2,000
2,500
3,000
3,500
1,709
1,148
208
3,066
1,691
1,079
187
2,957
1,803
1,081
195
3,078
1,792
1,025
181
2,998
Loan program type
Dollar amount
Dolla
rs (i
n 00
0,00
0’s) FY97
FY98
FY99
FY00
FFEL totalPLUSStafford UnsubsidizedStafford Subsidized0
2,000
4,000
6,000
8,000
10,000
12,000
$14,000
$6,033
$4,408
$1,393
$11,833
$5,686
$3,855
$1,162
$10,703
$6,141
$3,787
$1,198
$11,125
$6,233
$3,617
$1,068
$10,918
Figure 20. Federal Direct Loan Program (FDLP) loan volume commitments, by loan program type: FY 1997-FY 2000
SOURCE: U.S. Department of Education, Office of Postsecondary Education, Direct Loan/Loan Origination System.
SOURCE: U.S. Department of Education, Office of Postsecondary Education, Direct Loan/Loan Origination System.
Federal Student Loan Programs Data Book � FY 1997-FY 2000 153
Loan Volume Com
mitm
ents
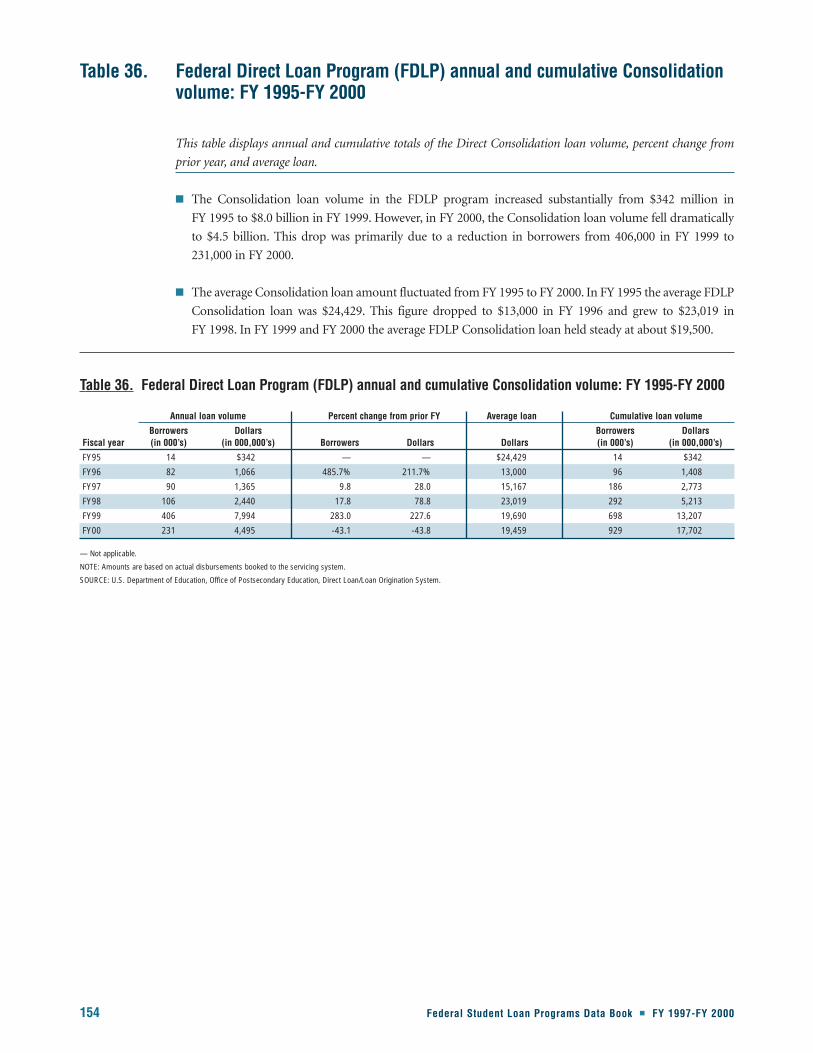
154 Federal Student Loan Programs Data Book � FY 1997-FY 2000
This table displays annual and cumulative totals of the Direct Consolidation loan volume, percent change from
prior year, and average loan.
� The Consolidation loan volume in the FDLP program increased substantially from $342 million in
FY 1995 to $8.0 billion in FY 1999. However, in FY 2000, the Consolidation loan volume fell dramatically
to $4.5 billion. This drop was primarily due to a reduction in borrowers from 406,000 in FY 1999 to
231,000 in FY 2000.
� The average Consolidation loan amount fluctuated from FY 1995 to FY 2000. In FY 1995 the average FDLP
Consolidation loan was $24,429. This figure dropped to $13,000 in FY 1996 and grew to $23,019 in
FY 1998. In FY 1999 and FY 2000 the average FDLP Consolidation loan held steady at about $19,500.
Table 36. Federal Direct Loan Program (FDLP) annual and cumulative Consolidationvolume: FY 1995-FY 2000
Table 36. Federal Direct Loan Program (FDLP) annual and cumulative Consolidation volume: FY 1995-FY 2000
Annual loan volume Percent change from prior FY Average loan Cumulative loan volume
Borrowers Dollars Borrowers DollarsFiscal year (in 000’s) (in 000,000’s) Borrowers Dollars Dollars (in 000’s) (in 000,000’s)
FY95 14 $342 — — $24,429 14 $342
FY96 82 1,066 485.7% 211.7% 13,000 96 1,408
FY97 90 1,365 9.8 28.0 15,167 186 2,773
FY98 106 2,440 17.8 78.8 23,019 292 5,213
FY99 406 7,994 283.0 227.6 19,690 698 13,207
FY00 231 4,495 -43.1 -43.8 19,459 929 17,702
— Not applicable.
NOTE: Amounts are based on actual disbursements booked to the servicing system.
SOURCE: U.S. Department of Education, Office of Postsecondary Education, Direct Loan/Loan Origination System.
These tables report the distribution of FFEL program borrowers and dollars disbursed, by type of institution,
through various loan program combinations. The number of borrowers and dollar amounts of each loan
combination is presented in addition to the percentage that each loan combination represents of the total
FFEL loan volume disbursed to students at the various types of institutions. (See also figure 21 which follows
tables 37-40.)
� During FY 1997-FY 2000, the majority of borrowers had either a Stafford Subsidized loan only or a
combination of Stafford Subsidized and Unsubsidized loans. In FY 1997, 44.3 percent of borrowers had a
Stafford Subsidized loan only, while 36.9 percent had the Stafford (Subsidized and Unsubsidized) loan
combination (see total column on table 37). By FY 2000, the percent of borrowers with a Stafford
Subsidized loan only decreased to 36.9 percent, while the percent of borrowers with the Stafford
(Subsidized and Unsubsidized) loan combination increased to 40.6 percent (see total column on table 40).
� In FY 1997-FY 2000, the largest proportion of FFEL program dollars was borrowed through the Stafford
(Subsidized and Unsubsidized) loan combination across all types of institutions. The proportion of all
FFEL program dollars borrowed through the Stafford (Subsidized and Unsubsidized) combination grew
slightly each year. During FY 1997-FY 2000, the proportion was 54.5, 55.1, 56.0, and 57.4 percent,
respectively (see total columns on tables 37-40).
� Borrowers at private 2-year, proprietary, and foreign institutions were more likely to have the Stafford
(Subsidized and Unsubsidized) loan combination than borrowers at other institutions. For example, in
FY 2000, 49 percent of borrowers at private 2-year institutions, 64.1 percent of borrowers at proprietary
institutions, and 82.7 percent of borrowers at foreign institutions had this combination. In contrast, one-
third of borrowers at public 2- and 4-year institutions and 39.8 percent of borrowers at private 4-year
institutions had Stafford Subsidized and Unsubsidized loans (see table 40).
� Between FY 1997 and FY 2000, more than 90 percent of FFEL dollars at foreign institutions were borrowed
through the Stafford (Subsidized and Unsubsidized) loan combination. This percentage was considerably
higher than at other institutions. For example, during this time, approximately 66 percent of FFEL dollars
at proprietary institutions and nearly 60 percent of FFEL dollars at private 2- and 4-year institutions were
borrowed through this combination (see tables 37-40).
Tables 37-40. Combinations of Federal Family Education Loan (FFEL) program participationamong Stafford Subsidized, Stafford Unsubsidized, and Parent Loans forUndergraduate Students (PLUS) borrowers, by type of institution: FY 1997-FY 2000
Federal Student Loan Programs Data Book � FY 1997-FY 2000 155
Loan Volume Com
mitm
ents
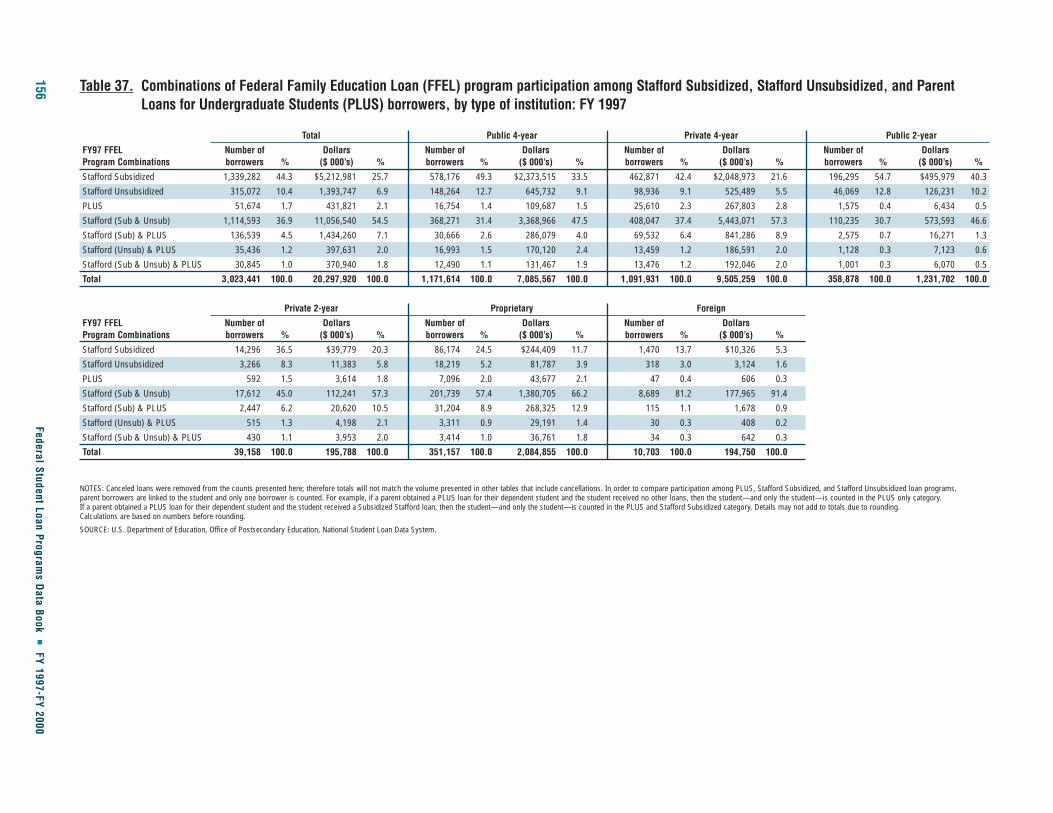
156Federal Student Loan Program
s Data Book
�FY 1997-FY 2000
Table 37. Combinations of Federal Family Education Loan (FFEL) program participation among Stafford Subsidized, Stafford Unsubsidized, and ParentLoans for Undergraduate Students (PLUS) borrowers, by type of institution: FY 1997
Total Public 4-year Private 4-year Public 2-year
FY97 FFEL Number of Dollars Number of Dollars Number of Dollars Number of DollarsProgram Combinations borrowers % ($ 000’s) % borrowers % ($ 000’s) % borrowers % ($ 000’s) % borrowers % ($ 000’s) %
Stafford Subsidized 1,339,282 44.3 $5,212,981 25.7 578,176 49.3 $2,373,515 33.5 462,871 42.4 $2,048,973 21.6 196,295 54.7 $495,979 40.3
Stafford Unsubsidized 315,072 10.4 1,393,747 6.9 148,264 12.7 645,732 9.1 98,936 9.1 525,489 5.5 46,069 12.8 126,231 10.2
PLUS 51,674 1.7 431,821 2.1 16,754 1.4 109,687 1.5 25,610 2.3 267,803 2.8 1,575 0.4 6,434 0.5
Stafford (Sub & Unsub) 1,114,593 36.9 11,056,540 54.5 368,271 31.4 3,368,966 47.5 408,047 37.4 5,443,071 57.3 110,235 30.7 573,593 46.6
Stafford (Sub) & PLUS 136,539 4.5 1,434,260 7.1 30,666 2.6 286,079 4.0 69,532 6.4 841,286 8.9 2,575 0.7 16,271 1.3
Stafford (Unsub) & PLUS 35,436 1.2 397,631 2.0 16,993 1.5 170,120 2.4 13,459 1.2 186,591 2.0 1,128 0.3 7,123 0.6
Stafford (Sub & Unsub) & PLUS 30,845 1.0 370,940 1.8 12,490 1.1 131,467 1.9 13,476 1.2 192,046 2.0 1,001 0.3 6,070 0.5
Total 3,023,441 100.0 20,297,920 100.0 1,171,614 100.0 7,085,567 100.0 1,091,931 100.0 9,505,259 100.0 358,878 100.0 1,231,702 100.0
Private 2-year Proprietary Foreign
FY97 FFEL Number of Dollars Number of Dollars Number of DollarsProgram Combinations borrowers % ($ 000’s) % borrowers % ($ 000’s) % borrowers % ($ 000’s) %
Stafford Subsidized 14,296 36.5 $39,779 20.3 86,174 24.5 $244,409 11.7 1,470 13.7 $10,326 5.3
Stafford Unsubsidized 3,266 8.3 11,383 5.8 18,219 5.2 81,787 3.9 318 3.0 3,124 1.6
PLUS 592 1.5 3,614 1.8 7,096 2.0 43,677 2.1 47 0.4 606 0.3
Stafford (Sub & Unsub) 17,612 45.0 112,241 57.3 201,739 57.4 1,380,705 66.2 8,689 81.2 177,965 91.4
Stafford (Sub) & PLUS 2,447 6.2 20,620 10.5 31,204 8.9 268,325 12.9 115 1.1 1,678 0.9
Stafford (Unsub) & PLUS 515 1.3 4,198 2.1 3,311 0.9 29,191 1.4 30 0.3 408 0.2
Stafford (Sub & Unsub) & PLUS 430 1.1 3,953 2.0 3,414 1.0 36,761 1.8 34 0.3 642 0.3
Total 39,158 100.0 195,788 100.0 351,157 100.0 2,084,855 100.0 10,703 100.0 194,750 100.0
NOTES: Canceled loans were removed from the counts presented here; therefore totals will not match the volume presented in other tables that include cancellations. In order to compare participation among PLUS, Stafford Subsidized, and Stafford Unsubsidized loan programs, parent borrowers are linked to the student and only one borrower is counted. For example, if a parent obtained a PLUS loan for their dependent student and the student received no other loans, then the student—and only the student—is counted in the PLUS only category. If a parent obtained a PLUS loan for their dependent student and the student received a Subsidized Stafford loan, then the student—and only the student—is counted in the PLUS and Stafford Subsidized category. Details may not add to totals due to rounding. Calculations are based on numbers before rounding.
SOURCE: U.S. Department of Education, Office of Postsecondary Education, National Student Loan Data System.
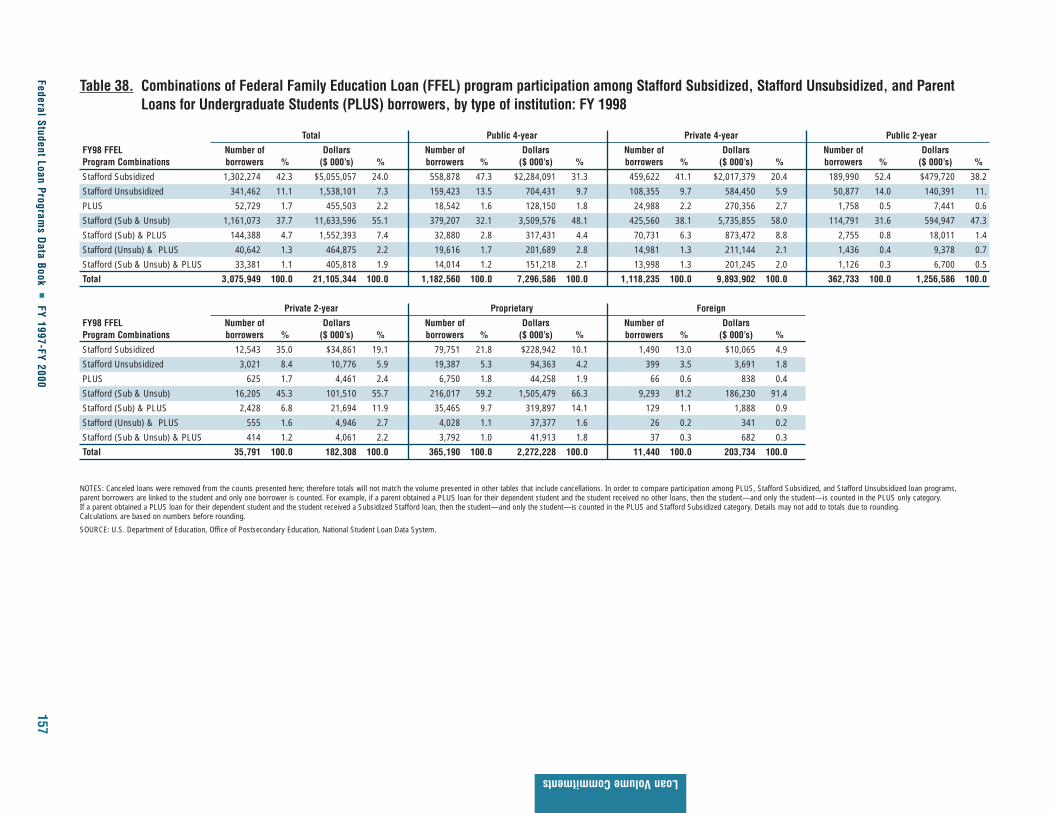
Federal Student Loan Programs D
ata Book �
FY 1997-FY 2000157
Loan Volume Commitments
Table 38. Combinations of Federal Family Education Loan (FFEL) program participation among Stafford Subsidized, Stafford Unsubsidized, and ParentLoans for Undergraduate Students (PLUS) borrowers, by type of institution: FY 1998
Total Public 4-year Private 4-year Public 2-year
FY98 FFEL Number of Dollars Number of Dollars Number of Dollars Number of DollarsProgram Combinations borrowers % ($ 000’s) % borrowers % ($ 000’s) % borrowers % ($ 000’s) % borrowers % ($ 000’s) %
Stafford Subsidized 1,302,274 42.3 $5,055,057 24.0 558,878 47.3 $2,284,091 31.3 459,622 41.1 $2,017,379 20.4 189,990 52.4 $479,720 38.2
Stafford Unsubsidized 341,462 11.1 1,538,101 7.3 159,423 13.5 704,431 9.7 108,355 9.7 584,450 5.9 50,877 14.0 140,391 11.
PLUS 52,729 1.7 455,503 2.2 18,542 1.6 128,150 1.8 24,988 2.2 270,356 2.7 1,758 0.5 7,441 0.6
Stafford (Sub & Unsub) 1,161,073 37.7 11,633,596 55.1 379,207 32.1 3,509,576 48.1 425,560 38.1 5,735,855 58.0 114,791 31.6 594,947 47.3
Stafford (Sub) & PLUS 144,388 4.7 1,552,393 7.4 32,880 2.8 317,431 4.4 70,731 6.3 873,472 8.8 2,755 0.8 18,011 1.4
Stafford (Unsub) & PLUS 40,642 1.3 464,875 2.2 19,616 1.7 201,689 2.8 14,981 1.3 211,144 2.1 1,436 0.4 9,378 0.7
Stafford (Sub & Unsub) & PLUS 33,381 1.1 405,818 1.9 14,014 1.2 151,218 2.1 13,998 1.3 201,245 2.0 1,126 0.3 6,700 0.5
Total 3,075,949 100.0 21,105,344 100.0 1,182,560 100.0 7,296,586 100.0 1,118,235 100.0 9,893,902 100.0 362,733 100.0 1,256,586 100.0
Private 2-year Proprietary Foreign
FY98 FFEL Number of Dollars Number of Dollars Number of DollarsProgram Combinations borrowers % ($ 000’s) % borrowers % ($ 000’s) % borrowers % ($ 000’s) %
Stafford Subsidized 12,543 35.0 $34,861 19.1 79,751 21.8 $228,942 10.1 1,490 13.0 $10,065 4.9
Stafford Unsubsidized 3,021 8.4 10,776 5.9 19,387 5.3 94,363 4.2 399 3.5 3,691 1.8
PLUS 625 1.7 4,461 2.4 6,750 1.8 44,258 1.9 66 0.6 838 0.4
Stafford (Sub & Unsub) 16,205 45.3 101,510 55.7 216,017 59.2 1,505,479 66.3 9,293 81.2 186,230 91.4
Stafford (Sub) & PLUS 2,428 6.8 21,694 11.9 35,465 9.7 319,897 14.1 129 1.1 1,888 0.9
Stafford (Unsub) & PLUS 555 1.6 4,946 2.7 4,028 1.1 37,377 1.6 26 0.2 341 0.2
Stafford (Sub & Unsub) & PLUS 414 1.2 4,061 2.2 3,792 1.0 41,913 1.8 37 0.3 682 0.3
Total 35,791 100.0 182,308 100.0 365,190 100.0 2,272,228 100.0 11,440 100.0 203,734 100.0
NOTES: Canceled loans were removed from the counts presented here; therefore totals will not match the volume presented in other tables that include cancellations. In order to compare participation among PLUS, Stafford Subsidized, and Stafford Unsubsidized loan programs, parent borrowers are linked to the student and only one borrower is counted. For example, if a parent obtained a PLUS loan for their dependent student and the student received no other loans, then the student—and only the student—is counted in the PLUS only category. If a parent obtained a PLUS loan for their dependent student and the student received a Subsidized Stafford loan, then the student—and only the student—is counted in the PLUS and Stafford Subsidized category. Details may not add to totals due to rounding. Calculations are based on numbers before rounding.
SOURCE: U.S. Department of Education, Office of Postsecondary Education, National Student Loan Data System.

158Federal Student Loan Program
s Data Book
�FY 1997-FY 2000
Table 39. Combinations of Federal Family Education Loan (FFEL) program participation among Stafford Subsidized, Stafford Unsubsidized, and ParentLoans for Undergraduate Students (PLUS) borrowers, by type of institution: FY 1999
Total Public 4-year Private 4-year Public 2-year
FY99 FFEL Number of Dollars Number of Dollars Number of Dollars Number of DollarsProgram Combinations borrowers % ($ 000’s) % borrowers % ($ 000’s) % borrowers % ($ 000’s) % borrowers % ($ 000’s) %
Stafford Subsidized 1,230,401 39.8 $4,737,869 21.7 531,352 44.8 $2,141,005 28.8 433,916 39.2 $1,889,144 18.8 173,263 50.6 $434,395 36.6
Stafford Unsubsidized 382,968 12.4 1,781,000 8.2 182,109 15.3 814,989 11.0 121,313 11.0 679,473 6.8 53,389 15.6 148,609 12.5
PLUS 57,976 1.9 523,328 2.4 20,443 1.7 147,543 2.0 27,521 2.5 308,668 3.1 1,929 0.6 8,299 0.7
Stafford (Sub & Unsub) 1,192,861 38.6 12,207,299 56.0 383,162 32.3 3,622,261 48.7 426,725 38.6 5,902,977 58.6 108,919 31.8 563,627 47.5
Stafford (Sub) & PLUS only 141,994 4.6 1,567,374 7.2 31,667 2.7 310,896 4.2 66,254 6.0 840,820 8.4 2,386 0.7 15,826 1.3
Stafford (Unsub) & PLUS 47,840 1.5 559,448 2.6 23,498 2.0 247,550 3.3 17,064 1.5 244,729 2.4 1,488 0.4 9,925 0.8
Stafford (Sub & Unsub) & PLUS 34,176 1.1 423,348 1.9 14,280 1.2 156,593 2.1 13,656 1.2 199,098 2.0 1,021 0.3 6,477 0.5
Total 3,088,216 100.0 21,799,666 100.0 1,186,511 100.0 7,440,838 100.0 1,106,449 100.0 10,064,909 100.0 342,395 100.0 1,187,159 100.0
Private 2-year Proprietary Foreign
FY99 FFEL Number of Dollars Number of Dollars Number of DollarsProgram Combinations borrowers % ($ 000’s) % borrowers % ($ 000’s) % borrowers % ($ 000’s) %
Stafford Subsidized 11,216 32.3 $30,851 16.8 79,146 19.5 $232,653 8.6 1,508 12.7 $9,821 4.6
Stafford Unsubsidized 3,137 9.0 11,180 6.1 22,693 5.6 123,943 4.6 327 2.7 2,805 1.3
PLUS 630 1.8 4,905 2.7 7,358 1.8 52,722 1.9 95 0.8 1,191 0.6
Stafford (Sub & Unsub) 16,169 46.6 103,114 56.2 248,147 61.1 1,820,650 67.2 9,739 81.8 194,669 91.7
Stafford (Sub) & PLUS only 2,479 7.1 23,072 12.6 39,040 9.6 374,126 13.8 168 1.4 2,633 1.2
Stafford (Unsub) & PLUS 573 1.7 5,207 2.8 5,185 1.3 51,606 1.9 32 0.3 431 0.2
Stafford (Sub & Unsub) & PLUS 492 1.4 5,286 2.9 4,685 1.2 55,198 2.0 42 0.4 696 0.3
Total 34,696 100.0 183,616 100.0 406,254 100.0 2,710,897 100.0 11,911 100.0 212,247 100.0
NOTES: Canceled loans were removed from the counts presented here; therefore totals will not match the volume presented in other tables that include cancellations. In order to compare participation among PLUS, Stafford Subsidized, and Stafford Unsubsidized loan programs, parent borrowers are linked to the student and only one borrower is counted. For example, if a parent obtained a PLUS loan for their dependent student and the student received no other loans, then the student—and only the student—is counted in the PLUS only category. If a parent obtained a PLUS loan for their dependent student and the student received a Subsidized Stafford loan, then the student—and only the student—is counted in the PLUS and Stafford Subsidized category. Details may not add to totals due to rounding. Calculations are based on numbers before rounding.
SOURCE: U.S. Department of Education, Office of Postsecondary Education, National Student Loan Data System.

Federal Student Loan Programs D
ata Book �
FY 1997-FY 2000159
Loan Volume Commitments
Table 40. Combinations of Federal Family Education Loan (FFEL) program participation among Stafford Subsidized, Stafford Unsubsidized and Parent Loansfor Undergraduate Students (PLUS) borrowers, by type of institution: FY 2000
Total Public 4-year Private 4-year Public 2-year
FY00 FFEL Number of Dollars Number of Dollars Number of Dollars Number of DollarsProgram Combinations borrowers % ($ 000’s) % borrowers % ($ 000’s) % borrowers % ($ 000’s) % borrowers % ($ 000’s) %
Stafford Subsidized 1,220,223 36.9 $4,776,508 19.6 525,713 41.8 $2,146,333 26.0 434,954 37.2 $1,927,464 17.5 170,562 47.8 $434,811 34.1
Stafford Unsubsidized 444,367 13.4 2,131,040 8.8 211,778 16.8 975,599 11.8 140,788 12.0 806,453 7.3 60,990 17.1 174,942 13.7
PLUS 56,467 1.7 533,775 2.2 18,808 1.5 139,186 1.7 26,731 2.3 316,426 2.9 1,772 0.5 8,101 0.6
Stafford (Sub & Unsub) 1,341,963 40.6 13,977,175 57.4 425,545 33.8 4,172,641 50.6 466,328 39.8 6,556,532 59.5 118,784 33.3 624,882 49.0
Stafford (Sub) & PLUS only 146,936 4.4 1,691,571 6.9 31,652 2.5 322,739 3.9 65,043 5.6 863,358 7.8 2,155 0.6 13,955 1.1
Stafford (Unsub) & PLUS 58,320 1.8 715,424 2.9 28,225 2.2 311,987 3.8 20,671 1.8 311,250 2.8 1,731 0.5 11,763 0.9
Stafford (Sub & Unsub) & PLUS 39,371 1.2 516,690 2.1 15,960 1.3 184,072 2.2 15,939 1.4 245,585 2.2 1,128 0.3 6,940 0.5
Total 3,307,647 100.0 24,342,183 100.0 1,257,681 100.0 8,252,556 100.0 1,170,454 100.0 11,027,068 100.0 357,122 100.0 1,275,393 100.0
Private 2-year Proprietary Foreign
FY00 FFEL Number of Dollars Number of Dollars Number of DollarsProgram Combinations borrowers % ($ 000’s) % borrowers % ($ 000’s) % borrowers % ($ 000’s) %
Stafford Subsidized 11,364 30.2 $31,539 15.5 76,258 16.1 $227,495 6.8 1,372 11.2 $8,867 4.0
Stafford Unsubsidized 3,408 9.1 12,806 6.3 27,033 5.7 157,973 4.7 370 3.0 3,266 1.5
PLUS 701 1.9 6,304 3.1 8,339 1.8 62,383 1.9 116 0.9 1,375 0.6
Stafford (Sub & Unsub) 18,429 49.0 118,340 58.3 302,756 64.1 2,299,737 68.4 10,121 82.7 205,043 92.2
Stafford (Sub) & PLUS only 2,597 6.9 23,038 11.4 45,313 9.6 466,024 13.9 176 1.4 2,457 1.1
Stafford (Unsub) & PLUS 654 1.7 6,243 3.1 7,002 1.5 73,615 2.2 37 0.3 566 N 0.3
Stafford (Sub & Unsub) & PLUS 428 1.1 4,574 2.3 5,871 1.2 74,690 2.2 45 0.4 829 0.4
Total 37,581 100.0 202,845 100.0 472,572 100.0 3,361,917 100.0 12,237 100.0 222,404 100.0
NOTES: Canceled loans were removed from the counts presented here; therefore totals will not match the volume presented in other tables that include cancellations. In order to compare participation among PLUS, Stafford Subsidized, and Stafford Unsubsidized loan programs, parent borrowers are linked to the student and only one borrower is counted. For example, if a parent obtained a PLUS loan for their dependent student and the student received no other loans, then the student—and only the student—is counted in the PLUS only category. If a parent obtained a PLUS loan for their dependent student and the student received a Subsidized Stafford loan, then the student—and only the student—is counted in the PLUS and Stafford Subsidized category. Details may not add to totals due to rounding. Calculations are based on numbers before rounding.
SOURCE: U.S. Department of Education, Office of Postsecondary Education, National Student Loan Data System.

160 Federal Student Loan Programs Data Book � FY 1997-FY 2000
FY00
Stafford Subsidized & Unsubsidized
57.4%
All other combinations5.0%
Stafford Subsidized19.6%
Stafford Subsidized & PLUS6.9%
Stafford Unsubsidized8.8%
PLUS2.2%
FY99
Stafford Subsidized & Unsubsidized
56.0%
All other combinations4.5%
Stafford Subsidized21.7%
Stafford Subsidized & PLUS7.2%
Stafford Unsubsidized8.2%
PLUS2.4%
Figure 21. Percentage distribution of the Federal Family Education Loan (FFEL) program dollar combinationsamong Stafford Subsidized, Stafford Unsubsidized, and Parent Loans for Undergraduate (PLUS)borrowers: FY 1997-FY 2000
SOURCE: U.S. Department of Education, Office of Postsecondary Education, National Student Loan Data System.
SOURCE: U.S. Department of Education, Office of Postsecondary Education, National Student Loan Data System.

FY98
Stafford Subsidized & Unsubsidized
55.1%
All other combinations4.1%
Stafford Subsidized24.0%
Stafford Subsidized & PLUS7.4%
Stafford Unsubsidized7.3%
PLUS2.2%
FY97
Stafford Subsidized & Unsubsidized
54.4%
All other combinations3.8%
Stafford Subsidized25.7%
Stafford Subsidized & PLUS7.1%
StaffordUnsubsidized
6.9%
PLUS2.1%
Figure 21. Percentage distribution of the Federal Family Education Loan (FFEL) program dollar combinationsamong Stafford Subsidized, Stafford Unsubsidized, and Parent Loans for Undergraduate (PLUS)borrowers: FY 1997-FY 2000 (continued)
SOURCE: U.S. Department of Education, Office of Postsecondary Education, National Student Loan Data System.
SOURCE: U.S. Department of Education, Office of Postsecondary Education, National Student Loan Data System.
Federal Student Loan Programs Data Book � FY 1997-FY 2000 161
Loan Volume Com
mitm
ents

This table shows the distribution of FDLP dollars committed to borrowers at each type of institution through the
various loan programs. The number of loans and dollar amount of each loan combination are presented in
addition to the percent each combination represents of the total FDLP loan volume committed to the various
institution types. (See also figure 22 which follows table 41.)
� Like borrowers in the FFEL program, the majority of FDLP borrowers had either a Stafford Subsidized loan
only or a combination of Stafford Subsidized and Unsubsidized loans. The percentage of FDLP borrowers
receiving the Stafford Subsidized and Unsubsidized loan combination held steady between FY 1997 and
FY 2000 at 34 percent. In addition, these borrowers accounted for nearly half of the total FDLP dollars.
� The proportion of FDLP borrowers receiving a Stafford Subsidized loan only decreased over time from
45.8 percent in FY 1997 to 40.2 percent in FY 2000. Furthermore, these borrowers accounted for a smaller
percentage of total FDLP dollars over time. For example, borrowers receiving a Stafford Subsidized loan
only accounted for 29 percent of total FDLP dollars in FY 1997 compared to 24 percent in FY 2000.
� The proportion of FDLP borrowers receiving Stafford Unsubsidized loans only increased from
11.3 percent in FY 1997 to 14.9 percent in FY 2000. The FDLP dollar volume going to these borrowers
increased from 7.9 percent of the total FDLP dollar volume to 10.3 percent.
� The distributions of FDLP borrowers and dollars at public and private 4-year institutions by loan
combination were similar to overall distributions. For example, approximately one-third of the borrowers
at these institutions had the Stafford Subsidized and Unsubsidized loan combination. These borrowers
accounted for nearly half of the FDLP dollars at public and private 4-year institutions.
� Borrowers at public 2-year institutions were more likely to borrow a Stafford Subsidized loan only than
borrowers at other institutions. From FY 1997 to FY 2000, approximately 55 percent of borrowers at public
2-year institutions had a Stafford Subsidized loan only. These borrowers accounted for 40 percent of the
FDLP dollars at these institutions.
� Borrowers at private 2-year and proprietary institutions were considerably more likely to borrow the
Stafford Subsidized and Unsubsidized loan combination. Approximately 6 in 10 borrowers at these
institutions had the Stafford loan combination. Furthermore, these borrowers accounted for two-thirds or
more of the FDLP dollars at these institutions.
Table 41. Federal Direct Loan Program (FDLP) combinations of participation amongStafford Subsidized, Stafford Unsubsidized, and Parent Loans forUndergraduate Students (PLUS) borrowers, by type of institution: FY 1997-FY 2000
162 Federal Student Loan Programs Data Book � FY 1997-FY 2000

Federal Student Loan Programs D
ata Book �
FY 1997-FY 2000163
Loan Volume Commitments
Table 41. Federal Direct Loan Program (FDLP) combinations of participation among Stafford Subsidized, Stafford Unsubsidized, and Parent Loans forUndergraduate Students (PLUS) borrowers, by type of institution: FY 1997-FY 2000
Total Public 4-year Private 4-year Public 2-year Private 2-year Proprietary
Number of Dollars Number of Dollars Number of Dollars Number of Dollars Number of Dollars Number of DollarsProgram combinations borrowers % (in 000’s) % borrowers % (in 000’s) % borrowers % (in 000’s) % borrowers % (in 000’s) % borrowers % (in 000’s) % borrowers % (in 000’s) %
FY97
Stafford Subsidized 729,983 45.8 $3,025,181 29.0 491,079 46.0 $2,115,423 30.2 153,766 49.6 $689,879 28.1 53,210 55.8 $132,728 40.1 955 29.2 $2,668 16.2 30,973 26.7 $84,482 13.3
Stafford Unsubsidized 179,366 11.3 821,424 7.9 136,256 12.8 628,805 9.0 25,584 8.3 135,327 5.5 11,306 11.8 31,300 9.5 173 5.3 687 4.2 6,047 5.2 25,306 4.0
PLUS 27,353 1.7 192,791 1.8 18,270 1.7 118,050 1.7 6,735 2.2 62,812 2.6 319 0.3 1,043 0.3 50 1.5 230 1.4 1,979 1.7 10,656 1.7
Stafford (Sub & Unsub) 546,877 34.3 5,171,028 49.6 347,235 32.5 3,322,634 47.5 99,257 32.0 1,237,146 50.4 29,752 31.2 161,253 48.7 1,834 56.1 10,740 65.4 68,799 59.3 439,256 69.4
Stafford (Sub) & PLUS 63,393 4.0 678,433 6.5 37,975 3.6 388,898 5.6 17,933 5.8 227,464 9.3 430 0.5 2,344 0.7 200 6.1 1,578 9.6 6,855 5.9 58,150 9.2
Stafford (Unsub) & PLUS 24,640 1.5 283,169 2.7 20,730 1.9 231,223 3.3 3,028 1.0 44,665 1.8 170 0.2 952 0.3 24 0.7 192 1.2 688 0.6 6,138 1.0
Stafford (Sub & Unsub) & PLUS 20,741 1.3 256,702 2.5 16,003 1.5 189,610 2.7 3,694 1.2 56,348 2.3 247 0.3 1,422 0.4 35 1.1 338 2.1 762 0.7 8,984 1.4
FY97 total 1,592,353 100.0 10,428,728 100.0 1,067,548 100.0 6,994,643 100.0 309,997 100.0 2,453,640 100.0 95,434 100.0 331,040 100.0 3,271 100.0 16,433 100.0 116,103 100.0 632,972 100.0
FY98
Stafford Subsidized 719,779 44.0 $2,920,704 27.2 482,388 44.4 $2,037,920 28.5 150,583 47.2 $658,721 26.0 54,126 55.6 $134,965 40.3 992 23.1 $2,775 12.6 31,690 24.9 $86,323 12.1
Stafford Unsubsidized 196,932 12.0 902,935 8.4 148,948 13.7 685,768 9.6 28,652 9.0 153,049 6.0 12,425 12.8 34,082 10.2 207 4.8 862 3.9 6,700 5.3 29,174 4.1
PLUS 28,612 1.7 212,856 2.0 18,779 1.7 126,325 1.8 7,608 2.4 74,354 2.9 320 0.3 1,126 0.3 60 1.4 299 1.4 1,845 1.4 10,751 1.5
Stafford (Sub & Unsub) 567,664 34.7 5,324,493 49.5 352,977 32.5 3,372,328 47.1 105,478 33.1 1,286,479 50.7 29,394 30.2 158,428 47.3 2,628 61.2 14,651 66.5 77,187 60.6 492,607 69.3
Stafford (Sub) & PLUS 69,627 4.3 761,234 7.1 41,719 3.8 437,165 6.1 18,869 5.9 246,672 9.7 564 0.6 3,347 1.0 299 7.0 2,287 10.4 8,176 6.4 71,762 10.1
Stafford (Unsub) & PLUS 29,172 1.8 341,965 3.2 24,316 2.2 276,399 3.9 3,677 1.2 55,306 2.2 252 0.3 1,506 0.4 52 1.2 516 2.3 875 0.7 8,238 1.2
Stafford (Sub & Unsub) & PLUS 23,352 1.4 293,073 2.7 18,089 1.7 217,500 3.0 3,970 1.2 61,357 2.4 273 0.3 1,581 0.5 56 1.3 652 3.0 964 0.8 11,984 1.7
FY98 total 1,635,138 100.0 10,757,259 100.0 1,087,216 100.0 7,153,405 100.0 318,837 100.0 2,535,938 100.0 97,354 100.0 335,034 100.0 4,294 100.0 22,043 100.0 127,437 100.0 710,839 100.0
FY99
Stafford Subsidized 675,877 42.6 $2,672,887 25.9 441,792 42.5 $1,827,633 27.1 150,305 47.2 $629,215 25.4 50,821 54.9 $125,900 39.8 1,024 24.4 $2,782 13.6 31,935 24.2 $87,356 11.7
Stafford Unsubsidized 217,925 13.7 986,739 9.6 165,126 15.9 748,027 11.1 32,217 10.1 170,664 6.9 12,870 13.9 35,242 11.1 235 5.6 886 4.3 7,477 5.7 31,921 4.3
PLUS 25,914 1.6 190,995 1.9 17,202 1.7 114,206 1.7 6,510 2.0 63,714 2.6 311 0.3 1,179 0.4 58 1.4 219 1.1 1,833 1.4 11,677 1.6
Stafford (Sub & Unsub) 543,585 34.3 5,068,851 49.2 334,674 32.2 3,169,905 47.0 100,750 31.7 1,231,616 49.8 27,558 29.8 147,890 46.8 2,518 59.9 13,879 67.6 78,085 59.3 505,561 67.5
Stafford (Sub) & PLUS 70,503 4.4 756,354 7.3 39,049 3.8 401,829 6.0 20,532 6.5 260,463 10.5 499 0.5 3,113 1.0 296 7.0 2,097 10.2 10,127 7.7 88,853 11.9
Stafford (Unsub) & PLUS 31,901 2.0 371,388 3.6 26,149 2.5 295,175 4.4 4,288 1.3 63,278 2.6 227 0.2 1,462 0.5 39 0.9 344 1.7 1,198 0.9 11,129 1.5
Stafford (Sub & Unsub) & PLUS 20,751 1.3 254,005 2.5 15,798 1.5 185,043 2.7 3,580 1.1 54,330 2.2 246 0.3 1,306 0.4 31 0.7 311 1.5 1,096 0.8 13,015 1.7
FY99 total 1,586,456 100.0 10,301,220 100.0 1,039,790 100.0 6,741,820 100.0 318,182 100.0 2,473,280 100.0 92,532 100.0 316,092 100.0 4,201 100.0 20,517 100.0 131,751 100.0 749,511 100.0
FY00
Stafford Subsidized 617,693 40.2 $2,505,687 24.0 400,548 39.8 $1,685,269 24.9 140,292 44.5 $618,756 23.3 47,627 53.6 $120,361 39.5 863 26.0 $2,162 13.0 28,363 23.2 $79,139 11.1
Stafford Unsubsidized 229,473 14.9 1,079,913 10.3 174,391 17.3 821,315 12.1 33,950 10.8 188,485 7.1 13,987 15.7 38,794 12.7 238 7.2 685 4.1 6,907 5.6 30,634 4.3
PLUS 28,395 1.8 222,000 2.1 19,267 1.9 134,840 2.0 6,477 2.1 69,756 2.6 355 0.4 1,467 0.5 47 1.4 210 1.3 2,249 1.8 15,727 2.2
Stafford (Sub & Unsub) 532,673 34.7 5,158,189 49.3 327,783 32.6 3,180,706 47.0 104,955 33.3 1,361,143 51.2 25,839 29.1 137,103 45.0 1,910 57.7 11,379 68.6 72,186 59.0 467,857 65.9
Stafford (Sub) & PLUS 68,280 4.4 759,256 7.3 37,241 3.7 391,038 5.8 20,284 6.4 273,878 10.3 543 0.6 3,264 1.1 200 6.0 1,612 9.7 10,012 8.2 89,464 12.6
Stafford (Unsub) & PLUS 36,815 2.4 438,815 4.2 29,989 3.0 345,269 5.1 5,027 1.6 77,636 2.9 298 0.3 1,953 0.6 34 1.0 303 1.8 1,467 1.2 13,654 1.9
Stafford (Sub & Unsub) & PLUS 22,719 1.5 288,422 2.8 17,032 1.7 203,924 3.0 4,278 1.4 69,115 2.6 245 0.3 1,611 0.5 21 0.6 235 1.4 1,143 0.9 13,537 1.9
FY00 total 1,536,048 100.0 10,452,282 100.0 1,006,251 100.0 6,762,362 100.0 315,263 100.0 2,658,768 100.0 88,894 100.0 304,553 100.0 3,313 100.0 16,587 100.0 122,327 100.0 710,013 100.0
NOTES: Volume measure is Direct Loan commitments. In order to compare participation among PLUS, Stafford Subsidized and Stafford Unsubsidized loan programs, parent borrowers are linked to the student and only one borrower is counted. For example, if a parent obtained a PLUS loan for their dependent student and the student received no other loans, then the student—and only the student—is counted in the PLUS only category. If a parent obtained a PLUS loan for their dependent student and the student received a Subsidized Stafford Loan, then the student—and only the student—is counted in the PLUS and Stafford Subsidized category. Details may not add to totals due to rounding. Calculations are based on numbers before rounding.
SOURCE: U.S. Department of Education, Office of Postsecondary Education, National Student Loan Data System.

FY00
Stafford Subsidized & Unsubsidized
49.3%
All other combinations7.0%
Stafford Subsidized24.0%
Stafford Subsidized & PLUS7.3%
StaffordUnsubsidized
10.3%
PLUS2.1%
FY99
Stafford Subsidized & Unsubsidized
49.2%
All other combinations6.1%
Stafford Subsidized25.9%
Stafford Subsidized & PLUS7.3%
StaffordUnsubsidized
9.6%
PLUS1.9%
Figure 22. Percentage distribution of Federal Direct Loan Program (FDLP) dollar combinations among StaffordSubsidized, Stafford Unsubsidized, and Parent Loans for Undergraduate Students (PLUS) borrowers:FY 1997-FY 2000
SOURCE: U.S. Department of Education, Office of Postsecondary Education, National Student Loan Data System.
SOURCE: U.S. Department of Education, Office of Postsecondary Education, National Student Loan Data System.
164 Federal Student Loan Programs Data Book � FY 1997-FY 2000

FY98
Stafford Subsidized & Unsubsidized
49.5%
All other combinations5.9%
Stafford Subsidized27.2%
Stafford Subsidized & PLUS7.1%
StaffordUnsubsidized
8.4%
PLUS2.0%
FY97
Stafford Subsidized & Unsubsidized
49.6%
All other combinations5.2%
Stafford Subsidized29.0%
Stafford Subsidized & PLUS6.5%
StaffordUnsubsidized
7.9%
PLUS1.8%
Figure 22. Percentage distribution of Federal Direct Loan Program (FDLP) dollar combinations among StaffordSubsidized, Stafford Unsubsidized, and Parent Loans for Undergraduate Students (PLUS) borrowers:FY 1997-FY 2000 (continued)
SOURCE: U.S. Department of Education, Office of Postsecondary Education, National Student Loan Data System.
SOURCE: U.S. Department of Education, Office of Postsecondary Education, National Student Loan Data System.
Federal Student Loan Programs Data Book � FY 1997-FY 2000 165
Loan Volume Com
mitm
ents

Dollars Outstanding and Guaranty Agency Characteristics
Federal Student Loan Programs Data Book � FY 1997-FY 2000 167
Part IIIFDLP and FFEL Program Dollars Outstanding and Guaranty Agency Characteristics

This table lists the quarterly 91-day Treasury Bill rates for FY86-FY00. (See also figure 23 which follows table 42.)
� From FY 1986 to FY 2000, rates for the 91-day Treasury Bills began at 7.4 percent, fluctuated over time, and
dropped to their lowest value (3.1 percent) in the fourth quarter of FY 1992. Over the next five quarters,
the average rate was either 3.1 or 3.2 percent.
� Treasury Bill rates began inching up again beginning in the third quarter of FY 1994, rising to 6.0 percent
in the second quarter of FY 1995.
� From FY 1996 through the first three quarters of FY 2000, rates varied between approximately 4.4 and
5.9 percent. In the fourth quarter of FY 2000, the average Treasury Bill rates increased to 6.2 percent.
Table 42. Weekly average 91-day Treasury Bill (bond equivalent) rates, by quarter: FY 1986-FY 2000
Federal Student Loan Programs Data Book � FY 1997-FY 2000 169
Dollars Outstanding and Guaranty Agency Characteristics

170 Federal Student Loan Programs Data Book � FY 1997-FY 2000
Table 42. Weekly average 91-day Treasury Bill (bond equivalent) rates, by quarter: FY 1986-FY 2000
Quarter ending
Fiscal year December 31 March 31 June 30 September 31
1986 7.4 7.1 6.3 5.7
1987 5.5 5.7 5.9 6.3
1988 6.2 5.9 6.4 7.2
1989 8.0 8.9 8.7 8.1
1990 7.9 8.0 8.0 7.7
1991 7.2 6.2 5.8 5.6
1992 4.7 4.0 3.8 3.1
1993 3.2 3.1 3.1 3.1
1994 3.1 3.3 4.2 4.6
1995 5.5 6.0 5.8 5.5
1996 5.4 5.1 5.2 5.3
1997 5.1 5.2 5.2 5.2
1998 5.2 5.2 5.1 5.0
1999 4.4 4.5 4.6 4.8
2000 5.2 5.7 5.9 6.2
NOTES: Special allowance rates to lenders participating in the Federal Family Education Loan (FFEL) program are based on the average weekly 91-day Treasury Bill (bond equivalent) rate for each quarter ofthe fiscal year. Data for earlier years appear in table A-42 in appendix I.
SOURCE: U.S. Department of Treasury.
Fiscal year
Rate
(per
cent
)
0
1
2
3
4
5
6
7
8
9
10%
FY00FY99FY98FY97FY96FY95FY94FY93FY92FY91FY90
Figure 23. Weekly average 91-day Treasury Bill (bond equivalent) rates, by quarter: FY 1990-FY 2000
NOTE: Data reported by quarter.
SOURCE: U.S. Department of Treasury.
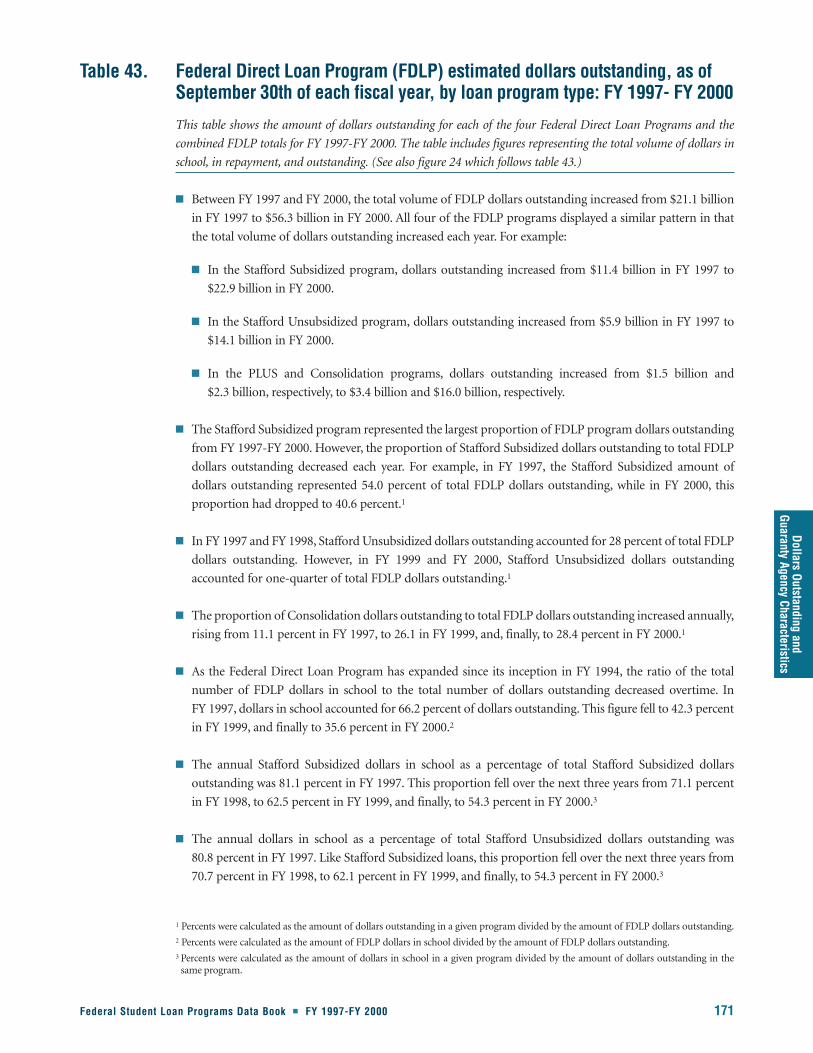
Dollars Outstanding and Guaranty Agency Characteristics
Federal Student Loan Programs Data Book � FY 1997-FY 2000 171
Table 43. Federal Direct Loan Program (FDLP) estimated dollars outstanding, as ofSeptember 30th of each fiscal year, by loan program type: FY 1997- FY 2000
This table shows the amount of dollars outstanding for each of the four Federal Direct Loan Programs and the
combined FDLP totals for FY 1997-FY 2000. The table includes figures representing the total volume of dollars in
school, in repayment, and outstanding. (See also figure 24 which follows table 43.)
� Between FY 1997 and FY 2000, the total volume of FDLP dollars outstanding increased from $21.1 billion
in FY 1997 to $56.3 billion in FY 2000. All four of the FDLP programs displayed a similar pattern in that
the total volume of dollars outstanding increased each year. For example:
� In the Stafford Subsidized program, dollars outstanding increased from $11.4 billion in FY 1997 to
$22.9 billion in FY 2000.
� In the Stafford Unsubsidized program, dollars outstanding increased from $5.9 billion in FY 1997 to
$14.1 billion in FY 2000.
� In the PLUS and Consolidation programs, dollars outstanding increased from $1.5 billion and
$2.3 billion, respectively, to $3.4 billion and $16.0 billion, respectively.
� The Stafford Subsidized program represented the largest proportion of FDLP program dollars outstanding
from FY 1997-FY 2000. However, the proportion of Stafford Subsidized dollars outstanding to total FDLP
dollars outstanding decreased each year. For example, in FY 1997, the Stafford Subsidized amount of
dollars outstanding represented 54.0 percent of total FDLP dollars outstanding, while in FY 2000, this
proportion had dropped to 40.6 percent.1
� In FY 1997 and FY 1998, Stafford Unsubsidized dollars outstanding accounted for 28 percent of total FDLP
dollars outstanding. However, in FY 1999 and FY 2000, Stafford Unsubsidized dollars outstanding
accounted for one-quarter of total FDLP dollars outstanding.1
� The proportion of Consolidation dollars outstanding to total FDLP dollars outstanding increased annually,
rising from 11.1 percent in FY 1997, to 26.1 in FY 1999, and, finally, to 28.4 percent in FY 2000.1
� As the Federal Direct Loan Program has expanded since its inception in FY 1994, the ratio of the total
number of FDLP dollars in school to the total number of dollars outstanding decreased overtime. In
FY 1997, dollars in school accounted for 66.2 percent of dollars outstanding. This figure fell to 42.3 percent
in FY 1999, and finally to 35.6 percent in FY 2000.2
� The annual Stafford Subsidized dollars in school as a percentage of total Stafford Subsidized dollars
outstanding was 81.1 percent in FY 1997. This proportion fell over the next three years from 71.1 percent
in FY 1998, to 62.5 percent in FY 1999, and finally, to 54.3 percent in FY 2000.3
� The annual dollars in school as a percentage of total Stafford Unsubsidized dollars outstanding was
80.8 percent in FY 1997. Like Stafford Subsidized loans, this proportion fell over the next three years from
70.7 percent in FY 1998, to 62.1 percent in FY 1999, and finally, to 54.3 percent in FY 2000.3
1 Percents were calculated as the amount of dollars outstanding in a given program divided by the amount of FDLP dollars outstanding.2 Percents were calculated as the amount of FDLP dollars in school divided by the amount of FDLP dollars outstanding.3 Percents were calculated as the amount of dollars in school in a given program divided by the amount of dollars outstanding in the
same program.
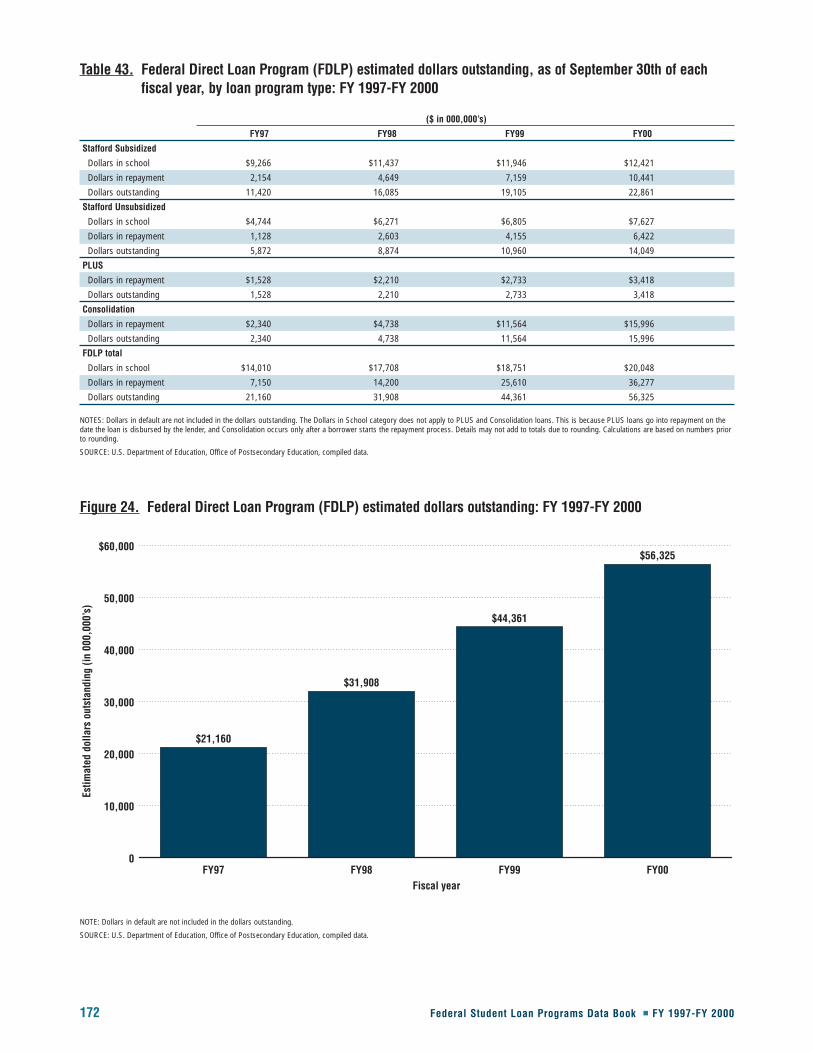
172 Federal Student Loan Programs Data Book � FY 1997-FY 2000
Table 43. Federal Direct Loan Program (FDLP) estimated dollars outstanding, as of September 30th of eachfiscal year, by loan program type: FY 1997-FY 2000
($ in 000,000’s)
FY97 FY98 FY99 FY00
Stafford Subsidized
Dollars in school $9,266 $11,437 $11,946 $12,421
Dollars in repayment 2,154 4,649 7,159 10,441
Dollars outstanding 11,420 16,085 19,105 22,861
Stafford Unsubsidized
Dollars in school $4,744 $6,271 $6,805 $7,627
Dollars in repayment 1,128 2,603 4,155 6,422
Dollars outstanding 5,872 8,874 10,960 14,049
PLUS
Dollars in repayment $1,528 $2,210 $2,733 $3,418
Dollars outstanding 1,528 2,210 2,733 3,418
Consolidation
Dollars in repayment $2,340 $4,738 $11,564 $15,996
Dollars outstanding 2,340 4,738 11,564 15,996
FDLP total
Dollars in school $14,010 $17,708 $18,751 $20,048
Dollars in repayment 7,150 14,200 25,610 36,277
Dollars outstanding 21,160 31,908 44,361 56,325
NOTES: Dollars in default are not included in the dollars outstanding. The Dollars in School category does not apply to PLUS and Consolidation loans. This is because PLUS loans go into repayment on thedate the loan is disbursed by the lender, and Consolidation occurs only after a borrower starts the repayment process. Details may not add to totals due to rounding. Calculations are based on numbers priorto rounding.
SOURCE: U.S. Department of Education, Office of Postsecondary Education, compiled data.
Fiscal year
Estim
ated
dol
lars
out
stan
ding
(in
000,
000’
s)
0
10,000
20,000
30,000
40,000
50,000
$60,000
$21,160
$31,908
$44,361
$56,325
FY00FY99FY98FY97
Figure 24. Federal Direct Loan Program (FDLP) estimated dollars outstanding: FY 1997-FY 2000
NOTE: Dollars in default are not included in the dollars outstanding.
SOURCE: U.S. Department of Education, Office of Postsecondary Education, compiled data.
Dollars Outstanding and Guaranty Agency Characteristics
Federal Student Loan Programs Data Book � FY 1997-FY 2000 173
This table shows the amount of dollars outstanding for each of the five FFEL programs and the combined FFEL
program totals for FY 1990-FY 2000. The table includes figures representing the total volume of dollars in school,
in repayment, and outstanding. (See also figure 25 which follows table 44.)
� Between FY 1990 and FY 2000, the total volume of FFEL program dollars outstanding increased each year,
from $54.1 billion in FY 1990 to $146.6 billion in FY 2000, a 170.8 percent increase. From FY 1993 to
FY 1999, total dollars outstanding increased by approximately $10.6 billion per year. From FY 1999 to
FY 2000 total dollars outstanding increased by $14.0 billion.
� The Stafford Subsidized, Stafford Unsubsidized, and PLUS programs each displayed a similar pattern in that
the total volume of dollars outstanding increased each year. However, within the Stafford Subsidized
program,dollarsoutstandingincreasedataslowerrate from$45.4billioninFY1990to$69.7billioninFY2000,
an increase of 53.5 percent. In contrast, the dollars outstanding in the Stafford Unsubsidized program
increased from $1.7 billion to $37.1 billion between FY1994 and FY2000, an increase of 2,035.6 percent. The
dollars outstanding in the PLUS program increased 314.7 percent from $2.0 billion in FY1990 to $8.4 billion
in FY2000.
� Like the other programs, dollars outstanding for Consolidation loans increased overtime from $2.2 billion
in FY 1990 to $28.4 billion, an increase of 1,186.8 percent.
� The Stafford Subsidized program had the largest proportion of FFEL program dollars outstanding from
FY 1990-FY 2000. In FY 1990, Stafford Subsidized dollars outstanding represented 83.9 percent of total
FFEL program dollars outstanding. However, by FY 2000, this proportion had decreased to 47.6 percent.4
� The proportion of the Stafford Unsubsidized dollars outstanding to total FFEL program dollars
outstanding increased annually, rising from 2.2 percent in FY 1994 to 17.4 percent in FY 1997, and finally,
to 25.3 percent in FY 2000.4
� The proportion of PLUS dollars outstanding to total FFEL dollars outstanding remained relatively steady
from FY 1992 through FY 2000, during which the proportion fluctuated between 5.3 percent and
5.8 percent.4
� The proportion of Consolidation dollars outstanding to total FFEL program dollars outstanding increased
annually, rising from 9.0 percent in FY 1994 to 15.6 percent in FY 1997, and finally, to 19.3 percent in
FY 2000.4
� The proportion of the total number of FFEL program dollars in school to the total number of FFEL
program dollars outstanding fluctuated between 32.2 and 35.2 between FY 1990 and FY 1994. In FY 1995,
this proportion peaked at 38.5 percent. Beginning in FY 1996 the proportion of the total number of dollars
in school to the total number of dollars outstanding decreased annually and stood at 30.1 percent in
FY 2000.5
Table 44. Federal Family Education Loan (FFEL) program estimated dollarsoutstanding, as of September 30th of each fiscal year, by loan programtype: FY 1990-FY 2000
4 Percents were calculated as the amount of dollars outstanding in a given program divided by the amount of FFEL dollars outstanding.5 Percents were calculated as the amount of FFEL dollars in school divided by the amount of FFEL dollars outstanding.6 Percents were calculated as the amount of dollars in school in a given program divided by the amount of dollars outstanding in the
same program.
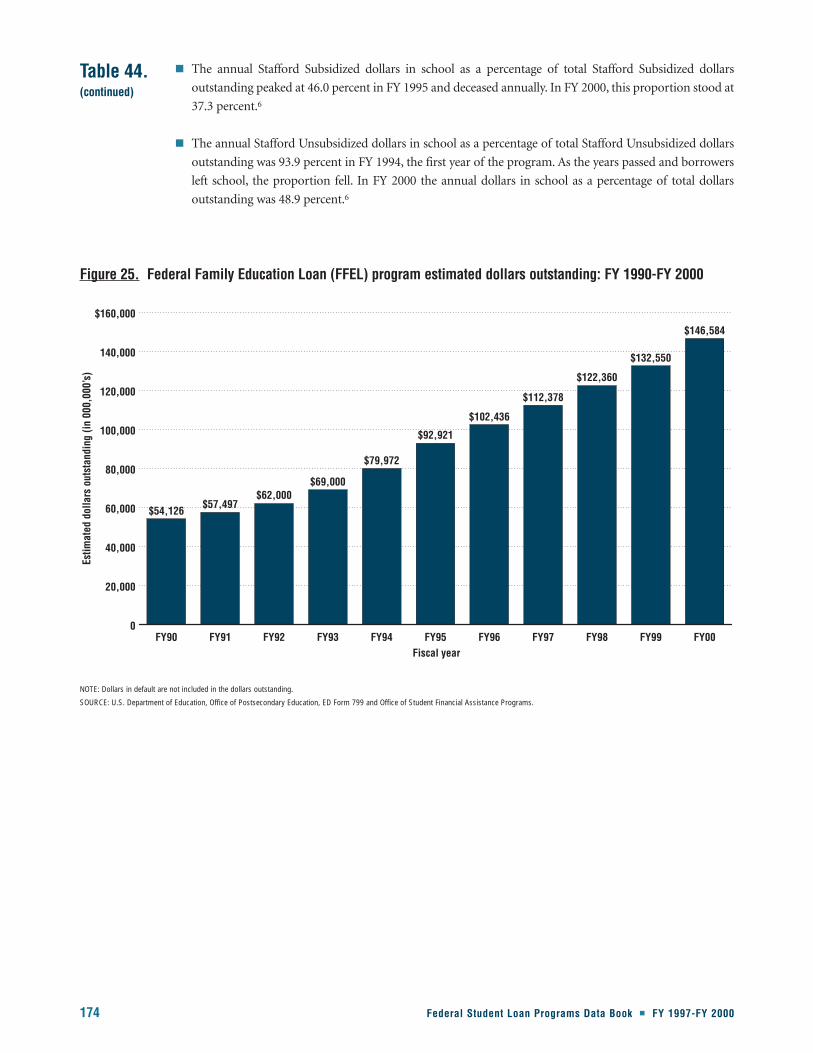
Table 44.(continued)
174 Federal Student Loan Programs Data Book � FY 1997-FY 2000
� The annual Stafford Subsidized dollars in school as a percentage of total Stafford Subsidized dollars
outstanding peaked at 46.0 percent in FY 1995 and deceased annually. In FY 2000, this proportion stood at
37.3 percent.6
� The annual Stafford Unsubsidized dollars in school as a percentage of total Stafford Unsubsidized dollars
outstanding was 93.9 percent in FY 1994, the first year of the program. As the years passed and borrowers
left school, the proportion fell. In FY 2000 the annual dollars in school as a percentage of total dollars
outstanding was 48.9 percent.6
Fiscal year
Estim
ated
dol
lars
out
stan
ding
(in
000,
000’
s)
0
20,000
40,000
60,000
80,000
100,000
120,000
140,000
$160,000
$54,126$57,497
$62,000$69,000
$79,972
$92,921
$102,436
$112,378
$122,360
$132,550
$146,584
FY00FY99FY98FY97FY96FY95FY94FY93FY92FY91FY90
Figure 25. Federal Family Education Loan (FFEL) program estimated dollars outstanding: FY 1990-FY 2000
NOTE: Dollars in default are not included in the dollars outstanding.
SOURCE: U.S. Department of Education, Office of Postsecondary Education, ED Form 799 and Office of Student Financial Assistance Programs.

Federal Student Loan Programs D
ata Book �
FY 1997-FY 2000175
Dollars Outstanding and Guaranty Agency Characteristics
Table 44. Federal Family Education Loan (FFEL) program estimated dollars outstanding, as of September 30th of each fiscal year, by loan program type: FY 1990-FY 2000
(in 000,000’s)
FY90 FY91 FY92 FY93 FY94 FY95 FY96 FY97 FY98 FY99 FY00
Stafford Subsidized/FISLP
Dollars in school $19,041 $18,500 $20,134 $22,200 $25,559 $27,916 $26,993 $26,521 $26,051 $26,030 $26,014
Dollars in repayment 26,388 28,479 28,495 29,743 32,038 32,753 35,093 37,401 39,901 41,563 43,709
Dollars outstanding 45,429 46,979 48,629 51,943 57,597 60,669 62,086 63,922 65,952 67,593 69,723
Stafford Unsubsidized1
Dollars in school — — — — $1,631 $7,898 $10,594 $12,876 $14,615 $16,309 $18,165
Dollars in repayment — — — — 106 1,011 3,423 6,681 10,714 14,582 18,931
Dollars outstanding — — — — 1,737 8,909 14,017 19,557 25,329 30,891 37,096
PLUS
Dollars in repayment $2,037 $2,607 $3,269 $3,968 $4,434 $5,111 $5,632 $6,261 $6,974 $7,595 $8,447
Dollars outstanding 2,037 2,607 3,269 3,968 4,434 5,111 5,632 6,261 6,974 7,595 8,447
SLS2
Dollars in repayment $4,457 $4,684 $5,618 $7,141 $9,026 $7,400 $6,155 $5,149 $4,405 $3,564 $2,970
Dollars outstanding 4,457 4,684 5,618 7,141 9,026 7,400 6,155 5,149 4,405 3,564 2,970
Consolidation
Dollars in repayment $2,203 $3,227 $4,484 $5,948 $7,178 $10,832 $14,546 $17,489 $19,700 $22,907 $28,348
Dollars outstanding 2,203 3,227 4,484 5,948 7,178 10,832 14,546 17,489 19,700 22,907 28,348
FFEL program total
Dollars in school $19,041 $18,500 $20,134 $22,200 $27,190 $35,814 $37,587 $39,397 $40,666 $42,339 $44,179
Dollars in repayment 35,085 38,997 41,866 46,800 52,782 57,107 64,849 72,981 81,694 90,211 102,405
Dollars outstanding 54,126 57,497 62,000 69,000 79,972 92,921 102,436 112,378 122,360 132,550 146,584
— Not applicable.1 The Stafford Unsubsidized program began in FY93.2 The Supplemental Loan for Students (SLS) program disbursed its last loans in FY94.
NOTES: Dollars in default are not included in the dollars outstanding. The Dollars in School category does not apply to PLUS, SLS, and Consolidation loans. This is because PLUS and SLS loans go into repayment on the date the loan is disbursed by the lender, and Consolidation occursonly after a borrower starts the repayment process. Details may not add to totals due to rounding. Calculations are based on numbers prior to rounding. Data for earlier years appear in table A—44 in appendix I.
SOURCE: U.S. Department of Education, Office of Postsecondary Education, ED Form 799 and Office of Student Financial Assistance Programs.

176 Federal Student Loan Programs Data Book � FY 1997-FY 2000
Table 45. Sallie Mae loan purchases and warehousing advances: Calendar years1973-2000
This table shows Sallie Mae’s annual loan purchases and dollars outstanding for calendar years 1973-00, as well
as warehousing advances made to lenders. Sallie Mae provides a national secondary market for the Federal Family
Education Loan (FFEL) program. Its main functions are to purchase loans and to provide warehousing advances
to participating lenders. (See also figure 26 which follows table 45.)
� Sallie Mae’s annual student loan purchases are a substantial portion of FFEL program loans and thus it
holds a large proportion of outstanding FFEL program dollars. For example:
� In 1997 and 1998, Sallie Mae’s annual student loan purchases represented approximately 40 percent of
FFEL loan volume. However, in 1999, Sallie Mae’s loan acquisitions jumped 63 percent to $13.7 billion.
This increase was due in large part to Sallie Mae’s acquisition of the Nellie Mae Corporation and its loan
portfolio. As a result, Sallie Mae’s student loan purchases accounted for nearly 60 percent of FFEL loan
volume in 1999. During 2000, Sallie Mae’s loan acquisitions again increased considerably to $20.6 billion,
which accounted for 80 percent of FFEL loan volume (see table 1 for FFEL program loan volume).
� Between 1997 and 2000, Sallie Mae’s outstanding loan purchases grew from $29.4 billion to $37.6
billion, an increase of 28 percent. Despite this increase, Sallie Mae’s outstanding student loan purchases
represented consistently about one-quarter of FFEL program dollars outstanding during this time (see
table 37 for FFEL dollars outstanding).
� Annual and outstanding warehousing advances declined between 1997 and 2000. In 1997, Sallie Mae had
$1.9 billion and $2.5 billion in annual and outstanding warehousing advances, respectively. By 2000, annual
warehousing advances fell to $1.0 billion, while outstanding warehousing advances decreased to $0.8 billion.
Table 45. Sallie Mae loan purchases and warehousing advances: Calendar years 1973-2000
($ in 000,000’s)
Student loan purchases1 Warehousing advances
Calendar year Annual Outstanding Annual Outstanding
1973-89 $24,259 $72,626 $16,116 $53,628
1990 5,973 19,242 5,612 9,270
1991 6,301 22,068 3,952 9,395
1992 5,772 24,173 1,806 8,085
1993 6,675 26,804 1,813 7,034
1994 7,956 30,370 3,377 7,032
1995 9,380 34,336 2,250 3,865
1996 8,371 32,308 1,392 2,790
1997 9,040 29,4432 1,869 2,518
1998 8,417 28,2832 1,543 1,718
1999 13,680 33,8092 1,043 1,173
2000 20,563 37,6472 987 825
Cumulative total 126,387 391,109 41,759 107,333
1 Student loan purchases include Stafford Subsidized, Stafford Unsubsidized, Parent Loans for Undergraduate Students (PLUS), Supplemental Loan for Students (SLS), Federal Insured Student LoanProgram (FISLP), and Health Education Assistance Loans (HEAL).2 The dollar amounts for calendar years 1997, 1998, 1999, and 2000 represent approximately one-quarter of the FFEL program dollars outstanding. (See FFEL dollars outstanding in table 44.)
NOTES: Sallie Mae provides a national secondary market for the FFEL program. Its main function is to purchase loans and provide warehousing advances to participating lenders. Details may not add tototals due to rounding. Data for earlier years appear in table A-45 in appendix I.
SOURCE: Sallie Mae Annual Report.

Calendar year
Annual student loan purchases
Perc
ent o
f FFE
L pr
ogra
m d
olla
rs
0
20
40
60
80
100%
49% 47%
39% 37%34%
45%42% 42%
37%
59%
80%
20001999199819971996199519941993199219911990
Calendar year
Outstanding student loan purchases
Perc
ent o
f FFE
L pr
ogra
m d
olla
rs o
utst
andi
ng
36% 38% 39% 39% 38% 37%32%
26%23%
26% 26%
0
20
40
60
80
100%
20001999199819971996199519941993199219911990
Figure 26. Sallie Mae student loan purchases and Federal Family Education Loan (FFEL) program dollars:Calendar years 1990-2000
NOTES: The percentages reported here are computed from Sallie Mae data in table 43 and from FFEL program loan volume data in table 1.
SOURCE: Sallie Mae Annual Report.
NOTES: The percentages reported here are computed from Sallie Mae data in table 45 and from FFEL program data in table 44. Student loan purchases include Stafford Subsidized, Stafford Unsubsidized,Parent Loans for Undergraduate Students (PLUS), Supplemental Loan for Students (SLS), Federal Insured Student Loan Program (FISLP), and Health Education Assistance Loans.
SOURCE: Sallie Mae Annual Report.
Federal Student Loan Programs Data Book � FY 1997-FY 2000 177
Dollars Outstanding and Guaranty Agency Characteristics

This table presents the designated guarantors for the 50 states, 3 territories, and the District of Columbia as of
September 30, 2000. The guarantors listed are identified as either an agency within the state; the United Student
Aid Funds, Inc. (USAF), a private non-profit guaranty agency; or a state agency located outside the state. These
agencies are further classified in the table as either private non-profit or state agencies.
� In 34 states, FFEL program activity was guaranteed by a state agency within that state. For ten states, the
designated guarantor was a state agency in another state, while for another ten states, the designated
guarantor was the USAF. Designated guarantors can change from year to year, although they did not
between September 30, 1997 and September 30, 2000.
� In 28 states, FFEL program activity was guaranteed by a non-profit agency. In 26 states, program activity
was guaranteed by a state agency, either in-state or out-of-state.
Table 46. Federal Family Education Loan (FFEL) program designated guarantor,organizational type, and agency name, by state: Status as of September 30, 2000
178 Federal Student Loan Programs Data Book � FY 1997-FY 2000

Federal Student Loan Programs Data Book � FY 1997-FY 2000 179
Dollars Outstanding and Guaranty Agency Characteristics
Table 46. Federal Family Education Loan (FFEL) program designated guarantor, organizational type, andagency name, by state: Status as of September 30, 2000
Designated guarantor1 Organizational type
Non-profit StateState State USAF2 Other agency agency Guaranty agency
Alabama KENT. X Kentucky Higher Education Assistance AuthorityAlaska X X United Student Aid Funds, Inc.Arizona X X United Student Aid Funds, Inc.Arkansas X X Student Loan Guarantee Foundation of ArkansasCalifornia X X California Student Aid CommissionColorado X X Colorado Student Loan ProgramConnecticut X X Connecticut Student Loan FoundationDelaware PENN. X Pennsylvania Higher Education Assistance AgencyDistrict of Columbia MASS. X American Student AssistanceFlorida X X Florida Dept. of Ed. Office of Student Financial Asst.Georgia X X Georgia Higher Education Assistance CorporationHawaii X X United Student Aid Funds, Inc.Idaho WASH. X Northwest Education Loan AssociationIllinois X X Illinois Student Assistance CommissionIndiana X X United Student Aid Funds, Inc.Iowa X X Iowa College Student Aid CommissionKansas X X United Student Aid Funds, Inc.Kentucky X X Kentucky Higher Education Assistance AuthorityLouisiana X X Louisiana Office of Student Financial Assistance Comm.Maine X X Maine Ed. Assistance Division, Finance Auth. of MaineMaryland X X United Student Aid Funds, Inc.Massachusetts X X American Student AssistanceMichigan X X Michigan Higher Education Assistance AuthorityMinnesota WISC. X Great Lakes Higher Education CorporationMississippi X X United Student Aid Funds, Inc.Missouri X X Coordinating Board For Higher EducationMontana X X Montana Guaranteed Student Loan ProgramNebraska X X Nebraska Student Loan ProgramNevada X X United Student Aid Funds, Inc.New Hampshire X X New Hampshire Higher Ed. Assistance FoundationNew Jersey X X New Jersey Higher Education Assistance AuthorityNew Mexico X X New Mexico Student Loan Guarantee CorporationNew York X X New York State Higher Education Services Corp.North Carolina X X North Carolina State Education Assistance AuthorityNorth Dakota X X Student Loans of North DakotaOhio WISC. X Great Lakes Higher Education CorporationOklahoma X X Oklahoma Guaranteed Student Loan ProgramOregon X X Oregon State Scholarship CommissionPacific Islands X X United Student Aid Funds, Inc.Pennsylvania X X Pennsylvania Higher Education Assistance AgencyPuerto Rico WISC. X Great Lakes Higher Education CorporationRhode Island X X Rhode Island Higher Education Assistance AuthoritySouth Carolina X X South Carolina State Education Assistance AuthoritySouth Dakota X X Education Assistance CorporationTennessee X X Tennessee Student Assistance CorporationTexas X X Texas Guaranteed Student Loan CorporationUtah X X Utah Higher Education Assistance AuthorityVermont X X Vermont Student Assistance CorporationVirgin Islands WISC. X Great Lakes Higher Education CorporationVirginia ECMC X Educational Credit Management CorporationWashington X X Northwest Education Loan AssociationWest Virginia PENN. X Pennsylvania Higher Education Assistance AgencyWisconsin X X Great Lakes Higher Education CorporationWyoming X X United Student Aid Funds, Inc.Total 34 10 10 28 26Unduplicated total3 34 1 6 13 23
1 Includes Stafford (Subsidized and Unsubsidized), Parent Loans for Undergraduate Students (PLUS), and Consolidation loans.2 United Student Aid Funds, Inc.3 The unduplicated total row counts a guaranty agency only once although a guaranty agency may represent more than one state.NOTES: This table covers the 4-year period from September 30, 1997 through September 30, 2000. The designated guarantor information was the same in all four of these years.SOURCE: U.S. Department of Education, Office of Postsecondary Education, compiled data.

180 Federal Student Loan Programs Data Book � FY 1997-FY 2000
Table 47a. Federal Family Education Loan (FFEL) program cumulative cash reservesand reserve ratio, by guaranty agency: As of September 30, 1997 andSeptember 30, 1998
This table shows the cumulative cash reserves and the corresponding reserve ratio for 36 guaranty agencies for FY
1997 and FY 1998. The formulas used to calculate these numbers are also provided.
� Between September 30, 1997 and September 30, 1998, the FFEL program cumulative total cash reserves
increased 5.1 percent, rising from $2.1 to $2.2 billion. The reserve ratio remained at 1.5 during this period.
� The United Student Aid Funds, Inc. (USAF) reported the largest cumulative cash reserves for both FY 1997
and FY 1998 ($492.3 and $526.0 million, respectively). In contrast, New Mexico reported the smallest
cumulative cash reserves ($4.9 million each year).
� North Carolina reported the largest reserve ratio for both FY 1997 (3.4) and FY 1998 (2.8). ECMC reported
the smallest reserve ratio in FY 1997 (0.0) and FY 1998 (0.1).
� Between FY 1997 and FY 1998, the reserve ratio decreased at 20 guaranty agencies, increased at 10 guaranty
agencies, and remained the same at six guaranty agencies.
NOTES: Cumulative cash reserves are calculated by subtracting an agency’s cumulative use of funds to pay for claims, operating expenses,
and lender fees, among others, from that agency’s cumulative sources of funds from insurance premiums, state appropriations, and federal
advances, among others. Complete lists of both sources and use of funds are listed in table 47a under the “Formulas” column.
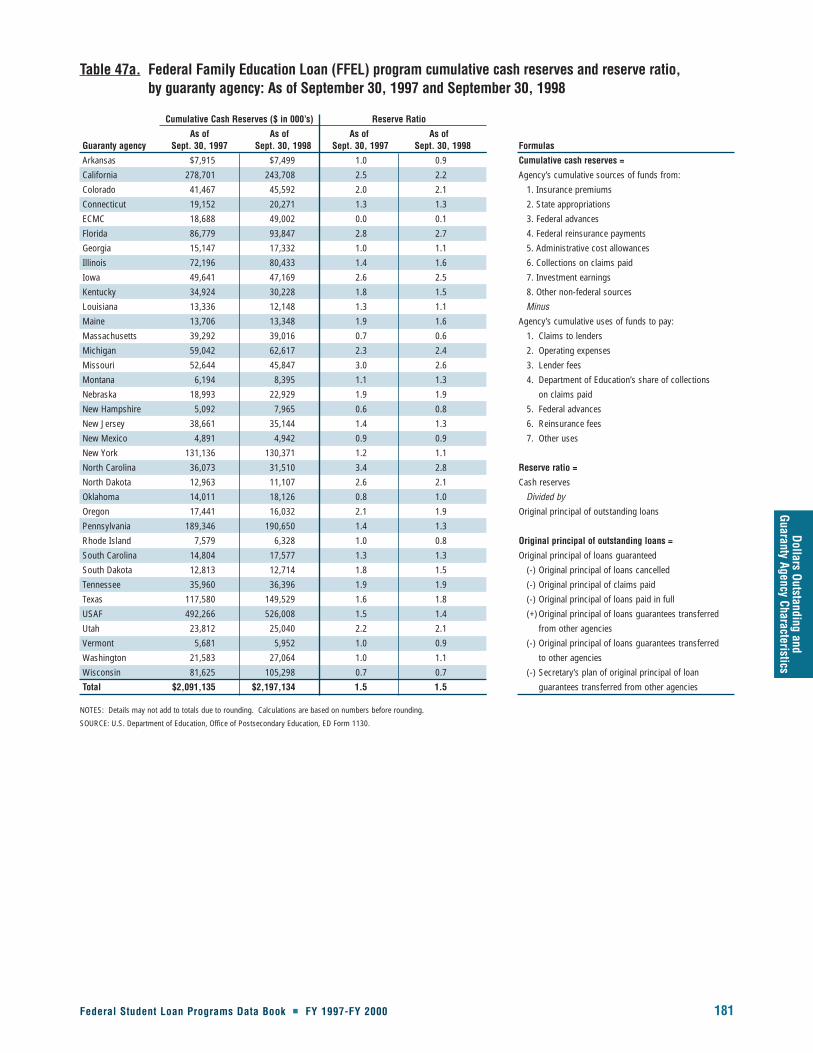
Federal Student Loan Programs Data Book � FY 1997-FY 2000 181
Dollars Outstanding and Guaranty Agency Characteristics
Table 47a. Federal Family Education Loan (FFEL) program cumulative cash reserves and reserve ratio, by guaranty agency: As of September 30, 1997 and September 30, 1998
Cumulative Cash Reserves ($ in 000’s) Reserve Ratio
As of As of As of As ofGuaranty agency Sept. 30, 1997 Sept. 30, 1998 Sept. 30, 1997 Sept. 30, 1998 Formulas
Arkansas $7,915 $7,499 1.0 0.9 Cumulative cash reserves =
California 278,701 243,708 2.5 2.2 Agency’s cumulative sources of funds from:
Colorado 41,467 45,592 2.0 2.1 1. Insurance premiums
Connecticut 19,152 20,271 1.3 1.3 2. State appropriations
ECMC 18,688 49,002 0.0 0.1 3. Federal advances
Florida 86,779 93,847 2.8 2.7 4. Federal reinsurance payments
Georgia 15,147 17,332 1.0 1.1 5. Administrative cost allowances
Illinois 72,196 80,433 1.4 1.6 6. Collections on claims paid
Iowa 49,641 47,169 2.6 2.5 7. Investment earnings
Kentucky 34,924 30,228 1.8 1.5 8. Other non-federal sources
Louisiana 13,336 12,148 1.3 1.1 Minus
Maine 13,706 13,348 1.9 1.6 Agency’s cumulative uses of funds to pay:
Massachusetts 39,292 39,016 0.7 0.6 1. Claims to lenders
Michigan 59,042 62,617 2.3 2.4 2. Operating expenses
Missouri 52,644 45,847 3.0 2.6 3. Lender fees
Montana 6,194 8,395 1.1 1.3 4. Department of Education’s share of collections
Nebraska 18,993 22,929 1.9 1.9 on claims paid
New Hampshire 5,092 7,965 0.6 0.8 5. Federal advances
New Jersey 38,661 35,144 1.4 1.3 6. Reinsurance fees
New Mexico 4,891 4,942 0.9 0.9 7. Other uses
New York 131,136 130,371 1.2 1.1
North Carolina 36,073 31,510 3.4 2.8 Reserve ratio =
North Dakota 12,963 11,107 2.6 2.1 Cash reserves
Oklahoma 14,011 18,126 0.8 1.0 Divided by
Oregon 17,441 16,032 2.1 1.9 Original principal of outstanding loans
Pennsylvania 189,346 190,650 1.4 1.3
Rhode Island 7,579 6,328 1.0 0.8 Original principal of outstanding loans =
South Carolina 14,804 17,577 1.3 1.3 Original principal of loans guaranteed
South Dakota 12,813 12,714 1.8 1.5 (-) Original principal of loans cancelled
Tennessee 35,960 36,396 1.9 1.9 (-) Original principal of claims paid
Texas 117,580 149,529 1.6 1.8 (-) Original principal of loans paid in full
USAF 492,266 526,008 1.5 1.4 (+)Original principal of loans guarantees transferred
Utah 23,812 25,040 2.2 2.1 from other agencies
Vermont 5,681 5,952 1.0 0.9 (-) Original principal of loans guarantees transferred
Washington 21,583 27,064 1.0 1.1 to other agencies
Wisconsin 81,625 105,298 0.7 0.7 (-) Secretary’s plan of original principal of loan
Total $2,091,135 $2,197,134 1.5 1.5 guarantees transferred from other agencies
NOTES: Details may not add to totals due to rounding. Calculations are based on numbers before rounding.
SOURCE: U.S. Department of Education, Office of Postsecondary Education, ED Form 1130.
This table presents federal, operating, and restricted funds for 36 agencies for FY 1999 and FY 2000. As part of the
Higher Education Amendments of 1998, the federal government provided seed money for guaranty agencies to
establish operating funds that cover administrative expenses such as loan-application processing, default-
prevention and collection activities, and compliance monitoring. Seed money was provided through a guaranty
agency’s Federal Student Loan Reserve Fund. Between FY 1999 and FY 2001, guaranty agencies could transfer up
to 45 percent of their reserve funds to their operating fund. Guaranty agencies are to invest these funds and return
the seed money to the Federal Reserve Fund within four years of establishing their operating fund.
� As of September 30, 1999, guaranty agencies had more than $2.5 billion in their federal, operating, and
restricted funds. Federal funds accounted for nearly three-quarters of this total, while operating funds and
restricted funds accounted for 11 and 16 percent, respectively. By September 30, 2000, the total amount in
the federal, operating, and restricted funds increased to $2.8 billion. However, federal funds declined to 62
percent of the total amount, while the operating and restricted funds grew to 16 and 22 percent,
respectively.
� In FY 1999, Rhode Island and Nebraska had more than one-third of their finances in operating funds. In
sharp contrast, Connecticut and ECMC did not have any funds in operating accounts, and six other
guaranty agencies (California, Maine, Kentucky, Colorado, Arkansas, and Pennsylvania) had five percent of
their funds or less in these accounts.
� In FY 2000, Rhode Island and Nebraska increased the percentage of their finances in operating funds to 39
and 43 percent, respectively. In addition, Texas, Oklahoma, South Carolina, and New York had a quarter of
their finances or more in operating funds. Only two guaranty agencies (Connecticut and Pennsylvania) had
five percent of their funds or less in operating accounts.
� All but five guaranty agencies increased the percentage of their funds in operating accounts between FY
1999 and FY 2000. On average, these agencies increased the percentage of funds in operating accounts by
five percent. However, four agencies (Texas, South Carolina, Wisconsin, and Nebraska) increased their
operating funds by 10 percent or more.
Table 47b. Federal Family Education Loan (FFEL) program federal, operating, andrestricted funds, by guaranty agency: As of September 30, 1999 andSeptember 30, 2000
182 Federal Student Loan Programs Data Book � FY 1997-FY 2000
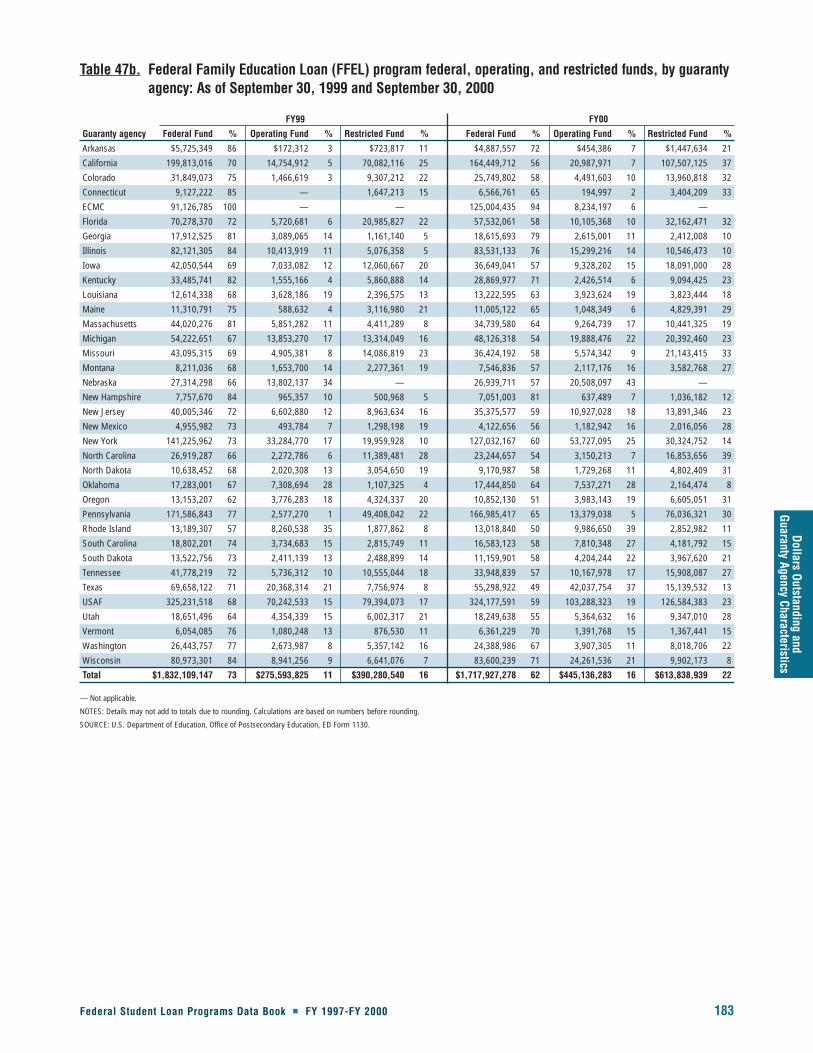
Federal Student Loan Programs Data Book � FY 1997-FY 2000 183
Dollars Outstanding and Guaranty Agency Characteristics
Table 47b. Federal Family Education Loan (FFEL) program federal, operating, and restricted funds, by guarantyagency: As of September 30, 1999 and September 30, 2000
FY99 FY00
Guaranty agency Federal Fund % Operating Fund % Restricted Fund % Federal Fund % Operating Fund % Restricted Fund %
Arkansas $5,725,349 86 $172,312 3 $723,817 11 $4,887,557 72 $454,386 7 $1,447,634 21
California 199,813,016 70 14,754,912 5 70,082,116 25 164,449,712 56 20,987,971 7 107,507,125 37
Colorado 31,849,073 75 1,466,619 3 9,307,212 22 25,749,802 58 4,491,603 10 13,960,818 32
Connecticut 9,127,222 85 — 1,647,213 15 6,566,761 65 194,997 2 3,404,209 33
ECMC 91,126,785 100 — — 125,004,435 94 8,234,197 6 —
Florida 70,278,370 72 5,720,681 6 20,985,827 22 57,532,061 58 10,105,368 10 32,162,471 32
Georgia 17,912,525 81 3,089,065 14 1,161,140 5 18,615,693 79 2,615,001 11 2,412,008 10
Illinois 82,121,305 84 10,413,919 11 5,076,358 5 83,531,133 76 15,299,216 14 10,546,473 10
Iowa 42,050,544 69 7,033,082 12 12,060,667 20 36,649,041 57 9,328,202 15 18,091,000 28
Kentucky 33,485,741 82 1,555,166 4 5,860,888 14 28,869,977 71 2,426,514 6 9,094,425 23
Louisiana 12,614,338 68 3,628,186 19 2,396,575 13 13,222,595 63 3,923,624 19 3,823,444 18
Maine 11,310,791 75 588,632 4 3,116,980 21 11,005,122 65 1,048,349 6 4,829,391 29
Massachusetts 44,020,276 81 5,851,282 11 4,411,289 8 34,739,580 64 9,264,739 17 10,441,325 19
Michigan 54,222,651 67 13,853,270 17 13,314,049 16 48,126,318 54 19,888,476 22 20,392,460 23
Missouri 43,095,315 69 4,905,381 8 14,086,819 23 36,424,192 58 5,574,342 9 21,143,415 33
Montana 8,211,036 68 1,653,700 14 2,277,361 19 7,546,836 57 2,117,176 16 3,582,768 27
Nebraska 27,314,298 66 13,802,137 34 — 26,939,711 57 20,508,097 43 —
New Hampshire 7,757,670 84 965,357 10 500,968 5 7,051,003 81 637,489 7 1,036,182 12
New Jersey 40,005,346 72 6,602,880 12 8,963,634 16 35,375,577 59 10,927,028 18 13,891,346 23
New Mexico 4,955,982 73 493,784 7 1,298,198 19 4,122,656 56 1,182,942 16 2,016,056 28
New York 141,225,962 73 33,284,770 17 19,959,928 10 127,032,167 60 53,727,095 25 30,324,752 14
North Carolina 26,919,287 66 2,272,786 6 11,389,481 28 23,244,657 54 3,150,213 7 16,853,656 39
North Dakota 10,638,452 68 2,020,308 13 3,054,650 19 9,170,987 58 1,729,268 11 4,802,409 31
Oklahoma 17,283,001 67 7,308,694 28 1,107,325 4 17,444,850 64 7,537,271 28 2,164,474 8
Oregon 13,153,207 62 3,776,283 18 4,324,337 20 10,852,130 51 3,983,143 19 6,605,051 31
Pennsylvania 171,586,843 77 2,577,270 1 49,408,042 22 166,985,417 65 13,379,038 5 76,036,321 30
Rhode Island 13,189,307 57 8,260,538 35 1,877,862 8 13,018,840 50 9,986,650 39 2,852,982 11
South Carolina 18,802,201 74 3,734,683 15 2,815,749 11 16,583,123 58 7,810,348 27 4,181,792 15
South Dakota 13,522,756 73 2,411,139 13 2,488,899 14 11,159,901 58 4,204,244 22 3,967,620 21
Tennessee 41,778,219 72 5,736,312 10 10,555,044 18 33,948,839 57 10,167,978 17 15,908,087 27
Texas 69,658,122 71 20,368,314 21 7,756,974 8 55,298,922 49 42,037,754 37 15,139,532 13
USAF 325,231,518 68 70,242,533 15 79,394,073 17 324,177,591 59 103,288,323 19 126,584,383 23
Utah 18,651,496 64 4,354,339 15 6,002,317 21 18,249,638 55 5,364,632 16 9,347,010 28
Vermont 6,054,085 76 1,080,248 13 876,530 11 6,361,229 70 1,391,768 15 1,367,441 15
Washington 26,443,757 77 2,673,987 8 5,357,142 16 24,388,986 67 3,907,305 11 8,018,706 22
Wisconsin 80,973,301 84 8,941,256 9 6,641,076 7 83,600,239 71 24,261,536 21 9,902,173 8
Total $1,832,109,147 73 $275,593,825 11 $390,280,540 16 $1,717,927,278 62 $445,136,283 16 $613,838,939 22
— Not applicable.
NOTES: Details may not add to totals due to rounding. Calculations are based on numbers before rounding.
SOURCE: U.S. Department of Education, Office of Postsecondary Education, ED Form 1130.
Defaults and Collections
Federal Student Loan Programs Data Book � FY 1997-FY 2000 185
Part IVFFEL Program and FDLP Defaults and Collections
This table shows the dollar amounts that each guaranty agency requested for federal reinsurance payments on
default claims in FY 1997-FY 2000. It also reports the amount of requested dollars paid, the percent of requested
dollars not paid, and the level of reinsurance. (See also figure 27 which follows table 48.)
� The amount of requested dollars paid decreased each year from FY 1997 to FY 2000. In FY 1997 the
amount of requested dollars paid stood at $3.2 billion. This figure fell to $3.1 billion in FY 1998, $2.5 billion
in FY 1999, and $2.2 billion in FY 2000.
� The percent of requests paid dropped just slightly from FY 1997 to FY 2000. In FY 1997 the percent of
requests paid stood at 99.1 percent. In FY 2000 this figure fell to 98.6 percent.
Table 48. Federal Family Education Loan (FFEL) program guaranty agencyreinsurance agreement default status: FY 1997-FY 2000
Federal Student Loan Programs Data Book � FY 1997-FY 2000 187
Defaults and Collections
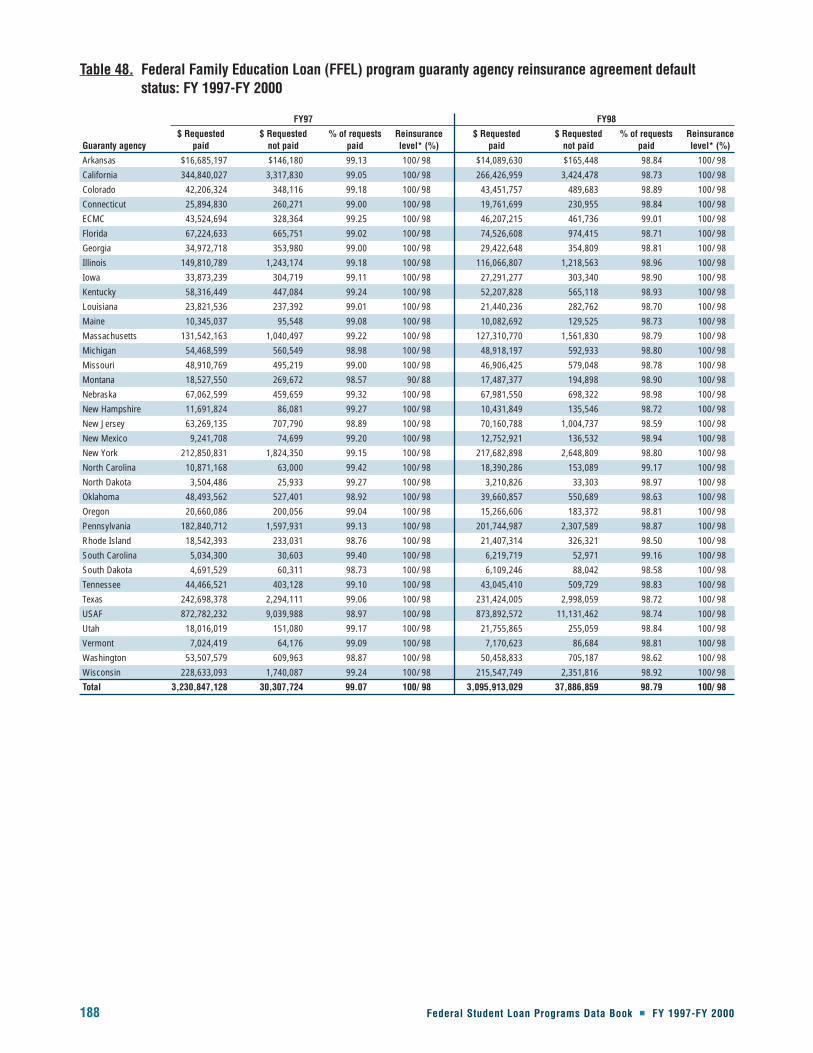
188 Federal Student Loan Programs Data Book � FY 1997-FY 2000
Table 48. Federal Family Education Loan (FFEL) program guaranty agency reinsurance agreement defaultstatus: FY 1997-FY 2000
FY97 FY98
$ Requested $ Requested % of requests Reinsurance $ Requested $ Requested % of requests ReinsuranceGuaranty agency paid not paid paid level* (%) paid not paid paid level* (%)
Arkansas $16,685,197 $146,180 99.13 100/ 98 $14,089,630 $165,448 98.84 100/ 98
California 344,840,027 3,317,830 99.05 100/ 98 266,426,959 3,424,478 98.73 100/ 98
Colorado 42,206,324 348,116 99.18 100/ 98 43,451,757 489,683 98.89 100/ 98
Connecticut 25,894,830 260,271 99.00 100/ 98 19,761,699 230,955 98.84 100/ 98
ECMC 43,524,694 328,364 99.25 100/ 98 46,207,215 461,736 99.01 100/ 98
Florida 67,224,633 665,751 99.02 100/ 98 74,526,608 974,415 98.71 100/ 98
Georgia 34,972,718 353,980 99.00 100/ 98 29,422,648 354,809 98.81 100/ 98
Illinois 149,810,789 1,243,174 99.18 100/ 98 116,066,807 1,218,563 98.96 100/ 98
Iowa 33,873,239 304,719 99.11 100/ 98 27,291,277 303,340 98.90 100/ 98
Kentucky 58,316,449 447,084 99.24 100/ 98 52,207,828 565,118 98.93 100/ 98
Louisiana 23,821,536 237,392 99.01 100/ 98 21,440,236 282,762 98.70 100/ 98
Maine 10,345,037 95,548 99.08 100/ 98 10,082,692 129,525 98.73 100/ 98
Massachusetts 131,542,163 1,040,497 99.22 100/ 98 127,310,770 1,561,830 98.79 100/ 98
Michigan 54,468,599 560,549 98.98 100/ 98 48,918,197 592,933 98.80 100/ 98
Missouri 48,910,769 495,219 99.00 100/ 98 46,906,425 579,048 98.78 100/ 98
Montana 18,527,550 269,672 98.57 90/ 88 17,487,377 194,898 98.90 100/ 98
Nebraska 67,062,599 459,659 99.32 100/ 98 67,981,550 698,322 98.98 100/ 98
New Hampshire 11,691,824 86,081 99.27 100/ 98 10,431,849 135,546 98.72 100/ 98
New Jersey 63,269,135 707,790 98.89 100/ 98 70,160,788 1,004,737 98.59 100/ 98
New Mexico 9,241,708 74,699 99.20 100/ 98 12,752,921 136,532 98.94 100/ 98
New York 212,850,831 1,824,350 99.15 100/ 98 217,682,898 2,648,809 98.80 100/ 98
North Carolina 10,871,168 63,000 99.42 100/ 98 18,390,286 153,089 99.17 100/ 98
North Dakota 3,504,486 25,933 99.27 100/ 98 3,210,826 33,303 98.97 100/ 98
Oklahoma 48,493,562 527,401 98.92 100/ 98 39,660,857 550,689 98.63 100/ 98
Oregon 20,660,086 200,056 99.04 100/ 98 15,266,606 183,372 98.81 100/ 98
Pennsylvania 182,840,712 1,597,931 99.13 100/ 98 201,744,987 2,307,589 98.87 100/ 98
Rhode Island 18,542,393 233,031 98.76 100/ 98 21,407,314 326,321 98.50 100/ 98
South Carolina 5,034,300 30,603 99.40 100/ 98 6,219,719 52,971 99.16 100/ 98
South Dakota 4,691,529 60,311 98.73 100/ 98 6,109,246 88,042 98.58 100/ 98
Tennessee 44,466,521 403,128 99.10 100/ 98 43,045,410 509,729 98.83 100/ 98
Texas 242,698,378 2,294,111 99.06 100/ 98 231,424,005 2,998,059 98.72 100/ 98
USAF 872,782,232 9,039,988 98.97 100/ 98 873,892,572 11,131,462 98.74 100/ 98
Utah 18,016,019 151,080 99.17 100/ 98 21,755,865 255,059 98.84 100/ 98
Vermont 7,024,419 64,176 99.09 100/ 98 7,170,623 86,684 98.81 100/ 98
Washington 53,507,579 609,963 98.87 100/ 98 50,458,833 705,187 98.62 100/ 98
Wisconsin 228,633,093 1,740,087 99.24 100/ 98 215,547,749 2,351,816 98.92 100/ 98
Total 3,230,847,128 30,307,724 99.07 100/ 98 3,095,913,029 37,886,859 98.79 100/ 98

Federal Student Loan Programs Data Book � FY 1997-FY 2000 189
Defaults and Collections
Table 48. Federal Family Education Loan (FFEL) program guaranty agency reinsurance agreement defaultstatus: FY 1997-FY 2000 (continued)
FY99 FY00
$ Requested $ Requested % of requests Reinsurance $ Requested $ Requested % of requests ReinsuranceGuaranty agency paid not paid paid level* (%) paid not paid paid level* (%)
Arkansas $12,969,302 $184,219 98.60 100/ 98 $13,204,202 $206,469 98.46 100/ 98
California 216,552,434 3,180,117 98.55 100/ 98 224,817,078 3,446,199 98.49 100/ 98
Colorado 33,864,702 474,314 98.62 100/ 98 26,120,640 411,794 98.45 100/ 98
Connecticut 16,268,662 257,336 98.44 100/ 98 14,580,970 243,937 98.35 100/ 98
ECMC 39,412,567 427,345 98.93 100/ 98 24,844,925 288,116 98.85 100/ 98
Florida 68,098,583 1,031,548 98.51 100/ 98 76,483,917 1,304,993 98.32 100/ 98
Georgia 26,700,790 380,921 98.59 100/ 98 23,810,729 389,551 98.39 100/ 98
Illinois 82,909,008 1,018,321 98.79 100/ 98 71,367,153 890,524 98.77 100/ 98
Iowa 24,675,998 315,773 98.74 100/ 98 25,765,415 360,652 98.62 100/ 98
Kentucky 29,406,247 367,883 98.76 100/ 98 25,258,555 390,445 98.48 100/ 98
Louisiana 22,238,062 326,102 98.55 100/ 98 17,508,330 271,913 98.47 100/ 98
Maine 7,407,565 107,440 98.57 100/ 98 10,401,867 159,035 98.49 100/ 98
Massachusetts 78,094,241 1,098,738 98.61 100/ 98 57,141,889 882,047 98.48 100/ 98
Michigan 45,310,496 592,863 98.71 100/ 98 40,674,402 561,857 98.64 100/ 98
Missouri 37,661,119 540,666 98.58 100/ 98 29,316,312 462,929 98.45 100/ 98
Montana 14,091,659 202,397 98.58 100/ 98 13,321,555 194,927 98.56 100/ 98
Nebraska 46,538,873 603,564 98.72 100/ 98 42,137,526 612,889 98.57 100/ 98
New Hampshire 4,030,177 52,945 98.70 100/ 98 4,929,755 74,729 98.51 100/ 98
New Jersey 44,002,374 648,025 98.55 100/ 98 30,251,878 511,752 98.34 100/ 98
New Mexico 10,541,138 145,409 98.64 100/ 98 15,320,018 233,741 98.50 100/ 98
New York 183,287,323 2,634,369 98.58 100/ 98 159,897,260 2,328,141 98.56 100/ 98
North Carolina 20,775,544 206,247 99.02 100/ 98 19,392,913 235,573 98.80 100/ 98
North Dakota 6,975,612 70,988 98.99 100/ 98 4,858,594 57,322 98.83 100/ 98
Oklahoma 36,482,718 561,512 98.48 100/ 98 33,915,359 552,922 98.40 100/ 98
Oregon 10,854,470 149,510 98.64 100/ 98 6,607,245 97,763 98.54 100/ 98
Pennsylvania 186,478,768 2,492,748 98.68 100/ 98 146,151,478 2,213,381 98.51 100/ 98
Rhode Island 17,487,738 301,769 98.30 100/ 98 14,345,515 244,777 98.32 100/ 98
South Carolina 8,716,424 98,144 98.89 100/ 98 7,078,181 93,462 98.70 100/ 98
South Dakota 5,424,488 89,176 98.38 100/ 98 5,286,545 92,538 98.28 100/ 98
Tennessee 38,235,848 552,066 98.58 100/ 98 33,188,485 518,031 98.46 100/ 98
Texas 177,719,633 2,526,312 98.60 100/ 98 153,195,631 2,294,446 98.52 100/ 98
USAF 690,889,819 9,721,376 98.61 100/ 98 632,967,808 9,277,240 98.56 100/ 98
Utah 8,997,931 128,058 98.60 100/ 98 8,330,614 131,061 98.45 100/ 98
Vermont 7,081,841 97,200 98.65 100/ 98 6,722,679 101,177 98.52 100/ 98
Washington 46,788,704 741,281 98.44 100/ 98 31,483,520 518,154 98.38 100/ 98
Wisconsin 187,060,456 2,343,048 98.76 100/ 98 138,559,105 1,390,697 99.01 100/ 98
Total 2,494,031,314 34,669,730 98.63 2,189,238,048 32,045,184 98.56
The reinsurance level for loans that went into default prior to October 1, 1993, was 100 percent. For loans that went into default after October 1, 1993, the reinsurance level was 98 percent.
NOTES: Details may not add to totals due to rounding.
SOURCE: U.S. Department of Education, Office of Postsecondary Education, ED Form 1189, guaranty agency statement of account finals
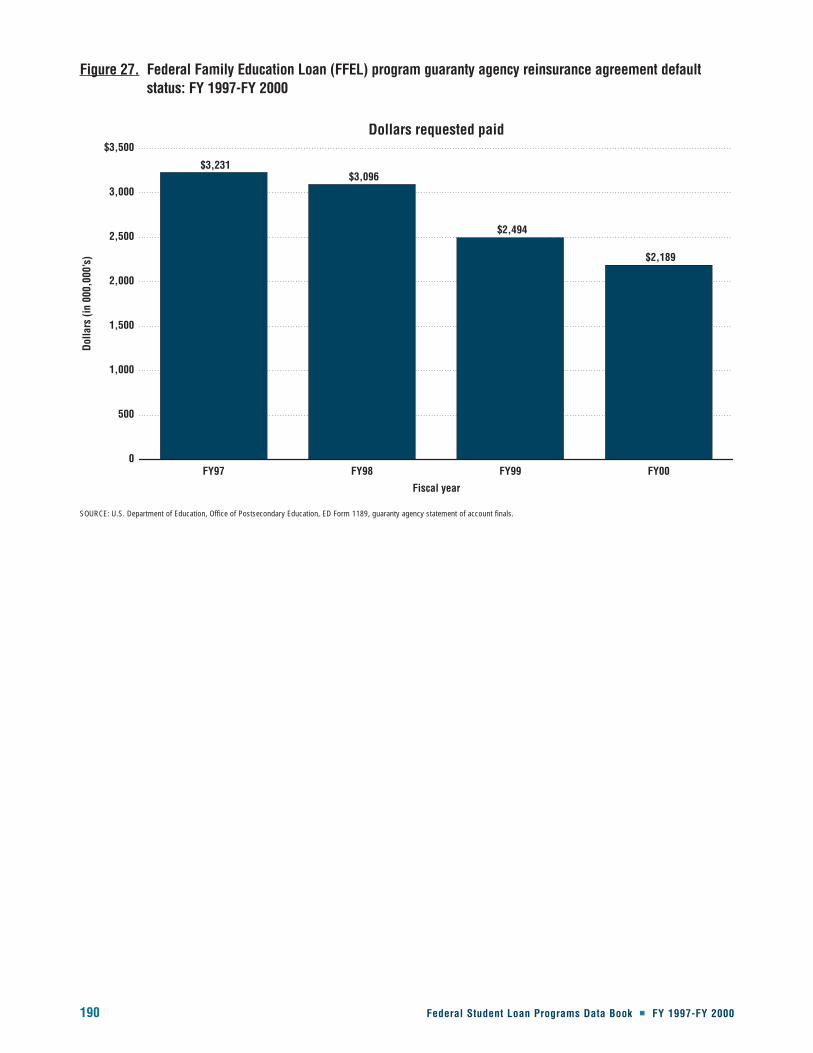
190 Federal Student Loan Programs Data Book � FY 1997-FY 2000
Fiscal year
Dollars requested paid
Dolla
rs (i
n 00
0,00
0’s)
0
500
1,000
1,500
2,000
2,500
3,000
$3,500
$3,231$3,096
$2,494
$2,189
FY00FY99FY98FY97
Figure 27. Federal Family Education Loan (FFEL) program guaranty agency reinsurance agreement defaultstatus: FY 1997-FY 2000
SOURCE: U.S. Department of Education, Office of Postsecondary Education, ED Form 1189, guaranty agency statement of account finals.

Defaults and Collections
Federal Student Loan Programs Data Book � FY 1997-FY 2000 191
Table 49. Federal Family Education Loan (FFEL) program annual and cumulativedefault dollars and collections: FY 1986-FY 2000
This table shows the total number of default dollars and collections for each FFEL program. In addition, the percent
change from prior year, percent share of FFEL program total, and cumulative totals for default and collection
activity are also provided for total FFEL program and each of the FFEL programs for FY 1986-FY 2000. (See also
figure 28 which follows table 49.)
� In FY 2000, guaranty agencies paid $2.1 billion default dollars to lenders and collected $4.7 billion.
� The annual default dollars paid to lenders fluctuated between FY 1990 and FY 2000. For example, default
dollars increased by 20 percent in FY 1991, then experienced declines until FY 1996. Although default
dollars increased by more than 10 percent in FY 1996 and FY 1997, default dollars decreased somewhat in
FY 1998 and considerably in FY 1999. The 31 percent decline in default dollars in FY 1999 was due, in part,
to the change in the definition of default from the Higher Education Amendments of 1998.
� In contrast to default dollars, collection dollars increased each year between FY 1990 and FY 2000, with the
exception of FY 1997. For example, collection dollars increased by 26.9 percent in FY 1998, 30.2 percent in
FY 1999, and 18.8 percent in FY 2000.
� Since FY 1990, Stafford Subsidized collection dollars increased in all but one year, and default dollars
decreased in all but three years. In FY 2000, defaults were $1.1 billion, and collections were $3.6 billion.
� Since the program’s inception,Stafford Unsubsidized collection dollars have increased every year,and default
dollars increased in all but one year. In FY2000,defaults were $513 million,and collections were $236 million.
� Annual collection dollars for Parent Loans for Undergraduate Students (PLUS) loans increased every year
from FY 1986 through FY 2000. Default dollars paid to lenders increased every year from FY 1986 though
FY 1996, but decreased each year starting in FY 1997. In FY 2000, defaults were $66 million, and collections
were $191 million.
� Although the Supplement Loan for Students (SLS) program ended in FY 1994, default and collection
activity continues for these loans. In general, SLS default dollars have decreased and collection dollars have
increased annually between FY 1990 and FY 2000. For example, in FY 1990 SLS default dollars stood at a
high of $636 million, and collection dollars were $33 million. By FY 2000, SLS defaults decreased to
$91 million, and collections increased to $212 million.
� Annual collection dollars for Consolidation loans increased every year from FY 1990 through FY 2000. In
addition, annual default dollars increased every year from FY 1988 through FY 1998. But in FY 1999 and
FY 2000 Consolidation loan default dollars decreased by 32.6 and 3.6 percent, respectively. In FY 2000,
defaults were $358 million, and collections were $485 million.

192 Federal Student Loan Programs Data Book � FY 1997-FY 2000
Table 49. Federal Family Education Loan (FFEL) program annual and cumulative default dollars and collections:FY 1986-FY 2000
Default dollars Percent Percent Annual Percent PercentCumulative dollars
paid to lenders change from share of collections change from share of (in 000,000’s)
Fiscal year (in 000,000’s) from prior FY totals (in 000,000’s) from prior FY totals Defaults Collections
FISLP1
1986 $80 9.8 5.9 $129 92.5 30.7 $1,196 $525
1987 31 -60.7 2.3 123 -4.7 22.9 1,227 648
1988 20 -35.3 1.4 97 -21.1 15.3 1,248 745
1989 19 -7.2 0.9 83 -14.4 11.1 1,266 828
1990 17 -7.5 0.6 70 -15.7 7.6 1,284 898
1991 17 -1.3 0.5 55 -21.4 5.2 1,301 953
1992 12 -32.2 0.4 55 0.0 4.0 1,312 1,008
1993 9 -26.7 0.3 43 -22.3 2.9 1,321 1,051
1994 7 -17.9 0.3 35 -18.1 1.8 1,328 1,086
1995 4 -42.9 0.2 20 -42.9 0.9 1,332 1,106
1996 1 -75.0 0.0 7 -65.0 0.3 1,333 1,113
Stafford Subsidized
1986 $1,262 32.9 92.9 $289 61.8 68.8 $4,405 $874
1987 1,295 2.6 95.9 410 41.7 76.3 5,700 1,283
1988 1,378 6.4 94.8 531 29.4 83.5 7,078 1,814
1989 1,675 21.6 82.2 650 22.5 86.9 8,753 2,464
1990 1,952 16.5 72.8 807 24.0 87.8 10,705 3,271
1991 2,436 24.8 75.6 916 13.6 86.2 13,141 4,187
1992 2,032 -16.6 76.5 1,160 26.6 84.4 15,173 5,347
1993 1,892 -6.9 75.8 1,271 9.6 85.0 17,065 6,618
1994 1,756 -7.2 73.1 1,735 36.5 90.3 18,821 8,353
1995 1,580 -10.0 68.9 2,088 20.3 89.8 20,401 10,441
1996 1,723 9.0 64.7 2,452 17.5 88.5 22,123 12,893
1997 1,734 0.7 58.0 2,044 -16.6 84.6 23,857 14,937
1998 1,631 -5.9 55.4 2,534 24.0 82.7 25,489 17,471
19994 1,079 -33.9 53.2 3,197 26.1 80.1 26,568 20,668
20004 1,074 -0.5 51.1 3,615 13.1 76.3 27,642 24,284
Stafford Unsubsidized2
1993 — — — — — — — —
1994 $1 — 0.0 $0 — 0.0 $1 $0
1995 11 1679.7 0.5 0 4040.0 0.0 12 0
1996 95 742.1 3.6 4 884.8 0.1 107 5
1997 288 203.2 9.6 21 419.1 0.9 395 26
1998 423 47.0 14.4 65 206.7 2.1 818 91
19994 377 -11.0 18.6 141 116.6 3.5 1,195 231
20004 513 36.1 24.4 236 68.2 5.0 1,708 468
PLUS
1986 $6 112.4 0.5 $1 238.4 0.2 $11 $1
1987 7 11.7 0.5 2 93.6 0.3 18 3
1988 20 188.1 1.4 3 71.3 0.5 37 6
1989 32 62.1 1.6 5 56.5 0.6 70 10
1990 40 23.7 1.5 8 65.2 0.8 109 18
1991 67 69.6 2.1 13 73.9 1.2 177 31
1992 78 15.1 2.9 24 83.2 1.7 254 55
1993 89 15.2 3.6 35 45.6 2.3 344 90
1994 96 6.8 4.0 35 1.2 1.8 440 125
1995 98 2.6 4.3 52 46.0 2.2 538 177
1996 113 15.4 4.3 74 43.5 2.7 651 251
1997 113 -0.1 3.8 86 15.4 3.5 764 337
1998 101 -10.7 3.4 131 52.6 4.3 865 467
19994 72 -28.5 3.6 143 9.4 3.6 937 610
20004 66 -8.2 3.2 191 34.1 4.0 1,003 801
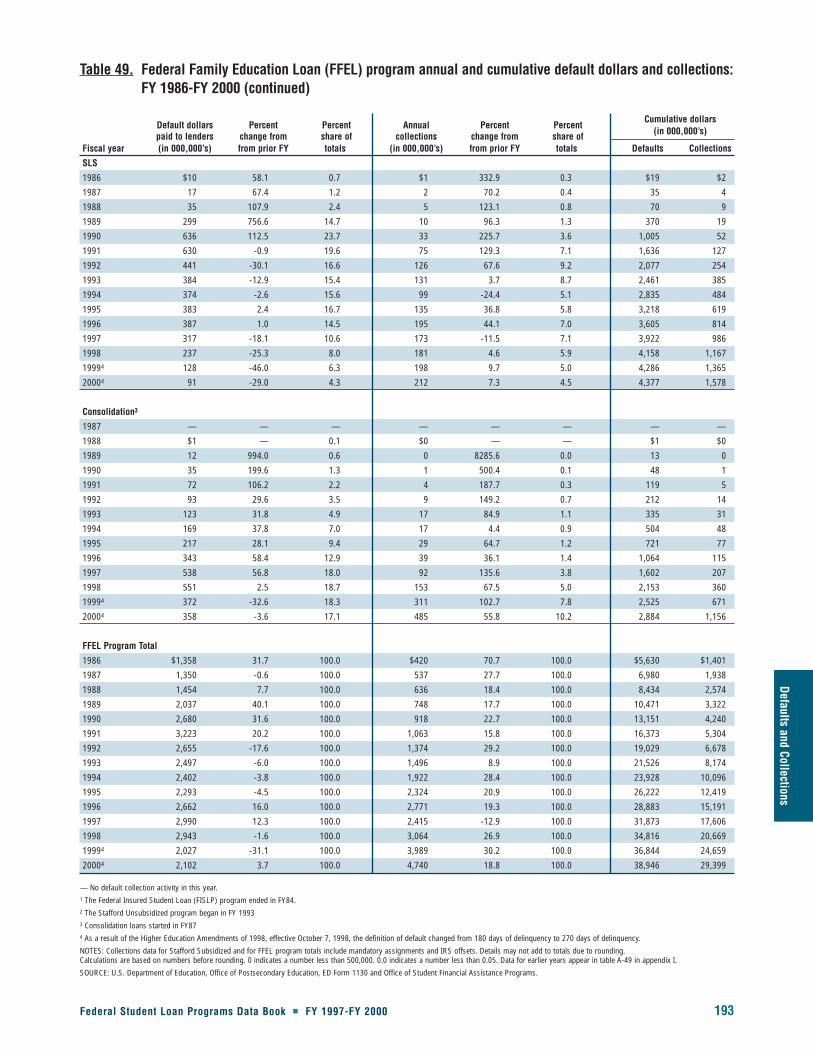
Federal Student Loan Programs Data Book � FY 1997-FY 2000 193
Defaults and Collections
Table 49. Federal Family Education Loan (FFEL) program annual and cumulative default dollars and collections:FY 1986-FY 2000 (continued)
Default dollars Percent Percent Annual Percent PercentCumulative dollars
paid to lenders change from share of collections change from share of (in 000,000’s)
Fiscal year (in 000,000’s) from prior FY totals (in 000,000’s) from prior FY totals Defaults Collections
SLS
1986 $10 58.1 0.7 $1 332.9 0.3 $19 $2
1987 17 67.4 1.2 2 70.2 0.4 35 4
1988 35 107.9 2.4 5 123.1 0.8 70 9
1989 299 756.6 14.7 10 96.3 1.3 370 19
1990 636 112.5 23.7 33 225.7 3.6 1,005 52
1991 630 -0.9 19.6 75 129.3 7.1 1,636 127
1992 441 -30.1 16.6 126 67.6 9.2 2,077 254
1993 384 -12.9 15.4 131 3.7 8.7 2,461 385
1994 374 -2.6 15.6 99 -24.4 5.1 2,835 484
1995 383 2.4 16.7 135 36.8 5.8 3,218 619
1996 387 1.0 14.5 195 44.1 7.0 3,605 814
1997 317 -18.1 10.6 173 -11.5 7.1 3,922 986
1998 237 -25.3 8.0 181 4.6 5.9 4,158 1,167
19994 128 -46.0 6.3 198 9.7 5.0 4,286 1,365
20004 91 -29.0 4.3 212 7.3 4.5 4,377 1,578
Consolidation3
1987 — — — — — — — —
1988 $1 — 0.1 $0 — — $1 $0
1989 12 994.0 0.6 0 8285.6 0.0 13 0
1990 35 199.6 1.3 1 500.4 0.1 48 1
1991 72 106.2 2.2 4 187.7 0.3 119 5
1992 93 29.6 3.5 9 149.2 0.7 212 14
1993 123 31.8 4.9 17 84.9 1.1 335 31
1994 169 37.8 7.0 17 4.4 0.9 504 48
1995 217 28.1 9.4 29 64.7 1.2 721 77
1996 343 58.4 12.9 39 36.1 1.4 1,064 115
1997 538 56.8 18.0 92 135.6 3.8 1,602 207
1998 551 2.5 18.7 153 67.5 5.0 2,153 360
19994 372 -32.6 18.3 311 102.7 7.8 2,525 671
20004 358 -3.6 17.1 485 55.8 10.2 2,884 1,156
FFEL Program Total
1986 $1,358 31.7 100.0 $420 70.7 100.0 $5,630 $1,401
1987 1,350 -0.6 100.0 537 27.7 100.0 6,980 1,938
1988 1,454 7.7 100.0 636 18.4 100.0 8,434 2,574
1989 2,037 40.1 100.0 748 17.7 100.0 10,471 3,322
1990 2,680 31.6 100.0 918 22.7 100.0 13,151 4,240
1991 3,223 20.2 100.0 1,063 15.8 100.0 16,373 5,304
1992 2,655 -17.6 100.0 1,374 29.2 100.0 19,029 6,678
1993 2,497 -6.0 100.0 1,496 8.9 100.0 21,526 8,174
1994 2,402 -3.8 100.0 1,922 28.4 100.0 23,928 10,096
1995 2,293 -4.5 100.0 2,324 20.9 100.0 26,222 12,419
1996 2,662 16.0 100.0 2,771 19.3 100.0 28,883 15,191
1997 2,990 12.3 100.0 2,415 -12.9 100.0 31,873 17,606
1998 2,943 -1.6 100.0 3,064 26.9 100.0 34,816 20,669
19994 2,027 -31.1 100.0 3,989 30.2 100.0 36,844 24,659
20004 2,102 3.7 100.0 4,740 18.8 100.0 38,946 29,399
— No default collection activity in this year.1 The Federal Insured Student Loan (FISLP) program ended in FY84.2 The Stafford Unsubsidized program began in FY 19933 Consolidation loans started in FY874 As a result of the Higher Education Amendments of 1998, effective October 7, 1998, the definition of default changed from 180 days of delinquency to 270 days of delinquency.
NOTES: Collections data for Stafford Subsidized and for FFEL program totals include mandatory assignments and IRS offsets. Details may not add to totals due to rounding. Calculations are based on numbers before rounding. 0 indicates a number less than 500,000. 0.0 indicates a number less than 0.05. Data for earlier years appear in table A-49 in appendix I.
SOURCE: U.S. Department of Education, Office of Postsecondary Education, ED Form 1130 and Office of Student Financial Assistance Programs.

194 Federal Student Loan Programs Data Book � FY 1997-FY 2000
Fiscal year
Stafford Subsidized
Dolla
rs (i
n 00
0,00
0’s)
Annual defaults
Annual collections
0
500
1,000
1,500
2,000
2,500
3,000
3,500
$4,000
$807$916
$1,160$1,271
$1,735
$2,088
$2,452
$2,044
$2,534
$3,197
$3,615
$1,952
$2,436
$2,032$1,892
$1,756
$1,580$1,723 $1,734
$1,631
$1,079 $1,074
FY00FY99FY98FY97FY96FY95FY94FY93FY92FY91FY90
Fiscal year
Stafford Unsubsidized
Dolla
rs (i
n 00
0,00
0’s)
Annual defaults
Annual collections
0
100
200
300
400
500
$600
0 0 $4$21
$65
$141
$236
$1 $11
$95
$288
$423
$377
$513
FY00FY99FY98FY97FY96FY95FY94
Figure 28. Federal Family Education Loan (FFEL) program annual defaults and collections: FY 1990-FY 2000
NOTE: Collections data for Stafford Subsidized totals include mandatory assignments and IRS offsets.
SOURCE: U.S. Department of Education, Office of Postsecondary Education, ED Form 1130 and Office of Student Financial Assistance Programs.
NOTE: The Stafford Unsubsidized program began in FY93.
SOURCE: U.S. Department of Education, Office of Postsecondary Education, ED Form 1130 and Office of Student Financial Assistance Programs.
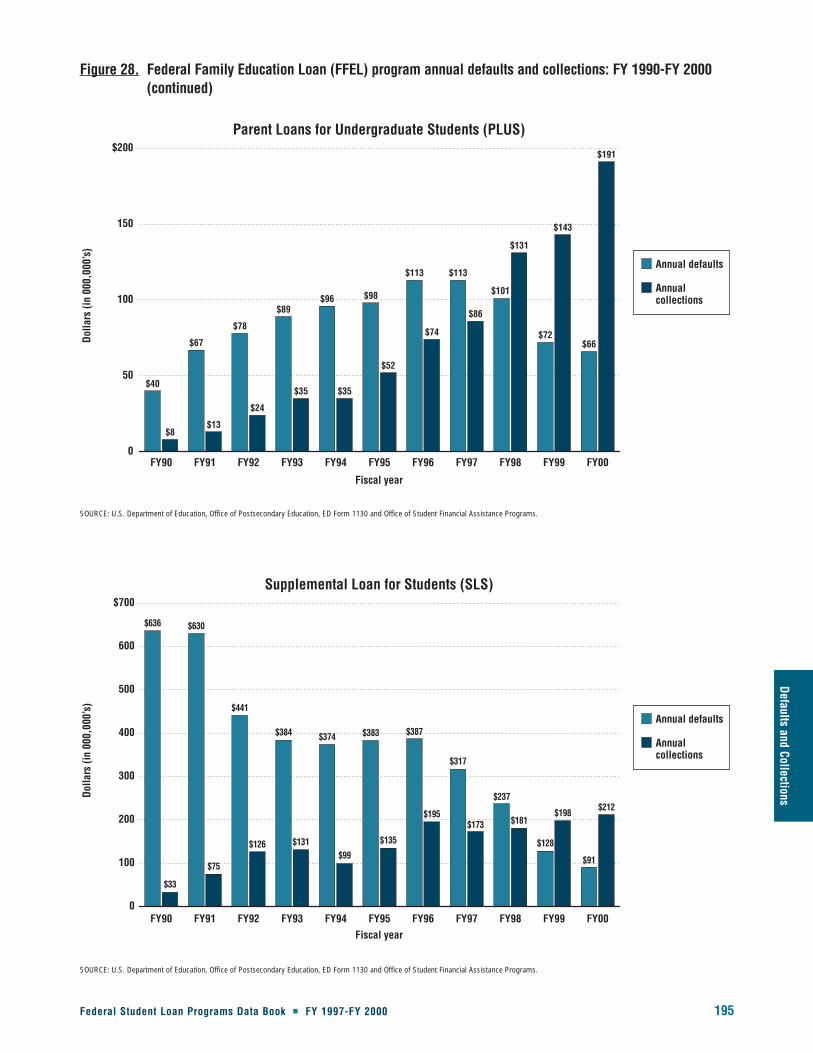
Fiscal year
Parent Loans for Undergraduate Students (PLUS)
Dolla
rs (i
n 00
0,00
0’s)
Annual defaults
Annual collections
0
50
100
150
$200
$8$13
$24
$35 $35
$52
$74
$86
$131
$143
$191
$40
$67
$78
$89$96 $98
$113 $113
$101
$72$66
FY00FY99FY98FY97FY96FY95FY94FY93FY92FY91FY90
Fiscal year
Supplemental Loan for Students (SLS)
Dolla
rs (i
n 00
0,00
0’s)
Annual defaults
Annual collections
0
100
200
300
400
500
600
$700
$33
$75
$126 $131$99
$135
$195$173 $181
$198$212
$636 $630
$441
$384 $374 $383 $387
$317
$237
$128
$91
FY00FY99FY98FY97FY96FY95FY94FY93FY92FY91FY90
Figure 28. Federal Family Education Loan (FFEL) program annual defaults and collections: FY 1990-FY 2000(continued)
SOURCE: U.S. Department of Education, Office of Postsecondary Education, ED Form 1130 and Office of Student Financial Assistance Programs.
SOURCE: U.S. Department of Education, Office of Postsecondary Education, ED Form 1130 and Office of Student Financial Assistance Programs.
Federal Student Loan Programs Data Book � FY 1997-FY 2000 195
Defaults and Collections

Fiscal year
Consolidation
Dolla
rs (i
n 00
0,00
0’s)
Annual defaults
Annual collections
0
100
200
300
400
500
$600
$1 $4 $9 $17 $17$29 $39
$92
$153
$311
$485
$35
$72$93
$123
$169
$217
$343
$538$551
$372$358
FY00FY99FY98FY97FY96FY95FY94FY93FY92FY91FY90
Fiscal year
FFEL program total
Dolla
rs (i
n 00
0,00
0’s)
Annual defaults
Annual collections
0
1,000
2,000
3,000
4,000
$5,000
$918$1,063
$1,374$1,496
$1,922
$2,324
$2,771
$2,415
$3,064
$3,989
$4,740
$2680
$3,223
$2,655$2,497
$2,402$2,293
$2,662
$2,990 $2,943
$2,027 $2,102
FY00FY99FY98FY97FY96FY95FY94FY93FY92FY91FY90
Figure 28. Federal Family Education Loan (FFEL) program annual defaults and collections: FY 1990-FY 2000(continued)
SOURCE: U.S. Department of Education, Office of Postsecondary Education, ED Form 1130 and Office of Student Financial Assistance Programs.
NOTE: Collections data include mandatory assignments and IRS offsets.
SOURCE: U.S. Department of Education, Office of Postsecondary Education, ED Form 1130 and Office of Student Financial Assistance Programs.
196 Federal Student Loan Programs Data Book � FY 1997-FY 2000

Table 50. Federal Direct Loan Program (FDLP) annual and cumulative default dollarsand collections: FY 1996-FY 2000
Federal Student Loan Programs Data Book � FY 1997-FY 2000 197
Defaults and Collections
This table provides a summary of annual defaults and collections for FDLP loans. Because the FDLP was initiated
in FY 1994, defaults and collections data begin in FY 1996. (See also figure 29 which follows table 50.)
� As the FDLP program has grown, so too has the amount of dollars in default and collections. For example,
from FY 1998 to FY 2000, the amount of dollars in default increased from $210.1 million to $613.4 million,
an increase of 192 percent. During this time, annual collection dollars experienced more than a tenfold
increase from $15.5 million to $184.2 million.

198 Federal Student Loan Programs Data Book � FY 1997-FY 2000
Fiscal year
FDLP program total
Dolla
rs (i
n 00
0,00
0’s)
Annual defaults
Annual collections
0
100
200
300
400
500
600
$700
0 $1 $16
$76
$184
$2
$83
$210
$473
$613
FY00FY99FY98FY97FY96
Figure 29. Federal Direct Loan Program (FDLP) annual default and collections: FY 1996-FY 2000
NOTES: Includes Consolidation loans. FDLP loan data in FY94 only include one-quarter of that fiscal year, and FDLP loans were restricted to a small number of institutions.
SOURCE: U.S. Department of Education, Office of Postsecondary Education, Direct Loan/Loan Origination System.
Table 50. Federal Direct Loan Program (FDLP) annual and cumulative default dollars and collections:FY 1995-FY 2000
($ in 000,000’s)
Annual Cumulative Annual Cumulative defaultFiscal year dollars defaulted dollars defaulted dollars collected dollars collected
1995 — — — —
1996 $2.2 $2.2 $0.1 $0.1
1997 $83.0 $85.2 $0.9 $1.0
1998 $210.1 $295.3 $15.5 $16.5
19991 $472.7 $767.9 $76.0 $92.5
20001 $613.4 $1,381.4 $184.2 $276.7
— Not applicable.1 As a result of the Higher Education Amendments of 1998, effective October 7, 1998, the definition of default changed from 180 days of delinquency to 270 days of delinquency.
NOTES: Includes Consolidation loans. FDLP loan data in FY94 only include one-quarter of that fiscal year, and FDLP loans were restricted to a small number of institutions.
SOURCE: U.S. Department of Education, Office of Postsecondary Education, Direct Loan/Loan Origination System.
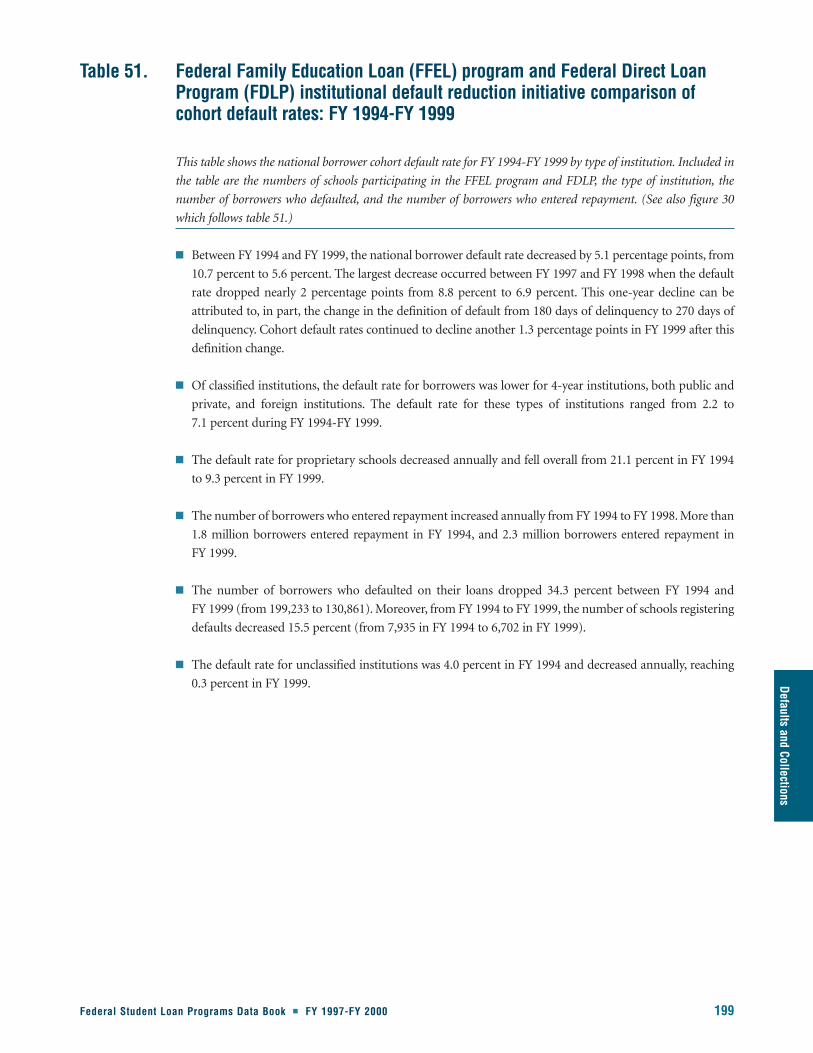
Defaults and Collections
Table 51. Federal Family Education Loan (FFEL) program and Federal Direct LoanProgram (FDLP) institutional default reduction initiative comparison ofcohort default rates: FY 1994-FY 1999
Federal Student Loan Programs Data Book � FY 1997-FY 2000 199
This table shows the national borrower cohort default rate for FY 1994-FY 1999 by type of institution. Included in
the table are the numbers of schools participating in the FFEL program and FDLP, the type of institution, the
number of borrowers who defaulted, and the number of borrowers who entered repayment. (See also figure 30
which follows table 51.)
� Between FY 1994 and FY 1999, the national borrower default rate decreased by 5.1 percentage points, from
10.7 percent to 5.6 percent. The largest decrease occurred between FY 1997 and FY 1998 when the default
rate dropped nearly 2 percentage points from 8.8 percent to 6.9 percent. This one-year decline can be
attributed to, in part, the change in the definition of default from 180 days of delinquency to 270 days of
delinquency. Cohort default rates continued to decline another 1.3 percentage points in FY 1999 after this
definition change.
� Of classified institutions, the default rate for borrowers was lower for 4-year institutions, both public and
private, and foreign institutions. The default rate for these types of institutions ranged from 2.2 to
7.1 percent during FY 1994-FY 1999.
� The default rate for proprietary schools decreased annually and fell overall from 21.1 percent in FY 1994
to 9.3 percent in FY 1999.
� The number of borrowers who entered repayment increased annually from FY 1994 to FY 1998. More than
1.8 million borrowers entered repayment in FY 1994, and 2.3 million borrowers entered repayment in
FY 1999.
� The number of borrowers who defaulted on their loans dropped 34.3 percent between FY 1994 and
FY 1999 (from 199,233 to 130,861). Moreover, from FY 1994 to FY 1999, the number of schools registering
defaults decreased 15.5 percent (from 7,935 in FY 1994 to 6,702 in FY 1999).
� The default rate for unclassified institutions was 4.0 percent in FY 1994 and decreased annually, reaching
0.3 percent in FY 1999.
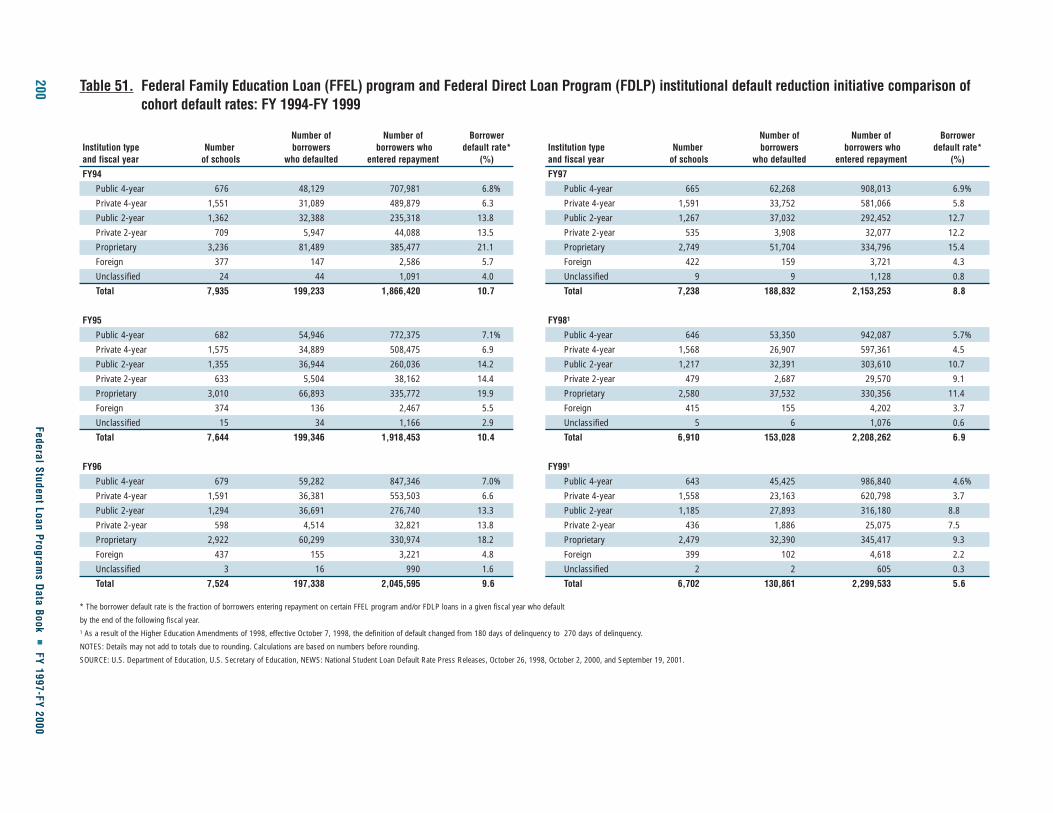
200Federal Student Loan Program
s Data Book
�FY 1997-FY 2000
Table 51. Federal Family Education Loan (FFEL) program and Federal Direct Loan Program (FDLP) institutional default reduction initiative comparison ofcohort default rates: FY 1994-FY 1999
Number of Number of Borrower Number of Number of BorrowerInstitution type Number borrowers borrowers who default rate* Institution type Number borrowers borrowers who default rate*and fiscal year of schools who defaulted entered repayment (%) and fiscal year of schools who defaulted entered repayment (%)
FY94 FY97
Public 4-year 676 48,129 707,981 6.8% Public 4-year 665 62,268 908,013 6.9%
Private 4-year 1,551 31,089 489,879 6.3 Private 4-year 1,591 33,752 581,066 5.8
Public 2-year 1,362 32,388 235,318 13.8 Public 2-year 1,267 37,032 292,452 12.7
Private 2-year 709 5,947 44,088 13.5 Private 2-year 535 3,908 32,077 12.2
Proprietary 3,236 81,489 385,477 21.1 Proprietary 2,749 51,704 334,796 15.4
Foreign 377 147 2,586 5.7 Foreign 422 159 3,721 4.3
Unclassified 24 44 1,091 4.0 Unclassified 9 9 1,128 0.8
Total 7,935 199,233 1,866,420 10.7 Total 7,238 188,832 2,153,253 8.8
FY95 FY981
Public 4-year 682 54,946 772,375 7.1% Public 4-year 646 53,350 942,087 5.7%
Private 4-year 1,575 34,889 508,475 6.9 Private 4-year 1,568 26,907 597,361 4.5
Public 2-year 1,355 36,944 260,036 14.2 Public 2-year 1,217 32,391 303,610 10.7
Private 2-year 633 5,504 38,162 14.4 Private 2-year 479 2,687 29,570 9.1
Proprietary 3,010 66,893 335,772 19.9 Proprietary 2,580 37,532 330,356 11.4
Foreign 374 136 2,467 5.5 Foreign 415 155 4,202 3.7
Unclassified 15 34 1,166 2.9 Unclassified 5 6 1,076 0.6
Total 7,644 199,346 1,918,453 10.4 Total 6,910 153,028 2,208,262 6.9
FY96 FY991
Public 4-year 679 59,282 847,346 7.0% Public 4-year 643 45,425 986,840 4.6%
Private 4-year 1,591 36,381 553,503 6.6 Private 4-year 1,558 23,163 620,798 3.7
Public 2-year 1,294 36,691 276,740 13.3 Public 2-year 1,185 27,893 316,180 8.8
Private 2-year 598 4,514 32,821 13.8 Private 2-year 436 1,886 25,075 7.5
Proprietary 2,922 60,299 330,974 18.2 Proprietary 2,479 32,390 345,417 9.3
Foreign 437 155 3,221 4.8 Foreign 399 102 4,618 2.2
Unclassified 3 16 990 1.6 Unclassified 2 2 605 0.3
Total 7,524 197,338 2,045,595 9.6 Total 6,702 130,861 2,299,533 5.6
* The borrower default rate is the fraction of borrowers entering repayment on certain FFEL program and/or FDLP loans in a given fiscal year who default
by the end of the following fiscal year.1 As a result of the Higher Education Amendments of 1998, effective October 7, 1998, the definition of default changed from 180 days of delinquency to 270 days of delinquency.
NOTES: Details may not add to totals due to rounding. Calculations are based on numbers before rounding.
SOURCE: U.S. Department of Education, U.S. Secretary of Education, NEWS: National Student Loan Default Rate Press Releases, October 26, 1998, October 2, 2000, and September 19, 2001.

Defaults and Collections
Federal Student Loan Programs Data Book � FY 1997-FY 2000 201
Fiscal year
Dolla
rs (i
n 00
0,00
0’s)
Public 4-year
Private 4-year
Public 2-year
Private 2-year
Proprietary
Total
0
5
10
15
20
25%
21%20%
18%
15%
11%
9%
14% 14% 14%
12%
9%
20%
14% 14%13% 13%
11%
16%
6%7% 7%
6%5%
4%
7% 7% 7% 7%6%
5%
FY99FY98FY97FY96FY95F94
Figure 30. Federal Family Education Loan (FFEL) program and Federal Direct Loan Program (FDLP) institutionaldefault rates, by type of institution:FY 1994-FY 1999
NOTES: As a result of the Higher Education Amendments of 1998, effective October 7, 1998, the definition of default changed from 180 days of delinquency to 270 days of delinquency. Information forforeign and unclassified institutions can be found in table 51.
SOURCE: U.S. Department of Education, U.S. Secretary of Education, NEWS: National Student Loan Default Rate Press Releases, October 26, 1998, October 2, 2000, and September 19, 2001.
202 Federal Student Loan Programs Data Book � FY 1997-FY 2000
Tables Federal Family Education Loan (FFEL) program cohort default rate for 52a-52c. guaranty agencies: FY 1997-FY 1999
This set of tables shows a summary of the number of borrowers in default and in repayment for each guaranty
agency in FY 1997, FY 1998, and FY 1999. The tables also show the borrower default rate and how the guaranty
agencies are ranked.
� Borrower default rates varied across guaranty agencies. For the FY 1997 cohort, default rates ranged from
28.6 percent (ECMC) to 1.3 percent (North Dakota). For the FY 1998 cohort, default rates ranged from a
high of 10.3 percent (Rhode Island) to 0.0 percent (North Dakota). For the FY 1999 cohort the highest rate
dropped to 7.9 percent (Montana) while the lowest rate increased to 1.8 percent (North Dakota).
� The rankings of guaranty agencies with the highest and lowest cohort default rates did not change
considerably for the FY 1997, FY 1998, and FY 1999 cohorts. For example, Texas and Tennessee ranked
among the five guaranty agencies with the highest cohort default rates in all three years. In addition, Rhode
Island, Montana, and Kentucky were among the five guaranty agencies with the highest default rates for
two of the three cohorts.
� North Dakota had the lowest default rate for each cohort. In addition, South Dakota was among the five
agencies with the lowest default rates for all three cohorts. Finally, New Mexico, South Carolina, New
Hampshire, and Vermont were among the five guaranty agencies with the lowest default rates for two of
the three cohorts.
NOTE: The borrower cohort default rate is the fraction of borrowers entering repayment in a given fiscal year who default by the end of
the following fiscal year.
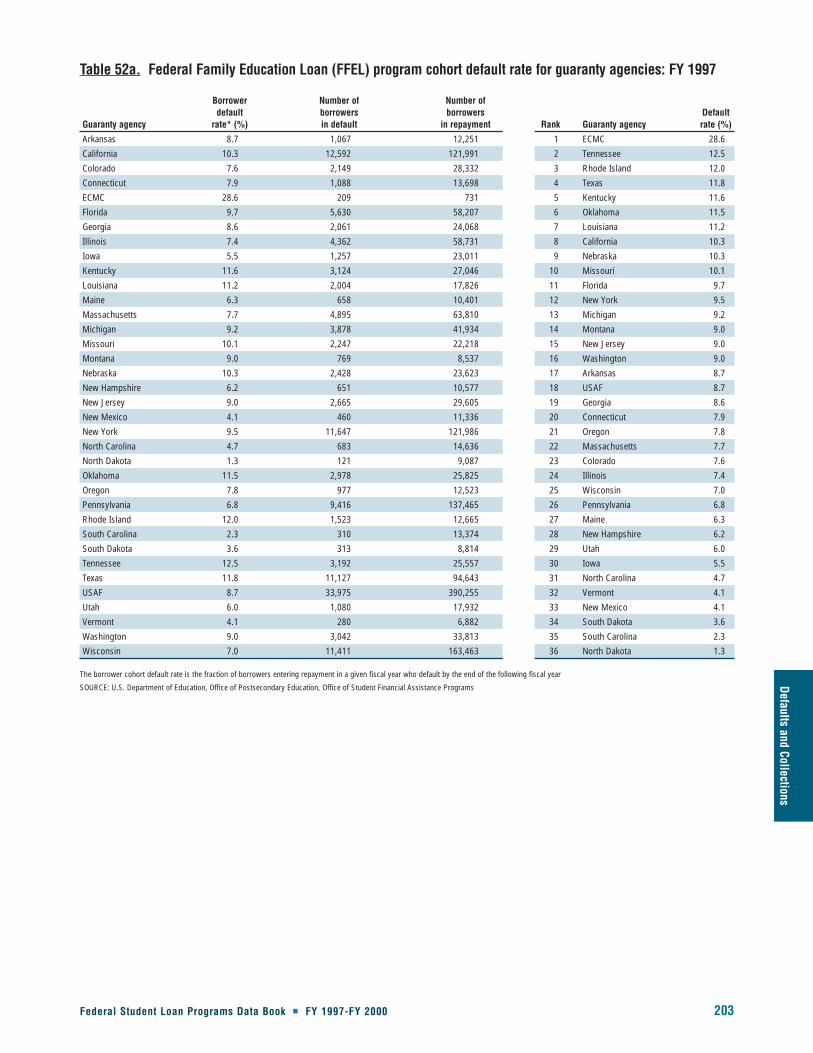
Federal Student Loan Programs Data Book � FY 1997-FY 2000 203
Defaults and Collections
Table 52a. Federal Family Education Loan (FFEL) program cohort default rate for guaranty agencies: FY 1997
Borrower Number of Number of default borrowers borrowers Default
Guaranty agency rate* (%) in default in repayment Rank Guaranty agency rate (%)
Arkansas 8.7 1,067 12,251 1 ECMC 28.6
California 10.3 12,592 121,991 2 Tennessee 12.5
Colorado 7.6 2,149 28,332 3 Rhode Island 12.0
Connecticut 7.9 1,088 13,698 4 Texas 11.8
ECMC 28.6 209 731 5 Kentucky 11.6
Florida 9.7 5,630 58,207 6 Oklahoma 11.5
Georgia 8.6 2,061 24,068 7 Louisiana 11.2
Illinois 7.4 4,362 58,731 8 California 10.3
Iowa 5.5 1,257 23,011 9 Nebraska 10.3
Kentucky 11.6 3,124 27,046 10 Missouri 10.1
Louisiana 11.2 2,004 17,826 11 Florida 9.7
Maine 6.3 658 10,401 12 New York 9.5
Massachusetts 7.7 4,895 63,810 13 Michigan 9.2
Michigan 9.2 3,878 41,934 14 Montana 9.0
Missouri 10.1 2,247 22,218 15 New Jersey 9.0
Montana 9.0 769 8,537 16 Washington 9.0
Nebraska 10.3 2,428 23,623 17 Arkansas 8.7
New Hampshire 6.2 651 10,577 18 USAF 8.7
New Jersey 9.0 2,665 29,605 19 Georgia 8.6
New Mexico 4.1 460 11,336 20 Connecticut 7.9
New York 9.5 11,647 121,986 21 Oregon 7.8
North Carolina 4.7 683 14,636 22 Massachusetts 7.7
North Dakota 1.3 121 9,087 23 Colorado 7.6
Oklahoma 11.5 2,978 25,825 24 Illinois 7.4
Oregon 7.8 977 12,523 25 Wisconsin 7.0
Pennsylvania 6.8 9,416 137,465 26 Pennsylvania 6.8
Rhode Island 12.0 1,523 12,665 27 Maine 6.3
South Carolina 2.3 310 13,374 28 New Hampshire 6.2
South Dakota 3.6 313 8,814 29 Utah 6.0
Tennessee 12.5 3,192 25,557 30 Iowa 5.5
Texas 11.8 11,127 94,643 31 North Carolina 4.7
USAF 8.7 33,975 390,255 32 Vermont 4.1
Utah 6.0 1,080 17,932 33 New Mexico 4.1
Vermont 4.1 280 6,882 34 South Dakota 3.6
Washington 9.0 3,042 33,813 35 South Carolina 2.3
Wisconsin 7.0 11,411 163,463 36 North Dakota 1.3
The borrower cohort default rate is the fraction of borrowers entering repayment in a given fiscal year who default by the end of the following fiscal year
SOURCE: U.S. Department of Education, Office of Postsecondary Education, Office of Student Financial Assistance Programs
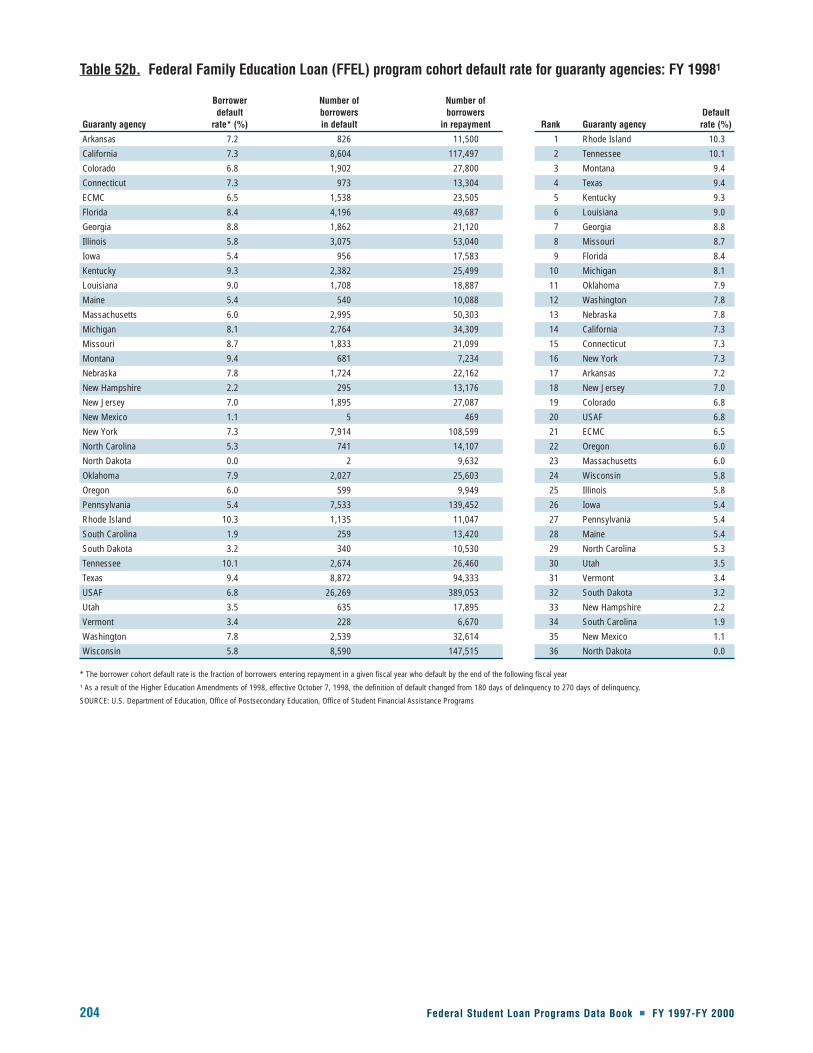
204 Federal Student Loan Programs Data Book � FY 1997-FY 2000
Table 52b. Federal Family Education Loan (FFEL) program cohort default rate for guaranty agencies: FY 19981
Borrower Number of Number of default borrowers borrowers Default
Guaranty agency rate* (%) in default in repayment Rank Guaranty agency rate (%)
Arkansas 7.2 826 11,500 1 Rhode Island 10.3
California 7.3 8,604 117,497 2 Tennessee 10.1
Colorado 6.8 1,902 27,800 3 Montana 9.4
Connecticut 7.3 973 13,304 4 Texas 9.4
ECMC 6.5 1,538 23,505 5 Kentucky 9.3
Florida 8.4 4,196 49,687 6 Louisiana 9.0
Georgia 8.8 1,862 21,120 7 Georgia 8.8
Illinois 5.8 3,075 53,040 8 Missouri 8.7
Iowa 5.4 956 17,583 9 Florida 8.4
Kentucky 9.3 2,382 25,499 10 Michigan 8.1
Louisiana 9.0 1,708 18,887 11 Oklahoma 7.9
Maine 5.4 540 10,088 12 Washington 7.8
Massachusetts 6.0 2,995 50,303 13 Nebraska 7.8
Michigan 8.1 2,764 34,309 14 California 7.3
Missouri 8.7 1,833 21,099 15 Connecticut 7.3
Montana 9.4 681 7,234 16 New York 7.3
Nebraska 7.8 1,724 22,162 17 Arkansas 7.2
New Hampshire 2.2 295 13,176 18 New Jersey 7.0
New Jersey 7.0 1,895 27,087 19 Colorado 6.8
New Mexico 1.1 5 469 20 USAF 6.8
New York 7.3 7,914 108,599 21 ECMC 6.5
North Carolina 5.3 741 14,107 22 Oregon 6.0
North Dakota 0.0 2 9,632 23 Massachusetts 6.0
Oklahoma 7.9 2,027 25,603 24 Wisconsin 5.8
Oregon 6.0 599 9,949 25 Illinois 5.8
Pennsylvania 5.4 7,533 139,452 26 Iowa 5.4
Rhode Island 10.3 1,135 11,047 27 Pennsylvania 5.4
South Carolina 1.9 259 13,420 28 Maine 5.4
South Dakota 3.2 340 10,530 29 North Carolina 5.3
Tennessee 10.1 2,674 26,460 30 Utah 3.5
Texas 9.4 8,872 94,333 31 Vermont 3.4
USAF 6.8 26,269 389,053 32 South Dakota 3.2
Utah 3.5 635 17,895 33 New Hampshire 2.2
Vermont 3.4 228 6,670 34 South Carolina 1.9
Washington 7.8 2,539 32,614 35 New Mexico 1.1
Wisconsin 5.8 8,590 147,515 36 North Dakota 0.0
* The borrower cohort default rate is the fraction of borrowers entering repayment in a given fiscal year who default by the end of the following fiscal year1 As a result of the Higher Education Amendments of 1998, effective October 7, 1998, the definition of default changed from 180 days of delinquency to 270 days of delinquency.
SOURCE: U.S. Department of Education, Office of Postsecondary Education, Office of Student Financial Assistance Programs

Federal Student Loan Programs Data Book � FY 1997-FY 2000 205
Defaults and Collections
Table 52c. Federal Family Education Loan (FFEL) program cohort default rate for guaranty agencies: FY 19991
Borrower Number of Number of default borrowers borrowers Default
Guaranty agency rate* (%) in default in repayment Rank Guaranty agency rate (%)
Arkansas 7.7 1,323 17,082 1 Montana 7.9
California 6.0 12,628 208,634 2 Arkansas 7.7
Colorado 5.0 2,129 42,455 3 Florida 7.3
Connecticut 4.6 1,016 21,947 4 Texas 6.9
ECMC 4.8 2,876 59,413 5 Tennessee 6.7
Florida 7.3 7,180 97,506 6 Louisiana 6.6
Georgia 6.4 3,686 56,807 7 Georgia 6.4
Illinois 4.9 4,533 90,745 8 Kentucky 6.4
Iowa 5.8 2,352 40,260 9 New Mexico 6.3
Kentucky 6.4 3,931 61,819 10 New Jersey 6.2
Louisiana 6.6 2,935 44,338 11 North Carolina 6.1
Maine 5.5 612 11,068 12 USAF 6.0
Massachusetts 4.2 3,463 81,682 13 California 6.0
Michigan 6.0 4,604 76,545 14 Michigan 6.0
Missouri 5.4 2,890 52,571 15 Oklahoma 5.9
Montana 7.9 756 9,525 16 Iowa 5.8
Nebraska 5.7 1,093 19,029 17 Nebraska 5.7
New Hampshire 2.2 327 14,565 18 Rhode Island 5.7
New Jersey 6.2 2,996 48,256 19 Maine 5.5
New Mexico 6.3 826 12,913 20 New York 5.5
New York 5.5 10,119 183,242 21 Washington 5.5
North Carolina 6.1 2,692 43,519 22 Missouri 5.4
North Dakota 1.8 200 10,694 23 Wisconsin 5.4
Oklahoma 5.9 2,066 34,898 24 Pennsylvania 5.1
Oregon 3.9 1,148 28,707 25 Colorado 5.0
Pennsylvania 5.1 8,438 165,865 26 Illinois 4.9
Rhode Island 5.7 838 14,499 27 ECMC 4.8
South Carolina 4.8 1,348 28,022 28 South Carolina 4.8
South Dakota 2.6 293 11,146 29 Connecticut 4.6
Tennessee 6.7 2,772 41,199 30 Massachusetts 4.2
Texas 6.9 9,114 130,880 31 Oregon 3.9
USAF 6.0 13,438 222,920 32 Vermont 3.1
Utah 2.9 590 20,074 33 Utah 2.9
Vermont 3.1 288 9,006 34 South Dakota 2.6
Washington 5.5 3,166 57,885 35 New Hampshire 2.2
Wisconsin 5.4 12,089 224,578 36 North Dakota 1.8
* The borrower cohort default rate is the fraction of borrowers entering repayment in a given fiscal year who default by the end of the following fiscal year1 As a result of the Higher Education Amendments of 1998, effective October 7, 1998, the definition of default changed from 180 days of delinquency to 270 days of delinquency.
SOURCE: U.S. Department of Education, Office of Postsecondary Education, Office of Student Financial Assistance Programs
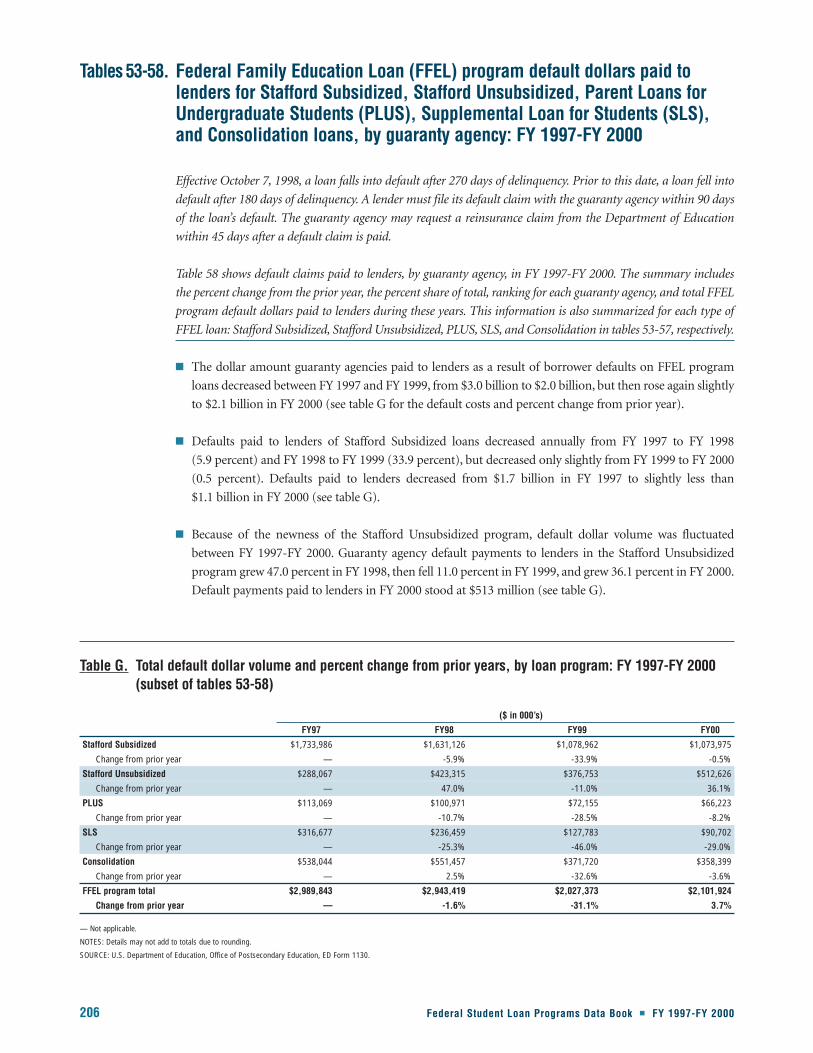
206 Federal Student Loan Programs Data Book � FY 1997-FY 2000
Tables 53-58. Federal Family Education Loan (FFEL) program default dollars paid tolenders for Stafford Subsidized, Stafford Unsubsidized, Parent Loans forUndergraduate Students (PLUS), Supplemental Loan for Students (SLS),and Consolidation loans, by guaranty agency: FY 1997-FY 2000
Effective October 7, 1998, a loan falls into default after 270 days of delinquency. Prior to this date, a loan fell into
default after 180 days of delinquency. A lender must file its default claim with the guaranty agency within 90 days
of the loan’s default. The guaranty agency may request a reinsurance claim from the Department of Education
within 45 days after a default claim is paid.
Table 58 shows default claims paid to lenders, by guaranty agency, in FY 1997-FY 2000. The summary includes
the percent change from the prior year, the percent share of total, ranking for each guaranty agency, and total FFEL
program default dollars paid to lenders during these years. This information is also summarized for each type of
FFEL loan: Stafford Subsidized, Stafford Unsubsidized, PLUS, SLS, and Consolidation in tables 53-57, respectively.
� The dollar amount guaranty agencies paid to lenders as a result of borrower defaults on FFEL program
loans decreased between FY 1997 and FY 1999, from $3.0 billion to $2.0 billion, but then rose again slightly
to $2.1 billion in FY 2000 (see table G for the default costs and percent change from prior year).
� Defaults paid to lenders of Stafford Subsidized loans decreased annually from FY 1997 to FY 1998
(5.9 percent) and FY 1998 to FY 1999 (33.9 percent), but decreased only slightly from FY 1999 to FY 2000
(0.5 percent). Defaults paid to lenders decreased from $1.7 billion in FY 1997 to slightly less than
$1.1 billion in FY 2000 (see table G).
� Because of the newness of the Stafford Unsubsidized program, default dollar volume was fluctuated
between FY 1997-FY 2000. Guaranty agency default payments to lenders in the Stafford Unsubsidized
program grew 47.0 percent in FY 1998, then fell 11.0 percent in FY 1999, and grew 36.1 percent in FY 2000.
Default payments paid to lenders in FY 2000 stood at $513 million (see table G).
Table G. Total default dollar volume and percent change from prior years, by loan program: FY 1997-FY 2000 (subset of tables 53-58)
($ in 000’s)
FY97 FY98 FY99 FY00
Stafford Subsidized $1,733,986 $1,631,126 $1,078,962 $1,073,975
Change from prior year — -5.9% -33.9% -0.5%
Stafford Unsubsidized $288,067 $423,315 $376,753 $512,626
Change from prior year — 47.0% -11.0% 36.1%
PLUS $113,069 $100,971 $72,155 $66,223
Change from prior year — -10.7% -28.5% -8.2%
SLS $316,677 $236,459 $127,783 $90,702
Change from prior year — -25.3% -46.0% -29.0%
Consolidation $538,044 $551,457 $371,720 $358,399
Change from prior year — 2.5% -32.6% -3.6%
FFEL program total $2,989,843 $2,943,419 $2,027,373 $2,101,924
Change from prior year — -1.6% -31.1% 3.7%
— Not applicable.
NOTES: Details may not add to totals due to rounding.
SOURCE: U.S. Department of Education, Office of Postsecondary Education, ED Form 1130.
Defaults and Collections
Federal Student Loan Programs Data Book � FY 1997-FY 2000 207
� Guaranty agency default payments to lenders in the PLUS program decreased annually from FY 1997 to
FY 2000. From FY 1997 to FY 1998, default payments decreased by 10.7 percent, then fell 28.5 percent in
FY 1999, and fell again in FY 2000 by 8.2 percent. Default payments paid to lenders in FY 2000 stood at
$66 million (see table G).
� Guaranty agency default payments to lenders for SLS loans decreased considerably from $316 million in
FY 1997 to $91 million in FY 2000 (see table G).
� Default dollars paid to lenders for consolidated loans increased slightly between FY 1997 and FY 1998, but
fell by nearly one-third in FY 1999. Guaranty agency default payments decreased by 3.6 percent in FY 2000
(see table G).
� In FY 1997-FY 2000, USAF consistently paid between 27 and 28 percent of the total default payments paid
to lenders participating in the FFEL program (see table 58).
� Excluding USAF, three guaranty agencies comprised a large portion of the total default payments paid to
lenders in FY 1997-FY 1999. California, Texas, and Wisconsin, together, paid approximately 24 percent of
the total default payments made to lenders during this period. In FY 2000, three guaranty agencies other
than USAF that comprised a large portion of the total default payments were California, Pennsylvania, and
New York. These three states paid 25.9 percent of the total default payments made to lenders in FY 2000
(see table 58).
� Seven guaranty agencies (Florida, Maine, New Mexico, North Carolina, North Dakota, South Carolina, and
South Dakota) made higher default payments to lenders in FY 2000 than in FY 1997. All other guaranty
agencies had lower default payments to lenders in FY 2000 than in FY 1997 (see table 58).
Tables 53-58.(continued)

208Federal Student Loan Program
s Data Book
�FY 1997-FY 2000
Table 53. Federal Family Education Loan (FFEL) program default dollars paid to lenders for Stafford Subsidized loans, by guaranty agency: FY 1997-FY 2000
Default dollars paid to lenders (in 000’s) Percent change from: Percent share of total Rank
FY97- FY98- FY99-Guaranty agency FY97 FY98 FY991 FY001 FY98 FY99 FY00 FY97 FY98 FY991 FY001 FY97 FY98 FY991 FY001
Arkansas 11,553 9,590 7,160 8,044 -17.0 -25.3 12.3 0.7 0.6 0.7 0.7 28 29 26 25
California 161,757 125,273 71,063 95,061 -22.6 -43.3 33.8 9.3 7.7 6.6 8.9 2 5 5 2
Colorado 14,513 16,109 11,870 11,092 11.0 -26.3 -6.6 0.8 1.0 1.1 1.0 23 20 23 20
Connecticut 14,919 13,192 6,517 6,858 -11.6 -50.6 5.2 0.9 0.8 0.6 0.6 22 25 28 29
ECMC 28,469 25,554 20,359 13,826 -10.2 -20.3 -32.1 1.6 1.6 1.9 1.3 17 17 12 18
Florida 46,528 47,506 38,997 47,529 2.1 -17.9 21.9 2.7 2.9 3.6 4.4 9 9 7 7
Georgia 23,106 18,972 13,340 19,774 -17.9 -29.7 48.2 1.3 1.2 1.2 1.8 19 19 21 11
Illinois 65,314 58,215 36,168 34,806 -10.9 -37.9 -3.8 3.8 3.6 3.4 3.2 7 8 9 9
Iowa 21,648 15,364 12,899 11,465 -29.0 -16.0 -11.1 1.2 0.9 1.2 1.1 20 23 22 19
Kentucky 39,632 28,619 15,958 10,237 -27.8 -44.2 -35.9 2.3 1.8 1.5 1.0 10 15 17 24
Louisiana 16,149 15,630 13,760 10,716 -3.2 -12.0 -22.1 0.9 1.0 1.3 1.0 21 22 20 22
Maine 6,851 6,549 4,010 6,933 -4.4 -38.8 72.9 0.4 0.4 0.4 0.6 32 31 32 28
Massachusetts 63,689 64,272 36,998 36,908 0.9 -42.4 -0.2 3.7 3.9 3.4 3.4 8 7 8 8
Michigan 38,631 34,607 21,685 21,382 -10.4 -37.3 -1.4 2.2 2.1 2.0 2.0 11 10 10 10
Missouri 27,861 31,766 17,893 14,519 14.0 -43.7 -18.9 1.6 1.9 1.7 1.4 18 11 14 15
Montana 11,581 8,340 6,417 6,518 -28.0 -23.1 1.6 0.7 0.5 0.6 0.6 27 30 29 30
Nebraska 31,751 30,635 14,970 16,546 -3.5 -51.1 10.5 1.8 1.9 1.4 1.5 14 13 18 14
New Hampshire 9,431 5,168 1,272 2,678 -45.2 -75.4 110.5 0.5 0.3 0.1 0.2 30 33 36 35
New Jersey 32,694 30,416 14,620 10,682 -7.0 -51.9 -26.9 1.9 1.9 1.4 1.0 12 14 19 23
New Mexico 7,634 9,656 7,937 10,739 26.5 -17.8 35.3 0.4 0.6 0.7 1.0 31 28 24 21
New York 134,385 131,214 70,656 64,347 -2.4 -46.2 -8.9 7.8 8.0 6.5 6.0 4 3 6 6
North Carolina 10,546 14,797 16,163 14,438 40.3 9.2 -10.7 0.6 0.9 1.5 1.3 29 24 16 17
North Dakota 2,358 2,126 4,552 4,249 -9.8 114.1 -6.7 0.1 0.1 0.4 0.4 35 36 31 31
Oklahoma 29,196 20,274 17,436 17,476 -30.6 -14.0 0.2 1.7 1.2 1.6 1.6 16 18 15 13
Oregon 14,250 10,220 6,045 3,312 -28.3 -40.9 -45.2 0.8 0.6 0.6 0.3 24 27 30 32
Pennsylvania 108,019 128,387 82,591 88,074 18.9 -35.7 6.6 6.2 7.9 7.7 8.2 6 4 4 3
Rhode Island 11,618 12,634 7,644 7,959 8.8 -39.5 4.1 0.7 0.8 0.7 0.7 26 26 25 26
South Carolina 5,051 5,700 7,131 6,980 12.8 25.1 -2.1 0.3 0.3 0.7 0.6 33 32 27 27
South Dakota 1,985 3,131 2,300 2,522 57.7 -26.5 9.6 0.1 0.2 0.2 0.2 36 35 35 36
Tennessee 30,968 31,247 20,330 18,385 0.9 -34.9 -9.6 1.8 1.9 1.9 1.7 15 12 13 12
Texas 127,389 113,694 86,875 80,658 -10.8 -23.6 -7.2 7.3 7.0 8.1 7.5 5 6 3 4
USAF 393,440 369,878 260,276 270,325 -6.0 -29.6 3.9 22.7 22.7 24.1 25.2 1 1 1 1
Utah 12,739 15,935 3,670 3,108 25.1 -77.0 -15.3 0.7 1.0 0.3 0.3 25 21 33 33
Vermont 3,510 3,720 3,071 2,902 6.0 -17.4 -5.5 0.2 0.2 0.3 0.3 34 34 34 34
Washington 32,339 27,433 20,582 14,447 -15.2 -25.0 -29.8 1.9 1.7 1.9 1.3 13 16 11 16
Wisconsin 142,485 145,300 95,746 78,478 2.0 -34.1 -18.0 8.2 8.9 8.9 7.3 3 2 2 5
Total 1,733,986 1,631,126 1,078,962 1,073,975 -5.9 -33.9 -0.5 100.0 100.0 100.0 100.0
NOTES: Details may not add to totals due to rounding. Calculations are based on numbers before rounding.1 As a result of the Higher Education Amendments of 1998, effective October 7, 1998, the definition of default changed from 180 days of delinquency to 270 days of delinquency.
SOURCE: U.S. Department of Education, Office of Postsecondary Education, ED Form 1130.

Federal Student Loan Programs D
ata Book �
FY 1997-FY 2000209
Defaults and Collections
Table 54. Federal Family Education Loan (FFEL) program default dollars paid to lenders for Stafford Unsubsidized loans, by guaranty agency: FY 1997-FY 2000
Default dollars paid to lenders (in 000’s) Percent change from: Percent share of total Rank
FY97- FY98- FY99-Guaranty agency FY97 FY98 FY991 FY001 FY98 FY99 FY00 FY97 FY98 FY991 FY001 FY97 FY98 FY991 FY001
Arkansas 1,132 1,619 1,511 2,783 43.1 -6.7 84.2 0.4 0.4 0.4 0.5 29 29 30 27
California 52,710 71,897 54,725 86,028 36.4 -23.9 57.2 18.3 17.0 14.5 16.8 2 2 2 2
Colorado 3,786 6,089 5,418 7,119 60.8 -11.0 31.4 1.3 1.4 1.4 1.4 18 15 14 14
Connecticut 3,554 4,332 2,904 3,002 21.9 -33.0 3.4 1.2 1.0 0.8 0.6 20 22 24 25
ECMC 4,462 5,673 5,586 4,792 27.1 -1.5 -14.2 1.5 1.3 1.5 0.9 15 18 13 19
Florida 6,894 12,967 12,399 19,986 88.1 -4.4 61.2 2.4 3.1 3.3 3.9 9 7 7 8
Georgia 3,912 4,927 5,284 6,021 26.0 7.2 13.9 1.4 1.2 1.4 1.2 17 20 17 17
Illinois 6,467 9,937 7,300 9,282 53.6 -26.5 27.1 2.2 2.3 1.9 1.8 10 8 9 9
Iowa 3,179 2,962 3,168 3,888 -6.8 7.0 22.7 1.1 0.7 0.8 0.8 22 24 23 22
Kentucky 5,408 6,661 5,309 4,615 23.2 -20.3 -13.1 1.9 1.6 1.4 0.9 13 12 16 20
Louisiana 2,271 3,065 3,302 3,418 35.0 7.7 3.5 0.8 0.7 0.9 0.7 25 23 22 24
Maine 967 1,502 953 2,153 55.3 -36.5 125.8 0.3 0.4 0.3 0.4 30 31 34 29
Massachusetts 8,214 8,291 4,768 37,213 0.9 -42.5 680.4 2.9 2.0 1.3 7.3 7 10 19 3
Michigan 5,409 6,576 6,658 7,910 21.6 1.2 18.8 1.9 1.6 1.8 1.5 12 13 10 11
Missouri 3,785 6,079 5,738 6,369 60.6 -5.6 11.0 1.3 1.4 1.5 1.2 19 16 12 16
Montana 1,569 2,066 2,215 2,794 31.7 7.2 26.2 0.5 0.5 0.6 0.5 26 27 26 26
Nebraska 3,276 6,218 4,506 7,205 89.8 -27.5 59.9 1.1 1.5 1.2 1.4 21 14 20 12
New Hampshire 1,290 1,611 580 1,122 24.8 -64.0 93.4 0.4 0.4 0.2 0.2 28 30 35 35
New Jersey 5,856 7,786 4,884 5,296 33.0 -37.3 8.5 2.0 1.8 1.3 1.0 11 11 18 18
New Mexico 631 1,243 1,677 2,576 97.1 34.9 53.6 0.2 0.3 0.4 0.5 32 32 29 28
New York 18,521 33,639 25,852 30,575 81.6 -23.1 18.3 6.4 7.9 6.9 6.0 4 3 6 7
North Carolina 784 1,854 2,660 3,638 136.6 43.5 36.8 0.3 0.4 0.7 0.7 31 28 25 23
North Dakota 241 345 560 928 43.2 62.3 65.6 0.1 0.1 0.1 0.2 36 36 36 36
Oklahoma 4,465 5,195 5,318 6,649 16.3 2.4 25.0 1.6 1.2 1.4 1.3 14 19 15 15
Oregon 2,411 2,346 2,032 1,534 -2.7 -13.4 -24.5 0.8 0.6 0.5 0.3 24 26 27 32
Pennsylvania 16,911 29,232 29,728 34,339 72.9 1.7 15.5 5.9 6.9 7.9 6.7 6 5 3 4
Rhode Island 2,542 4,492 3,586 4,071 76.7 -20.2 13.5 0.9 1.1 1.0 0.8 23 21 21 21
South Carolina 596 942 1,803 2,060 58.1 91.5 14.2 0.2 0.2 0.5 0.4 33 35 28 30
South Dakota 561 1,013 1,053 1,490 80.5 4.0 41.5 0.2 0.2 0.3 0.3 35 33 33 34
Tennessee 3,944 5,783 6,194 7,136 46.6 7.1 15.2 1.4 1.4 1.6 1.4 16 17 11 13
Texas 17,016 26,112 27,554 33,066 53.5 5.5 20.0 5.9 6.2 7.3 6.5 5 6 5 5
USAF 64,684 98,396 91,734 121,281 52.1 -6.8 32.2 22.5 23.2 24.3 23.7 1 1 1 1
Utah 1,410 2,521 1,364 1,594 78.8 -45.9 16.9 0.5 0.6 0.4 0.3 27 25 31 31
Vermont 593 968 1,054 1,502 63.4 8.8 42.5 0.2 0.2 0.3 0.3 34 34 32 33
Washington 7,341 9,514 7,866 8,108 29.6 -17.3 3.1 2.5 2.2 2.1 1.6 8 9 8 10
Wisconsin 21,274 29,460 29,509 31,078 38.5 0.2 5.3 7.4 7.0 7.8 6.1 3 4 4 6
Total 288,067 423,315 376,753 512,626 47.0 -11.0 36.1 100.0 100.0 100.0 100.0
NOTES: The Stafford Unsubsidized program began in FY93. Details may not add to totals due to rounding. Calculations are based on numbers before rounding.1 As a result of the Higher Education Amendments of 1998, effective October 7, 1998, the definition of default changed from 180 days of delinquency to 270 days of delinquency.
SOURCE: U.S. Department of Education, Office of Postsecondary Education, ED Form 1130.

210Federal Student Loan Program
s Data Book
�FY 1997-FY 2000
Table 55. Federal Family Education Loan (FFEL) program default dollars paid to lenders for Parent Loans for Undergraduate Students (PLUS) loans, by guaranty agency: FY 1997-FY 2000
Default dollars paid to lenders (in 000’s) Percent change from: Percent share of total Rank
FY97- FY98- FY99-Guaranty agency FY97 FY98 FY991 FY001 FY98 FY99 FY00 FY97 FY98 FY991 FY001 FY97 FY98 FY991 FY001
Arkansas 315 398 168 405 26.7 -57.8 141.0 0.3 0.4 0.2 0.6 28 25 28 22
California 5,649 6,032 4,041 5,308 6.8 -33.0 31.3 5.0 6.0 5.6 8.0 5 5 5 3
Colorado 1,038 932 575 472 -10.2 -38.3 -17.8 0.9 0.9 0.8 0.7 17 16 19 18
Connecticut 1,123 1,186 756 862 5.6 -36.2 14.0 1.0 1.2 1.0 1.3 16 14 15 15
ECMC 2,379 2,080 1,372 895 -12.6 -34.0 -34.8 2.1 2.1 1.9 1.4 9 11 13 14
Florida 2,128 1,965 1,942 2,844 -7.7 -1.2 46.5 1.9 1.9 2.7 4.3 11 12 8 7
Georgia 1,225 949 717 919 -22.5 -24.5 28.2 1.1 0.9 1.0 1.4 15 15 16 13
Illinois 2,047 1,855 1,633 1,254 -9.4 -12.0 -23.2 1.8 1.8 2.3 1.9 13 13 9 10
Iowa 1,014 818 550 305 -19.3 -32.7 -44.5 0.9 0.8 0.8 0.5 19 20 20 24
Kentucky 869 525 521 164 -39.6 -0.7 -68.6 0.8 0.5 0.7 0.2 20 24 23 30
Louisiana 563 322 377 248 -42.8 17.1 -34.1 0.5 0.3 0.5 0.4 24 27 25 25
Maine 276 366 113 178 32.9 -69.2 57.5 0.2 0.4 0.2 0.3 29 26 30 29
Massachusetts 7,183 6,653 3,162 4,031 -7.4 -52.5 27.5 6.4 6.6 4.4 6.1 4 4 7 6
Michigan 1,019 794 769 445 -22.1 -3.1 -42.1 0.9 0.8 1.1 0.7 18 21 14 20
Missouri 842 892 545 461 5.9 -38.9 -15.4 0.7 0.9 0.8 0.7 22 19 21 19
Montana 394 209 150 223 -46.9 -28.5 48.9 0.3 0.2 0.2 0.3 27 31 29 26
Nebraska 2,245 2,506 1,484 937 11.6 -40.8 -36.9 2.0 2.5 2.1 1.4 10 9 10 12
New Hampshire 228 239 101 193 5.0 -57.9 91.2 0.2 0.2 0.1 0.3 30 29 33 27
New Jersey 2,698 3,133 1,375 1,044 16.1 -56.1 -24.0 2.4 3.1 1.9 1.6 8 8 12 11
New Mexico 29 9 15 14 -70.0 76.0 -9.2 0.0 0.0 0.0 0.0 36 36 36 36
New York 7,440 8,035 6,002 5,665 8.0 -25.3 -5.6 6.6 8.0 8.3 8.6 3 3 2 2
North Carolina 47 267 209 150 466.7 -21.7 -28.2 0.0 0.3 0.3 0.2 33 28 26 31
North Dakota 38 12 108 100 -68.3 782.7 -7.4 0.0 0.0 0.1 0.2 35 35 31 32
Oklahoma 1,322 916 531 477 -30.7 -42.0 -10.2 1.2 0.9 0.7 0.7 14 18 22 17
Oregon 513 148 70 38 -71.1 -52.5 -45.6 0.5 0.1 0.1 0.1 26 33 34 35
Pennsylvania 3,324 4,402 4,084 4,394 32.4 -7.2 7.6 2.9 4.4 5.7 6.6 7 6 4 5
Rhode Island 2,116 2,193 1,443 1,576 3.6 -34.2 9.2 1.9 2.2 2.0 2.4 12 10 11 9
South Carolina 128 169 201 184 31.9 19.0 -8.8 0.1 0.2 0.3 0.3 32 32 27 28
South Dakota 45 22 22 99 -50.8 -3.2 356.0 0.0 0.0 0.0 0.1 34 34 35 33
Tennessee 619 652 443 366 5.2 -32.0 -17.3 0.5 0.6 0.6 0.6 23 23 24 23
Texas 5,600 4,097 3,375 2,722 -26.8 -17.6 -19.3 5.0 4.1 4.7 4.1 6 7 6 8
USAF 47,775 37,847 28,008 23,235 -20.8 -26.0 -17.0 42.3 37.5 38.8 35.1 1 1 1 1
Utah 219 222 101 53 1.5 -54.5 -47.4 0.2 0.2 0.1 0.1 31 30 32 34
Vermont 550 713 705 405 29.7 -1.1 -42.6 0.5 0.7 1.0 0.6 25 22 17 21
Washington 850 921 661 515 8.2 -28.2 -22.2 0.8 0.9 0.9 0.8 21 17 18 16
Wisconsin 9,217 8,491 5,823 5,041 -7.9 -31.4 -13.4 8.2 8.4 8.1 7.6 2 2 3 4
Total 113,069 100,971 72,155 66,223 -10.7 -28.5 -8.2 100.0 100.0 100.0 100.0
NOTES: Details may not add to totals due to rounding. Calculations are based on numbers before rounding.1 As a result of the Higher Education Amendments of 1998, effective October 7, 1998, the definition of default changed from 180 days of delinquency to 270 days of delinquency.
SOURCE: U.S. Department of Education, Office of Postsecondary Education, ED Form 1130.
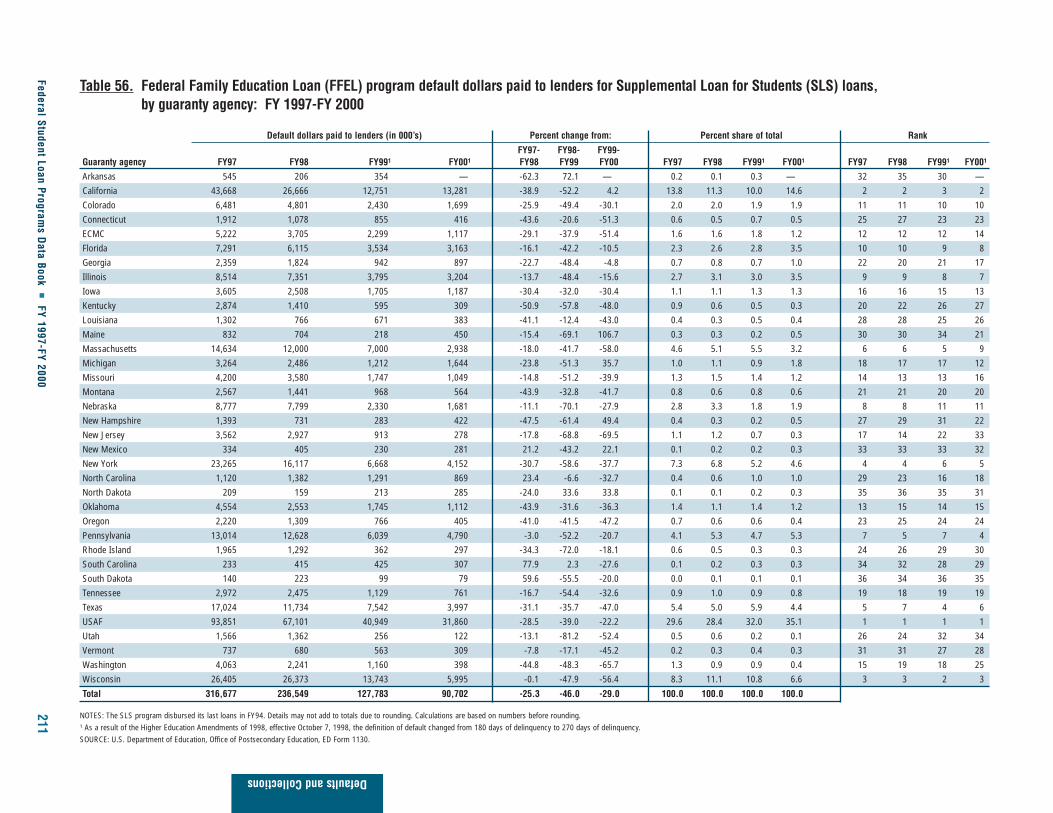
Federal Student Loan Programs D
ata Book �
FY 1997-FY 2000211
Defaults and Collections
Table 56. Federal Family Education Loan (FFEL) program default dollars paid to lenders for Supplemental Loan for Students (SLS) loans, by guaranty agency: FY 1997-FY 2000
Default dollars paid to lenders (in 000’s) Percent change from: Percent share of total Rank
FY97- FY98- FY99-Guaranty agency FY97 FY98 FY991 FY001 FY98 FY99 FY00 FY97 FY98 FY991 FY001 FY97 FY98 FY991 FY001
Arkansas 545 206 354 — -62.3 72.1 — 0.2 0.1 0.3 — 32 35 30 —California 43,668 26,666 12,751 13,281 -38.9 -52.2 4.2 13.8 11.3 10.0 14.6 2 2 3 2Colorado 6,481 4,801 2,430 1,699 -25.9 -49.4 -30.1 2.0 2.0 1.9 1.9 11 11 10 10Connecticut 1,912 1,078 855 416 -43.6 -20.6 -51.3 0.6 0.5 0.7 0.5 25 27 23 23ECMC 5,222 3,705 2,299 1,117 -29.1 -37.9 -51.4 1.6 1.6 1.8 1.2 12 12 12 14Florida 7,291 6,115 3,534 3,163 -16.1 -42.2 -10.5 2.3 2.6 2.8 3.5 10 10 9 8Georgia 2,359 1,824 942 897 -22.7 -48.4 -4.8 0.7 0.8 0.7 1.0 22 20 21 17Illinois 8,514 7,351 3,795 3,204 -13.7 -48.4 -15.6 2.7 3.1 3.0 3.5 9 9 8 7Iowa 3,605 2,508 1,705 1,187 -30.4 -32.0 -30.4 1.1 1.1 1.3 1.3 16 16 15 13Kentucky 2,874 1,410 595 309 -50.9 -57.8 -48.0 0.9 0.6 0.5 0.3 20 22 26 27Louisiana 1,302 766 671 383 -41.1 -12.4 -43.0 0.4 0.3 0.5 0.4 28 28 25 26Maine 832 704 218 450 -15.4 -69.1 106.7 0.3 0.3 0.2 0.5 30 30 34 21Massachusetts 14,634 12,000 7,000 2,938 -18.0 -41.7 -58.0 4.6 5.1 5.5 3.2 6 6 5 9Michigan 3,264 2,486 1,212 1,644 -23.8 -51.3 35.7 1.0 1.1 0.9 1.8 18 17 17 12Missouri 4,200 3,580 1,747 1,049 -14.8 -51.2 -39.9 1.3 1.5 1.4 1.2 14 13 13 16Montana 2,567 1,441 968 564 -43.9 -32.8 -41.7 0.8 0.6 0.8 0.6 21 21 20 20Nebraska 8,777 7,799 2,330 1,681 -11.1 -70.1 -27.9 2.8 3.3 1.8 1.9 8 8 11 11New Hampshire 1,393 731 283 422 -47.5 -61.4 49.4 0.4 0.3 0.2 0.5 27 29 31 22New Jersey 3,562 2,927 913 278 -17.8 -68.8 -69.5 1.1 1.2 0.7 0.3 17 14 22 33New Mexico 334 405 230 281 21.2 -43.2 22.1 0.1 0.2 0.2 0.3 33 33 33 32New York 23,265 16,117 6,668 4,152 -30.7 -58.6 -37.7 7.3 6.8 5.2 4.6 4 4 6 5North Carolina 1,120 1,382 1,291 869 23.4 -6.6 -32.7 0.4 0.6 1.0 1.0 29 23 16 18North Dakota 209 159 213 285 -24.0 33.6 33.8 0.1 0.1 0.2 0.3 35 36 35 31Oklahoma 4,554 2,553 1,745 1,112 -43.9 -31.6 -36.3 1.4 1.1 1.4 1.2 13 15 14 15Oregon 2,220 1,309 766 405 -41.0 -41.5 -47.2 0.7 0.6 0.6 0.4 23 25 24 24Pennsylvania 13,014 12,628 6,039 4,790 -3.0 -52.2 -20.7 4.1 5.3 4.7 5.3 7 5 7 4Rhode Island 1,965 1,292 362 297 -34.3 -72.0 -18.1 0.6 0.5 0.3 0.3 24 26 29 30South Carolina 233 415 425 307 77.9 2.3 -27.6 0.1 0.2 0.3 0.3 34 32 28 29South Dakota 140 223 99 79 59.6 -55.5 -20.0 0.0 0.1 0.1 0.1 36 34 36 35Tennessee 2,972 2,475 1,129 761 -16.7 -54.4 -32.6 0.9 1.0 0.9 0.8 19 18 19 19Texas 17,024 11,734 7,542 3,997 -31.1 -35.7 -47.0 5.4 5.0 5.9 4.4 5 7 4 6USAF 93,851 67,101 40,949 31,860 -28.5 -39.0 -22.2 29.6 28.4 32.0 35.1 1 1 1 1Utah 1,566 1,362 256 122 -13.1 -81.2 -52.4 0.5 0.6 0.2 0.1 26 24 32 34Vermont 737 680 563 309 -7.8 -17.1 -45.2 0.2 0.3 0.4 0.3 31 31 27 28Washington 4,063 2,241 1,160 398 -44.8 -48.3 -65.7 1.3 0.9 0.9 0.4 15 19 18 25Wisconsin 26,405 26,373 13,743 5,995 -0.1 -47.9 -56.4 8.3 11.1 10.8 6.6 3 3 2 3
Total 316,677 236,549 127,783 90,702 -25.3 -46.0 -29.0 100.0 100.0 100.0 100.0
NOTES: The SLS program disbursed its last loans in FY94. Details may not add to totals due to rounding. Calculations are based on numbers before rounding.1 As a result of the Higher Education Amendments of 1998, effective October 7, 1998, the definition of default changed from 180 days of delinquency to 270 days of delinquency.SOURCE: U.S. Department of Education, Office of Postsecondary Education, ED Form 1130.

212Federal Student Loan Program
s Data Book
�FY 1997-FY 2000
Table 57. Federal Family Education Loan (FFEL) program default dollars paid to lenders for Consolidation loans, by guaranty agency: FY 1997-FY 2000
Default dollars paid to lenders (in 000’s) Percent change from: Percent share of total Rank
FY97- FY98- FY99-Guaranty agency FY97 FY98 FY991 FY001 FY98 FY99 FY00 FY97 FY98 FY991 FY001 FY97 FY98 FY991 FY001
Arkansas 1,411 1,108 787 1,249 -21.5 -28.9 58.6 0.3 0.2 0.2 0.3 21 24 23 23
California 54,144 54,277 32,941 42,309 0.2 -39.3 28.4 10.1 9.8 8.9 11.8 2 3 3 2
Colorado 6,394 7,212 5,538 4,810 12.8 -23.2 -13.1 1.2 1.3 1.5 1.3 14 13 14 14
Connecticut 362 1,817 2,501 2,563 402.4 37.6 2.5 0.1 0.3 0.7 0.7 29 21 19 19
ECMC 170 199 223 2,209 17.1 12.2 890.7 0.0 0.0 0.1 0.6 33 32 33 21
Florida 1,306 546 2,193 5,347 -58.2 301.6 143.9 0.2 0.1 0.6 1.5 22 26 20 12
Georgia 306 109 438 402 -64.2 300.6 -8.3 0.1 0.0 0.1 0.1 30 33 29 32
Illinois 36,348 24,139 16,477 16,231 -33.6 -31.7 -1.5 6.8 4.4 4.4 4.5 4 5 6 6
Iowa 3,595 4,330 3,386 5,092 20.4 -21.8 50.4 0.7 0.8 0.9 1.4 16 15 16 13
Kentucky 2,477 2,382 1,532 1,637 -3.9 -35.7 6.8 0.5 0.4 0.4 0.5 17 19 21 22
Louisiana 794 541 705 919 -31.9 30.2 30.4 0.1 0.1 0.2 0.3 24 28 24 24
Maine 581 598 186 568 2.9 -69.0 205.9 0.1 0.1 0.0 0.2 27 25 35 29
Massachusetts 13,756 15,679 10,122 6,463 14.0 -35.4 -36.1 2.6 2.8 2.7 1.8 9 9 9 9
Michigan 1,823 2,056 6,013 3,539 12.8 192.5 -41.2 0.3 0.4 1.6 1.0 19 20 11 17
Missouri 7,286 7,910 4,914 4,259 8.6 -37.9 -13.3 1.4 1.4 1.3 1.2 13 12 15 16
Montana 4,420 2,691 2,926 2,465 -39.1 8.7 -15.8 0.8 0.5 0.8 0.7 15 16 18 20
Nebraska 14,858 23,678 12,006 10,885 59.4 -49.3 -9.3 2.8 4.3 3.2 3.0 7 6 7 7
New Hampshire 621 242 199 80 -61.1 -17.7 -59.9 0.1 0.0 0.1 0.0 26 31 34 35
New Jersey 19,193 18,072 9,056 5,471 -5.8 -49.9 -39.6 3.6 3.3 2.4 1.5 6 8 10 11
New Mexico 189 542 686 706 187.6 26.5 2.9 0.0 0.1 0.2 0.2 32 27 26 27
New York 13,199 13,290 20,919 41,463 0.7 57.4 98.2 2.5 2.4 5.6 11.6 10 10 5 3
North Carolina — — — 48 — — — — — — — — — — 36
North Dakota 24 108 345 384 343.8 219.9 11.2 0.0 0.0 0.1 0.1 35 34 31 33
Oklahoma 8,238 4,909 5,596 6,024 -40.4 14.0 7.6 1.5 0.9 1.5 1.7 12 14 13 10
Oregon 278 508 545 229 82.3 7.4 -57.9 0.1 0.1 0.1 0.1 31 29 27 34
Pennsylvania 31,462 34,791 31,410 24,875 10.6 -9.7 -20.8 5.8 6.3 8.4 6.9 5 4 4 4
Rhode Island 678 1,399 687 615 106.4 -50.9 -10.6 0.1 0.3 0.2 0.2 25 22 25 28
South Carolina 116 68 495 473 -42.0 632.9 -4.5 0.0 0.0 0.1 0.1 34 35 28 30
South Dakota 1,088 1,388 955 718 27.5 -31.2 -24.7 0.2 0.3 0.3 0.2 23 23 22 26
Tennessee 1,723 2,591 3,145 3,370 50.4 21.4 7.1 0.3 0.5 0.8 0.9 20 17 17 18
Texas 49,620 56,013 34,444 23,583 12.9 -38.5 -31.5 9.2 10.2 9.3 6.6 3 2 2 5
USAF 236,023 235,721 142,722 126,178 -0.1 -39.5 -11.6 43.9 42.7 38.4 35.2 1 1 1 1
Utah 2,182 2,416 401 413 10.7 -83.4 3.2 0.4 0.4 0.1 0.1 18 18 30 31
Vermont 577 468 231 791 -18.9 -50.6 242.4 0.1 0.1 0.1 0.2 28 30 32 25
Washington 8,562 8,308 5,968 4,379 -3.0 -28.2 -26.6 1.6 1.5 1.6 1.2 11 11 12 15
Wisconsin 14,239 21,354 11,030 7,653 50.0 -48.3 -30.6 2.6 3.9 3.0 2.1 8 7 8 8
Total 538,044 551,457 371,720 358,399 2.5 -32.6 -3.6 100.0 100.0 100.0 100.0
NOTES: Details may not add to totals due to rounding. Calculations are based on numbers before rounding.1 As a result of the Higher Education Amendments of 1998, effective October 7, 1998, the definition of default changed from 180 days of delinquency to 270 days of delinquency.
SOURCE: U.S. Department of Education, Office of Postsecondary Education, ED Form 1130.

Federal Student Loan Programs D
ata Book �
FY 1997-FY 2000213
Defaults and Collections
Table 58. Federal Family Education Loan (FFEL) program default dollars paid to lenders for Stafford Subsidized, Stafford Unsubsidized, Parent Loansfor Undergraduate Students (PLUS), Supplemental Loan for Students (SLS), and Consolidation loans, by guaranty agency: FY 1997-FY 2000
Default dollars paid to lenders (in 000’s) Percent change from: Percent share of total Rank
FY97- FY98- FY99-Guaranty agency FY97 FY98 FY991 FY001 FY98 FY99 FY00 FY97 FY98 FY991 FY001 FY97 FY98 FY991 FY001
Arkansas 14,955 12,921 9,980 12,480 -13.6 -22.8 25.1 0.5 0.4 0.5 0.6 28 29 29 28California 317,928 284,146 175,522 241,987 -10.6 -38.2 37.9 10.6 9.7 8.7 11.5 2 2 2 2Colorado 32,212 35,143 25,832 25,193 9.1 -26.5 -2.5 1.1 1.2 1.3 1.2 20 18 18 17Connecticut 21,869 21,605 13,533 13,702 -1.2 -37.4 1.2 0.7 0.7 0.7 0.7 22 24 25 26ECMC 40,702 37,210 29,838 22,838 -8.6 -19.8 -23.5 1.4 1.3 1.5 1.1 17 17 17 18Florida 64,147 69,099 59,064 78,869 7.7 -14.5 33.5 2.1 2.3 2.9 3.8 9 10 9 8Georgia 30,907 26,782 20,721 28,013 -13.3 -22.6 35.2 1.0 0.9 1.0 1.3 21 20 21 14Illinois 118,690 101,498 65,373 64,777 -14.5 -35.6 -0.9 4.0 3.4 3.2 3.1 7 8 7 9Iowa 33,041 25,982 21,708 21,938 -21.4 -16.5 1.1 1.1 0.9 1.1 1.0 19 21 20 20Kentucky 51,260 39,597 23,916 16,962 -22.8 -39.6 -29.1 1.7 1.3 1.2 0.8 13 16 19 22Louisiana 21,079 20,325 18,815 15,685 -3.6 -7.4 -16.6 0.7 0.7 0.9 0.7 23 25 23 23Maine 9,507 9,720 5,479 10,282 2.2 -43.6 87.7 0.3 0.3 0.3 0.5 31 31 34 29Massachusetts 107,475 106,895 62,050 87,554 -0.5 -42.0 41.1 3.6 3.6 3.1 4.2 8 7 8 7Michigan 50,146 46,519 36,337 34,920 -7.2 -21.9 -3.9 1.7 1.6 1.8 1.7 14 14 10 11Missouri 43,974 50,228 30,837 26,658 14.2 -38.6 -13.6 1.5 1.7 1.5 1.3 16 12 15 16Montana 20,532 14,748 12,676 12,564 -28.2 -14.1 -0.9 0.7 0.5 0.6 0.6 24 27 26 27Nebraska 60,907 70,837 35,296 37,255 16.3 -50.2 5.5 2.0 2.4 1.7 1.8 11 9 12 10New Hampshire 12,963 7,991 2,435 4,495 -38.4 -69.5 84.6 0.4 0.3 0.1 0.2 29 32 36 36New Jersey 64,002 62,334 30,848 22,772 -2.6 -50.5 -26.2 2.1 2.1 1.5 1.1 10 11 14 19New Mexico 8,817 11,855 10,545 14,316 34.5 -11.0 35.8 0.3 0.4 0.5 0.7 32 30 27 25New York 196,811 202,294 130,098 146,202 2.8 -35.7 12.4 6.6 6.9 6.4 7.0 5 6 6 4North Carolina 12,496 18,301 20,324 19,144 46.4 11.1 -5.8 0.4 0.6 1.0 0.9 30 26 22 21North Dakota 2,871 2,751 5,778 5,945 -4.2 110.0 2.9 0.1 0.1 0.3 0.3 36 36 32 31Oklahoma 47,776 33,847 30,627 31,739 -29.2 -9.5 3.6 1.6 1.1 1.5 1.5 15 19 16 12Oregon 19,672 14,531 9,458 5,518 -26.1 -34.9 -41.7 0.7 0.5 0.5 0.3 25 28 30 33Pennsylvania 172,731 209,440 153,852 156,474 21.3 -26.5 1.7 5.8 7.1 7.6 7.4 6 5 5 3Rhode Island 18,919 22,011 13,722 14,517 16.3 -37.7 5.8 0.6 0.7 0.7 0.7 26 23 24 24South Carolina 6,125 7,293 10,055 10,004 19.1 37.9 -0.5 0.2 0.2 0.5 0.5 33 33 28 30South Dakota 3,820 5,778 4,429 4,909 51.3 -23.3 10.8 0.1 0.2 0.2 0.2 35 35 35 35Tennessee 40,225 42,748 31,241 30,019 6.3 -26.9 -3.9 1.3 1.5 1.5 1.4 18 15 13 13Texas 216,649 211,649 159,790 144,026 -2.3 -24.5 -9.9 7.2 7.2 7.9 6.9 3 4 3 5USAF 835,774 808,943 563,689 572,880 -3.2 -30.3 1.6 28.0 27.5 27.8 27.3 1 1 1 1Utah 18,116 22,455 5,791 5,291 23.9 -74.2 -8.6 0.6 0.8 0.3 0.3 27 22 31 34Vermont 5,967 6,549 5,624 5,909 9.8 -14.1 5.1 0.2 0.2 0.3 0.3 34 34 33 32Washington 53,156 48,417 36,237 27,846 -8.9 -25.2 -23.2 1.8 1.6 1.8 1.3 12 13 11 15Wisconsin 213,620 230,979 155,850 128,244 8.1 -32.5 -17.7 7.1 7.8 7.7 6.1 4 3 4 6
Total 2,989,843 2,943,419 2,027,373 2,101,924 -1.6 -31.1 3.7 100.0 100.0 100.0 100.0
NOTES: Details may not add to totals due to rounding. Calculations are based on numbers before rounding.1 As a result of the Higher Education Amendments of 1998, effective October 7, 1998, the definition of default changed from 180 days of delinquency to 270 days of delinquency.SOURCE: U.S. Department of Education, Office of Postsecondary Education, ED Form 1130.

Collections are repayments on defaulted loans. Once the guaranty agency pays off a default claim, the lender
transfers the account to that guaranty agency. The guaranty agency is then responsible for seeking out the borrower
and collecting on the defaulted loan(s). If the guaranty agency is unable to collect from the borrower, it may turn
the account over to the Department of Education. In FY 1993, it became mandatory that all accounts that have
had no collection activity within the last three years be assigned to the Department of Education for collection; these
funds are referred to as “mandatory assignments.”
Table 64 presents collections on defaulted loans, by guaranty agency in FY 1997-FY 2000. The information is
presented for each FFEL program (Stafford Subsidized, Stafford Unsubsidized PLUS, SLS and Consolidation) in
tables 59-63, respectively. All tables report the percent change, percent share of total, and guaranty agency rank.
� FFEL program collections on defaulted loans increased by 39.1 percent from FY 1997 to FY 1998
collections increased 17.3 and 35.1 percent in FY 1999 and FY 2000, respectively. Each of the individual
loan programs also experienced annual increases over the period (see table H for a summary of collection
volume and percent change from prior year).
� The Stafford Unsubsidized loan program, initiated in FY 1993, experienced the largest percentage growth,
with increases of 206.7 percent from FY 1997 to FY 1998, 116.6 percent from FY 1998 to FY 1999, and
68.2 percent from FY 1999 to FY 2000 (see table H).
� In FY 1997-FY 2000, USAF collections on defaults represented the largest portion of FFEL program
collection activity. After falling from 26.1 percent of total collections in FY 1997 to 21.9 percent in FY 1998,
USAF’s share increased to 27.5 percent in FY 1999 and 31.7 percent in FY 2000 (see table 64).
Tables 59-64. Federal Family Education Loan (FFEL) program collections on defaultedloans for Stafford Subsidized, Stafford Unsubsidized, Parent Loans forUndergraduate Students (PLUS), Supplemental Loan for Students (SLS),and Consolidation loans, by guaranty agency: FY 1997-FY 2000
214 Federal Student Loan Programs Data Book � FY 1997-FY 2000
Table H. Total dollar volume and percent change of program collections on defaulted dollars, by loan program:FY 1997-FY 2000 (subset of tables 59-64)
($ in 000’s)
FY97 FY98 FY99 FY00
Stafford Subsidized $1,073,148 $1,479,200 $1,562,817 $2,057,255
Change from prior year — 37.8% 5.7% 31.6%
Stafford Unsubsidized $21,162 $64,908 $140,578 $236,471
Change from prior year — 206.7% 116.6% 68.2%
PLUS $85,529 $130,529 $142,766 $191,448
Change from prior year — 52.6% 9.4% 34.1%
SLS $172,589 $180,534 $198,045 $212,473
Change from prior year — 4.6% 9.7% 7.3%
Consolidation $91,595 $153,397 $310,948 $484,542
Change from prior year — 67.5% 102.7% 55.8%
FFEL program total $144,022 $2,008,568 $2,355,154 $3,182,189
Change from prior year — 39.1% 17.3% 35.1%
— Not applicable.
NOTES: Details may not add to totals due to rounding.
SOURCE: U.S. Department of Education, Office of Postsecondary Education, ED Form 1130.
� In FY 1999 and FY 2000, the three guaranty agencies other than USAF collecting the largest proportions of
FFEL defaulted loans were California, New York, and Texas. These three agencies accounted for
approximately 27 percent of FFEL program collection activity each of the two years (see table 64).
� Only Wisconsin collected fewer defaulted dollars in FY 2000 than in FY 1997. All other guaranty agencies
collected more defaulted loan dollars in FY 2000 than in FY 1997 (see table 64).
� The rank of ECMC fell each year from 17 in FY 1997, to 15 in FY 1998, to 10 in FY 1999, and to 9 in
FY 2000. The rank of Florida increased each year from 13 in FY 1997, to 17 in FY 1998, to 19 in FY 1999,
and to 23 in FY 2000. Although the other agencies changed rank as well, they did not show such a consistent
pattern over the period (see table 64).
Tables 59-64.(continued)
Federal Student Loan Programs Data Book � FY 1997-FY 2000 215
Defaults and Collections
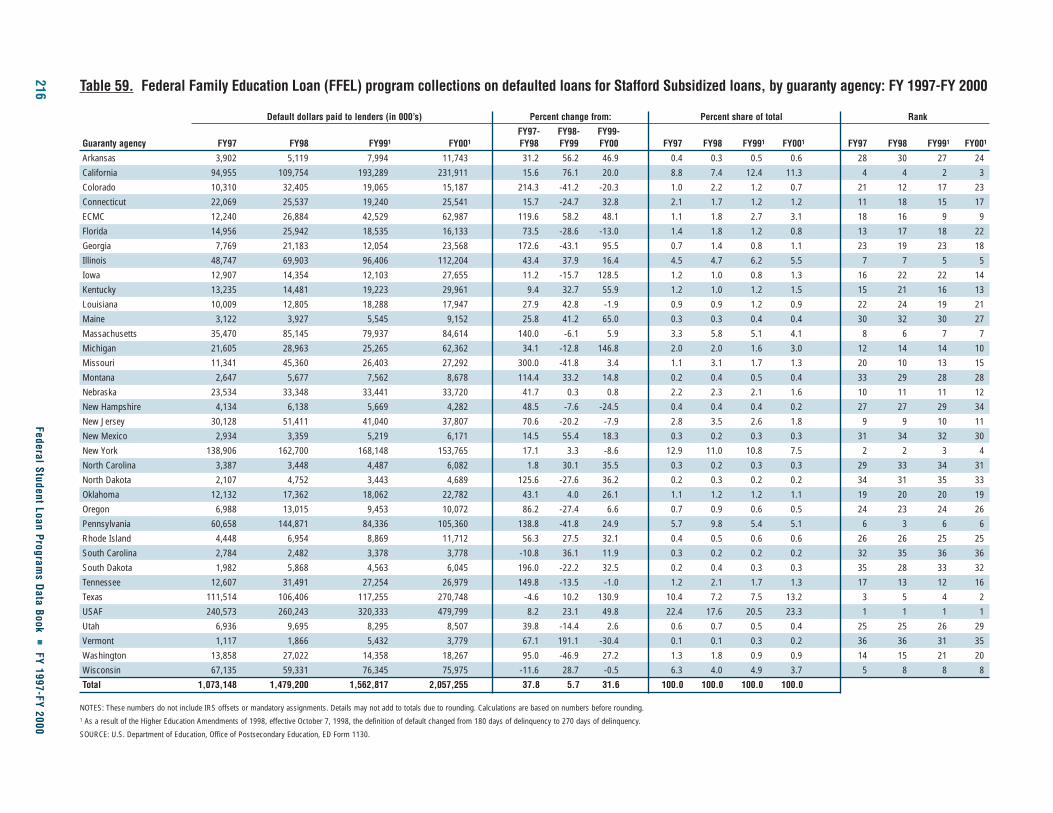
216Federal Student Loan Program
s Data Book
�FY 1997-FY 2000
Table 59. Federal Family Education Loan (FFEL) program collections on defaulted loans for Stafford Subsidized loans, by guaranty agency: FY 1997-FY 2000
Default dollars paid to lenders (in 000’s) Percent change from: Percent share of total Rank
FY97- FY98- FY99-Guaranty agency FY97 FY98 FY991 FY001 FY98 FY99 FY00 FY97 FY98 FY991 FY001 FY97 FY98 FY991 FY001
Arkansas 3,902 5,119 7,994 11,743 31.2 56.2 46.9 0.4 0.3 0.5 0.6 28 30 27 24
California 94,955 109,754 193,289 231,911 15.6 76.1 20.0 8.8 7.4 12.4 11.3 4 4 2 3
Colorado 10,310 32,405 19,065 15,187 214.3 -41.2 -20.3 1.0 2.2 1.2 0.7 21 12 17 23
Connecticut 22,069 25,537 19,240 25,541 15.7 -24.7 32.8 2.1 1.7 1.2 1.2 11 18 15 17
ECMC 12,240 26,884 42,529 62,987 119.6 58.2 48.1 1.1 1.8 2.7 3.1 18 16 9 9
Florida 14,956 25,942 18,535 16,133 73.5 -28.6 -13.0 1.4 1.8 1.2 0.8 13 17 18 22
Georgia 7,769 21,183 12,054 23,568 172.6 -43.1 95.5 0.7 1.4 0.8 1.1 23 19 23 18
Illinois 48,747 69,903 96,406 112,204 43.4 37.9 16.4 4.5 4.7 6.2 5.5 7 7 5 5
Iowa 12,907 14,354 12,103 27,655 11.2 -15.7 128.5 1.2 1.0 0.8 1.3 16 22 22 14
Kentucky 13,235 14,481 19,223 29,961 9.4 32.7 55.9 1.2 1.0 1.2 1.5 15 21 16 13
Louisiana 10,009 12,805 18,288 17,947 27.9 42.8 -1.9 0.9 0.9 1.2 0.9 22 24 19 21
Maine 3,122 3,927 5,545 9,152 25.8 41.2 65.0 0.3 0.3 0.4 0.4 30 32 30 27
Massachusetts 35,470 85,145 79,937 84,614 140.0 -6.1 5.9 3.3 5.8 5.1 4.1 8 6 7 7
Michigan 21,605 28,963 25,265 62,362 34.1 -12.8 146.8 2.0 2.0 1.6 3.0 12 14 14 10
Missouri 11,341 45,360 26,403 27,292 300.0 -41.8 3.4 1.1 3.1 1.7 1.3 20 10 13 15
Montana 2,647 5,677 7,562 8,678 114.4 33.2 14.8 0.2 0.4 0.5 0.4 33 29 28 28
Nebraska 23,534 33,348 33,441 33,720 41.7 0.3 0.8 2.2 2.3 2.1 1.6 10 11 11 12
New Hampshire 4,134 6,138 5,669 4,282 48.5 -7.6 -24.5 0.4 0.4 0.4 0.2 27 27 29 34
New Jersey 30,128 51,411 41,040 37,807 70.6 -20.2 -7.9 2.8 3.5 2.6 1.8 9 9 10 11
New Mexico 2,934 3,359 5,219 6,171 14.5 55.4 18.3 0.3 0.2 0.3 0.3 31 34 32 30
New York 138,906 162,700 168,148 153,765 17.1 3.3 -8.6 12.9 11.0 10.8 7.5 2 2 3 4
North Carolina 3,387 3,448 4,487 6,082 1.8 30.1 35.5 0.3 0.2 0.3 0.3 29 33 34 31
North Dakota 2,107 4,752 3,443 4,689 125.6 -27.6 36.2 0.2 0.3 0.2 0.2 34 31 35 33
Oklahoma 12,132 17,362 18,062 22,782 43.1 4.0 26.1 1.1 1.2 1.2 1.1 19 20 20 19
Oregon 6,988 13,015 9,453 10,072 86.2 -27.4 6.6 0.7 0.9 0.6 0.5 24 23 24 26
Pennsylvania 60,658 144,871 84,336 105,360 138.8 -41.8 24.9 5.7 9.8 5.4 5.1 6 3 6 6
Rhode Island 4,448 6,954 8,869 11,712 56.3 27.5 32.1 0.4 0.5 0.6 0.6 26 26 25 25
South Carolina 2,784 2,482 3,378 3,778 -10.8 36.1 11.9 0.3 0.2 0.2 0.2 32 35 36 36
South Dakota 1,982 5,868 4,563 6,045 196.0 -22.2 32.5 0.2 0.4 0.3 0.3 35 28 33 32
Tennessee 12,607 31,491 27,254 26,979 149.8 -13.5 -1.0 1.2 2.1 1.7 1.3 17 13 12 16
Texas 111,514 106,406 117,255 270,748 -4.6 10.2 130.9 10.4 7.2 7.5 13.2 3 5 4 2
USAF 240,573 260,243 320,333 479,799 8.2 23.1 49.8 22.4 17.6 20.5 23.3 1 1 1 1
Utah 6,936 9,695 8,295 8,507 39.8 -14.4 2.6 0.6 0.7 0.5 0.4 25 25 26 29
Vermont 1,117 1,866 5,432 3,779 67.1 191.1 -30.4 0.1 0.1 0.3 0.2 36 36 31 35
Washington 13,858 27,022 14,358 18,267 95.0 -46.9 27.2 1.3 1.8 0.9 0.9 14 15 21 20
Wisconsin 67,135 59,331 76,345 75,975 -11.6 28.7 -0.5 6.3 4.0 4.9 3.7 5 8 8 8
Total 1,073,148 1,479,200 1,562,817 2,057,255 37.8 5.7 31.6 100.0 100.0 100.0 100.0
NOTES: These numbers do not include IRS offsets or mandatory assignments. Details may not add to totals due to rounding. Calculations are based on numbers before rounding.1 As a result of the Higher Education Amendments of 1998, effective October 7, 1998, the definition of default changed from 180 days of delinquency to 270 days of delinquency.
SOURCE: U.S. Department of Education, Office of Postsecondary Education, ED Form 1130.

Federal Student Loan Programs D
ata Book �
FY 1997-FY 2000217
Defaults and Collections
Table 60. Federal Family Education Loan (FFEL) program collections on defaulted loans for Stafford Unsubsidized loans, by guaranty agency: FY 1997-FY 2000
Default dollars paid to lenders (in 000’s) Percent change from: Percent share of total Rank
FY97- FY98- FY99-Guaranty agency FY97 FY98 FY991 FY001 FY98 FY99 FY00 FY97 FY98 FY991 FY001 FY97 FY98 FY991 FY001
Arkansas 50 109 476 1,078 117.7 337.0 126.6 0.2 0.2 0.3 0.5 29 31 29 26
California 2,575 11,033 22,674 28,464 328.4 105.5 25.5 12.2 17.0 16.1 12.0 2 2 2 2
Colorado 198 578 1,700 1,691 191.3 194.3 -0.5 0.9 0.9 1.2 0.7 17 19 17 21
Connecticut 95 136 203 1,583 43.1 49.4 678.9 0.4 0.2 0.1 0.7 23 28 31 23
ECMC 14 931 4,074 7,571 6,750.9 337.8 85.8 0.1 1.4 2.9 3.2 35 11 7 8
Florida 197 539 994 1,593 173.9 84.4 60.3 0.9 0.8 0.7 0.7 18 20 21 22
Georgia 317 1,783 2,301 2,768 462.4 29.0 20.3 1.5 2.7 1.6 1.2 12 7 11 16
Illinois 419 1,594 3,999 9,927 280.0 150.9 148.2 2.0 2.5 2.8 4.2 8 8 8 6
Iowa 388 813 1,630 2,174 109.5 100.5 33.4 1.8 1.3 1.2 0.9 10 13 18 19
Kentucky 301 664 1,958 5,107 120.8 194.9 160.8 1.4 1.0 1.4 2.2 13 18 14 10
Louisiana 106 334 973 1,289 214.2 191.3 32.4 0.5 0.5 0.7 0.5 21 24 23 24
Maine 82 224 538 1,243 175.1 139.6 131.1 0.4 0.3 0.4 0.5 25 26 26 25
Massachusetts 409 130 122 120 -68.1 -6.1 -2.1 1.9 0.2 0.1 0.1 9 29 35 36
Michigan 349 797 1,391 5,446 128.1 74.4 291.6 1.7 1.2 1.0 2.3 11 14 19 9
Missouri 198 708 2,271 3,628 256.9 220.8 59.7 0.9 1.1 1.6 1.5 16 17 12 12
Montana 81 450 994 1,701 454.1 120.8 71.2 0.4 0.7 0.7 0.7 26 22 22 20
Nebraska 476 1,226 3,046 4,980 157.4 148.5 63.5 2.3 1.9 2.2 2.1 7 10 9 11
New Hampshire 61 340 552 547 459.0 62.4 -0.9 0.3 0.5 0.4 0.2 27 23 25 30
New Jersey 232 725 1,740 2,631 211.9 140.1 51.2 1.1 1.1 1.2 1.1 14 16 15 18
New Mexico 20 37 158 312 79.1 331.2 97.1 0.1 0.1 0.1 0.1 34 35 33 35
New York 905 3,159 6,927 9,395 249.2 119.3 35.6 4.3 4.9 4.9 4.0 5 5 5 7
North Carolina 21 61 158 487 196.0 158.9 207.7 0.1 0.1 0.1 0.2 33 34 32 31
North Dakota 8 33 115 328 323.3 252.6 185.9 0.0 0.1 0.1 0.1 36 36 36 34
Oklahoma 188 762 1,707 2,894 304.6 123.9 69.5 0.9 1.2 1.2 1.2 19 15 16 15
Oregon 83 328 555 829 292.7 69.3 49.4 0.4 0.5 0.4 0.4 24 25 24 28
Pennsylvania 579 2,537 5,434 11,642 337.7 114.2 114.2 2.7 3.9 3.9 4.9 6 6 6 5
Rhode Island 104 454 1,372 2,724 337.0 202.5 98.6 0.5 0.7 1.0 1.2 22 21 20 17
South Carolina 30 113 219 378 279.2 94.1 72.6 0.1 0.2 0.2 0.2 30 30 30 33
South Dakota 22 96 486 920 333.5 404.9 89.5 0.1 0.1 0.3 0.4 32 33 27 27
Tennessee 219 871 2,149 3,160 298.7 146.6 47.0 1.0 1.3 1.5 1.3 15 12 13 13
Texas 1,359 4,634 10,855 15,859 241.1 134.2 46.1 6.4 7.1 7.7 6.7 4 3 3 3
USAF 9,237 22,929 45,650 86,458 148.2 99.1 89.4 43.6 35.3 32.5 36.6 1 1 1 1
Utah 54 191 476 664 250.4 149.5 39.5 0.3 0.3 0.3 0.3 28 27 28 29
Vermont 25 97 144 419 282.7 48.9 191.4 0.1 0.1 0.1 0.2 31 32 34 32
Washington 186 1,521 2,420 3,114 716.1 59.1 28.7 0.9 2.3 1.7 1.3 20 9 10 14
Wisconsin 1,572 3,974 10,118 13,347 152.8 154.6 31.9 7.4 6.1 7.2 5.6 3 4 4 4
Total 21,162 64,908 140,578 236,471 206.7 116.6 68.2 100.0 100.0 100.0 100.0
NOTES: The Stafford Unsubsidized program began in FY93. These numbers do not include IRS offsets or mandatory assignments. Details may not add to totals due to rounding. Calculations are based on numbers before rounding.1 As a result of the Higher Education Amendments of 1998, effective October 7, 1998, the definition of default changed from 180 days of delinquency to 270 days of delinquency.
SOURCE: U.S. Department of Education, Office of Postsecondary Education, ED Form 1130.
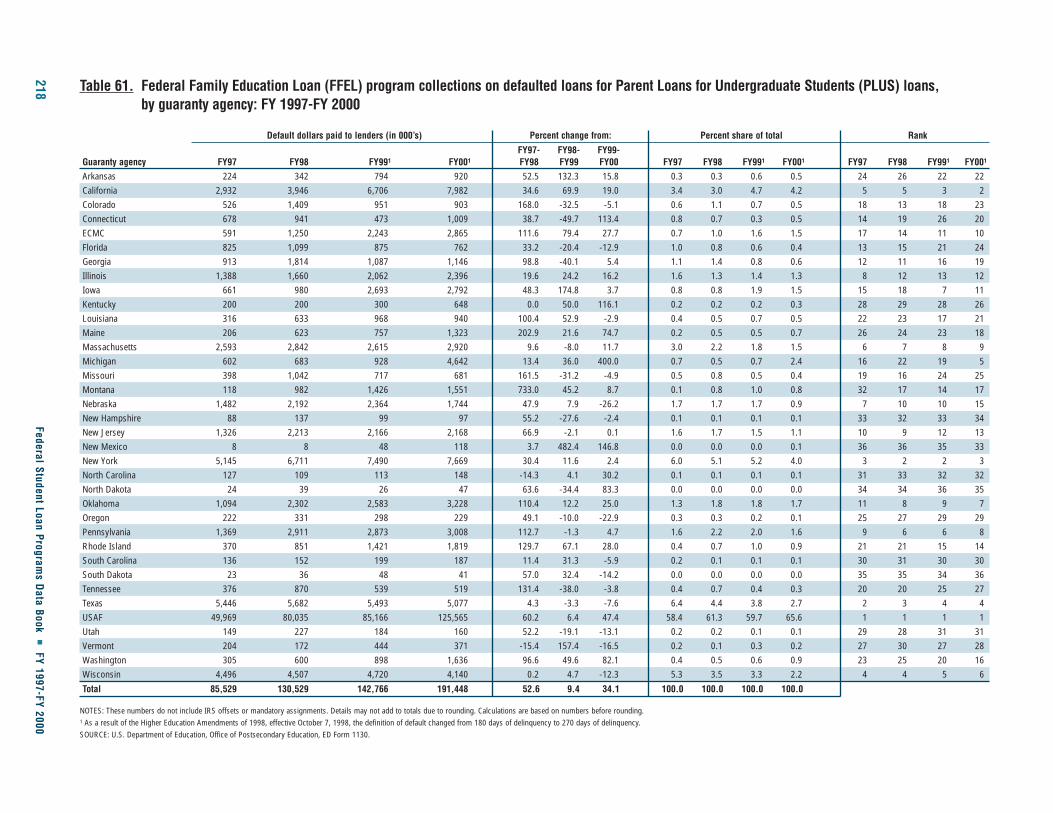
218Federal Student Loan Program
s Data Book
�FY 1997-FY 2000
Table 61. Federal Family Education Loan (FFEL) program collections on defaulted loans for Parent Loans for Undergraduate Students (PLUS) loans, by guaranty agency: FY 1997-FY 2000
Default dollars paid to lenders (in 000’s) Percent change from: Percent share of total Rank
FY97- FY98- FY99-Guaranty agency FY97 FY98 FY991 FY001 FY98 FY99 FY00 FY97 FY98 FY991 FY001 FY97 FY98 FY991 FY001
Arkansas 224 342 794 920 52.5 132.3 15.8 0.3 0.3 0.6 0.5 24 26 22 22 California 2,932 3,946 6,706 7,982 34.6 69.9 19.0 3.4 3.0 4.7 4.2 5 5 3 2 Colorado 526 1,409 951 903 168.0 -32.5 -5.1 0.6 1.1 0.7 0.5 18 13 18 23 Connecticut 678 941 473 1,009 38.7 -49.7 113.4 0.8 0.7 0.3 0.5 14 19 26 20 ECMC 591 1,250 2,243 2,865 111.6 79.4 27.7 0.7 1.0 1.6 1.5 17 14 11 10 Florida 825 1,099 875 762 33.2 -20.4 -12.9 1.0 0.8 0.6 0.4 13 15 21 24 Georgia 913 1,814 1,087 1,146 98.8 -40.1 5.4 1.1 1.4 0.8 0.6 12 11 16 19 Illinois 1,388 1,660 2,062 2,396 19.6 24.2 16.2 1.6 1.3 1.4 1.3 8 12 13 12 Iowa 661 980 2,693 2,792 48.3 174.8 3.7 0.8 0.8 1.9 1.5 15 18 7 11 Kentucky 200 200 300 648 0.0 50.0 116.1 0.2 0.2 0.2 0.3 28 29 28 26 Louisiana 316 633 968 940 100.4 52.9 -2.9 0.4 0.5 0.7 0.5 22 23 17 21 Maine 206 623 757 1,323 202.9 21.6 74.7 0.2 0.5 0.5 0.7 26 24 23 18 Massachusetts 2,593 2,842 2,615 2,920 9.6 -8.0 11.7 3.0 2.2 1.8 1.5 6 7 8 9 Michigan 602 683 928 4,642 13.4 36.0 400.0 0.7 0.5 0.7 2.4 16 22 19 5 Missouri 398 1,042 717 681 161.5 -31.2 -4.9 0.5 0.8 0.5 0.4 19 16 24 25 Montana 118 982 1,426 1,551 733.0 45.2 8.7 0.1 0.8 1.0 0.8 32 17 14 17 Nebraska 1,482 2,192 2,364 1,744 47.9 7.9 -26.2 1.7 1.7 1.7 0.9 7 10 10 15 New Hampshire 88 137 99 97 55.2 -27.6 -2.4 0.1 0.1 0.1 0.1 33 32 33 34 New Jersey 1,326 2,213 2,166 2,168 66.9 -2.1 0.1 1.6 1.7 1.5 1.1 10 9 12 13 New Mexico 8 8 48 118 3.7 482.4 146.8 0.0 0.0 0.0 0.1 36 36 35 33 New York 5,145 6,711 7,490 7,669 30.4 11.6 2.4 6.0 5.1 5.2 4.0 3 2 2 3 North Carolina 127 109 113 148 -14.3 4.1 30.2 0.1 0.1 0.1 0.1 31 33 32 32 North Dakota 24 39 26 47 63.6 -34.4 83.3 0.0 0.0 0.0 0.0 34 34 36 35 Oklahoma 1,094 2,302 2,583 3,228 110.4 12.2 25.0 1.3 1.8 1.8 1.7 11 8 9 7 Oregon 222 331 298 229 49.1 -10.0 -22.9 0.3 0.3 0.2 0.1 25 27 29 29 Pennsylvania 1,369 2,911 2,873 3,008 112.7 -1.3 4.7 1.6 2.2 2.0 1.6 9 6 6 8 Rhode Island 370 851 1,421 1,819 129.7 67.1 28.0 0.4 0.7 1.0 0.9 21 21 15 14 South Carolina 136 152 199 187 11.4 31.3 -5.9 0.2 0.1 0.1 0.1 30 31 30 30 South Dakota 23 36 48 41 57.0 32.4 -14.2 0.0 0.0 0.0 0.0 35 35 34 36 Tennessee 376 870 539 519 131.4 -38.0 -3.8 0.4 0.7 0.4 0.3 20 20 25 27 Texas 5,446 5,682 5,493 5,077 4.3 -3.3 -7.6 6.4 4.4 3.8 2.7 2 3 4 4 USAF 49,969 80,035 85,166 125,565 60.2 6.4 47.4 58.4 61.3 59.7 65.6 1 1 1 1 Utah 149 227 184 160 52.2 -19.1 -13.1 0.2 0.2 0.1 0.1 29 28 31 31 Vermont 204 172 444 371 -15.4 157.4 -16.5 0.2 0.1 0.3 0.2 27 30 27 28 Washington 305 600 898 1,636 96.6 49.6 82.1 0.4 0.5 0.6 0.9 23 25 20 16 Wisconsin 4,496 4,507 4,720 4,140 0.2 4.7 -12.3 5.3 3.5 3.3 2.2 4 4 5 6
Total 85,529 130,529 142,766 191,448 52.6 9.4 34.1 100.0 100.0 100.0 100.0
NOTES: These numbers do not include IRS offsets or mandatory assignments. Details may not add to totals due to rounding. Calculations are based on numbers before rounding.1 As a result of the Higher Education Amendments of 1998, effective October 7, 1998, the definition of default changed from 180 days of delinquency to 270 days of delinquency.SOURCE: U.S. Department of Education, Office of Postsecondary Education, ED Form 1130.

Federal Student Loan Programs D
ata Book �
FY 1997-FY 2000219
Defaults and Collections
Table 62. Federal Family Education Loan (FFEL) program collections on defaulted loans for Supplemental Loan for Students (SLS) loans, by guaranty agency: FY 1997-FY 2000
Default dollars paid to lenders (in 000’s) Percent change from: Percent share of total Rank
FY97- FY98- FY99-Guaranty agency FY97 FY98 FY991 FY001 FY98 FY99 FY00 FY97 FY98 FY991 FY001 FY97 FY98 FY991 FY001
Arkansas 341 278 241 196 -18.6 -13.1 -18.7 0.2 0.2 0.1 0.1 29 30 33 33 California 27,736 28,466 43,246 49,207 2.6 51.9 13.8 16.1 15.8 21.8 23.2 2 1 1 1 Colorado 2,789 7,675 5,043 3,422 175.1 -34.3 -32.2 1.6 4.3 2.5 1.6 10 8 11 13 Connecticut 1,395 1,804 962 3,215 29.3 -46.7 234.2 0.8 1.0 0.5 1.5 18 19 21 14 ECMC 2,338 6,667 9,242 13,422 185.2 38.6 45.2 1.4 3.7 4.7 6.3 11 10 8 5 Florida 1,342 2,037 1,577 1,416 51.7 -22.6 -10.2 0.8 1.1 0.8 0.7 19 18 17 20 Georgia 1,020 2,641 2,056 1,839 158.8 -22.2 -10.5 0.6 1.5 1.0 0.9 21 16 15 18 Illinois 3,352 6,032 9,584 11,990 80.0 58.9 25.1 1.9 3.3 4.8 5.6 8 11 7 6 Iowa 1,680 1,564 797 944 -6.9 -49.1 18.4 1.0 0.9 0.4 0.4 14 20 22 22 Kentucky 400 400 400 2,023 0.0 0.0 405.7 0.2 0.2 0.2 1.0 27 28 27 16 Louisiana 614 521 626 544 -15.2 20.3 -13.1 0.4 0.3 0.3 0.3 22 25 25 27 Maine 319 300 342 211 -6.1 13.8 -38.3 0.2 0.2 0.2 0.1 30 29 29 32 Massachusetts 5,971 7,572 6,612 7,460 26.8 -12.7 12.8 3.5 4.2 3.3 3.5 7 9 9 10 Michigan 1,115 1,414 1,311 1,478 26.7 -7.2 12.7 0.6 0.8 0.7 0.7 20 21 19 19 Missouri 1,424 4,600 3,822 4,159 223.1 -16.9 8.8 0.8 2.5 1.9 2.0 17 12 13 11 Montana 410 414 317 280 1.0 -23.5 -11.4 0.2 0.2 0.2 0.1 26 27 30 31 Nebraska 7,517 11,071 9,972 10,233 47.3 -9.9 2.6 4.4 6.1 5.0 4.8 6 6 6 9 New Hampshire 598 469 355 308 -21.6 -24.2 -13.2 0.3 0.3 0.2 0.1 23 26 28 30 New Jersey 1,874 3,450 4,012 3,958 84.1 16.3 -1.4 1.1 1.9 2.0 1.9 13 14 12 12 New Mexico 33 42 47 57 27.2 11.8 20.9 0.0 0.0 0.0 0.0 36 36 36 36 New York 12,427 17,860 18,499 16,550 43.7 3.6 -10.5 7.2 9.9 9.3 7.8 4 4 3 3 North Carolina 176 217 278 414 23.3 27.9 49.1 0.1 0.1 0.1 0.2 31 31 31 28 North Dakota 47 79 108 190 67.5 35.7 76.4 0.0 0.0 0.1 0.1 35 34 35 34 Oklahoma 2,149 2,115 1,952 1,975 -1.6 -7.7 1.2 1.2 1.2 1.0 0.9 12 17 16 17 Oregon 572 1,270 1,061 1,327 122.2 -16.5 25.1 0.3 0.7 0.5 0.6 24 22 20 21 Pennsylvania 3,171 8,538 6,184 11,165 169.3 -27.6 80.6 1.8 4.7 3.1 5.3 9 7 10 7 Rhode Island 358 614 725 637 71.6 18.1 -12.1 0.2 0.3 0.4 0.3 28 24 23 26 South Carolina 73 71 114 148 -2.9 60.3 30.1 0.0 0.0 0.1 0.1 33 35 34 35 South Dakota 66 185 259 314 179.7 40.1 21.0 0.0 0.1 0.1 0.1 34 32 32 29 Tennessee 1,615 3,688 3,201 3,014 128.3 -13.2 -5.8 0.9 2.0 1.6 1.4 15 13 14 15 Texas 19,539 17,943 17,610 15,078 -8.2 -1.9 -14.4 11.3 9.9 8.9 7.1 3 3 4 4 USAF 58,106 24,179 31,346 31,961 -58.4 29.6 2.0 33.7 13.4 15.8 15.0 1 2 2 2 Utah 430 1,069 675 669 148.8 -36.8 -1.0 0.2 0.6 0.3 0.3 25 23 24 24 Vermont 118 125 410 640 6.3 227.3 56.2 0.1 0.1 0.2 0.3 32 33 26 25 Washington 1,514 3,288 1,536 868 117.2 -53.3 -43.4 0.9 1.8 0.8 0.4 16 15 18 23 Wisconsin 9,958 11,876 13,523 11,158 19.3 13.9 -17.5 5.8 6.6 6.8 5.3 5 5 5 8
Total 172,589 180,534 198,045 212,473 4.6 9.7 7.3 100.0 100.0 100.0 100.0
NOTES: The SLS program disbursed its last loans in FY94. These numbers do not include IRS offsets or mandatory assignments. Details may not add to totals due to rounding. Calculations are based on numbers before rounding.1 As a result of the Higher Education Amendments of 1998, effective October 7, 1998, the definition of default changed from 180 days of delinquency to 270 days of delinquency.SOURCE: U.S. Department of Education, Office of Postsecondary Education, ED Form 1130.

220Federal Student Loan Program
s Data Book
�FY 1997-FY 2000
Table 63. Federal Family Education Loan (FFEL) program collections on defaulted loans for Consolidation loans, by guaranty agency: FY 1997-FY 2000
Default dollars paid to lenders (in 000’s) Percent change from: Percent share of total Rank
FY97- FY98- FY99-Guaranty agency FY97 FY98 FY991 FY001 FY98 FY99 FY00 FY97 FY98 FY991 FY001 FY97 FY98 FY991 FY001
Arkansas 245 387 844 1,537 57.7 118.2 82.1 0.3 0.3 0.3 0.3 19 23 22 23
California 4,383 7,697 12,431 17,703 75.6 61.5 42.4 4.8 5.0 4.0 3.7 4 7 6 6
Colorado 693 6,527 3,932 1,606 842.2 -39.8 -59.2 0.8 4.3 1.3 0.3 12 8 12 21
Connecticut 38 155 268 2,118 306.8 72.9 690.8 0.0 0.1 0.1 0.4 31 27 29 17
ECMC 762 1,824 6,180 9,897 139.6 238.7 60.2 0.8 1.2 2.0 2.0 11 15 8 8
Florida 38 123 140 245 221.2 13.4 75.0 0.0 0.1 0.0 0.1 29 29 30 30
Georgia 18 18 18 18 - - 2.4 0.0 0.0 0.0 0.0 32 33 34 35
Illinois 3,533 9,347 22,770 35,244 164.6 143.6 54.8 3.9 6.1 7.3 7.3 6 5 2 2
Iowa 350 777 2,731 3,929 122.0 251.5 43.9 0.4 0.5 0.9 0.8 18 19 15 13
Kentucky 185 456 593 1,933 145.9 30.0 226.0 0.2 0.3 0.2 0.4 22 21 26 20
Louisiana 171 213 952 702 24.6 347.9 -26.3 0.2 0.1 0.3 0.1 23 26 20 28
Maine 38 71 389 737 85.9 446.6 89.4 0.0 0.0 0.1 0.2 30 31 28 27
Massachusetts 2,279 1,917 1,799 2,005 -15.9 -6.2 11.5 2.5 1.2 0.6 0.4 9 14 17 19
Michigan 222 380 644 2,057 70.9 69.5 219.4 0.2 0.2 0.2 0.4 20 24 25 18
Missouri 510 2,761 6,034 7,270 441.8 118.5 20.5 0.6 1.8 1.9 1.5 16 11 9 9
Montana 360 1,757 3,745 3,243 387.7 113.2 -13.4 0.4 1.1 1.2 0.7 17 16 13 14
Nebraska 2,332 14,826 19,038 23,379 535.8 28.4 22.8 2.5 9.7 6.1 4.8 8 2 3 4
New Hampshire 109 996 1,277 454 815.9 28.3 -64.5 0.1 0.6 0.4 0.1 25 18 19 29
New Jersey 679 1,999 3,048 4,551 194.4 52.5 49.3 0.7 1.3 1.0 0.9 13 12 14 12
New Mexico 52 111 89 195 113.4 -20.0 118.9 0.1 0.1 0.0 0.0 28 30 31 31
New York 2,611 3,750 4,447 6,182 43.6 18.6 39.0 2.9 2.4 1.4 1.3 7 10 11 10
North Carolina — — — 1 — — — — — — 0.0 — — — 36
North Dakota — 0 6 134 — 6,447.8 2,174.4 — 0.0 0.0 0.0 — 35 35 32
Oklahoma 510 1,033 1,587 3,064 102.7 53.6 93.1 0.6 0.7 0.5 0.6 15 17 18 15
Oregon — 10 47 111 — 358.6 138.9 — 0.0 0.0 0.0 — 34 33 33
Pennsylvania 3,588 13,501 13,896 23,664 276.3 2.9 70.3 3.9 8.8 4.5 4.9 5 3 5 3
Rhode Island 67 141 560 941 109.3 296.7 68.0 0.1 0.1 0.2 0.2 27 28 27 24
South Carolina 1 31 48 90 5,356.9 55.7 86.9 0.0 0.0 0.0 0.0 33 32 32 34
South Dakota 85 435 946 1,587 414.3 117.3 67.7 0.1 0.3 0.3 0.3 26 22 21 22
Tennessee 205 1,957 2,094 2,246 853.6 7.0 7.3 0.2 1.3 0.7 0.5 21 13 16 16
Texas 4,609 8,238 11,873 18,918 78.7 44.1 59.3 5.0 5.4 3.8 3.9 3 6 7 5
USAF 19,086 52,579 164,125 286,455 175.5 212.2 74.5 20.8 34.3 52.8 59.1 2 1 1 1
Utah 510 718 711 868 40.7 -1.0 22.0 0.6 0.5 0.2 0.2 14 20 24 25
Vermont 152 215 820 747 42.1 280.5 -9.0 0.2 0.1 0.3 0.2 24 25 23 26
Washington 939 5,169 5,137 5,396 450.5 -0.6 5.1 1.0 3.4 1.7 1.1 10 9 10 11
Wisconsin 42,235 13,276 17,729 15,314 -68.6 33.5 -13.6 46.1 8.7 5.7 3.2 1 4 4 7
Total 91,595 153,397 310,948 484,542 67.5 102.7 55.8 100.0 100.0 100.0 100.0
NOTES: These numbers do not include IRS offsets or mandatory assignments. Details may not add to totals due to rounding. Calculations are based on numbers before rounding.1 As a result of the Higher Education Amendments of 1998, effective October 7, 1998, the definition of default changed from 180 days of delinquency to 270 days of delinquency.
SOURCE: U.S. Department of Education, Office of Postsecondary Education, ED Form 1130.
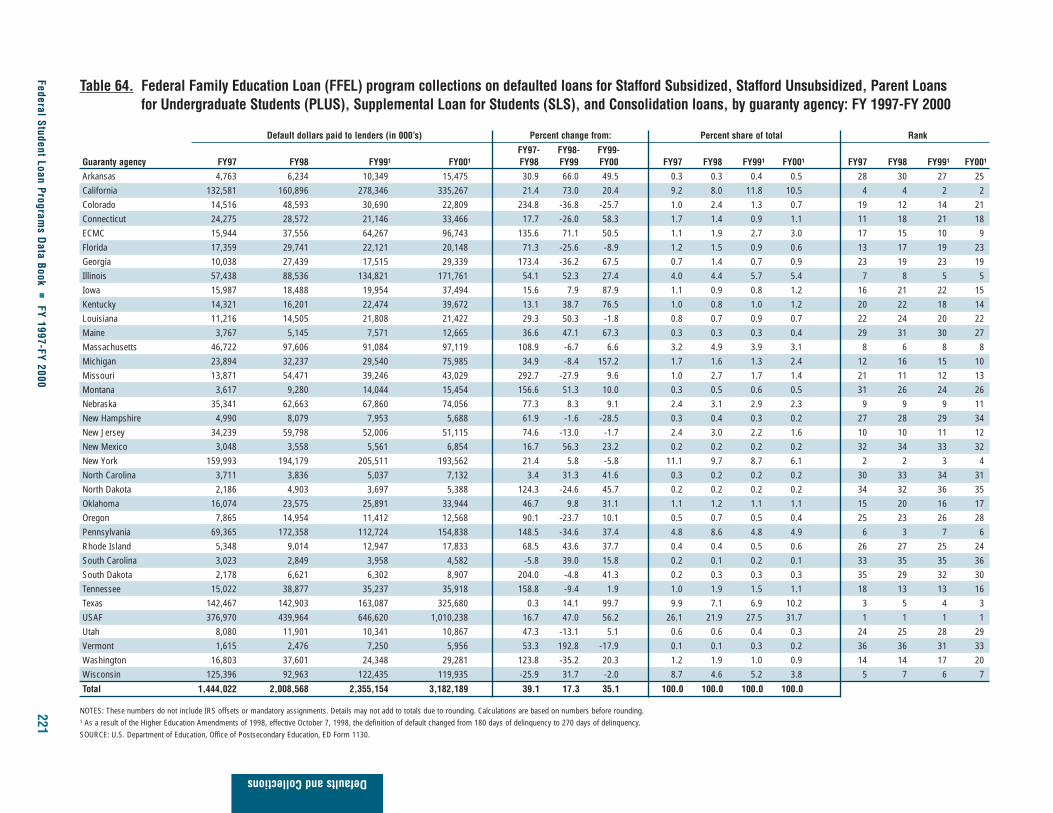
Federal Student Loan Programs D
ata Book �
FY 1997-FY 2000221
Defaults and Collections
Table 64. Federal Family Education Loan (FFEL) program collections on defaulted loans for Stafford Subsidized, Stafford Unsubsidized, Parent Loans for Undergraduate Students (PLUS), Supplemental Loan for Students (SLS), and Consolidation loans, by guaranty agency: FY 1997-FY 2000
Default dollars paid to lenders (in 000’s) Percent change from: Percent share of total Rank
FY97- FY98- FY99-Guaranty agency FY97 FY98 FY991 FY001 FY98 FY99 FY00 FY97 FY98 FY991 FY001 FY97 FY98 FY991 FY001
Arkansas 4,763 6,234 10,349 15,475 30.9 66.0 49.5 0.3 0.3 0.4 0.5 28 30 27 25 California 132,581 160,896 278,346 335,267 21.4 73.0 20.4 9.2 8.0 11.8 10.5 4 4 2 2 Colorado 14,516 48,593 30,690 22,809 234.8 -36.8 -25.7 1.0 2.4 1.3 0.7 19 12 14 21 Connecticut 24,275 28,572 21,146 33,466 17.7 -26.0 58.3 1.7 1.4 0.9 1.1 11 18 21 18 ECMC 15,944 37,556 64,267 96,743 135.6 71.1 50.5 1.1 1.9 2.7 3.0 17 15 10 9 Florida 17,359 29,741 22,121 20,148 71.3 -25.6 -8.9 1.2 1.5 0.9 0.6 13 17 19 23 Georgia 10,038 27,439 17,515 29,339 173.4 -36.2 67.5 0.7 1.4 0.7 0.9 23 19 23 19 Illinois 57,438 88,536 134,821 171,761 54.1 52.3 27.4 4.0 4.4 5.7 5.4 7 8 5 5 Iowa 15,987 18,488 19,954 37,494 15.6 7.9 87.9 1.1 0.9 0.8 1.2 16 21 22 15 Kentucky 14,321 16,201 22,474 39,672 13.1 38.7 76.5 1.0 0.8 1.0 1.2 20 22 18 14 Louisiana 11,216 14,505 21,808 21,422 29.3 50.3 -1.8 0.8 0.7 0.9 0.7 22 24 20 22 Maine 3,767 5,145 7,571 12,665 36.6 47.1 67.3 0.3 0.3 0.3 0.4 29 31 30 27 Massachusetts 46,722 97,606 91,084 97,119 108.9 -6.7 6.6 3.2 4.9 3.9 3.1 8 6 8 8 Michigan 23,894 32,237 29,540 75,985 34.9 -8.4 157.2 1.7 1.6 1.3 2.4 12 16 15 10 Missouri 13,871 54,471 39,246 43,029 292.7 -27.9 9.6 1.0 2.7 1.7 1.4 21 11 12 13 Montana 3,617 9,280 14,044 15,454 156.6 51.3 10.0 0.3 0.5 0.6 0.5 31 26 24 26 Nebraska 35,341 62,663 67,860 74,056 77.3 8.3 9.1 2.4 3.1 2.9 2.3 9 9 9 11 New Hampshire 4,990 8,079 7,953 5,688 61.9 -1.6 -28.5 0.3 0.4 0.3 0.2 27 28 29 34 New Jersey 34,239 59,798 52,006 51,115 74.6 -13.0 -1.7 2.4 3.0 2.2 1.6 10 10 11 12 New Mexico 3,048 3,558 5,561 6,854 16.7 56.3 23.2 0.2 0.2 0.2 0.2 32 34 33 32 New York 159,993 194,179 205,511 193,562 21.4 5.8 -5.8 11.1 9.7 8.7 6.1 2 2 3 4 North Carolina 3,711 3,836 5,037 7,132 3.4 31.3 41.6 0.3 0.2 0.2 0.2 30 33 34 31 North Dakota 2,186 4,903 3,697 5,388 124.3 -24.6 45.7 0.2 0.2 0.2 0.2 34 32 36 35 Oklahoma 16,074 23,575 25,891 33,944 46.7 9.8 31.1 1.1 1.2 1.1 1.1 15 20 16 17 Oregon 7,865 14,954 11,412 12,568 90.1 -23.7 10.1 0.5 0.7 0.5 0.4 25 23 26 28 Pennsylvania 69,365 172,358 112,724 154,838 148.5 -34.6 37.4 4.8 8.6 4.8 4.9 6 3 7 6 Rhode Island 5,348 9,014 12,947 17,833 68.5 43.6 37.7 0.4 0.4 0.5 0.6 26 27 25 24 South Carolina 3,023 2,849 3,958 4,582 -5.8 39.0 15.8 0.2 0.1 0.2 0.1 33 35 35 36 South Dakota 2,178 6,621 6,302 8,907 204.0 -4.8 41.3 0.2 0.3 0.3 0.3 35 29 32 30 Tennessee 15,022 38,877 35,237 35,918 158.8 -9.4 1.9 1.0 1.9 1.5 1.1 18 13 13 16 Texas 142,467 142,903 163,087 325,680 0.3 14.1 99.7 9.9 7.1 6.9 10.2 3 5 4 3 USAF 376,970 439,964 646,620 1,010,238 16.7 47.0 56.2 26.1 21.9 27.5 31.7 1 1 1 1 Utah 8,080 11,901 10,341 10,867 47.3 -13.1 5.1 0.6 0.6 0.4 0.3 24 25 28 29 Vermont 1,615 2,476 7,250 5,956 53.3 192.8 -17.9 0.1 0.1 0.3 0.2 36 36 31 33 Washington 16,803 37,601 24,348 29,281 123.8 -35.2 20.3 1.2 1.9 1.0 0.9 14 14 17 20 Wisconsin 125,396 92,963 122,435 119,935 -25.9 31.7 -2.0 8.7 4.6 5.2 3.8 5 7 6 7
Total 1,444,022 2,008,568 2,355,154 3,182,189 39.1 17.3 35.1 100.0 100.0 100.0 100.0
NOTES: These numbers do not include IRS offsets or mandatory assignments. Details may not add to totals due to rounding. Calculations are based on numbers before rounding.1 As a result of the Higher Education Amendments of 1998, effective October 7, 1998, the definition of default changed from 180 days of delinquency to 270 days of delinquency.SOURCE: U.S. Department of Education, Office of Postsecondary Education, ED Form 1130.
Appendices
Federal Student Loan Programs Data Book � FY 1997-FY 2000
Part VAppendices

Appendices
Federal Student Loan Programs Data Book � FY 1997-FY 2000 I-1
Appendix ITables
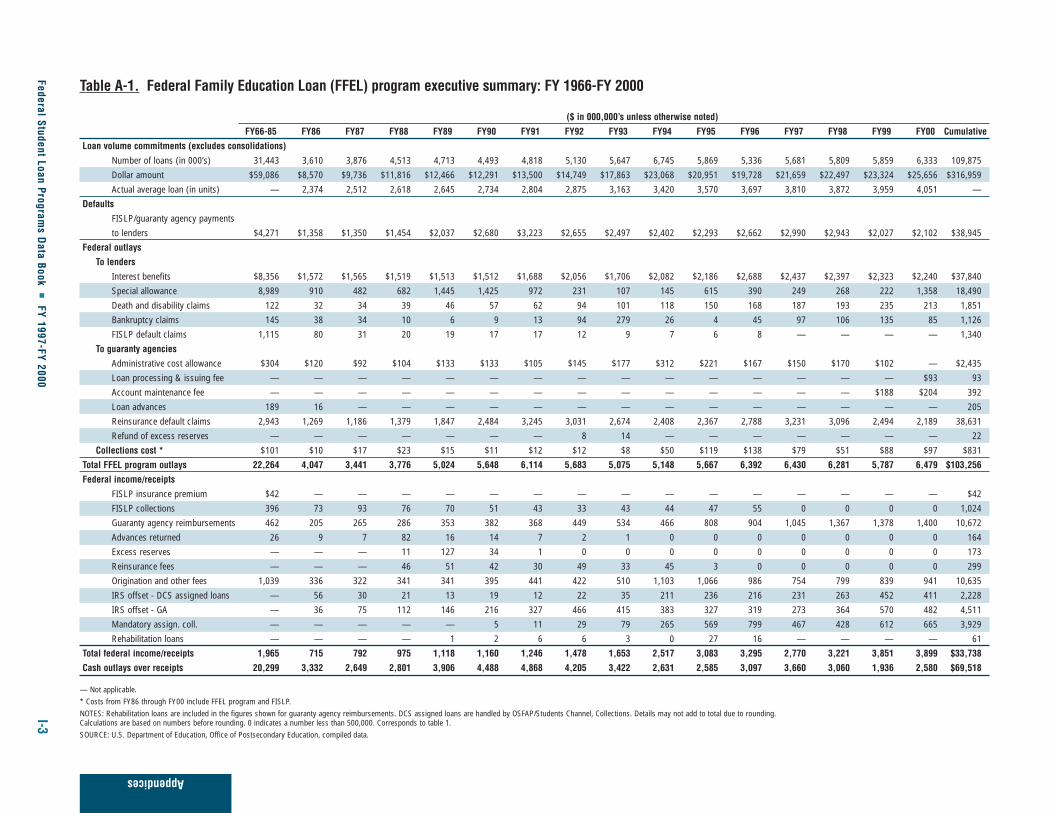
Federal Student Loan Programs D
ata Book �
FY 1997-FY 2000I-3
Appendices
Table A-1. Federal Family Education Loan (FFEL) program executive summary: FY 1966-FY 2000
($ in 000,000’s unless otherwise noted)
FY66-85 FY86 FY87 FY88 FY89 FY90 FY91 FY92 FY93 FY94 FY95 FY96 FY97 FY98 FY99 FY00 Cumulative
Loan volume commitments (excludes consolidations)
Number of loans (in 000’s) 31,443 3,610 3,876 4,513 4,713 4,493 4,818 5,130 5,647 6,745 5,869 5,336 5,681 5,809 5,859 6,333 109,875
Dollar amount $59,086 $8,570 $9,736 $11,816 $12,466 $12,291 $13,500 $14,749 $17,863 $23,068 $20,951 $19,728 $21,659 $22,497 $23,324 $25,656 $316,959
Actual average loan (in units) — 2,374 2,512 2,618 2,645 2,734 2,804 2,875 3,163 3,420 3,570 3,697 3,810 3,872 3,959 4,051 —
Defaults
FISLP/guaranty agency payments
to lenders $4,271 $1,358 $1,350 $1,454 $2,037 $2,680 $3,223 $2,655 $2,497 $2,402 $2,293 $2,662 $2,990 $2,943 $2,027 $2,102 $38,945
Federal outlays
To lenders
Interest benefits $8,356 $1,572 $1,565 $1,519 $1,513 $1,512 $1,688 $2,056 $1,706 $2,082 $2,186 $2,688 $2,437 $2,397 $2,323 $2,240 $37,840
Special allowance 8,989 910 482 682 1,445 1,425 972 231 107 145 615 390 249 268 222 1,358 18,490
Death and disability claims 122 32 34 39 46 57 62 94 101 118 150 168 187 193 235 213 1,851
Bankruptcy claims 145 38 34 10 6 9 13 94 279 26 4 45 97 106 135 85 1,126
FISLP default claims 1,115 80 31 20 19 17 17 12 9 7 6 8 — — — — 1,340
To guaranty agencies
Administrative cost allowance $304 $120 $92 $104 $133 $133 $105 $145 $177 $312 $221 $167 $150 $170 $102 — $2,435
Loan processing & issuing fee — — — — — — — — — — — — — — — $93 93
Account maintenance fee — — — — — — — — — — — — — — $188 $204 392
Loan advances 189 16 — — — — — — — — — — — — — — 205
Reinsurance default claims 2,943 1,269 1,186 1,379 1,847 2,484 3,245 3,031 2,674 2,408 2,367 2,788 3,231 3,096 2,494 2,189 38,631
Refund of excess reserves — — — — — — — 8 14 — — — — — — — 22
Collections cost * $101 $10 $17 $23 $15 $11 $12 $12 $8 $50 $119 $138 $79 $51 $88 $97 $831
Total FFEL program outlays 22,264 4,047 3,441 3,776 5,024 5,648 6,114 5,683 5,075 5,148 5,667 6,392 6,430 6,281 5,787 6,479 $103,256
Federal income/receipts
FISLP insurance premium $42 — — — — — — — — — — — — — — — $42
FISLP collections 396 73 93 76 70 51 43 33 43 44 47 55 0 0 0 0 1,024
Guaranty agency reimbursements 462 205 265 286 353 382 368 449 534 466 808 904 1,045 1,367 1,378 1,400 10,672
Advances returned 26 9 7 82 16 14 7 2 1 0 0 0 0 0 0 0 164
Excess reserves — — — 11 127 34 1 0 0 0 0 0 0 0 0 0 173
Reinsurance fees — — — 46 51 42 30 49 33 45 3 0 0 0 0 0 299
Origination and other fees 1,039 336 322 341 341 395 441 422 510 1,103 1,066 986 754 799 839 941 10,635
IRS offset - DCS assigned loans — 56 30 21 13 19 12 22 35 211 236 216 231 263 452 411 2,228
IRS offset - GA — 36 75 112 146 216 327 466 415 383 327 319 273 364 570 482 4,511
Mandatory assign. coll. — — — — — 5 11 29 79 265 569 799 467 428 612 665 3,929
Rehabilitation loans — — — — 1 2 6 6 3 0 27 16 — — — — 61
Total federal income/receipts 1,965 715 792 975 1,118 1,160 1,246 1,478 1,653 2,517 3,083 3,295 2,770 3,221 3,851 3,899 $33,738
Cash outlays over receipts 20,299 3,332 2,649 2,801 3,906 4,488 4,868 4,205 3,422 2,631 2,585 3,097 3,660 3,060 1,936 2,580 $69,518
— Not applicable.* Costs from FY86 through FY00 include FFEL program and FISLP. NOTES: Rehabilitation loans are included in the figures shown for guaranty agency reimbursements. DCS assigned loans are handled by OSFAP/Students Channel, Collections. Details may not add to total due to rounding. Calculations are based on numbers before rounding. 0 indicates a number less than 500,000. Corresponds to table 1.SOURCE: U.S. Department of Education, Office of Postsecondary Education, compiled data.

I-4 Federal Student Loan Programs Data Book � FY 1997-FY 2000
Table A-5. Federal Family Education Loan (FFEL) program annual and cumulative commitments, by loanprogram type: FY 1966-FY 2000
Annual Percent change Percent share Average Cumulativeloan volume from prior year of FFEL program loan loan volume
Loans Dollars Loans DollarsFiscal year1 (in 000’s) (in 000,000’s) Loans Dollars Loans Dollars Dollars (in 000’s) (in 000,000’s)
FISLP2
1966 0 $0 — — 0.0 0.0 $0 0 $0
1967 0 0 — — 0.0 0.0 0 0 0
1968 83 67 — — 16.9 15.7 806 83 67
1969 248 217 198.8 223.9 32.8 32.2 876 331 284
1970 365 354 47.2 63.1 42.3 43.6 968 696 638
1971 482 484 32.1 36.7 47.4 47.7 1,005 1,178 1,122
1972 692 708 43.6 46.3 57.6 55.6 1,024 1,870 1,830
1973 599 655 -13.4 -7.5 58.2 55.9 1,093 2,469 2,485
1974 507 612 -15.4 -6.6 54.1 53.7 1,207 2,976 3,097
1975 505 661 -0.4 8.0 51.0 50.9 1,310 3,481 3,758
1976 522 740 3.4 12.0 40.2 40.5 1,417 4,003 4,498
1977 322 500 -38.3 -32.4 33.1 32.5 1,556 4,325 4,998
1978 268 473 -16.8 -5.4 24.7 24.2 1,766 4,593 5,471
1979 277 541 3.4 14.4 18.3 18.1 1,954 4,870 6,012
1980 236 504 -14.8 -6.8 10.2 10.4 2,136 5,106 6,516
1981 189 427 -19.9 -15.3 5.3 5.5 2,260 5,295 6,943
1982 100 234 -47.1 -45.2 3.6 3.8 2,338 5,395 7,177
1983 54 134 -46.0 -42.7 1.8 1.9 2,471 5,449 7,311
1984 16 41 -70.4 -69.4 0.5 0.5 2,499 5,465 7,352
Stafford Subsidized
1966 89 $73 — — 100.0 100.0 $828 89 $73
1967 287 244 222.5 234.2 100.0 100.0 848 376 317
1968 407 361 41.8 48.0 83.1 84.3 888 783 678
1969 508 457 24.8 26.6 67.2 67.8 899 1,291 1,135
1970 498 457 -2.0 0.0 57.7 56.4 918 1,789 1,592
1971 535 531 7.4 16.2 52.6 52.3 992 2,324 2,123
1972 509 566 -4.9 6.6 42.4 44.4 1,113 2,833 2,689
1973 431 516 -15.3 -8.8 41.8 44.1 1,196 3,264 3,205
1974 431 528 0.0 2.3 45.9 46.3 1,225 3,695 3,733
1975 486 637 12.8 20.6 49.0 49.1 1,312 4,181 4,370
1976 776 1,088 59.7 70.8 59.8 59.5 1,401 4,957 5,458
1977 651 1,037 -16.1 -4.7 66.9 67.5 1,593 5,608 6,495
1978 817 1,485 25.5 43.2 75.3 75.8 1,819 6,425 7,980
1979 1,233 2,443 50.9 64.5 81.7 81.9 1,982 7,658 10,423
1980 2,078 4,335 68.5 77.4 89.8 89.6 2,086 9,736 14,758
1981 3,339 7,366 60.7 69.9 94.3 94.2 2,206 13,075 22,124
1982 2,646 5,901 -20.8 -19.9 95.0 94.7 2,230 15,721 28,025
1983 2,885 6,537 9.0 10.8 94.9 94.4 2,266 18,606 34,562
1984 3,246 7,506 12.5 14.8 95.4 94.8 2,312 21,852 42,068
1985 3,641 8,401 12.2 11.9 95.0 94.2 2,307 25,493 50,469
1986 3,413 8,050 -6.3 -4.2 94.5 93.9 2,359 28,906 58,519
1987 3,482 8,587 2.0 6.7 89.8 88.2 2,466 32,388 67,106
1988 3,619 9,257 3.9 7.8 80.2 78.3 2,558 36,007 76,363
1989 3,682 9,593 1.7 3.6 78.1 77.0 2,606 39,689 85,956
1990 3,605 9,708 -2.1 1.2 80.3 79.0 2,693 43,294 95,664
1991 3,842 10,551 6.5 8.7 79.7 78.2 2,747 47,136 106,215
1992 3,997 11,249 4.0 6.6 77.9 76.3 2,815 51,133 117,464
1993 4,072 12,471 1.9 10.9 72.1 69.8 3,062 55,205 129,935
1994 4,523 14,735 11.1 18.1 67.1 63.9 3,264 59,728 144,670
1995 3,716 12,444 -17.8 -15.5 63.3 59.4 3,352 63,444 157,114
1996 3,288 11,501 -11.5 -7.6 61.6 58.3 3,498 66,732 168,616
1997 3,401 11,985 3.5 4.2 59.9 55.3 3,523 70,133 180,600
1998 3,408 12,027 0.2 0.4 58.7 53.5 3,531 73,541 192,628
1999 3,339 11,862 -2.0 -1.4 57.0 50.9 3,546 76,880 204,490
2000 3,520 12,564 5.4 5.9 55.6 49.0 3,569 80,400 217,053
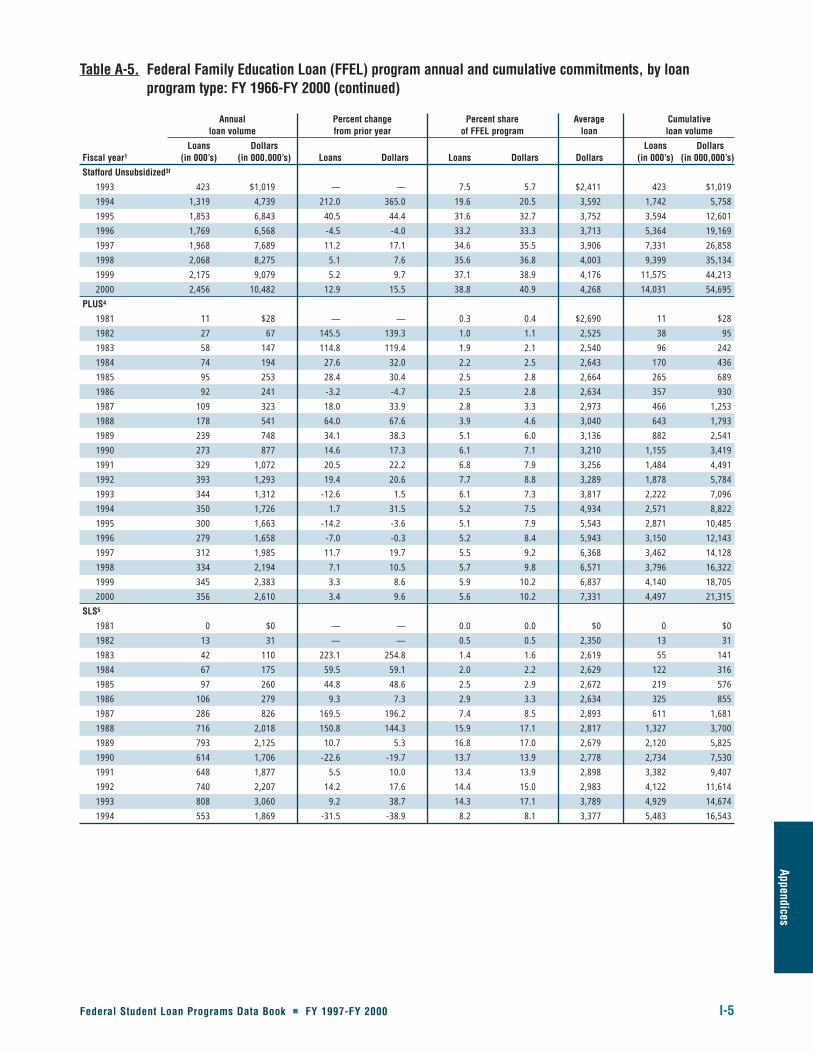
Federal Student Loan Programs Data Book � FY 1997-FY 2000 I-5
Appendices
Table A-5. Federal Family Education Loan (FFEL) program annual and cumulative commitments, by loanprogram type: FY 1966-FY 2000 (continued)
Annual Percent change Percent share Average Cumulativeloan volume from prior year of FFEL program loan loan volume
Loans Dollars Loans DollarsFiscal year1 (in 000’s) (in 000,000’s) Loans Dollars Loans Dollars Dollars (in 000’s) (in 000,000’s)
Stafford Unsubsidized3f
1993 423 $1,019 — — 7.5 5.7 $2,411 423 $1,019
1994 1,319 4,739 212.0 365.0 19.6 20.5 3,592 1,742 5,758
1995 1,853 6,843 40.5 44.4 31.6 32.7 3,752 3,594 12,601
1996 1,769 6,568 -4.5 -4.0 33.2 33.3 3,713 5,364 19,169
1997 1,968 7,689 11.2 17.1 34.6 35.5 3,906 7,331 26,858
1998 2,068 8,275 5.1 7.6 35.6 36.8 4,003 9,399 35,134
1999 2,175 9,079 5.2 9.7 37.1 38.9 4,176 11,575 44,213
2000 2,456 10,482 12.9 15.5 38.8 40.9 4,268 14,031 54,695
PLUS4
1981 11 $28 — — 0.3 0.4 $2,690 11 $28
1982 27 67 145.5 139.3 1.0 1.1 2,525 38 95
1983 58 147 114.8 119.4 1.9 2.1 2,540 96 242
1984 74 194 27.6 32.0 2.2 2.5 2,643 170 436
1985 95 253 28.4 30.4 2.5 2.8 2,664 265 689
1986 92 241 -3.2 -4.7 2.5 2.8 2,634 357 930
1987 109 323 18.0 33.9 2.8 3.3 2,973 466 1,253
1988 178 541 64.0 67.6 3.9 4.6 3,040 643 1,793
1989 239 748 34.1 38.3 5.1 6.0 3,136 882 2,541
1990 273 877 14.6 17.3 6.1 7.1 3,210 1,155 3,419
1991 329 1,072 20.5 22.2 6.8 7.9 3,256 1,484 4,491
1992 393 1,293 19.4 20.6 7.7 8.8 3,289 1,878 5,784
1993 344 1,312 -12.6 1.5 6.1 7.3 3,817 2,222 7,096
1994 350 1,726 1.7 31.5 5.2 7.5 4,934 2,571 8,822
1995 300 1,663 -14.2 -3.6 5.1 7.9 5,543 2,871 10,485
1996 279 1,658 -7.0 -0.3 5.2 8.4 5,943 3,150 12,143
1997 312 1,985 11.7 19.7 5.5 9.2 6,368 3,462 14,128
1998 334 2,194 7.1 10.5 5.7 9.8 6,571 3,796 16,322
1999 345 2,383 3.3 8.6 5.9 10.2 6,837 4,140 18,705
2000 356 2,610 3.4 9.6 5.6 10.2 7,331 4,497 21,315
SLS5
1981 0 $0 — — 0.0 0.0 $0 0 $0
1982 13 31 — — 0.5 0.5 2,350 13 31
1983 42 110 223.1 254.8 1.4 1.6 2,619 55 141
1984 67 175 59.5 59.1 2.0 2.2 2,629 122 316
1985 97 260 44.8 48.6 2.5 2.9 2,672 219 576
1986 106 279 9.3 7.3 2.9 3.3 2,634 325 855
1987 286 826 169.5 196.2 7.4 8.5 2,893 611 1,681
1988 716 2,018 150.8 144.3 15.9 17.1 2,817 1,327 3,700
1989 793 2,125 10.7 5.3 16.8 17.0 2,679 2,120 5,825
1990 614 1,706 -22.6 -19.7 13.7 13.9 2,778 2,734 7,530
1991 648 1,877 5.5 10.0 13.4 13.9 2,898 3,382 9,407
1992 740 2,207 14.2 17.6 14.4 15.0 2,983 4,122 11,614
1993 808 3,060 9.2 38.7 14.3 17.1 3,789 4,929 14,674
1994 553 1,869 -31.5 -38.9 8.2 8.1 3,377 5,483 16,543
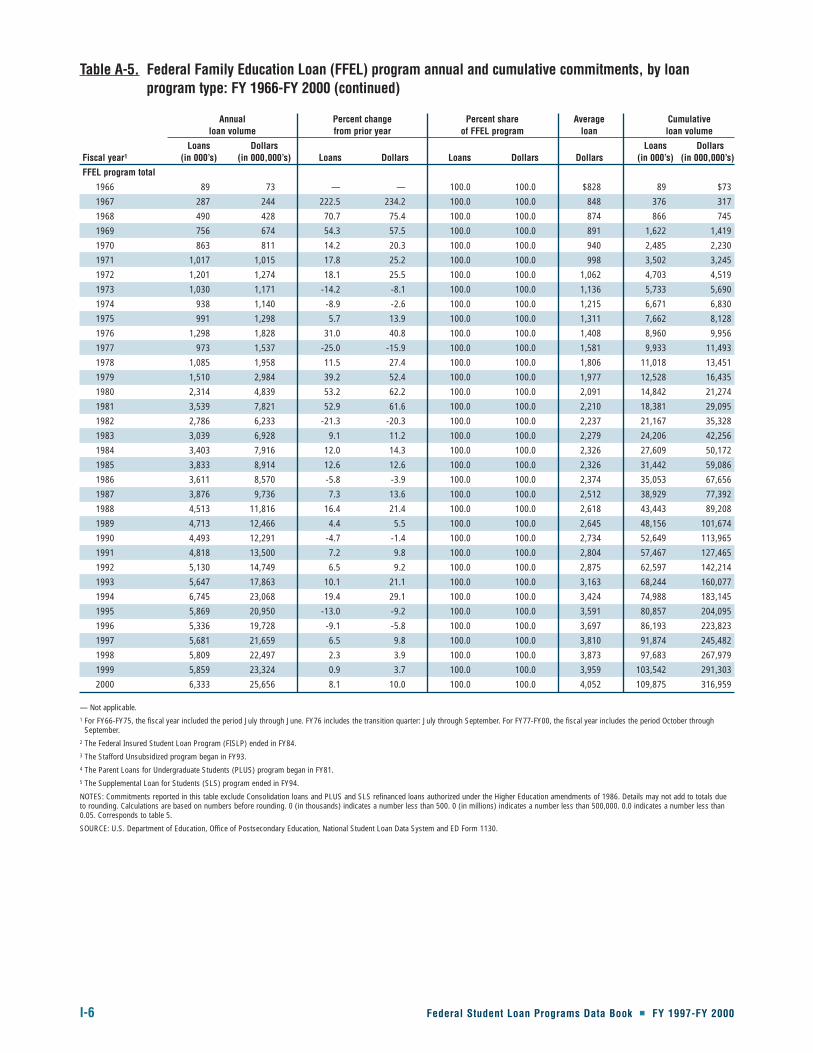
I-6 Federal Student Loan Programs Data Book � FY 1997-FY 2000
Table A-5. Federal Family Education Loan (FFEL) program annual and cumulative commitments, by loanprogram type: FY 1966-FY 2000 (continued)
Annual Percent change Percent share Average Cumulativeloan volume from prior year of FFEL program loan loan volume
Loans Dollars Loans DollarsFiscal year1 (in 000’s) (in 000,000’s) Loans Dollars Loans Dollars Dollars (in 000’s) (in 000,000’s)
FFEL program total
1966 89 73 — — 100.0 100.0 $828 89 $73
1967 287 244 222.5 234.2 100.0 100.0 848 376 317
1968 490 428 70.7 75.4 100.0 100.0 874 866 745
1969 756 674 54.3 57.5 100.0 100.0 891 1,622 1,419
1970 863 811 14.2 20.3 100.0 100.0 940 2,485 2,230
1971 1,017 1,015 17.8 25.2 100.0 100.0 998 3,502 3,245
1972 1,201 1,274 18.1 25.5 100.0 100.0 1,062 4,703 4,519
1973 1,030 1,171 -14.2 -8.1 100.0 100.0 1,136 5,733 5,690
1974 938 1,140 -8.9 -2.6 100.0 100.0 1,215 6,671 6,830
1975 991 1,298 5.7 13.9 100.0 100.0 1,311 7,662 8,128
1976 1,298 1,828 31.0 40.8 100.0 100.0 1,408 8,960 9,956
1977 973 1,537 -25.0 -15.9 100.0 100.0 1,581 9,933 11,493
1978 1,085 1,958 11.5 27.4 100.0 100.0 1,806 11,018 13,451
1979 1,510 2,984 39.2 52.4 100.0 100.0 1,977 12,528 16,435
1980 2,314 4,839 53.2 62.2 100.0 100.0 2,091 14,842 21,274
1981 3,539 7,821 52.9 61.6 100.0 100.0 2,210 18,381 29,095
1982 2,786 6,233 -21.3 -20.3 100.0 100.0 2,237 21,167 35,328
1983 3,039 6,928 9.1 11.2 100.0 100.0 2,279 24,206 42,256
1984 3,403 7,916 12.0 14.3 100.0 100.0 2,326 27,609 50,172
1985 3,833 8,914 12.6 12.6 100.0 100.0 2,326 31,442 59,086
1986 3,611 8,570 -5.8 -3.9 100.0 100.0 2,374 35,053 67,656
1987 3,876 9,736 7.3 13.6 100.0 100.0 2,512 38,929 77,392
1988 4,513 11,816 16.4 21.4 100.0 100.0 2,618 43,443 89,208
1989 4,713 12,466 4.4 5.5 100.0 100.0 2,645 48,156 101,674
1990 4,493 12,291 -4.7 -1.4 100.0 100.0 2,734 52,649 113,965
1991 4,818 13,500 7.2 9.8 100.0 100.0 2,804 57,467 127,465
1992 5,130 14,749 6.5 9.2 100.0 100.0 2,875 62,597 142,214
1993 5,647 17,863 10.1 21.1 100.0 100.0 3,163 68,244 160,077
1994 6,745 23,068 19.4 29.1 100.0 100.0 3,424 74,988 183,145
1995 5,869 20,950 -13.0 -9.2 100.0 100.0 3,591 80,857 204,095
1996 5,336 19,728 -9.1 -5.8 100.0 100.0 3,697 86,193 223,823
1997 5,681 21,659 6.5 9.8 100.0 100.0 3,810 91,874 245,482
1998 5,809 22,497 2.3 3.9 100.0 100.0 3,873 97,683 267,979
1999 5,859 23,324 0.9 3.7 100.0 100.0 3,959 103,542 291,303
2000 6,333 25,656 8.1 10.0 100.0 100.0 4,052 109,875 316,959
— Not applicable.1 For FY66-FY75, the fiscal year included the period July through June. FY76 includes the transition quarter: July through September. For FY77-FY00, the fiscal year includes the period October through
September.2 The Federal Insured Student Loan Program (FISLP) ended in FY84.3 The Stafford Unsubsidized program began in FY93.4 The Parent Loans for Undergraduate Students (PLUS) program began in FY81.5 The Supplemental Loan for Students (SLS) program ended in FY94.
NOTES: Commitments reported in this table exclude Consolidation loans and PLUS and SLS refinanced loans authorized under the Higher Education amendments of 1986. Details may not add to totals dueto rounding. Calculations are based on numbers before rounding. 0 (in thousands) indicates a number less than 500. 0 (in millions) indicates a number less than 500,000. 0.0 indicates a number less than0.05. Corresponds to table 5.
SOURCE: U.S. Department of Education, Office of Postsecondary Education, National Student Loan Data System and ED Form 1130.
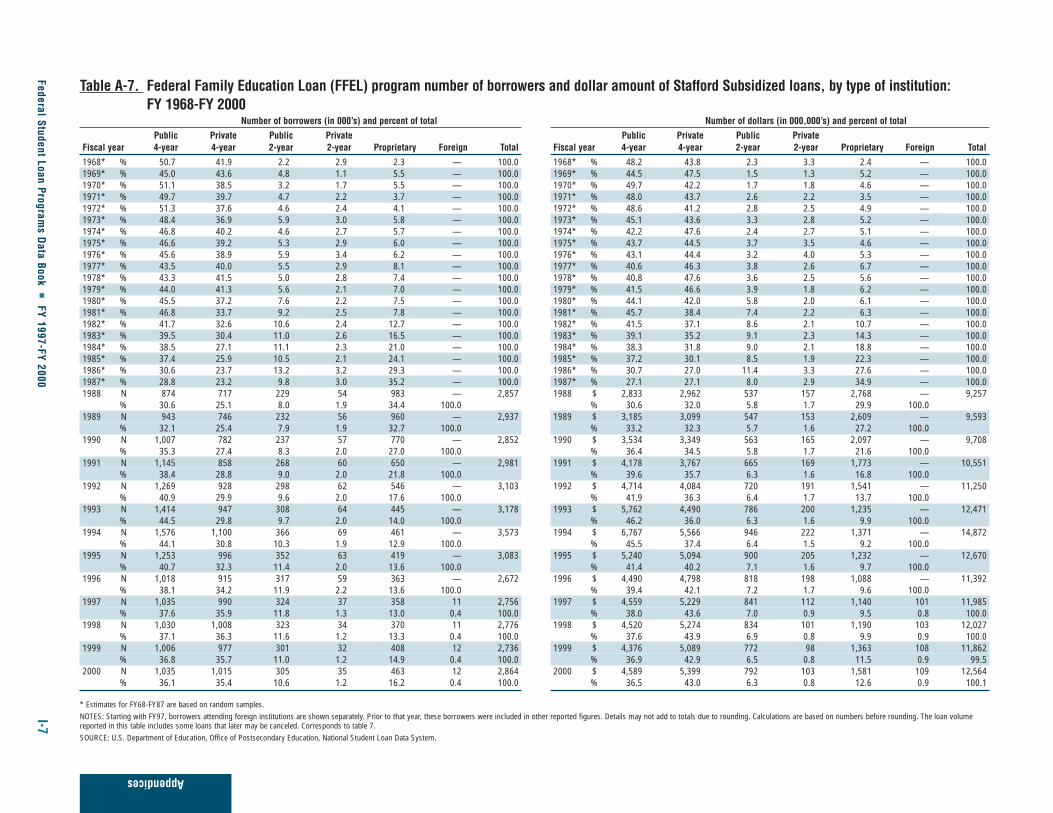
Federal Student Loan Programs D
ata Book �
FY 1997-FY 2000I-7
Appendices
Table A-7. Federal Family Education Loan (FFEL) program number of borrowers and dollar amount of Stafford Subsidized loans, by type of institution: FY 1968-FY 2000
Number of borrowers (in 000’s) and percent of total Number of dollars (in 000,000’s) and percent of total
Public Private Public Private Public Private Public PrivateFiscal year 4-year 4-year 2-year 2-year Proprietary Foreign Total Fiscal year 4-year 4-year 2-year 2-year Proprietary Foreign Total
1968* % 50.7 41.9 2.2 2.9 2.3 — 100.0 1968* % 48.2 43.8 2.3 3.3 2.4 — 100.0 1969* % 45.0 43.6 4.8 1.1 5.5 — 100.0 1969* % 44.5 47.5 1.5 1.3 5.2 — 100.0 1970* % 51.1 38.5 3.2 1.7 5.5 — 100.0 1970* % 49.7 42.2 1.7 1.8 4.6 — 100.0 1971* % 49.7 39.7 4.7 2.2 3.7 — 100.0 1971* % 48.0 43.7 2.6 2.2 3.5 — 100.0 1972* % 51.3 37.6 4.6 2.4 4.1 — 100.0 1972* % 48.6 41.2 2.8 2.5 4.9 — 100.0 1973* % 48.4 36.9 5.9 3.0 5.8 — 100.0 1973* % 45.1 43.6 3.3 2.8 5.2 — 100.0 1974* % 46.8 40.2 4.6 2.7 5.7 — 100.0 1974* % 42.2 47.6 2.4 2.7 5.1 — 100.0 1975* % 46.6 39.2 5.3 2.9 6.0 — 100.0 1975* % 43.7 44.5 3.7 3.5 4.6 — 100.0 1976* % 45.6 38.9 5.9 3.4 6.2 — 100.0 1976* % 43.1 44.4 3.2 4.0 5.3 — 100.0 1977* % 43.5 40.0 5.5 2.9 8.1 — 100.0 1977* % 40.6 46.3 3.8 2.6 6.7 — 100.0 1978* % 43.3 41.5 5.0 2.8 7.4 — 100.0 1978* % 40.8 47.6 3.6 2.5 5.6 — 100.0 1979* % 44.0 41.3 5.6 2.1 7.0 — 100.0 1979* % 41.5 46.6 3.9 1.8 6.2 — 100.0 1980* % 45.5 37.2 7.6 2.2 7.5 — 100.0 1980* % 44.1 42.0 5.8 2.0 6.1 — 100.01981* % 46.8 33.7 9.2 2.5 7.8 — 100.0 1981* % 45.7 38.4 7.4 2.2 6.3 — 100.01982* % 41.7 32.6 10.6 2.4 12.7 — 100.0 1982* % 41.5 37.1 8.6 2.1 10.7 — 100.01983* % 39.5 30.4 11.0 2.6 16.5 — 100.0 1983* % 39.1 35.2 9.1 2.3 14.3 — 100.01984* % 38.5 27.1 11.1 2.3 21.0 — 100.0 1984* % 38.3 31.8 9.0 2.1 18.8 — 100.01985* % 37.4 25.9 10.5 2.1 24.1 — 100.0 1985* % 37.2 30.1 8.5 1.9 22.3 — 100.01986* % 30.6 23.7 13.2 3.2 29.3 — 100.0 1986* % 30.7 27.0 11.4 3.3 27.6 — 100.01987* % 28.8 23.2 9.8 3.0 35.2 — 100.0 1987* % 27.1 27.1 8.0 2.9 34.9 — 100.01988 N 874 717 229 54 983 — 2,857 1988 $ 2,833 2,962 537 157 2,768 — 9,257
% 30.6 25.1 8.0 1.9 34.4 100.0 % 30.6 32.0 5.8 1.7 29.9 100.01989 N 943 746 232 56 960 — 2,937 1989 $ 3,185 3,099 547 153 2,609 — 9,593
% 32.1 25.4 7.9 1.9 32.7 100.0 % 33.2 32.3 5.7 1.6 27.2 100.01990 N 1,007 782 237 57 770 — 2,852 1990 $ 3,534 3,349 563 165 2,097 — 9,708
% 35.3 27.4 8.3 2.0 27.0 100.0 % 36.4 34.5 5.8 1.7 21.6 100.01991 N 1,145 858 268 60 650 — 2,981 1991 $ 4,178 3,767 665 169 1,773 — 10,551
% 38.4 28.8 9.0 2.0 21.8 100.0 % 39.6 35.7 6.3 1.6 16.8 100.01992 N 1,269 928 298 62 546 — 3,103 1992 $ 4,714 4,084 720 191 1,541 — 11,250
% 40.9 29.9 9.6 2.0 17.6 100.0 % 41.9 36.3 6.4 1.7 13.7 100.0 1993 N 1,414 947 308 64 445 — 3,178 1993 $ 5,762 4,490 786 200 1,235 — 12,471
% 44.5 29.8 9.7 2.0 14.0 100.0 % 46.2 36.0 6.3 1.6 9.9 100.0 1994 N 1,576 1,100 366 69 461 — 3,573 1994 $ 6,767 5,566 946 222 1,371 — 14,872
% 44.1 30.8 10.3 1.9 12.9 100.0 % 45.5 37.4 6.4 1.5 9.2 100.0 1995 N 1,253 996 352 63 419 — 3,083 1995 $ 5,240 5,094 900 205 1,232 — 12,670
% 40.7 32.3 11.4 2.0 13.6 100.0 % 41.4 40.2 7.1 1.6 9.7 100.0 1996 N 1,018 915 317 59 363 — 2,672 1996 $ 4,490 4,798 818 198 1,088 — 11,392
% 38.1 34.2 11.9 2.2 13.6 100.0 % 39.4 42.1 7.2 1.7 9.6 100.0 1997 N 1,035 990 324 37 358 11 2,756 1997 $ 4,559 5,229 841 112 1,140 101 11,985
% 37.6 35.9 11.8 1.3 13.0 0.4 100.0 % 38.0 43.6 7.0 0.9 9.5 0.8 100.0 1998 N 1,030 1,008 323 34 370 11 2,776 1998 $ 4,520 5,274 834 101 1,190 103 12,027
% 37.1 36.3 11.6 1.2 13.3 0.4 100.0 % 37.6 43.9 6.9 0.8 9.9 0.9 100.0 1999 N 1,006 977 301 32 408 12 2,736 1999 $ 4,376 5,089 772 98 1,363 108 11,862
% 36.8 35.7 11.0 1.2 14.9 0.4 100.0 % 36.9 42.9 6.5 0.8 11.5 0.9 99.5 2000 N 1,035 1,015 305 35 463 12 2,864 2000 $ 4,589 5,399 792 103 1,581 109 12,564
% 36.1 35.4 10.6 1.2 16.2 0.4 100.0 % 36.5 43.0 6.3 0.8 12.6 0.9 100.1
* Estimates for FY68-FY87 are based on random samples.NOTES: Starting with FY97, borrowers attending foreign institutions are shown separately. Prior to that year, these borrowers were included in other reported figures. Details may not add to totals due to rounding. Calculations are based on numbers before rounding. The loan volumereported in this table includes some loans that later may be canceled. Corresponds to table 7.SOURCE: U.S. Department of Education, Office of Postsecondary Education, National Student Loan Data System.

I-8Federal Student Loan Program
s Data Book
�FY 1997-FY 2000
Table A-9. Federal Family Education Loan (FFEL) program number of borrowers and dollar amount of Parent Loans for Undergraduate Students (PLUS)loans, by type of institution: FY 1981-FY 2000
Number of borrowers (in 000’s) and percent of total Number of dollars (in 000,000’s) and percent of total
Public Private Public Private Public Private Public PrivateFiscal year 4-year 4-year 2-year 2-year Proprietary Foreign Total Fiscal year 4-year 4-year 2-year 2-year Proprietary Foreign Total
1981* % 23.7 69.7 1.7 2.7 2.2 — 100.0 1981* % 20.5 73.0 1.4 3.0 2.1 — 100.0
1982* % 25.9 59.3 3.6 4.3 6.9 — 100.0 1982* % 24.9 62.2 3.1 3.9 5.9 — 100.0
1983* % 33.7 49.5 4.0 3.4 9.4 — 100.0 1983* % 32.1 51.5 3.4 3.6 9.4 — 100.0
1984* % 34.2 46.0 4.1 3.0 12.7 — 100.0 1984* % 32.5 48.3 3.7 2.9 12.6 — 100.0
1985* % 33.7 42.8 3.7 3.4 16.4 — 100.0 1985* % 32.3 44.9 3.2 3.4 16.2 — 100.0
1986* % 35.0 37.4 3.6 2.5 21.5 — 100.0 1986* % 34.4 38.9 3.2 2.3 21.2 — 100.0
1987* % 35.4 31.1 3.9 1.7 27.9 — 100.0 1987* % 34.2 32.3 3.4 1.6 28.5 — 100.0
1988 N 56.7 39.7 7.2 3.6 42.5 — 149.7 1988 $ 207.7 153.6 22.2 13.5 143.9 — 541.0
% 37.9 26.5 4.8 2.4 28.4 100.0 % 38.4 28.4 4.1 2.5 26.6 100.0
1989 N 77.8 54.6 8.3 4.9 57.5 — 203.0 1989 $ 294.7 216.9 25.4 18.0 193.0 — 748.0
% 38.3 26.9 4.1 2.4 28.3 100.0 % 39.4 29.0 3.4 2.4 25.8 100.0
1990 N 98.5 71.4 10.2 5.1 56.9 — 242.1 1990 $ 362.2 275.4 29.8 18.4 191.2 — 877.0
% 40.7 29.5 4.2 2.1 23.5 100.0 % 41.3 31.4 3.4 2.1 21.8 100.0
1991 N 123.8 91.2 12.8 6.1 56.7 — 290.6 1991 $ 458.8 355.9 38.6 21.4 197.2 — 1,072.0
% 42.6 31.4 4.4 2.1 19.5 100.0 % 42.8 33.2 3.6 2.0 18.4 100.0
1992 N 142.6 107.5 15.4 6.2 56.0 — 327.7 1992 $ 566.3 442.2 47.8 24.6 212.1 — 1,293.0
% 43.5 32.8 4.7 1.9 17.1 100.0 % 43.8 34.2 3.7 1.9 16.4 100.0
1993 N 117.8 100.4 10.8 6.0 50.2 — 285.2 1993 $ 505.1 524.8 38.0 27.6 216.5 — 1,312.0
% 41.3 35.2 3.8 2.1 17.6 100.0 % 38.5 40.0 2.9 2.1 16.5 100.0
1994 N 114 121 8 7 53 — 302 1994 $ 552 839 28 38 250 — 1,707
% 37.6 40.1 2.6 2.3 17.4 100.0 % 32.3 49.1 1.6 2.3 14.7 100.0
1995 N 86 118 7 7 50 — 267 1995 $ 451 899 28 38 238 — 1,655
% 32.2 44.1 2.7 2.5 18.6 100.0 % 27.2 54.4 1.7 2.3 14.4 100.0
1996 N 74 113 7 7 48 — 249 1996 $ 416 919 28 41 250 — 1,654
% 29.9 45.4 2.7 2.8 19.3 100.0 % 25.2 55.6 1.7 2.5 15.1 100.0
1997 N 83 130 6 4 51 0 276 1997 $ 496 1,145 26 23 291 3 1,985
% 30.2 47.2 2.3 1.6 18.6 0.1 100.0 % 25.0 57.7 1.3 1.2 14.7 0.2 99.9
1998 N 92 134 7 4 56 0 294 1998 $ 583 1,210 31 26 338 3 2,194
% 31.4 45.5 2.5 1.5 19.1 0.1 100.0 % 26.6 55.2 1.4 1.2 15.4 0.1 99.9
1999 N 97 133 7 4 62 0 303 1999 $ 638 1,265 31 29 409 4 2,383
% 32.0 43.7 2.3 1.5 20.4 0.1 100.0 % 26.8 53.1 1.3 1.2 17.2 0.2 99.7
2000 N 99 134 7 5 71 0 316 2000 $ 687 1,356 30 30 510 4 2,610
% 31.4 42.4 2.1 1.5 22.5 0.1 100.0 % 26.3 52.0 1.1 1.1 19.6 0.2 100.3
* Estimates for FY81-FY87 are based on random samples.
NOTES: The PLUS program began in FY81. Starting with FY97, borrowers attending foreign institutions are shown separately. Prior to that year, these borrowers were included in other reported figures. Details may not add to totals due to rounding. Calculations are based on numbersbefore rounding. The loan volume reported in this table includes some loans that later may be canceled. Corresponds to table 9.
SOURCE: U.S. Department of Education, Office of Postsecondary Education, National Student Loan Data System.

Federal Student Loan Programs D
ata Book �
FY 1997-FY 2000I-9
Appendices
Table A-10. Federal Family Education Loan (FFEL) program number of borrowers and dollar amount of Stafford Subsidized, Stafford Unsubsidized, ParentLoans for Undergraduate Students (PLUS), and Supplemental Loan for Students (SLS) loans, by type of institution: FY 1986-FY 2000
Number of borrowers (in 000’s) and percent of total Number of dollars (in 000,000’s) and percent of total
Public Private Public Private Public Private Public PrivateFiscal year 4-year 4-year 2-year 2-year Proprietary Foreign Total Fiscal year 4-year 4-year 2-year 2-year Proprietary Foreign Total
1986* % 30.6 41.0 6.1 2.1 20.1 — 100.0 1986* % 29.9 43.8 5.3 2.1 19.0 — 100.0
1987* % 26.4 26.9 5.7 2.1 38.9 — 100.0 1987* % 25.3 30.0 4.8 2.0 37.8 — 100.0
1988 N 997 856 258 67 1,396 — 3,575 1988 $ 3,276 3,546 636 205 4,153 — 11,816
% 27.9 23.9 7.2 1.9 39.1 100.0 % 27.7 30.0 5.4 1.7 35.1 100.0
1989 N 1,098 917 264 72 1,434 — 3,785 1989 $ 3,747 3,806 642 210 4,060 — 12,466
% 29.0 24.2 7.0 1.9 37.9 100.0 % 30.1 30.5 5.2 1.7 32.6 100.0
1990 N 1,202 991 270 73 1,063 — 3,599 1990 $ 4,232 4,206 658 218 2,977 — 12,291
% 33.4 27.5 7.5 2.0 29.5 100.0 % 34.4 34.2 5.4 1.8 24.2 100.0
1991 N 1,395 1,122 310 78 893 — 3,797 1991 $ 5,093 4,866 788 233 2,520 — 13,500
% 36.7 29.5 8.2 2.0 23.5 100.0 % 37.7 36.0 5.8 1.7 18.7 100.0
1992 N 1,575 1,233 352 81 761 — 4,003 1992 $ 5,907 5,407 891 264 2,281 — 14,750
% 39.4 30.8 8.8 2.0 19.0 100.0 % 40.0 36.7 6.0 1.8 15.5 100.0
1993 N 1,952 1,364 395 90 679 — 4,480 1993 $ 7,731 6,739 1,030 301 2,062 — 17,862
% 43.6 30.4 8.8 2.0 15.2 100.0 % 43.3 37.7 5.8 1.7 11.5 100.0
1994 N 2,384 1,738 503 109 778 — 3,948 1 1994 $ 9,762 9,161 1,282 373 2,435 — 23,053
% 43.3 31.5 9.1 2.0 14.1 100.0 % 42.5 39.8 5.6 1.6 10.6 100.0
1995 N 1,930 1,601 505 103 732 — 3,466 1 1995 $ 7,918 8,840 1,301 366 2,336 — 20,951
% 39.6 32.9 10.4 2.1 15.0 100.0 % 38.3 42.5 6.3 1.8 11.2 100.0
1996 N 1,620 1,514 471 100 657 — 3,028 1 1996 $ 7,076 8,686 1,228 369 2,165 — 19,728
% 37.2 34.7 10.8 2.3 15.1 100.0 % 36.3 44.5 6.3 1.9 11.1 100.0
1997 N 1,693 1,678 495 65 666 21 4,618 1997 $ 7,513 10,058 1,306 213 2,356 207 21,659
% 36.7 36.3 10.7 1.4 14.4 0.5 100.0 % 34.7 46.4 6.0 1.0 10.9 1.0 100.0
1998 N 1,725 1,731 506 60 699 22 4,743 1998 $ 7,729 10,462 1,336 198 2,547 214 22,497
% 36.4 36.5 10.7 1.3 14.7 0.5 100.0 % 34.4 46.5 5.9 0.9 11.3 1.0 100.0
1999 N 1,742 1,719 480 59 785 23 4,808 1999 $ 7,907 10,629 1,269 200 3,020 224 23,324
% 36.2 35.8 10.0 1.2 16.3 0.5 100.0 % 33.9 45.6 5.4 0.9 12.9 1.0 99.7
2000 N 1,849 1,822 501 64 909 23 5,168 2000 $ 8,667 11,569 1,346 217 3,654 232 25,656
% 35.8 35.2 9.7 1.2 17.6 0.5 100.0 % 33.8 45.1 5.2 0.8 14.2 0.9 100.1
* Estimates for FY86 and FY87 are based on random samples.1 Totals may not equal the sum of the individual column items since borrowers can, and do, change institutions over the course of the fiscal year.
NOTES: Starting with FY97, borrowers attending foreign institutions are shown separately. Prior to that year, these borrowers were included in other reported figures. Details may not add to totals due to rounding.Calculations are based on numbers before rounding. The loan volume reported in this table includes some loans that later may be canceled. The Stafford Unsubsidized program began in FY93 and the SLS program ended in FY94. As a result, figures for FY86 to FY94 include SLS loans,and figures for FY93 to FY00 include Stafford Unsubsidized loans. Corresponds to table 10.
SOURCE: U.S. Department of Education, Office of Postsecondary Education, National Student Loan Data System.

I-10Federal Student Loan Program
s Data Book
�FY 1997-FY 2000
Table A-10 Supplemental. Federal Family Education Loan (FFEL) program number of borrowers and dollar amount of Supplemental Loan for Students(SLS) loans, by type of institution: FY 1982-FY 1994
Number of borrowers (in 000’s) and percent of total Number of dollars (in 000,000’s) and percent of total
Public Private Public Private Public Private Public Private Fiscal year 4-year 4-year 2-year 2-year Proprietary Total Fiscal year 4-year 4-year 2-year 2-year Proprietary Total
1982* % 16.4 77.3 0.8 0.8 4.7 100.0 1982* % 15.9 79.1 0.7 0.7 3.6 100.0
1983* % 18.3 76.8 1.9 0.6 2.4 100.0 1983* % 17.5 78.1 1.7 0.6 2.1 100.0
1984* % 23.2 69.6 1.8 0.5 4.9 100.0 1984* % 22.0 71.7 1.7 0.4 4.2 100.0
1985* % 25.0 66.3 1.4 1.5 5.8 100.0 1985* % 23.7 68.5 1.2 1.3 5.3 100.0
1986* % 26.2 62.0 1.5 0.7 9.6 100.0 1986* % 24.5 65.4 1.2 0.7 8.2 100.0
1987* % 14.9 26.4 3.4 1.6 53.7 100.0 1987* % 14.7 30.6 3.0 1.6 50.1 100.0
1988 N 66 99 23 9 371 568 1988 $ 236 430 77 34 1,241 2,018
% 11.7 17.4 4.0 1.6 65.3 100.0 % 11.7 21.3 3.8 1.7 61.5 100.0
1989 N 78 117 23 11 416 645 1989 $ 268 491 70 38 1,258 2,125
% 12.1 18.1 3.6 1.7 64.5 100.0 % 12.6 23.1 3.3 1.8 59.2 100.0
1990 N 97 138 23 11 236 505 1990 $ 336 582 65 34 689 1,706
% 19.2 27.4 4.5 2.1 46.8 100.0 % 19.7 34.1 3.8 2.0 40.4 100.0
1991 N 127 172 29 12 186 526 1991 $ 456 743 84 43 550 1,877
% 24.1 32.7 5.5 2.3 35.4 100.0 % 24.3 39.6 4.5 2.3 29.3 100.0
1992 N 164 198 39 13 159 573 1992 $ 627 881 124 49 527 2,207
% 28.6 34.6 6.8 2.3 27.7 100.0 % 28.4 39.9 5.6 2.2 23.9 100.0
1993 N 193 224 39 15 163 635 1993 $ 857 1,441 138 61 563 3,060
% 30.4 35.3 6.2 2.4 25.7 100.0 % 28.0 47.1 4.5 2.0 18.4 100.0
1994 N 125 155 30 14 161 485 1994 $ 429 793 79 44 500 1,844
% 25.8 32.0 6.3 2.8 33.1 100.0 % 23.3 43.0 4.3 2.4 27.1 100.0
*Estimates for FY82-FY87 were based on random samples.
NOTES: Details may not add to totals due to rounding. Calculations are based on numbers before rounding. The loan volume reported in this table includes loans that later may become canceled.
SOURCE: U.S. Department of Education, Office of Postsecondary Education, National Student Loan Data System.
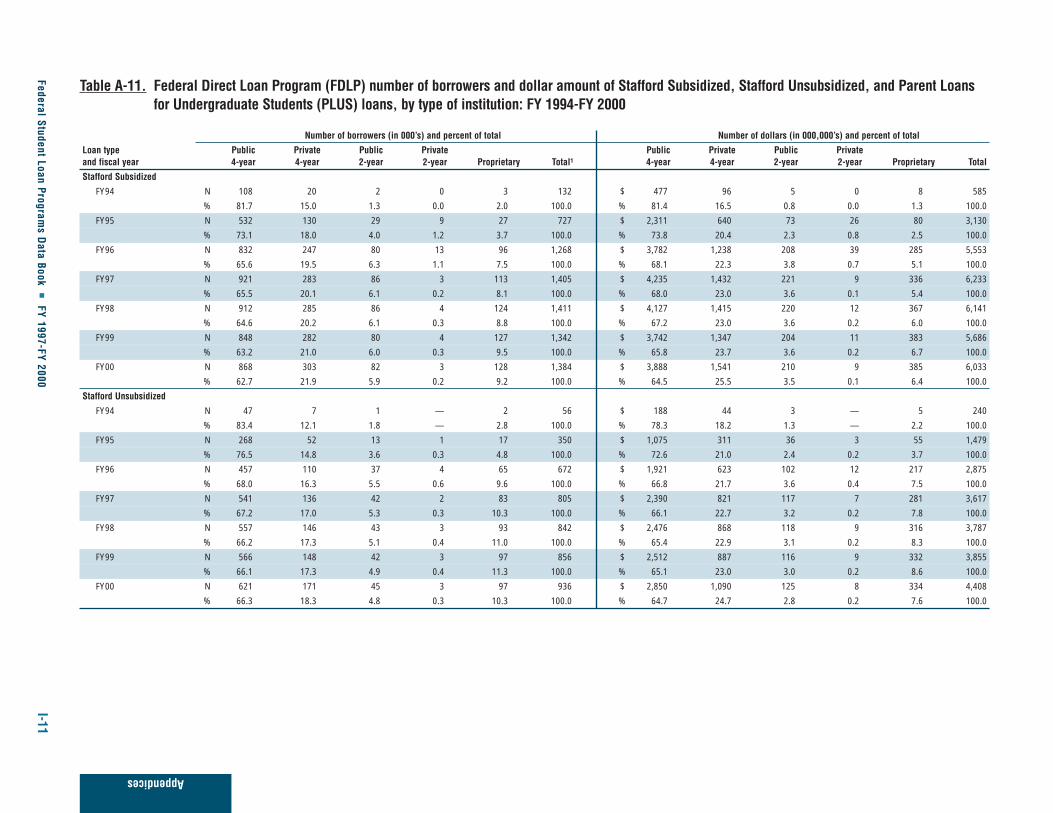
Federal Student Loan Programs D
ata Book �
FY 1997-FY 2000I-11
Appendices
Table A-11. Federal Direct Loan Program (FDLP) number of borrowers and dollar amount of Stafford Subsidized, Stafford Unsubsidized, and Parent Loansfor Undergraduate Students (PLUS) loans, by type of institution: FY 1994-FY 2000
Number of borrowers (in 000’s) and percent of total Number of dollars (in 000,000’s) and percent of total
Loan type Public Private Public Private Public Private Public Private and fiscal year 4-year 4-year 2-year 2-year Proprietary Total1 4-year 4-year 2-year 2-year Proprietary Total
Stafford Subsidized
FY94 N 108 20 2 0 3 132 $ 477 96 5 0 8 585
% 81.7 15.0 1.3 0.0 2.0 100.0 % 81.4 16.5 0.8 0.0 1.3 100.0
FY95 N 532 130 29 9 27 727 $ 2,311 640 73 26 80 3,130
% 73.1 18.0 4.0 1.2 3.7 100.0 % 73.8 20.4 2.3 0.8 2.5 100.0
FY96 N 832 247 80 13 96 1,268 $ 3,782 1,238 208 39 285 5,553
% 65.6 19.5 6.3 1.1 7.5 100.0 % 68.1 22.3 3.8 0.7 5.1 100.0
FY97 N 921 283 86 3 113 1,405 $ 4,235 1,432 221 9 336 6,233
% 65.5 20.1 6.1 0.2 8.1 100.0 % 68.0 23.0 3.6 0.1 5.4 100.0
FY98 N 912 285 86 4 124 1,411 $ 4,127 1,415 220 12 367 6,141
% 64.6 20.2 6.1 0.3 8.8 100.0 % 67.2 23.0 3.6 0.2 6.0 100.0
FY99 N 848 282 80 4 127 1,342 $ 3,742 1,347 204 11 383 5,686
% 63.2 21.0 6.0 0.3 9.5 100.0 % 65.8 23.7 3.6 0.2 6.7 100.0
FY00 N 868 303 82 3 128 1,384 $ 3,888 1,541 210 9 385 6,033
% 62.7 21.9 5.9 0.2 9.2 100.0 % 64.5 25.5 3.5 0.1 6.4 100.0
Stafford Unsubsidized
FY94 N 47 7 1 — 2 56 $ 188 44 3 — 5 240
% 83.4 12.1 1.8 — 2.8 100.0 % 78.3 18.2 1.3 — 2.2 100.0
FY95 N 268 52 13 1 17 350 $ 1,075 311 36 3 55 1,479
% 76.5 14.8 3.6 0.3 4.8 100.0 % 72.6 21.0 2.4 0.2 3.7 100.0
FY96 N 457 110 37 4 65 672 $ 1,921 623 102 12 217 2,875
% 68.0 16.3 5.5 0.6 9.6 100.0 % 66.8 21.7 3.6 0.4 7.5 100.0
FY97 N 541 136 42 2 83 805 $ 2,390 821 117 7 281 3,617
% 67.2 17.0 5.3 0.3 10.3 100.0 % 66.1 22.7 3.2 0.2 7.8 100.0
FY98 N 557 146 43 3 93 842 $ 2,476 868 118 9 316 3,787
% 66.2 17.3 5.1 0.4 11.0 100.0 % 65.4 22.9 3.1 0.2 8.3 100.0
FY99 N 566 148 42 3 97 856 $ 2,512 887 116 9 332 3,855
% 66.1 17.3 4.9 0.4 11.3 100.0 % 65.1 23.0 3.0 0.2 8.6 100.0
FY00 N 621 171 45 3 97 936 $ 2,850 1,090 125 8 334 4,408
% 66.3 18.3 4.8 0.3 10.3 100.0 % 64.7 24.7 2.8 0.2 7.6 100.0
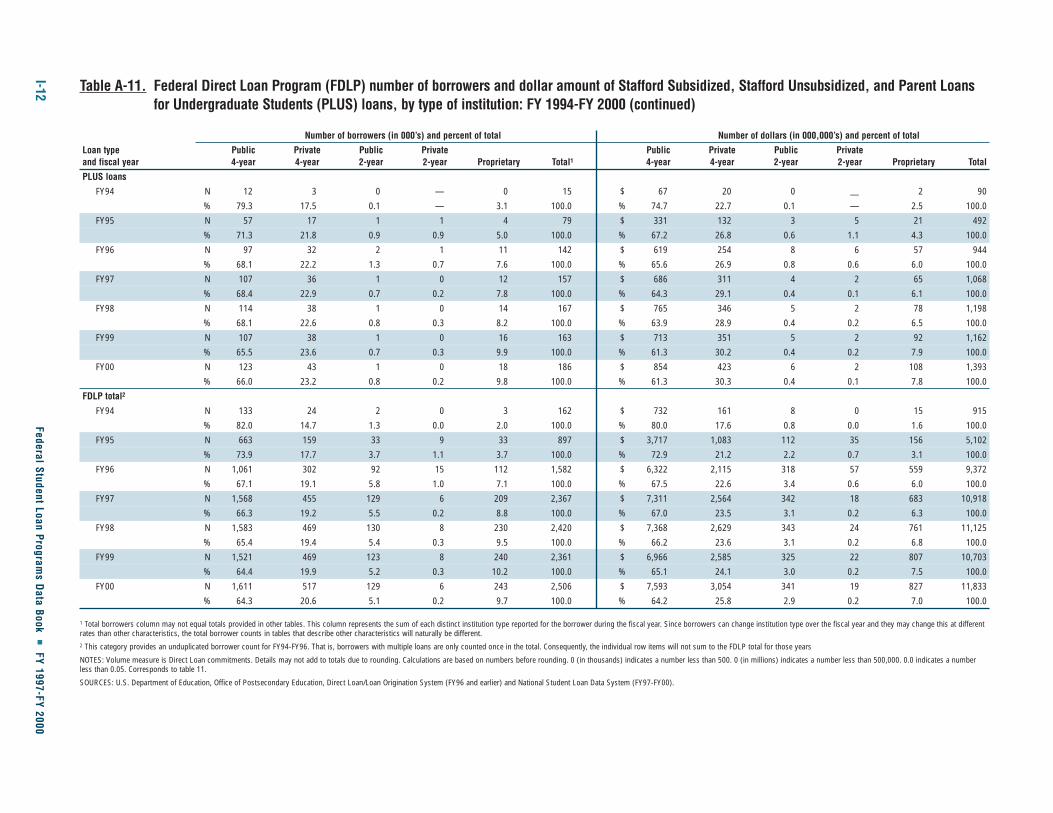
I-12Federal Student Loan Program
s Data Book
�FY 1997-FY 2000
Table A-11. Federal Direct Loan Program (FDLP) number of borrowers and dollar amount of Stafford Subsidized, Stafford Unsubsidized, and Parent Loansfor Undergraduate Students (PLUS) loans, by type of institution: FY 1994-FY 2000 (continued)
Number of borrowers (in 000’s) and percent of total Number of dollars (in 000,000’s) and percent of total
Loan type Public Private Public Private Public Private Public Private and fiscal year 4-year 4-year 2-year 2-year Proprietary Total1 4-year 4-year 2-year 2-year Proprietary Total
PLUS loans
FY94 N 12 3 0 — 0 15 $ 67 20 0 — 2 90
% 79.3 17.5 0.1 — 3.1 100.0 % 74.7 22.7 0.1 — 2.5 100.0
FY95 N 57 17 1 1 4 79 $ 331 132 3 5 21 492
% 71.3 21.8 0.9 0.9 5.0 100.0 % 67.2 26.8 0.6 1.1 4.3 100.0
FY96 N 97 32 2 1 11 142 $ 619 254 8 6 57 944
% 68.1 22.2 1.3 0.7 7.6 100.0 % 65.6 26.9 0.8 0.6 6.0 100.0
FY97 N 107 36 1 0 12 157 $ 686 311 4 2 65 1,068
% 68.4 22.9 0.7 0.2 7.8 100.0 % 64.3 29.1 0.4 0.1 6.1 100.0
FY98 N 114 38 1 0 14 167 $ 765 346 5 2 78 1,198
% 68.1 22.6 0.8 0.3 8.2 100.0 % 63.9 28.9 0.4 0.2 6.5 100.0
FY99 N 107 38 1 0 16 163 $ 713 351 5 2 92 1,162
% 65.5 23.6 0.7 0.3 9.9 100.0 % 61.3 30.2 0.4 0.2 7.9 100.0
FY00 N 123 43 1 0 18 186 $ 854 423 6 2 108 1,393
% 66.0 23.2 0.8 0.2 9.8 100.0 % 61.3 30.3 0.4 0.1 7.8 100.0
FDLP total2
FY94 N 133 24 2 0 3 162 $ 732 161 8 0 15 915
% 82.0 14.7 1.3 0.0 2.0 100.0 % 80.0 17.6 0.8 0.0 1.6 100.0
FY95 N 663 159 33 9 33 897 $ 3,717 1,083 112 35 156 5,102
% 73.9 17.7 3.7 1.1 3.7 100.0 % 72.9 21.2 2.2 0.7 3.1 100.0
FY96 N 1,061 302 92 15 112 1,582 $ 6,322 2,115 318 57 559 9,372
% 67.1 19.1 5.8 1.0 7.1 100.0 % 67.5 22.6 3.4 0.6 6.0 100.0
FY97 N 1,568 455 129 6 209 2,367 $ 7,311 2,564 342 18 683 10,918
% 66.3 19.2 5.5 0.2 8.8 100.0 % 67.0 23.5 3.1 0.2 6.3 100.0
FY98 N 1,583 469 130 8 230 2,420 $ 7,368 2,629 343 24 761 11,125
% 65.4 19.4 5.4 0.3 9.5 100.0 % 66.2 23.6 3.1 0.2 6.8 100.0
FY99 N 1,521 469 123 8 240 2,361 $ 6,966 2,585 325 22 807 10,703
% 64.4 19.9 5.2 0.3 10.2 100.0 % 65.1 24.1 3.0 0.2 7.5 100.0
FY00 N 1,611 517 129 6 243 2,506 $ 7,593 3,054 341 19 827 11,833
% 64.3 20.6 5.1 0.2 9.7 100.0 % 64.2 25.8 2.9 0.2 7.0 100.0
1 Total borrowers column may not equal totals provided in other tables. This column represents the sum of each distinct institution type reported for the borrower during the fiscal year. Since borrowers can change institution type over the fiscal year and they may change this at differentrates than other characteristics, the total borrower counts in tables that describe other characteristics will naturally be different.2 This category provides an unduplicated borrower count for FY94-FY96. That is, borrowers with multiple loans are only counted once in the total. Consequently, the individual row items will not sum to the FDLP total for those years
NOTES: Volume measure is Direct Loan commitments. Details may not add to totals due to rounding. Calculations are based on numbers before rounding. 0 (in thousands) indicates a number less than 500. 0 (in millions) indicates a number less than 500,000. 0.0 indicates a numberless than 0.05. Corresponds to table 11.
SOURCES: U.S. Department of Education, Office of Postsecondary Education, Direct Loan/Loan Origination System (FY96 and earlier) and National Student Loan Data System (FY97-FY00).

Federal Student Loan Programs D
ata Book �
FY 1997-FY 2000I-13
Appendices
Table A-12. Federal Direct Loan Program (FDLP) number of loans and dollar amount of Stafford Subsidized, Stafford Unsubsidized, and Parent Loans forUndergraduate Students (PLUS) loans, by type of institution: FY 1994-FY 2000
Number of borrowers (in 000’s) and percent of total Number of dollars (in 000,000’s) and percent of total
Loan type Public Private Public Private Public Private Public Private and fiscal year 4-year 4-year 2-year 2-year Proprietary Total1 4-year 4-year 2-year 2-year Proprietary Total
Stafford Subsidized
1994 N 112 20 2 0 3 137 $ 477 96 5 0 8 585
% 81.8 14.9 1.3 0.0 1.9 100.0 % 81.4 16.5 0.8 0.0 1.3 100.0
1995 N 603 142 30 9 30 813 $ 2,311 640 73 26 80 3,130
% 74.1 17.4 3.7 1.1 3.6 100.0 % 73.8 20.4 2.3 0.8 2.5 100.0
1996 N 1,081 311 95 15 110 1,611 $ 3,782 1,238 208 39 285 5,553
% 67.1 19.3 5.9 0.9 6.8 100.0 % 68.1 22.3 3.8 0.7 5.1 100.0
1997 N 1,196 348 102 9 137 1,792 $ 4,216 1,411 224 26 355 6,233
% 66.7 19.4 5.7 0.5 7.6 100.0 % 67.6 22.6 3.6 0.4 5.7 100.0
1998 N 1,192 351 103 9 148 1,803 $ 4,101 1,410 222 24 384 6,141
% 66.1 19.5 5.7 0.5 8.2 100.0 % 66.8 23.0 3.6 0.4 6.3 100.0
1999 N 1,088 342 96 11 154 1,691 $ 3,707 1,349 202 30 398 5,686
% 64.3 20.2 5.7 0.6 9.1 100.0 % 65.2 23.7 3.6 0.5 7.0 100.0
2000 N 1,090 368 96 10 145 1,709 $ 3,898 1,525 209 28 373 6,033
% 63.8 21.5 5.6 0.6 8.5 100.0 % 64.6 25.3 3.5 0.5 6.2 100.0
Stafford Unsubsidized
1994 N 48 7 1 — 2 58 $ 188 44 3 — 5 240
% 83.5 11.9 1.8 — 2.8 100.0 % 78.3 18.2 1.3 — 2.2 100.0
1995 N 302 56 13 1 19 391 $ 1,075 311 36 3 55 1,479
% 77.3 14.3 3.4 0.3 4.8 100.0 % 72.6 21.0 2.4 0.2 3.7 100.0
1996 N 582 136 44 4 75 841 $ 1,921 623 102 12 217 2,875
% 69.2 16.1 5.2 0.5 9.0 100.0 % 66.8 21.7 3.6 0.4 7.5 100.0
1997 N 699 171 50 3 102 1,025 $ 2,380 818 117 7 295 3,617
% 68.2 16.7 4.9 0.3 10.0 100.0 % 65.8 22.6 3.2 0.2 8.2 100.0
1998 N 728 184 51 4 114 1,081 $ 2,458 873 118 9 329 3,787
% 67.4 17.0 4.7 0.3 10.5 100.0 % 64.9 23.1 3.1 0.2 8.7 100.0
1999 N 722 186 50 4 118 1,079 $ 2,489 904 114 9 339 3,855
% 66.9 17.2 4.6 0.3 10.9 100.0 % 64.6 23.4 3.0 0.2 8.8 100.0
2000 N 773 211 53 3 109 1,148 $ 2,868 1,084 127 8 321 4,408
% 67.3 18.4 4.6 0.2 9.5 100.0 % 65.1 24.6 2.9 0.2 7.3 100.0
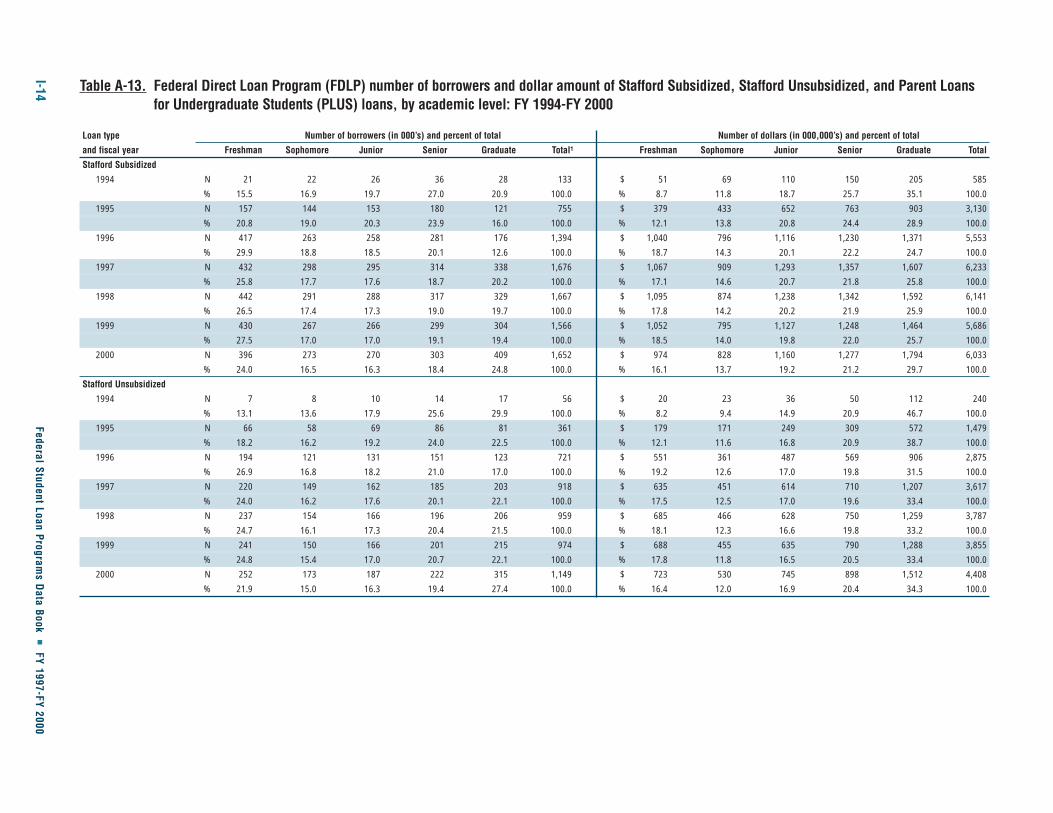
I-14Federal Student Loan Program
s Data Book
�FY 1997-FY 2000
Table A-13. Federal Direct Loan Program (FDLP) number of borrowers and dollar amount of Stafford Subsidized, Stafford Unsubsidized, and Parent Loansfor Undergraduate Students (PLUS) loans, by academic level: FY 1994-FY 2000
Loan type Number of borrowers (in 000’s) and percent of total Number of dollars (in 000,000’s) and percent of total
and fiscal year Freshman Sophomore Junior Senior Graduate Total1 Freshman Sophomore Junior Senior Graduate Total
Stafford Subsidized
1994 N 21 22 26 36 28 133 $ 51 69 110 150 205 585
% 15.5 16.9 19.7 27.0 20.9 100.0 % 8.7 11.8 18.7 25.7 35.1 100.0
1995 N 157 144 153 180 121 755 $ 379 433 652 763 903 3,130
% 20.8 19.0 20.3 23.9 16.0 100.0 % 12.1 13.8 20.8 24.4 28.9 100.0
1996 N 417 263 258 281 176 1,394 $ 1,040 796 1,116 1,230 1,371 5,553
% 29.9 18.8 18.5 20.1 12.6 100.0 % 18.7 14.3 20.1 22.2 24.7 100.0
1997 N 432 298 295 314 338 1,676 $ 1,067 909 1,293 1,357 1,607 6,233
% 25.8 17.7 17.6 18.7 20.2 100.0 % 17.1 14.6 20.7 21.8 25.8 100.0
1998 N 442 291 288 317 329 1,667 $ 1,095 874 1,238 1,342 1,592 6,141
% 26.5 17.4 17.3 19.0 19.7 100.0 % 17.8 14.2 20.2 21.9 25.9 100.0
1999 N 430 267 266 299 304 1,566 $ 1,052 795 1,127 1,248 1,464 5,686
% 27.5 17.0 17.0 19.1 19.4 100.0 % 18.5 14.0 19.8 22.0 25.7 100.0
2000 N 396 273 270 303 409 1,652 $ 974 828 1,160 1,277 1,794 6,033
% 24.0 16.5 16.3 18.4 24.8 100.0 % 16.1 13.7 19.2 21.2 29.7 100.0
Stafford Unsubsidized
1994 N 7 8 10 14 17 56 $ 20 23 36 50 112 240
% 13.1 13.6 17.9 25.6 29.9 100.0 % 8.2 9.4 14.9 20.9 46.7 100.0
1995 N 66 58 69 86 81 361 $ 179 171 249 309 572 1,479
% 18.2 16.2 19.2 24.0 22.5 100.0 % 12.1 11.6 16.8 20.9 38.7 100.0
1996 N 194 121 131 151 123 721 $ 551 361 487 569 906 2,875
% 26.9 16.8 18.2 21.0 17.0 100.0 % 19.2 12.6 17.0 19.8 31.5 100.0
1997 N 220 149 162 185 203 918 $ 635 451 614 710 1,207 3,617
% 24.0 16.2 17.6 20.1 22.1 100.0 % 17.5 12.5 17.0 19.6 33.4 100.0
1998 N 237 154 166 196 206 959 $ 685 466 628 750 1,259 3,787
% 24.7 16.1 17.3 20.4 21.5 100.0 % 18.1 12.3 16.6 19.8 33.2 100.0
1999 N 241 150 166 201 215 974 $ 688 455 635 790 1,288 3,855
% 24.8 15.4 17.0 20.7 22.1 100.0 % 17.8 11.8 16.5 20.5 33.4 100.0
2000 N 252 173 187 222 315 1,149 $ 723 530 745 898 1,512 4,408
% 21.9 15.0 16.3 19.4 27.4 100.0 % 16.4 12.0 16.9 20.4 34.3 100.0

Federal Student Loan Programs D
ata Book �
FY 1997-FY 2000I-15
Appendices
Table A-13. Federal Direct Loan Program (FDLP) number of borrowers and dollar amount of Stafford Subsidized, Stafford Unsubsidized, and Parent Loansfor Undergraduate Students (PLUS) loans, by academic level: FY 1994-FY 2000 (continued)
Loan type Number of borrowers (in 000’s) and percent of total Number of dollars (in 000,000’s) and percent of total
and fiscal year Freshman Sophomore Junior Senior Graduate Total1 Freshman Sophomore Junior Senior Graduate Total
PLUS loans
1994 N 7 3 2 2 — 15 $ 42 21 14 13 — 90
% 44.1 23.1 16.4 16.5 100.0 % 46.4 23.9 15.3 14.4 100.0
1995 N 41 19 13 10 — 83 $ 253 113 73 53 — 492
% 49.6 22.8 15.6 12.0 100.0 % 51.4 22.9 14.9 10.8 100.0
1996 N 76 36 24 18 — 154 $ 472 226 141 104 — 944
% 49.0 23.6 15.6 11.9 100.0 % 50.0 24.0 15.0 11.0 100.0
1997 N 76 40 29 20 — 165 $ 498 265 179 122 — 1,068
% 45.7 24.5 17.5 12.3 — 100.0 % 46.6 24.8 16.8 11.4 — 100.0
1998 N 78 42 32 25 — 176 $ 536 285 206 155 — 1,198
% 44.3 23.7 18.0 14.0 — 100.0 % 44.8 23.8 17.2 13.0 — 100.0
1999 N 76 39 30 25 — 170 $ 530 269 198 162 — 1,162
% 44.9 22.8 17.6 14.7 — 100.0 % 45.6 23.2 17.0 14.0 — 100.0
2000 N 87 45 34 28 — 194 $ 635 323 234 187 — 1,393
% 44.7 23.3 17.6 14.5 — 100.0 % 45.6 23.2 16.8 13.4 — 100.0
FDLP total2
1994 N 31 29 32 42 29 163 $ 112 113 159 213 317 915
% 19.0 17.8 19.6 25.8 17.8 100.0 % 12.3 12.4 17.4 23.3 34.7 100.0
1995 N 225 186 189 212 128 939 $ 811 717 974 1,124 1,475 5,102
% 24.0 19.8 20.1 22.6 13.6 100.0 % 15.9 14.1 19.1 22.0 28.9 100.0
1996 N 558 346 326 340 190 1,759 $ 2,063 1,383 1,745 1,904 2,277 9,372
% 31.7 19.7 18.5 19.3 10.8 100.0 % 22.0 14.8 18.6 20.3 24.3 100.0
1997 N 728 487 485 519 540 2,760 $ 2,199 1,625 2,086 2,188 2,814 10,918
% 26.4 17.6 17.6 18.8 19.6 100.0 % 20.1 14.9 19.1 20.0 25.8 100.0
1998 N 757 486 485 537 535 2,802 $ 2,316 1,625 2,071 2,248 2,850 11,125
% 27.0 17.4 17.3 19.2 19.1 100.0 % 20.8 14.6 18.6 20.2 25.6 99.9
1999 N 748 456 462 525 519 2,710 $ 2,270 1,520 1,959 2,200 2,752 10,703
% 27.6 16.8 17.0 19.4 19.2 100.0 % 21.2 14.2 18.3 20.6 25.7 100.0
2000 N 735 491 491 554 724 2,996 $ 2,332 1,681 2,139 2,362 3,306 11,833
% 24.5 16.4 16.4 18.5 24.2 100.0 % 19.7 14.2 18.1 20.0 27.9 99.9
— Graduate students are not eligible to receive PLUS loans.1 Total borrowers column may not equal totals provided in other tables. This column represents the sum of each distinct academic level reported for the borrower during the fiscal year. Since borrowers can change academic level over the fiscal year and they may change this at different
rates than other characteristics, the total borrower counts in tables that describe other characteristics will naturally be different. 2 This category provides an unduplicated borrower count for FY94-FY96. That is, borrowers with multiple loans are only counted once in the total. Consequently, the individual row items will not sum to the FDLP total for those years.
NOTES: Volume measure is Direct Loan commitments. Details may not add to totals due to rounding. Calculations are based on numbers before rounding. FDLP loan data in FY94 only include one-quarter of that fiscal year, and FDLP loans were restricted to a small number ofinstitutions. Corresponds to table 13.
SOURCE: U.S. Department of Education, Office of Postsecondary Education, Direct Loan/Loan Origination System (FY96 and earlier) and National Student Loan Data System (FY97-FY00).

I-16 Federal Student Loan Programs Data Book � FY 1997-FY 2000
Table A-15. Federal Family Education Loans (FFEL) program annual number of active lenders: FY 1966-FY 2000
Fiscal year Number of lenders Percent change from prior year
1966 1,488 —
1967 2,781 86.9
1968 3,861 38.8
1969 3,990 3.3
1970 4,054 1.6
1971 4,370 7.8
1972 4,506 3.1
1973 4,469 -0.8
1974 4,668 4.5
1975 4,812 3.1
1976 4,867 1.1
1977 5,456 12.1
1978 6,224 14.1
1979 7,687 23.5
1980 9,173 19.3
1981 10,301 12.3
1982 10,610 3.0
1983 10,835 2.1
1984 11,266 4.0
1985 11,298 0.3
1986 11,135 -1.4
1987 10,740 -3.5
1988 10,158 -5.4
1989 9,360 -7.9
1990 8,505 -9.1
1991 7,804 -8.2
1992 7,504 -3.8
1993 7,484 -0.3
1994 6,812 -9.0
1995 5,830 -14.4
1996 4,813 -17.4
1997 4,252 -11.7
1998 4,129 -2.9
1999 3,761 -8.9
2000 3,592 -4.5
— Not applicable.
NOTES: Some lenders reported loans under multiple numbers. In these instances lenders were counted more than once. These counts do not include lenders who participated exclusively under the FISLPwhich existed from FY68 through FY84. Corresponds to table 15.
SOURCE: U.S. Department of Education, Office of Postsecondary Education, National Student Loan Data System.
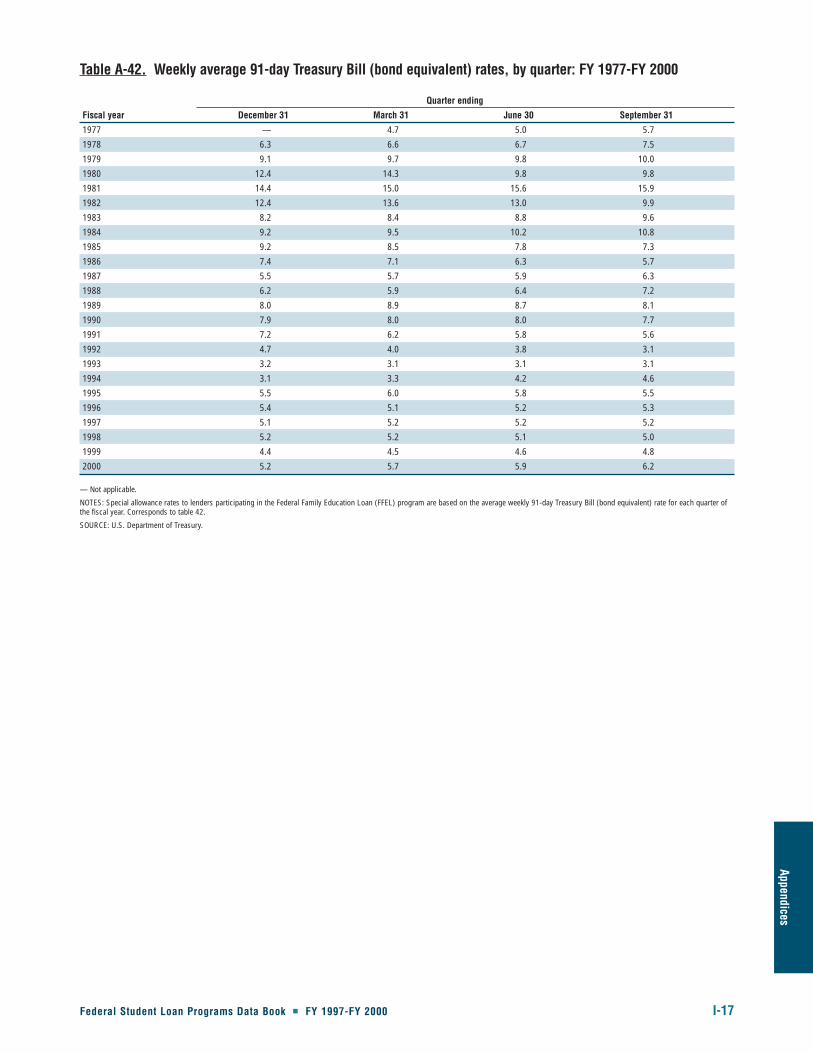
Federal Student Loan Programs Data Book � FY 1997-FY 2000 I-17
Appendices
Table A-42. Weekly average 91-day Treasury Bill (bond equivalent) rates, by quarter: FY 1977-FY 2000
Quarter ending
Fiscal year December 31 March 31 June 30 September 31
1977 — 4.7 5.0 5.7
1978 6.3 6.6 6.7 7.5
1979 9.1 9.7 9.8 10.0
1980 12.4 14.3 9.8 9.8
1981 14.4 15.0 15.6 15.9
1982 12.4 13.6 13.0 9.9
1983 8.2 8.4 8.8 9.6
1984 9.2 9.5 10.2 10.8
1985 9.2 8.5 7.8 7.3
1986 7.4 7.1 6.3 5.7
1987 5.5 5.7 5.9 6.3
1988 6.2 5.9 6.4 7.2
1989 8.0 8.9 8.7 8.1
1990 7.9 8.0 8.0 7.7
1991 7.2 6.2 5.8 5.6
1992 4.7 4.0 3.8 3.1
1993 3.2 3.1 3.1 3.1
1994 3.1 3.3 4.2 4.6
1995 5.5 6.0 5.8 5.5
1996 5.4 5.1 5.2 5.3
1997 5.1 5.2 5.2 5.2
1998 5.2 5.2 5.1 5.0
1999 4.4 4.5 4.6 4.8
2000 5.2 5.7 5.9 6.2
— Not applicable.
NOTES: Special allowance rates to lenders participating in the Federal Family Education Loan (FFEL) program are based on the average weekly 91-day Treasury Bill (bond equivalent) rate for each quarter ofthe fiscal year. Corresponds to table 42.
SOURCE: U.S. Department of Treasury.

I-18Federal Student Loan Program
s Data Book
�FY 1997-FY 2000
Table A-44. Federal Family Education Loan (FFEL) program estimated dollars outstanding, as of September 30th of each fiscal year, by loan program type:FY 1979-FY 2000
($ in 000,000’s)
FY79 FY80 FY81 FY82 FY83 FY84 FY85 FY86 FY87 FY88 FY89
Stafford Subsidized/FISLP
Dollars in school $5,867 $8,579 $13,819 $15,826 $17,444 $18,945 $20,352 $17,662 $17,842 $17,875 $18,173
Dollars in repayment 3,200 3,762 4,689 6,758 9,234 12,395 15,885 19,525 22,861 24,167 25,399
Dollars outstanding 9,067 12,341 18,508 22,584 26,678 31,340 36,237 37,187 40,703 42,042 43,572
Stafford Unsubsidized1
Dollars in school — — — — — — — — — — —
Dollars in repayment — — — — — — — — — — —
Dollars outstanding — — — — — — — — — — —
PLUS2
Dollars in repayment — — $28 $87 $211 $357 $530 $656 $822 $1,142 $1,572
Dollars outstanding — — 28 87 211 357 530 656 822 1,142 1,572
SLS3
Dollars in repayment — — — $29 $132 $290 $506 $707 $1,317 $2,813 $4,073
Dollars outstanding — — — 29 132 290 506 707 1,317 2,813 4,073
Consolidation4
Dollars in repayment — — — — — — — — $267 $892 $1,510
Dollars outstanding — — — — — — — — 267 892 1,510
FFEL program total
Dollars in school $5,867 $8,579 $13,819 $15,826 $17,444 $18,945 $20,352 $17,662 $17,842 $17,875 $18,173
Dollars in repayment 3,200 3,762 4,717 6,874 9,577 13,042 16,921 20,888 25,267 29,014 32,554
Dollars outstanding 9,067 12,341 18,536 22,700 27,021 31,987 37,273 38,550 43,109 46,889 50,727

Federal Student Loan Programs D
ata Book �
FY 1997-FY 2000I-19
Appendices
Table A-44. Federal Family Education Loan (FFEL) program estimated dollars outstanding, as of September 30th of each fiscal year, by loan program type:FY 1979-FY 2000 (continued)
($ in 000,000’s)
FY90 FY91 FY92 FY93 FY94 FY95 FY96 FY97 FY98 FY99 FY00
Stafford Subsidized/FISLP
Dollars in school $19,041 $18,500 $20,134 $22,200 $25,559 $27,916 $26,993 $26,521 $26,051 $26,030 $26,014
Dollars in repayment 26,388 28,479 28,495 29,743 32,038 32,753 35,093 37,401 39,901 41,563 43,709
Dollars outstanding 45,429 46,979 48,629 51,943 57,597 60,669 62,086 63,922 65,952 67,593 69,723
Stafford Unsubsidized1
Dollars in school — — — — $1,631 $7,898 $10,594 $12,876 $14,615 $16,309 $18,165
Dollars in repayment — — — — 106 1,011 3,423 6,681 10,714 14,582 18,931
Dollars outstanding — — — — 1,737 8,909 14,017 19,557 25,329 30,891 37,096
PLUS2
Dollars in repayment $2,037 $2,607 $3,269 $3,968 $4,434 $5,111 $5,632 $6,261 $6,974 $7,595 $8,447
Dollars outstanding 2,037 2,607 3,269 3,968 4,434 5,111 5,632 6,261 6,974 7,595 8,447
SLS3
Dollars in repayment $4,457 $4,684 $5,618 $7,141 $9,026 $7,400 $6,155 $5,149 $4,405 $3,564 $2,970
Dollars outstanding 4,457 4,684 5,618 7,141 9,026 7,400 6,155 5,149 4,405 3,564 2,970
Consolidation4
Dollars in repayment $2,203 $3,227 $4,484 $5,948 $7,178 $10,832 $14,546 $17,489 $19,700 $22,907 $28,348
Dollars outstanding 2,203 3,227 4,484 5,948 7,178 10,832 14,546 17,489 19,700 22,907 28,348
FFEL program total
Dollars in school $19,041 $18,500 $20,134 $22,200 $27,190 $35,814 $37,587 $39,397 $40,666 $42,339 $44,179
Dollars in repayment 35,085 38,997 41,866 46,800 52,782 57,107 64,849 72,981 81,694 90,211 102,405
Dollars outstanding 54,126 57,497 62,000 69,000 79,972 92,921 102,436 112,378 122,360 132,550 146,584
— Not applicable.1 The Stafford Unsubsidized program began in FY93.2 The Parent Loans for Undergraduate Students (PLUS) program began in FY81.3 The Supplemental Loan for Students (SLS) program began in FY81 and ended in FY94.4 Consolidation Loans started in FY87.
NOTES: Dollars in default are not included in the dollars outstanding. The Dollars in School category does not apply to PLUS, SLS, and Consolidation loans. This is because PLUS and SLS loans go into repayment on the date the loan is disbursed by the lender, and Consolidation occursonly after a borrower starts the repayment process. Details may not add to totals due to rounding. Calculations are based on numbers prior to rounding. Corresponds to table 44.
SOURCE: U.S. Department of Education, Office of Postsecondary Education, ED Form 799 and Office of Student Financial Assistance Programs.
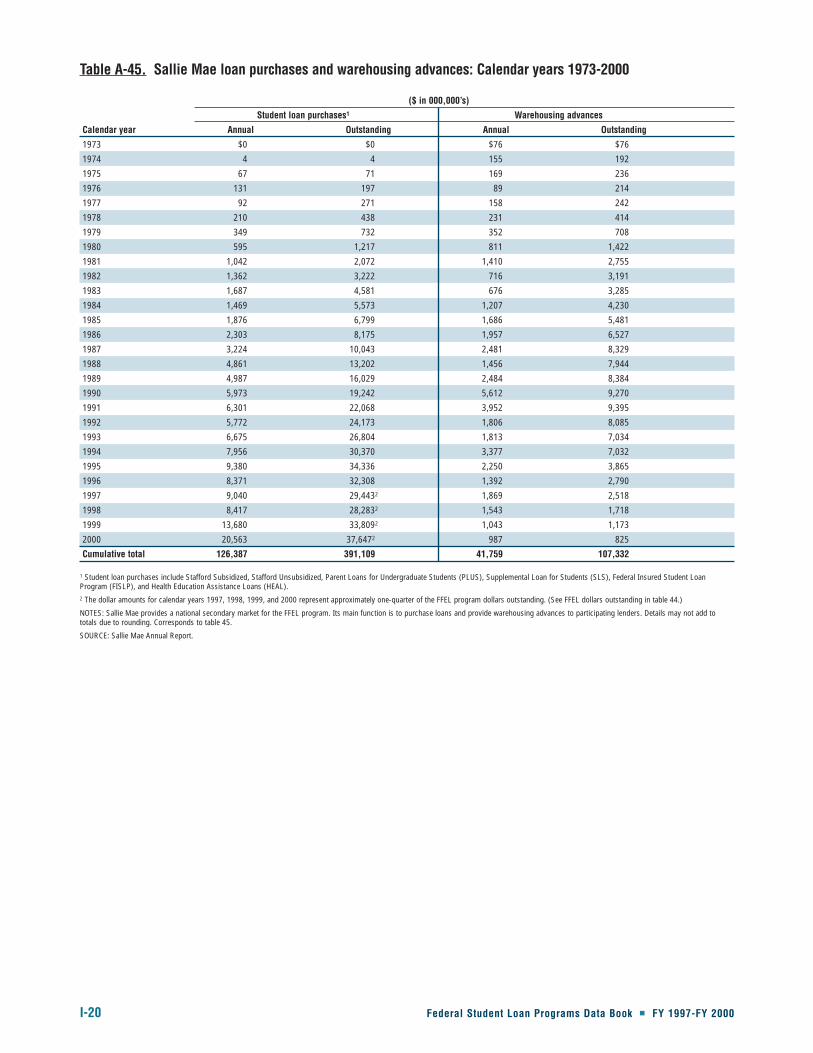
I-20 Federal Student Loan Programs Data Book � FY 1997-FY 2000
Table A-45. Sallie Mae loan purchases and warehousing advances: Calendar years 1973-2000
($ in 000,000’s)
Student loan purchases1 Warehousing advances
Calendar year Annual Outstanding Annual Outstanding
1973 $0 $0 $76 $76
1974 4 4 155 192
1975 67 71 169 236
1976 131 197 89 214
1977 92 271 158 242
1978 210 438 231 414
1979 349 732 352 708
1980 595 1,217 811 1,422
1981 1,042 2,072 1,410 2,755
1982 1,362 3,222 716 3,191
1983 1,687 4,581 676 3,285
1984 1,469 5,573 1,207 4,230
1985 1,876 6,799 1,686 5,481
1986 2,303 8,175 1,957 6,527
1987 3,224 10,043 2,481 8,329
1988 4,861 13,202 1,456 7,944
1989 4,987 16,029 2,484 8,384
1990 5,973 19,242 5,612 9,270
1991 6,301 22,068 3,952 9,395
1992 5,772 24,173 1,806 8,085
1993 6,675 26,804 1,813 7,034
1994 7,956 30,370 3,377 7,032
1995 9,380 34,336 2,250 3,865
1996 8,371 32,308 1,392 2,790
1997 9,040 29,4432 1,869 2,518
1998 8,417 28,2832 1,543 1,718
1999 13,680 33,8092 1,043 1,173
2000 20,563 37,6472 987 825
Cumulative total 126,387 391,109 41,759 107,332
1 Student loan purchases include Stafford Subsidized, Stafford Unsubsidized, Parent Loans for Undergraduate Students (PLUS), Supplemental Loan for Students (SLS), Federal Insured Student LoanProgram (FISLP), and Health Education Assistance Loans (HEAL).2 The dollar amounts for calendar years 1997, 1998, 1999, and 2000 represent approximately one-quarter of the FFEL program dollars outstanding. (See FFEL dollars outstanding in table 44.)
NOTES: Sallie Mae provides a national secondary market for the FFEL program. Its main function is to purchase loans and provide warehousing advances to participating lenders. Details may not add tototals due to rounding. Corresponds to table 45.
SOURCE: Sallie Mae Annual Report.

Federal Student Loan Programs Data Book � FY 1997-FY 2000 I-21
Appendices
Table A-49. Federal Family Education Loan (FFEL) program annual and cumulative default dollars andcollections: FY 1966-FY 2000
Default dollars Percent Percent share Annual Percent PercentCumulative dollars
paid to lenders change from of FFEL collections change from share of (in 000,000’s)
Fiscal year (in 000,000’s) from prior FY program totals (in 000,000’s) from prior FY totals Defaults Collections
FISLP1
1968 — — — — — — — —1969 $0 — 1.5 $0 — 11.8 $0 $0 1970 1 2,419.7 15.9 0 400.0 25.0 1 0 1971 7 542.4 34.3 0 100.0 21.1 8 0 1972 16 136.8 45.5 1 150.0 31.3 24 1 1973 31 96.4 46.4 3 400.0 56.8 55 3 1974 55 75.6 53.1 4 68.0 58.3 110 8 1975 72 29.9 51.2 8 81.0 54.5 182 15 1976 106 47.1 54.6 10 31.6 44.8 288 25 1977 117 10.5 57.7 10 -4.0 35.0 404 35 1978 104 -10.6 49.2 16 63.5 45.7 509 501979 101 -3.0 44.2 42 168.2 59.2 610 931980 106 5.2 44.5 43 1.2 59.5 716 1351981 88 -16.9 34.4 39 -8.5 52.1 805 1741982 72 -18.2 25.1 41 4.4 45.3 877 2151983 85 18.1 16.1 51 25.3 39.6 962 2661984 81 -4.8 11.4 63 23.5 34.0 1,044 3291985 73 -10.9 7.0 67 6.3 27.2 1,116 3961986 80 9.8 5.9 129 92.5 30.7 1,196 5251987 31 -60.7 2.3 123 -4.7 22.9 1,227 6481988 20 -35.3 1.4 97 -21.1 15.3 1,248 7451989 19 -7.2 0.9 83 -14.4 11.1 1,266 8281990 17 -7.5 0.6 70 -15.7 7.6 1,284 8981991 17 -1.3 0.5 55 -21.4 5.2 1,301 9531992 12 -32.2 0.4 55 0.0 4.0 1,313 1,0081993 9 -26.7 0.3 43 -22.3 2.9 1,321 1,0511994 7 -17.9 0.3 35 -18.1 1.8 1,328 1,0861995 4 -42.9 0.2 20 -42.9 0.9 1,332 1,1061996 1 -75.0 0.0 7 -65.0 0.3 1,333 1,113
Stafford Subsidized1966 — — — — — — — —1967 — — — — — — — —1968 $2 — 100.0 $0 — 100.0 $2 $01969 3 50.3 98.5 0 50.0 88.2 4 01970 6 109.0 84.1 0 100.0 75.0 10 11971 13 132.0 65.7 1 150.0 78.9 23 11972 19 48.3 54.5 1 46.7 68.8 42 21973 36 89.2 53.6 2 72.7 43.2 78 41974 49 34.6 46.9 3 57.9 41.7 127 71975 68 40.0 48.8 6 111.4 45.5 196 141976 88 28.6 45.4 12 94.0 55.2 283 261977 86 -2.7 42.3 18 44.9 65.0 369 441978 108 25.9 50.8 19 4.8 54.3 477 621979 128 18.5 55.8 29 55.4 40.8 604 911980 133 4.2 55.5 29 -0.2 40.5 737 1201981 168 26.7 65.6 36 23.8 47.9 906 1561982 216 28.2 74.9 49 37.2 54.7 1,122 2051983 444 105.6 83.7 78 58.1 60.4 1,566 2831984 627 41.3 88.1 122 57.2 66.0 2,193 4061985 950 51.4 92.1 179 46.2 72.6 3,143 5841986 1,262 32.9 92.9 289 61.8 68.8 4,405 8741987 1,295 2.6 95.9 410 41.7 76.3 5,700 1,2831988 1,378 6.4 94.8 531 29.4 83.5 7,078 1,8141989 1,675 21.6 82.2 650 22.5 86.9 8,753 2,4641990 1,952 16.5 72.8 807 24.0 87.8 10,705 3,2711991 2,436 24.8 75.6 916 13.6 86.2 13,141 4,1871992 2,032 -16.6 76.5 1,160 26.6 84.4 15,173 5,3471993 1,892 -6.9 75.8 1,271 9.6 85.0 17,065 6,6181994 1,756 -7.2 73.1 1,735 36.5 90.3 18,821 8,3531995 1,580 -10.0 68.9 2,088 20.3 89.8 20,401 10,4411996 1,723 9.0 64.7 2,452 17.5 88.5 22,123 12,8931997 1,734 0.7 58.0 2,044 -16.6 84.6 23,857 14,9371998 1,631 -5.9 55.4 2,534 24.0 82.7 25,489 17,47119996 1,079 -33.9 53.2 3,197 26.1 80.1 26,568 20,66820006 1,074 -0.5 51.1 3,615 13.1 76.3 27,642 24,284

I-22 Federal Student Loan Programs Data Book � FY 1997-FY 2000
Table A-49. Federal Family Education Loan (FFEL) program annual and cumulative default dollars andcollections: FY 1966-FY 2000 (continued)
Default dollars Percent Percent share Annual Percent PercentCumulative dollars
paid to lenders change from of FFEL collections change from share of (in 000,000’s)
Fiscal year (in 000,000’s) from prior FY program totals (in 000,000’s) from prior FY totals Defaults Collections
Stafford Unsubsidized2
1993 — — — — — — — -1994 $1 — 0.0 $0 — 0.0 $1 $01995 11 1,679.7 0.5 0 4,040.0 0.0 12 01996 95 742.1 3.6 4 884.8 0.1 107 51997 288 203.2 9.6 21 419.1 0.9 395 261998 423 47.0 14.4 65 206.7 2.1 818 9119996 377 -11.0 18.6 141 116.6 3.5 1,195 23120006 513 36.1 24.4 236 68.2 5.0 1,708 468
PLUS3
1981 — — — — — — — —1982 $0 — 0.0 — — — $0 —1983 0 613.1 0.1 $0 — 0.0 1 $01984 1 143.8 0.2 0 85.7 0.0 2 01985 3 146.3 0.3 0 301.0 0.1 5 01986 6 112.4 0.5 1 238.4 0.2 11 11987 7 11.7 0.5 2 93.6 0.3 18 31988 20 188.1 1.4 3 71.3 0.5 37 61989 32 62.1 1.6 5 56.5 0.6 70 101990 40 23.7 1.5 8 65.2 0.8 109 181991 67 69.6 2.1 13 73.9 1.2 177 311992 78 15.1 2.9 24 83.2 1.7 254 551993 89 15.2 3.6 35 45.6 2.3 344 901994 96 6.8 4.0 35 1.2 1.8 440 1251995 98 2.6 4.3 52 46.0 2.2 538 1771996 113 15.4 4.3 74 43.5 2.7 651 2511997 113 -0.1 3.8 86 15.4 3.5 764 3371998 101 -10.7 3.4 131 52.6 4.3 865 46719996 72 -28.5 3.6 143 9.4 3.6 937 61020006 66 -8.2 3.2 191 34.1 4.0 1,003 801
SLS4
1981 — — — — — — — —1982 — — — — — — — —1983 $0 — 0.0 $0 — 0.0 $0 $01984 2 646.3 0.3 0 558.6 0.0 2 01985 6 221.0 0.6 0 730.7 0.1 9 01986 10 58.1 0.7 1 332.9 0.3 19 21987 17 67.4 1.2 2 70.2 0.4 35 41988 35 107.9 2.4 5 123.1 0.8 70 91989 299 756.6 14.7 10 96.3 1.3 370 191990 636 112.5 23.7 33 225.7 3.6 1,005 521991 630 -0.9 19.6 75 129.3 7.1 1,636 1271992 441 -30.1 16.6 126 67.6 9.2 2,077 2541993 384 -12.9 15.4 131 3.7 8.7 2,461 3851994 374 -2.6 15.6 99 -24.4 5.1 2,835 4841995 383 2.4 16.7 135 36.8 5.8 3,218 6191996 387 1.0 14.5 195 44.1 7.0 3,605 8141997 317 -18.1 10.6 173 -11.5 7.1 3,922 9861998 237 -25.3 8.0 181 4.6 5.9 4,158 1,16719996 128 -46.0 6.3 198 9.7 5.0 4,286 1,36520006 91 -29.0 4.3 212 7.3 4.5 4,377 1,578
Consolidation5
1987 — — — — — — — —1988 $1 — 0.1 $0 — 0.0 $1 $01989 12 994.0 0.6 0 8,285.6 0.0 13 01990 35 199.6 1.3 1 500.4 0.1 48 11991 72 106.2 2.2 4 187.7 0.3 119 51992 93 29.6 3.5 9 149.2 0.7 212 141993 123 31.8 4.9 17 84.9 1.1 335 311994 169 37.8 7.0 17 4.4 0.9 504 481995 217 28.1 9.4 29 64.7 1.2 721 771996 343 58.4 12.9 39 36.1 1.4 1,064 1151997 538 56.8 18.0 92 135.6 3.8 1,602 2071998 551 2.5 18.7 153 67.5 5.0 2,153 36019996 372 -32.6 18.3 311 102.7 7.8 2,525 67120006 358 -3.6 17.1 485 55.8 10.2 2,884 1,156
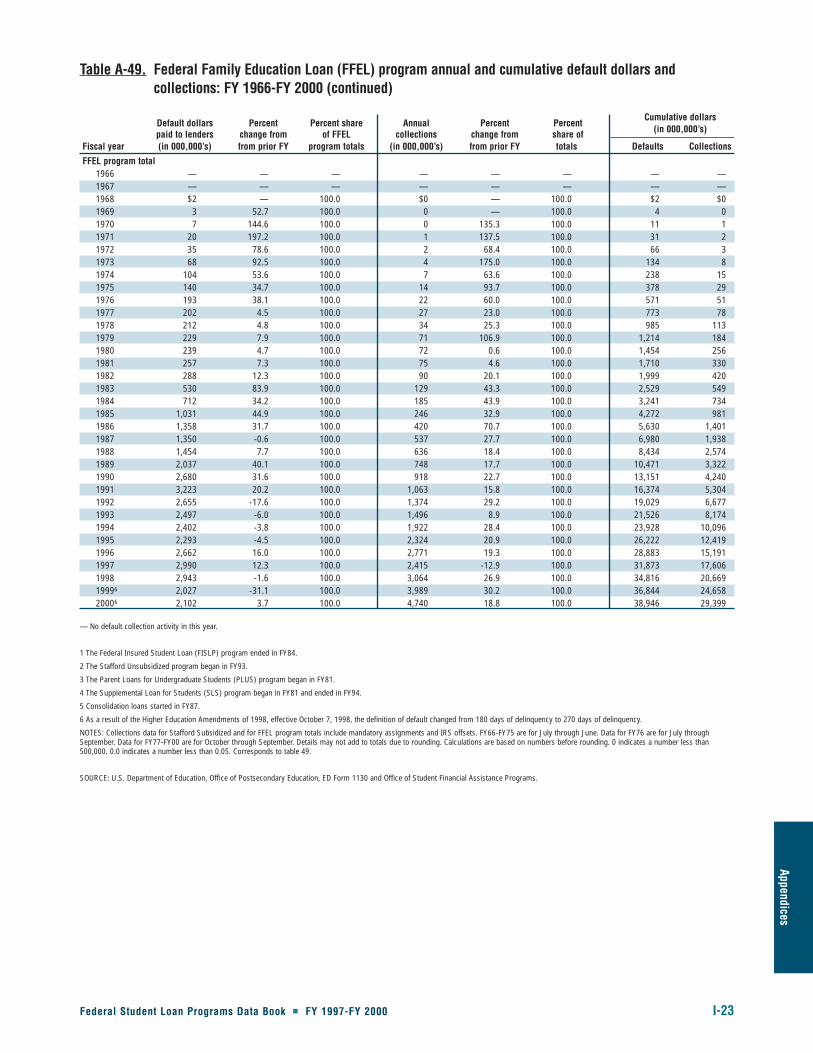
Federal Student Loan Programs Data Book � FY 1997-FY 2000 I-23
Appendices
Table A-49. Federal Family Education Loan (FFEL) program annual and cumulative default dollars andcollections: FY 1966-FY 2000 (continued)
Default dollars Percent Percent share Annual Percent PercentCumulative dollars
paid to lenders change from of FFEL collections change from share of (in 000,000’s)
Fiscal year (in 000,000’s) from prior FY program totals (in 000,000’s) from prior FY totals Defaults Collections
FFEL program total1966 — — — — — — — —1967 — — — — — — — —1968 $2 — 100.0 $0 — 100.0 $2 $01969 3 52.7 100.0 0 — 100.0 4 01970 7 144.6 100.0 0 135.3 100.0 11 11971 20 197.2 100.0 1 137.5 100.0 31 21972 35 78.6 100.0 2 68.4 100.0 66 31973 68 92.5 100.0 4 175.0 100.0 134 81974 104 53.6 100.0 7 63.6 100.0 238 151975 140 34.7 100.0 14 93.7 100.0 378 291976 193 38.1 100.0 22 60.0 100.0 571 511977 202 4.5 100.0 27 23.0 100.0 773 781978 212 4.8 100.0 34 25.3 100.0 985 1131979 229 7.9 100.0 71 106.9 100.0 1,214 1841980 239 4.7 100.0 72 0.6 100.0 1,454 2561981 257 7.3 100.0 75 4.6 100.0 1,710 3301982 288 12.3 100.0 90 20.1 100.0 1,999 4201983 530 83.9 100.0 129 43.3 100.0 2,529 5491984 712 34.2 100.0 185 43.9 100.0 3,241 7341985 1,031 44.9 100.0 246 32.9 100.0 4,272 9811986 1,358 31.7 100.0 420 70.7 100.0 5,630 1,4011987 1,350 -0.6 100.0 537 27.7 100.0 6,980 1,9381988 1,454 7.7 100.0 636 18.4 100.0 8,434 2,5741989 2,037 40.1 100.0 748 17.7 100.0 10,471 3,3221990 2,680 31.6 100.0 918 22.7 100.0 13,151 4,2401991 3,223 20.2 100.0 1,063 15.8 100.0 16,374 5,3041992 2,655 -17.6 100.0 1,374 29.2 100.0 19,029 6,6771993 2,497 -6.0 100.0 1,496 8.9 100.0 21,526 8,1741994 2,402 -3.8 100.0 1,922 28.4 100.0 23,928 10,0961995 2,293 -4.5 100.0 2,324 20.9 100.0 26,222 12,4191996 2,662 16.0 100.0 2,771 19.3 100.0 28,883 15,1911997 2,990 12.3 100.0 2,415 -12.9 100.0 31,873 17,6061998 2,943 -1.6 100.0 3,064 26.9 100.0 34,816 20,66919996 2,027 -31.1 100.0 3,989 30.2 100.0 36,844 24,65820006 2,102 3.7 100.0 4,740 18.8 100.0 38,946 29,399
— No default collection activity in this year.
1 The Federal Insured Student Loan (FISLP) program ended in FY84.
2 The Stafford Unsubsidized program began in FY93.
3 The Parent Loans for Undergraduate Students (PLUS) program began in FY81.
4 The Supplemental Loan for Students (SLS) program began in FY81 and ended in FY94.
5 Consolidation loans started in FY87.
6 As a result of the Higher Education Amendments of 1998, effective October 7, 1998, the definition of default changed from 180 days of delinquency to 270 days of delinquency.
NOTES: Collections data for Stafford Subsidized and for FFEL program totals include mandatory assignments and IRS offsets. FY66-FY75 are for July through June. Data for FY76 are for July throughSeptember. Data for FY77-FY00 are for October through September. Details may not add to totals due to rounding. Calculations are based on numbers before rounding. 0 indicates a number less than500,000. 0.0 indicates a number less than 0.05. Corresponds to table 49.
SOURCE: U.S. Department of Education, Office of Postsecondary Education, ED Form 1130 and Office of Student Financial Assistance Programs.

Appendices
Federal Student Loan Programs Data Book � FY 1997-FY 2000 II-1
Appendix IILegislative History

National Vocational Student Loan Insurance Act of 1965 – Pub. L. 89-287; October 22, 1965This legislation authorized a separate guaranteed student loan program for vocational students. This Act
was repealed by Pub. L. 90-575 (Higher Education Amendments of 1968); vocational students were then
made eligible under Pub. L. 89-329 (Higher Education Act of 1965).
Higher Education Act of 1965 – Pub. L. 89-329; November 8, 1965This is the authorizing legislation for the Guaranteed Student Loan (GSL) programs. Title IV, Part B of this
Act originally established a program of low-interest insured loans for students enrolled in institutions of
higher education and, with the repeal of Pub. L. 89-287 (National Vocational Student Loan Insurance Act
of 1965), in vocational and proprietary schools. Regarding the GSL programs, the purpose of this
legislation was:
� to encourage state and private nonprofit guaranty agencies to establish adequate loan insurance
programs;
� to provide a federal program of loan insurance for students not having reasonable access to state or
private nonprofit guaranty agencies; and
� to pay federal interest subsidies (i.e., interest benefits) on loans made under these programs, as well as on
loans made under direct state loan programs (i.e., non-insured loans made directly by a state agency).
Federal Claims Collection Act of 1966 – Pub. L. 89-508; July 19, 1966This Act provided for the collection and compromise of all claims of the United States, pursuant to
regulations and standards published by the General Accounting Office (GAO) and/or the head of each
executive-branch agency.
International Education Act of 1966 – Pub. L. 89-698; October 29, 1966Section 204 of this Act amended the GSL programs to allow students to obtain GSLs to attend foreign
institutions of higher education.
Higher Education Amendments of 1966 – Pub. L. 89-752; November 3, 1966
Section 11 of this Act established that the minimum federal advance to any guaranty agency for any fiscal
year, pursuant to §422(a) of Pub. L. 89-329, would be $25,000.
Section 12 of this Act authorized the government of the District of Columbia to establish a guaranty agency
and authorized appropriations for that purpose. The Commissioner of Education was also required to
conduct a study to determine ways of improving the GSL programs.
Economic Opportunity Amendments of 1966 – Pub. L. 89-794; November 8, 1966Section 1101(b) of this Act provided for deferment of repayment for full-time VISTA volunteers.
(Untitled) – Pub. L. 90-460; August 3, 1968Section 2 of this Act raised the maximum interest rate applicable to GSLs from 6 percent to 7 percent An
administrative cost allowance (maximum 1 percent) was also authorized when state usury laws did not
permit an interest rate of 7 percent Comparable changes were made to both Pub. L. 89-287 and Pub. L.89-329.
Public Laws Listed Chronologically By Date of Enactment
Federal Student Loan Programs Data Book � FY 1997-FY 2000 II-3
Appendices

II-4 Federal Student Loan Programs Data Book � FY 1997-FY 2000
Section 3 provided for federal reinsurance of loans guaranteed by state or private nonprofit guaranty
agencies. Reimbursement was 80% of the principal amount of losses incurred by the agencies in paying
default/death/disability claims to lenders.
Higher Education Amendments of 1968 – Pub. L. 90-575; October 16, 1968Highlights from this Act include:
� The GSL programs were extended through 1971.
� The 3% interest subsidy paid during the repayment period was eliminated.
� Provided for federal payment and discharge of borrower debts on death/disability claims.
� Repealed Pub. L. 89-287 and also permitted the Commissioner of Education to make direct loans to
vocational students.
� Eliminated the 1- percent administrative allowance (authorized by Pub. L. 90-460) and provided for a
permanent override of state usuary laws.
� Authorized $12.5 million in new federal advance funds for guaranty agencies (§422(a) of
Pub. L. 89-329)
� Required guaranty agencies to authorize deferments for full-time study, VISTA/peace corps service and
service in the armed forces.
� Annual/aggregate loan amounts under guaranty agency programs were made comparable to the Federal
Insured Student Loan Program (FISLP).
� The definition of “eligible lender” was expanded to include pension funds; credit unions could invest a
larger percentage of assets in GSLs.
� The Commissioner was authorized to insure loans made by lenders in guaranty agency states for
borrowers not meeting an agency’s residency requirements, and was also authorized to provide federal
insurance to lenders operating on an interstate basis.
� A minimum annual repayment amount of $360 was established for borrowers.
� Section 461(a) of this Act amended the definition of “state” to include the Trust Territories of
the Pacific.
Emergency Insured Student Loan Act of 1969 – Pub. L. 91-95; October 22, 1969This law, originally a separate Act that did not amend Pub. L. 89-329, created a special allowance payment
to lenders; the maximum special allowance was set at 3 percent. Pub. L. 94-482 (Education Amendments
of 1976) subsequently repealed this Act and incorporated the special allowance provisions (somewhat
revised) into Pub. L. 89-329.
This Act also required the Secretary of HEW to conduct a study to determine if there were any practices of
lending institutions that discriminated against particular classes or categories of students. The report was
to be submitted to the Congress prior to March 1, 1970.
Fair Credit Reporting Act – Pub. L. 91-508; October 26, 1970This Act (Title VI of the Consumer Credit Protection Act of 1968) became effective on April 25, 1971, and
was the first federal “regulation” of the consumer reporting industry (i.e., credit bureaus, investigative
reporting agencies and other organizations that gather and report information about consumers).
Comprehensive Health Manpower Training Act of 1971 – Pub. L. 92-157; November 18, 1971Section 105(b) of this Act amended §741(f) of the Public Health Service Act to provide for repayment of
educational loans by the Secretary of HEW for service of at least two years in areas having shortages of, and
need for, personnel trained in certain professions (medicine, osteopathy, dentistry, veterinary medicine,
optometry, pharmacy or podiatry).
Appendices
Federal Student Loan Programs Data Book � FY 1997-FY 2000 II-5
Nurse Training Act of 1971 – Pub. L. 92-158; November 18, 1971Section 6(b) of this Act amended the Public Health Service Act to provide for repayment of educational
loans (costs of nurse training) by the Secretary of HEW for service of at least two years in areas having
shortages of, and need for, nurses.
Education Amendments of 1972 – Pub. L. 92-318; June 23, 1972Highlights of this Act include:
� Extended the GSLP through June 30, 1975.
� Increased annual amounts for all students to $2,500 and aggregate amounts for graduate/professional
students to $10,000.
� Required “need analysis” for determining eligibility for interest benefits.
� Required that the borrower sign an affidavit stating that the loan proceeds would be used only for
educational purposes (“Statement of Educational Purpose”).
� Increased FISLP insurance coverage to 100% of principal and interest, and pledged the full faith and
credit of the U.S. to the payment of FISLP claims.
� Created the Student Loan Marketing Association (Sallie Mae or SLMA).
� Authorized the Commissioner to publish a list of state agencies determined to be reliable authorities as
to the quality of public vocational schools.
Joint Resolution – Pub. L. 92-391; August 19, 1972This Act suspended until March 1, 1973, all provisions of Pub. L. 92-318 except the extension of the GSLP,
the creation of Sallie Mae, and the student affidavit requirement.
Domestic Volunteer Service Act of 1973 – Pub. L. 93-113; October 1, 1973This Act repealed Title VIII of the Economic Opportunity Act of 1964, which had authorized GSLP
deferments, and substituted a deferment provision for full-time volunteers in the ACTION programs
authorized by Title I of this Act.
(Untitled) – Pub. L. 93-269; April 18, 1974This Act revised the requirements for determining eligibility for interest benefits and extended
Pub. L. 91-95 through June 30, 1975.
Education Amendments of 1974 – Pub. L. 93-380; August 21, 1974This Act contained amendments relating to the Office of Education’s regional offices, the General
Education Provisions Act (GEPA), and the transmittal of rules/regulations to the Congress (known as the
“Buckley Amendment”).
Equal Credit Opportunity Act – Pub. L. 93-495; October 28, 1974This Act restricted the conditions under which a lender can request information about marital status and
obtain the signature and income information of a spouse as part of a loan application. Regulation B,
published in the Federal Register on October 22, 1975, implemented this Act. The GSLP was deemed
exempt from these provisions during periods in which the adjusted family income of the borrower and
family was used to determine eligibility for interest benefits.
Privacy Act of 1974 – Pub. L. 93-579; December 31, 1974This Act provided for the safeguard of individual records, and the access to such records, that are
maintained by federal agencies.

II-6 Federal Student Loan Programs Data Book � FY 1997-FY 2000
Emergency Technical Provisions Act of 1976 – Pub. L. 94-328; June 30, 1976This Act extended the authority for lenders to make insured loans and for the special allowance rates to be
set through the “transition quarter” ending September 30, 1976. This “transition quarter” was the quarter
that bridged the old federal fiscal year (July 1 - June 30) and the new one (October 1 - September 30).
Education Amendments of 1976 – Pub. L. 94-482; October 12, 1976This Act extended the GSLP though June 30, 1981, and totally rewrote the authorizing legislation for the
first time since the enactment of Pub. L. 89-329.
Technical and Miscellaneous Amendments – Pub. L. 95-43; June 15, 1977Most amendments made by this Act dealt with changes effected by Pub. L. 94-482 and to guaranty agency
programs. This Act also amended the formula for special allowance (SA) to calculate SA on the “average
unpaid balance of principal” rather than on the “unpaid balance of disbursed principal.” The existing
practice of dividing the “annual” special allowance rate by four (to obtain a “quarterly rate”) was added to
the statutory formula.
Fair Debt Collection Practices Act – Pub. L. 95-109; September 20, 1977This Act is to ensure fair treatment by debt collectors and to prohibit abusive and deceptive collection
practices. Pub. L. 99-361 was amended to include attorneys, collecting on behalf of and in the name of
creditors, as “debt collectors.”
(Untitled) – Pub. L. 95-180; November 15, 1977This Act amended the definition of “state” (§1201(b) of Pub. L. 89-329) was amended to include the
Northern Mariana Islands.
Education Amendments of 1978 – Pub. L. 95-561; November 1, 1978Section 1322 of this Act amended the effective date of §422(c) [“1976 advance funds” to “new” guaranty
agencies] to be October 1, 1976 rather than October 1, 1977 (as originally enacted by Pub. L. 94-482). This
was enacted to permit the Higher Education Assistance Foundation (HEAF) to qualify as a “new” guaranty
agency.
Middle Income Student Assistance Act – Pub. L. 95-566; November 1, 1978This Act eliminated the “adjusted family income” ceiling for determining eligibility for interest benefits. A
new deferment was authorized for borrowers in rehabilitation training programs.
Uniform Law on the Subject of Bankruptcy – Pub. L. 95-598; November 1, 1978Section 317 of this Act repealed section 439A of Pub. L. 89-329 that had been enacted by Pub. L. 94-482and had provided for the non-dischargeability of student loans through the first five years of repayment.
The repeal was effective on the date of enactment of this Act.
Section 523 of this Act established a new student loan provision (effective October 1, 1979) that was
generally comparable to the repealed section 439A, but applied only to loans held by governmental units
and institutions of higher education. As such, it did not apply to loans held by commercial lenders, Sallie
Mae, proprietary schools, or private non-profit guaranty agencies.
Right to Financial Privacy Act of 1978 – Pub. L. 95-630; November 10, 1978This Act governs financial institutions that provide federal agencies or their agents with access to, or
information contained in, the financial records of a customer. It does not govern disclosures and access
provided to non-federal organizations such as guaranty agencies.

Appendices
Federal Student Loan Programs Data Book � FY 1997-FY 2000 II-7
Higher Education Technical Amendments of 1979 – Pub. L. 96-49; August 13, 1979This Act removed the 5 percent ceiling on the special allowance rate, effective as of the quarter ending
September 30, 1979; the special allowance formula was amended; and Section 428(a) of Pub. L. 89-329 was
amended to provide for a special multiple installment agreement.
(Untitled) – Pub. L. 96-56; August 14, 1979This Act amended the Bankruptcy Act to include the provisions of section 439A that had been repealed by
section 317 of Pub. L. 95-598, effective through October 1, 1979. The Bankruptcy Act was amended,
effective October 1, 1979, to apply these provisions to a larger group of student loans, including all GSLs,
NDSLs, and Health Education Assistance Loans (HEALs).
Department of Education Organization Act – Pub. L. 96-88; October 17, 1979This Act established the cabinet-level Department of Education, under which the federal student assistance
programs formerly were administered by the U.S. Office of Education.
Department of Defense Authorization Act, 1981 – Pub. L. 96-342; September 8, 1980Section 902 of this Act provided for the Armed Forces Repayment Program, under which the Secretary of
Defense is authorized to repay GSLs and NDSLs on the basis of criteria established by the Defense
Department.
Education Amendments of 1980 – Pub. L. 96-374; October 3, 1980This Act made numerous changes to the GSL programs covering:
� Annual/aggregate loan amounts.
� Interest rates.
� Special allowance payments to tax-exempt authorities.
� New deferments for Public Health Service, service with a tax-exempt organization, internship
programs, and temporary, total disability.
� A six-month grace period, for 8 percent and 9 percent GSLs, and a post-deferment grace period.
� Amendments to the Administrative Cost Allowance (ACA) spending minimums and definitions.
� Establishment of the Parent Loans for Undergraduate Students (PLUS) program.
� Changes to the Sallie Mae warehousing and financing authority and Sallie Mae’s authority to make
Consolidation Loans.
� New definitions of “independent student,”“allowable cost of attendance,” and “student eligibility” for all
Title IV programs.
Omnibus Reconciliation Act of 1980 – Pub. L. 96-499; December 5, 1980Section 302 of this Act amended §6103(m) of the Internal Revenue Code of 1954 to provide for the
disclosure of mailing addresses of defaulted student loan borrowers by the Secretary to employees/agents
of the Department of Education, guaranty agencies, and schools for the purpose of locating such borrowers
and collecting defaulted loans.
Omnibus Budget Reconciliation Act of 1981 (including the Postsecondary Student AssistanceAmendments of 1981) – Pub. L. 97-35; August 13, 1981
The Postsecondary Student Assistance Amendments of 1981 (part of Pub. L. 97-35) made additional
changes to the GSL programs, including:
� Reinstatement of need analysis criteria for eligibility for interest benefits.
� Revisions to the definitions of “estimated cost of attendance” and “estimated financial assistance” (to

II-8 Federal Student Loan Programs Data Book � FY 1997-FY 2000
include Veterans and Social Security educational benefits).
� Elimination of “rounding” of special allowance rate and payment of special allowance on non-
subsidized loans.
� Implementation of the loan origination fee.
� Repeal of the post-deferment grace period.
� Increase of the minimum annual repayment amount from $360 to $600.
� Repeal of the increased loan amounts for independent undergraduate students (GSL).
� Increased PLUS interest rate.
� Expanded eligibility under the PLUS program to include independent undergraduate students and
graduate/professional students.
Department of Defense Authorization Act – Pub. L. 97-252; September 1982Section 1113(a) of this Act amended the Military Selective Service Act. Effective for periods of instruction
beginning on/after June 30, 1983, any student who is subject to Selective Service registration and has not
done so is ineligible to receive any Title IV student assistance.
Student Financial Assistance Technical Amendments Act of 1982 – Pub. L. 97-301; October 13, 1982Section 9 of this Act dealt with the 1983-84 GSL Family Contribution Schedule (FCS). Section 13(a)
amended §433A of Pub. L. 89-329 to require a number of new disclosures prior to the start of the
repayment period. Section 14(b) extended the authority of Sallie Mae to make Consolidation loans (until
August 1, 1983).
Garn-St. Germain Depository Institutions Act of 1982 – Pub. L. 97-320; October 15, 1982Section 701 of this Act amended §104 of the Truth-in-Lending Act to exempt GSLs and NDSLs from the
requirements of Regulation Z and from the disclosure requirements of any state law. These amendments
were made retroactive and applied to all GSLs.
Debt Collection Act of 1982 – Pub. L. 97-365; October 25, 1982This Act amended the Privacy Act (Pub. L. 93-579) and the Federal Claims Collection Act of 1966 (Pub.L. 89-508) to require that agencies administering certain federal loan programs to provide for a taxpayer’s
identification number. It also provided several procedures for the collection of debts owed to the federal
government, including salary offsets for federal employees.
Student Loan Consolidation and Technical Amendments Act of 1983 – Pub. L. 98-79; August 15, 1983This Act made several significant changes, including:
� Revised loan disclosure requirements.
� Extended the authority of Sallie Mae to make Consolidation loans until November 1, 1983.
� Technical changes to the Administrative Cost Allowance (ACA) and interest rate provisions.
� Added “non-discrimination” language.
� Clarified when the repayment period begins (loans carrying a six-month grace period).
� Amended Pub. L. 97-301 to require that the 1984-85 and 1985-86 GSL Family Contribution Schedules
(FCS) be the same as the 1982-83 FCS, except for updating for “the most recent and relevant data.”
� Established restrictions on special allowance payments to tax-exempt authorities and required those
entities to submit Plans for Doing Business to the Department of Education.
Appendices
Federal Student Loan Programs Data Book � FY 1997-FY 2000 II-9
Deficit Reduction Act of 1984 – Pub. L. 98-369; July 18, 1984Certain provisions of this Act affected tax-exempt bonds and the funding of student loans, particularly by
the establishment of a state-wide cap for student loans and industrial revenue bonds. A study of tax-exempt
funding of student loans and a review of IRS regulations on tax-exempt funding was mandated. Section
2653(c) of this Act provided for the IRS offset program through 1/1/88.
Single Audit Act of 1984 – Pub. L. 98-502; October 19, 1984This Act provided for uniform requirements for audits of federal financial assistance provided to state and
local governments. It was, among other things, meant to ensure that federal departments rely on audit work
done by other state and federal agencies, such as the General Accounting Office (GAO).
Education Amendments of 1984 – Pub. L. 98-511; October 19, 1984This Act amended Pub. L. 97-301 to continue the GSL Family Contribution Schedule (FCS) in essentially
the same form through the 1986-87 academic year. The Act also extended, through 1986-87, the
independent student criteria and separate need analysis systems for the Campus-based programs.
Department of Defense Authorization Act, 1986 – Pub. L. 99-145; November 11, 1985This Act made permanent the Armed Forces Loan Repayment Program enacted by Pub. L. 96-342.
Balanced Budget and Emergency Deficit Control Act of 1985 – Pub. L. 99-177; December 12, 1985This Act, relating to the federal debt ceiling limit, is known as the “Gramm-Rudman-Hollings” balanced
budget amendment. When automatic spending cuts are mandated by the President, via a sequestration
order, the GSL programs are affected by a reduction in special allowance rates and an increased loan
origination fee.
Compact of Free Association – Pub. L. 99-239; January 14, 1986This Act provided for the implementation of compacts to establish the governments of Palau, the Marshall
Islands and the Federated States of Micronesia, formerly known as the Trust Territories of the Pacific
Islands). As new entities under those compacts, they would no longer be subject to the laws of the United
States and, with certain exceptions, their citizens would no longer be eligible for federal student assistance.
Consolidated Omnibus Budget Reconciliation Act of 1985 – Pub. L. 99-272; April 7, 1986This Act extended the GSL programs through September 30, 1988 and made a number of changes to the
Title IV programs.
Student Financial Assistance Technical Corrections Act of 1986 – Pub. L. 99-320; May 23, 1986This Act made corrections to Pub. L. 99-272:
� Amended the effective date for ineligibility for the Title IV programs due to default on student loans.
� Amended the effective date for the requirement that loan checks be sent directly to schools.
� Provided that guaranty agencies can be reimbursed for Supplemental Preclaims Assistance costs
through reinsurance payments.
Higher Education Amendments of 1986 – Pub. L. 99-498; October 17, 1986This Act, known as “Reauthorization,” extended the Title IV programs through 1991, and made numerous
major changes to those programs.
II-10 Federal Student Loan Programs Data Book � FY 1997-FY 2000
Immigration Reform and Control Act of 1986 – Pub. L. 99-603; November 6, 1986This Act established rules for the eligibility for federal programs of financial assistance of aliens granted
temporary resident status.
Higher Education Technical Amendments Act of 1987 – Pub. L. 100-50; June 3, 1987This Act made several additional changes to the Title IV programs that were considered as if enacted as part
of Pub. L. 99-498.
Balanced Budget and Emergency Deficit Control Reaffirmation Act of 1987 – Pub. L. 100-119;September 29, 1987
In part, this Act reinstated the provisions of §256(c) of Pub. L. 99-177. The Presidential sequestration
order was issued, effective October 20, 1987, to affect special allowance payments and origination fees.
Omnibus Budget Reconciliation Act of 1987 – Pub. L. 100-203; December 22, 1987This Act achieved the deficit reductions mandated by Pub. L. 100-119 and rescinded the initial
sequestration order of October 20, 1987. §428(k) of Pub. L. 89-329 was amended to require guaranty
agencies to provide schools, upon request, information about former students who have defaulted.
Authority for the federal tax offset program, authorized by §2653 of Pub. L. 98-369, was extended through
7/1/88.
Augustus F. Hawkins-Robert T. Stafford Elementary and Secondary School Improvement Amendmentsof 1988 – Pub. L. 100-297; April 28, 1988
Effective July 1, 1988, §2601 of this Act renamed the programs authorized under Title IV, Part B of Pub. L.89-329 as the “Robert T. Stafford Loan Program.”
NOTE: Initially, after discussions with congressional staff, the decision was made to refer to these programs collectively as the “Part B
Programs” and to refer to the “Guaranteed Student Loan Program” and “Guaranteed Student Loans” as the “Stafford Loan Program”
and “Stafford Loans” respectively, with the other programs (FISLP, Consolidation, PLUS and SLS) continuing to be referred to by their
individual names. Later, the decision was made to use “Guaranteed Student Loan programs” as the “umbrella” term for the Title IV,
Part B programs and to use the terms “Stafford,”“FISLP,”“Consolidation,”“PLUS,” and “SLS” for the individual programs.
(Untitled) – Pub. L. 100-369; July 18, 1988This Act made several changes:
� Multiple disbursement of SLS loans according to the same requirements in effect for Stafford loans.
� A determination of need for and application for a Stafford loan prior to application for an SLS.
� The internship/residency deferment, implemented by Pub.L. 100-50, was made applicable to all
Stafford and SLS borrowers.
Departments of Labor, Health and Human Services, and Education, and Related AgenciesAppropriations Act, 1989 – Pub. L. 100-436; September 20, 1988
This appropriations bill also affected §§479A, 411F (professional judgment), and 484 (student eligibility)
of Pub. L. 89-329.
Welfare Reform Act – Pub. L. 100-485; October 13, 1988Title VII, §701(a) of this Act amended §2653(c) of Pub. L. 98-369 to extend the authority for the IRS offset
through 1/10/94.

Appendices
Federal Student Loan Programs Data Book � FY 1997-FY 2000 II-11
Technical and Miscellaneous Revenue Act of 1988 – Pub. L. 100-647; November 10, 1988This Act provided for the following:
� A College Savings Plan; interest on U.S. Savings Bonds would be tax-free if the bonds are used to pay
for college.
� The Treasury Department is required to issue regulations that again include special allowances in the
profit calculations of tax-exempt bondholders.
� Graduate students who get tuition benefits for teaching can exclude, for IRS purposes, the tuition
reduction that represents the value of the services performed.
Omnibus Drug Initiative Act of 1988 – Pub. L. 100-690; November 18, 1988This Act, in part (Title IV-D, the “Drug-free Workplace Act”), curtails student aid eligibility for certain
individuals convicted of drug related crimes.
Departments of Labor, Health and Human Services, and Education, and Related AgenciesAppropriations Act, 1990 – Pub. L. 101-166; November 21, 1989
This Act affected the following:
� Pro rata refunds at high default schools.
� Professional judgment, less-than-half-time students and maximum awards under the Pell Grant
Program.
Drug Free Schools and Communities Act Amendments of 1989 – Pub. L. 101-226; December 12, 1989Section 22 of this Act requires each institution of higher education to sign a certification by October 1, 1990
that it has adopted and implemented a program to prevent the illicit use of drugs and the abuse of alcohol
by its students and employees. A biennial review of its program is also required by each institution.
Omnibus Budget Reconciliation Act of 1989 – Pub. L. 101-239; December 19, 1989This Act affected the following general areas:
� Aid administrator discretion (§479A of Pub. L. 89-329) and institutional eligibility as affected by loss
of accreditation.
� Ability-to-benefit students under most Title IV programs.
� The Special Payoff and Loan Rehabilitation programs.
� §11002(b)(2) affected the sequestration order issued by the President on October 16, 1989.
� Deferment and loan eligibility under the Guaranteed Student Loan and Perkins Loan programs during
medical internships/residencies.
� Forbearances for medical and dental internships/residencies.
� Restricted SLS eligibility for students at high default schools.
� Changes affecting SLS annual loan limits.
� Revisions to the multiple disbursement requirements and other disbursement/endorsement
requirements for Stafford and SLS loans, including new overaward provisions.
� GED requirement for SLS borrowers admitted under ability-to-benefit provisions.
Omnibus Budget Reconciliation Act of 1990 – Pub. L. 101-508; November 5, 1990This Act affected the following general areas:
� Requirement that students admitted on the basis of ability-to-benefit pass as independently
administered examination approved by the Secretary.

II-12 Federal Student Loan Programs Data Book � FY 1997-FY 2000
� Provision for institutions to refuse to provide loan certification or to reduce the determination of need.
� Requirement that guaranty agencies provide preclaims and supplemental preclaims assistance (SPA)
and revision to the SPA payment.
� Revision to the minimum period requirement for SLS annual loan amounts.
� Expansion of the delayed delivery requirement to apply to Stafford and SLS loans and other revisions.
� Ineligibility of institutions whose cohort default rates exceed certain thresholds.
� Amendments to the Bankruptcy Law, exempting certain actions from the automatic stay provisions and
including Chapter 13 bankruptcies as non-dischargeable.
National Defense Authorization Act for Fiscal Year 1991 – Pub. L. 101-510; November 5, 1990§1206(b) of this Act provides, with certain restrictions, a program under which federal agencies are
permitted to repay student loans of employees in order to recruit or retain highly qualified professional,
technical or administrative personnel. The Office of Personnel Management (OPM) is responsible for
issuing regulations to implement this program.
Departments of Labor, Health and Human Services, and Education, and Related AgenciesAppropriations Act, 1991 – Pub. L. 101-517; November 5, 1990
The provisions of this Act related to student assistance affected special conditions provisions (§479A of the
Higher Education Act of 1965, as amended) and the Pell Grant Program.
Student Right-to-Know and Campus Security Act – Pub. L. 101-542; November 8, 1990This statute suspended the provisions set forth in 33 CFR 668.44(c) -(f) [consumer disclosures] but did
not affect the additional statutory requirement found in §487(a)(8) of the Higher Education Act of 1965,
as amended.
National and Community Service Act of 1990 – Pub. L. 101-610; November 16, 1990This Act affected the information* dissemination and exit counseling information activities of schools,
found in §§485(a) and (b) of the Higher Education Act of 1965, as amended, and information contained
in departmental publications and the National Student Loan Data Base, found in §§485(d) and 485B(a) of
the Higher Education Act of 1965, as amended.
* Deferments (GSL and Perkins programs) and partial cancellations (Perkins) for service in the Peace Corps, the ACTION Programs
and tax-exempt organizations.
Crime Control Act of 1990 – Pub. L. 101-647; November 29, 1990This statute further modified the Bankruptcy Code to extend the “five-year” period of non-dischargeability
to seven years and, in addition to Title IV student loans, to include obligations to repay educational benefits
provided by a governmental unit or under a program funded by a governmental unit or non-profit
institution.
Higher Education Technical Amendments of 1991 – Pub. L. 102-26; April 9, 1991This Act affected Title IV applicants and recipients, who were Reservists of an Armed Force called to active
duty for service in connection with Operation Desert Shield or Operation Desert Storm, relating to (a)
tuition refunds/credits, (b) need analysis, (c) military deferment eligibility, (d) a post-deferment grace
period after a military or in-school deferment, and (e) general administrative requirements related to the
GSL and Perkins (including Direct and Defense loans) programs.
This Act also contained provisions not related to Operation Desert Shield or Operation Desert Storm that
affected (a) need analysis for Puerto Rico residents, (b) the elimination of the statute of limitations
Appendices
Federal Student Loan Programs Data Book � FY 1997-FY 2000 II-13
provisions, and (c) the authority of institutions to refuse to certify GSL programs loan applications or to
certify applications for lesser amounts.
Emergency Unemployment Compensation Act of 1991 – Pub. L. 102-164; November 15, 1991§401 of this Act amended §2653(c) of the Deficit Reduction Act of 1984 (Pub. L. 98-369) to make the IRS
offset program permanent, effective 10/1/91.
Higher Education Amendments of 1992 – Pub. L. 102-325; July 23, 1992This Act, known as “Reauthorization,” extended the Title IV programs through FY 1998 and made
numerous major changes to those programs.
Health Professions Education Extension Amendments of 1992 – Pub. L. 102-408; October 13. 1992§306 of this Act amended §428C of Higher Education Act of 1965 to include HEAL Program loans as part
of eligible loans that may be included in a Federal Consolidation Loan.
Omnibus Budget Reconciliation Act of 1993 – Pub. L. 103-66; August 10, 1993Chapters 1 (Federal Direct Student Loan Program) and 2 (Conforming Amendments) of Subtitle A of Title
IV of this Act are known as the “Student Loan Reform Act of 1993.”
National and Community Service Trust Act of 1993 – Pub. L. 103-82; September 21, 1993In part, this Act establishes the Corporation for National Service by combining the existing ACTION
programs and the Commission on National and Community Service. Provisions include the acceleration
of the implementation of the Federal Stafford Loan Forgiveness program.
Higher Education Technical Amendments of 1993 – Pub. L. 103-208; December 20, 1993§2(c) of this Act made a number of “technical” corrections and revisions to Title IV, Part B of the Higher
Education Act of 1965. §5(a) of this Act specified that those amendments were effective as if they had been
included in Pub. L. 102-325, unless otherwise specified in §5(b).
(Untitled) – Pub. L. 103-235; April 28, 1994Extension (from 7/1/94 to 7/1/98) of the exemption of Historically Black Colleges and Universities
(HBCU) from the default rate criteria (§435(a)(2)(C) of the Act).
Improving America’s Schools Act of 1994 – Pub. L. 103-382; October 20, 1994§355 of this Act provided that guaranty agency reinsurance “trigger” calculations will now exclude lender-
of-last-resort loans; §356 specified that loans made under the Nursing Student Loan Program (subpart
II of part B of title VIII of the Public Health Service Act) may be included in Federal Consolidation
Loans; and §357 amended the definition of “economic Hardship (§435(o) of Pub. L. 89-329, as
amended).
Bankruptcy Reform Act of 1994 – Pub. L. 103-394; October 22, 1994§313 of this Act, amended §525 of title 11 of the United States Code to specify that a loan applicant may
not be denied a loan by a lender or a guaranty agency solely because of bankruptcy.
The Omnibus Consolidated Recissions and Appropriations Act of 1996 – P.L. 104-134;April 26, 1996
§305 of this Act required that ED pay administrative cost allowances to guaranty agencies for FY 1995
and FY 1996 and restricted the use of subsequent years’ funds available under §458 (the Higher
Education Act [HEA] of 1965, as amended) for FDLP administrative expenses.
II-14 Federal Student Loan Programs Data Book � FY 1997-FY 2000
§31001 made numerous changes to the collection of delinquent and defaulted federal obligations. For
example, it barred delinquent federal debtors from receiving federal loans or loan guarantees.
The Small Business Job Protection Act of 1996 – P.L. 104-188; August 20, 1996§1614 of this Act amended Internal Revenue Code §150(d) to make financially feasible the conversion of
not-for-profit secondary markets to private, for-profit companies. Permits a not-for-profit secondary
market to cease status as a “qualified scholarship funding corporation” yet maintains the tax-exempt status
of its tax-exempt bonds. Allows the not-for-profit organization to transfer assets to a new for-profit
corporation without encountering adverse tax consequences.
The Omnibus Consolidated Appropriations Act, 1997 – P.L. 104-208; September 30, 1996
Title VI of this Act amended the HEA to provide for the reorganization of the Student Loan Marketing
Association (Sallie Mae) through the formation of a holding company and the cessation of federal
sponsorship. Amended HEA to prohibit Sallie Mae, or any successor entity functioning as a secondary
market for student loans, from engaging in certain discriminatory practices against borrowers.
§304 of this Act required that ED pay administrative cost allowances to guaranty agencies for FY 1996 and
FY 1997 and restricted the use of subsequent years’ funds available under HEA §458 for FDLP
administrative expenses.
The 1997 Emergency Supplemental Appropriations Act for Recovery from Natural Disasters, and forOverseas Peacekeeping Efforts, Including Those in Bosnia – P.L. 105-18; June 12, 1997
§6002 of this Act authorized the Secretary to waive statutory and regulatory provisions for the benefit of
borrowers and schools affected by floods in the Midwest.
The Balanced Budget Act of 1997 – P.L. 105-33; August 5, 1997§6101 of this Act directed the Secretary of Education to recall a specified amount of reserve funds held by
guaranty agencies on September 1, 2002. Denied the Secretary any authority to direct a guaranty agency to
return reserve funds before such date. Required each guaranty agency, between FY 1998 and 2002, to
transfer a certain portion of its required share of the projected recall amount into restricted accounts for
investment in U.S. obligations or other similarly low-risk securities.
§6102 repealed the requirement that the Secretary pay direct loan origination fees to institutions of higher
education to assist in meeting the cost of loan origination.
§6103 set HEA §458 funding levels through FY 2002 for mandatory administrative expenses. Reduced the
previously authorized level of appropriations for FY 1998 ($750 million), while authorizing increasing
amounts for subsequent fiscal years until the level reached $750 million for FY 2002.
Prescribed a formula for the calculation of administrative cost allowances payable to guaranty agencies.
The Taxpayer Relief Act of 1997 – P.L. 105-34; August 5, 1997§202 of this Act restored partial tax deductibility for student loan interest. §225 expanded community
service loan forgiveness by excluding from taxable income loan amounts forgiven by non-profit,
tax-exempt charitable or educational institutions for borrowers who take qualifying community-service
jobs.

Appendices
Federal Student Loan Programs Data Book � FY 1997-FY 2000 II-15
The Departments of Labor, Health and Human Services, and Education, and Related AgenciesAppropriations Act, 1998 – P.L. 105-78; November 13, 1997
§609 of this Act allowed FFELP lenders to include underlying FDLP loans in their consolidation loans.
Prohibited an eligible lender from discriminating against any borrower seeking a consolidation loan: (1)
based on the number or type of eligible student loans the borrower seeks to consolidate; (2) based on the
type or category of institution of higher education that the borrower attended; (3) based on the interest
rate to be charged with respect to the consolidation loan; or (4) with respect to the types of repayment
schedules offered to such borrower.
The Transportation Equity Act for the 21st Century [TEA-21] – P.L. 105-178; June 9, 1998§8301 of this Act postponed the impending July 1, 1998 implementation of long-term T-note interest rates
for FFELP and FDLP loans until October 1, 1998. Instead implemented a new rate structure based on the
short-term (91-day) T-bill: a FFELP/FDLP Stafford borrower interest rate of T-bill +1.7% for in-
school/grace/deferment and +2.3% for repayment and a FFELP lender special allowance rate of T-bill
+2.2% for in-school/grace/deferment status loans and +2.8% for repayment status loans. FFELP/FDLP
PLUS loans shifted to 91-day T-bill +3.1%.
The Higher Education Amendments of 1998 – P.L. 105-244; October 7, 1998This Act, known as “Reauthorization,” extended the Title IV programs through FY 2003 and made
numerous major changes to those programs. Continued the TEA-21 interest rate and special allowance
structure for Stafford and PLUS loans.
The Omnibus Consolidated and Emergency Supplemental Appropriations Act, 1999 – P.L. 105-277;October 21, 1998
Division H of this Act modified the Federal Deposit Insurance Act to permit certain affiliations between
Sallie Mae and depository institutions.
Amended the Federal Deposit Insurance Act to specify circumstances under which the Secretary of the
Treasury may: (1) approve an affiliation between a depository institution and Sallie Mae solely in its
reorganized, privatized status as “the Holding Company,” not in its status as a government sponsored
enterprise (GSE); and (2) impose affiliation terms and conditions, including constraints upon either the
issuance of debt obligations by Sallie Mae in its GSE status, or upon the use of proceeds from such
obligations. (Previous law prohibited affiliations between depository institutions and GSEs.)
Limited the value of the investment portfolio of Sallie Mae in its GSE status in the event such affiliation
should occur to the lesser of: (1) its value upon enactment of this Act; or (2) its value on the date such
affiliation is consummated.
The Gramm-Leach-Bliley Financial Services Modernization Act – P.L. 106-102; November 12, 1999Requires FFEL lenders and the Department (as well as lenders in other contexts) to provide certain
disclosures to consumers.
The Consolidated Appropriations Act, 2000 – P.L. 106-113; November 29, 1999§303 of Appendix E of this Act, as an offset, authorized use of DHHS’s National Directory of New Hires
for data matching to improve collection of defaulted Title IV loans.

II-16 Federal Student Loan Programs Data Book � FY 1997-FY 2000
The Ticket to Work and Work Incentives Improvement Act of 1999 –P.L. 106-170; December 17, 1999§409 of this Act established an average 3-month commercial paper rate as the financial instrument used
for determining quarterly lender special allowance payments for new FFELP loans from January 1, 2000
through June 30, 2003. Did not impact borrower interest rates.
The Electronic Signatures in Global and National Commerce Act – P.L. 106-229; June 30, 2000§107 of this Act established “special” effective date with respect to the electronic signature consent
requirement for Title IV loans. This effective date was the earlier of the time that ED published revised
common promissory notes or that date which is one year after the Act’s enactment.
The Consolidated Appropriations Act, 2001 – P.L. 106-554, which by reference enacts H.R. 5656, theDepartments of Labor, Health and Human Services, Education, and Related Agencies AppropriationsAct, 2001; December 21, 2000
§318 of this Act replaced the interest rate formula for certain PLUS and SLS loans which used the rates
established by the auction of 52-week Treasury bills for setting new interest rates each July 1st. Interest rates
for these loans are now based on a new formula which uses the weekly average of the one year constant
maturity Treasury yield, as published by the Board of Governors of the Federal Reserve System, for the last
calendar week ending on or before June 26th preceding the July 1st effective date for interest rate changes.
§312 enacted an extension (from 7/1/02 to 7/1/04) of the exemption of Historically Black Colleges and
Universities (HBCUs) from the default rate criteria contained in §435(a) of the HEA.
§311 provided for HEA preemption of state law in the perfection of security interests in FFELP loans.
§309 contained an amendment to the HEA to improve compensation for auditors and examiners in the
Department of Treasury’s Office of Sallie Mae Oversight.
§308 changed the process for appealing cohort default rate calculations so that a school that misses the
appeal deadline may still retain eligibility if a clear mistake was made in the data used to calculate the rate.
Other Statutes:
� General Education Provisions Act (GEPA
� Freedom of Information Act (FOIA)
� Truth-in-Lending Act (TILA)

Appendices
Federal Student Loan Programs Data Book � FY 1997-FY 2000 III-1
Appendix IIIGlossary

Academic Year: The measure of the time in which academic work is to be accomplished by a student each
year as defined by the school. For instance, at a school that uses terms, the academic year must contain at
least 30 weeks of instructional time in which a full-time student is expected to complete at least 24 semester
or trimester hours, 36-quarter hours, or 900 clock hours.
Accrued Interest: The interest on a student loan that begins to accrue (accumulate) after a student completes
school. This interest is charged on the principal (dollar) amount of the loan.
Administrative Cost Allowance (ACA): Monies the federal government may pay a guaranty agency as
reimbursement for administrative expenses incurred in the operation of its program. Agencies apply
annually and are paid quarterly for ACA.
Alternative Repayment: A repayment plan the Servicing Center provides to a borrower who adequately
demonstrates that the terms and conditions of the four FDLP repayment plans do not accommodate the
borrower’s exceptional circumstances.
Bankruptcy: Legal proceedings that relieve borrowers from their creditors.
Booked Disbursements: A booked disbursement occurs when funds for a booked loan become disbursed. At
this time, the booked disbursement date becomes an actual disbursement date.
Booked Loan: An FDLP loan becomes booked when a promissory note, origination record, and anticipated
disbursement date exists in the loan origination system.
Borrower: Person responsible for repaying a loan who has signed and agreed to the terms in the promissory
note.
Capitalizing Interest: Adding accumulated interest to the loan principal rather than having the borrower make
monthly interest payments. Capitalizing interest increases the principal amount of the loan and, therefore,
the total cost of the loan.
Cash Reserve Ratio: The amount of cash reserves that an agency holds divided by the original principal of
outstanding loans.
Cash Reserves: An agency’s cumulative sources of funds minus an agency’s cumulative uses of funds to pay.
Cohort: Borrowers who enter repayment in a given fiscal year
Cohort Default Rates: The rate calculated by dividing the number of borrowers who defaulted at the end of
the specified time interval, by the total number of borrowers in the cohort. A cohort of student borrowers
who entered repayment in the same year may be tracked over a specific time interval to determine the
percentage of students who default on their loans. (A cohort default rate may also be based on the total
dollar amount loaned to students. In this case, the rate would be expressed as the percentage of dollars
borrowed that are defaulted.)
Glossary
Federal Student Loan Programs Data Book � FY 1997-FY 2000 III-3
Appendices

III-4 Federal Student Loan Programs Data Book � FY 1997-FY 2000
Collection Costs: Costs the government incurs when collecting a delinquent or defaulted loan. These costs are
charged to the borrower.
Collections: Amounts collected by guaranty agencies or the federal government from borrowers after default
claims are paid to lenders. FY 1986-FY 1996 figures reported in the Data Book include collections by the
Internal Revenue Service through offset of federal income tax refunds.
Commitment (Direct Loans): For the FDLP, a commitment occurs when the Department receives and accepts
an origination record and a signed promissory note from the borrower.
Commitment (FFEL program): In the FFEL program, a commitment occurs when the guaranty agency issues
a commitment to the lender for a loan.
Consolidation Loans: Loans under the FDLP or FFEL in grace or repayment status are eligible for
consolidation. Consolidation occurs when a borrower with multiple loans requests that all of his or her
loans be consolidated into one loan. Repayment begins 60 days after discharge of prior loans; certain
deferments are authorized. Interest is the greater of nine percent or weighted average of underlying loans.
Constant Dollars: Dollars adjusted using a price index to eliminate inflationary factors. This adjustment
facilitates direct comparison over time.
Cross-Program Participation: Student participation in more than one FFEL program component. Students
may borrow under both Stafford Subsidized and Stafford Unsubsidized programs, and their parents may
borrow under the Parent Loan for Undergraduate Students (PLUS) program. However, a student may not
receive an FDLP loan and an FFELP loan for the same period of enrollment.
Default: Failure to repay a loan in accordance with the terms of the promissory note.
Deferment: The temporary postponement of loan payments.
Delinquency: Incidents of late or missed loan payments, as specified in the terms of the promissory note and
the selected repayment plan.
Dependent Student: A student that is financially dependent upon a parent or legal guardian or a student who
does not meet certain criteria for being classified as independent (see Independent Student).
Direct Consolidation Loan: One or more federal education loans combined into a single loan under the
FDLP. Only one monthly payment is made to the U.S. Department of Education.
Direct Loan Servicing Center: The place where FDLP borrowers send their loan payments. The Servicing
Center can answer questions a student might have about an FDLP loan. The toll-free telephone number is
1-800-848-0979.
Disbursement: When loan proceeds are paid by the school to the student or parent borrower.
Discharge: The release of borrowers from their obligations to repay their FDLP loans. Borrowers must meet
certain requirements to be eligible for discharges.
Appendices
Federal Student Loan Programs Data Book � FY 1997-FY 2000 III-5
Disclosure Statement: Statement of the actual cost of a loan, including the interest costs and the loan fee.
ECMC: Educational Credit Management Corporation is a guaranty agency, which guarantees loans for many
lenders in various states.
Exit Counseling: A group or individual session during which FDLP borrowers who are leaving school or
dropping below half-time enrollment receive important information about their repayment obligations
and update information about themselves.
Expected Family Contribution (EFC): The amount that a family can be expected to contribute toward college
costs.
Extended Repayment Plan: A plan that requires the borrower to pay at least $50 a month and allows up to 30
years to repay, depending on the amount borrowed.
Federal Direct Loan Program (FDLP): The William D. Ford Federal Direct Loan Program, also referred to as
the Direct Loan Program, is a federal program that was authorized under by the Student Loan Reform Act
of 1993. FDLP provides low-interest loans to students. These loans are originated by participating
institutions with capital provided directly through the U.S. Department of Education, which is the sole
lender. Several loan programs exist under the umbrella of FDLP. These loans are the Stafford Subsidized
loan program, the Stafford Unsubsidized loan program, the Parent Loan for Undergraduate Students
(PLUS), and Consolidation loans.
Federal Family Education Loan (FFEL) program: The Federal Family Education Loan FFEL program is
formerly known as Guaranteed Student Loans (GSL). Funds for the FFEL program are provided primarily
by commercial lenders. Loans are guaranteed by individual state or private non-profit guaranty agencies
and reinsured by the federal government. Several loan programs exist under the umbrella of FFEL. These
loans are the Stafford Subsidized program, the Stafford Unsubsidized program, the Parent Loans for
Undergraduate Students (PLUS), the Supplemental Loan for Students (SLS), and Consolidation loans.
Federal Insured Student Loan Program (FISLP): The Higher Education Act of 1965 authorized the Federal
Insured Student Loan Program, a program that provided loan guarantees to state and private nonprofit
agencies. Changes in legislation gradually phased out this program and no new FISLP loan guarantees have
been provided since July 14, 1984.
FFEL: See Federal Family Education Loan Program.
FDLP: See Federal Direct Loan Program.
Fiscal Year (FY): The annual accounting year for the federal government begins on October 1 and ends the
following September 30. The fiscal year is designated by the calendar year in which it ends. For example,
the FY 1996 begins on October 1, 1995 and ends on September 30, 1996. [NOTE: Prior to FY 1976, the
fiscal year began on July 1 and ended on the following June 30.]
Forbearance: An arrangement to postpone or reduce a borrower’s monthly payment amount for a limited
and specified period, or to extend the repayment period. The borrower is charged interest during
forbearance.
Foreign Borrowers: Borrowers who attend eligible foreign institutions.
III-6 Federal Student Loan Programs Data Book � FY 1997-FY 2000
GA Reimbursement: Monies that guaranty agencies return to the government for collections on defaulted
loans.
Grace Period: A six-month period before the first payment must be made on a Stafford Subsidized or Stafford
Unsubsidized loan. The grace period starts the day after a borrower ceases to be enrolled at least half time.
During the grace period on a FDLP Unsubsidized loan, accumulating interest must be paid or it will be
capitalized.
Graduated Repayment Plan: A plan that allows monthly payment amounts to start out at one level and then
increase every two years during the repayment period. Borrowers have up to 30 years to repay, depending
on the amount they borrowed. The minimum payment must cover interest that accumulates monthly and
must be at least half of the payment that would be required under the Standard Repayment Plan. The
maximum amount may not be more than 1-1/2 times the payment that would be required under the
Standard Repayment Plan.
Guarantee Agency (GA): A state or private nonprofit agency that has an agreement with the Secretary to
administer the Guaranteed Student Loan programs. The agency insures lenders against losses due to a
borrower’s default. Also called “guarantor” or “guaranty agency.”
Half-time Student: A student who is not a full-time student, who is enrolled in a school that participates in the
FFEL program or the FDLP, and who is carrying an academic workload that is considered at least one-half
the workload of a full-time student (as determined by the school).
HEAF: Higher Education Assistance Foundation is a guaranty agency, which guarantees loans for many lenders
in various states.
Income Contingent Repayment Plan: A plan that allows the monthly payment amount to vary with the
borrower’s income. A borrower has up to 25 years to repay.
Independent Student: A student who meets one of the following criteria: the student is 24 years or older, a
graduate or professional student, married, orphaned or a ward of the court, veteran of the armed services,
or has documents describing circumstances of independence.
In-School Period: Under the Stafford Subsidized loan program, the period during which a borrower pursues
his or her studies as at least a half-time student at a participating school. This period begins with the date
of disbursement and ends with the beginning of the grace period. During the in-school period, the federal
government pays lenders interest benefits and special allowance on behalf of eligible borrowers.
Institution Default Rates: Each institution’s cohort default rate calculated annually by the Department of
Education. The cohort consists of the borrowers who enter repayment in a given fiscal year. The rate is
calculated by dividing the number of borrowers who default by the end of the following fiscal year by the
total number of borrowers in the cohort.
Insurance Premium: The amount charged a lender by a guarantee agency for insuring the lender against losses
on GSLP loans. The lender, however, may pass the cost of the insurance premium to the borrower.
Interest: A loan expense charged by the lender and paid by the borrower for the use of borrowed money. The
expense is calculated as a percentage of the principal amount (loan amount) borrowed.
Appendices
Federal Student Loan Programs Data Book � FY 1997-FY 2000 III-7
Interest Benefits: Under the FFEL Stafford loan program, federal payments to lenders on behalf of eligible
borrowers for interest which accrues during the in-school and grace periods, and during any authorized
deferment periods.
IRS Offset: Defaulted loans on accounts that the Department of Education has turned over to the Internal
Revenue Service (IRS). This action will offset the debt against the defaulter’s income tax refund.
Lender (active): An eligible lending institution which has made at least one Stafford Subsidized, Stafford
Unsubsidized, PLUS, or SLS loan in a fiscal year.
Lenders’ Default Claims Rate: The ratio of default claims paid since program inception to all loans that have
entered repayment (matured paper) since program inception. The default rate does not reflect any
collection activity subsequent to the default. Commonly referred to as the gross default rate.
Loan: Money borrowed that must be repaid.
Loan Advances: Non-interest bearing loans with no fixed maturity, which the federal government makes to a
guaranty agency to help establish or maintain the guaranty agency’s reserves for loan guarantees. Advances
were authorized in 1965, 1968, and 1976.
Loan Fee: An expense of borrowing deducted proportionately from each FFEL disbursement.
Loan Limits: Limits placed on student borrowers in terms of the maximum numbers of dollars they may
obtain through federally funded student financial assistance programs. Loan limits vary by type of loan,
academic level, program length, and whether a student is dependent or independent. Here is one example
of Stafford Subsidized and Unsubsidized loan limits for FFEL and FDLP loans to independent students
when program length or the enrollment period is one academic year:
Independent Students Stafford Subsidized loans Stafford Subsidized and Unsubsidized
Freshmen $2,625 $ 6,625
Sophomores 3,500 7,500
Juniors-Seniors 5,500 10,500
Graduate & Professional 8,500 18,500
Loan Postponement: See deferment and forbearance.
Loan Principal: The total sum of money borrowed.
Loan Volume: Refers to the dollar amount or number of loans committed. Loan volume may be reported in
thousands or millions of dollars.
Loan Volume Commitments: The total amount of loans that lenders or guarantee agencies commit to
borrowers. The principal amount actually loaned may be less than the total value of loan commitments
due to cancellations. Also, consolidated loans are excluded from the totals when calculating total loan
commitments.
Loans in Repayment: Loans that have entered the repayment period after expiration of the grace period.
III-8 Federal Student Loan Programs Data Book � FY 1997-FY 2000
Mandatory Assignments: Loans assigned to the Department of Education after the guaranty agency has made
the required effort to collect on defaulted loans.
Matured Paper: The cumulative dollar amount of loans that have ever entered repayment. It is a measurement
equal to the cumulative dollar amount of loans disbursed since the program’s inception less the dollar
amount of loans in the in-school and grace periods.
National Cohort Default Rate: The number of student borrowers that entered repayment in a cohort fiscal year
and defaulted on these loans before the end of the next fiscal year divided by the total number of student
borrowers that entered repayment in the cohort fiscal year.
Net Cost of Loan Defaults: The cost of the loan default claims minus the collections that are made on the
defaulted loans.
Net Default Rate: The net default rate is computed by dividing the cumulative dollar amount of default claims
paid to lenders, less cumulative collections by matured paper. It measures, on a cumulative basis, the dollar
amount of net loss to the Department compared to the total dollar amount of loans subject to default. This
definition was revised in 1985 to reflect the proper credit for collection active while providing a valid
barometer of the cash loss to the Department.
Operating Expenses: Expenses incurred by a guaranty agency, such as salaries, travel, computer hardware and
software, equipment, rent, supplies, and contractor costs.
Origination Fee: A fee charged and deducted from the proceeds of an FFEL program loan before the loan is
disbursed. The origination fee offsets some of the administrative costs of loan processing. The fee must not
exceed the maximum rate established by law. This fee is deducted from the interest and special allowance
the federal government pays the lender. Generally, lending institutions pass this fee on to borrowers at the
time the loans are made.
PLUS Loan (FDLP or FFEL): Parent Loans for Undergraduate Students. Loans taken out by parents for the
purpose of helping to pay for their children’s undergraduate education. Parents are responsible for all
interest charges. The loan value may not exceed the full cost of the student’s education, minus any other
financial aid that the student receives. Interest rates are fixed or variable, not to exceed 12 percent.
Postponement (loan): See Deferment and Forbearance.
Prepayment: Any amount paid on a loan by the borrower before it is required to be paid under the terms of
the promissory note. There is never a penalty for prepaying principal or interest on FDLP loans.
Promissory Note: A legally binding contract between a lender and a borrower. The promissory note contains
the terms and conditions of the loan, including how and when the loan must be repaid.
Proprietary Borrowers: Borrowers at for-profit institutions.
Proprietary Institutions: Postsecondary institutions that are operated for profit.
Recovery Rate: The ratio of cumulative dollars collected by the federal government or a guaranty agency on
defaulted loans to cumulative dollars paid in default claims.

Appendices
Federal Student Loan Programs Data Book � FY 1997-FY 2000 III-9
Refinancing of PLUS/SLS: There are three refinancing options for PLUS student, SLS and PLUS parent
borrowers: (1) refinancing to secure combined payment; (2) refinancing to secure a variable interest rate;
(3) refinancing by discharge of previous loan.
Rehabilitation Loans: When 12 consecutive payments have been made on a formerly defaulted loan, it can
become a rehabilitation loan. Once a loan becomes rehabilitated, it becomes a new loan. A borrower again
becomes eligible for participation in Title IV programs.
Reinsurance Fees: Guarantee agencies must pay to the Department a fee of 0.25 percent of the total principal
amount of loans guaranteed by the agency during the fiscal year, beginning FY 1987. The fee is 0.5 percent
for any year in which the agency hits the five- percent reinsurance “trigger.” The fee applies to all Stafford,
PLUS and SLS loans (except refinanced loans).
Reinsurance Payments (Reinsurance Default Claims): Monies the federal government gives a guarantee
agency as reimbursement for payments made to lenders for losses due to borrower default.
Repayment Period: The period, which a borrower is responsible for repaying his or her loan. In the case of
Stafford loans, this period begins on the day after the last day of the grace period. In the case of PLUS and
SLS loans, this period begins on the day the loan is disbursed. The maximum repayment period is ten years,
not including any authorized deferment or forbearance periods.
Repayment Schedule: A statement provided by the Direct Loan Servicing Center to the borrower that lists the
amount borrowed, the amount of monthly payments, and the date payments are due.
Sallie Mae: A federally chartered, stockholder-owned corporation which provides liquidity to lenders by
purchasing and/or warehousing student loans. Sallie Mae, with over $15 billion in outstanding loans, is
currently the largest holder of FFEL program loans. Sallie Mae is also referred to as the Student Loan
Marketing Association (SLMA).
Secondary Market: An institution or organization that purchases eligible student loans and provides lenders
with a source of liquidity to make new loans. Congress established Sallie Mae as a national secondary
market. In addition, other secondary markets operate in a number of States at either the state or regional
level.
Special Allowance: A quarterly supplemental interest payment to lenders based on the outstanding principal
balance of Stafford, PLUS, SLS and Consolidation loans. This payment assures that, as a complement to the
borrower’s interest rate, the lenders receive an equitable yield on their loans.
Stafford Subsidized Loan (FDLP and FFEL): A federally subsidized student loan made on the basis of the
student’s financial need and other specific eligibility requirements. Stafford Subsidized loans have
subsidized interest, which means that the federal government does not charge interest on these loans while
borrowers are enrolled at least halftime, during the six-month grace period following graduation, or during
authorized periods of deferment. Stafford Subsidized loans are available to undergraduate and graduate
students while the student is in school. The borrower begins to repay the principal and interest after leaving
school. Following a 1992 amendment to the Higher Education Act, an unsubsidized component was added
to the Stafford Loan Program.

III-10 Federal Student Loan Programs Data Book � FY 1997-FY 2000
Stafford Unsubsidized Loan (FDLP and FFEL): As part of the Higher Education Amendments of 1992, this
unsubsidized component was added to the Stafford loan program. These loans are made to borrowers
meeting specific eligibility requirements. Interest is charged throughout the life of the loan. The borrower
may choose to pay the interest charged on the loan or allow the interest to be capitalized (added to the loan
principal).
Standard Repayment Plan: A plan that requires a borrower to pay at least $50 a month and allows up to 10
years to repay.
Supplemental Loans for Students (SLS): Prior to July 1, 1994, Supplemental Loan for Students (SLS) loans
were available for independent students who were not qualified for sufficient financial aid under the FFEL
Stafford loan program. Graduate and professional students, independent students and, in some cases,
dependent undergraduate students could participate in this loan program. Repayment began within 60
days after disbursement was not subject to deferral. There was no federal interest subsidy. Interest rates were
fixed or variable and could not exceed 12 percent.
Trigger Rate: The ratio of reinsurance claims paid to a guarantee agency during any fiscal year to the agency’s
total amount of loans in repayment at the end of the preceding fiscal year. If this ratio equals 5 percent, an
agency is reimbursed for 90 percent of its losses. If the ratio equals 9 percent, the agency is reimbursed for
80 percent of its losses.
USAF: United Student Aid Funds is a guaranty agency, which is the designated guarantor for several states.
Variable Interest: Rate of interest on a loan that is tied to a stated index and changes annually every
July 1 as the index changes.
Warehousing Advances: Advances provided to lenders to invest in additional student loans. This enables the
lenders to finance their new and outstanding student loan portfolios without depleting their funds.
NOTE: Sources for glossary terms and definitions include: U.S. Department of Education. (1997). FY94-FY96 Federal Student Loan
Programs Data Book. Washington, DC: Author. U.S. Department of Education. (1996). Guide to U.S. Department of Education Programs.
Washington, DC: Author. Federal Register, Vol. 59, No. 230 (1994).