Federal Reserve Lending to Troubled Banks During the ... · Federal Reserve Lending to Troubled...
23
Federal Reserve Lending to Troubled Banks During the Financial Crisis, 2007-2010 R. Alton Gilbert , Kevin L. Kliesen , Andrew P. Meyer , and David C. Wheelock Numerous commentaries have questioned both the legality and appropriateness of Federal Reserve lend- ing to banks during the recent financial crisis. This article addresses two questions motivated by such commentary: Did the Federal Reserve violate either the letter or spirit of the law by lending to under- capitalized banks? Did Federal Reserve credit constitute a large fraction of the deposit liabilities of failed banks during their last year before failure? The Federal Deposit Insurance Corporation Improvement Act of 1991 (FDICIA) imposed limits on the number of days that the Federal Reserve may lend to under- capitalized or critically undercapitalized depository institutions. The authors find no evidence that the Federal Reserve ever exceeded statutory limits during the recent financial crisis, recession, and recovery. In most cases, the number of days that Federal Reserve credit was extended to an undercapitalized or critically undercapitalized depository institution was appreciably less than the number of days permitted under law. Furthermore, compared with patterns of Fed lending during 1985-90, the authors find that few banks that failed during 2008-10 borrowed from the Fed during their last year prior to failure, and even fewer had outstanding Fed loans when they failed. Moreover, Federal Reserve loans averaged less than 1 percent of total deposit liabilities among nearly all banks that did borrow from the Fed during their last year. It is impossible to know whether the enactment of FDICIA explains differences in Federal Reserve lending practices during 2007-10 and the previous period of financial distress in the 1980s. However, it does seem clear that Federal Reserve lending to depository institutions during the recent episode was consistent with the congressional intent of this legislation. (JEL E58, G01, G21, G28) Federal Reserve Bank of St. Louis Review, May/June 2012, 94(3), pp. 221-42. T he Federal Reserve responded aggressively—some argue too aggressively—to the crisis that enveloped the world financial system in 2008-09. Using powers granted by legisla- tion enacted during the Great Depression, the Fed established several special lending facilities to (i) provide liquidity to the commercial paper market, money market mutual funds, and investment banks and (ii) facilitate orderly resolution of two large troubled financial firms (Bear Stearns and Co. and American International Group). In addition to providing billions of R. Alton Gilbert is a visiting scholar and economist emeritus at the Federal Reserve Bank of St. Louis. Kevin L. Kliesen and Andrew P. Meyer are economists and David C. Wheelock is deputy director of research at the Federal Reserve Bank of St. Louis. The authors thank Jane Anne Batjer, Paul Butler, Hillary Debenport, Lyle Kumasaka, Kim Nelson, Julie Stackhouse, and Kristina Stierholz for valuable discussions and assistance in obtaining data used in this project. David A. Lopez provided research assistance. © 2012, The Federal Reserve Bank of St. Louis. The views expressed in this article are those of the author(s) and do not necessarily reflect the views of the Federal Reserve System, the Board of Governors, or the regional Federal Reserve Banks. Articles may be reprinted, reproduced, published, distributed, displayed, and transmitted in their entirety if copyright notice, author name(s), and full citation are included. Abstracts, synopses, and other derivative works may be made only with prior written permission of the Federal Reserve Bank of St. Louis. Federal Reserve Bank of St. Louis REVIEW May/June 2012 221
Transcript of Federal Reserve Lending to Troubled Banks During the ... · Federal Reserve Lending to Troubled...

Federal Reserve Lending to Troubled BanksDuring the Financial Crisis, 2007-2010 R. Alton Gilbert, Kevin L. Kliesen, Andrew P. Meyer, and David C. Wheelock
Numerous commentaries have questioned both the legality and appropriateness of Federal Reserve lend-ing to banks during the recent financial crisis. This article addresses two questions motivated by suchcommentary: Did the Federal Reserve violate either the letter or spirit of the law by lending to under-capitalized banks? Did Federal Reserve credit constitute a large fraction of the deposit liabilities of failedbanks during their last year before failure? The Federal Deposit Insurance Corporation Improvement Actof 1991 (FDICIA) imposed limits on the number of days that the Federal Reserve may lend to under-capitalized or critically undercapitalized depository institutions. The authors find no evidence that theFederal Reserve ever exceeded statutory limits during the recent financial crisis, recession, and recovery.In most cases, the number of days that Federal Reserve credit was extended to an undercapitalized orcritically undercapitalized depository institution was appreciably less than the number of days permittedunder law. Furthermore, compared with patterns of Fed lending during 1985-90, the authors find thatfew banks that failed during 2008-10 borrowed from the Fed during their last year prior to failure, andeven fewer had outstanding Fed loans when they failed. Moreover, Federal Reserve loans averaged lessthan 1 percent of total deposit liabilities among nearly all banks that did borrow from the Fed duringtheir last year. It is impossible to know whether the enactment of FDICIA explains differences in FederalReserve lending practices during 2007-10 and the previous period of financial distress in the 1980s.However, it does seem clear that Federal Reserve lending to depository institutions during the recentepisode was consistent with the congressional intent of this legislation. (JEL E58, G01, G21, G28)
Federal Reserve Bank of St. Louis Review, May/June 2012, 94(3), pp. 221-42.
T he Federal Reserve responded aggressively—some argue too aggressively—to the crisisthat enveloped the world financial system in 2008-09. Using powers granted by legisla-tion enacted during the Great Depression, the Fed established several special lending
facilities to (i) provide liquidity to the commercial paper market, money market mutual funds,and investment banks and (ii) facilitate orderly resolution of two large troubled financial firms(Bear Stearns and Co. and American International Group). In addition to providing billions of
R. Alton Gilbert is a visiting scholar and economist emeritus at the Federal Reserve Bank of St. Louis. Kevin L. Kliesen and Andrew P. Meyer areeconomists and David C. Wheelock is deputy director of research at the Federal Reserve Bank of St. Louis. The authors thank Jane Anne Batjer,Paul Butler, Hillary Debenport, Lyle Kumasaka, Kim Nelson, Julie Stackhouse, and Kristina Stierholz for valuable discussions and assistance inobtaining data used in this project. David A. Lopez provided research assistance.
© 2012, The Federal Reserve Bank of St. Louis. The views expressed in this article are those of the author(s) and do not necessarily reflect theviews of the Federal Reserve System, the Board of Governors, or the regional Federal Reserve Banks. Articles may be reprinted, reproduced,published, distributed, displayed, and transmitted in their entirety if copyright notice, author name(s), and full citation are included. Abstracts,synopses, and other derivative works may be made only with prior written permission of the Federal Reserve Bank of St. Louis.
Federal Reserve Bank of St. Louis REVIEW May/June 2012 221

dollars through these facilities, the Fed also lent billions to depository institutions (commer-cial banks, savings institutions, and credit unions) through its long-standing discount windowprograms and a Term Auction Facility (TAF) established in December 2007.1 The Fed’s aggres-sive response to the crisis has been heavily criticized, though the Fed’s defenders contend thatit was necessary and successful in helping the economy weather the worst financial crisis sincethe Great Depression.2
This paper examines the Fed’s lending to depository institutions (hereafter “banks”) duringthe recent financial crisis, recession, and recovery. Some observers contend that the Fed lentinappropriately to weak or insolvent banks, or that its lending may have merely delayed theinevitable failures of many banks and perhaps increased losses to the Federal Deposit InsuranceCorporation (FDIC) Deposit Insurance Fund.3 The Federal Reserve Act specifies the termsunder which the Fed is permitted to lend to banks. Section 142 of the Federal Deposit InsuranceCorporation Improvement Act of 1991 (FDICIA) limits—but does not prohibit—FederalReserve lending to undercapitalized or critically undercapitalized banks. With certain exceptions,FDICIA prohibits the Federal Reserve from lending to (i) any undercapitalized depository insti-tution for more than 60 days in any 120-day period and (ii) any critically undercapitalized insti-tution beyond the fifth day after the institution becomes critically undercapitalized. Usingboth public and nonpublic information, we examine instances in which the Fed provided loansthrough its discount window and TAF programs to undercapitalized and critically undercapital-ized banks during the recent financial crisis, recession, and recovery. Our research finds noinstances in which the Fed provided credit to an undercapitalized or critically undercapitalizedbank for more than the maximum number of days specified in FDICIA.
This article also examines Federal Reserve lending to banks that subsequently failed during2008-10. A principal motivation behind the provisions on lending to undercapitalized banks inFDICIA was the claim that Federal Reserve loans had merely forestalled inevitable bank failuresduring the 1980s, which may have increased losses to the FDIC’s Deposit Insurance Fund whenthose banks were ultimately closed. Gilbert (1994) examined Fed lending to banks that failedduring the 1980s. He found that loans were allocated to the banks with the greatest liquidityneeds and that loans to banks that failed during 1985-91 were often concentrated near the timeof failure. This article finds that, in contrast to the period 1985-91, few banks that failed during2008-10 borrowed from the Fed in their last year of operation.
FDICIA PROVISIONS ON LENDING TO UNDERCAPITALIZED BANKSThe U.S. Congress enacted legislation in 1991 that mandated many changes in the way federal
agencies supervise and regulate depository institutions. This legislation, FDICIA, was a responseto the widespread collapse of the savings and loan industry and large number of bank failuresduring the 1980s. The mandates of the legislation were based on the view that government super-vision of banks and savings and loan associations had performed poorly during the 1980s.
Federal Reserve lending to undercapitalized banks was one of many facets of the process ofresolving failing banks addressed by FDICIA. Section 142 of FDICIA imposes limits on FederalReserve lending to undercapitalized and critically undercapitalized banks. The act states thatwith certain exceptions, “no advances to any undercapitalized depository institution by any
Gilbert, Kliesen, Meyer, Wheelock
222 May/June 2012 Federal Reserve Bank of St. Louis REVIEW

Federal Reserve Bank…may be outstanding for more than 60 days in any 120-day period.”4
Under FDICIA, the Fed is subject to financial liability if it provides credit to a critically under-capitalized bank beyond the fifth day after the bank becomes critically undercapitalized and theDeposit Insurance Fund incurs a loss greater than it would have incurred if the FDIC had liqui-dated the bank by the end of the five-day period.5 Section 201.5 of Federal Reserve Regulation A,which is reproduced in Table 1, summarizes the limitations on extensions of Federal Reservecredit to undercapitalized and critically undercapitalized depository institutions and the possibleassessments that could be levied on Federal Reserve Banks for any excess losses to the DepositInsurance Fund arising from delay in liquidating a critically undercapitalized bank. FDICIA clas-sifies depository institutions with capital ratios below specified levels or that have been assignedthe lowest examination rating by their principal regulator as either undercapitalized or criticallyundercapitalized. Tables 2 through 4 provide information about the measures of capital and theratios used to classify a depository institution as undercapitalized or critically undercapitalized.
Gilbert, Kliesen, Meyer, Wheelock
Federal Reserve Bank of St. Louis REVIEW May/June 2012 223
Table 1
Federal Reserve Regulation A
§201.5 Limitations on availability and assessments
(a) Lending to undercapitalized insured depository institutions. A Federal Reserve Bank may make or have outstanding advances to or discounts for a depository institution that it knows to be an undercapitalized insured depository institution, only:
(1) If, in any 120-day period, advances or discounts from any Federal Reserve Bank to that depository institution are not outstanding for more than 60 days during which the institution is an undercapitalized insured depository institution; or
(2) During the 60 calendar days after the receipt of a written certification from the chairman of the Board of Governors or the head of the appropriate federal banking agency that the borrowing depository institution is viable; or
(3) After consultation with the Board of Governors. In unusual circumstances, when prior consultation with the Board is not possible, a Federal Reserve Bank should consult with the Board as soon as possible after extending credit that requires consultation under this paragraph (a)(3).
(b) Lending to critically undercapitalized insured depository institutions. A Federal Reserve Bank may make or have outstanding advances to or discounts for a depository institution that it knows to be a critically undercapitalized insured depository institution only:
(1) During the 5-day period beginning on the date the institution became a critically undercapitalized insured depositoryinstitution; or
(2) After consultation with the Board of Governors. In unusual circumstances, when prior consultation with the Board is not possible, a Federal Reserve Bank should consult with the Board as soon as possible after extending credit that requires consultation under this paragraph (b)(2).
(c) Assessments. The Board of Governors will assess the Federal Reserve Banks for any amount that the Board pays to the FDIC due to any excess loss in accordance with section 10B(b) of the Federal Reserve Act. Each Federal Reserve Bank shall be assessed that portion of the amount that the Board of Governors pays to the FDIC that is attributable to an extension of credit by that Federal Reserve Bank, up to 1 percent of its capital as reported at the beginning of the calendar year in which the assessment is made. The Board of Governors will assess all of the Federal Reserve Banks for the remainder of the amountit pays to the FDIC in the ratio that the capital of each Federal Reserve Bank bears to the total capital of all Federal Reserve Banks at the beginning of the calendar year in which the assessment is made, provided, however, that if any assessment exceeds 50 percent of the total capital and surplus of all Federal Reserve Banks, whether to distribute the excess over such 50 percent shall be made at the discretion of the Board of Governors.
SOURCE: www.federalreserve.gov/bankinforeg/reglisting.htm.

FEDERAL RESERVE PROGRAMS FOR LENDING TO BANKS DURING THE FINANCIAL CRISIS
Provisions in FDICIA on lending to undercapitalized banks apply to all extensions of FederalReserve credit to banks. The Fed’s primary lending facility—the discount window—has been inexistence since the Fed was established in 1913.6 Currently, the discount window consists ofthree programs: primary credit, secondary credit, and seasonal credit. Primary credit is a facilityavailable to banks in generally sound financial condition. Secondary credit is available to banksthat are not eligible for primary credit because they do not meet the standard of being in gener-ally sound financial condition. The interest rate on secondary credit is higher than the discountrate on primary credit. The seasonal credit program offers loans to banks with recurring seasonalvariation in liquidity demand—typically small banks that serve agriculture, tourism, or otherseasonally oriented industries.
During the financial crisis, the Federal Reserve established a new facility—the Term AuctionFacility (TAF)—to make term funds available to banks. The TAF was created in response to con-cerns that banks were reluctant to borrow from the discount window and, hence, that the win-dow was not providing sufficient liquidity to alleviate the financial crisis. The Federal Reservemade 4,214 TAF loans to 411 borrowers. Total TAF loans outstanding peaked at $493 billion onMarch 2, 2009.7 The final TAF auction was held on April 8, 2010. Table 5 provides more detailabout the discount window and TAF programs.
Gilbert, Kliesen, Meyer, Wheelock
224 May/June 2012 Federal Reserve Bank of St. Louis REVIEW
Table 2
Components of Capital Measures
Tier 1 capital
• Common stockholder’s equity.
• Non-cumulative perpetual preferred stock.
• Minority interests in the equity accounts of consolidated subsidiaries.
Tier 2 capital
• The allowance for loan and lease losses (up to a maximum of 1.25 percent of risk-weighted assets).
• Cumulative perpetual or long-term preferred stock.
• Hybrid capital instruments and mandatory convertible debt securities.
• Subordinated debt and intermediate-term preferred stock.
• Unrealized holding gains on equity securities.
• The amount of subordinated debt and intermediate-term preferred stock that a bank may count as Tier 2 capital cannot exceed 50 percent of its Tier 1 capital. In addition, these two components and any other limited-life capital instruments are discounted in Tier 2 computations as they approach maturity.
Tier 3 capital
• Allocated for market risk.
Total capital
• The sum of Tier 1, Tier 2, and Tier 3 capital.
SOURCE: Spong (2000, pp. 87-88).

Gilbert, Kliesen, Meyer, Wheelock
Federal Reserve Bank of St. Louis REVIEW May/June 2012 225
Table 3
Calculation of Risk-Weighted Assets Under Basel I
Category 1: Zero percent weight
• Cash, including balances due from central banks in OECD countries.
• U.S. Treasury and government securities and claims unconditionally guaranteed by OECD governments.
Category 2: 20 percent weight
• Cash items in the process of collection.
• All claims on or guaranteed by U.S. depository institutions and banks in OECD countries.
• General obligation bonds of state and local governments.
• Portions of claims secured by U.S. government agency securities or OECD central governments that do not qualify for a zero percent weight.
• Loans and other claims conditionally guaranteed by U.S. government securities and other claims on U.S. government-sponsored enterprises.
Off balance sheet:
• Short-term trade-related contingencies, such as commercial letters of credit.
Category 3: 50 percent weight
• Loans secured by first liens on 1- to 4-family residential property and certain multifamily residential properties.
• Certain privately issued mortgage-backed securities.
• Revenue bonds of state and local governments.
Off balance sheet:
• Performance bonds and performance-based standby letters of credit.
• Unused portions of commitments with original maturity over 1 year.
• Revolving underwriting facilities.
Category 4: 100 percent weight
• All loans and other claims on private obligators not placed in a lower risk category.
• Bank premises, fixed assets, and other real estate owned.
• Industrial development revenue bonds.
• Intangible assets and investment in unconsolidated subsidiaries, provided they are not deducted from capital.
Off balance sheet:
• Financial standby letters of credit.
• Sale and repurchase agreements.
• Asset sales with recourse.
• Forward agreements to purchase assets.
• Securities lent that place the bank at risk.
SOURCE: Spong (2000, pp. 89-90).

Gilbert, Kliesen, Meyer, Wheelock
226 May/June 2012 Federal Reserve Bank of St. Louis REVIEW
Table 4
Criteria for Classifying Bank Capitalization
Total risk-based capital Tier 1 capital as a percentage of as a percentage of Tier-1
Classification risk-weighted assets risk-weighted assets leverage ratio
Well capitalized 10% or greater AND 6% or greater AND 5% or greater
Adequately capitalized 8% or greater AND 4% or greater AND 4% or greater
Undercapitalized Less than 8% OR Less than 4% OR Less than 4%
Significantly undercapitalized Less than 6% OR Less than 3% OR Less than 3%
NOTE: In addition to meeting these criteria, a well-capitalized bank must also be free of any directive from its supervisor to maintain a specificcapital level. A bank is classified as undercapitalized if it fails to meet any of the three measures for being classified as adequately capitalized.That is, if a bank meets only two of the three criteria for being classified as adequately capitalized, it is classified as undercapitalized. A bank isclassified as undercapitalized for purposes of discount window loans if its federal supervisory agency rates the bank as CAMELS 5 or equivalent,irrespective of the levels of the three capital ratios derived from the accounting statements. A bank is classified as critically undercapitalized ifits ratio of tangible equity to total assets is equal to or less than 2 percent.
SOURCE: Spong (2000, p. 91).
Table 5
Federal Reserve Programs for Lending to Depository Institutions
The discount window helps to relieve liquidity strains for individual depository institutions and for the banking system as awhole by providing a source of funding in time of need. Much of the statutory framework that governs lending to depositoryinstitutions is contained in section 10B of the Federal Reserve Act, as amended. The general policies that govern discount windowlending are set forth in Regulation A. As described in more detail below, depository institutions have, since 2003, had access tothree types of discount window credit—primary credit, secondary credit, and seasonal credit. In December of 2007, the FederalReserve introduced the Term Auction Facility (TAF), which provided credit to depository institutions through an auction mech-anism. All regular discount window loans and TAF loans must be fully collateralized to the satisfaction of the lending ReserveBank, with an appropriate haircut applied to the collateral; in other words, the value of the collateral must exceed the value ofthe loan. Information on collateral policies and interest rates charged for lending are discussed in the collateral and rate settingand risk management sections of this website.
Primary credit
Primary credit is a lending program available to depository institutions that are in generally sound financial condition. Becauseprimary credit is available only to depository institutions in generally sound financial condition, it is generally provided withminimal administrative requirements; for example, there are essentially no usage restrictions on primary credit. Before the cur-rent financial crisis, primary credit was available on a very short-term basis, typically overnight, at a rate 100 basis points abovethe Federal Open Market Committee’s (FOMC) target rate for federal funds. The primary credit facility helps provide an alterna-tive source of funding if the market rate exceeds the primary credit rate, thereby limiting trading at rates significantly above thetarget rate.
The Federal Reserve implemented a number of important changes to the primary credit program as the financial crisis emerged.On August 17, 2007, to promote orderly market functioning, the Federal Reserve reduced the spread between the primarycredit rate and the target federal funds rate to 50 basis points and began to allow the provision of primary credit for terms aslong as 30 days. On March 16, 2008, to bolster market liquidity, the Federal Reserve further reduced the spread of the primarycredit rate over the target federal funds rate to 25 basis points and increased the maximum maturity of primary credit loans to90 days.
continued on next page

Gilbert, Kliesen, Meyer, Wheelock
Federal Reserve Bank of St. Louis REVIEW May/June 2012 227
Table 5, cont’d
Federal Reserve Programs for Lending to Depository Institutions
In response to the improvement in financial conditions, on November 17, 2009, the Federal Reserve announced that the maxi-mum maturity on primary credit loans would be reduced to 28 days effective January 14, 2010. In extending primary credit,Reserve Banks must judge that the borrower is likely to remain eligible for primary credit for the term of the loan. On February 18,2010, the Federal Reserve announced that typical maximum maturity on primary credit would be shortened to overnight, effec-tive March 18, 2010. In addition, the Federal Reserve increased the spread between the primary credit rate and the top of thetarget range for the federal funds rate to 50 basis points, effective February 19, 2010. These changes represented further normal-ization of the Federal Reserve’s lending facilities and did not signal any change in the outlook for the economy or for monetarypolicy. Detailed information is available on the discount window website.
Primary credit outstanding is reported in Table 1 of the H.4.1 statistical release. In addition, primary credit is included in “Otherloans” in Tables 8 and 9 of that release.
Secondary credit
Secondary credit is available to depository institutions that are not eligible for primary credit. It is extended on a very short-termbasis, typically overnight, at a rate 50 basis points above the primary credit rate. In contrast to primary credit, there are restric-tions on the uses of secondary credit extensions. Secondary credit is available to meet backup liquidity needs when its use isconsistent with a timely return by the borrower to a reliance on market sources of funding or the orderly resolution of a troubledinstitution. Secondary credit may not be used to fund an expansion of the borrower’s assets. Moreover, the secondary creditprogram entails a higher level of Reserve Bank administration and oversight than the primary credit program. Reserve Bankstypically apply higher haircuts on collateral pledged to secure secondary credit. In addition, the liquidity position of secondarycredit borrowers is monitored closely, and the Federal Reserve typically is in close contact with the borrower’s primary federalregulator. Detailed information is available on the discount window website.
Secondary credit outstanding is reported in Table 1 of the H.4.1 statistical release. In addition, secondary credit is included in“Other loans” in Tables 8 and 9 of that release.
Seasonal credit
The Federal Reserve’s seasonal credit program assists small depository institutions in managing significant seasonal swings intheir loans and deposits. Eligible depository institutions may borrow term funds from the discount window during their periodsof seasonal need, enabling them to carry fewer liquid assets during the rest of the year and, thus, allow them to make morefunds available for local lending. The interest rate applied to seasonal credit is a floating rate based on market rates.
Seasonal credit is available only to depository institutions that can demonstrate a clear pattern of recurring intra-yearly swingsin funding needs. Eligible institutions are usually located in agricultural or tourist areas. To become eligible for seasonal credit,an institution must establish a seasonal qualification with its Reserve Bank. Detailed information is available on the discountwindow website.
Seasonal credit outstanding is reported in Table 1 of the H.4.1 statistical release. In addition, seasonal credit is included in“Other loans” in Tables 10 and 11 of that release.
Term Auction Facility
On December 12, 2007, the Federal Reserve created the TAF to improve depository institutions’ access to term funding. The TAFprovided credit through an auction mechanism to depository institutions in generally sound financial condition. The TAF offered28-day and, beginning in August 2008, 84-day loans.
On September 24, 2009, the Federal Reserve announced that the TAF would be scaled back in response to continued improve-ments in financial market conditions. The auction amount for the 84-day auctions was reduced in late 2009 and the maturitydates of the 84-day auctions were adjusted over time to align with the maturity dates of the 28-day auctions. Subsequently,the auction amount for the remaining 28-day auctions was tapered, and the final TAF auction was held on March 8, 2010. Creditextended under the March 2010 auction matured on April 8, 2010. All TAF loans were fully collateralized to the satisfaction ofthe lending Reserve Bank, with an appropriate “haircut” applied to the value of the collateral and were repaid in full, with interest,in accordance with the terms of the facility.
SOURCE: www.federalreserve.gov/monetarypolicy/bst_lendingdepository.htm.

Figures 1 and 2 illustrate the scope of Federal Reserve assistance to banks during the financialcrisis through the discount window and the TAF program. Figure 1 plots weekly outstandingFederal Reserve credit for the primary credit and TAF programs, and Figure 2 plots similar totalsfor the secondary and seasonal credit programs. As these figures show, TAF loans accounted forthe bulk of the Fed’s assistance to depository institutions. By early 2009, outstanding TAF loanstotaled nearly $500 billion. By contrast, primary credit loans peaked in late 2008 at just over$100 billion. Indeed, Figure 1 also shows that primary credit loans began to decline sharply, andthe difference between TAF loans and primary credit loans increased sharply after the failure ofLehman Brothers in September 2008. Figure 2 shows that while secondary credit loans rosenoticeably during the crisis, they peaked at only about $1 billion in late 2009. Interestingly, thepeak activity in secondary credit lending occurred when TAF and primary credit lending weredeclining rapidly.
We use data on Federal Reserve discount window loans to individual depository institutionsthat were released by the Federal Reserve in March 2011 in response to a Freedom of InformationAct request and subsequent court ruling. The data include loans to individual institutions madebetween August 20, 2007, and March 1, 2010. Data from August 20, 2007, through March 13,2008, are limited to primary credit borrowings, whereas data from March 14, 2008, throughMarch 1, 2010, include both primary and secondary credit loans. However, for the latter period,
Gilbert, Kliesen, Meyer, Wheelock
228 May/June 2012 Federal Reserve Bank of St. Louis REVIEW
0
100,000
200,000
300,000
400,000
500,000
600,000
2007 2008 2009 2010 2011
Primary Credit
TAF Loans
$ Millions
Beginning of data on both primary and secondary credit
Beginning of TAF loans
Beginning ofdata onprimary credit
Figure 1
Primary Credit and Term Auction Facility Loans
NOTE: Data are weekly.

the available data do not identify which loans were made under the primary credit program andwhich were secondary credit. Further, we do not include loans made under the seasonal creditprogram. This study uses data on all TAF loans made to individual depository institutions fromDecember 20, 2007, through March 11, 2010.8 Our data include information about TAF loansthat were subsequently called by the Fed before their original maturity dates.
As shown in Figure 1, the large increases in primary credit during 2007-10 occurred afterAugust 20, 2007, the first date for which we have data on loans to individual banks. In addition,primary credit had fallen to a relatively low level by March 1, 2010, the last date for which wehave data on loans to individual banks. Most of the larger spikes in secondary credit in Figure 2occurred between March 14, 2008, and March 1, 2010, the period for which our data on loansto individual banks include secondary credit. Almost no secondary credit loans were made beforeMarch 14, 2008, and hence the lack of data on secondary credit loans to individual institutionsbefore that date is not an important problem for our study. In addition, seasonal credit, whichwas not included in the data available for this study, was not large during 2007-10.
The lending data released by the Federal Reserve in 2011 include some loans excluded fromour study. First, we omit all loans to depository institutions other than those made under thediscount window or TAF programs. These include loans in which depository institutions merely
Gilbert, Kliesen, Meyer, Wheelock
Federal Reserve Bank of St. Louis REVIEW May/June 2012 229
0
200
400
600
800
1,000
1,200
2007 2008 2009 2010 2011
$ Millions
Beginning of data on both primary and secondary credit
Beginning of TAF loans
Beginning ofdata onprimary credit
Secondary Credit
Seasonal Credit
Figure 2
Secondary and Seasonal Credit Loans
NOTE: Data are weekly.

served as conduits under various programs established by the Federal Reserve during the finan-cial crisis. The organizations that ultimately received the funds—not the conduit banks—wereresponsible for repaying the Federal Reserve. Hence, such loans are not relevant for our study.We also exclude loans to U.S. branches and agencies of foreign financial institutions because theFederal Reserve uses different metrics to determine their eligibility for credit.9 Similarly, weexclude loans to credit unions because the capital measures of credit unions differ from theregulatory capital ratios of commercial banks and thrift institutions. However, we found noinstances when Federal Reserve credit was extended to an undercapitalized credit union, asreflected by the methods the Fed uses to identify undercapitalized credit unions.
IDENTIFYING UNDERCAPITALIZED AND CRITICALLY UNDERCAPITALIZED BANKS
Section 142 of FDICIA lists criteria for classifying banks as undercapitalized or criticallyundercapitalized and specifies the maximum length of time the Federal Reserve may lend tosuch institutions. These criteria include regulatory capital ratios and examination ratingsassigned by bank supervisors. FDICIA authorizes bank regulators to define regulatory capitalratios based on information collected in the Reports of Condition and Income (“call reports”)that banks file quarterly with regulators. Section 142 of FDICIA also requires regulators to con-sider a bank that has been assigned the lowest supervisory rating as undercapitalized for pur-poses of access to Federal Reserve credit, even if the bank would be considered adequatelycapitalized on the basis of regulatory capital ratios.
A definitive determination of whether the Federal Reserve restricted the length of time itmade loans to undercapitalized and critically undercapitalized banks to the limits set in FDICIArequires information about when Fed officials learned about the condition of banks thatrequested loans. Much of the information about a bank’s condition that is available to Fed lend-ing officers is derived from quarterly call reports and reports of supervisory examinations. How -ever, call reports are sometimes revised and on-site examinations, especially of distressed banks,can take some time to complete. Hence, Fed lending officers typically do not have up-to-the-minute information about a borrowing bank’s condition. Call report information usually becomesavailable within 30 days after the end of a quarter (banks are required to file their call reportswithin 30 days of the end of a quarter). Data on the regulatory capital ratios of banks are derivedfrom these reports. Gunther and Moore (2000) examine the frequency of revisions to call reports,focusing on one item in the call reports: provision for loan losses, which is an expense item. Thatstudy finds that regulators are more likely to require banks with the most severe asset-qualityproblems, as reflected in the ratio of nonperforming loans to total assets, to increase their provi-sion for loan losses. This can lead to revisions of previously filed call reports. In their sample,Gunther and Moore (2000) find that among banks examined in the first quarter of a given year,almost 10 percent of those with the worst asset quality were required to increase their provisionfor loan losses as reported in the call report for the fourth quarter of the prior year. Their findingsalso indicate that revisions to call reports are especially relevant for undercapitalized banks.
Because call reports are sometimes revised, especially in the case of financially troubledbanks, we use an internal Federal Reserve database—the Prompt Corrective Action Database
Gilbert, Kliesen, Meyer, Wheelock
230 May/June 2012 Federal Reserve Bank of St. Louis REVIEW

(PCAD)—which provides information about the data on regulatory capital positions of banksthat were available to Federal Reserve lending officers at the time loans were made. The PCADis updated regularly with information on the current regulatory capital ratios of banks and isused by bank supervisors for taking the corrective actions required by FDICIA.
We augment the data on regulatory capital ratios with information on supervisory exami-nation dates and ratings. Bank examinations are performed by state and federal agencies thatsupervise banks. Supervisors assign ratings from 1 (best) to 5 (worst) for each of the followingfacets of bank operations: capital adequacy, asset quality, management, earnings, liquidity, andsensitivity to market risk; in addition, supervisors assign a composite score from 1 to 5 (knownas the CAMELS composite rating). FDICIA classifies all banks with a composite CAMELS rat-ing of 5 as undercapitalized regardless of their current capital ratios.
Examination ratings are not released publicly but are made available both to the examinedinstitution and to supervisory authorities, including Federal Reserve lending officers. The pre-cise dates on which Fed officials are informed of the ratings assigned for individual bank examsare not systematically recorded, however, and hence we consider alternative dates that boundthe actual reporting dates. Specifically, we use both the exam close date, which is the date whenthe supervisory staff finish their examination, and the report disposition date, which is the datethe examination was finalized and mailed to institution management or the date an internalmemo on examination findings was completed and sent to the Board of Governors. Supervisoryagencies may not have determined the CAMELS ratings they assign to banks as of the exam closedates, but they will have assigned CAMELS ratings to banks by the report disposition dates.Federal Reserve credit officers use all available information in evaluating requests from banksfor loans, including any information on examination ratings made available prior to the reportdisposition date. However, in most instances, the report disposition date is likely the most rele-vant date for counting the number of days that a bank received Federal Reserve credit whileundercapitalized or rated CAMELS 5.
To estimate the number of days that Federal Reserve credit was extended to undercapital-ized banks, we use two alternative criteria for classifying banks as undercapitalized as follows:
(i) banks that were undercapitalized on the basis of regulatory capital ratios from the PCAD database or the close dates of exams for which banks are rated CAMELS 5 or
(ii) banks that were undercapitalized on the basis of regulatory capital ratios from the PCAD database or the report disposition dates of exams for which banks are rated CAMELS 5.
With the one exception discussed below, we find that the choice of examination date has nomaterial impact on our findings about the length of time that undercapitalized banks borrowedfrom the Fed during the period covered by our data.
DID THE FED COMPLY WITH THE FDICIA LIMITS ON LENDING TOUNDERCAPITALIZED BANKS?
Table 6 presents information on the number of days that Federal Reserve credit was extendedto undercapitalized banks based on exam close and report disposition dates. For undercapital-
Gilbert, Kliesen, Meyer, Wheelock
Federal Reserve Bank of St. Louis REVIEW May/June 2012 231

ized banks that received Federal Reserve credit for more than 60 days in total, we investigatewhether the Fed extended credit to the bank for more than 60 days during any 120-day period,the maximum permitted under FDICIA. For undercapitalized banks that received credit for 60days or less in total, investigation of whether the bank received credit for more than 60 days in a120-day period is unnecessary.
Using exam close dates, we find that 53 banks borrowed from the Fed while undercapital-ized. More than half of these banks borrowed for 5 days or less while undercapitalized, but onebank borrowed for 72 days within a 120-day period while undercapitalized. However, furtherinvestigation revealed that the FDICIA limit on the number of days that the Fed may lend to anundercapitalized bank was not violated in this instance. The bank was classified as undercapi-talized on the basis of an examination on which the bank was assigned a composite CAMELSrating of 5 (the bank had been rated 2 at its previous exam). However, the new CAMELS ratingwas not considered final on the closing date of the exam, and the report disposition date onwhich the rating was considered final did not occur until five months after the exam closingdate. The bank’s primary regulator informed the lending Reserve Bank of the pending examina-tion rating approximately three months after the exam closing date, by which time the bank wasno longer borrowing from the Fed. No additional credit was extended to the bank after the dateon which Reserve Bank officials were informed of the pending rating.
As shown in Table 6, if we use exam report disposition dates for determining when banksbecame undercapitalized, 45 banks borrowed from the Fed while undercapitalized, but none ofthem for more than 60 days. Using either the exam closing or report disposition dates, we findthat most of the banks that borrowed from the Fed while undercapitalized did so for five daysor less.
We identified only one instance in which the Fed extended credit to a bank that was identi-fied as critically undercapitalized in the PCAD database. However, further investigation revealedthat this bank was not undercapitalized when it received Federal Reserve credit. The bank wasundercapitalized on September 30, 2008, as reflected in its third-quarter 2008 call report. Thebank received additional capital during the fourth quarter of 2008, which made the bank well
Gilbert, Kliesen, Meyer, Wheelock
232 May/June 2012 Federal Reserve Bank of St. Louis REVIEW
Table 6
Banks with Outstanding Discount Window or TAF Loans While Undercapitalized According to PCADInformation or CAMELS 5 Rating
No. of banks with outstanding loans
No. of days with loan Based on exam close dates Based on report disposition dates
0-5 39 32
6-10 6 6
11-25 2 3
26-59 5 4
60 or more 1 0
Total 53 45
NOTE: Data used to construct these tables include adjustments for repayment of TAF loans prior to original maturity dates.

capitalized. However, the PCAD database continued to indicate that the bank was criticallyundercapitalized until January 30, 2009, when the database first indicated the bank’s well-capitalized position as reflected in its fourth-quarter 2008 call report. Although the PCADdatabase had not been updated to reflect the borrowing bank’s well-capitalized status when theFed extended credit to the bank on January 28 and 29, 2009, the bank was in fact well capitalizedat that time and, hence, there was no violation of FDICIA.
Another way to put the results in Table 6 into perspective is to compare the number ofbanks that borrowed from the Fed while undercapitalized with the total number of banks thatbecame undercapitalized during the period for which we have data on loans to individual banks.Between September 30, 2007, and March 31, 2010, 625 banks and thrifts were rated eitherCAMELS 5 or became undercapitalized based on regulatory capital ratios. Thus, regardless ofwhether we use exam close or report disposition dates as the basis for classifying banks as under-capitalized, we find that only a small percentage of undercapitalized banks during this periodborrowed from the Fed at any time while undercapitalized.
Gilbert, Kliesen, Meyer, Wheelock
Federal Reserve Bank of St. Louis REVIEW May/June 2012 233
Table 7
Distribution of Banks that Borrowed from the Federal Reserve While Undercapitalized: Asset Size
No. of banks
Total assets Based on exam close dates Based on report disposition dates
Greater than $10 billion 1 1
$1 billion to $10 billion 14 14
$300 million to $1 billion 20 19
$100 million to $300 million 13 8
Less than $100 million 5 3
Total 53 45
NOTE: Asset size is measured as of September 30, 2007.
Table 8
Distribution of Banks that Borrowed from the Federal Reserve While Undercapitalized: Charter Type
No. of banks
Charter type Based on exam close dates Based on report disposition dates
National banks 13 11
State member banks 7 5
Nonmember banks* 30 26
Federal savings banks 1 1
State savings bank 1 1
Savings and loan associations 1 1
Total 53 45
NOTE: Charter type as of September 30, 2007. *Banks that are not members of the Federal Reserve System.

Table 7 provides information on the asset size of the banks identified in Table 6 as borrow-ing from the Fed while undercapitalized. Assets are measured at the beginning of the period forwhich we have data on lending to individual banks. One of these banks had assets in excess of$10 billion, and a few had assets less than $100 million.
Table 8 provides information on the charter class of the banks in Table 6. A few bankschanged their charter class during the period covered by our data. The information in Table 8 isbased on charter class at the beginning of the period. Most borrowers were commercial banks,and among those, the largest group consisted of state banks that were not members of theFederal Reserve System.
FEDERAL RESERVE LOANS TO FREQUENT BORROWERS The evidence reported in Table 6 does not prove that the provisions in FDICIA caused the
Fed to restrict lending to undercapitalized banks. As noted previously, over 90 percent of banksthat became undercapitalized during the period for which we have data did not borrow from theFed while undercapitalized. In addition, 44 of the 53 banks that borrowed from the Fed whileundercapitalized based on exam close dates borrowed for fewer than 60 days over the entireperiod covered by our data, including days when they were adequately capitalized. For the 45banks that borrowed from the Fed while undercapitalized based on the report disposition dates,37 borrowed from the Fed for fewer than 60 days during the entire period covered by our data,including days when they were adequately capitalized. Thus, the observations in Table 6 on thenumber of days that banks borrowed from the Fed while undercapitalized may reflect a generalreluctance of banks to rely on Federal Reserve credit rather than restrictions imposed by the Fedin FDICIA or for other reasons.
We may learn more about the impact of FDICIA on lending to undercapitalized banks byfocusing on banks that borrowed frequently from the Fed before they became undercapitalized.The eight banks listed in Table 9 relied heavily on the Fed as a consistent source of credit, borrow-ing almost every day for at least three months just before becoming undercapitalized based onthe exam close date. Becoming undercapitalized may have limited their access to credit fromsources other than the Fed even more than in the period before they became undercapitalized.And yet the periods over which these banks borrowed from the Fed while undercapitalizedwere much shorter than the periods over which they borrowed before they became undercapi-talized. To illustrate, the bank identified as number 8 in Table 9 borrowed from the Fed on 126days over a period of 136 days—93 percent of the time—just before it became undercapitalizedbut for only 2 days after it became undercapitalized. This suggests that the Fed promptly cut offaccess to credit for this bank after it became undercapitalized, even though the bank had reliedon credit from the Fed almost continuously over the preceding four months.
Table 10 provides comparable information for seven banks that borrowed frequently beforebecoming undercapitalized based on the report disposition dates. The borrowing patterns shownin Tables 9 and 10 illustrate that banks that borrowed frequently from the Fed in the three monthsbefore they became undercapitalized borrowed much less frequently after they were classifiedas undercapitalized. This suggests that the Fed followed the intent of Congress in limiting accessto credit by undercapitalized banks.
Gilbert, Kliesen, Meyer, Wheelock
234 May/June 2012 Federal Reserve Bank of St. Louis REVIEW
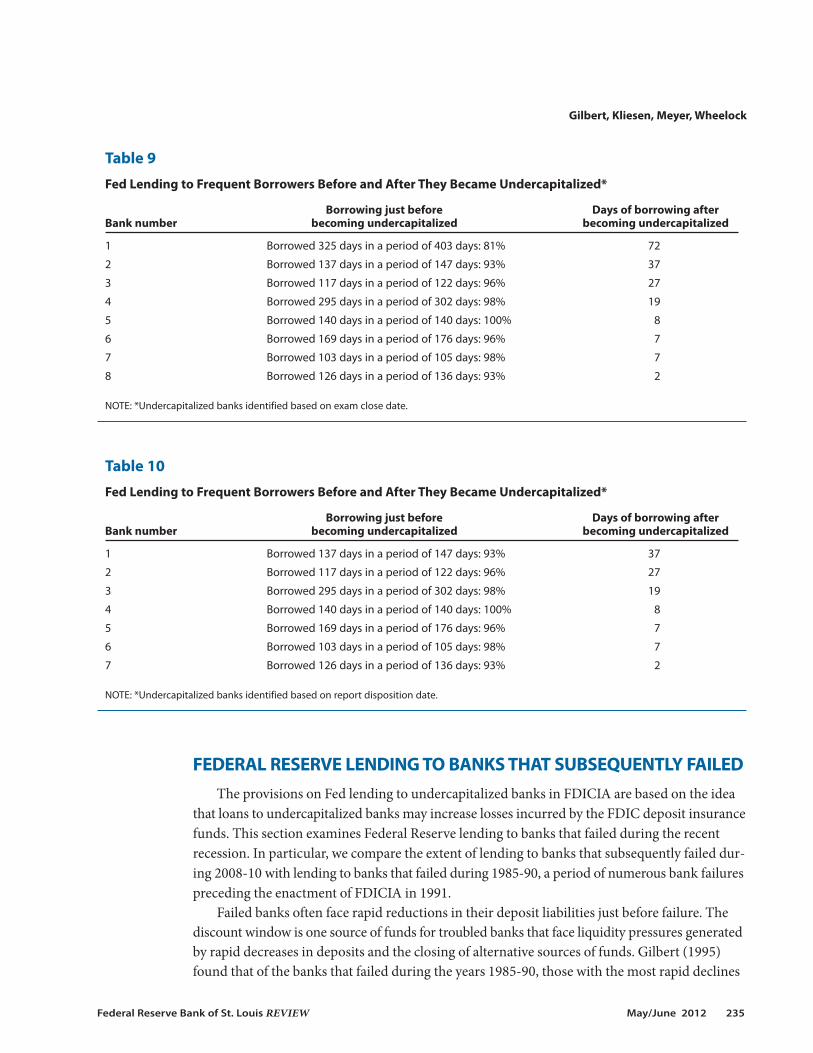
FEDERAL RESERVE LENDING TO BANKS THAT SUBSEQUENTLY FAILEDThe provisions on Fed lending to undercapitalized banks in FDICIA are based on the idea
that loans to undercapitalized banks may increase losses incurred by the FDIC deposit insurancefunds. This section examines Federal Reserve lending to banks that failed during the recentrecession. In particular, we compare the extent of lending to banks that subsequently failed dur-ing 2008-10 with lending to banks that failed during 1985-90, a period of numerous bank failurespreceding the enactment of FDICIA in 1991.
Failed banks often face rapid reductions in their deposit liabilities just before failure. Thediscount window is one source of funds for troubled banks that face liquidity pressures generatedby rapid decreases in deposits and the closing of alternative sources of funds. Gilbert (1995)found that of the banks that failed during the years 1985-90, those with the most rapid declines
Gilbert, Kliesen, Meyer, Wheelock
Federal Reserve Bank of St. Louis REVIEW May/June 2012 235
Table 9
Fed Lending to Frequent Borrowers Before and After They Became Undercapitalized*
Borrowing just before Days of borrowing after Bank number becoming undercapitalized becoming undercapitalized
1 Borrowed 325 days in a period of 403 days: 81% 72
2 Borrowed 137 days in a period of 147 days: 93% 37
3 Borrowed 117 days in a period of 122 days: 96% 27
4 Borrowed 295 days in a period of 302 days: 98% 19
5 Borrowed 140 days in a period of 140 days: 100% 8
6 Borrowed 169 days in a period of 176 days: 96% 7
7 Borrowed 103 days in a period of 105 days: 98% 7
8 Borrowed 126 days in a period of 136 days: 93% 2
NOTE: *Undercapitalized banks identified based on exam close date.
Table 10
Fed Lending to Frequent Borrowers Before and After They Became Undercapitalized*
Borrowing just before Days of borrowing after Bank number becoming undercapitalized becoming undercapitalized
1 Borrowed 137 days in a period of 147 days: 93% 37
2 Borrowed 117 days in a period of 122 days: 96% 27
3 Borrowed 295 days in a period of 302 days: 98% 19
4 Borrowed 140 days in a period of 140 days: 100% 8
5 Borrowed 169 days in a period of 176 days: 96% 7
6 Borrowed 103 days in a period of 105 days: 98% 7
7 Borrowed 126 days in a period of 136 days: 93% 2
NOTE: *Undercapitalized banks identified based on report disposition date.

in deposit liabilities during their last year were more likely to borrow from the Federal Reserveand were likely to borrow larger amounts than other failed banks.
Federal Reserve Chairman Ben Bernanke (2011) has noted that the Federal Reserve hasoccasionally provided loans to assist with the orderly resolution of failing banks:
In the handful of instances when discount window loans were extended to troubled institutions, itwas in consultation with the Federal Deposit Insurance Corporation to facilitate a least-cost resolu-tion; in these instances, also, the Federal Reserve was fully repaid.
Because it takes time for the FDIC to determine the least costly method of resolving a failingbank, Federal Reserve loans to troubled banks potentially can assist in facilitating orderly reso-lutions of failing banks and avoiding market and service disruptions arising from sudden liqui-dation. However, reference in the Chairman’s statement to “the handful of instances” indicatesthat Fed loans to facilitate orderly resolutions are not common. There is no official list of casesin which the Federal Reserve made loans to failing banks in consultation with the FDIC for pur-poses of facilitating orderly resolutions. Data available on discount window loans to individualbanks during the period August 20, 2007, through March 1, 2010, confirm, however, that Fedloans to facilitate orderly resolutions were not common. Of the 177 banks that failed duringthe period from August 20, 2008, through March 1, 2010, only 23 borrowed from the FederalReserve at any time during their last 13 weeks (Table 11).
Even among the banks that borrowed from the Federal Reserve while undercapitalized, fewwere borrowing in the period just before failure. Of the 53 banks identified in Table 6 that bor-rowed from the Federal Reserve while undercapitalized based on exam close dates, 28 failedwithin the period for which we have data on loans to individual banks. Only 12 of these 28 banksborrowed from the Federal Reserve within one month of their failure dates. There were gaps ofseveral months between their last discount window loans and failure dates for most of the other16 banks that borrowed while undercapitalized and failed by March 1, 2010. These 16 banksused sources of funds other than the discount window for managing any unusual liquiditypressures near their failure dates. Of the 45 banks identified in Table 6 that borrowed from theFederal Reserve while undercapitalized based on report disposition dates, 27 failed within theperiod for which we have data on loans to individual banks. Only 11 of these 27 banks borrowedfrom the Federal Reserve within one month of their failure dates.
Next we compare Fed lending to banks that failed during the recent financial crisis withlending during the years 1985-90, based on observations in Gilbert (1994). To make this com-
Gilbert, Kliesen, Meyer, Wheelock
236 May/June 2012 Federal Reserve Bank of St. Louis REVIEW
Table 11
Distribution of Failed Banks by Borrowings from the Federal Reserve in Their Last Year
Borrowed in their Borrowed in their Borrowed in at least 26 last 52 weeks last 13 weeks of their last 52 weeks
Failure period No. of banks No. (%) No. (%) No. (%)
1985-90 318 185 (58.2) 154 (48.4) 28 (8.8)
2008-10 177 59 (33.3) 23 (13.0) 4 (2.3)
NOTE: Data for 2008-10 are for August 20, 2008, through March 1, 2010.

parison, we require data on Fed loans to individual institutions for at least one year prior to theirfailure dates. Since data on Fed loans are available for August 20, 2007, through March 1, 2010,our sample of failed banks includes those that failed during the period August 20, 2008, throughMarch 1, 2010. For this sample we impose no restriction on asset size, unlike Gilbert (1994),whose study was based on a sample of 318 banks that excluded the smallest strata of banks thatwere not required to file weekly reports on their deposit liabilities. Our sample of failed banksincludes 148 commercial banks, 27 savings banks, and 2 savings and loan associations, for atotal of 177 banks. Figure 3 shows the total number of bank failures (including failures of com-mercial banks and savings institutions) by month for January 2007 through December 2011.Data on discount window lending are available for the period from August 2007 through March2010. Relatively few bank failures occurred prior to August 2008.
Table 11 compares the frequency of Fed lending to banks that failed during 2008-10 withlending to banks that failed in 1985-90, as reported in Gilbert (1994, Table 1). For the banksthat failed during 2008-10, data on Fed lending include both discount window and TAF loans.The information reported in the table accounts for TAF loans that were repaid to the Fed beforetheir original maturity dates.
The percentages of failed banks that borrowed from the Fed during their last 52 weeks andtheir last 13 weeks were substantially smaller during 2008-10 than during 1985-90. Of the 177
Gilbert, Kliesen, Meyer, Wheelock
Federal Reserve Bank of St. Louis REVIEW May/June 2012 237
0
5
10
15
20
25
30
2007 2008 2009 2010 2011
Number of Failures
August2007
August2008
March2010
Figure 3
Commercial Bank and Savings Institution Failures (January 2007–December 2011)
NOTE: Data are monthly.

banks that failed during the period from August 20, 2008, through March 1, 2010, only 23 bor-rowed from the Federal Reserve at any time during their last 13 weeks. The last column ofTable 11 presents information on failed banks that borrowed frequently from the Fed through-out their last year. Four banks (2.3 percent) borrowed during 26 or more of their last 52 weeksduring 2008-10, whereas 28 banks in the sample (8.8 percent) borrowed during 26 or more oftheir last 52 weeks during 1985-90. Table 11 indicates that while the Fed made loans frequentlyto a small number of banks that failed during 2008-10, as a group these banks relied less on theFed for credit during their last year than did the banks that failed during 1985-90.
Tables 12 through 14 compare the dollar amount of Fed lending to banks relative to theirtotal deposits over their last 13, 26, and 52 weeks for banks that failed during the two periods,using the format of Table 3 in Gilbert (1994). For both periods we include days on which banksdid not borrow in calculating average borrowings. Data on deposits for 1985-90 were derivedfrom weekly reports by the banks to the Fed on their total deposit liabilities. Comparable weeklydeposit data are not available for 2008-10. For those years, we use quarterly call report data toapproximate average total deposits over the last 13, 26, and 52 weeks of a failed bank’s existence.10
Table 12 compares ratios of average borrowings to total deposits over the last 13 weeks forfailed banks. Banks that failed during 2008-10 tended to rely less on the Fed for credit in theweeks just before their failures than did banks that failed during 1985-90. Among banks thatfailed during 2008-10, 87 percent did not borrow from the Fed during their last 13 weeks, com-pared with 52 percent for the banks that failed during 1985-90. Borrowings were less than one-half of 1 percent of average total deposits for 96 percent of the banks that failed during 2008-10,compared with 70 percent for the banks that failed during 1985-90. Two of the banks that failed
Gilbert, Kliesen, Meyer, Wheelock
238 May/June 2012 Federal Reserve Bank of St. Louis REVIEW
Table 12
Distribution of Failed Banks by the Size of Their Borrowings Relative to Their Average Total Deposits OverTheir Last 13 Weeks
Sum of borrowings divided by the sum of total deposits over the following periods ending on failure dates
1985-90 2008-10
Range of ratios of borrowings to total deposits No. of banks Cumulative % No. of banks Cumulative %
0 164 51.57 153 87.43
0.0 < x ≤ 0.001 28 60.38 11 93.71
0.001 < x ≤ 0.005 29 69.50 4 96.00
0.005 < x ≤ < 0.010 23 76.73 4 98.29
0.010 < x ≤ 0.020 20 83.02 1 98.86
0.020 < x ≤ 0.050 25 90.88 0 98.86
0.050 < x ≤ 0.100 14 95.28 0 98.86
0.100 < x ≤ 0.200 11 98.74 2 100.00
0.200 < x 4 100.00 0 100.00
NOTE: Data for 2008-10 are for August 20, 2008, through March 1, 2010. Deposit data are missing for 2 of the 177 banks that failed over thisperiod. One of the missing banks borrowed during its last 13 weeks and the other missing bank did not borrow.

Gilbert, Kliesen, Meyer, Wheelock
Federal Reserve Bank of St. Louis REVIEW May/June 2012 239
Table 13
Distribution of Failed Banks by the Size of Their Borrowings Relative to Their Average Total Deposits OverTheir Last 26 Weeks
Sum of borrowings divided by the sum of total deposits over the following periods ending on failure dates
1985-90 2008-10
Range of ratios of borrowings to total deposits No. of banks Cumulative % No. of banks Cumulative %
0 149 46.86 142 80.23
0.000 < x ≤ 0.001 54 63.84 24 93.79
0.001 < x ≤ 0.005 29 72.96 5 96.61
0.005 < x ≤ 0.010 23 80.19 2 97.74
0.010 < x ≤ 0.020 22 87.11 1 98.31
0.020 < x ≤ 0.050 24 94.65 0 98.31
0.050 < x ≤ 0.100 10 97.80 1 98.87
0.100 < x ≤ 0.200 5 99.37 1 99.44
0.200 < x 2 100.00 1 100.00
NOTE: Data for 2008-10 are for August 20, 2008, through March 1, 2010.
Table 14
Distribution of Failed Banks by the Size of Their Borrowings Relative to Their Average Total Deposits OverTheir Last 52 Weeks
Sum of borrowings divided by the sum of total deposits over the following periods ending on failure dates
1985-90 2008-10
Range of ratios of borrowings to total deposits No. of banks Cumulative % No. of banks Cumulative %
0 133 41.82 119 67.23
0.000 < x ≤ 0.001 65 62.26 39 89.27
0.001 < x ≤ 0.005 52 78.62 9 94.35
0.005 < x ≤ 0.010 21 85.11 4 96.61
0.010 < x ≤ 0.020 23 92.45 2 97.74
0.020 < x ≤ 0.050 15 97.17 1 98.31
0.050 < x ≤ 0.100 6 99.06 1 98.87
0.100 < x ≤ 0.200 2 99.69 1 99.44
0.200 < x 1 100.00 1 100.00
NOTE: Data for 2008-10 are for August 20, 2008, through March 1, 2010.

during 2008-10, however, had average borrowings over their last 13 weeks that were between10 percent and 20 percent of their total deposits.
The pattern shown in Table 13 is similar to that in Table 12, indicating that banks that failedduring 2008-10 relied less on Federal Reserve loans over their last 26 weeks than banks thatfailed during 1985-90. A few banks that failed during 2008-10, however, relied heavily on creditfrom the Fed during their last 26 weeks. Average borrowings were between 10 percent and 20percent of average total deposits for one bank and exceeded 20 percent for another bank. Thecontrast between the two periods was similar for average borrowings relative to total depositsover the last 52 weeks before failure (Table 14). As a group, banks that failed during 2008-10relied less on Federal Reserve credit during their last 52 weeks than did banks that failed during1985-90. Comparisons of the patterns of Fed lending to failed banks during their last year areconsistent with the conclusion that the provisions in FDICIA on lending to undercapitalizedbanks reduced the frequency and amount of lending to banks that failed during 2008-10 relativeto such lending during 1985-90.
CONCLUSIONThe Federal Deposit Insurance Corporation Improvement Act of 1991 (FDICIA) was,
among other things, intended to limit the access of financially troubled banks to Federal Reservecredit and thereby help minimize losses incurred by federal deposit insurance funds. This articleinvestigates the effectiveness of FDICIA by studying Federal Reserve lending to commercialbanks and other depository institutions during the recent financial crisis, recession, and subse-quent period of economic recovery. We address two principal questions, which are motivatedby press reports and other commentary about Federal Reserve lending during the crisis: (i) Didthe Fed violate either the letter or spirit of FDICIA by lending to undercapitalized banks? (ii) DidFederal Reserve lending constitute a large fraction of the deposit liabilities of banks that failedduring their last year prior to failure?
Our research finds no evidence that the Fed ever knowingly lent to an undercapitalizedbank for more than 60 days during the period between August 2007 and March 2010. In addi-tion, the Fed never knowingly extended credit to a critically undercapitalized bank during thatperiod. Hence, Fed lending to undercapitalized banks remained within the limits set in FDICIA.Moreover, in most cases, Federal Reserve credit was extended for considerably fewer days thanpermitted by FDICIA. Furthermore, compared with patterns of Fed lending during 1985-90, wefind that few banks that failed during 2008-10 borrowed from the Fed during their last year priorto failure, and only a small number of banks had outstanding Fed loans when they failed. As agroup, the banks that failed during the 2008-10 period relied less on the Federal Reserve as asource of credit during their last 52 weeks than did the banks that failed during 1985-90. Ofcourse, it is impossible to know whether the enactment of FDICIA accounts for differences inFederal Reserve lending practices during the recent financial crisis and recovery and the previ-ous period of financial distress in the 1980s. However, it does seem clear that Federal Reservelending to depository institutions during the recent episode was consistent with the congres-sional intent of FDICIA.
Gilbert, Kliesen, Meyer, Wheelock
240 May/June 2012 Federal Reserve Bank of St. Louis REVIEW

NOTES1 For information about the specific programs established by the Fed in response to the financial crisis, see the Board of
Governors website (www.federalreserve.gov/monetarypolicy/bst_crisisresponse.htm). The Federal Reserve Bank of St. Louisprovides a timeline of crisis events and government action in response to the crisis (http://timeline.stlouisfed.org/).
2 Criticisms of aspects of the Fed’s response to the crisis include those by Buiter (2009), Meltzer (2009), and Poole (2009). Forresponses to these and other criticisms, see Bernanke (2009, 2010), Madigan (2009), and Nelson (2011).
3 For examples, see Applebaum and McGinty (2011) and Ivry, Keoun, and Kuntz (2011).
4 The limitation does not apply if the head of the appropriate banking agency or the Chairman of the Federal Reserve Boardcertifies to the Federal Reserve Bank that a depository institution is viable.
5 The Fed’s liability may not exceed the lesser of (i) any loss exceeding the loss that the FDIC would have incurred if it had liquidated the critically undercapitalized bank within five days of becoming critically undercapitalized and (ii) the interestearned by the Fed on advances to the bank beyond the first five days of becoming critically undercapitalized. The text ofFDICIA is available from the Federal Reserve Bank of St. Louis website (http://fraser.stlouisfed.org/publication-series/?id=415).
6 See Bordo and Wheelock (2011) on what the Fed’s founders sought to achieve by establishing the discount window, short-comings with the mechanism that became apparent during the Great Depression, and subsequent reforms.
7 Government Accountability Office (2011, p. 228). The General Accountability Office identified 416 unique names of TAF bor-rowers. We identified 411 unique depository institutions that received TAF loans, according to data provided by the FederalReserve Board (www.federalreserve.gov/newsevents/reform_taf.htm).
8 These data are available on the Board of Governors’ website (www.federalreserve.gov/newsevents/reform_taf.htm).
9 The rating systems used for foreign banking organizations are described in Federal Reserve Supervisory Letters 96-36 and00-14 (www.federalreserve.gov/boarddocs/srletters/1996/sr9627.htm and www.federalreserve.gov/boarddocs/srletters/2000/SR0014.HTM).
10 We estimated the average deposits of a failed bank over its last 13 weeks as the average of its total deposits in the two quar-ters directly before the bank’s failure date. For example, if a bank failed in July 2009, total deposits correspond to the averageof its total deposits for 2009:Q1 (March 31) and 2009:Q2 (June 30). The estimate of total deposits for a failed bank over itslast 26 weeks is the average of its total deposits over the two quarters before failure. If a bank failed in July 2009, the estimateof total deposits in the second quarter before failure would be the average of the total deposits for 2008:Q4 (December 31)and 2009:Q1 (March 31). We estimated the total deposits of a failed bank over its last 52 weeks as its average of total depositsin the last four quarters before its failure. We estimated total deposits in the third quarter before failure as the average oftotal deposits for the third and fourth quarters before the bank’s failure. If a bank failed in July 2009, the estimate of totaldeposits in the third quarter before its failure would be the average of the total deposits for 2008:Q3 (September 30) and2008:Q4 (December 31). We estimated total deposits in the fourth quarter before failure as the average of the total depositsfor the fourth and fifth quarters before the bank’s failure. If a bank failed in July 2009, the estimate of total deposits in thefourth quarter before failure would be the average of the total deposits for 2008:Q2 (June 30) and 2008:Q3 (September 30).
REFERENCESApplebaum, Binyamin and McGivney, Jo Craven. “Fed Help Kept Banks Afloat, Until It Didn’t.” New York Times, April 4, 2011.
Bernanke, Ben S. “Reflections on a Year of Crisis.” Remarks at the Federal Reserve Bank of Kansas City’s Annual EconomicSymposium on Financial Stability and Macroeconomic Policy, Jackson Hole, Wyoming, August 21, 2009; www.federalreserve.gov/newsevents/speech/bernanke20090821a.htm.
Bernanke, Ben S. “Economic Challenges: Past, Present, and Future.” Remarks at the Dallas Regional Chamber, Dallas, Texas,April 7, 2010; www.federalreserve.gov/newsevents/speech/20100407a.htm.
Bernanke, Ben S. “Correction of Recent Press Reports Regarding Federal Reserve Emergency Lending During the FinancialCrisis.” Letter to the Senate Banking Committee, U.S. Congress, December 6, 2011;www.federalreserve.gov/generalinfo/foia/emergency-lending-financial-crisis-20111206.pdf.
Bordo, Michael D. and Wheelock, David C. “The Promise and Performance of the Federal Reserve as Lender of Last Resort1914-1933.” Federal Reserve Bank of St. Louis Working Paper No. 2010-036B, January 2011;http://research.stlouisfed.org/wp/2010/2010-036.pdf.
Buiter, Willem. “The Fed’s Moral Hazard Maximising Strategy.” FT.com/maverecon, March 6, 2009; http://blogs.ft.com/maverecon/2009/03/the-feds-moral-hazard-maximising-stragegy/.
Gilbert, Kliesen, Meyer, Wheelock
Federal Reserve Bank of St. Louis REVIEW May/June 2012 241

Gilbert, R. Alton. “Federal Reserve Lending to Banks that Failed: Implications for the Bank Insurance Fund.” Federal ReserveBank of St. Louis Review, January/February 1994, 76(1), pp. 3-18;http://research.stlouisfed.org/publications/review/94/01/Lending_Jan_Feb1994.pdf.
Gilbert, R. Alton. “Determinants of Federal Reserve Lending to Failed Banks.” Journal of Economics and Business, December1995, 47(5), pp. 397-408.
Government Accountability Office. “Federal Reserve System: Opportunities Exist to Strengthen Policies and Processes forManaging Emergency Assistance.” Report No. GAO-11-696, July 2011; www.gao.gov/new.items/d11696.pdf.
Gunther, Jeffery W. and Moore, Robert R. “Financial Statements and Reality: Do Troubled Banks Tell All?” Federal Reserve Bankof Dallas Economic and Financial Review, Third Quarter 2000, pp. 30-35; www.dallasfed.org/research/efr/2000/efr0003c.pdf.
Ivry, Bob; Keoun, Bradley and Kuntz, Phil. “Secret Fed Loans Gave Banks $13 Billion Undisclosed to Congress.” BloombergMarkets Magazine, November 28, 2011; www.bloomberg.com/news/2011-11-28/secret-fed-loans-undisclosed-to-congress-gave-banks-13-billion-in-income.html.
Madigan, Brian F. “Bagehot’s Dictum in Practice: Formulating and Implementing Policies to Combat the Financial Crisis.”Remarks at the Federal Reserve Bank of Kansas City’s Annual Economic Symposium on Financial Stability andMacroeconomic Policy, Jackson Hole, Wyoming, August 21, 2009; www.federalreserve.gov/newsevents/speech/madigan20090821a.htm.
Meltzer, Allan H. “Regulatory Reform and the Federal Reserve.” Testimony before the Subcommittee on Monetary Policy,House Committee on Financial Services, July 9, 2009; www.house.gov/apps/list/hearing/financialsvcs_dem/meltzer_testimony.pdf.
Nelson, Edward. “Friedman’s Monetary Economics in Practice.” Finance and Economics Discussion Series 2011-26. Divisions ofResearch and Statistics and Monetary Affairs, Board of Governors of the Federal Reserve System, Washington, DC, 2011;www.federalreserve.gov/pubs/feds/2011/201126/201126pap.pdf.
Poole, William. “The Bernanke Question.” Cato Institute: Commentary, July 28, 2009; www.cato.org/publications/commentary/bernanke-question.
Spong, Kenneth. Banking Regulation: Its Purposes, Implementation, and Effects. Fifth Edition. Kansas City, MO: Federal ReserveBank of Kansas City, 2000; www.kc.frb.org/publicat/bankingregulation/RegsBook2000.pdf.
Gilbert, Kliesen, Meyer, Wheelock
242 May/June 2012 Federal Reserve Bank of St. Louis REVIEW

Close
R. Alton GilbertEconomist emeritus, Federal Reserve Bank of St. Louis
http://research.stlouisfed.org/econ/gilbert/
Research FocusKevin Kliesen’s research focuses on the analysis of macroeconomic conditions, the effects of energy prices onthe economy, labor productivity, and fiscal policy; he also provides reports on economic and business conditionsto assist the Bank president and Board of Directors.
Kevin L. KliesenBusiness economist for the Supervisory Policy and Risk Analysis Unit,Federal Reserve Bank of St. Louis
http://research.stlouisfed.org/econ/kliesen/kkwp.html
Research FocusDave Wheelock’s research focuses on U.S. financial and monetary history, banking, and monetary policy.
David C. WheelockVice president and deputy director of research, Federal Reserve Bank of St. Louis
http://research.stlouisfed.org/econ/wheelock/
Andrew P. MeyerSenior economist in the Banking Supervision and Regulation Division,Federal Reserve Bank of St. Louis
Research FocusAndy Meyer’s research focuses mainly on community bank safety and soundness issues.