Federal Procurement Spending in the Washington Region~2008...
31
Federal Procurement Spending in the Washington Region: 2008 - 2016 Keith Waters Graduate Research Assistant The Stephen S. Fuller Institute for Research on the Washington Region’s Economic Future Schar School of Policy and Government George Mason University May, 2017
Transcript of Federal Procurement Spending in the Washington Region~2008...

Federal Procurement Spending in the Washington Region: 2008 - 2016
Keith Waters
Graduate Research Assistant
The Stephen S. Fuller Institute
for Research on the Washington Region’s Economic Future
Schar School of Policy and Government
George Mason University
May, 2017

2
Executive Summary
Over the thirty years between 1980 and 2010, federal procurement spending in the Washington region increased from $4.2 billion to $81.5 billion. The growth of the Washington region’s economy during this period was directly correlated with these annual increases in federal procurement spending and continues to remain highly dependent on federal outlays for its growth. Dependence on federal procurement spending is a very real concern with the lessons still fresh of the impacts of decreased federal procurement spending under the Budget Control Act of 2011 and the ensuing contraction of the Washington region’s economy in 2014. This report analyzes recent changes in the composition, sources, and distribution of federal procurement spending in the Washington region to provide current information on how spending priorities at the federal level can impact the region.
Federal procurement spending in the Washington region became less concentrated by agency and sub-state region but more concentrated by industry as well as product and service category from 2008 to 2016. Decreased procurement spending by the Department of Defense (DoD) in conjunction with steady spending by other agencies resulted in less concentration of federal procurement spending by agencies. Federal procurement spending also became less concentrated by sub-state region as procurement spending in Northern Virginia had the largest percentage decrease, primarily due to the decreased DoD spending in the sub-state region.
Federal procurement spending in the Washington region by industry became more concentrated over the past eight years. The ten largest categories of goods and services purchased by the federal government increased their share of total federal procurement in the Washington region each year from 2008 to 2016.
Additional research findings include:
• contractors in the Washington region captured between 16.5 percent and 17.7 percent of total national federal procurement dollars each year from 2010 to 2016;
• Department of Defense procurement spending accounted for 38.7 percent of federal procurement spending in the Washington region in 2016, decreasing from 52.0 percent in 2008;
• in 2016, contractors in Northern Virginia accounted for 51.4 percent of total procurement spending in the Washington region, contractors in the District of Columbia secured 27.9 percent, and contractors in Suburban Maryland captured 20.2 percent;
• federal procurement spending by agency was the least diversified in Northern Virginia where DoD spending accounted for 55.7 percent of federal procurement spending in 2016, and the most diversified in the District of Columbia where no single agency accounted for more than 20 percent of total federal procurement spending in 2016;

3
• federal procurement spending for computer system design services in the Washington region increased from $4.6 billion in 2008 to $10.1 billion in 2016 and accounted for 13.7 percent of federal procurement spending regionally;
• while overall procurement spending by DoD in the Washington region declined substantially from 2008 to 2016, procurement spending by the agency for computer system design services and engineering services in the Washington region remained stable; and,
• federal procurement spending on other professional services increased from $4.8 billion in 2008 to $7.8 billion in 2016 and engineering and technical services increased from $3.3 billion in 2008 to $5.6 in 2016.
Federal procurement spending in the Washington region from 2008 to 2016 was marked by three major trends. The first major trend was the decline in federal procurement spending following its peak in 2010 after thirty years of growth. The second trend was a decrease in the concentration of federal procurement dollars by agency and sub-state portion of the Washington region that was primarily the result of large spending decline by DoD. The third trend was the homogenization of purchases by the federal government with fewer categories of products and services accounting for a greater percentage of annual procurement spending. Overall, these trends point to the region’s economy being less dependent on which agency is doing the procurement and more dependent on what products and services are being purchased. Still, the key variable remains the total value of federal procurement contracting as this is a critical determinant of the Washington region’s future economic vitality.

4
Contents
Overview of Regional Procurement Spending ............................................................................. 6
Federal Procurement Spending by Agency .................................................................................. 8
Department of Defense ............................................................................................................ 10
Department of Health and Human Services .......................................................................... 11
Department of Homeland Security ......................................................................................... 11
Other Agencies ......................................................................................................................... 12
Federal Procurement Spending by Sub-State Region ............................................................... 12
Northern Virginia ..................................................................................................................... 12
District of Columbia ................................................................................................................. 13
Suburban Maryland ................................................................................................................. 15
Federal Procurement Spending by Industry ............................................................................. 16
Computer Systems Design Services ........................................................................................ 18
Other Computer-Related Services .......................................................................................... 20
Engineering Services ............................................................................................................... 21
R&D in the Physical, Engineering, and Life Sciences ............................................................ 22
Federal Procurement Spending by Product or Service Category ............................................ 23
Other Professional Services .................................................................................................... 25
Other Information Technology (IT) and Telecommunications ............................................ 26
Engineering and Technical Services ....................................................................................... 27
Conclusions .................................................................................................................................. 29
About These Data ......................................................................................................................... 31
Appendix ....................................................................................................................................... 31
5
Federal Procurement Spending in the National Capital Region: 2008 – 2016
The performance of the Washington region’s economy has been tied to its function as the nation’s capital for 217 years. For most of this period, federal employment and payroll were the principal economic variables that determined the region’s economic performance. In 1950, 32.1 percent of all jobs in the Washington region were federal; by 2016 that percentage decreased to 11.4. But rather than being driven only by changes in federal employment, the region’s economy is now increasingly dependent on changes in local federal procurement spending.
Federal procurement spending in the Washington region grew from $4.2 billion in 1980 to $73.5 billion in 2016. During this period, a total of $1.3 trillion in federal procurement outlays were made in the region for the purchase of goods and services from local businesses and organizations. In 1996 federal procurement spending in the Washington region exceeded the value of the federal payroll in the region for the first time.
Federal procurement outlays in the Washington region peaked in 2010 at $81.5 billion. The implementation of the Budget Control Act of 2011 that included the Sequester (principally impacting federal spending in FY 2013 and 2014), resulted in the first annual decreases in federal procurement spending in the Washington region since 1980. During the thirty-year period from 1980 to 2010, federal procurement spending sustained an upward trend gaining 1,840.5 percent.
The growth of federal procurement spending over this period had a 0.95 correlation with the Washington region’s economic growth measured by its Gross Regional Product (GRP). The more federal procurement spending increased, the greater the gains in the region’s economic growth. When federal procurement spending in the Washington region decreased, as it did between 2010 and 2013, the region’s economy, as measured by GRP also contracted, losing 0.5 percent in 2013 while the US Gross Domestic Product (GDP) gained 1.5 percent (the US GDP growth was negatively impacted by federal government spending reductions at the national level).
The continuing dependence of the Washington region’s economy on federal spending, recent proposals to re-structure federal spending by shifting funds among agencies, and reduced federal spending targeting central office functions located in the District of Columbia raise new questions regarding federal contracting trends in the region. Questions regarding the region’s federal procurement activity include how has federal procurement contracting shifted in recent years among federal agencies and reshaped the region’s distribution of federal contracting across its sub-state region; and, how have patterns changed across the range of goods and services the federal government purchases from local businesses and organizations? The research presented in the following report identifies and analyzes these trends over the 2008-2016 period and is intended to provide an updated framework for
6
assessing how future policy changes potentially reflected in the FY 2018 budget may affect the performance of the Washington region’s future economic growth.
Overview of Regional Procurement Spending
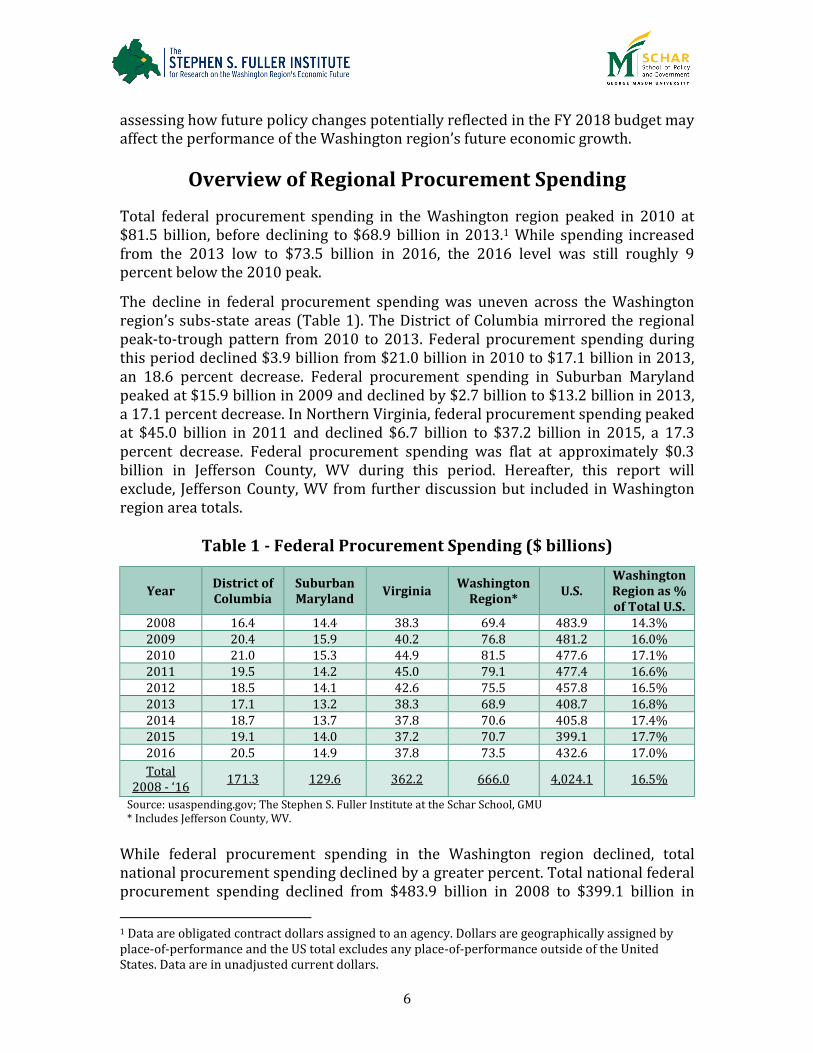
Total federal procurement spending in the Washington region peaked in 2010 at $81.5 billion, before declining to $68.9 billion in 2013.1 While spending increased from the 2013 low to $73.5 billion in 2016, the 2016 level was still roughly 9 percent below the 2010 peak.
The decline in federal procurement spending was uneven across the Washington region’s subs-state areas (Table 1). The District of Columbia mirrored the regional peak-to-trough pattern from 2010 to 2013. Federal procurement spending during this period declined $3.9 billion from $21.0 billion in 2010 to $17.1 billion in 2013, an 18.6 percent decrease. Federal procurement spending in Suburban Maryland peaked at $15.9 billion in 2009 and declined by $2.7 billion to $13.2 billion in 2013, a 17.1 percent decrease. In Northern Virginia, federal procurement spending peaked at $45.0 billion in 2011 and declined $6.7 billion to $37.2 billion in 2015, a 17.3 percent decrease. Federal procurement spending was flat at approximately $0.3 billion in Jefferson County, WV during this period. Hereafter, this report will exclude, Jefferson County, WV from further discussion but included in Washington region area totals.
Table 1 - Federal Procurement Spending ($ billions)
While federal procurement spending in the Washington region declined, total national procurement spending declined by a greater percent. Total national federal procurement spending declined from $483.9 billion in 2008 to $399.1 billion in
1 Data are obligated contract dollars assigned to an agency. Dollars are geographically assigned by place-of-performance and the US total excludes any place-of-performance outside of the United States. Data are in unadjusted current dollars.
Year District of Columbia
Suburban Maryland
Virginia Washington
Region* U.S.
Washington Region as % of Total U.S.
2008 16.4 14.4 38.3 69.4 483.9 14.3%
2009 20.4 15.9 40.2 76.8 481.2 16.0%
2010 21.0 15.3 44.9 81.5 477.6 17.1%
2011 19.5 14.2 45.0 79.1 477.4 16.6%
2012 18.5 14.1 42.6 75.5 457.8 16.5%
2013 17.1 13.2 38.3 68.9 408.7 16.8%
2014 18.7 13.7 37.8 70.6 405.8 17.4%
2015 19.1 14.0 37.2 70.7 399.1 17.7%
2016 20.5 14.9 37.8 73.5 432.6 17.0%
Total 2008 - ‘16
171.3 129.6 362.2 666.0 4,024.1 16.5%
Source: usaspending.gov; The Stephen S. Fuller Institute at the Schar School, GMU * Includes Jefferson County, WV.

7
2015, a decrease of 17.5 percent over this period. Federal procurement spending in the Washington region was only 1.9 percent lower in 2015 as compared with 2008. These changes resulted in the share of total U.S. federal procurement spending captured by federal contractors located in the Washington region increasing from 14.3 percent in 2008 to 17.1 percent in 2010 (Figure 1). The Washington region’s share of total national federal procurement spending remained above 16.5 percent from 2010 to 2016. The increased share of total national procurement spending captured by contractors in the Washington region is notable as it implies that while the Washington region experienced a decline in federal procurement outlays, declines in federal procurement spending were greater elsewhere in the United States.
Figure 1 - Federal Procurement Spending in the Washington Region
Federal procurement spending in the Washington region totaled $660 billion from 2008 through 2016. Over this period, contractors located in Northern Virginia received 54.4 percent of the region’s total procurement, contractors in the District of Columbia received 25.7 percent, and contractors in Maryland received 19.5 percent (Figure 2).1 Contractors in the District of Columbia increased their annual share of regional federal procurement dollars from 23.6 percent in 2008 to 27.9 percent in 2016. Contractors in Northern Virginia lost regional share, declining from 55.2 percent in 2008 to 51.4 percent in 2016. Contractors in Maryland retained their share of total federal procurement spending in the region of about 20.0 percent throughout the period.
1 Contractors in Jefferson County, West Virginia received 0.4 percent
10.0%
11.0%
12.0%
13.0%
14.0%
15.0%
16.0%
17.0%
18.0%
19.0%
50.0
55.0
60.0
65.0
70.0
75.0
80.0
85.0
2008 2009 2010 2011 2012 2013 2014 2015 2016
$ b
ilio
ns
WMA Federal Procurement Spending WMA as % of Total US(right axis)
Source: usaspending.gov; The Stephen S. Fuller Institute at the Schar School, GMU

8
Figure 2 – Distribution of Federal Procurement Spending by Sub-State Region in the Washington Region
Federal Procurement Spending by Agency
Federal procurement spending by agency in the Washington region became less concentrated from 2008 to 2016. The Herfindahl-Hirschman index (HHI) measures market share, taking values ranging from zero to 10,000. Larger values indicate greater market concentration. The HHI applied to federal procurement spending in the Washington region by agency decreased from high concentration (as defined by the Department of Justice) in 2008 to moderate market concentration in 2010, nearly becoming an unconcentrated market in 2016 (Table A-1).
Reduced market concentration was the result of decreased spending by the Department of Defense and the Department of Homeland Security and increased spending by the remaining federal agencies between 2008 and 2016. In 2008, procurement spending by the Department of Defense and the Department of Homeland Security was $43.7 billion and accounted for 63.0 percent of total federal procurement spending in the Washington region. By 2016, these two agencies spent $35.0 billion on contractors located in the Washington region, reducing their share to 48.0 percent. The three agencies that increased their share of federal procurement spending in the Washington region were the Department of Veterans Affairs, the Department of State, and the Department of Health and Human Services.
23.6% 26.6% 25.7% 24.7% 24.6% 24.8% 26.5% 27.0% 27.9%
20.7% 20.7% 18.7% 17.9% 18.6% 19.1% 19.5% 19.8% 20.2%
55.2% 52.4% 55.1% 57.0% 56.4% 55.6% 53.5% 52.7% 51.4%
0.0%
10.0%
20.0%
30.0%
40.0%
50.0%
60.0%
70.0%
80.0%
90.0%
100.0%
2008 2009 2010 2011 2012 2013 2014 2015 2016
DC MD VA WV
Source: usaspending.gov; The Stephen S. Fuller Institute at the Schar School, GMU

9
Figure 3 - Federal Procurement by Agency in the Washington Region
($ billions)
Table 2 – Procurement Spending by Federal Agency in the Washington Region
($ billions)
Agency 2008 2009 2010 2011 2012 2013 2014 2015 2016
Dept. of Defense 36.1 36.6 38.4 39.1 36.4 31.2 30.2 28.1 28.5
Dept. of Health & Human Svcs.
4.2 4.8 5.3 5.1 4.8 5.4 6.1 6.3 7.2
Dept. of Homeland Security
7.6 7.5 7.0 6.4 6.2 5.5 5.6 5.9 6.5
General Services Administration
3.3 5.0 5.4 4.4 3.2 2.9 3.0 3.2 3.4
Dept. of Justice 2.4 3.2 3.0 3.0 3.0 2.9 3.3 3.3 3.4
Dept. of State 1.4 1.6 2.2 1.9 2.2 2.3 2.6 3.0 3.1
Dept. of Transportation 2.2 2.3 2.6 3.1 3.0 2.8 2.8 2.8 2.9
Dept. of Veterans Affairs 0.7 1.0 1.5 1.6 1.6 2.0 2.4 2.6 2.7
Dept. of the Treasury 2.0 2.2 2.3 2.3 2.3 2.2 2.2 2.2 2.5
Dept. of Commerce 1.6 2.0 2.4 1.4 1.4 1.2 1.7 2.0 2.2
Remaining Federal Depts.
7.9 10.5 11.5 10.8 11.3 10.6 10.8 11.5 11.3
Total 69.4 76.8 81.5 79.1 75.5 68.9 70.6 70.7 73.5 Source: usaspending.gov; The Stephen S. Fuller Institute at the Schar School, GMU
36.1 36.6 38.4 39.1 36.4 31.2 30.2 28.1 28.5
4.2 4.8 5.3 5.1 4.85.4 6.1 6.3 7.2
7.6 7.5 7.0 6.4 6.25.5 5.6 5.9 6.5
21.527.8
30.8 28.628.1
26.8 28.7 30.5 31.4
0.0
10.0
20.0
30.0
40.0
50.0
60.0
70.0
80.0
90.0
2008 2009 2010 2011 2012 2013 2014 2015 2016
Department of Defense Department of Health & Human Services
Department of Homeland Security Remaining Federal Departments
Source: usaspending.gov; The Stephen S. Fuller Institute at the Schar School, GMU
10
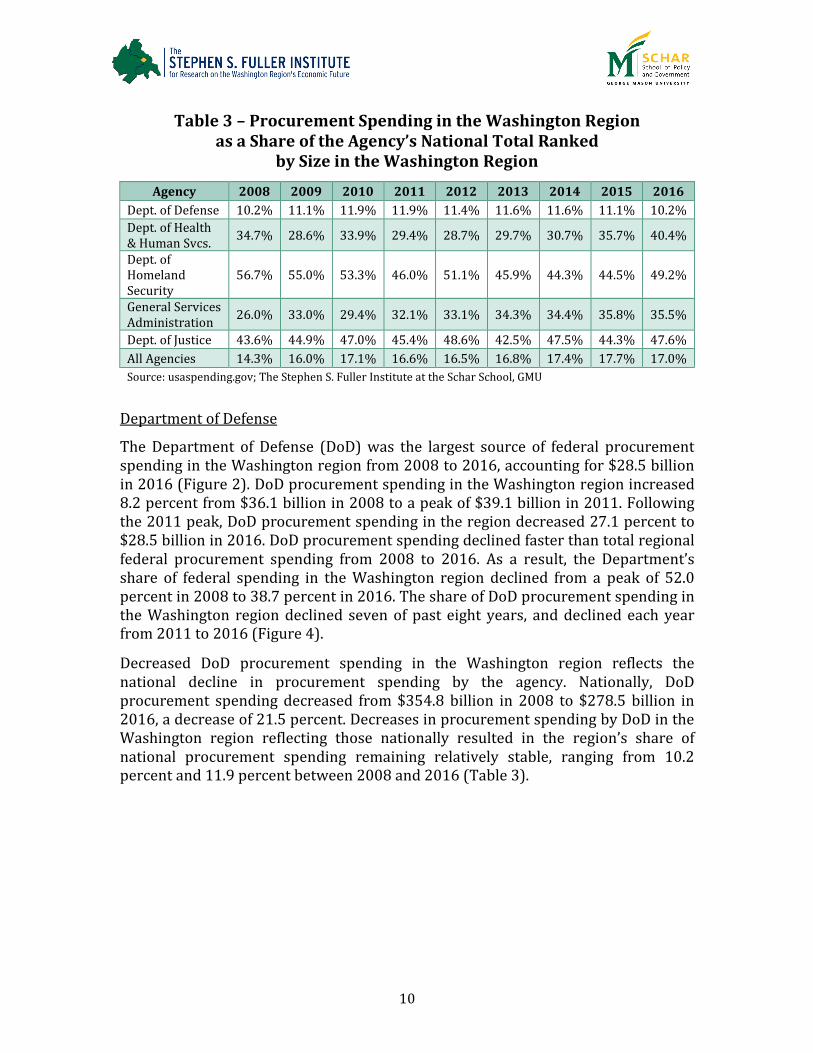
Table 3 – Procurement Spending in the Washington Region as a Share of the Agency’s National Total Ranked
by Size in the Washington Region
Agency 2008 2009 2010 2011 2012 2013 2014 2015 2016
Dept. of Defense 10.2% 11.1% 11.9% 11.9% 11.4% 11.6% 11.6% 11.1% 10.2%
Dept. of Health & Human Svcs.
34.7% 28.6% 33.9% 29.4% 28.7% 29.7% 30.7% 35.7% 40.4%
Dept. of Homeland Security
56.7% 55.0% 53.3% 46.0% 51.1% 45.9% 44.3% 44.5% 49.2%
General Services Administration
26.0% 33.0% 29.4% 32.1% 33.1% 34.3% 34.4% 35.8% 35.5%
Dept. of Justice 43.6% 44.9% 47.0% 45.4% 48.6% 42.5% 47.5% 44.3% 47.6%
All Agencies 14.3% 16.0% 17.1% 16.6% 16.5% 16.8% 17.4% 17.7% 17.0%
Source: usaspending.gov; The Stephen S. Fuller Institute at the Schar School, GMU
Department of Defense
The Department of Defense (DoD) was the largest source of federal procurement spending in the Washington region from 2008 to 2016, accounting for $28.5 billion in 2016 (Figure 2). DoD procurement spending in the Washington region increased 8.2 percent from $36.1 billion in 2008 to a peak of $39.1 billion in 2011. Following the 2011 peak, DoD procurement spending in the region decreased 27.1 percent to $28.5 billion in 2016. DoD procurement spending declined faster than total regional federal procurement spending from 2008 to 2016. As a result, the Department’s share of federal spending in the Washington region declined from a peak of 52.0 percent in 2008 to 38.7 percent in 2016. The share of DoD procurement spending in the Washington region declined seven of past eight years, and declined each year from 2011 to 2016 (Figure 4).
Decreased DoD procurement spending in the Washington region reflects the national decline in procurement spending by the agency. Nationally, DoD procurement spending decreased from $354.8 billion in 2008 to $278.5 billion in 2016, a decrease of 21.5 percent. Decreases in procurement spending by DoD in the Washington region reflecting those nationally resulted in the region’s share of national procurement spending remaining relatively stable, ranging from 10.2 percent and 11.9 percent between 2008 and 2016 (Table 3).

11
Figure 4 – DoD Share of Federal Procurement Spending in the Washington Region
Department of Health and Human Services
The Department of Health and Human Services (HHS) was the second largest source of federal procurement spending in the region in 2016. HHS procurement spending in the Washington region increased from $4.2 billion in 2008 to $7.2 billion in 2016, an increase of 70.9 percent. In 2016, HHS accounted for 9.7 percent of total federal procurement spending in the Washington region, up from 6.0 percent in 2008.
Nationally, HHS spending increased at a slower rate than in the Washington region as the region’s contractors captured a larger share of spending between 2008 and 2016. Total national procurement dollars from HHS increased from $12.1 billion in 2008 to $17.7 billion in 2016, an increase of 46.8 percent. The differences in spending growth regionally and nationally resulted in the share of HHS procurement spending secured by contractors located in the Washington region increasing from 34.7 percent in 2008 to 40.4 percent in 2016. Department of Homeland Security
The third largest source of procurement spending in the Washington region in 2016 was the Department of Homeland Security (DHS). DHS procurement spending decreased annually from $7.6 billion in 2008 to $5.5 billion in 2013 before increasing to $6.5 billion in 2016. The decrease in spending by DHS approximately matched declines in total federal procurement spending in the Washington region. The similar declines resulted in the agency’s share of total regional federal procurement spending remaining around 8.5 percent from 2008 to 2016.
The decreased procurement spending by DHS in the Washington region reflected decreases in national procurement spending by the agency as well as shifts in where procurement dollars were spent. Nationally, DHS procurement spending declined from $13.4 billion in 2008 to $13.1 billion in 2016 (-1.9%). DHS procurement spending in the Washington region decreased by 14.8 percent over the same period,
52.0%47.7% 47.1%
49.4% 48.2%45.3%
42.8%39.7% 38.7%
0.0%
10.0%
20.0%
30.0%
40.0%
50.0%
60.0%
2008 2009 2010 2011 2012 2013 2014 2015 2016
Source: usaspending.gov; The Stephen S. Fuller Institute at the Schar School, GMU

12
resulting in the share of DHS procurement dollars spent in the region decreasing from 56.7 percent in 2008 to 49.2 percent in 2016 (Table 3). Other Agencies
The remainder of federal agencies collectively purchased $31.4 billion in products and services in the region in 2016, approximately $10 billion more than in 2008. Notable changes in spending include increases by the Department of State and the Department of Veterans Affairs.
Federal Procurement Spending by Sub-State Region
Federal procurement spending varies substantially across the sub-state regions. Contractors in Northern Virginia captured the largest share of federal procurement spending in the region, $37.8 billion in 2016. Contractors in the District of Columbia and Suburban Maryland secured 20.5 billion and $14.9 billion in 2016 respectively. Varied spending by agency among the sub-state regions results in differing levels of procurement spending by agency as measured by the Herfindahl-Hirschman index (HHI).1 Procurement spending in the District of Columbia is the most diversified; no single agency accounted for more than 20 percent of total federal procurement spending in 2016. In contrast, Northern Virginia is deeply reliant on procurement spending by the Department of Defense, the agency accounted for 55.7 percent of regional spending. While federal procurement spending in Northern Virginia became less concentrated from 2008 to 2016, this was due entirely to decreased spending by the Department of Defense and relatively steady spending among the other agencies. Northern Virginia
Contractors located in Northern Virginia captured the largest share of the region’s federal procurement spending from 2008 through 2016. In 2016, contractors in Northern Virginia secured $37.8 billion in federal procurement spending, 51.4 percent of all federal procurement dollars in the Washington region (Table 4). Federal spending in Northern Virginia peaked at $45.0 billion in 2011, declining every year through 2015 to $37.2 billion. While federal procurement spending increased from 2015 to 2016, federal procurement spending in Northern Virginia remained 15.9 percent below the 2011 peak. The share of total federal procurement spending in the Washington region secured by contractors in Northern Virginia declined every year from 57.0 percent in 2011 to 51.4 percent in 2016.
Market concentration of federal procurement spending by agency, measured using HHI, in Northern Virginia was also the highest among sub-state regions. From 2008 to 2016, federal procurement spending in Northern Virginia was highly concentrated among relatively few agencies. The concentration was the result of DoD spending in Northern Virginia.
1 See Appendix Table A-1 for discussion of the index.
13
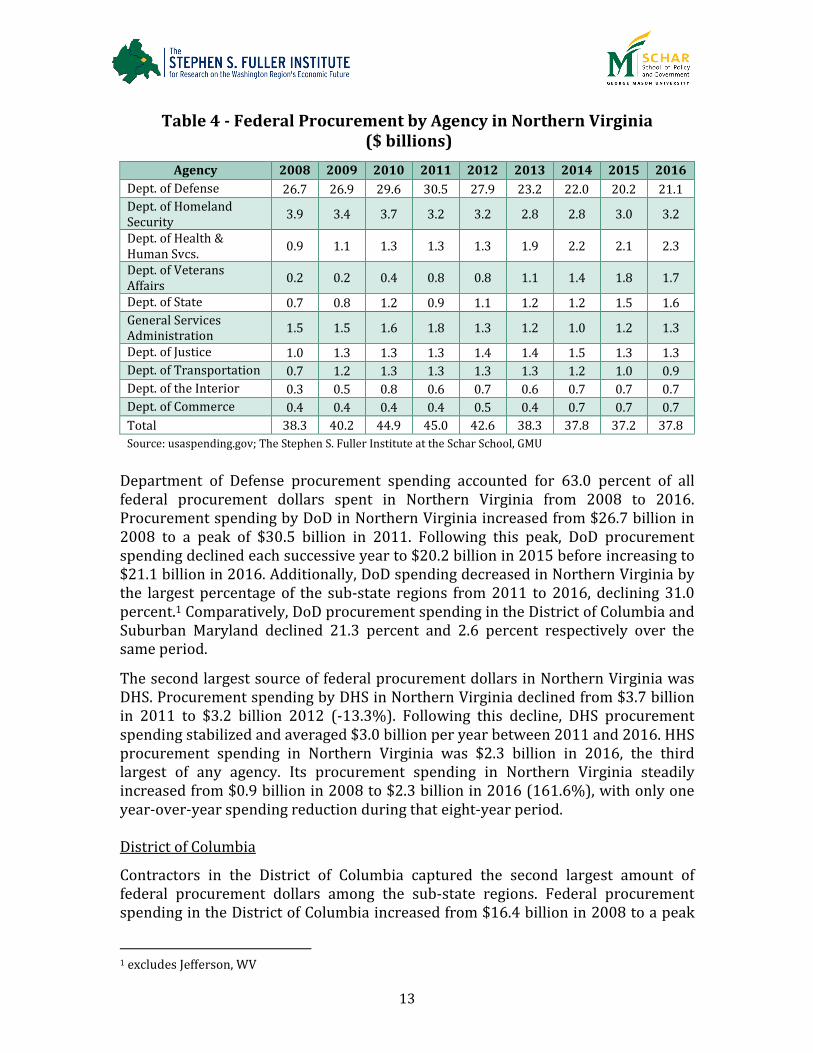
Table 4 - Federal Procurement by Agency in Northern Virginia ($ billions)
Agency 2008 2009 2010 2011 2012 2013 2014 2015 2016
Dept. of Defense 26.7 26.9 29.6 30.5 27.9 23.2 22.0 20.2 21.1
Dept. of Homeland Security
3.9 3.4 3.7 3.2 3.2 2.8 2.8 3.0 3.2
Dept. of Health & Human Svcs.
0.9 1.1 1.3 1.3 1.3 1.9 2.2 2.1 2.3
Dept. of Veterans Affairs
0.2 0.2 0.4 0.8 0.8 1.1 1.4 1.8 1.7
Dept. of State 0.7 0.8 1.2 0.9 1.1 1.2 1.2 1.5 1.6
General Services Administration
1.5 1.5 1.6 1.8 1.3 1.2 1.0 1.2 1.3
Dept. of Justice 1.0 1.3 1.3 1.3 1.4 1.4 1.5 1.3 1.3
Dept. of Transportation 0.7 1.2 1.3 1.3 1.3 1.3 1.2 1.0 0.9
Dept. of the Interior 0.3 0.5 0.8 0.6 0.7 0.6 0.7 0.7 0.7
Dept. of Commerce 0.4 0.4 0.4 0.4 0.5 0.4 0.7 0.7 0.7
Total 38.3 40.2 44.9 45.0 42.6 38.3 37.8 37.2 37.8
Source: usaspending.gov; The Stephen S. Fuller Institute at the Schar School, GMU
Department of Defense procurement spending accounted for 63.0 percent of all federal procurement dollars spent in Northern Virginia from 2008 to 2016. Procurement spending by DoD in Northern Virginia increased from $26.7 billion in 2008 to a peak of $30.5 billion in 2011. Following this peak, DoD procurement spending declined each successive year to $20.2 billion in 2015 before increasing to $21.1 billion in 2016. Additionally, DoD spending decreased in Northern Virginia by the largest percentage of the sub-state regions from 2011 to 2016, declining 31.0 percent.1 Comparatively, DoD procurement spending in the District of Columbia and Suburban Maryland declined 21.3 percent and 2.6 percent respectively over the same period.
The second largest source of federal procurement dollars in Northern Virginia was DHS. Procurement spending by DHS in Northern Virginia declined from $3.7 billion in 2011 to $3.2 billion 2012 (-13.3%). Following this decline, DHS procurement spending stabilized and averaged $3.0 billion per year between 2011 and 2016. HHS procurement spending in Northern Virginia was $2.3 billion in 2016, the third largest of any agency. Its procurement spending in Northern Virginia steadily increased from $0.9 billion in 2008 to $2.3 billion in 2016 (161.6%), with only one year-over-year spending reduction during that eight-year period. District of Columbia
Contractors in the District of Columbia captured the second largest amount of federal procurement dollars among the sub-state regions. Federal procurement spending in the District of Columbia increased from $16.4 billion in 2008 to a peak
1 excludes Jefferson, WV

14
of $21.0 billion in 2010. Following this peak, federal procurement spending declined each year to $17.1 billion in 2013 before increasing to $20.5 billion in 2016. While federal procurement spending in the District of Columbia was still below the 2010 peak, federal procurement spending in the District of Columbia was only 2.1 percent below the peak, closer to its peak than either Suburban Maryland or Northern Virginia.
Among the sub-state regions, the District of Columbia has the most diversified federal procurement dollars across federal agencies. Federal procurement spending in the District of Columbia became less concentrated, measured using HHI, from 2008 to 2016 (Table A1). In 2008, DoD and DHS accounted for 29.0 percent and 19.4 percent of total procurement spending in the District of Columbia, respectively. By 2016, no single agency accounted for more than 19.0 percent of total federal procurement spending in the District of Columbia. Diversification across federal agencies is further highlighted by the fact that seven federal agencies spent more than $1.0 billion dollars for products and services from contractors located in the District of Columbia, for a combined $14.0 billion (Table 5)
The largest sources of federal procurement spending in the District of Columbia were DoD and DHS. DoD procurement spending in the District of Columbia was $3.8 billion in 2016. Although DoD procurement spending remained the largest source of procurement dollars throughout the 2008 to 2016 period in the District of Columbia, it steadily decreased by $1.0 billion between 2011 and 2016 (-20.8%). DHS procurement spending decreased $1.3 billion between the 2009 peak and 2014 (-20%). Between 2014 and 2016, however, DHS procurement spending in the District of Columbia increased by $0.6 billion (27.2%) to $2.8 billion. In addition to DoD and DHS, five additional agencies that spent more than $1.0 billion on contractors in the District of Columbia include the Department of Justice, General Services Administration, Department of State, Department of Transportation, and the Agency for International Development. Combined, these agencies accounted for 68.2 percent of the procurement spending in the District.

15
Table 5 - Federal Procurement by Agency in the District of Columbia ($ billions)
Agency 2008 2009 2010 2011 2012 2013 2014 2015 2016
Dept. of Defense 4.8 4.8 4.6 4.8 4.4 4.3 4.2 4.0 3.8
Dept. of Homeland Security
3.2 3.5 3.0 2.7 2.5 2.3 2.2 2.4 2.8
Dept. of Justice 1.2 1.5 1.4 1.3 1.3 1.3 1.7 1.8 1.9
General Services Administration
1.3 2.9 2.9 2.0 1.4 1.3 1.6 1.6 1.7
Dept. of State 0.6 0.7 0.9 0.9 1.1 1.0 1.3 1.4 1.4
Dept. of Transportation 0.6 0.5 0.9 1.1 1.0 0.9 1.0 1.1 1.3
Agency for International Development
0.3 0.3 0.3 0.3 0.3 0.3 0.4 0.4 1.1
Dept. of the Treasury 0.8 0.9 0.8 0.8 0.8 0.8 0.8 0.8 0.8
Dept. of Labor 0.4 0.5 0.6 0.6 0.6 0.6 0.6 0.7 0.8
Dept. of Veterans Affairs
0.3 0.5 0.8 0.6 0.5 0.5 0.6 0.4 0.6
Total 16.4 20.4 21.0 19.5 18.5 17.1 18.7 19.1 20.5 Source: usaspending.gov; The Stephen S. Fuller Institute at the Schar School, GMU
Suburban Maryland
Contractors in Suburban Maryland captured the fewest federal procurement dollars of the three sub-state regions in 2016. Federal procurement spending in Suburban Maryland peaked at $15.9 billion in 2009 before declining to $13.2 billion in 2013. Federal procurement spending in the sub-state region subsequently increased each year, rising to $14.9 billion in 2016. Federal procurement spending in Suburban Maryland in 2016 was 6.4 percent below its 2009 peak.
Federal procurement spending in Suburban Maryland by agency was moderately concentrated, measured using HHI, in 2016. The level of concentration approximately reflected the concentration of the broader Washington region. Market concentration of federal procurement spending in Suburban Maryland by agency was moderately concentrated for all but one year from 2008 to 2016 (Table A-1).
Two agencies resulted in about one-half of the federal procurement spending in Suburban Maryland: HHS and DoD (Table 6). While HHS procurement spending in Suburban Maryland fluctuated from year to year, from a recent low of 2012 of $3.2 billion to $4.4 billion in 2016, HHS procurement spending in Suburban Maryland trended upward from 2008 to 2016. In contrast, DoD gradually reduced procurement spending in the Suburban Maryland region, declining from the peak of $4.9 billion in 2009 to $3.6 billion in 2016, a decrease of 26.8 percent. In addition to HHS and DoD, the only other agency that spent more than $1.0 billion on contractors located in Suburban Maryland was the National Aeronautics and Space Administration (NASA).

16
Table 6 - Federal Procurement by Agency in Suburban Maryland ($ billions)
Agency 2008 2009 2010 2011 2012 2013 2014 2015 2016
Dept. of Health & Human Svcs.
3.1 3.4 3.7 3.3 3.2 3.3 3.6 3.8 4.4
Dept. of Defense 4.6 4.9 4.2 3.7 4.1 3.7 4.0 3.8 3.6
National Aeronautics and Space Administration
1.2 1.2 1.2 1.3 1.4 1.5 1.3 1.4 1.5
Dept. of Commerce 1.1 1.5 1.9 0.9 0.8 0.7 0.9 1.0 1.3
Dept. of the Treasury 0.8 0.8 0.9 1.0 0.9 0.8 0.8 0.7 0.9
Dept. of Transportation 0.9 0.6 0.4 0.7 0.7 0.6 0.6 0.6 0.7
General Services Administration
0.6 0.6 0.8 0.6 0.5 0.4 0.4 0.4 0.4
Dept. of Homeland Security
0.4 0.5 0.2 0.3 0.4 0.3 0.4 0.4 0.3
Dept. of Energy 0.3 0.3 0.3 0.2 0.2 0.2 0.2 0.3 0.3
Dept. of Veterans Affairs
0.1 0.1 0.2 0.2 0.3 0.3 0.4 0.3 0.2
Total 14.4 15.9 15.3 14.2 14.1 13.2 13.7 14.0 14.9 Source: usaspending.gov; The Stephen S. Fuller Institute at the Schar School, GMU
Federal Procurement Spending by Industry
The composition of federal procurement spending by industrial classification in the Washington region became less diverse between 2008 and 2016. Industrial classifications are defined by production processes of the contracting organization in order to group similar establishments and firms for statistical reporting. Federal procurement spending by industrial classification is reported by place-of-performance. Data are aggregated by the industrial classification of the contractor, as well as where the work is being carried out.
The ten industrial classifications receiving the most federal procurement spending in the Washington region accounted for just 52.4 percent in 2009.1 By 2016, the top ten industries accounted for 62.5 percent of all the region’s procurement in 2016, an increase of 10.1 percent points (Figure 5). In 2016, six of the ten largest industrial classifications by federal procurement spending in the Washington region received over one-half of the total national federal procurement spending in their respective industrial classification. Between 2008 to 2016, the largest increases in federal procurement spending in the Washington region were in the computer systems design services industry, other computer-related services industry, and the research and development (R&D) in physical, engineering and life sciences industries (Table 7).
1 Concentration of federal procurement spending was calculated for the ten largest industries for each year. Industries were not constant across years.

17
Figure 5 –Federal Procurement Spending in the Top Ten Industries as a Share of Total Spending in the Washington Region
Table 7 – Procurement Spending by Industry
in the Washington Region ($ billions)
NAICS - Industry 2008 2009 2010 2011 2012 2013 2014 2015 2016
Computer Systems Design Svcs.
4.6 5.2 5.3 5.3 6.1 6.2 8.1 9.3 10.1
Other Computer-Related Svcs.
5.2 5.4 6.3 7.3 7.5 7.5 7.8 7.4 7.6
Engineering Svcs. 7.4 7.8 8.2 9.4 8.8 7.0 6.5 6.7 7.3
Administrative Mgmnt. & General Mgmnt. Consulting Svcs.
4.9 6.0 6.7 6.2 5.8 5.8 5.8 6.2 6.5
R&D in the Physical, Engineering, and Life Sciences (Except Biotechnology)
0.9 1.9 2.9 3.1 3.9 3.6 4.2 4.5 4.8
Custom Computer Programming Svcs.
2.9 3.0 3.1 3.2 3.4 3.2 3.1 2.9 3.0
All Other Professional, Scientific, and Technical Svcs.
2.2 2.2 1.8 1.9 1.9 2.0 2.3 2.4 2.4
Facilities Support Svcs. 1.2 1.0 1.4 1.4 1.8 1.4 1.4 1.3 1.6
Data Processing, Hosting, and Related Svcs.
0.4 0.5 0.5 0.5 0.5 0.6 0.7 1.1 1.4
Computer Facilities Mgmnt. Svcs.
1.3 1.8 2.0 2.1 2.1 1.8 1.7 1.2 1.4
Remainder 38.4 42.1 43.5 38.6 33.7 29.8 28.8 27.5 27.5
Total 69.4 76.8 81.5 79.1 75.5 68.9 70.6 70.7 73.5 Source: usaspending.gov; The Stephen S. Fuller Institute at the Schar School, GMU
52.6% 52.4% 52.6%
55.1%
57.9% 58.5%
60.4%61.4%
62.5%
46.0%
48.0%
50.0%
52.0%
54.0%
56.0%
58.0%
60.0%
62.0%
64.0%
2008 2009 2010 2011 2012 2013 2014 2015 2016
Source: usaspending.gov; The Stephen S. Fuller Institute at the Schar School, GMU

18
Table 8 – Procurement Spending by Industry in the Washington Region as a Share of Industry’s National Total
NAICS - Industry
2008 2009 2010 2011 2012 2013 2014 2015 2016
Computer Systems Design Svcs.
60.0% 61.9% 59.0% 54.9% 55.7% 54.1% 58.8% 61.1% 60.0%
Other Computer- Related Svcs.
52.4% 50.9% 56.1% 62.6% 64.8% 64.5% 63.6% 62.1% 59.4%
Engineering Svcs.
20.2% 19.4% 22.4% 26.0% 27.7% 25.3% 25.1% 26.3% 25.6%
Administrative Mgmnt. & General Mgmnt. Consulting Svcs.
65.6% 68.1% 67.9% 69.1% 66.5% 66.5% 65.4% 66.4% 64.3%
R&D in the Physical, Engineering, and Life Sciences*
13.7% 17.5% 19.0% 17.6% 19.7% 17.3% 18.8% 19.0% 17.4%
Custom Computer Programming Svcs.
50.1% 52.7% 54.0% 54.2% 60.4% 63.1% 61.2% 61.9% 59.8%
All Other Professional, Scientific, and Technical Svcs.
30.0% 24.7% 23.3% 26.1% 25.5% 30.2% 32.0% 37.0% 38.6%
Facilities Support Svcs.
7.4% 5.5% 8.1% 8.4% 10.7% 8.8% 8.7% 7.8% 8.9%
Data Processing, Hosting, and Related Svcs.
47.2% 51.3% 47.4% 50.3% 55.3% 58.5% 58.7% 60.4% 64.9%
Computer Facilities Mgmnt. Svcs.
45.8% 54.9% 56.1% 59.4% 61.5% 60.3% 55.1% 53.7% 60.1%
Remainder 10.0% 11.5% 12.0% 10.8% 9.9% 10.0% 10.0% 9.8% 9.1%
Total 14.3% 16.0% 17.1% 16.6% 16.5% 16.8% 17.4% 17.7% 17.0%
Source: usaspending.gov; The Stephen S. Fuller Institute at the Schar School, GMU. *Except Biotechnology
Computer Systems Design Services
Computer systems design services contractors in the Washington region secured $10.1 billion in federal procurement spending in 2016, the largest of any industrial classification. Federal procurement spending for computer systems design services from contractors located in the Washington region increased from $4.6 billion in 2008 to $10.1 billion in 2016, an increase of 118.3 percent (Table 7). The increased spending primarily occurred after 2013; federal procurement spending in the

19
classification increased 63.3 percent between 2013 and 2016, becoming the largest industry for federal procurement spending in the Washington region in 2014.
The growth of federal procurement spending in the computer systems design services industry in the Washington region was perhaps the most notable development in regional federal procurement spending during this period. Federal procurement spending in the computer systems design industry accounted for 13.7 percent of total federal procurement spending in the Washington region in 2016. In 2008, this share was just 6.7 percent. The Washington region captured 60.0 percent of total national federal procurement spending in the in the computer system design services industry in 2016 (Table 8).
The three largest sources of procurement spending for computer systems design services in the Washington region in 2016 were DoD, HHS, and the Government Services Administration (GSA). These agencies all increased spending for computers systems design services from 2008 to 2016. DoD procurement spending in the computer systems design services industry increased from $1.5 billion in 2008 to $3.3 billion in 2016, an increase of 64.9 percent. DoD procurement spending accounted for 24.0 percent of total federal procurement spending in the Washington region’s computer systems design classification in 2016 (Table 9). HHS spending in the computer systems design industry in the Washington region increased from $0.5 billion in 2008 to $1.2 billion, an increase of 134.9 percent Spending by HHS accounted for 12.2 percent of total federal procurement spending in the region's industry in 2016. GSA procurement spending for computers systems design services in the Washington region increased from $0.5 billion in 2008 to $1.1 billion in 2016, an increase of 111.9 percent. In 2016, the GSA accounted for 11.3 percent of total federal procurement spending in this industry.
Table 9 – Share Computer Systems Design Industry Spending by Agency in the Washington Region
Agency 2008 2009 2010 2011 2012 2013 2014 2015 2016
Department of Defense
31.8% 20.3% 15.8% 20.8% 24.9% 27.8% 25.7% 24.9% 24.0%
Department of Health and Human Svcs.
11.3% 10.0% 9.7% 10.6% 9.2% 10.5% 11.6% 10.5% 12.2%
General Svcs. Administration
11.6% 12.3% 10.2% 15.8% 11.1% 11.8% 11.8% 11.8% 11.3%
Department of Homeland Security
4.6% 7.7% 6.7% 3.5% 6.5% 5.8% 7.0% 8.3% 10.6%
Department of Veterans Affairs
1.0% 1.1% 1.8% 3.8% 5.5% 7.9% 9.2% 10.9% 9.0%
Remainder 39.7% 48.6% 55.7% 45.6% 42.9% 36.1% 34.7% 33.5% 32.9%
Total 100% 100% 100% 100% 100% 100% 100% 100% 100%
Source: usaspending.gov; The Stephen S. Fuller Institute at the Schar School, GMU. Agency shares may not sum to 100% due to rounding.
20
Other Computer-Related Services
Contractors in the other computer-related services industrial classification captured the second most federal procurement dollars in the Washington region in 2016, increasing from $5.2 billion in 2008 to $7.6 billion in 2016 (Table 7). This classification includes computer services that are not primarily programming, design and management like software installation services and disaster recovery services. Federal procurement spending growth in the other computer-related services classification in the Washington region was primarily at the beginning of the study period, increasing 39.4 percent from 2008 to 2011 and only 3.5 percent from 2011 to 2016. Contractors in the Washington region captured 59.4 percent of total national federal procurement spending in this classification in 2016 (Table 8). From 2008 to 2010, the Washington region captured 52.4 percent to 56.1 percent of total national federal procurement spending in the industrial classification. From 2011 to 2016, contractors in the Washington region secured 59.4 percent to 64.8 percent of total national federal procurement spending in the classification.
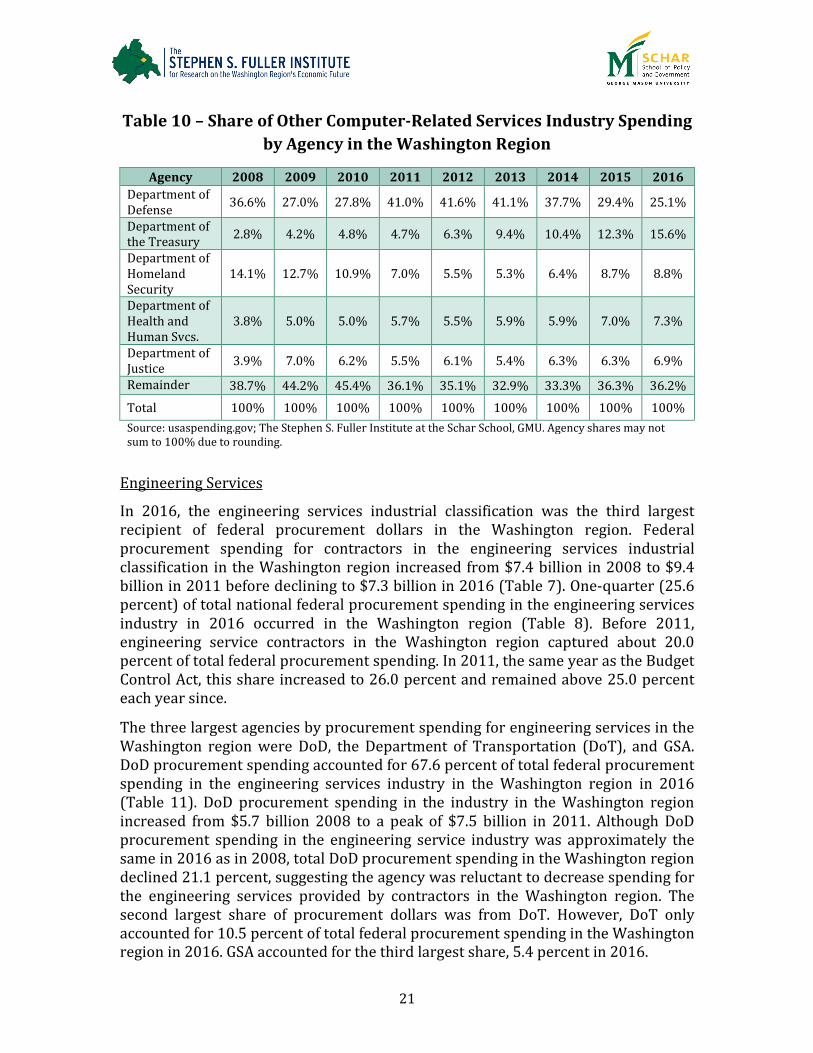
The three federal agencies that provided the most procurement spending in the Washington region were DoD, the Department of Treasury, and DHS. DoD spent $1.9 billion in the other computer-related services industry in the Washington region, the largest amount of any agency. DoD increased spending in this industry from $1.9 billion in 2008 to $3.1 billion in 2012. Following the 2012 peak, DoD procurement spending in the other computer-related services industry declined to $1.9 billion in 2016. In 2008, DoD procurement spending was 36.6 percent of all procurement spending in the other computer-related services industry in the Washington region. This share increased to 41.6 percent in 2012 before declining to 25.1 percent (Table 10). The Department of Treasury accounted for the second largest share of federal procurement dollars spent in the other computer-related services industry accounting for 15.6 percent of total federal procurement spending in 2016. The Department of Treasury spending in this industry increased from $0.1 billion in 2008 to $1.2 billion in 2016 and, as a result, increased its share from 2.8 percent in 2008. In both 2008 and 2016, DHS spent $0.7 billion dollars in the other computer-related services industry. In concert with increased spending by other agencies, DHS’s share of federal procurement spending in the Washington region decreased from 14.1 percent in 2008 to 8.8 percent in 2016.
21
Table 10 – Share of Other Computer-Related Services Industry Spending
by Agency in the Washington Region
Agency 2008 2009 2010 2011 2012 2013 2014 2015 2016
Department of Defense
36.6% 27.0% 27.8% 41.0% 41.6% 41.1% 37.7% 29.4% 25.1%
Department of the Treasury
2.8% 4.2% 4.8% 4.7% 6.3% 9.4% 10.4% 12.3% 15.6%
Department of Homeland Security
14.1% 12.7% 10.9% 7.0% 5.5% 5.3% 6.4% 8.7% 8.8%
Department of Health and Human Svcs.
3.8% 5.0% 5.0% 5.7% 5.5% 5.9% 5.9% 7.0% 7.3%
Department of Justice
3.9% 7.0% 6.2% 5.5% 6.1% 5.4% 6.3% 6.3% 6.9%
Remainder 38.7% 44.2% 45.4% 36.1% 35.1% 32.9% 33.3% 36.3% 36.2%
Total 100% 100% 100% 100% 100% 100% 100% 100% 100%
Source: usaspending.gov; The Stephen S. Fuller Institute at the Schar School, GMU. Agency shares may not sum to 100% due to rounding.
Engineering Services
In 2016, the engineering services industrial classification was the third largest recipient of federal procurement dollars in the Washington region. Federal procurement spending for contractors in the engineering services industrial classification in the Washington region increased from $7.4 billion in 2008 to $9.4 billion in 2011 before declining to $7.3 billion in 2016 (Table 7). One-quarter (25.6 percent) of total national federal procurement spending in the engineering services industry in 2016 occurred in the Washington region (Table 8). Before 2011, engineering service contractors in the Washington region captured about 20.0 percent of total federal procurement spending. In 2011, the same year as the Budget Control Act, this share increased to 26.0 percent and remained above 25.0 percent each year since.
The three largest agencies by procurement spending for engineering services in the Washington region were DoD, the Department of Transportation (DoT), and GSA. DoD procurement spending accounted for 67.6 percent of total federal procurement spending in the engineering services industry in the Washington region in 2016 (Table 11). DoD procurement spending in the industry in the Washington region increased from $5.7 billion 2008 to a peak of $7.5 billion in 2011. Although DoD procurement spending in the engineering service industry was approximately the same in 2016 as in 2008, total DoD procurement spending in the Washington region declined 21.1 percent, suggesting the agency was reluctant to decrease spending for the engineering services provided by contractors in the Washington region. The second largest share of procurement dollars was from DoT. However, DoT only accounted for 10.5 percent of total federal procurement spending in the Washington region in 2016. GSA accounted for the third largest share, 5.4 percent in 2016.

22
Table 11 – Share of Engineering Services Industry Spending by Agency in the Washington Region
Agency 2008 2009 2010 2011 2012 2013 2014 2015 2016
Department of Defense
77.9% 75.9% 77.1% 79.3% 77.3% 76.5% 75.4% 71.9% 67.6%
Department of Transportation
4.4% 5.6% 6.7% 8.2% 9.1% 10.3% 10.9% 11.2% 10.5%
General Svcs. Administration
1.2% 1.4% 1.2% 1.1% 1.3% 1.6% 1.3% 5.0% 5.4%
National Aeronautics and Space Administration
3.5% 3.4% 3.5% 2.9% 3.6% 3.9% 4.5% 4.6% 4.5%
Department of Homeland Security
9.7% 8.7% 5.5% 4.9% 4.6% 3.4% 2.9% 2.8% 4.0%
Remainder 3.4% 5.0% 6.0% 3.6% 4.1% 4.4% 5.1% 4.6% 7.9%
Total 100% 100% 100% 100% 100% 100% 100% 100% 100%
Source: usaspending.gov; The Stephen S. Fuller Institute at the Schar School, GMU. Agency shares may not sum to 100% due to rounding.
R&D in the Physical, Engineering, and Life Sciences
Of the largest ten industries by federal procurement spending in the Washington region, the research and development (R&D) in the physical, engineering, and life sciences (except biotechnology) industry was the fastest growing between 2008 and 2016. Contractors in the R&D in the physical, engineering, and life sciences industry in the Washington region secured $4.8 billion in federal procurement dollars in 2016, a 449.7 percent increase from $0.9 billion in 2008 (Table 7). The significant increase in federal procurement spending in the industry also occurred nationally. Total national federal procurement spending in these industries grew 331.8 percent from 2008 to 2016. Correspondingly, the share of federal procurement spending captured by contractors in the Washington region was between 17 and 20 percent for most of this period (Table 8).
In 2016, DoD procurement spending accounted for 69.7 percent of total federal spending in the R&D in the physical, engineering, and life sciences industry in the Washington region, down from 89.6 percent in 2010 (Table 12). DoD procurement spending in this industry increased from $0.3 billion in 2008 to $3.3 billion in 2016, an increase of 353.2 percent. The $3.0 billion increase by DoD drove the majority of the increase for the industry as a whole, accounting for 66.4 percent of the total gain during the 2008-2016 period. Increased spending in the R&D in the physical, engineering, and life sciences industry combined with decreases in overall spending by the DoD has resulted in the share of DoD spending in the Washington region allocated to this industry increasing from 2.0 percent in 2008 to 11.7 percent in 2016.

23
Table 12 – Share of Research and Development in the Physical, Engineering, and Life Sciences Industry Spending
by Agency in the Washington Region
Agency 2008 2009 2010 2011 2012 2013 2014 2015 2016
Department of Defense
84.6% 89.6% 87.5% 79.3% 76.6% 66.4% 69.2% 68.7% 69.7%
National Aeronautics and Space Administration
1.7% 1.8% 3.3% 8.2% 9.7% 16.3% 14.7% 14.2% 13.4%
Department of Health and Human Svcs.
11.1% 3.6% 3.9% 4.5% 5.3% 7.3% 6.1% 5.0% 4.9%
Department of Transportation
0.2% 0.4% 1.3% 1.9% 2.9% 4.9% 4.7% 4.2% 4.6%
Department of Homeland Security
0.4% 2.9% 2.6% 2.6% 1.1% 1.1% 0.6% 3.2% 2.8%
Remainder 2.0% 1.7% 1.4% 3.6% 4.4% 4.1% 4.7% 4.6% 4.6%
Total 100% 100% 100% 100% 100% 100% 100% 100% 100%
Source: usaspending.gov; The Stephen S. Fuller Institute at the Schar School, GMU. Agency shares may not sum to 100% due to rounding.
Federal Procurement Spending
by Product or Service Category
Federal procurement spending on products and services in the Washington region
became more concentrated among top categories from 2008 to 2016. Product and
service categories specify the main purchase of the contract, while the industry
describes the main activity of the contracting firm. The product and service
categories receiving the most federal procurement dollars in 2016 are: other
professional services, other information technology (IT) and telecommunications,
engineering and technical services, program management support services and
automatic data processing (ADP) software (Table 13).
The top ten product and service categories accounted for 47.7 percent of total
federal procurement spending in the Washington region in 2016, up from 41.5
percent in 2008.1 The increased share of federal procurement spending captured by
the top ten product and service categories points to a consolidation of federal
purchases in the Washington region. As a share of total national procurement
spending, the Washington region captured the largest proportion of ADP Systems
Development services, and IT & telecommunications programming product and
service categories (Table 14).
1 Concentration of federal procurement spending was calculated for the ten largest product or service categories for each year. Product or service categories were not constant across years.

24
Table 13 - Federal Procurement Spending by Product or Service Category in the Washington Region
($ billions)
Product or Service Category
2008 2009 2010 2011 2012 2013 2014 2015 2016
Other Professional Svcs. 4.8 5.9 6.2 6.8 7.4 7.7 7.8 7.9 7.8
IT and Telecom - Other IT and Telecommunications
7.0 7.8 8.1 8.8 7.6 7.3 7.0 6.6 6.6
Engineering and Technical Svcs.
3.3 4.1 4.7 4.9 5.7 4.7 4.2 4.5 5.6
Program Management/Support Svcs.
3.5 3.8 4.5 3.9 4.2 3.5 3.9 3.9 4.0
ADP Software 1.6 2.3 2.4 2.6 2.3 2.4 3.1 3.2 3.3
Other Management Support Svcs.
1.7 1.8 2.1 2.0 1.6 1.7 1.7 1.6 1.8
ADP Systems Development Svcs.
1.7 2.1 2.3 1.9 1.6 1.1 1.4 1.6 1.8
IT and Telecom- Integrated Hardware/Software/Svcs. Solutions*
0.0 0.0 0.0 0.0 1.2 1.2 1.0 1.3 1.7
IT and Telecom- Programming
0.4 0.5 0.6 0.7 0.9 0.9 1.0 1.1 1.2
Automated Information System Svcs.
1.6 1.3 1.4 1.8 1.7 1.3 1.0 1.2 1.1
Remainder 43.8 47.3 49.2 45.8 41.4 37.1 38.4 37.9 38.5
Total 69.4 76.8 81.5 79.1 75.5 68.9 70.6 70.7 73.5
Source: usaspending.gov; The Stephen S. Fuller Institute at the Schar School, GMU. *Predominantly Services
25
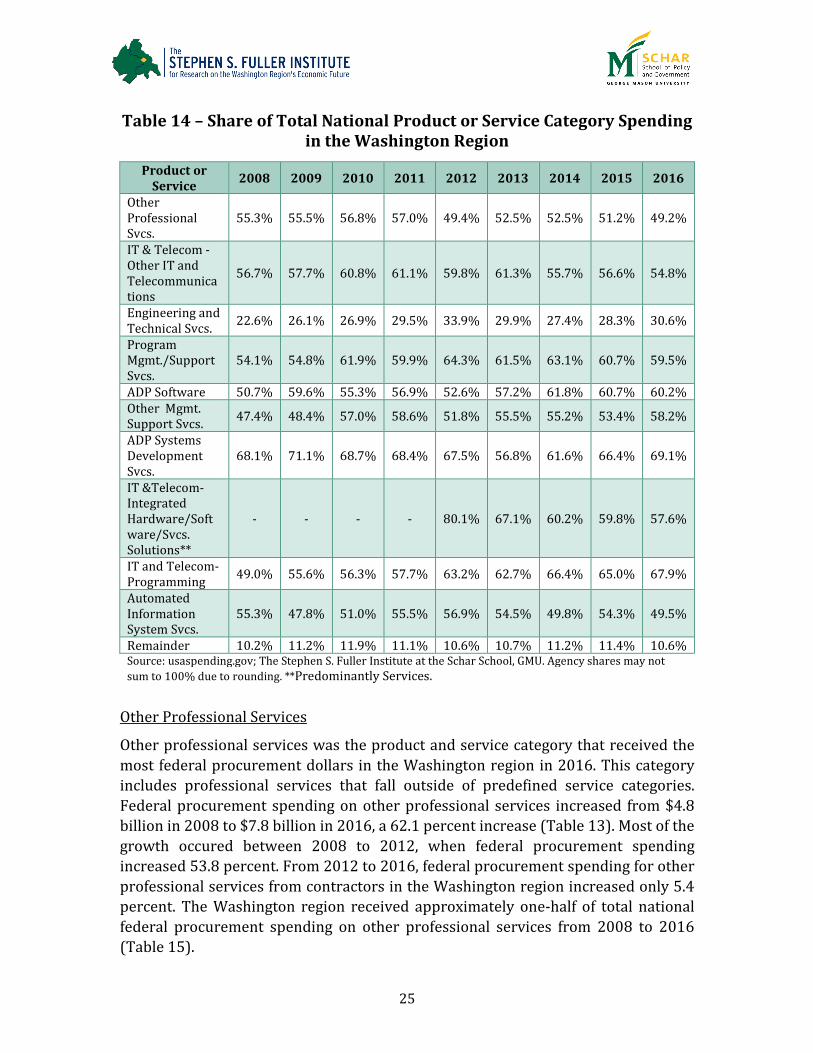
Table 14 – Share of Total National Product or Service Category Spending in the Washington Region
Other Professional Services
Other professional services was the product and service category that received the
most federal procurement dollars in the Washington region in 2016. This category
includes professional services that fall outside of predefined service categories.
Federal procurement spending on other professional services increased from $4.8
billion in 2008 to $7.8 billion in 2016, a 62.1 percent increase (Table 13). Most of the
growth occured between 2008 to 2012, when federal procurement spending
increased 53.8 percent. From 2012 to 2016, federal procurement spending for other
professional services from contractors in the Washington region increased only 5.4
percent. The Washington region received approximately one-half of total national
federal procurement spending on other professional services from 2008 to 2016
(Table 15).
Product or Service
2008 2009 2010 2011 2012 2013 2014 2015 2016
Other Professional Svcs.
55.3% 55.5% 56.8% 57.0% 49.4% 52.5% 52.5% 51.2% 49.2%
IT & Telecom - Other IT and Telecommunications
56.7% 57.7% 60.8% 61.1% 59.8% 61.3% 55.7% 56.6% 54.8%
Engineering and Technical Svcs.
22.6% 26.1% 26.9% 29.5% 33.9% 29.9% 27.4% 28.3% 30.6%
Program Mgmt./Support Svcs.
54.1% 54.8% 61.9% 59.9% 64.3% 61.5% 63.1% 60.7% 59.5%
ADP Software 50.7% 59.6% 55.3% 56.9% 52.6% 57.2% 61.8% 60.7% 60.2%
Other Mgmt. Support Svcs.
47.4% 48.4% 57.0% 58.6% 51.8% 55.5% 55.2% 53.4% 58.2%
ADP Systems Development Svcs.
68.1% 71.1% 68.7% 68.4% 67.5% 56.8% 61.6% 66.4% 69.1%
IT &Telecom- Integrated Hardware/Software/Svcs. Solutions**
- - - - 80.1% 67.1% 60.2% 59.8% 57.6%
IT and Telecom- Programming
49.0% 55.6% 56.3% 57.7% 63.2% 62.7% 66.4% 65.0% 67.9%
Automated Information System Svcs.
55.3% 47.8% 51.0% 55.5% 56.9% 54.5% 49.8% 54.3% 49.5%
Remainder 10.2% 11.2% 11.9% 11.1% 10.6% 10.7% 11.2% 11.4% 10.6% Source: usaspending.gov; The Stephen S. Fuller Institute at the Schar School, GMU. Agency shares may not
sum to 100% due to rounding. **Predominantly Services.

26
The three agencies that spent the most on other professional services were DoD,
HHS, and the GSA. DoD spending on other professional services from contractors
located in the Washington region declined from a peak of $2.8 billion in 2010 to $2.1
billion in 2016. This decline, coupled with the increase in overall federal
procurement spending resulted in DoD’s share of other professional services
procurement dollars spent in the Washington region this category declining from
54.8 percent in 2008 to 27.3 percent in 2016 (Table 15). In contrast, HHS increased
increased spending on other professional services from $0.3 billion in 2008 to $1.6
billion in 2016, an increase of 474.2%. In turn, its share of other professional
services contracting in the Washington region increased from 5.6 percent in 2008 to
19.9 percent in 2016. Similarly, the GSA increased its spending from $0.1 billion to
$0.9 billion during the same period and accounted for a larger share of purchases,
rising from 2.1 percent in 2008 to 11.5 percent in 2016.
Table 15 – Share of Other Professional Services Spending by Agency in the Washington Region
Agency 2008 2009 2010 2011 2012 2013 2014 2015 2016
Department of Defense
54.8% 44.0% 45.0% 39.8% 36.7% 31.6% 31.7% 28.7% 27.3%
Department of Health and Human Svcs.
5.6% 7.4% 8.2% 7.8% 8.3% 16.0% 17.3% 16.9% 19.9%
General Svcs. Administration
2.1% 2.6% 3.8% 5.3% 8.0% 6.5% 6.8% 9.2% 11.5%
Department of Homeland Security
7.4% 11.8% 9.0% 10.5% 8.1% 8.5% 7.9% 6.1% 5.6%
Department of Justice
2.3% 2.8% 3.4% 4.9% 6.5% 5.2% 4.5% 3.9% 4.3%
Remainder 27.7% 31.5% 30.5% 31.8% 32.4% 32.1% 31.9% 35.3% 31.4%
Total 100% 100% 100% 100% 100% 100% 100% 100% 100% Source: usaspending.gov; The Stephen S. Fuller Institute at the Schar School, GMU. Agency shares may not sum to 100% due to rounding.
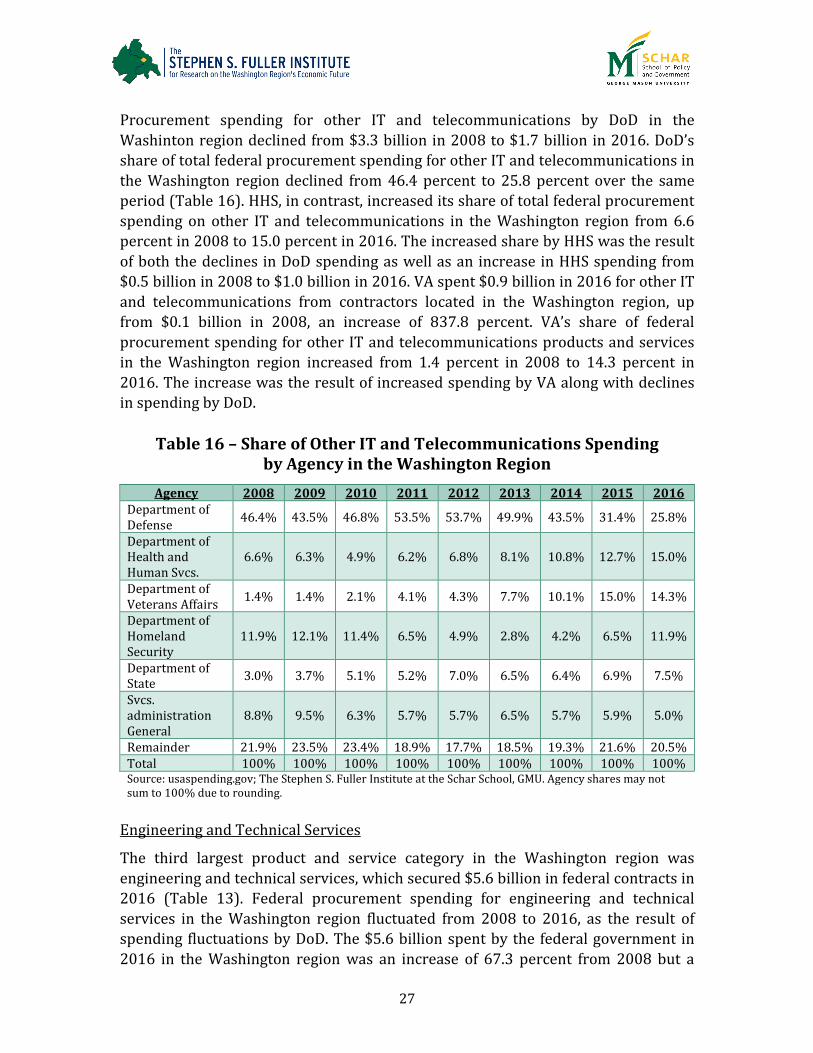
Other Information Technology (IT) and Telecommunications
Federal procurement for other IT and telecommunications was $6.6 in 2016 billion
in the Washington region, the second largest of all product and service categories
(Table 13). Federal procurement spending for other IT and telecommunications in
the Washington region in 2016 was down 24.5 percent from its 2011 peak of $8.8
billion. Federal procurement spending for other IT and telecommunications in the
Washington region accounted for approximately 55 percent of total national federal
procurement spending annually from 2008 to 2016 (Table 14).
The three agencies that spent the most for other IT and telecommunications in the
Washington region were DoD, HHS, and the Department of Veterans Affairs (VA).
27
Procurement spending for other IT and telecommunications by DoD in the
Washinton region declined from $3.3 billion in 2008 to $1.7 billion in 2016. DoD’s
share of total federal procurement spending for other IT and telecommunications in
the Washington region declined from 46.4 percent to 25.8 percent over the same
period (Table 16). HHS, in contrast, increased its share of total federal procurement
spending on other IT and telecommunications in the Washington region from 6.6
percent in 2008 to 15.0 percent in 2016. The increased share by HHS was the result
of both the declines in DoD spending as well as an increase in HHS spending from
$0.5 billion in 2008 to $1.0 billion in 2016. VA spent $0.9 billion in 2016 for other IT
and telecommunications from contractors located in the Washington region, up
from $0.1 billion in 2008, an increase of 837.8 percent. VA’s share of federal
procurement spending for other IT and telecommunications products and services
in the Washington region increased from 1.4 percent in 2008 to 14.3 percent in
2016. The increase was the result of increased spending by VA along with declines
in spending by DoD.
Table 16 – Share of Other IT and Telecommunications Spending by Agency in the Washington Region
Agency 2008 2009 2010 2011 2012 2013 2014 2015 2016
Department of Defense
46.4% 43.5% 46.8% 53.5% 53.7% 49.9% 43.5% 31.4% 25.8%
Department of Health and Human Svcs.
6.6% 6.3% 4.9% 6.2% 6.8% 8.1% 10.8% 12.7% 15.0%
Department of Veterans Affairs
1.4% 1.4% 2.1% 4.1% 4.3% 7.7% 10.1% 15.0% 14.3%
Department of Homeland Security
11.9% 12.1% 11.4% 6.5% 4.9% 2.8% 4.2% 6.5% 11.9%
Department of State
3.0% 3.7% 5.1% 5.2% 7.0% 6.5% 6.4% 6.9% 7.5%
Svcs. administration General
8.8% 9.5% 6.3% 5.7% 5.7% 6.5% 5.7% 5.9% 5.0%
Remainder 21.9% 23.5% 23.4% 18.9% 17.7% 18.5% 19.3% 21.6% 20.5%
Total 100% 100% 100% 100% 100% 100% 100% 100% 100% Source: usaspending.gov; The Stephen S. Fuller Institute at the Schar School, GMU. Agency shares may not sum to 100% due to rounding.
Engineering and Technical Services
The third largest product and service category in the Washington region was
engineering and technical services, which secured $5.6 billion in federal contracts in
2016 (Table 13). Federal procurement spending for engineering and technical
services in the Washington region fluctuated from 2008 to 2016, as the result of
spending fluctuations by DoD. The $5.6 billion spent by the federal government in
2016 in the Washington region was an increase of 67.3 percent from 2008 but a

28
decrease of 1.8 percent from its peak in 2012. Federal procurement spending for
engineering and technical services from contractors in the Washington region
accounted for 30.6 percent of total national federal procurement spending for
engineering and technical services in 2016 (Table 14). The share captured in the
Washington region ranged from 22.6 percent to 33.9 percent during the 2008 to
2016 period.
The three agencies that spent the most procurement dollars in the Washington
region for engineering and technical services in 2016 were DoD, the United States
Agency for International Development (USAID), and DoT. DoD spent the largest
amount of procurement dollars for engineering and technical services, $3.1 billion in
2016. DoD spending for engineering and technical services fluctuated between $2.2
billion and $4.2 billion from 2008 to 2016 despite overall declines in DoD
procurement in the region. DoD procurement spending accounted for 55.1 percent
of federal procurement spending on engineering and technical services in the region
in 2016, down from 74.6 percent in 2012 (Table 17). USAID provided the second
largest source of procurement spending for engineering and technical services in
the Washinton region. The agency spent $0.7 billion in 2016, 12.0 percent of total
federal procurement spending in the category. However, 2016 represented an
unusually large amount spent in the region by the agency, USAID spent under $50
million from 2008 through 2014. The third largest source of procurement spending
in 2016 was DoT. Procurement spending by DoT for engineering and technical
services remained stable from 2008 to 2016, at about $0.5 billion during the period,
accounting for 10.5 percent to 12.9 percent of total federal procurement spending
for engineering and technical services from contractors located in the Washington
region

29
Table 17 – Share of Engineering and Technical Services Spending by Agency in the Washington Region
Agency 2008 2009 2010 2011 2012 2013 2014 2015 2016
Department of Defense
65.0% 65.9% 70.6% 71.2% 74.6% 63.9% 58.6% 58.9% 55.1%
Agency for International Development
0.0% 0.0% 0.0% 0.0% 0.2% 0.4% 1.0% 1.8% 12.0%
Department of Transportation
11.8% 12.9% 12.4% 11.7% 10.8% 12.6% 12.9% 12.4% 10.3%
National Aeronautics and Space Administration
5.4% 4.6% 3.8% 4.6% 4.8% 8.7% 10.5% 9.7% 8.1%
Department of Justice
1.4% 1.3% 0.7% 0.7% 0.8% 0.8% 2.1% 2.7% 2.9%
Department of Homeland Security
11.7% 9.4% 7.1% 6.8% 3.1% 4.7% 4.3% 3.7% 2.8%
Remainder 4.7% 5.8% 5.4% 4.9% 5.7% 8.9% 10.6% 10.8% 8.9%
Total 100% 100% 100% 100% 100% 100% 100% 100% 100% Source: usaspending.gov; The Stephen S. Fuller Institute at the Schar School, GMU. Agency shares may not sum to 100% due to rounding.
Conclusions
Over the thirty years between 1980 and 2010, federal procurement spending in the Washington region increased from $4.2 billion to $81.5 billion. The growth of the Washington region’s economy during this period was directly correlated with these annual increases in federal procurement spending and continues to remain highly dependent on federal outlays for its growth. Dependence on federal procurement spending is a very real concern with the lessons still fresh of the impacts of decreased federal procurement spending under the Budget Control Act of 2011 and the ensuing contraction of the Washington region’s economy in 2014. This report analyzes recent changes in the composition, sources, and distribution of federal procurement spending in the Washington region to provide current information on how spending priorities at the federal level can impact the region.
From the 2010 peak in federal procurement spending of $81.5 billion, federal
outlays declined to $68.9 billion in 2013. During this time, however, the Washington
region increased its share of national federal procurement; the share of total
national procurement dollars captured by contractors in the Washington region
increased from 14.3 percent in 2008 to 17.7 percent in 2015 and remained between
17.0 and 17.7 percent from 2014 to 2016.
Federal procurement spending from 2008 to 2016 in the Washington region became
less concentrated by agency and sub-state region. The share of federal procurement
spending in the Washington region attributed to DoD decreased from 52.0 percent
30
in 2008 to 38.7 percent in 2016. Reduced DoD spending in the Washington region
diminished the share of regional procurement spending captured by contractors in
Northern Virginia. Relatively stable spending outlays by non-DoD agencies across
the region resulted in less concentrated spending patterns among the sub-state
regions with the District of Columbia increasing its share of the region’s federal
spending the most.
In contrast to federal procurement spending by agency and sub-state geography,
federal procurement spending became more concentrated by industry classification
and product or service category. The share of total procurement spending secured
by the top ten industries in the Washington region increased from 52.4 percent in
2009 to 62.5 percent in 2016. Similarly, the top ten product and service categories
by federal procurement spending in the Washington region, as a share of total
spending, increased from 41.5 percent in 2008 to 47.7 percent in 2016.
Increased concentration of federal procurement spending by industry classification
and product and service category may serve to diminish the impact of regional
dependence on any single federal agency as overall federal purchases become
increasingly homogenous. Federal procurement spending on contractors for
computer systems design services, for example, increased from $4.6 billion in 2008
to $10.1 billion in 2016. The three agencies that provided the largest source of
procurement dollars in this industry were DoD, HHS, and GSA. All three of these
agencies increased procurement spending in the computer systems design industry
in the Washington region from 2008 to 2016.
The composition of federal procurement spending and its distribution across agencies and sub-state portions of the region have changed in recent years along with the total value of this spending. While there are multiple explanations for the trends reported herein, it has been the changes in federal budget policy that have been the most impactful. This was clearly illustrated by the economic impacts of the Sequester in 2013 and 2014. Proposed changes in federal budgetary priorities reflected in President Trump’s Budget Blueprint, issued on March 17th, and in his newly released FY 2018 Budget, point to potentially substantial changes in funding allocations among federal agencies. These could have significant economic impacts, both on the levels of federal procurement contracting activity supported in the region and on federal employment impacting the region’s ability to grow its economy going forward.

31
About These Data
Data used for this report are federal dollars obligated for federal contracts and categorized by fiscal year, October 1 to September 30. Data were downloaded from the usaspending.gov data archives on March, 15, 2017. For consistency, only dollars categorized as contracted through a federal agency were used. Additionally, contract dollars spent outside of the United States were not included in this analysis. While data are available back to 2005, documentation ensuring completeness are provided for 2008 to present. Data are categorized by place-of-performance and fiscal year. The Washington region is consistent with the 2013 Office of Management and Budget definition for the Washington-Arlington-Alexandria, DC-VA-MD-WV Metro Area 2013 definition.
The Herfindahl-Hirschman Index (HHI) used throughout the report measures market concentration. The index ranges from zero to 10,000, with larger values indicating greater concentration. The index is defined as the sum of market shares squared. In a market dominated by a single firm, the value would be 10,000 (1002 = 10,000). A market with two firms with equal share would have an index value of 5,000 (502+502 = 5,000). Market concentration categories used in the report reflect those defined by the Department of Justice used for firm merger rulings. For more, refer to the U.S. Department of Justice & FTC, Horizontal Merger Guidelines § 5.2 (2010).
Appendix
Table A-1 – Federal Market Concentration by Agency in the Washington Region
2008 2009 2010 2011 2012 2013 2014 2015 2016
District of Columbia
1,416 1,188 1,039 1,081 1,000 1,070 941 921 869
Suburban Maryland
1,733 1,672 1,625 1,479 1,595 1,656 1,739 1,697 1,718
Northern Virginia
5,004 4,598 4,453 4,697 4,409 3,802 3,545 3,144 3,296
Washington Region
2,938 2,517 2,445 2,643 2,521 2,281 2,078 1,852 1,803
Note: Unconcentrated Markets (< 1,500); Moderately Concentrated Markets (1,500- 2,500); Highly Concentrated Markets (>2,500). Herfindahl-Hirschman Index and concentration categories defined by the U.S. Department of Justice. Source: usaspending.gov, The Stephen S. Fuller Institute at the Schar School.