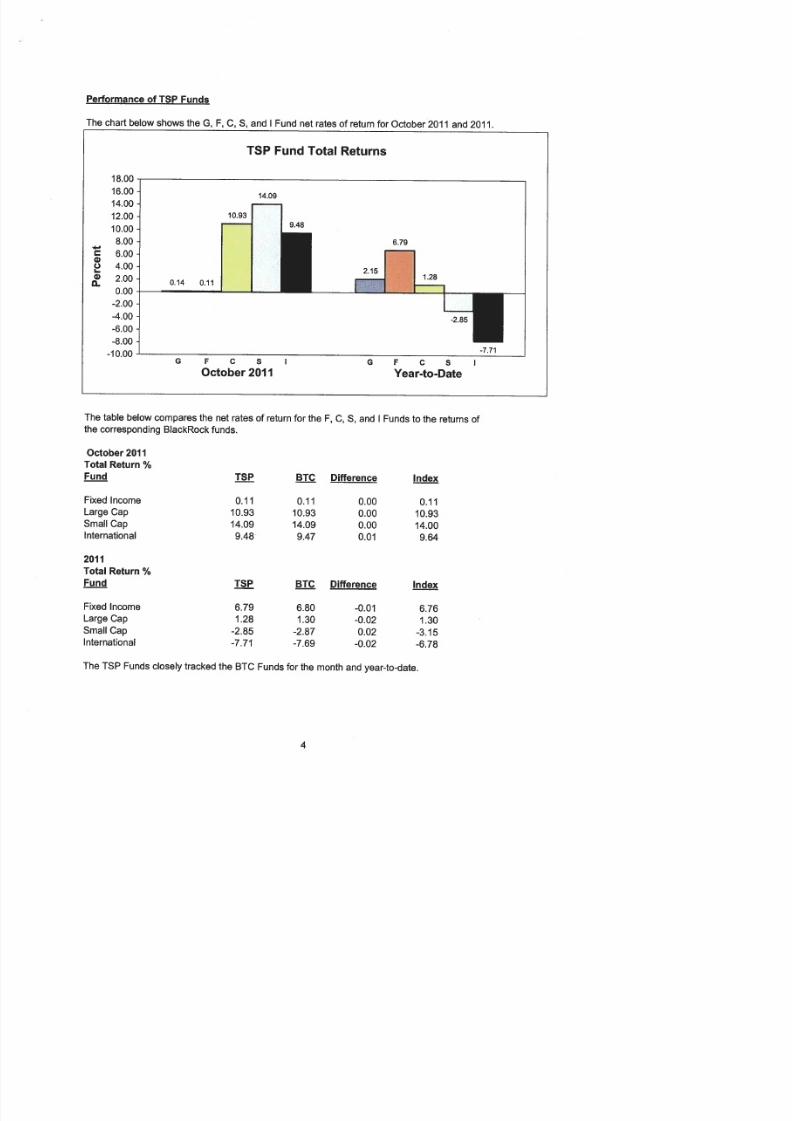
Federal Judges Retirement & Blackrock 2006 MBS ABS
37
3/11 Thrift Savings Plan S Fun d Small Capitalization Stock Index Investment Fund S Fund Returns* Inception – 20 1 0 P e r c e n t R e t u r n Growth of $100 Since Inception −40 −30 −20 −10 0 10 20 30 40 50 2010 2001 Fund Information As of December 31, 2010 Net Assets $28.0 billion 2010 Administrative Expenses $0.24 per $1,000 account b alance, .024% (2.4 basis points) Benchmark Index Dow Jones U.S. Completion TSM Index www.djindexes.com Asset Manager BlackRock Institutional Trust Company, N.A. Returns S Fund* Dow Jones U.S. Completion TSM Index 1-Year 29.06% 28.62% 3-Year 2.39% 2.53% 5-Year 5.48% 5.54% 10-Year N/A 6.20% Since Inception 7.14% 7.22% May 1, 2001 * After expenses *The 2001 rate of return is a blended return using the return of the Dow Jones U.S. Completion TSM Index (without deductions for management fees, trading costs, or administrative expenses) for the period prior to the S Fund’s inception on May 1, 2001. Company Las Vegas Sands Corp. General Motors Co. BlackRock, Inc. Lyondell Basell Industries The Mosaic Co. Crown Castle Intl. Corp. Annaly Capital Management, Inc. Southern Copper Corp. Marvell Technology Group Ltd. Delta Airlines, Inc. Dow Jones U.S . Completion TSM Index Top Ten Holdings as of December 31, 2010 Key Features • TheSFundofferstheopportunitytoe arnapotentiallyhighinvestment returnoverthelongtermbyinvestinginthestocksofsmallandmedi- um-sizedU.S.companies. • TheobjectiveoftheSFundistom atchtheperformanceoft heDowJones U.S.CompletionT otalStockMarket(TSM) Index,abroadmarketindex madeupofstocksofU.S.companiesnotincludedintheS&P500Index. • Thereisaris koflossiftheDowJo nesU.S.Com plet ionTSMIndexdecli nes in response to changes in overall economic conditions (market risk). • Earnings consist ofgains (orlo sses)in thepri cesofst ocks,and dividend income.
Transcript of Federal Judges Retirement & Blackrock 2006 MBS ABS

8/9/2019 Federal Judges Retirement & Blackrock 2006 MBS ABS
http://slidepdf.com/reader/full/federal-judges-retirement-blackrock-2006-mbs-abs 1/373/11
Thrift Savings Plan
S F undSmall Capitalization Stock Index Investment Fund
S Fund Returns*Inception – 2010
P e r c e n t
R e
t u r n
Growth of $100Since Inception
−40
−30
−20
−10
0
10
20
30
40
50
20102001
Fund InformationAs of December 31, 2010
Net Assets$28.0 billion
2010 Administrative Expenses$0.24 per $1,000account balance,
.024% (2.4 basis points)Benchmark Index
Dow Jones U.S.Completion TSM Indexwww.djindexes.com
Asset ManagerBlackRock Institutional Trust
Company, N.A.
Returns
S Fund*
Dow JonesU.S.
CompletionTSM Index
1-Year 29.06% 28.62%3-Year 2.39% 2.53%5-Year 5.48% 5.54%
10-Year N/A 6.20%Since Inception 7.14% 7.22%
May 1, 2001
* After expenses
*The 2001 rate of return is a blended return using the return of the Dow Jones U.S. Completion TSM Index (wdeductions for management fees, trading costs, or administrative expenses) for the period prior to the S Fund’inception on May 1, 2001.
Company Las Vegas Sands Corp.General Motors Co.BlackRock, Inc.Lyondell Basell IndustriesThe Mosaic Co.Crown Castle Intl. Corp.Annaly Capital Management, Inc.Southern Copper Corp.Marvell Technology Group Ltd.Delta Airlines, Inc.
Dow Jones U.S. Completion TSM IndexTop Ten Holdings as of December 31, 2010
Key Features• The S Fund offers the opportunity to earn a potentially high investment
return over the long term by investing in the stocks of small and medi-um-sized U.S. companies.
• The objective of the S Fund is to match the performance of the Dow JoneU.S. Completion Total Stock Market (TSM) Index, a broad market indexmade up of stocks of U.S. companies not included in the S&P 500 Index.
• There is a risk of loss if the Dow Jones U.S. Completion TSM Index decliin response to changes in overall economic conditions (market risk).
• Earnings consist of gains (or losses) in the prices of stocks, and dividendincome.

8/9/2019 Federal Judges Retirement & Blackrock 2006 MBS ABS
http://slidepdf.com/reader/full/federal-judges-retirement-blackrock-2006-mbs-abs 2/37Page 2 TSPLF1
Dow Jones U.S. Completion TSM IndexMajor Industry GroupsDecember 31, 2010
Health Care11.2%
InformationTechnology
15.9%
Financials20.6%
Industrials14.3%
ConsumerDiscretionary
15.3%Energy 7.0%
Telecom Services 1.6%
Utilities 3.7%
Consumer Staples 3.2%
Materials 7.2%
S F und FactS
By law, the S Fund must be invested in a portfolio designed to replicate the performance of an index of U.S. common stocks, exclud-ing those that are held in the C Fund. The Federal Retirement Thrift Investment Board has chosen as its benchmark the Dow JonesU.S. Completion Total Stock Market Index, which tracks the performance of the actively traded non-S&P 500 stocks in the U.S. stockmarket.
The Dow Jones U.S. Completion Total Stock Market Index is an index of all actively traded U.S. common stocks that are not
included in the S&P 500 Index. The index is designed to be the broadest measure of the non-S&P 500 domestic stock markets. As ofDecember 31, 2010, the index was comprised of 3,385 common stocks. The Dow Jones U.S. Completion TSM Index made up approxi-mately 25% of the market value of the U.S. stock markets; the S&P 500 accounted for the other 75%. Thus, the combined S Fund andC Fund cover virtually the entire U.S. stock market.
The Dow Jones U.S. Completion TSMIndex is weighted by oat-adjustedmarket capitalization, in which acompany’s market value and itsweighting in the index are calculatedusing the number of shares that arefreely traded, rather than all out-standing shares. Shares that are not
freely traded, such as the holdings ofcontrolling shareholders and theirfamilies, company management, andother companies, are excluded fromthe calculation. A company’s weight-ing in the index is the oat-adjustedmarket value of the company (thatis, the share price multiplied bythe number of freely traded sharesoutstanding) as a percentage of thecombined oat-adjusted marketvalue of all companies in the index. As of December 31, 2010, the largest100 companies in the Dow Jones U.S.Completion TSM Index represented23.7% of the index.
BlackRock’s Extended MarketIndex Fund — The S Fund is invested in BlackRock’s Extended Market Index Fund. The Dow Jones U.S. Completion TSM Indexcontains a large number of stocks, including illiquid stocks with low trading volume and stocks with prices lower than $1.00 pershare. Therefore, it is not ef cient for BlackRock’s Extended Market Index Fund to invest in every stock in the index. The BlackRockfund holds the stocks of most of the companies in the index with market values greater than $1 billion. However, a mathemati-cal sampling technique is used to select among the smaller stocks. BlackRock’s mathematical model considers size and industrygroup to match the industry weights in the index. Within each industry group, BlackRock selects stocks that, together, are expectedto produce a return that is very close to the industry’s return in the Dow Jones U.S. Completion TSM Index. The performance of the
Extended Market Index Fund is evaluated on the basis of how closely its returns match those of the Dow Jones U.S. Completion TSMIndex. A portion of Extended Market Index Fund assets is reserved to meet the needs of daily client activity. This liquidity reserve isinvested in futures contracts of the S&P 400 and Russell 2000 (other broad equity indexes).
The S Fund invests in the Extended Market Index Fund by purchasing shares of the Extended Market Index Fund “E,” which, in turn, holds aliquidity pool and shares of the Extended Market Index Master Fund. As of December 31, 2010, S Fund holdings constituted $27.2 billion ofthe Extended Market Index Master Fund, which itself held $35.3 billion in securities.
Note: Participants’ interfund transfer (IFT) requests redistribute their existing account balances among the TSP funds. For each cal-endar month, the frst two IFTs can redistribute money among any or all of the TSP funds. After that, for the remainder of the month,IFTs can only move money into the G Fund. (For participants with more than one TSP account, this rule applies to each account sepa-rately.)

8/9/2019 Federal Judges Retirement & Blackrock 2006 MBS ABS
http://slidepdf.com/reader/full/federal-judges-retirement-blackrock-2006-mbs-abs 3/373/11
F F undFixed Income Index Investment Fund
Thrift Savings Plan
Key Features• The F Fund offers the opportunity to earn rates of return that exceed
those of money market funds over the long term (particularly duringperiods of declining interest rates), with relatively low risk.
• The objective of the F Fund is to match the performance of the BarclaysCapital U.S. Aggregate Bond Index, a broad index representing the U.S.bond market.
• The risk of nonpayment of interest or principal (credit risk) is relativelylow because the fund includes only investment-grade securities and isbroadly diversi ed. However, the F Fund has market risk (the risk thatthe value of the underlying securities will decline) and prepayment risk(the risk that the security will be repaid before it matures).
• Earnings consist of interest income on the securities and gains (orlosses) in the value of securities.
F Fund Returns*Inception – 2010
PercentReturn
Growth of $100Since Inception
Fund InformationAs of December 31, 2010
Net Assets$19.7 billion
2010 Administrative Expenses$0.25 per $1,000account balance,
.025% (2.5 basis points)
Average Duration4.5 years
Average Current Yield4.01%
Benchmark IndexBarclays Capital U.S. Aggregate
Bond Indexwww.barcap.com
Asset ManagerBlackRock Institutional Trust
Company, N.A.
Returns
F Fund*
BarclaysU.S.
AggregateIndex
1-Year 6.71% 6.54%3-Year 6.05% 5.90%5-Year 5.93% 5.80%
10-Year 5.91% 5.84%Since Inception 7.09% 7.34% January 29, 1988
* After expenses
−5
0
5
10
15
20
20101988
*1988 return shown is a partial-year return.
8/9/2019 Federal Judges Retirement & Blackrock 2006 MBS ABS
http://slidepdf.com/reader/full/federal-judges-retirement-blackrock-2006-mbs-abs 4/37Page 2 TSPLF
F F und Facts
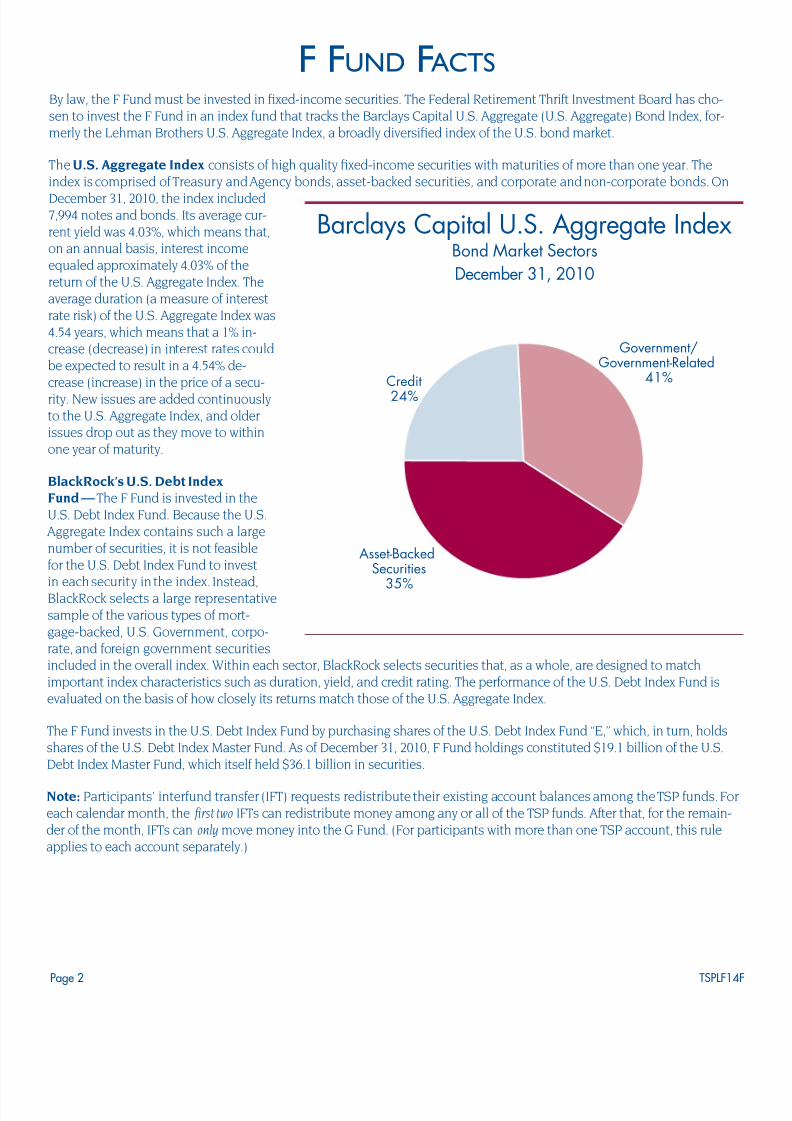
By law, the F Fund must be invested in xed-income securities. The Federal Retirement Thrift Investment Board has cho-sen to invest the F Fund in an index fund that tracks the Barclays Capital U.S. Aggregate (U.S. Aggregate) Bond Index, for-merly the Lehman Brothers U.S. Aggregate Index, a broadly diversi ed index of the U.S. bond market.
The U.S. Aggregate Index consists of high quality xed-income securities with maturities of more than one year. Theindex is comprised of Treasury and Agency bonds, asset-backed securities, and corporate and non-corporate bonds. OnDecember 31, 2010, the index included7,994 notes and bonds. Its average cur-rent yield was 4.03%, which means that,on an annual basis, interest incomeequaled approximately 4.03% of thereturn of the U.S. Aggregate Index. Theaverage duration (a measure of interestrate risk) of the U.S. Aggregate Index was4.54 years, which means that a 1% in-crease (decrease) in interest rates couldbe expected to result in a 4.54% de-crease (increase) in the price of a secu-rity. New issues are added continuouslyto the U.S. Aggregate Index, and olderissues drop out as they move to withinone year of maturity.
BlackRock’s U.S. Debt IndexFund — The F Fund is invested in theU.S. Debt Index Fund. Because the U.S. Aggregate Index contains such a largenumber of securities, it is not feasiblefor the U.S. Debt Index Fund to investin each security in the index. Instead,BlackRock selects a large representativesample of the various types of mort-gage-backed, U.S. Government, corpo-rate, and foreign government securitiesincluded in the overall index. Within each sector, BlackRock selects securities that, as a whole, are designed to matchimportant index characteristics such as duration, yield, and credit rating. The performance of the U.S. Debt Index Fund isevaluated on the basis of how closely its returns match those of the U.S. Aggregate Index.
The F Fund invests in the U.S. Debt Index Fund by purchasing shares of the U.S. Debt Index Fund “E,” which, in turn, holdsshares of the U.S. Debt Index Master Fund. As of December 31, 2010, F Fund holdings constituted $19.1 billion of the U.S.Debt Index Master Fund, which itself held $36.1 billion in securities.
Note: Participants’ interfund transfer (IFT) requests redistribute their existing account balances among the TSP funds. Foreach calendar month, the frst two IFTs can redistribute money among any or all of the TSP funds. After that, for the remain-der of the month, IFTs can only move money into the G Fund. (For participants with more than one TSP account, this ruleapplies to each account separately.)
Barclays Capital U.S. Aggregate IndexBond Market SectorsDecember 31, 2010
Asset-BackedSecurities
35%
Credit24%
Government/Government-Related
41%

8/9/2019 Federal Judges Retirement & Blackrock 2006 MBS ABS
http://slidepdf.com/reader/full/federal-judges-retirement-blackrock-2006-mbs-abs 5/37
Allocation Targets January 2011
L 2040 L 2050L 2030
L Income L 2020
11%
23%17%
9 %40%
S
CF
G
I
19%
7%
27%
44%
3S I
GFC
22%8%
36%
14%
20%
C
S
GF
I
74%
6%12%
5%
3%
GI
CF S
36%
30% 17%
7%
10%
F
C I
G
S
Thrift Savings Plan
3/11
Thrift Savings Plan
L F undsLifecycle Funds
Fund InformationAs of December 31, 2010
Net Assets$34.9 billion
2010 Administrative Expenses$0.25 per $1,000account balance,
.025% (2.5 basis points)
Investment Objective Fund Growth
Preservationof Assets
L 2050 High Very LowL 2040 High LowL 2030 Moderate/High LowL 2020 Moderate ModerateL Income Low High
Time Horizons(when you expect to need the money)
Choose: If your time horizon is:L 2050 2045 or laterL 2040 2035 through 2044L 2030 2025 through 2034L 2020 2015 through 2024L Income Now withdrawing
or withdrawing soon
InceptionThe frst L Funds were
introduced August 1, 2005
Key Features• The L Funds diversify participant accounts among the G, F, C, S, and I
Funds using professionally determined investment mixes (allocations)that are tailored to different time horizons. The L Funds are rebalancedto their target allocations each business day. The investment mix ofeach fund adjusts quarterly to more conservative investments as thefund’s time horizon shortens.
• The objective of the L Funds is to provide the highest possible rate ofreturn for the amount of risk taken.
• Investing in the L Funds is not a guarantee against loss and does noteliminate risk. The L Funds are subject to the risks inherent in the un-derlying funds, and can have periods of gain and loss.
• The L Funds’ returns will be approximately equal to the weighted aver-age of the G, F, C, S, and I Funds’ returns. Earnings are calculated dailyand there is a daily share price for each L Fund.

8/9/2019 Federal Judges Retirement & Blackrock 2006 MBS ABS
http://slidepdf.com/reader/full/federal-judges-retirement-blackrock-2006-mbs-abs 6/37Page 2 TSPLF
L F und Facts
The L Funds are intended to meet the investment needs of TSP participants with time horizons that fall into ve different date ranges, asshown on the front. The ve L Funds were designed for the TSP by Mercer Investment Consulting, Inc. The asset allocations are based onMercer’s assumptions regarding future investment returns, in ation, economic growth, and interest rates. The TSP reviews these assump-tions at least annually to determine whether changes to the allocations are warranted.
L 2050, L 2040, L 2030, and L 2020 are for participants with time horizons that fall within the de ned date ranges. The asset allocationsof these funds are adjusted quarterly, moving to a more conservative mix, gradually approaching that of the L Income Fund. Betweenquarterly adjustments, the asset allocation of each fund is maintained through daily rebalancing to that fund’s target allocation. When afund reaches its horizon, it will roll into the L Income Fund, and a new fund will be added with a more distant time horizon. For example, in2010, the L 2010 Fund rolled into the L Income Fund, and shortly thereafter the L 2050 Fund was created.
The L Income Fund is designed to produce current income for participants who are already receiving money from their accounts throughmonthly payments and for participants who plan to withdraw or to begin withdrawing from their accounts in the near future. The assetallocation of the L Income Fund does not change over time; it is maintained through daily rebalancing.
The pie charts on the front show the January 2011 target allocations of the L Income, L 2020, L 2030, L 2040, and L 2050 Funds in each ofve underlying TSP funds. The allocation to the G Fund, which has the least amount of risk, is largest in the L Income Fund, and becomes
successively smaller with the more distant target dates. In contrast, the allocations to the F, C, S, and I Funds, which carry varying degreesof risk, but also the potential for higher returns, are largest in L 2050 and smallest in the L Income Fund.
The graph below depicts the expected return and risk associated with each of the ve L Funds based on the target allocations in January2011. The expected returns are derived from Mercer’s economic assumptions and are not guaranteed. Expected variability of the invest-ment returns is a measure of risk in investing. For each risk level, there is one “optimal” asset allocation that provides the highest expected
return. The collection of optimal asset allocations make up the “Ef cient Frontier,” which is shown by the curve. Asset allocations that arebelow the Ef cient Frontier are less than optimal, because there is an asset allocation along the frontier that provides a higher return forthe same level of risk, or lower risk for the same expected return. The ve TSP L Funds have asset allocations that correspond to pointsshown on the Ef cient Frontier. Putting your entire TSP account into one of the L Funds will help you to achieve the best expectedreturn for the amount of ex-pected risk that is appropriatefor your time horizon.
Over time, the L Funds (exceptfor the L Income Fund) will “rolldown” the Ef cient Frontier. Thatmeans that, as their allocations areadjusted each quarter, the fundsshift left on the line, becoming lessrisky, until they eventually mergeinto the L Income Fund.
The administrative expensesassociated with the L Funds arethose of the underlying G, F, C, S,and I Funds, calculated in propor-tion to their allocations in eachL Fund. The L Funds do not haveany additional charges. There areno restrictions on investing in theL Funds. You may invest any partof your TSP account in any L Fund,and even invest in more than oneL Fund. But it is recommendedthat you put your entire TSP ac-count into just one L Fund — theone with the target date thatis closest to your time horizon. Any other strategy may result inan asset allocation that is lessthan optimal (i.e., not on the Ef cient Frontier), or which is not suited to your investment time horizon.
Remember, however, that risk and expected return are based on assumptions about future economic conditions and investmentperformance. There is no guaranteed rate of return for any period, either short-term or long-term.
Note: Participants’ interfund transfer (IFT) requests redistribute their existing account balances among the TSP funds. For each calendarmonth, the frst two IFTs can redistribute money among any or all of the TSP funds. After that, for the remainder of the month, IFTs canonly movemoney into the G Fund. (For participants with more than one TSP account, this rule applies to each account separately.)
L Funds and the Ef cient Frontier
G Fund
F Fund
C Fund
S Fund
I Fund
Expected Return
Expected Risk (Standard Deviation)
0% 5% 10% 15% 20%0%
2%
4%
6%
8%
10%
Income
2050
20202030
2040

8/9/2019 Federal Judges Retirement & Blackrock 2006 MBS ABS
http://slidepdf.com/reader/full/federal-judges-retirement-blackrock-2006-mbs-abs 7/373/11
Thrift Savings Plan
I F undInternational Stock Index Investment Fund
MSCI EAFE Top Ten Holdingsas of December 31, 2010
Company Nestlé S.A.HSBC Holdings (GB) PLCBHP Billiton Ltd.BP PLCVodafone Group PLCNovartis AGRoyal Dutch Shell PLCTotal S.A.Toyota Motor Corp.Roche Holding Genuss
PercentReturn
Growth of $100Since Inception
0
20102001−50
−40
−30
−20
−10
10
20
30
40
I Fund Returns*Inception – 2010
Key Features• The I Fund offers the opportunity to earn a potentially high investment
return over the long term by investing in the stocks of companies in de-veloped countries outside the United States.
• The objective of the I Fund is to match the performance of the MorganStanley Capital International EAFE (Europe, Australasia, Far East) Index.
• There is a risk of loss if the EAFE Index declines in response to changesin overall economic conditions (market risk) or in response to in creasesin the value of the U.S. dollar (currency risk).
• Earnings consist of gains (or losses) in the prices of stocks, currencychanges relative to the U.S. dollar, and dividend income.
Fund InformationAs of December 31, 2010
Net Assets$25.1 billion
2010 Administrative Expenses$0.25 per $1,000account balance,
.025% (2.5 basis points)
Benchmark IndexMorgan Stanley Capital
International EAFEStock Index
www.msci.com
Asset ManagerBlackRock Institutional Trust
Company, N.A.
ReturnsI Fund*
EAFEIndex
1-Year 7.94% 7.75%3-Year −6.86% −7.02%5-Year 2.61% 2.46%
10-Year N/A 3.50%Since Inception 4.43% 4.49%
May 1, 2001
* After expenses
*The 2001 rate of return is a blended return using the return of the EAFE Index (without deductions for management fees, trading costs, or administrative expenses) for the period prior to the I Fund’s inception onMay 1, 2001.

8/9/2019 Federal Judges Retirement & Blackrock 2006 MBS ABS
http://slidepdf.com/reader/full/federal-judges-retirement-blackrock-2006-mbs-abs 8/37Page 2 TSPLF
I F und Facts
By law, the I Fund must be invested in a portfolio designed to track the performance of an index of common stocks representing in-ternational stock markets outside of the United States. The Federal Retirement Thrift Investment Board has chosen as its benchmarkthe Morgan Stanley Capital International EAFE (Europe, Austral asia, Far East) Index, which tracks the overall performance of the ma-jor companies and industries in the European, Australian, and Asian stock markets.
A signi cant component of the return of the EAFE Index (and the I Fund) results from changes in the value of the U.S. dollar rela-tive to the currencies of the countries represented in the index. For example, the EAFE Index returned 7.75% in 2010, but that return
included a decrease in the value of the U.S. dollar whichincreased the return by 2.93%.
The EAFE Index , published by Morgan Stanley Capital In-ternational (MSCI), is an index of the equity markets of thedeveloped world outside of the United States and Canada.It is the most widely used international stock index. As ofDecember 31, 2010, the index covered the equity marketsof 22 countries, as shown in the table.
The companies in the EAFE Index are large companies.The index is weighted by oat-adjusted market capitaliza-tion, in which a company’s market value and its weightingin the index are calculated using the number of shares
that are freely traded, rather than all outstanding shares.Shares that are not freely traded, such as the holdingsof controlling shareholders and their families, companymanagement, and other companies, are excluded fromthe calculation. Also excluded are shares subject to for-eign ownership limitations imposed by governments orcompanies. Within each country, a company’s weightingis the oat-adjusted market value of the company (that is,the share price multiplied by the number of freely tradedshares outstanding) as a percentage of the combined
oat-adjusted market value of all companies in the index.Similarly, a country’s weighting in the EAFE Index is the
oat-adjusted market value of its stock market as a per-centage of the combined oat-adjusted market value of allstock markets included in the EAFE Index.
BlackRock’s EAFE Index Fund — The BlackRock Fundholds common stocks of all the companies representedin the EAFE Index in virtually the same weights that theyhave in the index. The return on the BlackRock Fund (andon the I Fund) will differ from that of the EAFE Index ondays when BlackRock makes a “fair valuation” adjustmentto reprice the securities held by the fund. Fair valuationadjustments are made on days when there are large move-ments in either U.S. equity markets or currency exchangerates after the foreign markets have closed. Fair valuationprevents traders from exploiting “stale” prices, thus dilut-
ing the returns of other TSP participants who invest in the I Fund.The performance of the EAFE Equity Index Fund is evaluated on the basis of how closely its returns match those of the EAFE Index. A portion of EAFE Equity Index Fund assets is reserved to meet the needs of daily client activity. This liquidity reserve is invested infutures contracts.
The I Fund invests in the EAFE Equity Index Fund by purchasing shares of the EAFE Equity Index Fund “E,” which, in turn, holds aliquidity pool and shares of the EAFE Index Master Fund. As of December 31, 2010, I Fund holdings constituted $24.3 billion of theEAFE Equity Index Master Fund, which itself held $68.0 billion in securities.
Note: Participants’ interfund transfer (IFT) requests redistribute their existing account balances among the TSP funds. For each calen-dar month, the frst two IFTs can redistribute money among any or all of the TSP funds. After that, for the remainder of the month, IFTscan only move money into the G Fund. (For participants with more than one TSP account, this rule applies to each account separately.)
EAFE IndexCountry CompositionDecember 31, 2010
CountryPercent
of Index*Number ofCompanies
EuropeAustria 0.3 8Belgium 0.9 14Denmark 1.0 11
Finland 1.1 17France 9.5 76Germany 8.2 54Greece 0.2 8Ireland 0.2 5Israel 0.8 14Italy 2.6 29Netherlands 2.5 21Norway 0.8 9Portugal 0.3 9Spain 3.3 28Sweden 3.2 33Switzerland 8.0 37United Kingdom 21.3 107
Europe 64.4% 480
Australasia/Far East Australia 8.8 72Hong Kong 2.9 41
Japan 22.1 340New Zealand 0.1 5Singapore 1.7 31
Australasia/Far East 35.6% 489Total EAFE Index 100.0% 969
*Weight as a percentage of index (based on foreign inclusion factor,which re ects the free oat available to foreign investors).
Source: Morgan Stanley Capital Internation
8/9/2019 Federal Judges Retirement & Blackrock 2006 MBS ABS
http://slidepdf.com/reader/full/federal-judges-retirement-blackrock-2006-mbs-abs 9/373/11
Thrift Savings Plan
G F undGovernment Securities Investment Fund
G Fund Returns1988 – 2010
Pe
rcentReturn
Growth of $100Since Inception
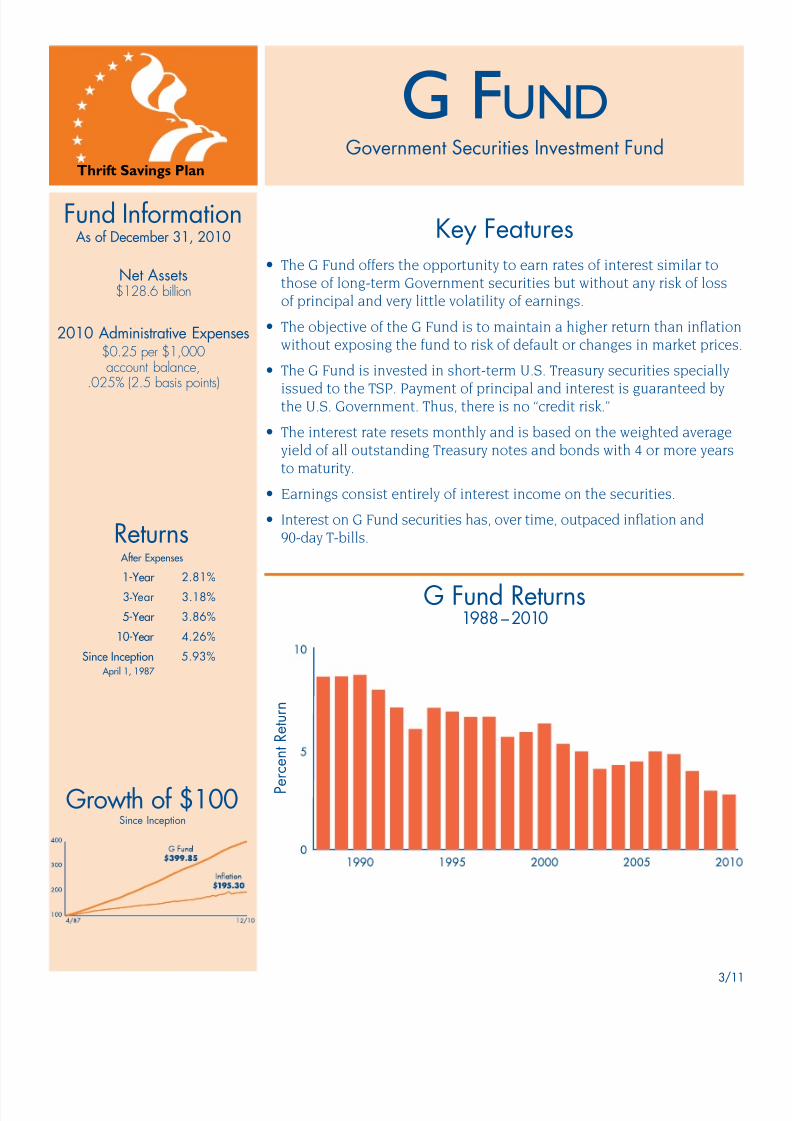
Key Features• The G Fund o ers the opportunity to earn rates o interest similar to
those o long-term Government securities but without any risk o losso principal and very little volatility o earnings.
• The objective o the G Fund is to maintain a higher return than infationwithout exposing the und to risk o de ault or changes in market prices
• The G Fund is invested in short-term U.S. Treasury securities specially
issued to the TSP. Payment o principal and interest is guaranteed bythe U.S. Government. Thus, there is no “credit risk.”
• The interest rate resets monthly and is based on the weighted averageyield o all outstanding Treasury notes and bonds with 4 or more yearsto maturity.
• Earnings consist entirely o interest income on the securities.
• Interest on G Fund securities has, over time, outpaced infation and90-day T-bills.
Fund InformationAs of December 31, 2010
Net Assets$128.6 billion
2010 Administrative Expenses$0.25 per $1,000account balance,
.025% (2.5 basis points)
Returns After Expenses
1-Year 2.81%3-Year 3.18%5-Year 3.86%
10-Year 4.26%Since Inception 5.93%
April 1, 1987

8/9/2019 Federal Judges Retirement & Blackrock 2006 MBS ABS
http://slidepdf.com/reader/full/federal-judges-retirement-blackrock-2006-mbs-abs 10/37Page 2 TSPLF1
G F und Facts
By law, the G Fund must be invested in nonmarketable U.S. Treasury securities specially issued to the TSP. The G Fundinvestments are kept by electronic entries which do not involve any transaction costs to the TSP. The G Fund rate is setonce a month by the U.S. Treasury based on a statutorily prescribed ormula (described below), and all G Fund invest-ments earn that interest rate or the month. (The G Fund rate is also used in other Government programs, such as theSocial Security and Medicare trust unds and the Civil Service Retirement and Disability Fund.)
Although the securities in the G Fund earn a long-term interest rate, the Board’s investment in the G Fund is redeem-able on any business day with no risk to principal. The value o G und securities does not fuctuate; only the interest ratechanges. Thus, when the monthly G Fund interest rate goes up, G Fund earnings accrue aster; when the G Fund interestrate declines, G Fund earnings accrue more slowly.
Calculation of G Fund Rate — G Fund securities earn a statutory interest rate equal to the average market yield onoutstanding marketable U.S. Treasury securities with 4 or more years to maturity. The G Fund rate is calculated by theU.S. Treasury as the weighted average yield o approximately 110 U.S. Treasury securities on the last day o the previ-ous month. The yield othe security has a weightin the G Fund rate calcula-tion based on the amountoutstanding. (The larger thedollar amount o a securityoutstanding, the larger itsweight in the calculation.)The Treasury securities usedin the G Fund rate calcula-tion have a weighted averagematurity o approximately10 years.
The G Fund Yield Advan-tage — The G Fund ratecalculation described aboveresults in a long-term ratebeing earned on short-termsecurities. Because long-term interest rates are gener-ally higher than short-term rates, G Fund securities usually earn a higher rate o return than do short-term marketableTreasury securities. In the chart above, the G Fund rate is compared with the rate o return on 3-month marketable Trea-sury securities (T-bills). From January 1988 through December 2010, the G Fund rate was, on average, 1.77 percentagepoints higher per year than the 3-month T-bill rate.
G Fund Yield AdvantageApril 1987 – December 2010
PercentReturn

8/9/2019 Federal Judges Retirement & Blackrock 2006 MBS ABS
http://slidepdf.com/reader/full/federal-judges-retirement-blackrock-2006-mbs-abs 11/373/11
Thrift Savings Plan
C F undCommon Stock Index Investment Fund
C Fund Returns*Inception – 2010
PercentReturn
Growth of $100Since Inception
−40
−30
−20
−10
0
10
20
30
40
20101988
Key Features• The C Fund o ers the opportunity to earn a potentially high investment
return over the long term rom a broadly diversifed port olio o stockso large and medium-sized U.S. companies.
• The objective o the C Fund is to match the per ormance o the Stan-dard & Poor’s 500 (S&P 500) Index, a broad market index made up ostocks o 500 large to medium-sized U.S. companies.
• There is a risk o loss i the S&P 500 Index declines in response to
changes in overall economic conditions (market risk).• Earnings consist o gains (or losses) in the prices o stocks, and
dividend income.
Fund InformationAs of December 31, 2010
Net Assets$79.5 billion
2010 Administrative Expenses$0.25 per $1,000account balance,
.025% (2.5 basis points)
Benchmark IndexStandard & Poor’s 500
Stock Indexwww.standardandpoors.com
Asset ManagerBlackRock Institutional Trust
Company, N.A.
ReturnsC Fund*
S&P 500Index
1-Year 15.06% 15.06%3-Year −2.80% −2.86%5-Year 2.34% 2.29%
10-Year 1.42% 1.41%Since Inception 9.55% 9.78% January 29, 1988
* After expenses
S&P 500 Top Ten Holdingsas of December 31, 2010
Company Exxon Mobil Corp.Apple, Inc.Microsoft Corp.General Electric Co.Chevron Corp.International Business Machines Corp.Proctor & GambleAT&T, Inc.
Johnson & Johnson JP Morgan Chase & Co.
*1988 return shown is a partial-year return.

8/9/2019 Federal Judges Retirement & Blackrock 2006 MBS ABS
http://slidepdf.com/reader/full/federal-judges-retirement-blackrock-2006-mbs-abs 12/37Page 2 TSPLF1
C F und FaCts
By law, the C Fund must be invested in a port olio designed to replicate the per ormance o an index o stocks represent-ing the U.S. stock market. The Federal Retirement Thri t Investment Board has chosen as its benchmark the Standard &Poor’s 500 (S&P 500) Index, which tracks the per ormance o major U.S. companies and industries.
The S&P 500 Index is an index o 500 large to medium-sized U.S. companies that are traded in the U.S. stock markets.The index was designed by Standard & Poor’s Corporation (S&P) to provide a representative measure o U.S. stock market
per ormance. The companies in the index represent 132 sub-industries classifed into the 10 major industry groups shownin the chart. The stocks in the S&P 500 Index represent approximately 75% o the market value o the U.S. stock markets.
The S&P 500 is considered a“big company” index. As oDecember 31, 2010, the largest100 companies in the S&P 500represented approximately 65%o the index’s market value. TheS&P 500 Index includes 401 se-curities traded on the New YorkStock Exchange and 99 securi-ties that are traded on NASDAQ.The market value o the largestcompany in the index is approxi-mately $369 billion; the marketvalue o the smallest company isapproximately $1.3 billion.
The S&P 500 Index is weightedby oat-adjusted market capi-talization, in which a company’smarket value and its weightingin the index are calculated us-ing the number o shares thatare reely traded, rather than alloutstanding shares. Shares thatare not reely traded, such as theholdings o controlling shareholders and their amilies, company management, and other companies, are excluded romthe calculation. A company’s weighting in the index is the oat-adjusted market value o the company (that is, the shareprice multiplied by the number o reely traded shares outstanding) as a percentage o the combined oat-adjusted mar-ket value o all companies in the index.
BlackRock’s Equity Index Fund — The C Fund is invested in the Equity Index Fund. The C Fund holds all the stocks in-cluded in the S&P 500 Index in virtually the same weights that they have in the index. The per ormance o the Equity IndexFund is evaluated on the basis o how closely its returns match those o the S&P 500 Index. A portion o the Equity IndexFund assets is reserved to meet the needs o daily client activity. This liquidity reserve is invested in S&P 500 Index utures
contracts.
The C Fund invests in the Equity Index Fund by purchasing shares o the Equity Index Fund “E,” which, in turn, holdsshares o the Equity Index Master Fund along with a liquidity pool. As o December 31, 2010, C Fund holdings constituted$77.1 billion o the Equity Index Master Fund, which itsel held $90.8 billion in securities.
Note: Participants’ inter und trans er (IFT) requests redistribute their existing account balances among the TSP unds.For each calendar month, the frst two IFTs can redistribute money among any or all o the TSP unds. A ter that, or the rmainder o the month, IFTs can only move money into the G Fund. (For participants with more than one TSP account, thisrule applies to each account separately.)
S&P 500 IndexMajor Industry GroupsDecember 31, 2010
Health Care10.9%
InformationTechnology18.7%
Financials16.1%
Industrials11.0%
ConsumerDiscretionary10.6%
Energy12.0%
Telecom Services 3.1%Utilities 3.3%
ConsumerStaples10.6%
Materials 3.7%

8/9/2019 Federal Judges Retirement & Blackrock 2006 MBS ABS
http://slidepdf.com/reader/full/federal-judges-retirement-blackrock-2006-mbs-abs 13/37

8/9/2019 Federal Judges Retirement & Blackrock 2006 MBS ABS
http://slidepdf.com/reader/full/federal-judges-retirement-blackrock-2006-mbs-abs 14/37
8/9/2019 Federal Judges Retirement & Blackrock 2006 MBS ABS
http://slidepdf.com/reader/full/federal-judges-retirement-blackrock-2006-mbs-abs 15/37

8/9/2019 Federal Judges Retirement & Blackrock 2006 MBS ABS
http://slidepdf.com/reader/full/federal-judges-retirement-blackrock-2006-mbs-abs 16/37

8/9/2019 Federal Judges Retirement & Blackrock 2006 MBS ABS
http://slidepdf.com/reader/full/federal-judges-retirement-blackrock-2006-mbs-abs 17/37

8/9/2019 Federal Judges Retirement & Blackrock 2006 MBS ABS
http://slidepdf.com/reader/full/federal-judges-retirement-blackrock-2006-mbs-abs 18/37

8/9/2019 Federal Judges Retirement & Blackrock 2006 MBS ABS
http://slidepdf.com/reader/full/federal-judges-retirement-blackrock-2006-mbs-abs 19/37

8/9/2019 Federal Judges Retirement & Blackrock 2006 MBS ABS
http://slidepdf.com/reader/full/federal-judges-retirement-blackrock-2006-mbs-abs 20/37

8/9/2019 Federal Judges Retirement & Blackrock 2006 MBS ABS
http://slidepdf.com/reader/full/federal-judges-retirement-blackrock-2006-mbs-abs 21/37
8/9/2019 Federal Judges Retirement & Blackrock 2006 MBS ABS
http://slidepdf.com/reader/full/federal-judges-retirement-blackrock-2006-mbs-abs 22/37

8/9/2019 Federal Judges Retirement & Blackrock 2006 MBS ABS
http://slidepdf.com/reader/full/federal-judges-retirement-blackrock-2006-mbs-abs 23/37

8/9/2019 Federal Judges Retirement & Blackrock 2006 MBS ABS
http://slidepdf.com/reader/full/federal-judges-retirement-blackrock-2006-mbs-abs 24/37
8/9/2019 Federal Judges Retirement & Blackrock 2006 MBS ABS
http://slidepdf.com/reader/full/federal-judges-retirement-blackrock-2006-mbs-abs 25/37

8/9/2019 Federal Judges Retirement & Blackrock 2006 MBS ABS
http://slidepdf.com/reader/full/federal-judges-retirement-blackrock-2006-mbs-abs 26/37

8/9/2019 Federal Judges Retirement & Blackrock 2006 MBS ABS
http://slidepdf.com/reader/full/federal-judges-retirement-blackrock-2006-mbs-abs 27/37
8/9/2019 Federal Judges Retirement & Blackrock 2006 MBS ABS
http://slidepdf.com/reader/full/federal-judges-retirement-blackrock-2006-mbs-abs 28/37

8/9/2019 Federal Judges Retirement & Blackrock 2006 MBS ABS
http://slidepdf.com/reader/full/federal-judges-retirement-blackrock-2006-mbs-abs 29/37

8/9/2019 Federal Judges Retirement & Blackrock 2006 MBS ABS
http://slidepdf.com/reader/full/federal-judges-retirement-blackrock-2006-mbs-abs 30/37

8/9/2019 Federal Judges Retirement & Blackrock 2006 MBS ABS
http://slidepdf.com/reader/full/federal-judges-retirement-blackrock-2006-mbs-abs 31/37

8/9/2019 Federal Judges Retirement & Blackrock 2006 MBS ABS
http://slidepdf.com/reader/full/federal-judges-retirement-blackrock-2006-mbs-abs 32/37

8/9/2019 Federal Judges Retirement & Blackrock 2006 MBS ABS
http://slidepdf.com/reader/full/federal-judges-retirement-blackrock-2006-mbs-abs 33/37
Rating Market Value
Number of Holdings 141 948 FNMA 30YR TBA 5.000% 10/12/06 Agency $16,650,349
Duration (yrs) 2.6 3.4 FNMA 15YR 2002 PROD 6.000% 4/1/21 Agency $12,451,582
Avg. Credit Quality Govt/Govt Aaa/AAA FNMA 30YR 2004 PROD 5.500% 10/1/34 Agency $10,034,462Avg. Life (yrs) 4.9 5.4 FNMA 30YR TBA 6.500% 10/12/06 Agency $8,367,673
Avg. YTM (%) 5.5 5.6 FNMA 15YR 2003 PROD 5.000% 2/1/18 Agency $5,967,139
Avg. Current Yield (%) 5.4 5.3
Avg. Coupon (%) 5.2 5.3
BlackrockMBS &
ABS
LehmanMBS/ABSComposite
Top Five Holdings
Security
% of MOSERS Total Fund 2.04%
MOSERS' Specific Information
Market Value (MV) $145,710,394
Inception Date January, 1995
Robert Capaldi Relationship Manager (212) 810-5312 [email protected]
September 30, 2006
Andrew Phillips Portfolio Manager (212) 810-5559 [email protected]
3.14 3.374.24 4.18 3.56 3.63
4.55 4.43
6.16 6.026.52 6.28 7.16 6.93
-1.0
1.0
3.0
5.0
7.0
9.0
11.0
P e r c e n
t ( % )
1 Quarter 1 Year 3 Years 5 Years 7 Years 10 Years Since Inception
Performance (Annualized)
Blackrock MBS & ABS
Mosers Hybrid 67/33
Firm Backgroundttt t BlackRock was established in March 1988 to provide fixedincome investment management services to investorsworldwide. The firm was founded on the belief thatexperienced investment professionals using a disciplinedinvestment process and highly sophisticated analytical tools
will consistently add value to client portfolios. Accordingly,BlackRock has assembled a team of investment professionalswith expertise in fixed income, liquidity, equity and alternative,including real estate, asset classes and continues to makeinvestments in technology and analytics.
Investment Philosophyttt t BlackRock applies a controlled duration, relative valuesector rotation and security selection style to the managementof all its fixed income mandates. The distinguishing featureof BlackRock’s investment management style is the abili ty togenerate alpha within a risk-controlled framework. Real-time
analysis of a vast array of risk measures allows them to assessthe potential impact of various sector and security strategieson total return. As a result, consistent value is added andperformance volatility is controlled.
BlackRock Financial ManagementNew York, NY
Enhanced MBS/ABS
Andrew Phillips Robert Capaldi
8/9/2019 Federal Judges Retirement & Blackrock 2006 MBS ABS
http://slidepdf.com/reader/full/federal-judges-retirement-blackrock-2006-mbs-abs 34/37
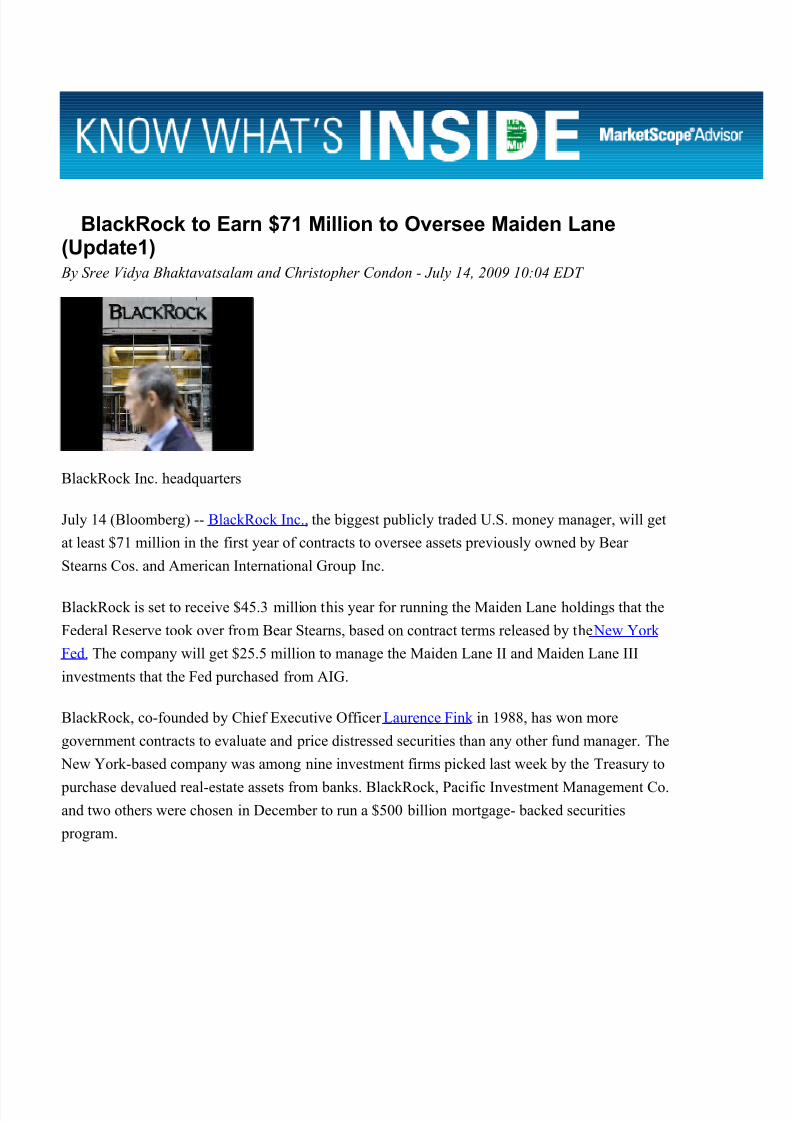
BlackRock to Earn $71 Million to Oversee Maiden Lane(Update1)
By Sree Vidya Bhaktavatsalam and Christopher Condon - July 14, 2009 10:04 EDT
BlackRock Inc. headquarters
July 14 (Bloomberg) -- BlackRock Inc., the biggest publicly traded U.S. money manager, will getat least $71 million in the first year of contracts to oversee assets previously owned by Bear Stearns Cos. and American International Group Inc.
BlackRock is set to receive $45.3 million this year for running the Maiden Lane holdings that theFederal Reserve took over from Bear Stearns, based on contract terms released by the New York Fed. The company will get $25.5 million to manage the Maiden Lane II and Maiden Lane IIIinvestments that the Fed purchased from AIG.
BlackRock, co-founded by Chief Executive Officer Laurence Fink in 1988, has won moregovernment contracts to evaluate and price distressed securities than any other fund manager. The
New York-based company was among nine investment firms picked last week by the Treasury to
purchase devalued real-estate assets from banks. BlackRock, Pacific Investment Management Co.and two others were chosen in December to run a $500 billion mortgage- backed securities
program.

8/9/2019 Federal Judges Retirement & Blackrock 2006 MBS ABS
http://slidepdf.com/reader/full/federal-judges-retirement-blackrock-2006-mbs-abs 35/37
³ The important thing, in my opinion, would be the reputational enhancement,´ Jeffrey Hopson, ananalyst with Stifel Nicolaus & Co. in St. Louis, said in an interview. Contracts with the U.S.government are ³ impressive to anyone that they¶re potentially seeking as a client,´ he said.
The New York Fed posted copies of its contracts with BlackRock and other investment managersin June without disclosing fees. It subsequently published the information on its Web site.
Devalued Assets
The U.S. government is relying on money-management firms such as BlackRock to help manageand dispose of devalued assets after the collapse of the subprime mortgage market in 2007triggered about $1.47 trillion of writedowns and credit losses at financial companies.
BlackRock could earn an additional $50 million or more under the Maiden Lane agreements,which are set to run at least three years. Its fees, based on assets, will shrink as the portfoliosdecrease in size.
Bobbie Collins , a spokeswoman for BlackRock, declined to comment on the Fed contracts. CalvinMitchell , a spokesman for the New York Fed, didn¶t return a call seeking comment.
Bear Stearns, once the fifth-largest U.S. securities firm, agreed in March 2008 to sell itself toJPMorgan Chase & Co. at a fraction of its market value to avert a collapse. The Fed took over $30
billion worth of the New York-based firm¶s assets.
AIG, formerly the world¶s largest insurer by assets, was bailed out by the U.S. after losses tied tohome loans last year. The New York-based insurer sold securities with a face value of $39.3
billion to the Maiden Lane facility. Maiden Lane was named for a Manhattan street that bordersthe New York Federal Reserve.
Congressional Questions
Lawmakers including U.S. Senator Charles Grassley , an Iowa Republican, have questioned theBear Stearns and AIG contracts with BlackRock, which were awarded without competing bids.
BlackRock, which manages $1.3 trillion in assets, reported about $5 billion in revenue last year.About 88 percent came from investment-management and performance fees.

8/9/2019 Federal Judges Retirement & Blackrock 2006 MBS ABS
http://slidepdf.com/reader/full/federal-judges-retirement-blackrock-2006-mbs-abs 36/37
³ Being in the flow of information -- pricing information, knowing who¶s buying and selling, themarket knowledge -- will ultimately be more important than the actual fees,´ Charles Peabody , a
partner and research analyst at Portales Partners LLC in New York, said in an interview. ³ Relativeto the size of the company, those fees are immaterial.´
To contact the reporters on this story: Sree Vidya Bhaktavatsalam in Boston [email protected] ; Christopher Condon in Boston at [email protected]

8/9/2019 Federal Judges Retirement & Blackrock 2006 MBS ABS
http://slidepdf.com/reader/full/federal-judges-retirement-blackrock-2006-mbs-abs 37/37
BlackRock Enhanced MBS-
ABS's % of Total Fund: 1.68% as of 10-31-2008
Public Debt
Core Bonds High Yield Bonds Market Nuetral TIPS
Beta-Alpha Program - Core Fixed Income
BlackRock Enhanced MBS-ABS
NISA Fixed Income - Coporate Bonds
Blackrock MBS-ABSNew York, NY
Manager Information
Investment PhilosophyBlackRock utilizes technology and research staff to add incremental value through extensive quantitative analysis. Theyimplement strategies through a very active trading approach, in which sector rotation and security selection play a veryimportant role. The investment strategy group (comprised of BlackRock’s most senior executives) meets weekly todetermine overall investment strategy. Within the parameters established by the investment strategy group, the portfoliomanagers implement the process of sector and security selection, while adhering to well defined duration constraints.
Policy Allocation PurposeMortgage-backed securities (MBS) are highly liquid instruments that are also very high in quality due to the dual backing
of both the issuer’s credit worthiness as well as the underlying mortgage collateral (primarily residential but somecommercial). Asset-backed securities (ABS) are very high quality (typically the highest investment grade rating) securitiesdue to their backing by over-collateralized liquid assets such as car loans and credit card receivables to name a fewexamples. These core fixed income securities are intended to provide a source of current income and reduce overall fundvolatility. In addition, the portfolio is expected to perform well during periods of disinflation and/or outright deflation.
Value Added Allocation PurposeBlackRock’s goal is to add value over the index with a risk profile commensurate to that of the benchmark. BlackRock hasbeen remarkably consistent in achieving modest levels of alpha over a long time period—there has never been a significantperiod of time in which returns have fallen short of the benchmark.
Asset Allocation
41%
32%
27%
Alternatives Public Debt Public Equity