Federal Budget - Finance · The Budget in Brief is a summary of the Federal Budget 2011-12. It is...
51
Federal Budget BUDGET IN BRIEF 2011‐12 GOVERNMENT OF PAKISTAN FINANCE DIVISION ISLAMABAD
-
Upload
truongdung -
Category
Documents
-
view
217 -
download
3
Transcript of Federal Budget - Finance · The Budget in Brief is a summary of the Federal Budget 2011-12. It is...

Federal Budget
BUDGET IN
BRIEF 2011‐12
GOVERNMENT OF PAKISTAN FINANCE DIVISION
ISLAMABAD

PREFACE The Budget in Brief is a summary of the Federal Budget 2011-12. It
is designed to provide essential budgetary information about the revenues and expenditure at a glance. Detailed information is available in other budgetary documents.
The federal budget is being prepared in accordance with the budgeting and accounting classification system that has been approved by the Government of Pakistan as an integral part of the New Accounting Model.
The three years medium-term indicative budget ceilings for the current and development budgets were issued to all Principal Accounting Officers of the Federal Government. A new budget preparation method, called the 'Output Based Budgeting' has been introduced, which presents the federal budget by services and effects of services on target population and links these with performance indicators and targets over the 3 year period. Medium Term Macroeconomic Indicators have been included in this document.
For the convenience of readers, some additional information regarding subsidies, loans and advances has been shown separately. Another facility is that after approval by the Parliament, all budgetary books including Budget in Brief will be placed on the Ministry of Finance website www.finance.gov.pk for un-restricted access by all.
I hope that this document will prove to be useful and easily accessible.
Waqar Masood Khan Secretary to the Government of Pakistan
Finance Division Islamabad, the 3rd June, 2011
Page
1
123
- 3- 4- 5
6
7
78
9
10- 10- 11- 12- 13- 14
15
16
- 16- 17- 21
Contd.........
Revenue Receipts
_______________________________________________________________
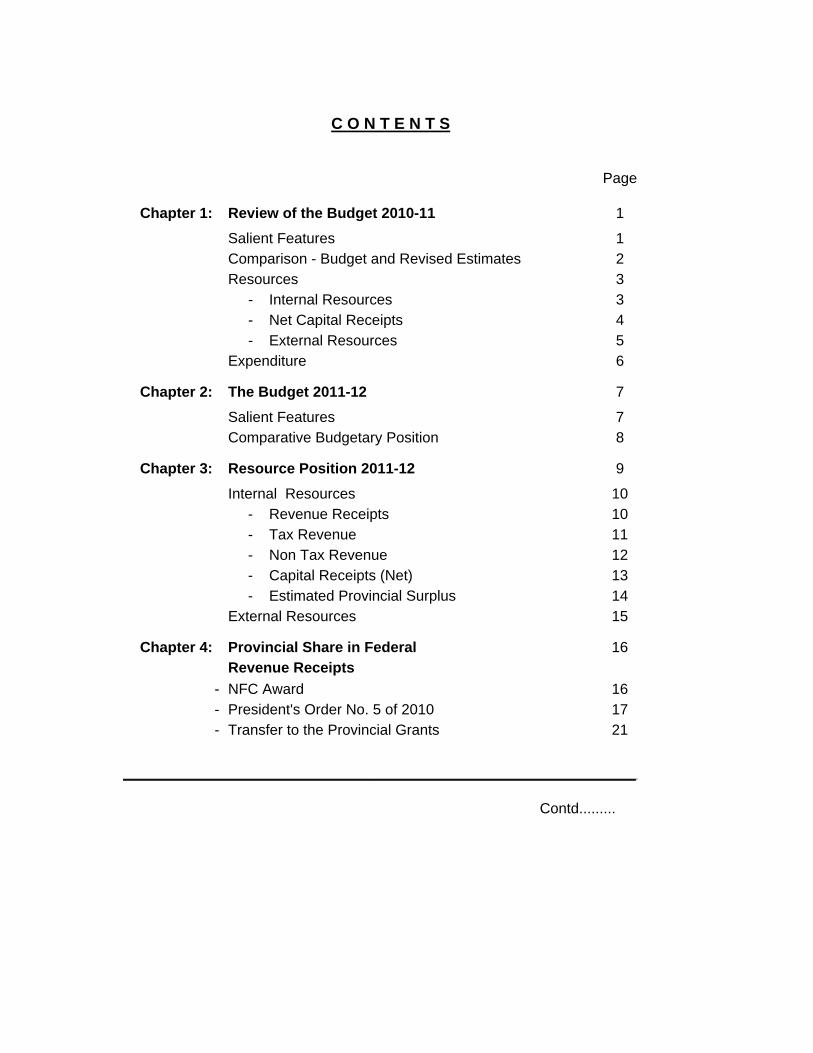
NFC AwardPresident's Order No. 5 of 2010Transfer to the Provincial Grants
Non Tax RevenueCapital Receipts (Net)Estimated Provincial Surplus
Chapter 4: Provincial Share in Federal
External Resources
The Budget 2011-12
Chapter 3: Resource Position 2011-12
Salient Features
Revenue ReceiptsTax Revenue
External Resources
C O N T E N T S
Chapter 1: Review of the Budget 2010-11
ResourcesComparison - Budget and Revised EstimatesSalient Features
Internal Resources Net Capital Receipts
Expenditure
Internal Resources
Comparative Budgetary Position
Chapter 2:

22
222324252627282829303132
33
3335
37
373839
40
4041
Outside PSDP 43
44
45
47
49Working of Fiscal Deficit and Financing Budget 2011-12
_______________________________________________________________
Budget at a Glance 2011-12
Chapter 8: Public Sector DevelopmentProgramme (PSDP) 2011-12
Salient Features of PSDPSize of PSDP
Macroeconomic Indicators
Chapter 9:
Chapter 7: Loans and Investments
Development Loans and AdvancesCurrent Investment
Medium Term Budgetary Framework
C O N T E N T S
Chapter 6:
Education Affairs and ServicesRecreational, Culture and ReligionHealth Affairs and ServicesHousing and Community Amenities
Public Order and Safety Affairs
Social Protection
Subsidies & Grants
Details of Grants
Environment ProtectionEconomic Affairs
General Public ServiceDefence Affairs and Services
Chapter 5: Current Expenditure 2011-12Current Expenditure (Summary)
Details of Subsidies
Current Loans & Advances
Comparative Position

49
a)
b)
c)
d)
e)
f)
g)
h)
i)
The total outlay of budget 2010-11 was estimated at Rs 2,423 billion. However,this size increased to Rs 2,559 billion in revised estimates 2010-11 or by 5.6%.
The resource availability during 2010-11 had been estimated at Rs 2,256 billionwhich declined to Rs 2,107 billion in revised estimates or by 6.6%.
The share of current expenditure in total budgetary outlay for 2010-11 was82.5% as compared to 89.7% in revised estimates for 2010-11.
The expenditure on General Public Service (inclusive of debt servicing transferpayments and superannuation allowance) was estimated at Rs 1,388 billionwhich was 69.5% of the current expenditure.
Net revenue receipts for 2010-11 had been estimated at Rs 1,377 billionindicating a decrease of 10% in revised estimates 2010-11.
The provincial share in federal revenue receipts was estimated at Rs 1,034billion during 2010-11 which was decreased to Rs 998 billion in the revisedestimates for 2010-11.
CHAPTER - 1REVIEW OF BUDGET 2010-11
SALIENT FEATURES
1.1 The budget 2010-11 had the following salient features:
The capital receipts (net) for 2010-11 had been estimated at Rs 325 billionwhich increased to Rs 459 billion in revised estimates 2010-11 i.e. an increaseof 41.2%.
The external receipts in 2010-11 were estimated at Rs 387 billion. This showeda decrease of 25% over the revised estimates for 2010-11.
The overall expenditure during 2010-11 had been estimated at Rs 2,423 billionof which the current expenditure was Rs 1,998 billion and developmentexpenditure at Rs 425 billion. Current expenditure showed an increase of14.9% over the revised estimates of 2010-11, while development expenditurehad been decreased by 38.0% in the revised estimates of 2010-11.
12:38 PM6/4/2011

49
j)
k)
l)
Budget Revised2010-11 2010-11
2,256,278 2,107,150
- 1,869,659 1,817,325 - 1,377,350 1,238,188 - 325,384 459,332 - 166,925 119,805
- External Resources 386,620 289,824
EXPENDITURE 2,422,823 2,559,367 - 1,997,892 2,295,921 - 290,000 196,000 - 31,385 21,929 - 123,545 45,517 - (20,000) 0
BANK BORROWING 166,544 452,217
SUMMARY 2010-11
Classification
(Rs in Million)
1.2 In the light of features outlined above, a comparison has been drawn betweenbudget estimates and revised estimates 2010-11 in the following Table:
While for Other Development Expenditure was budgeted at Rs 124 billion in2010-11.
Internal ResourcesRevenue Receipts (Net)
Estimated Provincial Surplus
RESOURCES
The size of Public Sector Development Programme (PSDP) for 2010-11was Rs 663 billion. Out of which Rs 168 billion was allocated to FederalMinistries/Divisions, Rs 57 billion for Corporations and Rs 30 billion for SpecialProgramme.
TABLE - 1
The provinces had been allocated an amount of Rs 373 billion for budgetestimates 2010-11 in their PSDP. An amount of Rs 10 billion had beenallocated to Earthquake Reconstruction and Rehabilitation Authority (ERRA) inthe PSDP 2010-11, which increased to Rs 16 billion in revised estimates.
Capital Receipts (Net)
Current ExpenditureFederal PSDP
Other Development ExpenditureDevelopment Loans & Grants to Provinces
Est. Operational Shortfall in PSDP
12:38 PM6/4/2011

49
Budget Revised2010-11 2010-11
TAX REVENUE 1,778,715 1,679,363
- 657,700 626,900
- 1,121,015 1,052,463
632,279 556,526
- 169,985 103,625
- 332,250 302,640
- 130,044 150,261
2,410,994 2,235,889
1,033,644 997,701
1,377,350 1,238,188
A.
Revenue Receipts (Gross)
Classification
Direct Taxes
Miscellaneous Receipts
REVENUE RECEIPTS
B.
1.3 The internal resources come though revenue receipts (tax & non-tax) and netcapital receipts. Table-2 provides the budget and revised estimates for 2010-11 inrespect of tax and non-tax revenue, while Table-3 provides the details of net capitalreceipts.
INTERNAL RESOURCES
TABLE - 2
( 2010-11 )(Rs in Million)
NON - TAX REVENUE
RESOURCES:
Revenue Receipts (Net)
Indirect Taxes
Less Provincial Share
Income from Property and Enterprise
Receipts from Civil Administration and Other Functions
12:38 PM6/4/2011

49
Budget Revised2010-11 2010-11
RECEIPTS ( A + B ) 380,034 520,299
A. Federal Consolidated Fund 163,890 319,061
- Recovery of Loans 47,460 57,752
- Permanent Debt 61,430 148,809
- Floating Debt 55,000 112,500
B. Public Account 216,144 201,238
DISBURSEMENTS 54,650 60,966
325,384 459,332
CAPITAL RECEIPTS (NET)
1.6 The net capital receipts expected to register an increase of Rs 133,948 millionor by 41.2% in the revised estimates 2010-11. The following Table provides thedetails:
TABLE - 3CAPITAL RECEIPTS (NET)
( 2010-11 )
Classification
I.
(Rs in Million)
II.
NET CAPITAL RECEIPTS (I-II)
1.5 After deducting the provincial share, the net revenue receipts wereestimated at Rs 1,377,350 million in the budget 2010-11. These are nowestimated at Rs 1,238,188 million in the revised estimates 2010-11 i.e. a decline of10.1%.
1.4 The tax revenue in revised estimates 2010-11 recorded a decrease of5.6% over budget estimates 2010-11 while the non-tax revenue decreased fromRs 632,279 million to Rs 556,526 million or by 12.0%.
12:38 PM6/4/2011
49
Budget RevisedClassification 2010-11 2010-11
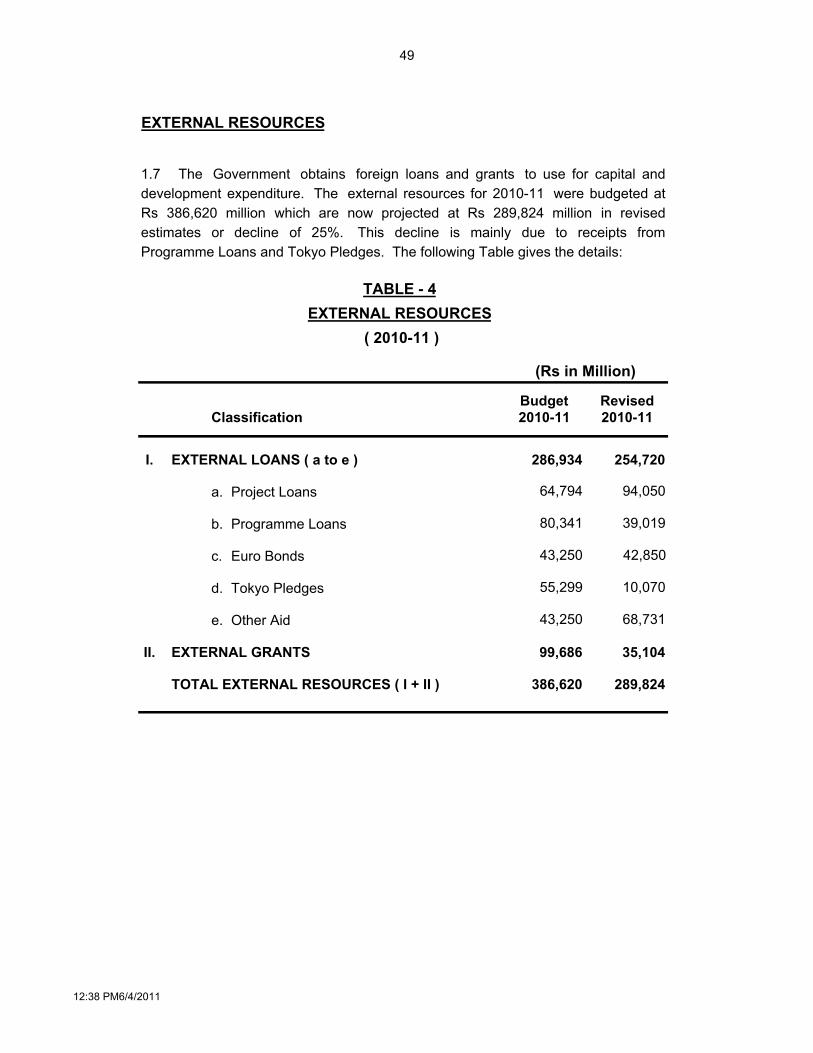
EXTERNAL LOANS ( a to e ) 286,934 254,720
64,794 94,050
b. 80,341 39,019
c. 43,250 42,850
d. 55,299 10,070
e. 43,250 68,731
EXTERNAL GRANTS 99,686 35,104
TOTAL EXTERNAL RESOURCES ( I + II ) 386,620 289,824
Programme Loans
Other Aid
Tokyo Pledges
Euro Bonds
II.
a. Project Loans
I.
TABLE - 4
EXTERNAL RESOURCES
( 2010-11 )
(Rs in Million)
1.7 The Government obtains foreign loans and grants to use for capital anddevelopment expenditure. The external resources for 2010-11 were budgeted atRs 386,620 million which are now projected at Rs 289,824 million in revisedestimates or decline of 25%. This decline is mainly due to receipts fromProgramme Loans and Tokyo Pledges. The following Table gives the details:
EXTERNAL RESOURCES
12:38 PM6/4/2011
49
Budget RevisedClassification 2010-11 2010-11
1,997,892 2,295,921
- 1,387,664 1,655,566
- 442,173 444,640
- 51,263 58,735
- 66,897 79,960
- 448 448
- 1,842 1,657
- 7,283 7,455
- 4,359 4,197
- 34,500 40,324
- 1,463 2,940
424,930 263,446
- 290,000 196,000
- 123,545 45,517
- 31,385 21,929
- (20,000) 0
2,422,823 2,559,367
B. DEVELOPMENT
Federal PSDP
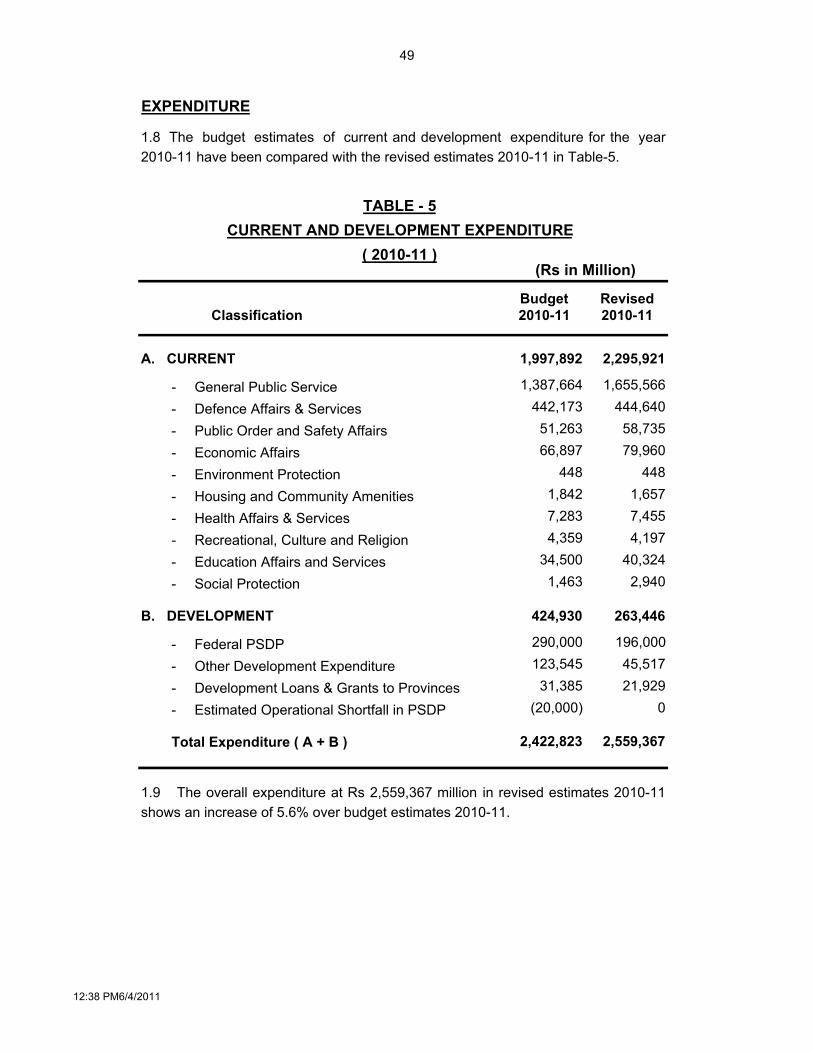
1.9 The overall expenditure at Rs 2,559,367 million in revised estimates 2010-11shows an increase of 5.6% over budget estimates 2010-11.
Other Development Expenditure Development Loans & Grants to Provinces
Total Expenditure ( A + B )
General Public Service
Public Order and Safety AffairsDefence Affairs & Services
( 2010-11 )(Rs in Million)
A. CURRENT
1.8 The budget estimates of current and development expenditure for the year2010-11 have been compared with the revised estimates 2010-11 in Table-5.
TABLE - 5
EXPENDITURE
CURRENT AND DEVELOPMENT EXPENDITURE
Recreational, Culture and Religion
Environment Protection
Health Affairs & Services
Social ProtectionEducation Affairs and Services
Estimated Operational Shortfall in PSDP
Economic Affairs
Housing and Community Amenities
12:38 PM6/4/2011

49
2.1
a)
b)
c)
d)
e)
f)
g)
h)
i)
CHAPTER - 2THE BUDGET 2011-12
The resource availability during 2011-12 has been estimated at Rs 2,463 billionagainst Rs 2,256 billion in the budget estimates of 2010-11.
The budget 2011-12 has the following main salient features:
The total outlay of budget 2011-12 is Rs 2,767 billion. This size is 14.2% higherthan the size of budget estimates 2010-11.
SALIENT FEATURES
The share of current expenditure in total budgetary outlay for 2011-12 is 83.7%as compared to 89.7% in revised estimates for 2010-11.
Net revenue receipts for 2011-12 have been estimated at Rs 1,529 billionindicating an increase of 11% over the budget estimates of 2010-11.
The external receipts in 2011-12 are estimated at Rs 414 billion. This showsan increase of 7.1% over the budget estimates for 2010-11.
The provincial share in federal revenue receipts is estimated at Rs 1,203 billionduring 2011-12 which is 16.4% higher than the budget estimates for 2010-11.
The capital receipts (net) for 2011-12 have been estimated at Rs 396 billionagainst the budget estimates of Rs 325 billion in 2010-11 i.e. an increase of11%.
The overall expenditure during 2011-12 has been estimated at Rs 2,767 billionof which the current expenditure is Rs 2,315 billion and developmentexpenditure at Rs 452 billion. Current expenditure shows an increase of lessthan 1% over the revised estimates of 2010-11, while development expenditurewill increase by 64.4% in 2011-12 over the revised estimates of 2010-11.
The expenditure on General Public Services (inclusive of debt servicingtransfer payments and superannuation allowance) is estimated at Rs 1,660billion which is 71.1% of the current expenditure.
12:38 PM6/4/2011
49
j)
k)
l)
Budget Revised Budget2010-11 2010-11 2011-12
2,256,278 2,107,150 2,463,292a. 1,869,659 1,817,325 2,049,363
- 1,377,350 1,238,188 1,528,829- 325,384 459,332 395,652- 166,925 119,805 124,882
b. 386,620 289,824 413,929
2,422,823 2,559,367 2,766,816- 1,997,892 2,295,921 2,314,859- 290,000 196,000 300,000-
31,385 21,929 54,871- 123,545 45,517 97,085- (20,000) 0 0
166,544 452,217 303,524
Estimated Provincial Surplus
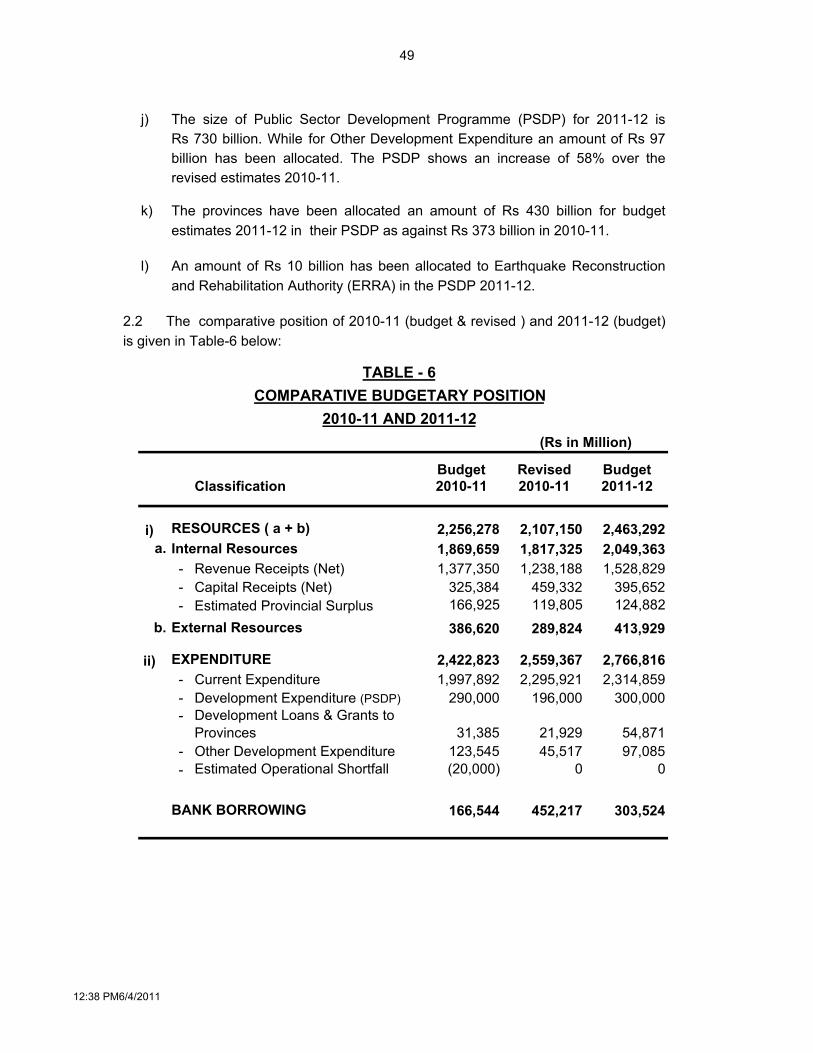
2.2 The comparative position of 2010-11 (budget & revised ) and 2011-12 (budget)is given in Table-6 below:
The provinces have been allocated an amount of Rs 430 billion for budgetestimates 2011-12 in their PSDP as against Rs 373 billion in 2010-11.
i)
TABLE - 6
Other Development Expenditure
BANK BORROWING
Revenue Receipts (Net)
RESOURCES ( a + b)
COMPARATIVE BUDGETARY POSITION
ii)
Estimated Operational Shortfall
Current Expenditure
Capital Receipts (Net)
External Resources
Development Expenditure (PSDP)Development Loans & Grants to Provinces
Internal Resources
An amount of Rs 10 billion has been allocated to Earthquake Reconstructionand Rehabilitation Authority (ERRA) in the PSDP 2011-12.
2010-11 AND 2011-12
Classification
(Rs in Million)
EXPENDITURE
The size of Public Sector Development Programme (PSDP) for 2011-12 isRs 730 billion. While for Other Development Expenditure an amount of Rs 97billion has been allocated. The PSDP shows an increase of 58% over therevised estimates 2010-11.
12:38 PM6/4/2011

49
Budget Revised Budget2010-11 2010-11 2011-12
1,869,659 1,817,325 2,049,363
1,377,350 1,238,188 1,528,829325,384 459,332 395,652166,925 119,805 124,882
386,620 289,824 413,929
2,256,278 2,107,150 2,463,292
TABLE - 7
Classification
CHAPTER - 3
3.1 There are two resources i.e. internal and external. The internal resourcescomprise of revenue receipts, capital receipts and estimated provincial surplus.The external resources come from foreign loans and grants. The overallcomparative resource position for the year 2010-11 (budget and revised) and2011-12 (budget) is given in Table -7 below:
RESOURCE POSITION
A. INTERNAL RESOURCES
B.
Revenue Receipts (Net)
TOTAL RESOURCES ( A + B )
(2011-12)
Capital Receipts (Net)
EXTERNAL RESOURCES
Estimated Provincial Surplus
RESOURCE POSITION
(Rs in Million)
12:38 PM6/4/2011

49
Budget Revised Budget2010-11 2010-11 2011-12
1,778,715 1,679,363 2,074,182
- 657,700 626,900 743,600
- 1,121,015 1,052,463 1,330,582
632,279 556,526 657,968
- 169,985 103,625 195,330
- 332,250 302,640 321,383
- 130,044 150,261 141,255
2,410,994 2,235,889 2,732,150
1,033,644 997,701 1,203,321
1,377,350 1,238,188 1,528,829
(Rs in Million)
Classification
INTERNAL RESOURCES
REVENUE RECEIPTS
3.2 The revenue receipts in budget 2011-12, on gross basis, are estimated atRs 2,732,150 million showing an increase of 13.3% over the budgetestimates 2010-11. The provincial share in taxes for 2011-12 is estimated atRs 1,203,321 million which is 16.4% higher than the budget estimates of2010-11.
Revenue Receipts (Net)
Property and Enterprise
Revenue Receipts (Gross)
Miscellaneous Receipts
Tax Revenue
Civil Administration and Other Functions
Indirect Taxes
Direct Taxes
Non - Tax Revenue
REVENUE RECEIPTS
Less: Provincial Share
3.4 Detailed information on various components of tax revenue and non-taxrevenue is given in the following Table 8 to 10:
TABLE - 8
3.3 The tax revenue at Rs 2,074,182 million for 2011-12 shows an increase of23.5% over revised estimates 2010-11. Non-tax revenue has been projected atRs 657,968 million in 2011-12 as compared with Rs 632,279 million in budgetestimates 2010-11. At this level the non-tax revenue is higher by 4.1% whencompared with the budget estimates 2010-11.
12:38 PM6/4/2011

49
Budget Revised Budget2010-11 2010-11 2011-12
1,778,715 1,679,363 2,074,182
I. 657,700 626,900 743,600
- 633,000 602,500 718,600
- 20,000 20,000 25,000
- 4,700 4,400 0
II. 1,121,015 1,052,463 1,330,582
- 180,800 173,300 206,400
- 674,900 654,600 836,700
- 153,600 132,900 165,600
- 110,000 90,000 120,000
- 1,640 1,592 1,807
- 75 71 75
1,667,000 1,587,700 1,952,300
Petroleum Levy
Income Tax
TABLE - 9
Sales Tax
*TAX REVENUE ( I + II)
Federal Excise
Direct Taxes
Indirect Taxes
* Out of which F.B.R tax collection:
Other Taxes (ICT)
TAX REVENUE
Airport Tax
(Rs in Million)
Classification
Capital Value Tax
Customs
Workers Welfare Fund
12:38 PM6/4/2011

49
Budget Revised Budget2010-11 2010-11 2011-12
632,279 556,526 657,968
169,985 103,625 195,330
- 1,100 (140) (2,195)
- 50,000 0 75,000- 16,638 18,508 15,638- 38,032 41,776 42,503- 64,215 43,481 64,384
332,250 302,640 321,383
- 788 702 801- 185,000 185,000 200,000- 133,463 115,296 118,739- 1,733 761 866- 811 497 530- 10,455 384 447
130,044 150,261 141,255- 2,402 2,213 2,388- 29,995 31,706 24,925
- 12,000 25,189 25,100- 15,500 19,605 15,183- 32,000 35,143 32,796- 10,850 10,700 13,750- 27,297 25,704 27,112
Interest (Provinces)
Income From Property and Enterprise
Dividends
Profits Pak. Telecom. Authority
Interest (PSEs & Others)
Gas Development SurchargeEconomic Services
Miscellaneous Receipts
Receipts from Civil Admn and Other Functions
Community Services
Surplus Profit of the SBP
Royalty on Oil
Defence
General Administration
Law and Order
Social Services
Discount Retained on Local Crude Oil
Royalty on Gas
OthersPassport and Citizenship Fees
NON - TAX REVENUE
Classification
Profits Pakistan Post Office
NON - TAX REVENUE TABLE - 10
(Rs in Million)
12:38 PM6/4/2011

49
CAPITAL RECEIPTS (NET)
Budget Revised Budget2010-11 2010-11 2011-12
I. RECEIPTS (A + B) 380,034 520,299 464,209A. 163,890 319,061 299,977
47,460 57,752 51,610- 25,863 32,429 27,192- 21,598 25,322 24,419
61,430 148,809 129,267- (6,495) (6,495) 0- 30,000 (25,000) 50,000- (50) (25) (25)- (10) (10) (10)- (15) (15) (15)- 40,000 182,354 80,000- (2,000) (2,000) (683)
55,000 112,500 119,100- 35,000 36,500 37,000- 20,000 76,000 82,100
B. 216,144 201,238 164,232- 213,014 186,600 149,200- 2,000 2,000 2,000- 1,130 12,638 13,032
II. 54,650 60,966 68,557- 28,190 20,394 32,330
- 26,460 40,573 36,227325,384 459,332 395,652
6,592 (4,929) 7,911 Net Lending to Others:
Saving Schemes
CAPITAL RECEIPTS NET (I - II)
G.P. Fund
DISBURSEMENT
Treasury Bills
OthersProvinces
3. Floating Debt
Deposits (Net)
Prize Bonds
3.5 Capital receipts in the budget 2011-12 have been estimated atRs 395,652 million against Rs 325,384 million in the budget estimates 2010-11 andRs 459,332 million in the revised estimates 2010-11. The details of capital receiptsand disbursements are reflected in Table-11.
FEBCs
Ijara Sukuk Bonds
Federal Consolidated Fund (1+2+3)
Public Account
1. Recoveries of Loans/Advances
2. Permanent Debt
FCBCs
Government BondsPakistan Investment Bonds
Repayment of Short Term Credits
Government Investments, loans,and Advances and Others
CAPITAL RECEIPTS (NET)
(Rs in Million)
Special US Dollar Bonds
U.S. Dollar Bearer Certificates
Classification
TABLE - 11
12:38 PM6/4/2011
49
Budget Revised Budget2010-11 2010-11 2011-12
1,119,516 1,073,742 1,313,712Divisible Pool 865,778 834,664 1,043,933Straight Transfers 167,864 163,037 159,388Special Grants/Subventions 54,398 54,060 55,430Project Loans 31,385 21,929 38,239Program Loans 0 0 16,632Japanese Grant 90 52 90
Less Payments to Federal Govt. 42,500 50,938 42,830Interest Payments 16,638 18,508 15,638Loans Repayments 25,863 32,429 27,192
Transfer to Provinces (Net) 1,077,016 1,022,804 1,270,882
Total Transfer to Provinces
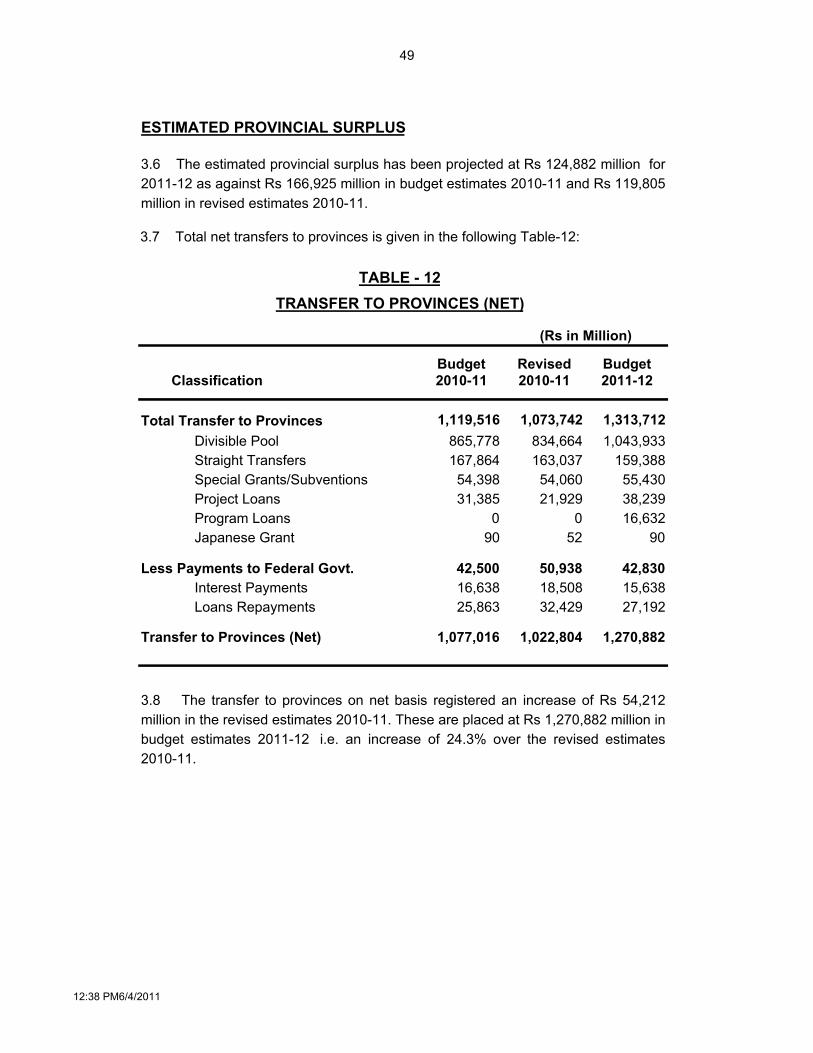
3.8 The transfer to provinces on net basis registered an increase of Rs 54,212million in the revised estimates 2010-11. These are placed at Rs 1,270,882 million in budget estimates 2011-12 i.e. an increase of 24.3% over the revised estimates2010-11.
(Rs in Million)
3.7 Total net transfers to provinces is given in the following Table-12:
Classification
TRANSFER TO PROVINCES (NET)
3.6 The estimated provincial surplus has been projected at Rs 124,882 million for2011-12 as against Rs 166,925 million in budget estimates 2010-11 and Rs 119,805million in revised estimates 2010-11.
TABLE - 12
ESTIMATED PROVINCIAL SURPLUS
12:38 PM6/4/2011
49
EXTERNAL RESOURCES
Budget Revised Budget2010-11 2010-11 2011-12
I. 286,934 254,720 287,236
A. Project Loans (i+ii) 64,794 94,050 67,509i 39,180 76,720 34,500- 26,076 37,373 14,883- 13,104 39,348 19,616
ii Provinces 25,613 17,330 33,009
B. Programme Loans 80,341 39,019 117,832C. Euro Bonds 43,250 42850 44,000D. Tokyo Pledges 55,299 10,070 13,895E. Other Aid 43,250 68,731 44,000
- 43,250 0 44,000- 0 68,731 0
II. 99,686 35,104 126,693- Project Grants 13,566 11,729 9,298
• 7,576 6,321 4,043• 218 809 25• 5,772 4,600 5,230
- Budget Support Grants 7,526 8,724 9,170- Tokyo Pledges 26,694 3,599 3,661- Privatization Proceeds 0 0 70,400- Kerry Lugar 51,900 11,051 34,164
386,620 289,824 413,929
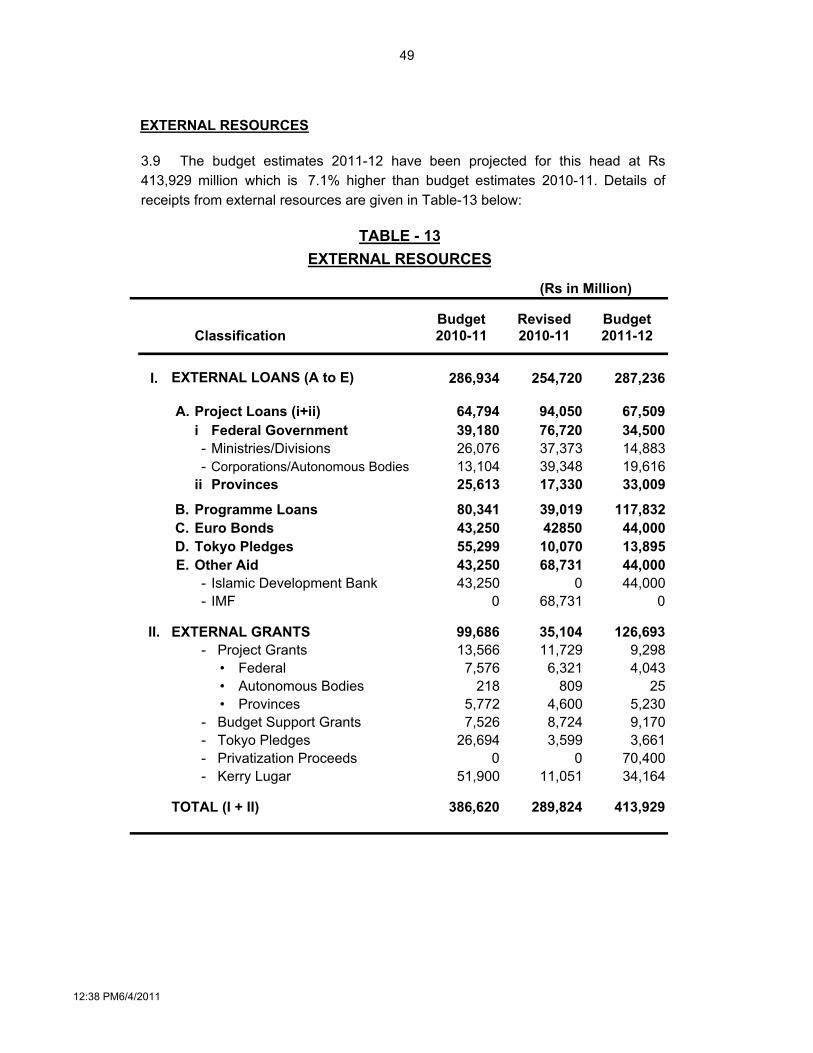
3.9 The budget estimates 2011-12 have been projected for this head at Rs413,929 million which is 7.1% higher than budget estimates 2010-11. Details ofreceipts from external resources are given in Table-13 below:
Classification
Islamic Development Bank
Federal Government
Autonomous Bodies
TABLE - 13
Ministries/Divisions
EXTERNAL RESOURCES
Federal
Corporations/Autonomous Bodies
EXTERNAL GRANTS
IMF
TOTAL (I + II)
(Rs in Million)
EXTERNAL LOANS (A to E)
Provinces
12:38 PM6/4/2011
49
4.4 For the first time in the history, multiple indicators have been adopted fordistribution of provincial share in the divisible pool whereas in all the previousAwards, population was the sole criterion for distribution of provincial share in thedivisible pool with special grants (subventions) to smaller provinces.
4.2 The 5th NFC gave the Award in 1996. 6th NFC was constituted in 2000 but itcould not give the Award and its life expired in July 2005. Accordingly, 7th NFC wasconstituted in July 2005 which gave the Award in the years 2010, after a period of 14years.
CHAPTER - 4
PROVINCIAL SHARE IN FEDERAL REVENUE RECEIPTS
4.3 Through this Award, the financial autonomy of the provinces has beenensured by increasing their share in the Divisible Pool (taxes) i.e. from 50% to 56%in 2010-11 and 57.5% from 2011-12 onwards. In case of Balochistan, the sharefrom the divisible pool has been guaranteed at Rs. 83 billion in financial year 2010-11, which is more than double from the actual divisible pool share of financial year2009-10. It has further been guaranteed that Balochistan province would receiveprovincial share in the divisible pool based on the budgetary projections fromfinancial year 2011-12 onwards for the NFC period. Shortfall, if any, based on theactual collection reported by FBR would be borne by the Federal Government itself.In the financial year 2010-11, in order to match the share of Balochistan Provincewith the guaranteed figures of Rs. 83.00 billion, Federal Government has paidRs. 16.7 billion from its own resources upto 30th April, 2011.
NFC Award
4.1 In Pakistan, about 93% resources are generated at federal level whereas only7% resources are generated by the provinces. Therefore, provinces rely on theFederal Government for meeting their expenditure requirements. In order tomaintain inter-governmental fiscal relationship, Article 160 of the Constitutionprovides for setting up of National Finance Commission (NFC) at intervals notexceeding five years. The mandate of NFC is to recommend to the President for thedistribution of resources between the Federal and Provincial Governments. ThePresident, through Presidential Order, gives legal cover to the recommendations ofthe NFC.
12:38 PM6/4/2011

49
4.5 The Recommendations of the NFC has been given legal cover throughPresident’s Order No. 5 of 2010, which is reproduced as follows:
ORDER
(a)
2. Definitions.— In this Order, unless there is anything repugnant in thesubject or context,─
"net proceeds" means, in relation to any tax, duty or levy, the proceedsthereof reduced by the cost of collection as ascertained and certified bythe Auditor General of Pakistan; and
(2) It shall come into force on the first day of July, 2010.
WHEREAS in pursuance of clause (1) of Article 160 of the Constitution of theIslamic Republic of Pakistan hereinafter referred to as the Constitution, thePresident, by the Finance Division's Notification No. S.R.O. 739(I)/2005, dated 21stJuly 2005, as modified by the said Division's Notification No. S.R.O. 693(I)/2009,dated 24th July 2009, appointed a National Finance Commission to makerecommendations, among other matters, as to the distribution between theFederation and the Provinces of the net proceeds of certain taxes;
1. Short title and commencement.— (1) This Order may be called theDistribution of Revenues and Grants-in-Aid Order, 2010.
"PRESIDENT'S ORDER No. 5 of 2010
to provide for distribution of revenues and certain grants
AN
AND WHEREAS the said Commission has also submitted its recommendationswith regard to the said distribution;
NOW, THEREFORE, in pursuance of clauses (4) and (7) of Article 160 of theConstitution, the President is pleased to make the following Order:—
"taxes on income" includes corporation tax but does not include taxes onincome consisting of remuneration paid out of the Federal ConsolidatedFund.
(b)
12:38 PM6/4/2011
49
(c)
(a) 82.0%
(b) 10.3%
(c) 5.0%
(d) 2.7%
wealth tax;
3. Distribution of Revenues.— (1) The divisible pool taxes in each yearshall consist of the following taxes levied and collected by the Federal Governmentin that year, namely:─
(b)
(a)
Revenue collection or generation
taxes on the sales and purchases of goods imported, exported,produced, manufactured or consumed;
(e)
any other tax which may be levied by the Federal Government.
(f)
federal excise duties excluding the excise duty on gas charged at well-head; and
export duties on cotton;
taxes on income;
(h)
Inverse population density
(3) After deducting the amounts as prescribed in clause (2), of the balanceamount of the net proceeds of divisible pool taxes, fifty-six percent shall beassigned to provinces during the financial year 2010-11 and fifty-seven and halfpercent from the financial year 2011-12 onwards. The share of the FederalGovernment in the net proceeds of divisible pool shall be forty - four percent duringthe financial year 2010-11 and forty-two and half percent from the financial year2011-12 onwards.
Poverty or backwardness
(2) One percent of the net proceeds of divisible pool taxes shall be assigned toGovernment of Khyber Pakhtunkhwa to meet the expenses on war on terror.
Population
4. Allocation of shares to the Provincial Governments.—(1) The Province-wise ratios given in clause (2) are based on multiple indicators. The indicators andtheir respective weights as agreed upon are:—
capital value tax;
(g)
customs duties;
(d)
12:38 PM6/4/2011
49
(a) 9.09%
(b) 14.62%
(c) 51.74%
(d) 24.55%100.00%
5. Payment of net proceeds of royalty on crude oil.─Each of the provincesshall be paid in each financial year as a share in the net proceeds of the totalroyalties on crude oil an amount which bears to the total net proceeds the sameproportion as the production of crude oil in the Province in that year bears to thetotal production of crude oil.
6. Payment of net proceeds of development surcharge on natural gas tothe Provinces.─(1) Each of the Provinces shall be paid in each financial year as ashare in the net proceeds to be worked out based on average rate per MMBTU ofthe respective province. The average rate per MMBTU shall be derived by notionallyclubbing both the royalty on natural gas and development surcharge on Gas.Royalty on natural gas shall be distributed in accordance with clause (1) of Article161 of the Constitution whereas the development surcharge on natural gas would bedistributed by making adjustments based on this average rate.
Khyber Pakhtunkhwa
Punjab
(2) The development surcharge on natural gas for Balochistan with effect from1st July 2002, shall be re-worked out hypothetically on the basis of the formula givenin clause (1) and the amount, subject to maximum of ten billion rupees, shall be paidin five years in five equal installments by the Federal Government as grants to becharged on the Federal Consolidated Fund.
Sindh
Balochistan
(3) The Federal Government shall guarantee that Balochistan province shallreceive the projected sum of eighty-three billion rupees from the provincial share inthe net proceeds of divisible pool taxes in the first year of the Award. Any shortfall inthis amount shall be made up by the Federal Government from its own resources.This arrangement for Balochistan shall remain protected throughout the remainingfour years of the Award based on annual budgetary projections.
Total:
(2) The sum assigned to the Provincial Governments under Article 3 shall bedistributed amongst the Provinces on the basis of the percentage specified againsteach:─
12:38 PM6/4/2011
49
President."
9. Miscellaneous.—(1) NFC also recommended increase in the rate of exciseduty on natural gas to Rs10.0 per MMBTU. Federal Government may initiate necessarylegislation accordingly.
(2) The NFC recommended that the Federal Government and ProvincialGovernments should streamline their tax collection systems to reduce leakages andincrease their revenues through efforts to improve taxation in order to achieve a 15%tax to GDP ratio by the terminal year i.e. 2014-15. Provinces would initiate steps toeffectively tax the agriculture and real estate sectors. Federal Government andProvincial Governments may take necessary administrative and legislative stepsaccordingly.
8. Sales tax on services.—NFC recognizes that sales tax on services is aProvincial subject under the Constitution of the Islamic Republic of Pakistan, and maybe collected by respective Provinces, if they so desired.
ASIF ALI ZARDARI,
(3) Federal Government and Provincial Governments would develop andenforce mechanism for maintaining fiscal discipline at the Federal and Provincial levelsthrough legislative and administrative measures.
7. Grants-in-Aid to the Provinces.―There shall be charged upon the FederalConsolidated Fund each year, as grants-in-aid of the revenues of the province of Sindhan amount equivalent to 0.66% of the provincial share in the net proceeds of divisiblepool as a compensation for the losses on account of abolition of octroi and zilla tax.
10. Repeal.— The Distribution of Revenues and Grants-in-Aid Order, 1997(P.O. No. 1 of 1997), and the Distribution of Revenues and Grants-in-Aid, Order, 2010(P.O. 4 of 2010) are hereby repealed.
(5) The meetings of the NFC may be convened regularly on a quarterly basis tomonitor implementation of the award in letter and spirit.
(4) The Federal Government may assist the Provinces through specific grants intimes of unforeseen calamities.
12:38 PM6/4/2011
49
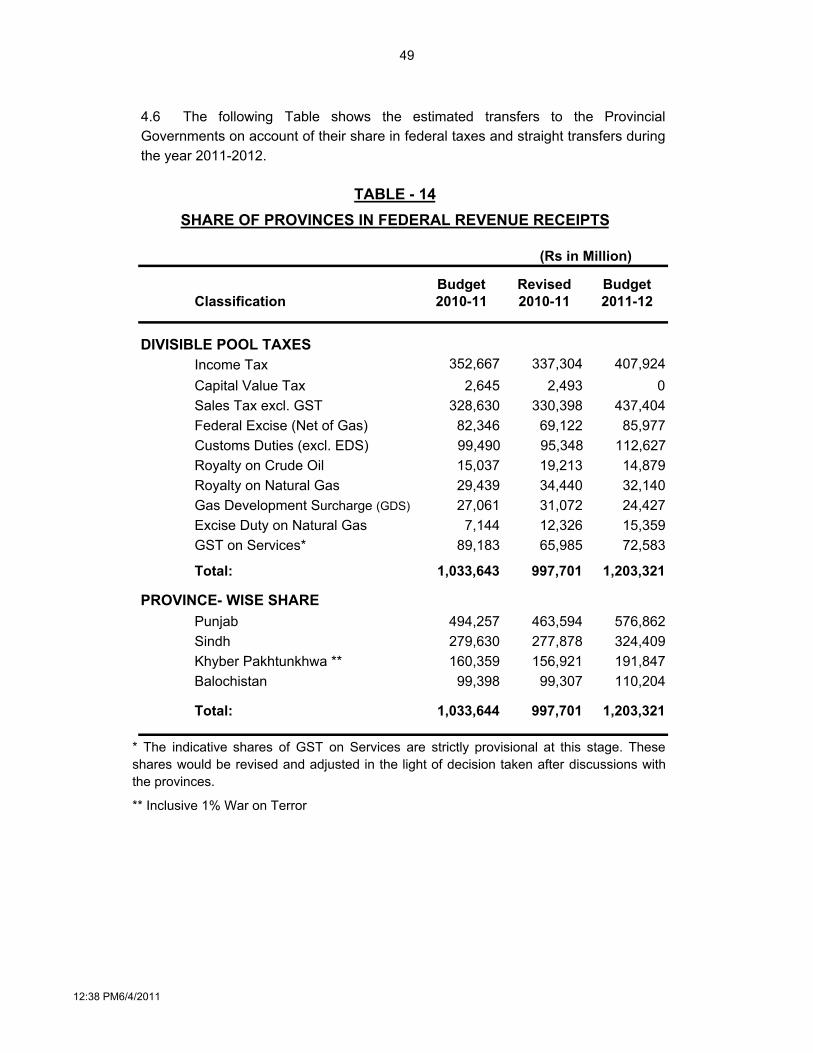
Budget Revised Budget2010-11 2010-11 2011-12
Income Tax 352,667 337,304 407,924Capital Value Tax 2,645 2,493 0Sales Tax excl. GST 328,630 330,398 437,404Federal Excise (Net of Gas) 82,346 69,122 85,977
99,490 95,348 112,627 Royalty on Crude Oil 15,037 19,213 14,879Royalty on Natural Gas 29,439 34,440 32,140Gas Development Surcharge (GDS) 27,061 31,072 24,427Excise Duty on Natural Gas 7,144 12,326 15,359GST on Services* 89,183 65,985 72,583
Total: 1,033,643 997,701 1,203,321
PROVINCE- WISE SHAREPunjab 494,257 463,594 576,862Sindh 279,630 277,878 324,409
160,359 156,921 191,847Balochistan 99,398 99,307 110,204
Total: 1,033,644 997,701 1,203,321
TABLE - 14SHARE OF PROVINCES IN FEDERAL REVENUE RECEIPTS
** Inclusive 1% War on Terror
Customs Duties (excl. EDS)
4.6 The following Table shows the estimated transfers to the ProvincialGovernments on account of their share in federal taxes and straight transfers duringthe year 2011-2012.
(Rs in Million)
DIVISIBLE POOL TAXES
* The indicative shares of GST on Services are strictly provisional at this stage. Theseshares would be revised and adjusted in the light of decision taken after discussions withthe provinces.
Classification
Khyber Pakhtunkhwa **
12:38 PM6/4/2011
49
Budget Revised Budget2010-11 2010-11 2011-12
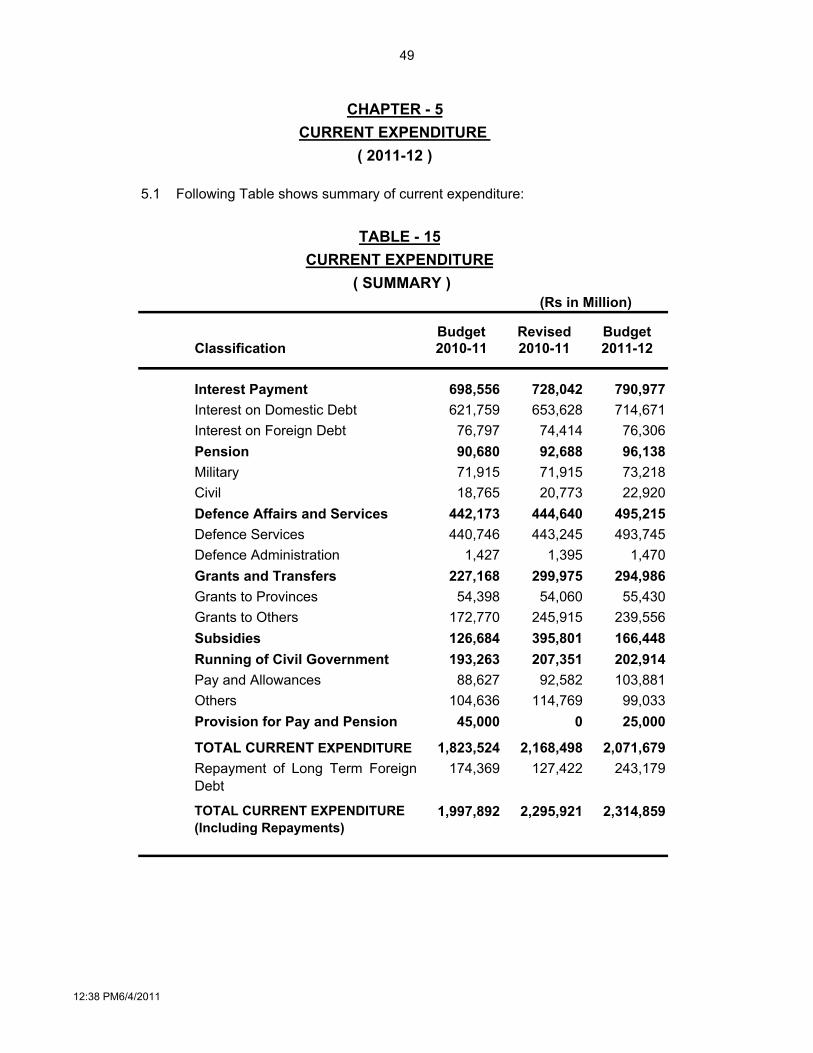
698,556 728,042 790,977621,759 653,628 714,671
76,797 74,414 76,30690,680 92,688 96,13871,915 71,915 73,21818,765 20,773 22,920
442,173 444,640 495,215440,746 443,245 493,745
1,427 1,395 1,470227,168 299,975 294,986
54,398 54,060 55,430172,770 245,915 239,556126,684 395,801 166,448193,263 207,351 202,914
88,627 92,582 103,881104,636 114,769 99,033
45,000 0 25,000
1,823,524 2,168,498 2,071,679174,369 127,422 243,179
1,997,892 2,295,921 2,314,859
Running of Civil GovernmentPay and AllowancesOthersProvision for Pay and Pension
5.1 Following Table shows summary of current expenditure:
(Rs in Million)
( 2011-12 )
CHAPTER - 5CURRENT EXPENDITURE
( SUMMARY )
Repayment of Long Term ForeignDebt
TOTAL CURRENT EXPENDITURE (Including Repayments)
Classification
Interest Payment
Military
Interest on Domestic DebtInterest on Foreign Debt
TOTAL CURRENT EXPENDITURE
Grants to Provinces
CivilDefence Affairs and ServicesDefence Services
Grants to Others
Defence Administration
Pension
TABLE - 15CURRENT EXPENDITURE
Grants and Transfers
Subsidies
12:38 PM6/4/2011

49
Budget Revised Budget2010-11 2010-11 2011-12
General Public Service 1,387,664 1,655,566 1,659,978
Defence Affairs and Services 442,173 444,640 495,215
Public Order and Safety Affairs 51,263 58,735 59,609
Economic Affairs 66,897 79,960 50,307
Environment Protection 448 448 577
Housing and Community Amenities 1,842 1,657 1,602
Health Affairs & Services 7,283 7,455 2,646
Recreational, Culture and Religion 4,359 4,197 4,247
Education Affairs and Services 34,500 40,324 39,513
Social Protection 1,463 2,940 1,164
1,997,892 2,295,921 2,314,859
5.2 The revised estimates for 2010-11 on account of current expenditure haveincreased to Rs 2,295,921 million from the budget estimates of Rs 1,997,892million. For 2011-12, the current expenditure has been estimated at Rs 2,314,859million, showing an increase of less than 1% over revised estimates 2010-11.
Classification
TABLE - 16
5.3 Following Table indicates the comparative position of the budget and revisedestimates of current expenditure for the year 2010-11 and the budget estimates for2011-12.
(Rs in Million)
TOTAL:
CURRENT EXPENDITURE
12:38 PM6/4/2011

49
Budget Revised Budget2010-11 2010-11 2011-12
GENERAL PUBLIC SERVICE 1,387,664 1,655,566 1,659,978
1,090,236 1,329,159 1,308,91790,680 92,688 96,13876,797 74,414 76,307
174,369 127,422 243,179621,759 653,628 714,671126,630 381,007 178,622
103 95 88227,168 299,975 294,986
2,488 3,910 2,7362,267 2,506 2,5245,665 5,552 6,0591,254 1,219 1,390
58,483 13,150 43,278 General Public Services not elsewhere defined
- Superannuation Allowance & Pensions - Servicing of Foreign Debt
Basic ResearchR&D General Public Services
General ServicesTransfer Payments
Administration of General Public Service
Foreign Economic Aid - Others
GENERAL PUBLIC SERVICE
5.4 The bulk of expenditure has been placed under General Public Service. Theexpenditure against this head has been budgeted at Rs 1,659,978 million i.e. 71.7%of current expenditure, while 21.4% for Defence, and 2.6% for Public Order andSafety have been allocated in the budget estimates 2011-12.
Executive & Legislatives Organs, Financial
5.5 The details under General Public Service are given in Table-17.
- Servicing of Domestic Debt - Foreign Loan Repayment
(Rs in Million)
TABLE - 17GENERAL PUBLIC SERVICE
Classification
12:38 PM6/4/2011

49
DEFENCE AFFAIRS AND SERVICES
Budget Revised Budget2010-11 2010-11 2011-12
DEFENCE AFFAIRS AND SERVICES 442,173 444,640 495,215
1,427 1,395 1,470
440,746 443,245 493,745
Employees Related Expenses 176,726 176,726 206,488
111,240 111,327 128,283
119,370 117,557 117,591
34,664 38,890 42,638
(1,254) (1,254) (1,255)
Defence Services
Defence Administration
Civil Works
Less Recoveries
DEFENCE AFFAIRS AND SERVICES
Classification
Physical Assets
(Rs in Million)
Operating Expenses
5.7 Details of estimates of expenditure on Defence Affairs and Services in 2010-11 (budget & revised) and 2011-12 (budget) are given below:
TABLE - 18
5.6 Under General Public Service, the major portion gives to executive &legislatives organs, financial and fiscal affairs. At Rs 1,308,917 million, it forms78.9% of the allocation of Rs 1,659,978 million. The main heads of expenses areservicing of domestic debt, foreign loan repayment and others. Other major item isthe transfer payments.
12:38 PM6/4/2011

49
PUBLIC ORDER AND SAFETY AFFAIRS
Budget Revised Budget2010-11 2010-11 2011-12
51,263 58,735 59,609
1,744 1,766 2,401
47,760 55,058 55,429
89 89 102
17 17 23
17 17 19
1,637 1,789 1,635
PUBLIC ORDER AND SAFETY AFFAIRS
(Rs in Million)
Fire Protection
PUBLIC ORDER AND SAFETY AFFAIRS
Law Courts
R and D Public Order and Safety
Administration of Public Order
Police
TABLE - 19
Classification
Prison Administration and Operation
5.8 Under this head an amount of Rs 59,609 million has been provided inthe budget 2011-12 as compared with Rs 51,263 million in the budget estimates2010-11 and Rs 58,735 billion in revised estimates 2010-11. The allocation forPolice (Rs 55,429 million) forms the major component under this classificationwhich has share of 93% in total allocation of this head. The following Table providesthe details:
12:38 PM6/4/2011

49
Budget Revised Budget2010-11 2010-11 2011-12
ECONOMIC AFFAIRS 66,897 79,960 50,307
24,603 33,831 25,166
29,821 15,840 12,108
507 11,401 539
1,806 1,618 1,760
7,503 7,285 8,415
1,773 1,677 2,115
885 8,308 205
5.9 The allocation under this head in the budget 2011-12 has been projected atRs 50,307 million. This is less by 24.8% than the budget estimates of 2010-11 and37.1% than the revised estimates 2010-11. The main reason for this reduction iselimination of subsidies. The following Table provides the details under this head:
Communications
Agriculture, Food, Irrigation, Forestry and Fishing
TABLE - 20
Classification
(Rs in Million)
Construction and Transport
Other Industries
Mining and Manufacturing
ECONOMIC AFFAIRS
General Economic, Commercial & Labour Affairs
Fuel and Energy
ECONOMIC AFFAIRS
12:38 PM6/4/2011
49
ENVIRONMENT PROTECTION
Budget Revised Budget2010-11 2010-11 2011-12
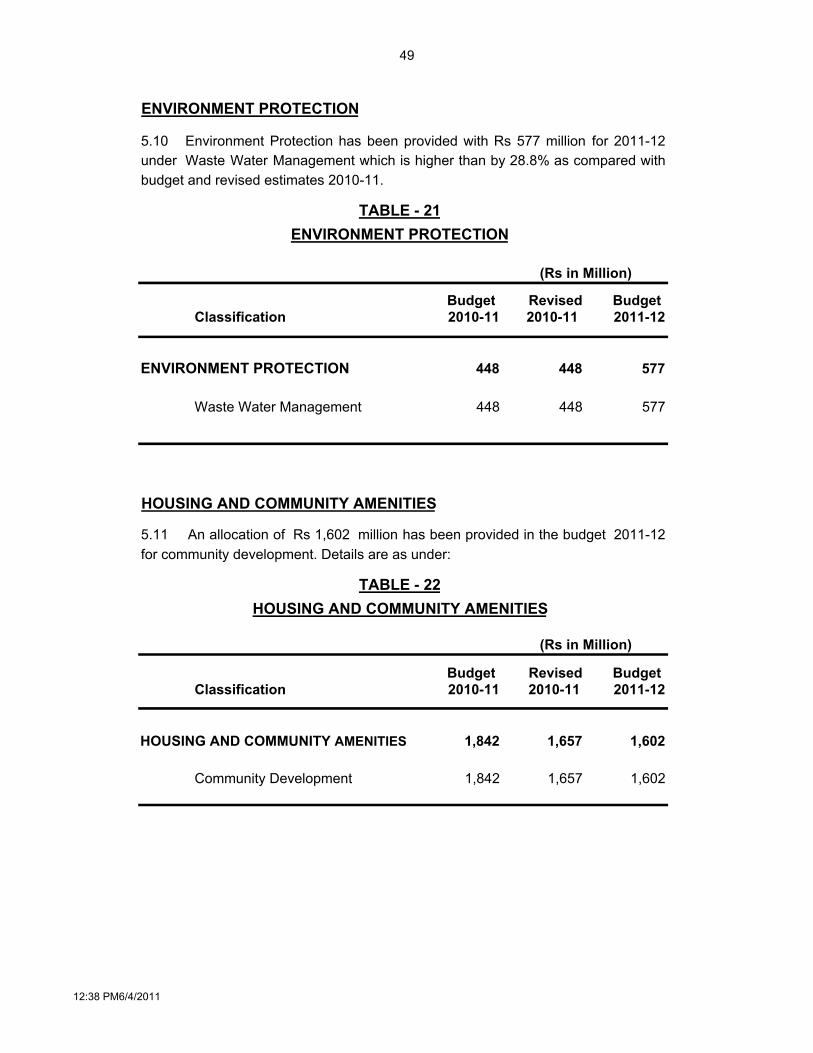
ENVIRONMENT PROTECTION 448 448 577
Waste Water Management 448 448 577
HOUSING AND COMMUNITY AMENITIES
Budget Revised Budget2010-11 2010-11 2011-12
HOUSING AND COMMUNITY AMENITIES 1,842 1,657 1,602
Community Development 1,842 1,657 1,602
ENVIRONMENT PROTECTION
TABLE - 22HOUSING AND COMMUNITY AMENITIES
5.11 An allocation of Rs 1,602 million has been provided in the budget 2011-12for community development. Details are as under:
Classification
(Rs in Million)
5.10 Environment Protection has been provided with Rs 577 million for 2011-12under Waste Water Management which is higher than by 28.8% as compared withbudget and revised estimates 2010-11.
(Rs in Million)
Classification
TABLE - 21
12:38 PM6/4/2011
49
Budget Revised Budget2010-11 2010-11 2011-12
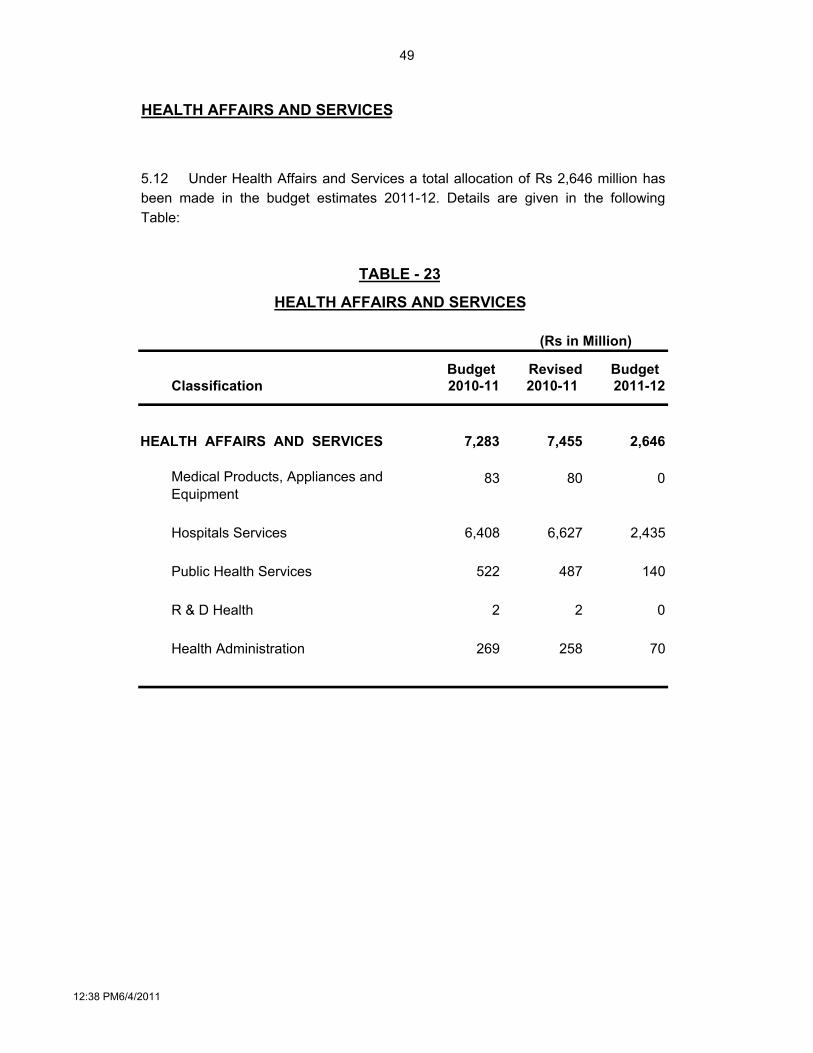
7,283 7,455 2,646
83 80 0
6,408 6,627 2,435
522 487 140
2 2 0
269 258 70
(Rs in Million)
Medical Products, Appliances and Equipment
TABLE - 23
HEALTH AFFAIRS AND SERVICES
Hospitals Services
Public Health Services
Classification
HEALTH AFFAIRS AND SERVICES
Health Administration
R & D Health
HEALTH AFFAIRS AND SERVICES
5.12 Under Health Affairs and Services a total allocation of Rs 2,646 million hasbeen made in the budget estimates 2011-12. Details are given in the followingTable:
12:38 PM6/4/2011

49
RECREATIONAL, CULTURE AND RELIGION
Budget Revised Budget2010-11 2010-11 2011-12
4,359 4,197 4,247
151 86 0
448 314 347
2,893 2,932 3,303
683 601 387
184 264 210Administration of Information, Recreation & Culture
(Rs in Million)
Religious Affairs
RECREATIONAL, CULTURE & RELIGION
Cultural Services
5.13 In budget 2011-12 an amount of Rs 4,247 million has been provided forRecreational, Culture and Religion. The bulk of the expenditure has beenearmarked for Broadcasting and Publishing which is 77.8% of the total allocationunder this head. Details are given in Table-24:
Broadcasting and Publishing
Classification
TABLE - 24
RECREATIONAL, CULTURE AND RELIGION
Recreational and Sporting Services
12:38 PM6/4/2011

49
EDUCATION AFFAIRS AND SERVICES
Budget Revised Budget2010-11 2010-11 2011-12
EDUCATION AFFAIRS AND SERVICES 34,500 40,324 39,513
3,174 3,245 4,148
Secondary Education Affairs and Services 4,232 4,425 4,893
25,210 31,166 29,111
42 34 54
Subsidiary Services to Education 35 35 95
Administration 1,260 884 700
547 534 513Education Affairs and Services not elsewhere Classified
Tertiary Education Affairs and Services
Classification
5.14 The Education Affairs and Services have been provided with Rs 39,513million in the budget estimates 2011-12 as compared with Rs 34,500 million underbudget estimates 2010-11 and Rs 40,324 million in revised estimates 2010-11. Thebulk of expenditure at Rs 29,111 million has been allocated for Tertiary EducationAffairs and Services in budget 2011-12 which is 73.7% of the total allocation underthis head. The details are as under:
(Rs in Million)
Social Welfare & Special Education Div.
EDUCATION AFFAIRS AND SERVICES
TABLE - 25
Pre-Primary & Primary Education AffairsServices
12:38 PM6/4/2011
49
Budget Revised Budget 2010-11 2010-11 2011-12
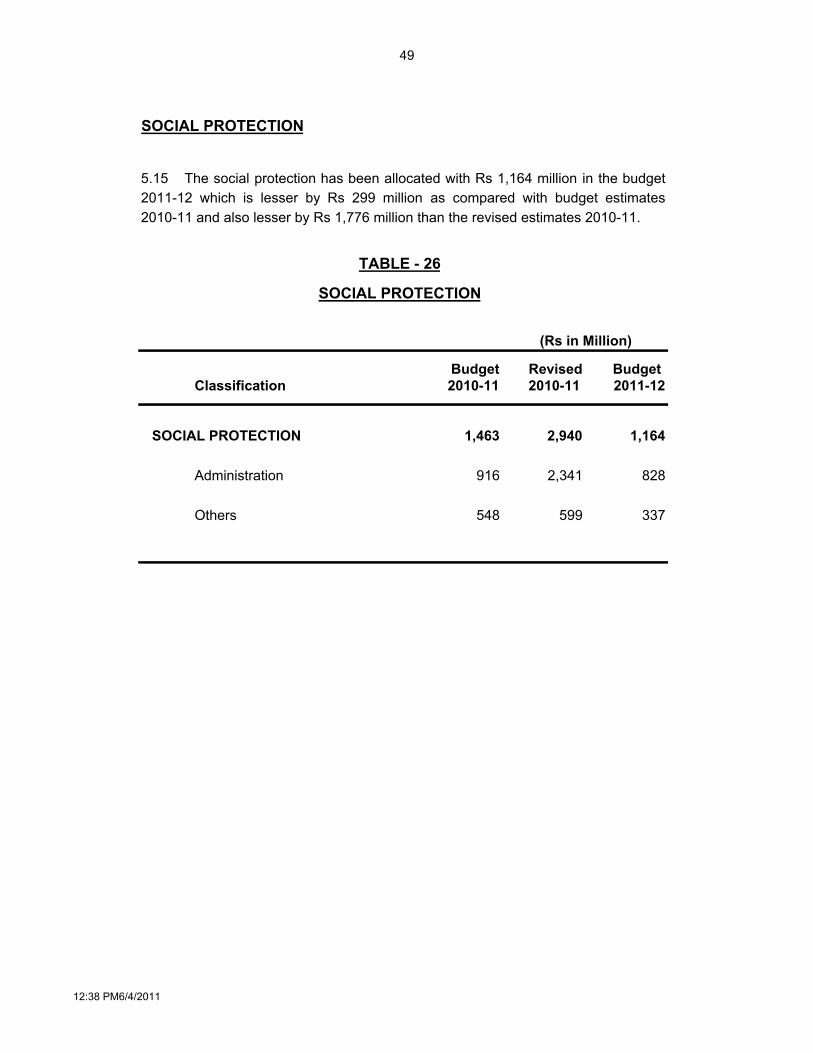
1,463 2,940 1,164
Administration 916 2,341 828
Others 548 599 337
SOCIAL PROTECTION
(Rs in Million)
SOCIAL PROTECTION
5.15 The social protection has been allocated with Rs 1,164 million in the budget2011-12 which is lesser by Rs 299 million as compared with budget estimates2010-11 and also lesser by Rs 1,776 million than the revised estimates 2010-11.
Classification
SOCIAL PROTECTION
TABLE - 26
12:38 PM6/4/2011
49
Budget Revised Budget 2010-11 2010-11 2011-12
84,000 295,827 122,7004,000 7,000 10,000
30,000 238,827 50,00010,000 10,000 7,00040,000 40,000 55,700
3,317 47,317 24,5881,000 1,000 3502,000 46,000 24,000
317 317 238
17,130 17,130 4,0004,000 4,000 4,000
12,000 12,000 01,130 1,130 0
4,200 4,200 2,000 700 700 2,000
3,500 3,500 0
Contd….
(Rs in Million)
To Pick up Interest Payment for TFCs
Adjustment of Addl. surcharge against GST
Classification
2011-12
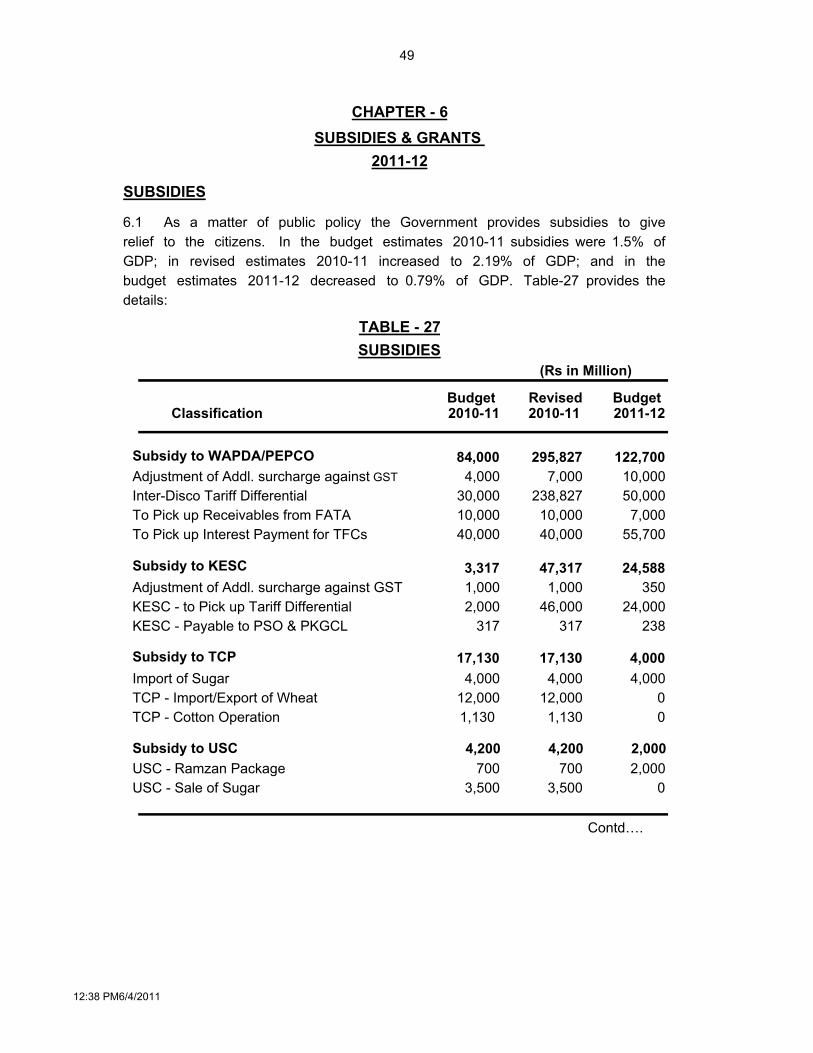
6.1 As a matter of public policy the Government provides subsidies to giverelief to the citizens. In the budget estimates 2010-11 subsidies were 1.5% ofGDP; in revised estimates 2010-11 increased to 2.19% of GDP; and in thebudget estimates 2011-12 decreased to 0.79% of GDP. Table-27 provides thedetails:
SUBSIDIES
TABLE - 27SUBSIDIES
USC - Sale of Sugar
Subsidy to USC
Subsidy to KESC
Subsidy to WAPDA/PEPCO
Inter-Disco Tariff DifferentialTo Pick up Receivables from FATA
Import of Sugar
KESC - to Pick up Tariff Differential
TCP - Import/Export of Wheat
USC - Ramzan Package
TCP - Cotton Operation
Subsidy to TCP
KESC - Payable to PSO & PKGCL
Adjustment of Addl. surcharge against GST
CHAPTER - 6SUBSIDIES & GRANTS
12:38 PM6/4/2011

49
Budget Revised Budget2010-11 2010-11 2011-12
2,900 2,900 74600 600 0
2,000 2,000 0300 300 74
15,137 28,427 13,086
185 185 16210,807 10,807 7,921
200 38 03,000 4,000 4,000
0 7,500 00 800 00 200 00 4,000 0
233 233 255707 659 744
4 4 4
126,684 395,801 166,448
Imports of Phosphatic Pottasic Fertilizer
Wheat Reserved Stock
Sale of Wheat in Gilgit BaltistanSale of Wheat to FATA
Total Subsidies:
Servicing of Outstanding Foreign Loan Liability of SOPREST/GIK Instt. Topi
R & D Support to Textile SectorManufacturers of Phosphatic Pottasic Fertilizer
TCP for Import of Urea Fertilizer
PASSCO - Paddy OperationPASSCO - Mung Operation
Oil Refineries/OMCsFauji Fertilizer Bin Qasim Ltd
PASSCO - Sale of Wheat
Classification
Subsidy to PASSCO
SUBSIDIES
(Rs in Million)
Subsidy to Others
Sale of Salt in Gilgit Baltistan
12:38 PM6/4/2011

49
Budget Revised Budget2010-11 2010-11 2011-12
54,398 54,060 55,430
53,654 54,060 54,880
5,166 5,227 5,166 6,790 7,107 7,970
25,000 25,018 25,000 16,698 16,708 16,744
744 0 550
172,770 245,915 239,556 21,856 32,642 25,000
53 53 011,250 12,940 15,000
0 0 8,164Contingent Liabilities 110,000 141,686 150,000National Internship Program 3,600 2,928 700Remission of ZTBL loans 1,000 400 1,000HBFCL 1,000 1,000 1,000
10 0 10
1,000 151 0
1,000 0 0
Contd…..
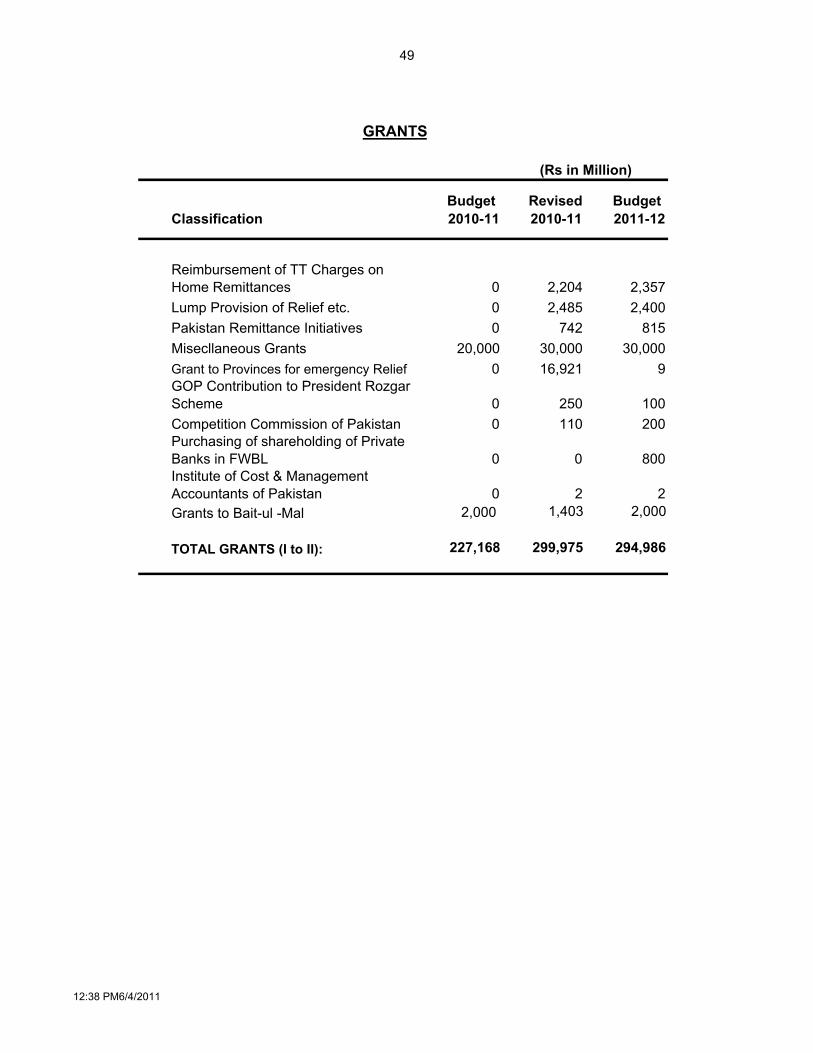
6.2 The detail of grants to the provinces and others is given in the following Table:
AJK Earthquake affected areas
Remission of Agri. Loans of Farmers of Bajor Swat & Buner
NBP Admn. Fee & PED Expenses etc.
Pakistan Railways to meet losses
Payment to PIA for repair & maintenance of VVIP Aircraft
Grants to AJKGrant-in-Aid to Gilgit Baltistan
I. GRANTS TO PROVINCES (A+B):
II. GRANTS TO OTHERS:
A. SPECIAL GRANTS:
B. LUMP PROVISION:
PunjabSindh
BalochistanKhyber Pakhtunkhwa
Classification
GRANTS
TABLE - 28
(Rs in Million)
GRANTS
12:38 PM6/4/2011
49
Budget Revised Budget2010-11 2010-11 2011-12
0 2,204 2,3570 2,485 2,4000 742 815
20,000 30,000 30,0000 16,921 9
0 250 1000 110 200
0 0 800
0 2 2 2,000 1,403 2,000
227,168 299,975 294,986 TOTAL GRANTS (I to II):
GRANTS
(Rs in Million)
Grants to Bait-ul -Mal
Classification
Lump Provision of Relief etc.
Competition Commission of Pakistan
GOP Contribution to President Rozgar Scheme
Pakistan Remittance InitiativesMisecllaneous Grants
Reimbursement of TT Charges on Home Remittances
Institute of Cost & Management Accountants of Pakistan
Purchasing of shareholding of Private Banks in FWBL
Grant to Provinces for emergency Relief
12:38 PM6/4/2011
49
Budget Revised Budget2010-11 2010-11 2011-12
1 28 28 36
2 3,000 2,991 3,300
3 6,796 6,796 8,007
4 100 100 200
5 4 4 4
6 1 1 18
132 132 132
Total: 10,061 10,052 11,680
CHAPTER - 7
Ways & Means Advance to AJ&K
CURRENT LOANS & ADVANCES
(Rs in Million)
Loan to Printing Corporation ofPakistan
Junagadh & Kathiawar ChiefsLoans/Advances Employees of PNRA
Loans - WAPDA
Classification
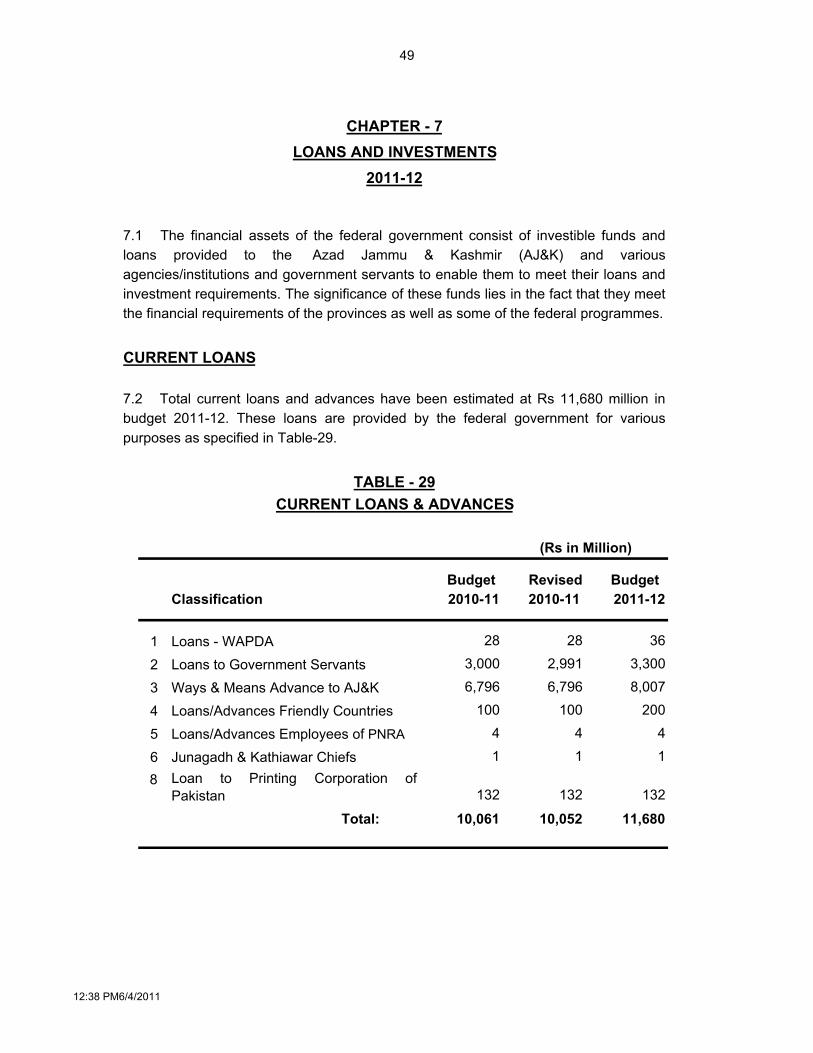
7.1 The financial assets of the federal government consist of investible funds andloans provided to the Azad Jammu & Kashmir (AJ&K) and variousagencies/institutions and government servants to enable them to meet their loans andinvestment requirements. The significance of these funds lies in the fact that they meetthe financial requirements of the provinces as well as some of the federal programmes.
LOANS AND INVESTMENTS
Loans/Advances Friendly Countries
Loans to Government Servants
TABLE - 29
CURRENT LOANS
7.2 Total current loans and advances have been estimated at Rs 11,680 million inbudget 2011-12. These loans are provided by the federal government for variouspurposes as specified in Table-29.
2011-12
12:38 PM6/4/2011
49
Budget Revised Budget2010-11 2010-11 2011-12
1 52,842 37,468 65,289
245,119 58,793 72,406
Total: 97,961 96,261 137,695
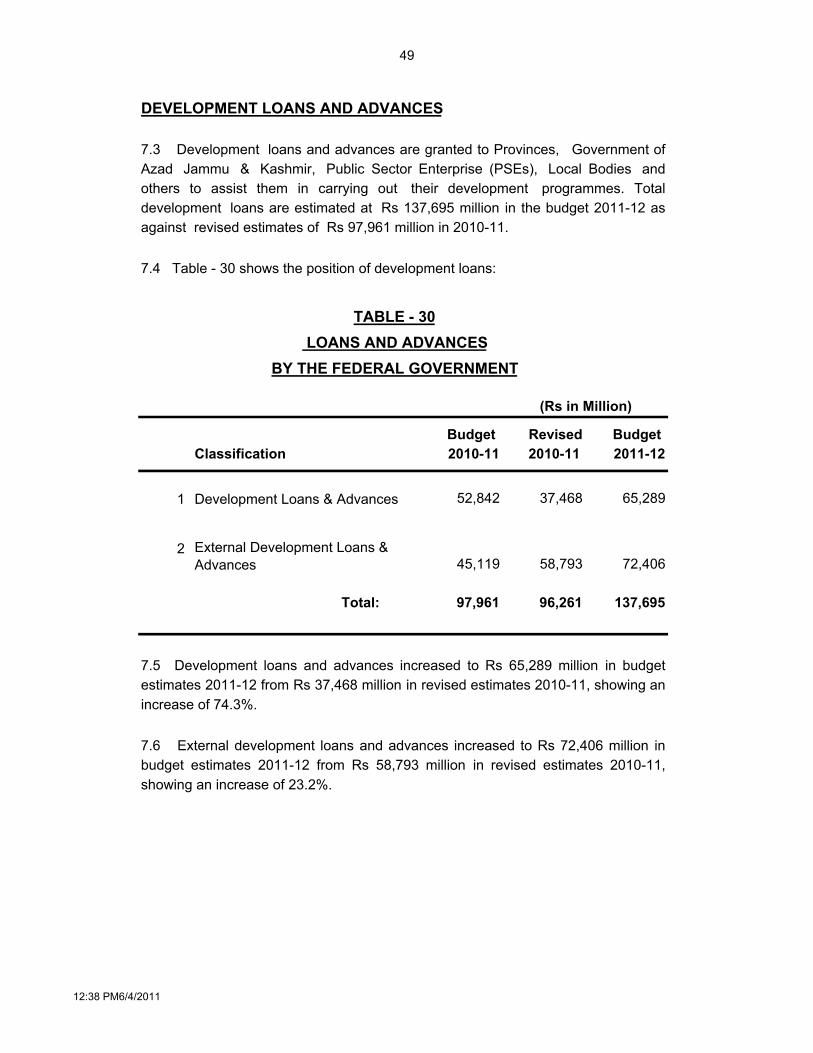
DEVELOPMENT LOANS AND ADVANCES
7.3 Development loans and advances are granted to Provinces, Government ofAzad Jammu & Kashmir, Public Sector Enterprise (PSEs), Local Bodies andothers to assist them in carrying out their development programmes. Totaldevelopment loans are estimated at Rs 137,695 million in the budget 2011-12 asagainst revised estimates of Rs 97,961 million in 2010-11.
External Development Loans & Advances
7.4 Table - 30 shows the position of development loans:
(Rs in Million)
Development Loans & Advances
BY THE FEDERAL GOVERNMENT LOANS AND ADVANCES
TABLE - 30
7.5 Development loans and advances increased to Rs 65,289 million in budgetestimates 2011-12 from Rs 37,468 million in revised estimates 2010-11, showing anincrease of 74.3%.
Classification
7.6 External development loans and advances increased to Rs 72,406 million inbudget estimates 2011-12 from Rs 58,793 million in revised estimates 2010-11,showing an increase of 23.2%.
12:38 PM6/4/2011

49
Budget Revised Budget2010-11 2010-11 2011-12
1 2,100 2,072 2,192
2 1,165 0 1,400
3 578 518 04 3,677 2,867 3,8315
50 0 59
6 517 517 544
7 1,127 1,127 1,127
8 232 232 160
9 1,400 1,400 1,500
10 83 83 45
11 291 120 379
12 3,200 0 3,000
13 2,500 0 2,000
14 1,200 0 1,200
15 0 1,383 016 0 0 3,210
16 0 15 2
Total: 18,121 10,334 20,649
7.7 The investment on current account for the year 2011-12 has been estimated atRs 20,649 million as compared to Rs 10,334 million in the revised estimates of2010-11 which is higher by 100%. The comparative position is given below:
FEDERAL INVESTMENTS ON CURRENT ACCOUNT
(Rs in Million)
Classification
Payment of Mark up on Loans byPASDEC
Lump Provision
5th Gen. Capital Increase of ADB
TABLE - 31
GoP Equity in PIAC
KESC
GoP Equity in the capital of KS&EW
Islamic Development Bank (IDB)
Others
GoP Equity in Pak Dairy Dev.Co.Ltd
CURRENT INVESTMENT
GoP Investment-Peoples Steel Mills
Contribution towards ECO TradeGoP Contribution to SAARC (SDF)
Investment in HBFCL's Equity SME Bank Ltd.Mortgage Refinance Co. (MRC)
GoP Equity Investment NIP Karachi
Equity from GoP for Pak China Inv.Co
12:38 PM6/4/2011
49
-
-
-
-
-
-
-
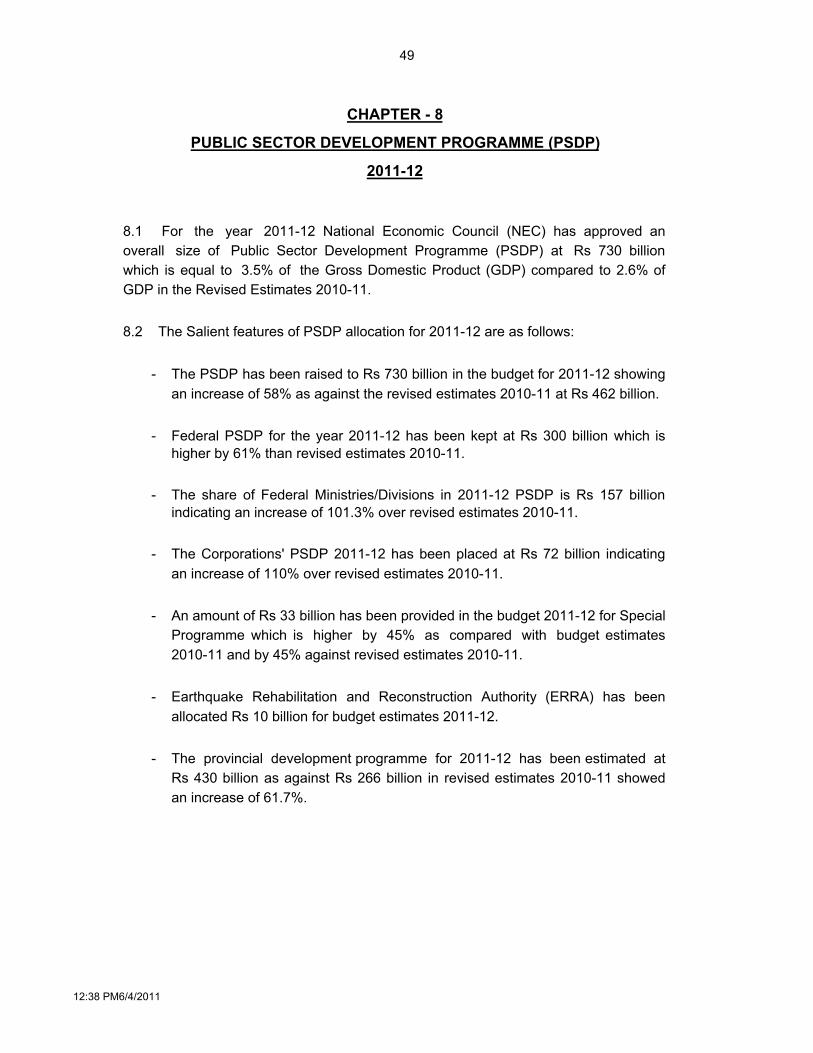
CHAPTER - 8
PUBLIC SECTOR DEVELOPMENT PROGRAMME (PSDP)
An amount of Rs 33 billion has been provided in the budget 2011-12 for Special Programme which is higher by 45% as compared with budget estimates2010-11 and by 45% against revised estimates 2010-11.
8.1 For the year 2011-12 National Economic Council (NEC) has approved anoverall size of Public Sector Development Programme (PSDP) at Rs 730 billionwhich is equal to 3.5% of the Gross Domestic Product (GDP) compared to 2.6% ofGDP in the Revised Estimates 2010-11.
8.2 The Salient features of PSDP allocation for 2011-12 are as follows:
The Corporations' PSDP 2011-12 has been placed at Rs 72 billion indicatingan increase of 110% over revised estimates 2010-11.
The PSDP has been raised to Rs 730 billion in the budget for 2011-12 showingan increase of 58% as against the revised estimates 2010-11 at Rs 462 billion.
Earthquake Rehabilitation and Reconstruction Authority (ERRA) has beenallocated Rs 10 billion for budget estimates 2011-12.
Federal PSDP for the year 2011-12 has been kept at Rs 300 billion which ishigher by 61% than revised estimates 2010-11.
2011-12
The share of Federal Ministries/Divisions in 2011-12 PSDP is Rs 157 billionindicating an increase of 101.3% over revised estimates 2010-11.
The provincial development programme for 2011-12 has been estimated atRs 430 billion as against Rs 266 billion in revised estimates 2010-11 showedan increase of 61.7%.
12:38 PM6/4/2011
49
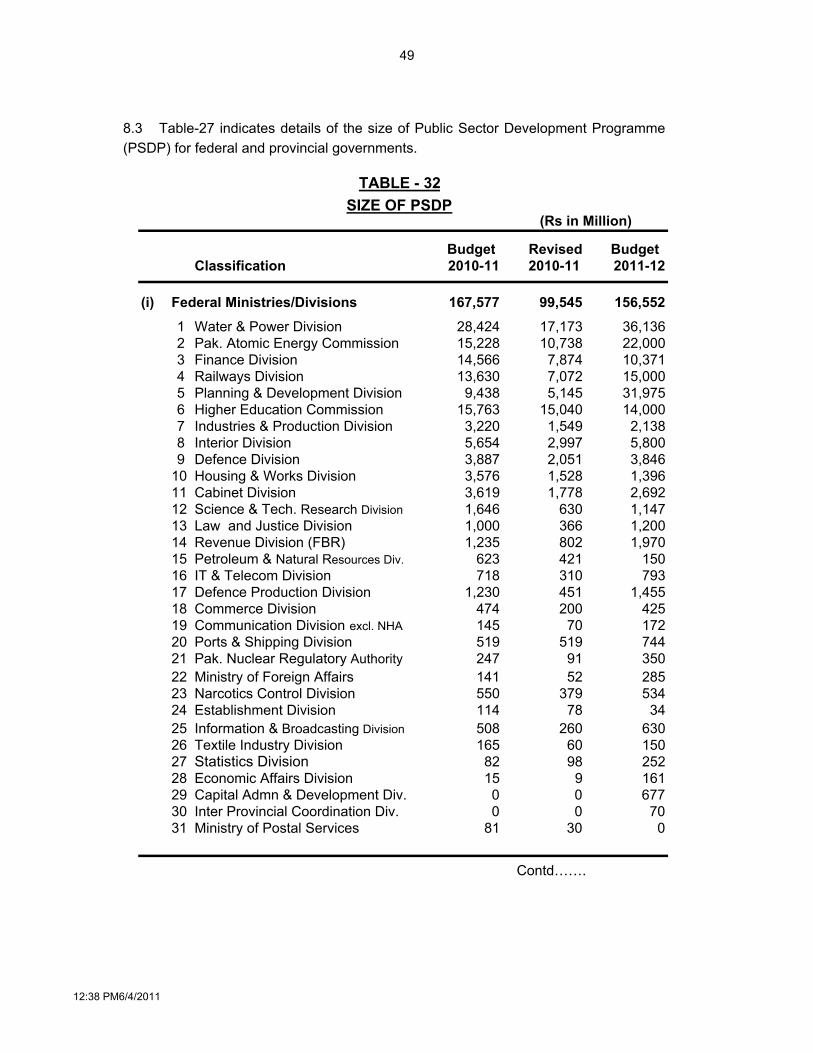
Budget Revised Budget2010-11 2010-11 2011-12
(i) 167,577 99,545 156,5521 28,424 17,173 36,1362 15,228 10,738 22,0003 14,566 7,874 10,3714 13,630 7,072 15,0005 9,438 5,145 31,9756 15,763 15,040 14,0007 3,220 1,549 2,1388 5,654 2,997 5,8009 3,887 2,051 3,846
10 3,576 1,528 1,39611 3,619 1,778 2,69212 1,646 630 1,14713 1,000 366 1,20014 1,235 802 1,97015 623 421 15016 718 310 79317 1,230 451 1,45518 474 200 42519 145 70 17220 519 519 74421 247 91 35022 141 52 28523 550 379 53424 114 78 3425 508 260 63026 165 60 15027 82 98 25228 15 9 16129 0 0 67730 0 0 7031 81 30 0
Contd…….
8.3 Table-27 indicates details of the size of Public Sector Development Programme(PSDP) for federal and provincial governments.
Higher Education Commission
Narcotics Control Division
IT & Telecom Division
Science & Tech. Research Division
Economic Affairs Division
Textile Industry Division
Capital Admn & Development Div.
Ministry of Postal Services
Housing & Works Division
Classification
Cabinet Division
Industries & Production Division
Federal Ministries/Divisions
Finance Division
Planning & Development Division
Communication Division excl. NHA
(Rs in Million)
Establishment Division
Petroleum & Natural Resources Div.
Information & Broadcasting Division
Inter Provincial Coordination Div.
Law and Justice DivisionRevenue Division (FBR)
Defence DivisionInterior Division
Water & Power Division
Railways Division
TABLE - 32
Defence Production Division
Statistics Division
Commerce Division
Pak. Nuclear Regulatory Authority
SIZE OF PSDP
Ports & Shipping Division
Pak. Atomic Energy Commission
Ministry of Foreign Affairs
12:38 PM6/4/2011
49
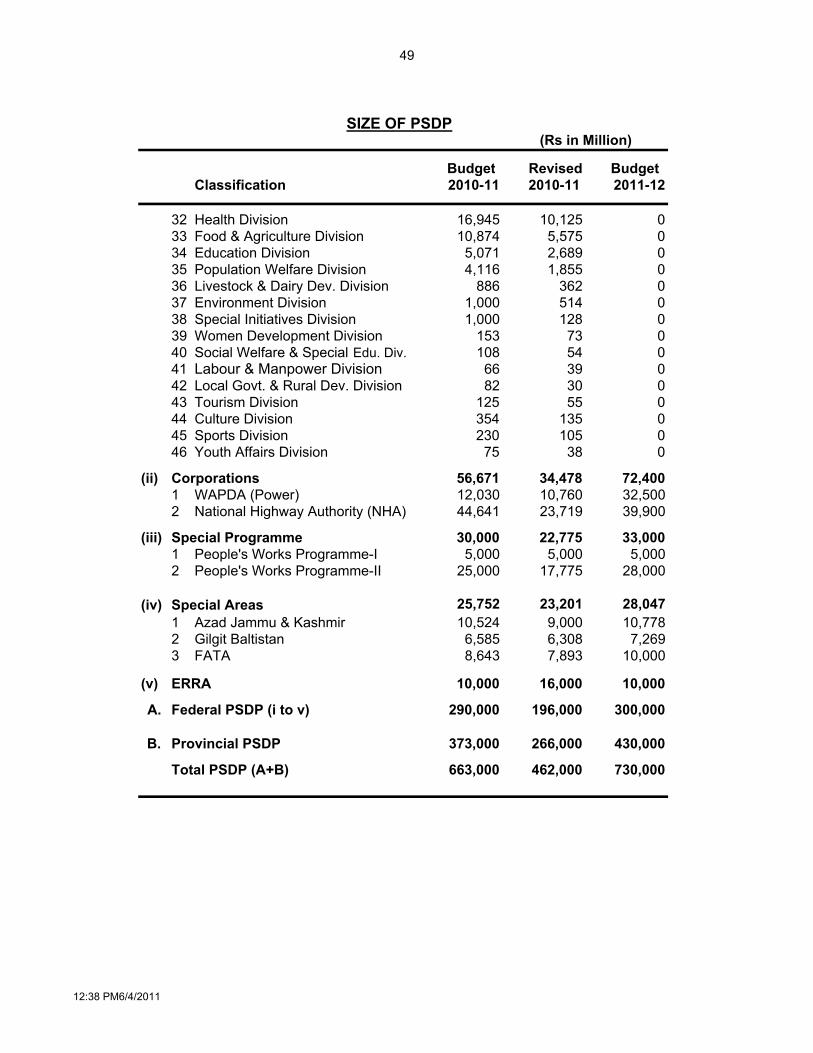
Budget Revised Budget2010-11 2010-11 2011-12
32 16,945 10,125 033 10,874 5,575 034 5,071 2,689 035 4,116 1,855 036 886 362 037 1,000 514 038 1,000 128 039 153 73 040 108 54 041 66 39 042 82 30 043 125 55 044 354 135 045 230 105 046 75 38 0
(ii) Corporations 56,671 34,478 72,4001 12,030 10,760 32,5002 44,641 23,719 39,900
(iii) Special Programme 30,000 22,775 33,0001 5,000 5,000 5,0002 25,000 17,775 28,000
(iv) 25,752 23,201 28,0471 10,524 9,000 10,7782 6,585 6,308 7,2693 8,643 7,893 10,000
(v) 10,000 16,000 10,000
A. 290,000 196,000 300,000
B. 373,000 266,000 430,000
663,000 462,000 730,000
SIZE OF PSDP
Social Welfare & Special Edu. Div.
Special Initiatives Division
Federal PSDP (i to v)
(Rs in Million)
Labour & Manpower Division
Provincial PSDP
Sports DivisionCulture Division
Youth Affairs Division
Azad Jammu & Kashmir
Local Govt. & Rural Dev. DivisionTourism Division
National Highway Authority (NHA)
Education DivisionFood & Agriculture Division
Total PSDP (A+B)
ERRA
Women Development Division
Environment Division
People's Works Programme-II
Livestock & Dairy Dev. Division
Health Division
Classification
Gilgit Baltistan
People's Works Programme-I
Special Areas
WAPDA (Power)
Population Welfare Division
FATA
12:38 PM6/4/2011
49
Budget Revised Budget2010-11 2010-11 2011-12
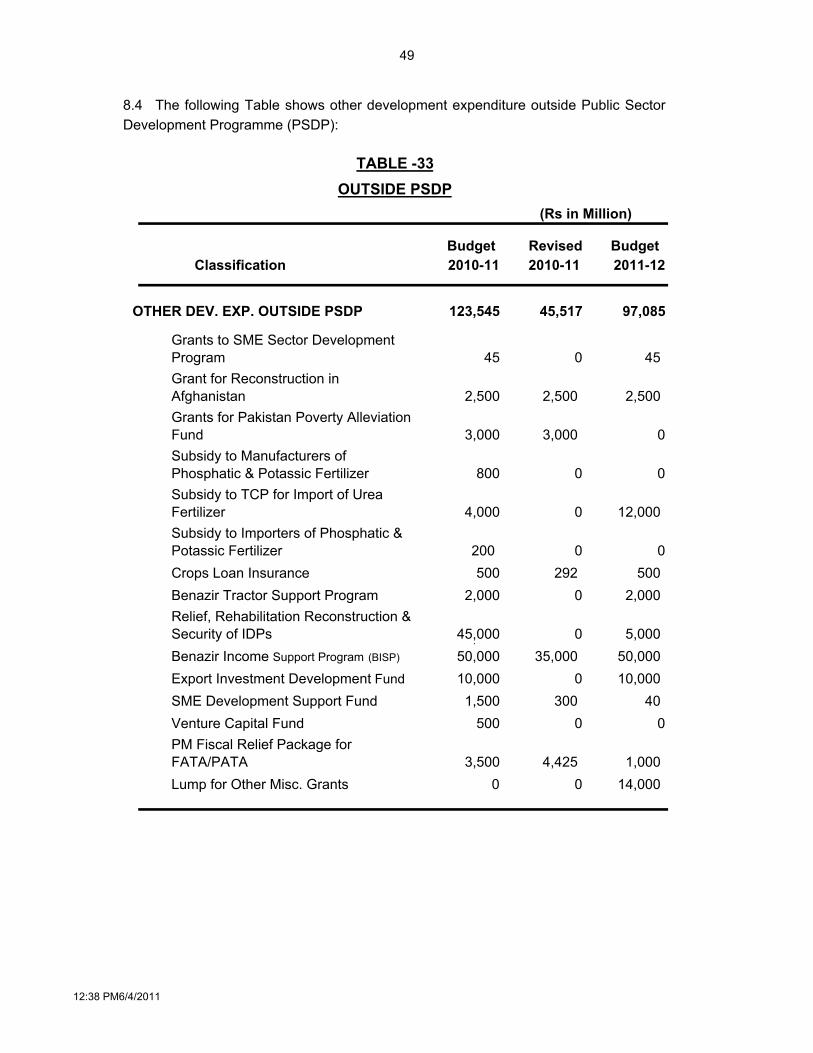
123,545 45,517 97,085
45 0 45
2,500 2,500 2,500
3,000 3,000 0
800 0 0
4,000 0 12,000
200 0 0500 292 500
Benazir Tractor Support Program 2,000 0 2,000
45,000 0 5,000 ,50,000 35,000 50,000 10,000 0 10,000
1,500 300 40 500 0 0
3,500 4,425 1,000 Lump for Other Misc. Grants 0 0 14,000
Subsidy to Importers of Phosphatic & Potassic Fertilizer
Grants to SME Sector Development ProgramGrant for Reconstruction in AfghanistanGrants for Pakistan Poverty Alleviation Fund
OTHER DEV. EXP. OUTSIDE PSDP
Subsidy to TCP for Import of Urea Fertilizer
Subsidy to Manufacturers of Phosphatic & Potassic Fertilizer
Classification
PM Fiscal Relief Package for FATA/PATA
Crops Loan Insurance
Relief, Rehabilitation Reconstruction & Security of IDPsBenazir Income Support Program (BISP)
SME Development Support FundVenture Capital Fund
Export Investment Development Fund
(Rs in Million)
8.4 The following Table shows other development expenditure outside Public SectorDevelopment Programme (PSDP):
TABLE -33OUTSIDE PSDP
12:38 PM6/4/2011
49
9.2 This year the Budget Strategy Paper 2011-14 was presented in the Cabinet on11 May 2011. The Budget Strategy Paper 2011-14 included; macroeconomic situation,key revenue and expenditure policies, medium-term fiscal and macroeconomicframework and indicative budget ceilings for all Federal Ministries. This indicativebudget ceilings 2011-14 were communicated to all the Principal Accounting Officers ofthe federal government. Consultations on the Budget Strategy Paper 2011-14 werealso made with the Parliamentary Standing Committees of Finance & Revenue,political parties, provinces, and the Economic Advisory Council.
9.3 Last year, the budget was presented by outputs (services) in the Parliament in abook called 'Federal Medium-Term Budget Estimates for Services Delivery 2010-13'(also called 'Green Book 2010-13'). The Green Book 2010-13 presented goals,outcomes outputs and inputs and linked these with three-years budgets within ceilingsfor each Principal Accounting Officer. In addition, key performance indicators andtargets were presented for each output over the three-years period.
9.4 This year, the 'Federal Medium-Term Budget Estimates for Service Delivery2011-14' book is being presented.
9.5 For the next year, the government intends to improve alignment of output-basedbudgeting with the New Framework for Growth, which was approved by the Nationaleconomic council in its meeting of 28 May 2011. The government also intends to startthe process of output-based monitoring with an aim to provide reports on thegovernment's performance to the Cabinet. In addition, the Finance Division will takeadditional steps to strengthen linkages of MTBF with PIFRA (Project to ImproveFinancial Reporting and Auditing) including output-based budget preparation andoutput-based expenditure monitoring using the PIFRA system.
CHAPTER - 9MEDIUM TERM BUDGETARY FRAMEWORK (MTBF)
2011-12
9.1 The Medium-Term Budgetary Framework (MTBF), budget management and keygovernance reform programme of the government, was rolled-out to entire FederalGovernment last year. As per the MTBF two important changes have been made in theprocess of budget making; the 'Budget Strategy Paper' and 'Output based Budgeting'.
12:38 PM6/4/2011
49
4.2 4.5 4.712.0 9.5 8.0
13.6 13.4 13.2- 10.3 10.5 10.8- 9.3 9.6 9.9- 3.3 2.9 2.4
17.7 16.9 16.2- 13.7 12.8 11.8- 4.0 4.1 4.4
-4.0 -3.5 -3.00.0 0.6 1.4
53.2 48.7 45.921,041 24,200 27,464
(Rs. In Billions)
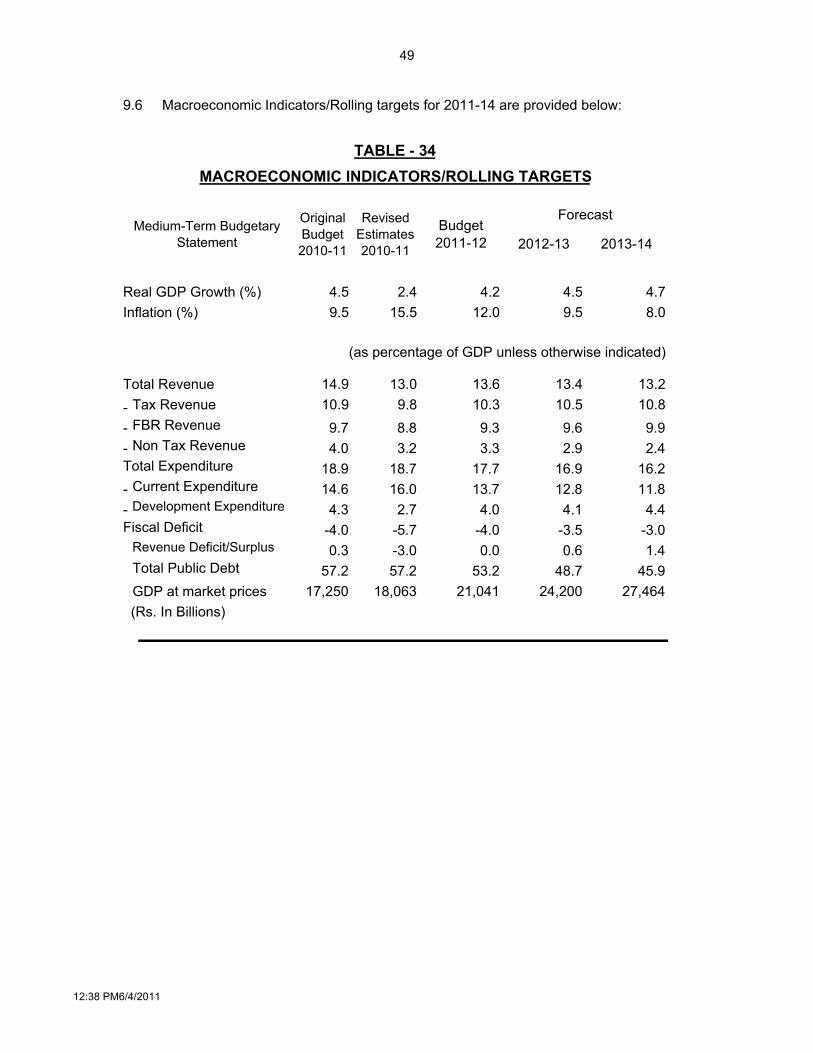
9.6 Macroeconomic Indicators/Rolling targets for 2011-14 are provided below:
Forecast
2012-13 2013-14
8.8
Inflation (%)
Revised Estimates 2010-11
Original Budget 2010-11
Medium-Term Budgetary Statement
2.415.5
4.59.5
Real GDP Growth (%)
Fiscal Deficit
Total ExpenditureCurrent ExpenditureDevelopment Expenditure
17,250
4.018.914.6
4.3-4.00.3
-5.7-3.057.2
3.218.716.0
2.7
Revenue Deficit/SurplusTotal Public DebtGDP at market prices
TABLE - 34MACROECONOMIC INDICATORS/ROLLING TARGETS
Tax Revenue
18,06357.2
FBR RevenueNon Tax Revenue
Total Revenue
Budget 2011-12
(as percentage of GDP unless otherwise indicated)
14.910.99.7
13.09.8
12:38 PM6/4/2011

(a) Tax Revenue*2,074
A. CURRENT2,315
(b) Non-Tax Revenue 658 Interest Payment 791
- Gross Revenue Receipts 2,732 Pension 96
- Less Provincial Share 1,203 Repayment of Foreign Loans 243
I. Net Revenue Recipts (a-b) 1,529 Defence Affairs & Services 495
II. Net Capital Receipts 396 Grants and Transfers 295
III. External Receipts 414 Subsidies 166
IV. Estimated Provincial 125 Running of Civil Government 203
Surplus Provision for Pay & Pension 25
V. Bank Borrowing 304 B. DEVELOPMENT 452
PSDP 355
- Federal Government 300
Development Loans &
Grants to Provinces 55
Other Dev. Expenditure 97
2,767 TOTAL EXPENDITURE (A+B) 2,767
*Out of which FBR collection has been estimated at Rs 1952 billion.
BUDGET AT A GLANCE
2011-12
RECEIPTS EXPENDITURE
(Rs in Billion)
TOTAL RESOURCES (I to V)
49
a) Total Revenue and Gross External Loans 287GrantsFederal Revenue (net) Less Repayment 279
Grants Long Term Foreign Loans 243
b) Total Federal Short Term Foreign Loans 36Expenditure
Current Expenditure i) Net External Financing 8
Development and Net ii) Domestic Financing 716Lending
PSDP Bank Financing 304
Other Development of which SBP Financing 0Expenditure
Net Lending Non Bank Financing 413
c) Federal Deficit (a-b) Public debt 248
Est. Provincial Surplus Public Account 164
Overall Fiscal Deficit Total Financing of Deficit 724
% of GDP % of GDP 3.4%
Overall Fiscal Deficit(Excluding Grants)
% of GDP
127
2,072
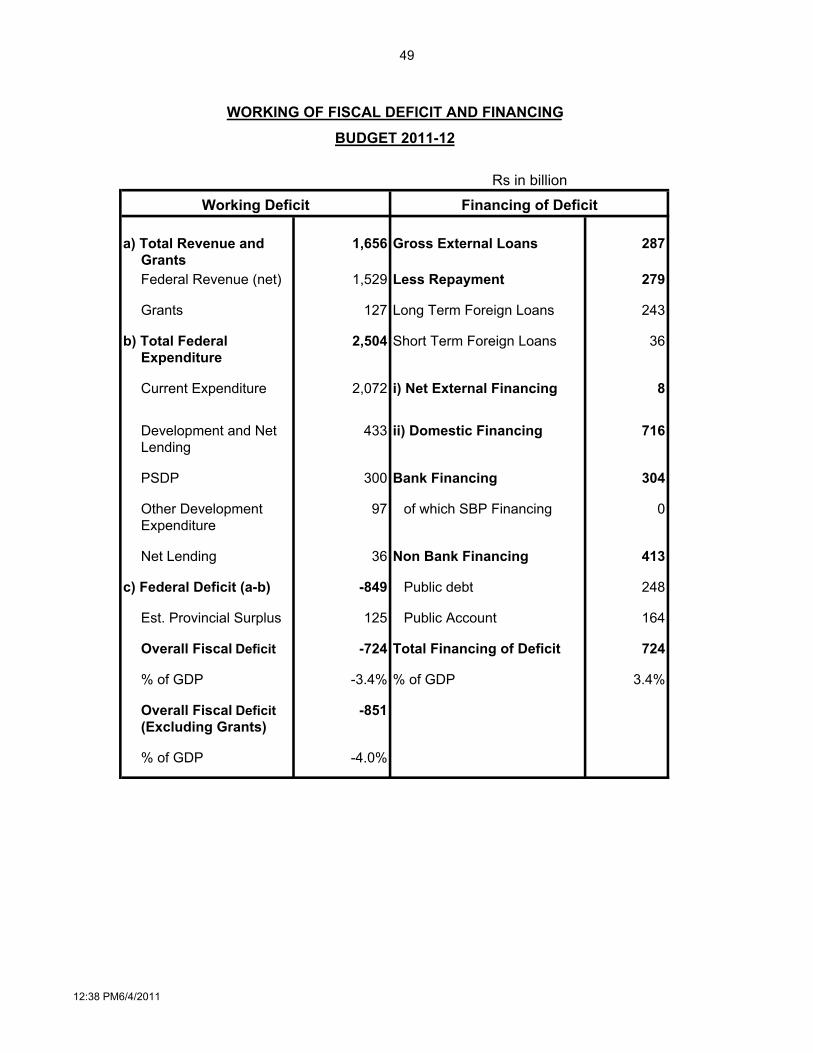
WORKING OF FISCAL DEFICIT AND FINANCING
BUDGET 2011-12
Financing of DeficitWorking DeficitRs in billion
-724
1,656
2,504
-849
1,529
-851
300
97
36
433
125
-4.0%
-3.4%
12:38 PM6/4/2011