Federal Aviation Administration ATO Future Schedule Generation Performance Analysis and Strategy...
30
Federal Aviation Administration ATO Future Schedule Generation Performance Analysis and Strategy January 27, 2010
-
Upload
shona-lucinda-martin -
Category
Documents
-
view
218 -
download
0
Transcript of Federal Aviation Administration ATO Future Schedule Generation Performance Analysis and Strategy...

Federal AviationAdministration
ATO Future Schedule Generation
Performance Analysis and Strategy
January 27, 2010

2Federal AviationAdministration
Briefing Overview
• ATO and Future Schedule Generation
• Inputs to Future Schedule Generation
• Sample Day Selection and Averaging
• Core Logic
• Future Work

3Federal AviationAdministration
ATO and Future Schedules
• Core ATO Function Since 2006– ATO Sponsored Multiple Demand Generation Projects– No consistency across planning projects
• Streamline process for building future scenarios– Demand/Model Issues Worked out in Advance– Representative Sample Days
• Assumptions coordinated within ATO– Feasible Schedules – Risk Ranges

4Federal AviationAdministration
• DATACOM Investment Analysis
• ERAM Evaluations
• NextGen Portfolio Analysis
• Performance Airspace Management
• High Altitude Trajectory Based Airspace
End Users

5Federal AviationAdministration
Summary of Input to Future Scenarios
• APO– TAF Airport Operations (Annual Levels)– Future Fleet Assumptions (Annual Projections)– ASPM Gate/Runway Times (Daily Traffic)– OPSNET Data Counts (Daily Traffic)– Cancellations
• ATO AIMLAB – Filed Flight Information (altitude, speed, waypoints)– Center Crossing Data (Not Filed but used for Center Activity)– Cancellations
• Consistent with Data Sources Used to Assess ATO Performance

6Federal AviationAdministration
TAF 2004
TAF 2006
2001 – 16,164,9002017 – 16,174,591
TAF 2008
TAF 2009
25% Down from 2004
19% Down from 2006
OEP35 TAF Total Operations FY2001-2025
12,000,000
14,000,000
16,000,000
18,000,000
20,000,000
22,000,000
24,000,000
26,000,000
20
01
20
02
20
03
20
04
20
05
20
06
20
07
20
08
20
09
20
10
20
11
20
12
20
13
20
14
20
15
20
16
20
17
20
18
20
19
20
20
20
21
20
22
20
23
20
24
20
25
Op
era
tio
ns
TAF 2009 Forecast TAF 2008 Forecast TAF 2006 TAF 2004 OPSNET Actuals Track
7Federal AviationAdministration
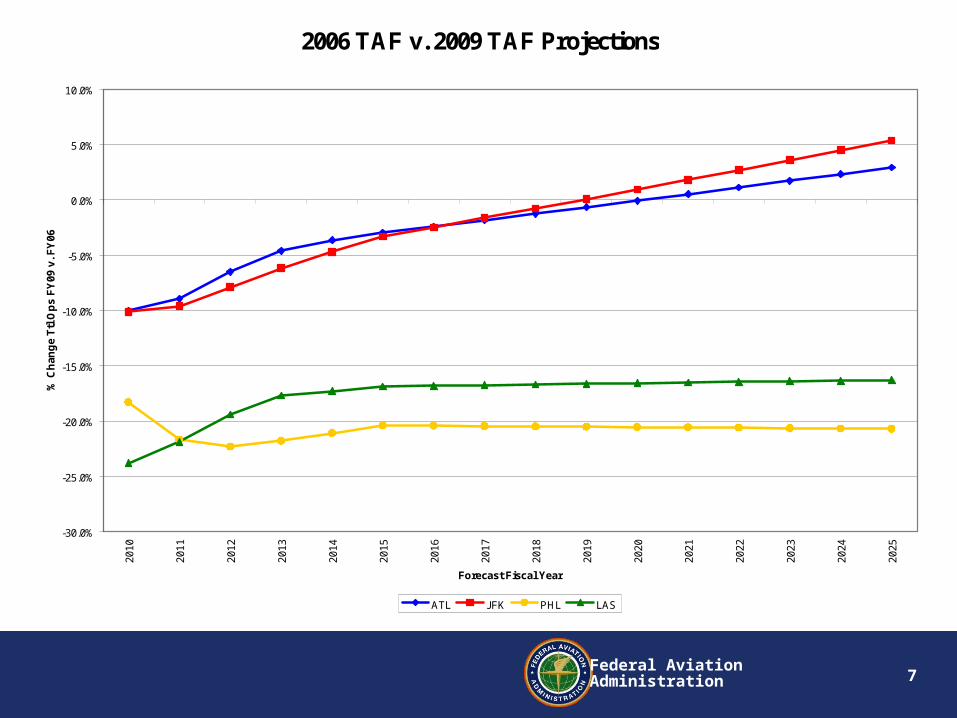
2006 TAF v. 2009 TAF Projections
-30.0%
-25.0%
-20.0%
-15.0%
-10.0%
-5.0%
0.0%
5.0%
10.0%
2010
2011
2012
2013
2014
2015
2016
2017
2018
2019
2020
2021
2022
2023
2024
2025
Forecast Fiscal Year
% C
han
ge
Ttl
Op
s F
Y09
v.
FY
06
ATL JFK PHL LAS

8Federal AviationAdministration
Representative Planning Days
• Sample Days Throughout Fiscal Year– Reflect Seasonality of the NAS– Peak and Off-peak Days each Fiscal Quarter– 8 Days per Fiscal Year
• Target 90% Planning Day by Facility by Season– Originally Based on 20 CONUS Centers– Assess 90% Day for 35 OEP Airports– ASPM Delay, NAS Wx index

9Federal AviationAdministration
Center Count Traffic for ZMA
3000
3500
4000
4500
5000
5500
6000
6500
7000
7500
25-Sep-04 14-Nov-04 3-Jan-05 22-Feb-05 13-Apr-05 2-Jun-05 22-Jul-05 10-Sep-05
FY2005
Co
un
ts
ZMA FY05 FAL WNT SPR SUM ATO_FAL ATO_WNT ATO_SPR ATO_SUM Poly. (ZMA)
5130
5974
5353
4380
Almost all 36 Above Target Days Occur in Winter/Spring
5543 Current Target Day - Mar 23

10Federal AviationAdministration
Representative Days
-10
-8
-6
-4
-2
0
2
4
6
8
10
ZAB ZAU ZBW ZDC ZDV ZFW ZHU ZID ZJX ZKC ZLA ZLC ZMA ZME ZMP ZNY ZOA ZOB ZSE ZTL
CONUS Center
Per
cen
t D
iffe
ren
ce f
rom
90%
Day
23-Jul L1 L2
11Federal AviationAdministration
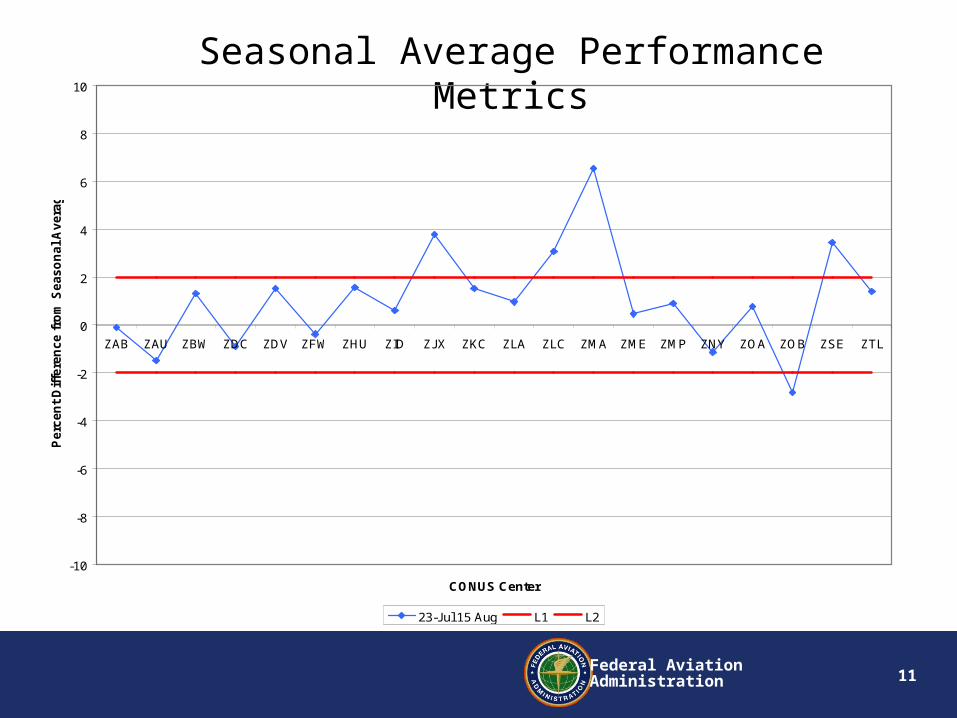
Seasonal Average Performance Metrics
-10
-8
-6
-4
-2
0
2
4
6
8
10
ZAB ZAU ZBW ZDC ZDV ZFW ZHU ZID ZJX ZKC ZLA ZLC ZMA ZME ZMP ZNY ZOA ZOB ZSE ZTL
CONUS Center
Perc
en
t D
iffe
ren
ce f
rom
Seas
on
al A
ve
rag
e
23-Jul 15 Aug L1 L2
12Federal AviationAdministration
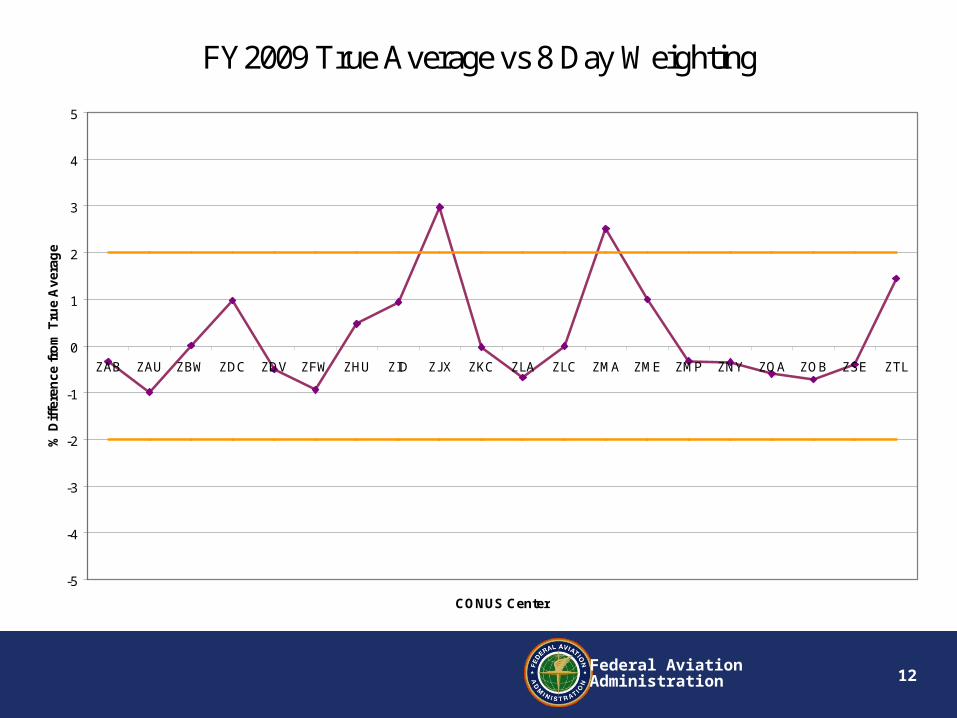
FY2009 True Average vs 8 Day Weighting
-5
-4
-3
-2
-1
0
1
2
3
4
5
ZAB ZAU ZBW ZDC ZDV ZFW ZHU ZID ZJX ZKC ZLA ZLC ZMA ZME ZMP ZNY ZOA ZOB ZSE ZTL
CONUS Center
% D
iffe
ren
ce f
rom
Tru
e A
vera
ge

13Federal AviationAdministration
FY2009 True Average vs 8 Day Weighting
-5
-4
-3
-2
-1
0
1
2
3
4
5
ZAB ZAU ZBW ZDC ZDV ZFW ZHU ZID ZJX ZKC ZLA ZLC ZMA ZME ZMP ZNY ZOA ZOB ZSE ZTL
CONUS Center
% D
iffe
ren
ce f
rom
Tru
e A
vera
ge
Series1 L L
14Federal AviationAdministration
Summary Day Selection
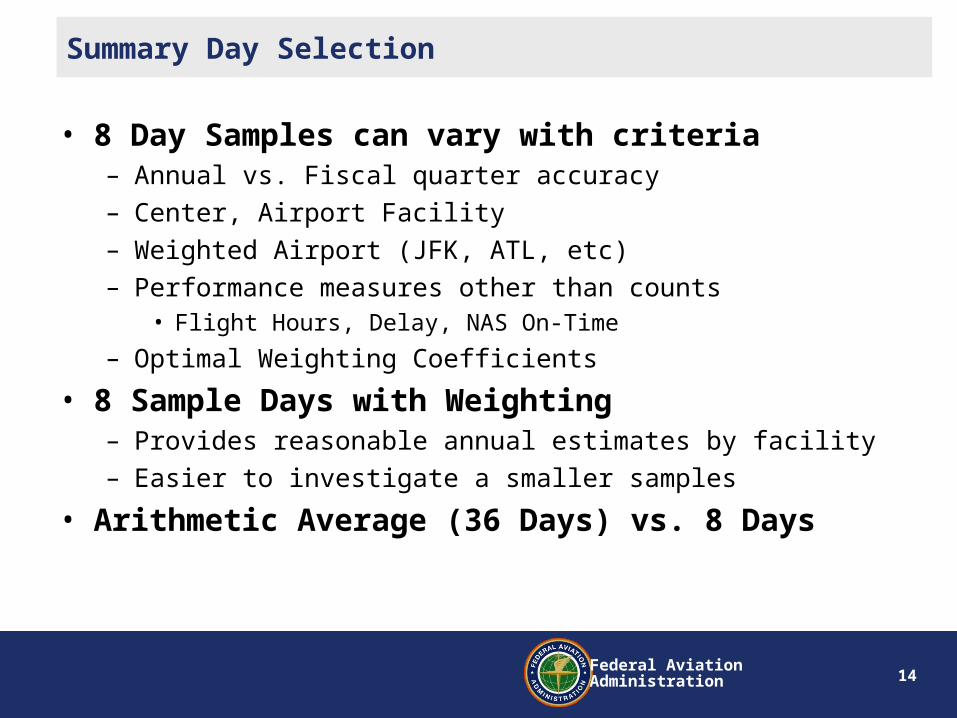
• 8 Day Samples can vary with criteria– Annual vs. Fiscal quarter accuracy– Center, Airport Facility– Weighted Airport (JFK, ATL, etc)– Performance measures other than counts
• Flight Hours, Delay, NAS On-Time
– Optimal Weighting Coefficients
• 8 Sample Days with Weighting– Provides reasonable annual estimates by facility– Easier to investigate a smaller samples
• Arithmetic Average (36 Days) vs. 8 Days

15Federal AviationAdministration
ATO Future Schedule – Core Logic
• Turn Airport Growth Rates into City Pair Growth Rates (Frater)
– Builds the traffic network
• Constrained Demand
– Is the Network Feasible?
• Future Itineraries
– Links flights together, propagated delay
• Future Fleet
– How will the fleet evolve?
• What has Changed?

16Federal AviationAdministration
How Peaky Should Schedules Become?
• ATO-F discount delay if above a certain threshold– Generic smoothing algorithm – no limit on time
• 20 Minute Delay Rule – LGA Study– 20 minute average open to interpretation– Iterative process with models
• FY 2000 Delay Rule– Airports Frozen at 2000 Levels– Sensitive to model
• Historical Demand/Capacity Ratios– Developed by MITRE for OEP 6.0 & 8.0– Simple, practical to implement

17Federal AviationAdministration
0
10
20
30
40
50
60
0%-10% 10%-20% 20%-30% 30%-40% 40%-50% 50%-60% 60%-70% 70%-80%
Pct Above Capacity
# o
f 1
5 M
inu
te B
ins
Ab
ov
e
Pct Above Capacity
Percent Above Target Capacity in 15 Minute Bin – How Bad Does It Get?2006 VMC Capacity Data from ATO-F, Summer 90% Peak Day
Known Problem AirportsOver Capacity More Balanced Operation
Most 15 Minute Bin PeaksLess than 30% Over
40% Selected for Representative As Bad As It Gets
Arr/Dep ImbalanceSpecial Cases

18Federal AviationAdministration
Newark Airport FY 2006Ratio of Filed Operations to Optimal VFR Capacity
0
500
1000
1500
2000
2500
3000
3500
4000
0.6-0.7 0.7-0.8 0.8-0.9 0.9-1.0 1.0-1.1 1.1-1.2 1.2-1.3 1.3-1.4 1.4-1.5 1.5-1.6 1.6-1.7 1.7-1.8 1.8-1.9 1.9+
Filed Operations/VFR Capacity
# o
f Q
uar
ter
Ho
ur
Bin
s
0.6-0.7 0.7-0.8 0.8-0.9 0.9-1.0 1.0-1.1 1.1-1.2 1.2-1.3 1.3-1.4 1.4-1.5 1.5-1.6 1.6-1.7 1.7-1.8 1.8-1.9 1.9+
Upper Bound for Qtr Operations Growth

19Federal AviationAdministration
Newark EWR Traffic Flow - Summer Quarter FY2006NAS Model Day: 4:00am to 4:00am
0
5
10
15
20
25
30
35
40
44.
75 5.5
6.25 7
7.75 8.
59.
25 1010
.75
11.5
12.2
5 1313
.75
14.5
15.2
5 1616
.75
17.5
18.2
5 1919
.75
20.5
21.2
5 2222
.75
23.5
24.2
5 2525
.75
26.5
27.2
5 2828
.75
29.5
Local Time
Tra
ffic
Flo
w
ATO Sched Cap Cap40
Results in about 85 Operations per hour 21.25/qtr
62% AboveATO-F Curve43 42 35 50
48% Above43 % Above
38% Above33%32%
29%40%19 Deps 2 ArrAt Cap at 15 Ops

20Federal AviationAdministration
Constrained Schedule Methodology
• Airport VFR Capacities Compared to IFR Schedule for 15 Minute Intervals
• Flight Times Adjusted to Reduce Peaks
• Based on Airline Tolerance for Congestion – 15 Minute > 40% above Capacity– 1 Hour > 20 % above Capacity– 2 Consecutive Hours > 14 % above Capacity– 3 Consecutive Hours > 6 % above Capacity– Most Congested Airports Considered First

21Federal AviationAdministration
Cleveland CLE Traffic Flow - Summer Quarter FY2017NAS Model Day: 4:00am to 4:00am
0
5
10
15
20
25
30
35
40
Zulu Prime + Hour
Tra
ffic
Flo
w
ATO Sched ATO_Sched_Base ATO_Con_Rev Cap Cap40
Results in about 86 Operations per hour 21.5/qtr
All Departures
All Arrivals

22Federal AviationAdministration
ORD - Avg Minutes Delay
0
10
20
30
40
50
60
70
80
90
FY07 FY08 FY09 FY10 FY11 FY12 FY13 FY14 FY15 FY16 FY17 FY18
Fiscal Year
Ave
rag
e M
inu
tes
of
Del
ay
0
500
1000
1500
2000
2500
3000
3500
4000
Unconstrained TrimmedU_Ops T_Ops

23Federal AviationAdministration
TAF Projections and Constrained Airports - 2025 Projection
0
100
200
300
400
500
600
PHL LAS ATL MDW LAX EWR JFK SNA PHX
Airport
Nu
mb
er o
f T
rim
med
Flig
hts
2006 Projection 2009 Projection
24Federal AviationAdministration
Future Fleet
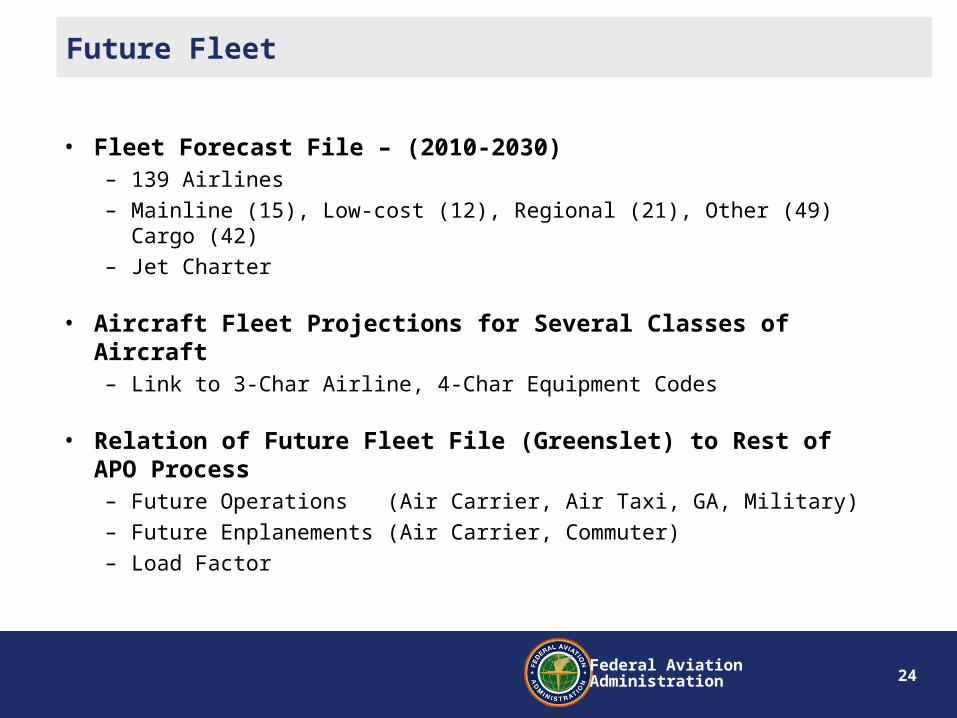
• Fleet Forecast File – (2010-2030)– 139 Airlines
– Mainline (15), Low-cost (12), Regional (21), Other (49) Cargo (42)
– Jet Charter
• Aircraft Fleet Projections for Several Classes of Aircraft– Link to 3-Char Airline, 4-Char Equipment Codes
• Relation of Future Fleet File (Greenslet) to Rest of APO Process– Future Operations (Air Carrier, Air Taxi, GA, Military)
– Future Enplanements (Air Carrier, Commuter)
– Load Factor
25Federal AviationAdministration
21500000
22000000
22500000
23000000
23500000
24000000
24500000
25000000
25500000
26000000
2006 2008 2010 2012 2014 2016 2018 2020 2022 2024 2026
En
pla
nem
ents
350000
355000
360000
365000
370000
375000
380000
385000
390000
Op
eration
s
AC Enplanements AC Operations
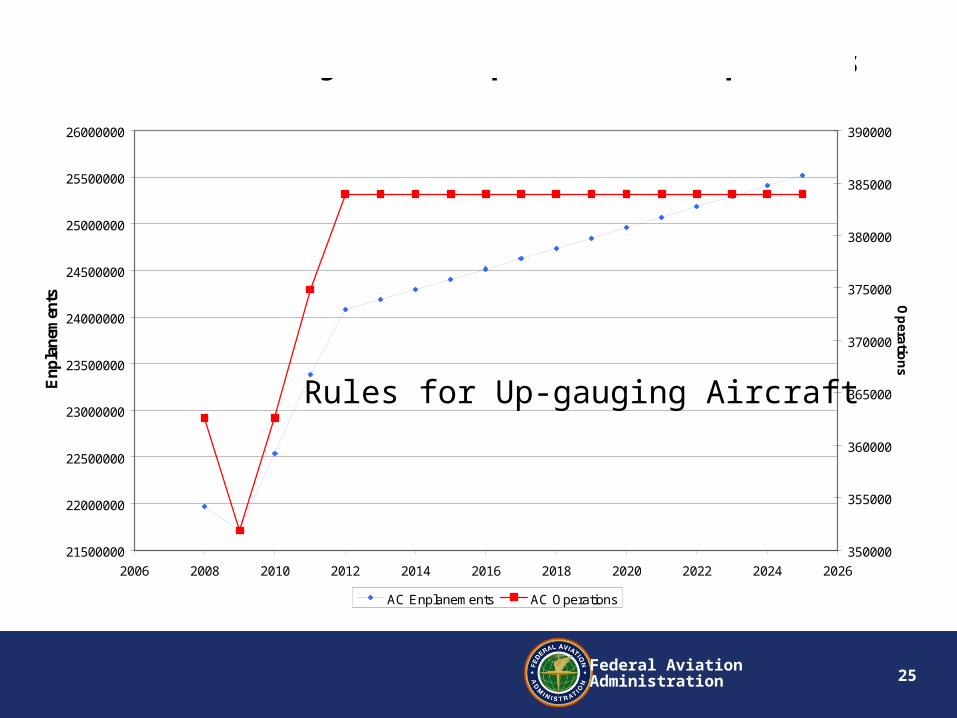
JFK TAF Projections - Enplanments and Operations
Rules for Up-gauging Aircraft

26Federal AviationAdministration
Evidence of Up-gauging
• Based on the number of seats available in the fleet as predicted by the 2008 Greenslet/APO fleet forecast.
– Cargo aircraft are assigned zero seats.
26

27Federal AviationAdministration
Evidence of Up-gauging
• If the data is segregated by airline user class, we observe that the up-gauging is driven by regional and ‘other’ operations, while mainline carriers lower the number of available seats.
27
28Federal AviationAdministration
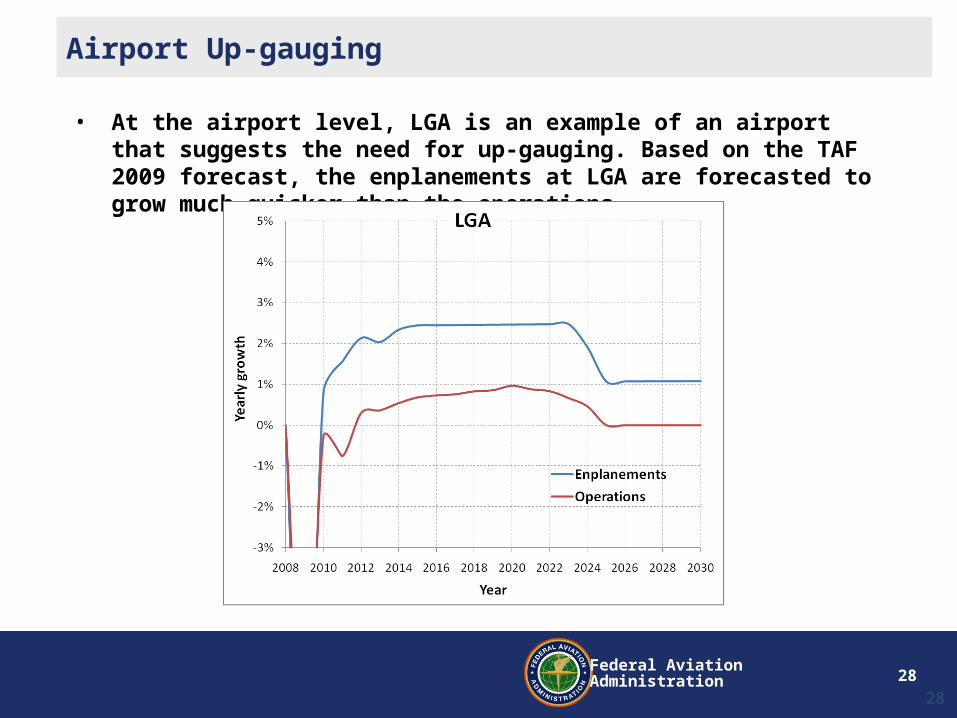
Airport Up-gauging
• At the airport level, LGA is an example of an airport that suggests the need for up-gauging. Based on the TAF 2009 forecast, the enplanements at LGA are forecasted to grow much quicker than the operations.
28
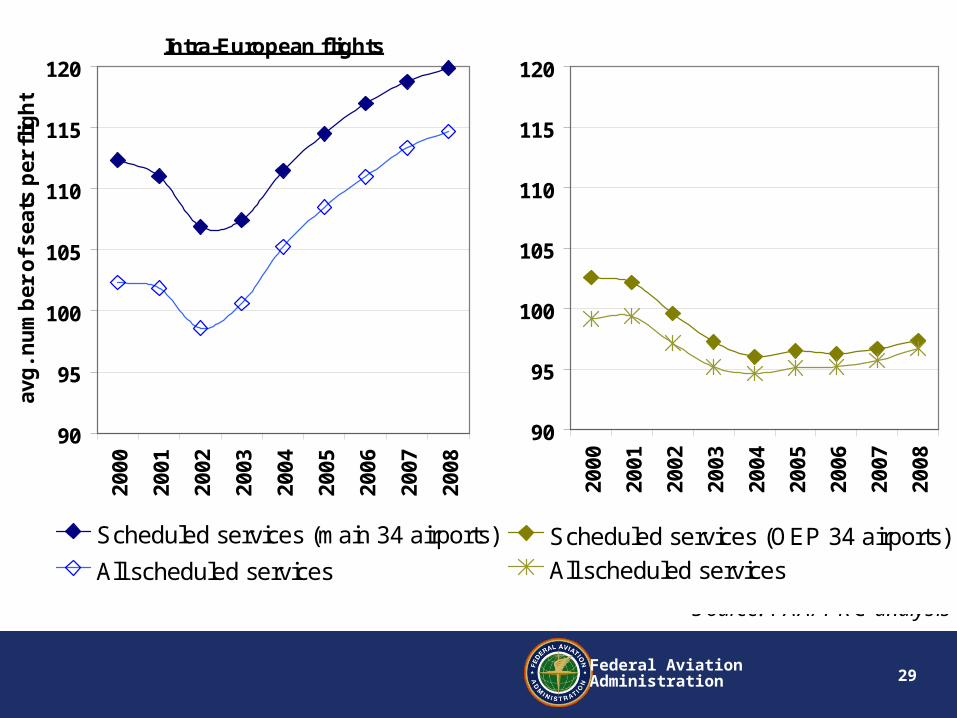
29Federal AviationAdministration
90
95
100
105
110
115
120
2000
2001
2002
2003
2004
2005
2006
2007
2008
avg
. nu
mb
er o
f se
ats
per
flig
ht
Scheduled services (main 34 airports)
All scheduled services
90
95
100
105
110
115
120
2000
2001
2002
2003
2004
2005
2006
2007
2008
Scheduled services (OEP 34 airports)
All scheduled services
Intra-European flights US domestic flights (CONUS)
Source: FAA/ PRC analysis

30Federal AviationAdministration
Future Development
• Improve Accessibility of Schedules– Understand Data Limitations– Web Access
• Guidance for Uncertainty– Alternative Scenarios– Mont-Carlo
• System Performance/Airline Behavior– Demand Shifts
• Keep Analysis “Costs” Down– Remember the Objective– Did the work make a difference?