Fecal Indicator Bacteria Persistence Under Natural Conditions in an Ice-Covered River
10
APPLIED AND ENVIRONMENTAL MICROBIOLOGY, Oct. 1976, p. 527-536 Copyright ©) 1976 American Society for Microbiology Vol. 32, No. 4 Printed in U.S.A. Fecal Indicator Bacteria Persistence Under Natural Conditions in an Ice-Covered River CHARLOTTE V. DAVENPORT, ELENA B. SPARROW,' AND RONALD C. GORDON* Arctic Environmental Research Station, U.S. Environmental Protection Agency, College, Alaska 99701 Received for publication 18 May 1976 Total coliform (TC), fecal coliform (FC), and fecal streptococcus (FS) survival characteristics, under natural conditions at 00C in an ice-covered river, were examined during February and March 1975. The membrane filter (MF) tech- nique was used throughout the study, and the multiple-tube (MPN) method was used in parallel on three preselected days for comparative recovery of these bacteria. Survival was studied at seven sample stations downstream from all domestic pollution sources in a 317-km reach of the river having 7.1 days mean flow time (range of 6.0 to 9.1 days). The mean indicator bacteria densities decreased continuously at successive stations in this reach and, after adjustment for dilution, the most rapid die-off was found to occur during the first 1.9 days, followed by a slower decrease. After 7.1 days, the relative survival was TC < FC < FS, with 8.4%, 15.7%, and 32.8% of the initial populations remaining viable, respectively. These rates are higher than previously reported and suggest that the highest survival rates for these bacteria in receiving streams can be expected at 00C under ice cover. Additionally, the FC-FS ratio was >5 at all stations, indicating that this ratio may be useable for determining the source of fecal pollution in receiving streams for >7 days flow time at low water temperatures. The MPN and MF methods gave comparable results for the TC and FS at all seven sample stations, with both the direct and verified MF counts within the 95% confidence limits of the respective MPNs in most samples, but generally lower than the MPN index. Although FC recovery on membrane filters was improved with a modified technique, the MPN and MF methods did not provide comparable results at stations near the pollution source. However, the results became more comparable with increasing flow time. The results of this study indicate that heat shock is a major factor in suppression of the FC counts on the membrane filters at 44.5°C. Heat shock may be minimized by extended incuba- tion at 350C before exposure to the higher temperature. Water temperature, chemical and physical parameters, and predation are among the ma- jor factors affecting enteric microorganism sur- vival in the aquatic environment (15, 19, 22, 30). Early in this century, Ruediger (35) demon- strated a seasonal effect on survival. Subse- quent studies confirmed his observation that greater numbers of fecal indicator bacteria sur- vive in water for a longer time during the win- ter than during the summer (7, 18, 21, 25, 32). Based on a literature review, Kittrell and Fur- fari (25) suggested 1500 as an adequate dividing point for determining seasonal water tempera- ture effects. However, the work of McFeters and Stuart (30) suggested this division may not be adequate when they found that the tempera- ture effect on Escherichia coli survival time ' Present address: Institute of Water Resources, Univer- sity of Alaska, College, AK 99701. was inversely proportional to the temperature change between 5 and 1500. Since E. coli has been shown to have a minimum growth tem- perature of 7.5 to 7.80C (39), the low-tempera- ture survival picture may be clouded by the coliform aftergrowth demonstrated in some studies at temperatures above the minimum for growth but less than 15°0 (25, 31). Although fecal streptococci (FS) survive longer in winter than in summer (7, 42), aftergrowth does not appear to be a problem since these bacteria rarely, if ever, multiply in water (4, 13). Most fecal indicator bacteria survival studies have been conducted under controlled labora- tory or field conditions utilizing pure cultures of coliforms and FS. Such controlled studies con- tribute immeasurably to a basic understanding of survival characteristics (2, 29) and are neces- sary to delineate the effect of individual factors such as water temperature (14, 30). However, 527 Downloaded from https://journals.asm.org/journal/aem on 22 February 2022 by 45.183.93.91.
Transcript of Fecal Indicator Bacteria Persistence Under Natural Conditions in an Ice-Covered River

APPLIED AND ENVIRONMENTAL MICROBIOLOGY, Oct. 1976, p. 527-536Copyright ©) 1976 American Society for Microbiology
Vol. 32, No. 4Printed in U.S.A.
Fecal Indicator Bacteria Persistence Under NaturalConditions in an Ice-Covered River
CHARLOTTE V. DAVENPORT, ELENA B. SPARROW,' AND RONALD C. GORDON*Arctic Environmental Research Station, U.S. Environmental Protection Agency, College, Alaska 99701
Received for publication 18 May 1976
Total coliform (TC), fecal coliform (FC), and fecal streptococcus (FS) survivalcharacteristics, under natural conditions at 00C in an ice-covered river, were
examined during February and March 1975. The membrane filter (MF) tech-nique was used throughout the study, and the multiple-tube (MPN) method wasused in parallel on three preselected days for comparative recovery of thesebacteria. Survival was studied at seven sample stations downstream from alldomestic pollution sources in a 317-km reach of the river having 7.1 days meanflow time (range of 6.0 to 9.1 days). The mean indicator bacteria densitiesdecreased continuously at successive stations in this reach and, after adjustmentfor dilution, the most rapid die-off was found to occur during the first 1.9 days,followed by a slower decrease. After 7.1 days, the relative survival was TC < FC< FS, with 8.4%, 15.7%, and 32.8% of the initial populations remaining viable,respectively. These rates are higher than previously reported and suggest thatthe highest survival rates for these bacteria in receiving streams can be expectedat 00C under ice cover. Additionally, the FC-FS ratio was >5 at all stations,indicating that this ratio may be useable for determining the source of fecalpollution in receiving streams for >7 days flow time at low water temperatures.The MPN and MF methods gave comparable results for the TC and FS at allseven sample stations, with both the direct and verified MF counts within the95% confidence limits of the respective MPNs in most samples, but generallylower than the MPN index. Although FC recovery on membrane filters wasimproved with a modified technique, the MPN and MF methods did not providecomparable results at stations near the pollution source. However, the resultsbecame more comparable with increasing flow time. The results of this studyindicate that heat shock is a major factor in suppression of the FC counts on themembrane filters at 44.5°C. Heat shock may be minimized by extended incuba-tion at 350C before exposure to the higher temperature.
Water temperature, chemical and physicalparameters, and predation are among the ma-jor factors affecting enteric microorganism sur-vival in the aquatic environment (15, 19, 22,30). Early in this century, Ruediger (35) demon-strated a seasonal effect on survival. Subse-quent studies confirmed his observation thatgreater numbers of fecal indicator bacteria sur-vive in water for a longer time during the win-ter than during the summer (7, 18, 21, 25, 32).Based on a literature review, Kittrell and Fur-fari (25) suggested 1500 as an adequate dividingpoint for determining seasonal water tempera-ture effects. However, the work of McFetersand Stuart (30) suggested this division may notbe adequate when they found that the tempera-ture effect on Escherichia coli survival time
' Present address: Institute of Water Resources, Univer-sity of Alaska, College, AK 99701.
was inversely proportional to the temperaturechange between 5 and 1500. Since E. coli hasbeen shown to have a minimum growth tem-perature of 7.5 to 7.80C (39), the low-tempera-ture survival picture may be clouded by thecoliform aftergrowth demonstrated in somestudies at temperatures above the minimum forgrowth but less than 15°0 (25, 31). Althoughfecal streptococci (FS) survive longer in winterthan in summer (7, 42), aftergrowth does notappear to be a problem since these bacteriararely, if ever, multiply in water (4, 13).Most fecal indicator bacteria survival studies
have been conducted under controlled labora-tory or field conditions utilizing pure cultures ofcoliforms and FS. Such controlled studies con-tribute immeasurably to a basic understandingof survival characteristics (2, 29) and are neces-sary to delineate the effect of individual factorssuch as water temperature (14, 30). However,
527
Dow
nloa
ded
from
http
s://j
ourn
als.
asm
.org
/jour
nal/a
em o
n 22
Feb
ruar
y 20
22 b
y 45
.183
.93.
91.

528 DAVENPORT, SPARROW, AND GORDON
extrapolation to natural conditions must bedone with great caution because controlledstudies cannot take into account all the envi-ronmental factors and interrelationships innatural aquatic ecosystems (11, 12, 14, 29).
Enteric microorganism survival in receivingstreams is one of the critical factors impactingdownstream water uses (14). Since low watertemperatures enhance survival and prevailover a large part of the world for a portion ofeach year, low-temperature survival parame-ters must be established in natural receivingwaters. An earlier report (18) on fecal indicatorbacteria survival characteristics at low watertemperatures pointed out the need to relateindicator and pathogen survival. As a result,the low-temperature survival characteristics ofthe indicator bacteria, salmonellae, and entericviruses were examined during an intensivesampling program on the Tanana River nearFairbanks, Alaska, when the water tempera-ture was 0°C and the river was ice covered. Thepresent report describes the fecal indicator bac-teria survival characteristics and compares to-tal coliform (TC), fecal coliform (FC), and FSrecovery using the membrane filter (MF) tech-nique and multiple-tube (MPN) method.
MATERIALS AND METHODSRiver description. The Tanana River, one of the
major rivers draining the interior of Alaska, flowsgenerally northwest to its confluence with the Yu-kon River. The 360-km reach studied (Fig. 1) hascomplete ice cover and a water temperature of 0°Cfrom November through April. Unlike many riversin more temperate climates which have high fluc-
tuating flows (25), the Tanana River (U.S. Geologi-cal Survey, personal communication) and otherAlaskan rivers (37) have low flows during the win-ter. The minimum flow is usually reached duringearly January and remains stable until the begin-ning of spring breakup in April. The Tanana Riverreceives domestic sewage effluent from severalwaste treatment systems in a reach starting at itsconfluence with the Chena River and extending up-stream for 35 km. Most of this effluent enters fromthe Chena River which flows through Fairbanks;there is no additional input downstream from thispoint.Sample station selection and field schedule. Ten
sample stations were selected (Fig. 1). The T-900station was located upstream from all known domes-tic waste sources to provide background informa-tion. The T-800 and C-100 stations monitored allknown sewage sources on the Tanana and ChenaRivers, respectively. The T-700 station was locateddownstream from the confluence of the Tanana andChena Rivers, a distance sufficient to permit com-plete mixing of the water from the two rivers. The T-700 through T-100 stations established the 317-kmreach in which the survival study was conductedand, based on previous velocity estimates (18), di-vided the river into approximately 1-day flow timereaches.The study was conducted during February and
March 1975. The 17 February (day 1) to 7 March (day19) time period was selected because of stable riverdischarge and ice conditions, sufficient daylight forfield work, and ambient air temperature generallywarmer than - 30°C. Hydrological studies werestarted and preliminary bacteriological sampleswere obtained from each station during days 1through 7. Days 8 through 19 were utilized for inten-sive sampling and completion of the hydrologicalstudies.
FIG. 1. Lower reach of the Tanana River showing sample stations.
APPL. ENVIRON. MICROBIOL.
Dow
nloa
ded
from
http
s://j
ourn
als.
asm
.org
/jour
nal/a
em o
n 22
Feb
ruar
y 20
22 b
y 45
.183
.93.
91.
FECAL INDICATOR BACTERIA PERSISTENCE 529
Sampling methods. The C-100 sample station wasthe only one readily accessible by ground transpor-tation. Small, ski-equipped aircraft were used toreach the other stations. The techniques for thistype of winter field operations have been describedby Casper et al. (6) and Gordon (18).
All samples were collected in new 5 (ca. 19.0liters)- or 6 (ca. 22.8 liters)-gallon Cubitainers (Hed-win) which were discarded after one use. A new holewas cut in the ice each day that samples were taken.Water for the 6-gallon bacteriology and chemistrysamples was dipped from the hole. At stationswhere larger volumes of water (106 gallons [ca.402.8 liters]) were required, a submersible pumppowered by a small generator was used to pumpwater through a low-temperature rubber hose di-rectly into Cubitainers inside the aircraft. Eachsample was delivered to a small airport near the T-600 station and transferred to an insulated truck fortransport to the laboratory. Samples from the T-100through T-700 stations were collected between 10:00a.m. and 2:00 p.m. and maintained at a temperaturenear 0°C during transport. All samples were in thelaboratory within 6 h after removal from the river.
Hydrological studies. U.S. Geological Survey hy-drologists, experienced in doing under-ice measure-ments, used established techniques to measure theriver discharge at each station. This was used todetermine the dilution factor for enteric microorgd-nism survival and for the dye study. The hydrolo-gists also marked the center of the main river chan-nel at each station to establish the dye injection andmicrobiology sampling points.The dye study provided the minimum, mean, and
maximum flow times between stations. Based on theriver discharge, appropriate volumes of RhodamineB dye were injected at each station from T-200 pro-ceeding upstream through T-700 in consecutive or-der. The dye passage at each station from T-100 to T-600 was monitored using a Turner model 111 fluor-ometer fitted with a high-volume continuous flowdoor. Because it was not advisable to leave a personon the ice during the extended time required for dyepassage, a procedure was developed that permittedthe monitoring equipment to operate unattended for24 h or longer. A report on the details of this proce-dure is in preparation.
Indicator bacteria analysis. Because MF brandand lot may affect TC and FC recovery (10, 20, 33,36), a preliminary comparison of Millipore filters(type HAWG 047 SO; lot numbers 12463 1, 12463 2,17668 4 and 17668 5; Millipore Corp.) and Gelmanfilters (type GN-6; lot number 80689) was conducted.A pure culture of E. coli (ATCC 11775) was used forthe initial comparisons. Subsequently, unchlori-nated primary sewage effluent and polluted riverwater from the C-100, T-600, and T-700 stations wereexamined for TC, FC, and FS, and isolates wereverified to determine recovery efficiency. The com-parison indicated that neither the TC nor the FScounts were affected by MF brand or lot. Incorpora-tion of agar into the medium showed no improve-ment in TC counts. FC recovery on Gelman filterswas higher than the best recovery on Millipore fil-ters (lot number 17668 5, Millipore Corp.) by 1.4
times with E. cbli and 1.9 times with polluted riverwater.
Using Gelman filters, additional testing withriver water samples showed that the broth mediumgave 1.8 to 2.0 times greater FC recovery than theagar medium. It was suggested (R. H. Bordner,personal communication) that FC recovery may beincreased by a preincubation step to minimize orprevent heat shock arising from the rapid tempera-ture increase from 0 to 44.5°C. To examine thispossibility, water samples were filtered in the nor-mal manner, and the filters were placed on the brothmedium and left at either room temperature or 35°Cfor 2 h. This was followed by incubation in a 44.5°Cwater bath for 24 h. Parallel samples were immedi-ately placed in the water bath. The counts frompreincubated filters were 2.0 to 2.3 (room tempera-ture) and 2.8 to 3.5 (35°C) times greater than thosefrom filters placed immediately at 44.5°C.The MF technique as described in Standard Meth-
ods (1) was used throughout the study for the deter-mination of total coliforms (m-TC), fecal coliforms(m-FC) and fecal streptococci (m-FS), except thatthe FC filters were preincubated for 2 h at 35°C.Millipore filter lot number 17668 5 was used for bothTC and FS, and Gelman filter lot number 80689 wasused for FC. The growth media used were m-Coli-form broth (BBL), KF streptococcal (KF) agar (BBL)and m-FC broth (BBL). Three replicate portions ofeach sample volume were filtered. To minimize var-iables in counting during the study, one person didall MF counting and isolation of colonies for verifi-cation.On days 5, 12, and 19, 10 MF colonies exhibiting
positive color reactions were randomly picked fromeach of the three replicate filters for verification.The TC and FC verification methods utilized duringthis study have been described elsewhere (41). Inaddition, TC isolates that showed a positive pre-sumptive test were subcultured in EC broth (Difco)for verification as FC. Verified TC and FC isolatesfrom day 5 were subcultured on Endo agar (BBL)plates and typical coliform colonies were transferredto Trypticase soy agar (BBL) slants for furtherstudy. FS verification was an abbreviated procedureusing the same media and methods as the MPN.Isolates verified by this procedure on day 5 weresubcultured on brain heart infusion agar (BBL)plates, and colonies were transferred to slants on thesame medium for further study.
The MPN method (1) was used in parallel withthe MF technique on days 5, 12, and 19. Eitherlauryl sulfate broth (BBL) or lauryl tryptose broth(Difco) was used for the presumptive coliform MPNtest. All positive presumptive cultures were trans-ferred to brilliant green bile 2% (Difco) for TC con-firmation and to EC medium (Difco) for FC confir-mation. Azide dextrose broth (BBL) and ethyl violetazide broth (BBL) were used in the presumptive andconfirmed MPN tests for FS.
Chemical analyses. Samples were obtained dur-ing the intensive sampling period (days 8-19). Im-mediately after the samples arrived in the labora-tory, pH was determined with a Leeds & Northrupmodel 7401 pH meter, and conductivity was mea-
VOL. 32, 1976
Dow
nloa
ded
from
http
s://j
ourn
als.
asm
.org
/jour
nal/a
em o
n 22
Feb
ruar
y 20
22 b
y 45
.183
.93.
91.
530 DAVENPORT, SPARROW, AND GORDON
sured with a Beckman model RC 16B2 conductivitybridge. A Technicon AutoAnalyzer I and automatedmethods (40) were used to measure concentrations ofthe following chemical parameters: chloride, ammo-nia nitrogen, nitrate nitrogen (hydrazine reductionmethod), and orthophosphate phosphorus (single re-
agent method). Calcium, magnesium, sodium, andpotassium concentrations were measured with a
Perkin-Elmer model 303 atomic absorption spectro-photometer. A Beckman model 915 total organiccarbon analyzer was used for measuring total car-
bon and total organic carbon.
RESULTS AND DISCUSSIONTC, FC, and FS recovery with the MF tech-
nique. The data in Table 1 reveal that theChena River (C-100) was the major source offecal pollution in the Tanana River. These bac-teria are almost entirely of doftiestic origin dur-ing the winter when ice effectively seals theriver because there are no other point or non-
point sources. Thus, the wide range in numbersof indicator bacteria recovered at each stationcan be attributed mainly to diurnal fluctua-tions in domestic sewage flow and are compara-ble to the ranges previously reported for pol-luted rivers (17, 18, 27). The bacterial countsoverlapped extensively between consecutivestations, but there was a continuous decrease inthe mean TC, FC, and FS densities as the watermoved downstream.Even though the TC, FC, and FS densities at
each station varied widely from day to day, themean coefficients of variation (Table 2) indicatethat the MF technique had a high degree ofprecision for enumerating indicator bacteria inthis type of river water sample. The MF tech-nique was used on a total of 61 samples fromstations T-700 through T-100, with overall coeffi-cients of variation of 0.13 (TC), 0.15 (FC), and
0.10 (FS). These values for TC and FC are inagreement with the mean coefficients of varia-tion reported earlier for pure coliform cultures(A. P. Dufour and V. J. Cabelli, presented atthe EPA-ASTM Symposium on Membrane Fil-ters, Fort Lauderdale, Fla., 20 January 1975;33). Thus, the type of laboratory errors de-scribed by E. E. Geldreich (presented at theEPA-ASTM Symposium on Membrane Filters,Fort Lauderdale, Fla., 20 January 1975) andVelz (44) can be minimized and excellent repro-ducibility can be obtained with environmentalsamples.
Geldreich (13) pointed out that the FC-FSratio indicates whether pollution is from a hu-man or nonhuman source because it is always>4 in domestic sewage effluent and generally<0.7 in animal wastes. McFeters et al. (29)reported that the persistent FS species are ofhuman origin, so the FC-FS ratio would fallwhen domestic effluent entered the stream en-
vironment and started moving downstream,whereas the ratio in animal wastes would rise.Because of the different rates of FC and FS die-off in natural streams, it has been suggestedthat the ratio may not be valid as a sourceindicator after 24 h (13, 27). However, McFeterset al. (29) found the ratio to be valid for as longas 4 days at 9.5 to 12.5°C. The data in Table 3suggest that the FC-FS ratio may be valid foran even more extended period at 0°C as it wasstill >5 after 7 days of flow time.
Verification of MF isolates. Verification ofTC, FC, and FS isolates is shown in Table 4.Although the mean TC verification was 80.6%at the seven downstream stations, the percent-ages varied widely among the samples even
though the pollution source was known to bedomestic sewage. The verification range of 50.0
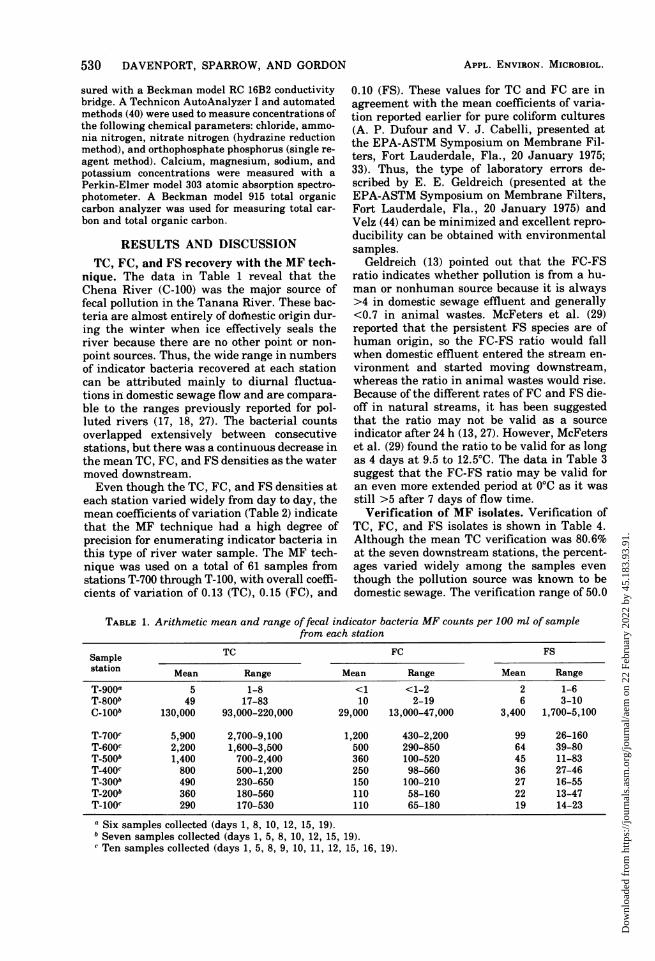
TABLE 1. Arithmetic mean and range of fecal indicator bacteria MF counts per 100 ml of samplefrom each station
Sample TC FC FS
station Mean Range Mean Range Mean Range
T 9OOa 5 1-8 <1 <1-2 2 1-6T-800b 49 17-83 10 2-19 6 3-10C-lOOb 130,000 93,000-220,000 29,000 13,000-47,000 3,400 1,700-5,100
T-700c 5,900 2,700-9,100 1,200 430-2,200 99 26-160T-600c 2,200 1,600-3,500 500 290-850 64 39-80T-500b 1,400 700-2,400 360 100-520 45 11-83T-400c 800 500-1,200 250 98-560 36 27-46T-300b 490 230-650 150 100-210 27 16-55T-200b 360 180-560 110 58-160 22 13-47T-100c 290 170-530 110 65-180 19 14-23
a Six samples collected (days 1, 8, 10, 12, 15, 19).bSeven samples collected (days 1, 5, 8, 10, 12, 15, 19)." Ten samples collected (days 1, 5, 8, 9, 10, 11, 12, 15, 16, 19).
APPL. ENVIRON. MICROBIOL.
Dow
nloa
ded
from
http
s://j
ourn
als.
asm
.org
/jour
nal/a
em o
n 22
Feb
ruar
y 20
22 b
y 45
.183
.93.
91.

FECAL INDICATOR BACTERIA PERSISTENCE 531
TABLE 2. Mean coefficient of variation ofMF countsfrom each sample stationa
Sample sta- TC FC FStion
T-900 0.38 0.43T-800 0.19 0.23 0.22C-100 0.14 0.21 0.11
T-700 0.13 0.18 0.11T-600 0.11 0.15 0.09T-500 0.12 0.17 0.09T-400 0.13 0.17 0.08T-300 0.12 0.12 0.10T-200 0.18 0.12 0.14T-100 0.13 0.15 0.11
a Calculated from the sum of the coefficients ofvariation obtained each day.
TABLE 3. Mean TC-FC and FC-FS ratios from MFcounts per 100 ml at each sample stationa
Sample station TC-FC FC-FS
T-900 3.9 0.7T-800 5.8 1.9C-100 5.3 8.9
T-700 5.4 13.9T-600 4.9 8.2T-500 4.2 8.5T-400 4.1 7.1T-300 3.3 6.0T-200 3.3 5.4T-100 2.8 5.5
a Calculated from the sum of the ratios obtainedeach day.
to 96.7% for samples from these stations wascomparable to that reported for other rivers (9)and supports the conclusion that many noncoli-form bacteria are capable of producing a false-positive m-TC reaction (9, 38). Concurrently,these TC isolates were checked for verificationas FC and the mean verification rate was 43.5%,with a range of 16.7 to 66.7%. The mean FCverification rate was 92.5% (range, 83.3 to 100%)for m-FC isolates after the 35°C preincubationand incubation at 44.5°C. This is in close agree-ment with the 91.0% FC verification from riverwater samples reported by Rose et al. (34). TheFS had a mean verification of 94.5% (range, 83.3to 100%), which was slightly higher than re-ported previously (8), and may have resultedfrom the abbreviated verification method usedin this study. These data show that verificationof m-TC isolates either as TC or FC was highlyvariable from sample to sample and had noconsistent relationship to m-FC isolate verifica-tion. In contrast, neither day nor movementdownstream from the pollution source affectedverification of m-FC or m-FS isolates. The per-
centages of FC and FS isolates verified weresimilar in individual samples and had essen-tially the same overall mean and range.Comparison of TC, FC, and FS recovery
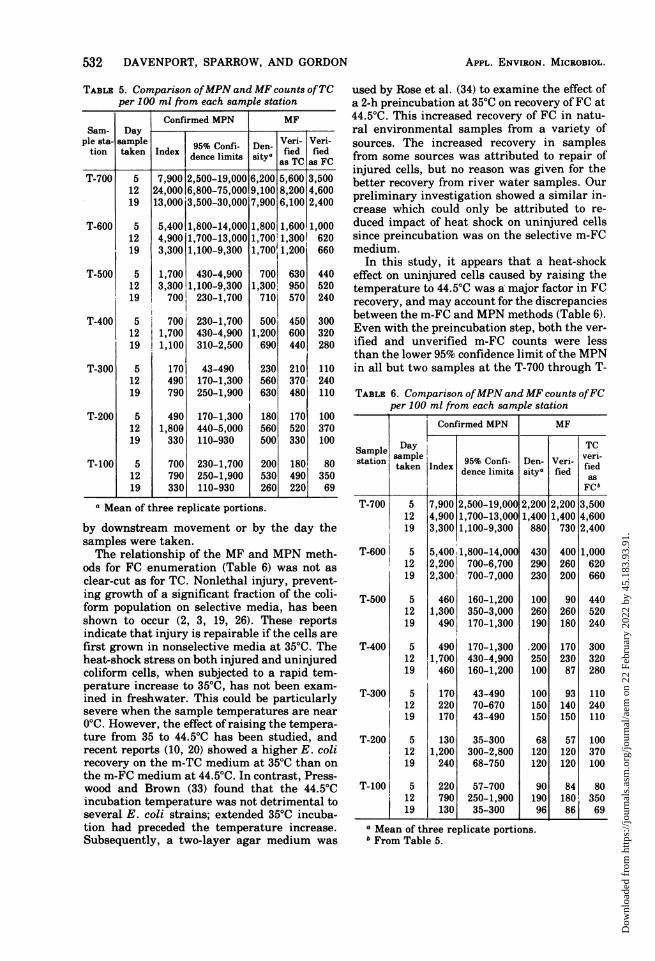
with MF and MPN methods. In some reports,it is difficult to ascertain whether the MPNindex or the 95% confidence limits were used tocompare the MPN and MF methods. Since theindex is an estimate of bacterial density ratherthan a precise measurement (41), it is of littlesignificance without the confidence limits be-cause any bacterial density within the limitscan produce the observed result (44). Thus, boththe MPN index and 95% confidence limits wereused during this study to compare MF andMPN recoveries of TC, FC, and FS from theTanana River. Parallel MF and confirmedMPN results are shown in Tables 5, 6, and 7,along with the MF counts adjusted for the per-cent verification from Table 4. The TC densities(Table 5) show that the m-TC counts were gen-erally lower than the confirmed MPN index.This appears to be in agreement with previousreports, which indicate that the m-TC countsare often lower than the MPN densities in riverwater samples (25, 28). However, the two meth-ods did provide comparable results, unaffected
TABLE 4. Verification ofMF colonies from eachsample stationa
TC FC FS
Sam- Day % %ple sta- sample Veri- Veri- % Ver- % Ver-tion taken fied fied ified ified
as asTC FC
T-700 5 90.0 56.7 100.0 96.712 90.0 50.0 96.7 96.719 76.7 30.0 83.3 100.0
T-600 5 86.7 56.7 93.3 93.312 76.7 36.7 90.0 83.319 70.0 36.7 86.7 90.0
T-500 5 90.0 63.3 90.0 96.712 73.3 40.0 100.0 100.019 80.0 33.3 93.3 93.3
T-400 5 90.0 60.0 86.7 86.712 50.0 26.7 93.3 93.319 63.3 40.0 86.7 90.0
T-300 5 90.0 46.7 93.3 86.712 66.7 43.3 93.3 96.719 76.7 16.7 96.7 100.0
T-200 5 96.7 56.7 83.3 83.312 93.3 66.7 96.7 96.719 66.7 20.0 100.0 100.0
T-100 5 90.0 40.0 93.3 96.712 93.3 66.7 96.7 96.719 83.3 26.7 90.0 100.0
a Thirty colonies subcultured from each stationeach day.
VOL. 32, 1976
Dow
nloa
ded
from
http
s://j
ourn
als.
asm
.org
/jour
nal/a
em o
n 22
Feb
ruar
y 20
22 b
y 45
.183
.93.
91.
532 DAVENPORT, SPARROW, AND GORDON
TABLE 5. Comparison ofMPN and MF counts ofTCper 100 ml from each sample station
Confirmed MPN MFSam- Day
ple sta- sample 95% Confi- Den- Veri- Veri-tion taken Index dence limits sity, fied fied
denclimts styaas TC as FC
T-700 5 7,900 2,500-19,000 6,200 5,600 3,50012 24,000 6,800-75,000 9,100 8,200 4,60019 13,000 3,500-30,000 7,900 6,100 2,400
T-600 5 5,400 1,800-14,000 1,80011,60011,00012 4,900 1,700-13,000 1,700 1,3001 62019 3,300 1,100-9,300 1,700i 1,200 660
T-500 5 1,700 430-4,900 7001 630 44012 3,300 1,100-9,300 1,300, 950 52019 700! 230-1,700 7101 570 240
T-400 5 700 230-1,700 500 450 30012 1,700 430-4,900 1,200 600 32019 1,100 310-2,500 690 440 280
T-300 5 170 43-490 230 210 11012 490 170-1,300 560 370: 24019 790 250-1,900 630 480 110
T-200 5 490 170-1,300 180 170 10012 1,800 440-5,000 560 520 37019 330 110-930 500 330 100
T-100 5 700 230-1,700 200 180' 8012 790 250-1,900 530 4901 35019 330 110-930 260 2201 69
a Mean of three replicate portions.
by downstream movement or by the day thesamples were taken.The relationship of the MF and MPN meth-
ods for FC enumeration (Table 6) was not asclear-cut as for TC. Nonlethal injury, prevent-ing growth of a significant fraction of the coli-form population on selective media, has beenshown to occur (2, 3, 19, 26). These reportsindicate that injury is repairable if the cells arefirst grown in nonselective media at 35°C. Theheat-shock stress on both injured and uninjuredcoliform cells, when subjected to a rapid tem-perature increase to 35°C, has not been exam-ined in freshwater. This could be particularlysevere when the sample temperatures are near0°C. However, the effect of raising the tempera-ture from 35 to 44.5°C has been studied, andrecent reports (10, 20) showed a higher E. colirecovery on the m-TC medium at 35°C than onthe m-FC medium at 44.5°C. In contrast, Press-wood and Brown (33) found that the 44.5°Cincubation temperature was not detrimental toseveral E. coli strains; extended 35°C incuba-tion had preceded the temperature increase.Subsequently, a two-layer agar medium was
used by Rose et al. (34) to examine the effect ofa 2-h preincubation at 35°C on recovery of FC at44.5°C. This increased recovery of FC in natu-ral environmental samples from a variety ofsources. The increased recovery in samplesfrom some sources was attributed to repair ofinjured cells, but no reason was given for thebetter recovery from river water samples. Ourpreliminary investigation showed a similar in-crease which could only be attributed to re-duced impact of heat shock on uninjured cellssince preincubation was on the selective m-FCmedium.
In this study, it appears that a heat-shockeffect on uninjured cells caused by raising thetemperature to 44.5°C was a major factor in FCrecovery, and may account for the discrepanciesbetween the m-FC and MPN methods (Table 6).Even with the preincubation step, both the ver-ified and unverified m-FC counts were lessthan the lower 95% confidence limit of the MPNin all but two samples at the T-700 through T-
TABLE 6. Comparison ofMPN and MF counts ofFCper 100 ml from each sample station
Confirmed MPN MF
SapeDay; TCstation sampie 95% Confi- Den- Veri- veri-
taken Index dence limits sitya fied fiedasFCb
T-700 5 7,900 2,500-19,000 2,200 2,200 3,50012 4,900 1,700-13,000 1,400 1,400 4,60019 3,300 1,100-9,300 880 730 2,400
T-6001 5 5,400 1,800-14,000 430 400 1,00012 2 2001 700-6,700 290 260 62019 2,3001 700-7,000 230 200 660
T-500 5 4601 160-1,200 100 90 44012 1,3001 350-3,000 260 260 52019 4901 170-1,300 190 180 240
T-400 5 490 170-1,300 .200 170 30012 1,700 430-4,900 250 230 32019 460 160-1,200 100 87 280
T-300 5 170 43-490 100 93 11012 220 70-670 150 140 24019 170 43-490 150 150 110
T-200 5 130 35-300 68 57 10012 1,200 300-2,800 120 120 37019 240 68-750 120 120 100
T-100 5 220 57-700 90 84 80|12 790 250-1,900 190 180 350119 130 35-300 96 86 69
a Mean of three replicate portions.b From Table 5.
APPL. ENVIRON. MICROBIOL.
Dow
nloa
ded
from
http
s://j
ourn
als.
asm
.org
/jour
nal/a
em o
n 22
Feb
ruar
y 20
22 b
y 45
.183
.93.
91.
FECAL INDICATOR BACTERIA PERSISTENCE 533
400 stations. The cell densities became morecomparable after 5.3 days flow time down-stream from the pollution source and were inagreement in all but two samples at stations T-300 through T-100. The verified FC densitiesfrom the m-TC medium were within the 95%confidence limits of the MPN in all but 4 of the21 samples, but lower than the index in all butone sample. Since the m-FC and m-TC mediaare both selective, the difference in FC recoverymay be attributable to the length of incubationat 35°C before exposure to 44.5°C. Additionally,the data suggest that the effect of 35°C incuba-tion diminishes as exposure time to environ-mental stress increases. The higher MPN indexsuggests that growth in nonselective media at35°C is necessary to maximize FC recovery inselective media at the higher temperature asnoted previously by Geldreich et al. (16).Using KF agar, the m-FS technique has been
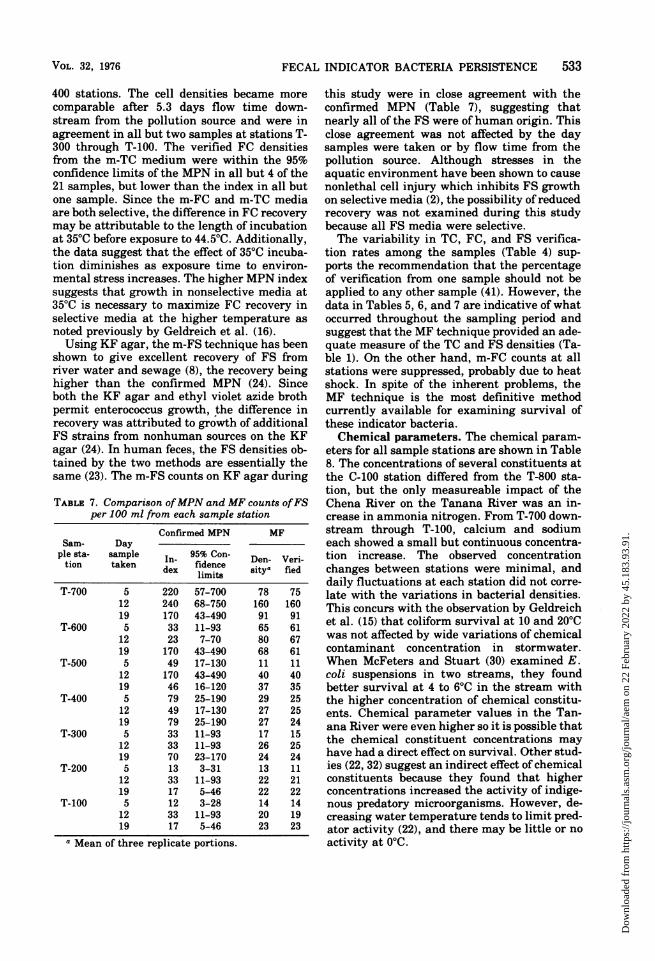
shown to give excellent recovery of FS fromriver water and sewage (8), the recovery beinghigher than the confirmed MPN (24). Sinceboth the KF agar and ethyl violet azide brothpermit enterococcus growth, the difference inrecovery was attributed to growth of additionalFS strains from nonhuman sources on the KFagar (24). In human feces, the FS densities ob-tained by the two methods are essentially thesame (23). The m-FS counts on KF agar during
TABLE 7. Comparison ofMPN and MF counts ofFSper 100 ml from each sample station
Confirmed MPN MFSam- Day
ple sta- sample In- 95% Con- Den- Veri-tion taken dex fidence Sitya fed
limits
T-700 5 220 57-700 78 7512 240 68-750 160 16019 170 43-490 91 91
T-600 5 33 11-93 65 6112 23 7-70 80 6719 170 43-490 68 61
T-500 5 49 17-130 11 1112 170 43-490 40 4019 46 16-120 37 35
T-400 5 79 25-190 29 2512 49 17-130 27 2519 79 25-190 27 24
T-300 5 33 11-93 17 1512 33 11-93 26 2519 70 23-170 24 24
T-200 5 13 3-31 13 1112 33 11-93 22 2119 17 5-46 22 22
T-100 5 12 3-28 14 1412 33 11-93 20 1919 17 5-46 23 23
a Mean of three replicate portions.
this study were in close agreement with theconfirmed MPN (Table 7), suggesting thatnearly all of the FS were ofhuman origin. Thisclose agreement was not affected by the daysamples were taken or by flow time from thepollution source. Although stresses in theaquatic environment have been shown to causenonlethal cell injury which inhibits FS growthon selective media (2), the possibility of reducedrecovery was not examined during this studybecause all FS media were selective.The variability in TC, FC, and FS verifica-
tion rates among the samples (Table 4) sup-ports the recommendation that the percentageof verification from one sample should not beapplied to any other sample (41). However, thedata in Tables 5, 6, and 7 are indicative of whatoccurred throughout the sampling period andsuggest that the MF technique provided an ade-quate measure of the TC and FS densities (Ta-ble 1). On the other hand, m-FC counts at allstations were suppressed, probably due to heatshock. In spite of the inherent problems, theMF technique is the most definitive methodcurrently available for examining survival ofthese indicator bacteria.Chemical parameters. The chemical param-
eters for all sample stations are shown in Table8. The concentrations of several constituents atthe C-100 station differed from the T-800 sta-tion, but the only measureable impact of theChena River on the Tanana River was an in-crease in ammonia nitrogen. From T-700 down-stream through T-100, calcium and sodiumeach showed a small but continuous concentra-tion increase. The observed concentrationchanges between stations were minimal, anddaily fluctuations at each station did not corre-late with the variations in bacterial densities.This concurs with the observation by Geldreichet al. (15) that coliform survival at 10 and 20°Cwas not affected by wide variations of chemicalcontaminant concentration in stormwater.When McFeters and Stuart (30) examined E.coli suspensions in two streams, they foundbetter survival at 4 to 6°C in the stream withthe higher concentration of chemical constitu-ents. Chemical parameter values in the Tan-ana River were even higher so it is possible thatthe chemical constituent concentrations mayhave had a direct effect on survival. Other stud-ies (22, 32) suggest an indirect effect of chemicalconstituents because they found that higherconcentrations increased the activity of indige-nous predatory microorganisms. However, de-creasing water temperature tends to limit pred-ator activity (22), and there may be little or noactivity at 0°C.
VOL. 32, 1976
Dow
nloa
ded
from
http
s://j
ourn
als.
asm
.org
/jour
nal/a
em o
n 22
Feb
ruar
y 20
22 b
y 45
.183
.93.
91.

534 DAVENPORT, SPARROW, AND GORDON
TABLE 8. Comparison of chemical parameters in the water from each sample station
Conduc- Concn range (mg/liter)Sample No. of pH tivitystation samples range range Cl- Ca2+ Mg2+ Na+ K+ TC| TOCb NH3-N N03-N
(gmhos)T-900 5 6.7-7.4 220-291 1.7-2.0 42c 14-15 3.8-4.0 2.0-2.1 27-30 15-25 0.01 0.08-0.19T-800 5 7.3-7.7 220-275 1.7-3.4 42 13-15 3.8-4.0 1.9-2.1 27-31 15-26 0.02-0.05 0.10-0.18C-100 5 6.7-7.1 195-240 5.6-7.7 32-34 14-15 5.2-6.0 1.8-2.1 28-32 18-28 0.80-0.97 0.11-0.15
T-700 8 6.6-7.4 225-250 1.9-3.2 42 14-15 4.0 2.0-2.2 28-30 5-25 0.04-0.16 0.08-0.28T-600 8 6.9-7.3 210-261 1.8-3.7 42-46 15-16 4.2-4.4 1.9-2.3 29-34 16-27 0.07-0.16 0.09-0.17T-500 5 6.8-7.4 243-265 2.5-4.8 46 15 4.4-4.6 2.1-2.2 30-32 7-28 0.04-0.12 0.15-0.19T-400 8 6.7-7.2 240-280 2.6-4.3 44-46 15-16 4.4-4.6 2.2-2.3 31-34 17-31 0.06-0.11 0.14-0.22T-300 5 7.0-7.2 246-265 3.0-4.6 46 16 4.6 2.1-2.2 31-34 7-30 0.08-0.12 0.12-0.20T-200 5 7.0-7.3 249-295 2.8-6.9 46-50 16-17 4.6-4.8 2.1-2.2 33-36 17-30 0.07-0.12 0.15-0.22T-100 8 6.8-7.3 245-280 3.0-4.2 46-48 15-17 4.6-5.0 2.1-2.3 32-36 17-30 0.07-0.11 0.13-0.26
a Total carbon.b Total organic carbon.I Same concentration in all samples.
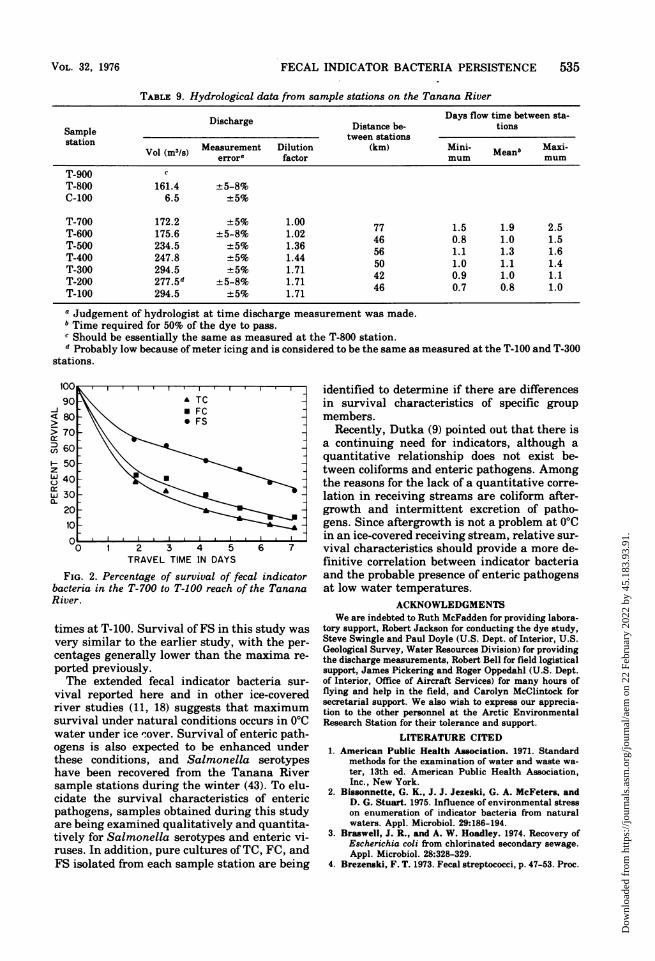
TC, FC, and FS survival. The discharges atstations T-800 and C-100 (Table 9), which moni-tor all effluent sources, indicated that theChena River contributed a very small part ofthe water in the Tanana River. Survival wasexamined in the 317-km reach from T-700downstream through T-100, and the dye studybetween stations showed that the mean flowtime was 7.1 days, with a range of 6.0 to 9.1days. Using the mean TC, FC, and FS densities(Table 1) and the discharge dilution factors (Ta-ble 9), with the densities at T-700 representing100% viability, survival at stations T-600through T-100 were calculated as shown by thefollowing example:[Mean density at T-600 x discharge
dilution factor at T-600
mean density at T-700] x 100
= percentage of survival at T-600
The percentage of survival obtained at eachstation was plotted versus mean flow time toobtain the survival curves (Fig. 2). These dataindicate that the most rapid reduction in num-bers occurred during the first 1.9 days of traveltime, with 38.0% TC, 42.5% FC, and 65.9% FSremaining at T-600. Die-away continued at aslower rate, with 8.4% TC, 15.7% FC, and 32.8%FS remaining viable at the T-100 station after7.1 days. The rapid density decrease followed bya slower decline during subsequent days hasbeen reported in warmer waters (5, 7, 15, 25)and 00C in the Tanana River. The relative sur-vival is TC < FC < FS at all stations, which issubstantiated by the decreasing TC-FC and FC-FS ratios (Table 3). The much higher survivalrate for the FS than for either the TC or FCsupports previous findings (7, 18, 29). Variable
results for the relative TC and FC survivalhave been reported (11, 15, 18, 29) and may becaused by experimental or environmental dif-ferences.Although an initial increase in coliform num-
bers before onset of the rapid decrease has beenobserved at temperatures above the minimumfor coliform growth (5, 25), the 00C temperaturewould have prevented aftergrowth during thisstudy. It has been suggested (2, 25) that thebiphasic survival curves result from two sub-populations, one which does not survive well inthe aquatic environment and one that is morepersistent. A third population appears to existand may be a significant portion of the FCpopulation, but does not grow on selective me-dia (2). In a river, it is difficult to ascertain theactual size and importance of the third subpop-ulation because of the presence of a mixed bac-terial population capable ofgrowth on nonselec-tive media.
Fecal indicator bacteria survival during thisstudy is not directly comparable with the ear-lier Tanana River study (18) because ice surfaceconditions which prohibited aircraft operationmade it necessary to relocate stations T-500, T-400, T-300, and T-100. Also, the dye study indi-cated that the mean flow time from T-700 andT-600 was 1.9 days instead of the 1.2 days previ-ously estimated. However, the overall survivalcurves were similar. On this basis, little differ-ence was found in TC survival although thepercentages in this study indicate a slightlygreater survival than the maximum values re-ported previously. In contrast, the evidencesuggests that the highest survival rate reportedin the prior study significantly underestimatedFC viability. The percentages reported here arehigher than those previously reported by 1.7times at T-600, increasing continuously to 3.7
APPL. ENVIRON. MICROBIOL.
Dow
nloa
ded
from
http
s://j
ourn
als.
asm
.org
/jour
nal/a
em o
n 22
Feb
ruar
y 20
22 b
y 45
.183
.93.
91.
FECAL INDICATOR BACTERIA PERSISTENCE 535
TABLE 9. Hydrological data from sample stations on the Tanana River
Days flow time between sta-Discharge Distance be- tions
stampetion________________ tween stationsVol (m3/s) Measurement Dilution (km) Mini- Meanb Maxi-
error a factor mum mum
T-900T-800 161.4 +5-8%C-100 6.5 ±+5%
T-700 172.2 ±+5% 1.00 77 1.5 1.9 2.5T-600 175.6 +5-8% 1.02 46 0.8 1.0 1.5T-500 234.5 ±5% 1.36 56 1.1 1.3 1.6T-400 247.8 +5% 1.44 50 1.0 1.1 1.4T-300 294.5 ±+5% 1.71 42 0.9 1.0 1.1T-200 277.5d +5-8% 1.71 46 0 0 1.0T-100 294.5 +5% 1.71
a Judgement of hydrologist at time discharge measurement was made.b Time required for 50% of the dye to pass.c Should be essentially the same as measured at the T-800 station.d Probably low because of meter icing and is considered to be the same as measured at the T-100 and T-300
stations.
90-J
< 80> 70
') 60F 50z
u, 40wi 30a-
TRAVEL TIME IN DAYS
FIG. 2. Percentage of survival of fecal indicatorbacteria in the T-700 to T-100 reach of the TananaRiver.
times at T-100. Survival of FS in this study wasvery similar to the earlier study, with the per-centages generally lower than the maxima re-
ported previously.The extended fecal indicator bacteria sur-
vival reported here and in other ice-coveredriver studies (11, 18) suggests that maximumsurvival under natural conditions occurs in 0°Cwater under ice 0over. Survival of enteric path-ogens is also expected to be enhanced underthese conditions, and Salmonella serotypeshave been recovered from the Tanana Riversample stations during the winter (43). To elu-cidate the survival characteristics of entericpathogens, samples obtained during this studyare being examined qualitatively and quantita-tively for Salmonella serotypes and enteric vi-ruses. In addition, pure cultures of TC, FC, andFS isolated from each sample station are being
identified to determine if there are differencesin survival characteristics of specific groupmembers.
Recently, Dutka (9) pointed out that there isa continuing need for indicators, although aquantitative relationship does not exist be-tween coliforms and enteric pathogens. Amongthe reasons for the lack of a quantitative corre-lation in receiving streams are coliform after-growth and intermittent excretion of patho-gens. Since aftergrowth is not a problem at 0°Cin an ice-covered receiving stream, relative sur-vival characteristics should provide a more de-finitive correlation between indicator bacteriaand the probable presence of enteric pathogensat low water temperatures.
ACKNOWLEDGMENTSWe are indebted to Ruth McFadden for providing labora-
tory support, Robert Jackson for conducting the dye study,Steve Swingle and Paul Doyle (U.S. Dept. of Interior, U.S.Geological Survey, Water Resources Division) for providingthe discharge measurements, Robert Bell for field logisticalsupport, James Pickering and Roger Oppedahl (U.S. Dept.of Interior, Office of Aircraft Services) for many hours offlying and help in the field, and Carolyn McClintock forsecretarial support. We also wish to express our apprecia-tion to the other personnel at the Arctic EnvironmentalResearch Station for their tolerance and support.
LITERATURE CITED1. American Public Health Association. 1971. Standard
methods for the examination of water and waste wa-ter, 13th ed. American Public Health Association,Inc., New York.
2. Bissonnette, G. K., J. J. Jezeski, G. A. McFeters, andD. G. Stuart. 1975. Influence of environmental stresson enumeration of indicator bacteria from naturalwaters. Appl. Microbiol. 29:186-194.
3. Braswell, J. R., and A. W. Hoadley. 1974. Recovery ofEscherichia coli from chlorinated secondary sewage.Appl. Microbiol. 28:328-329.
4. Brezenski, F. T. 1973. Fecal streptococci, p. 47-53. Proc.
VOL. 32, 1976
Dow
nloa
ded
from
http
s://j
ourn
als.
asm
.org
/jour
nal/a
em o
n 22
Feb
ruar
y 20
22 b
y 45
.183
.93.
91.
536 DAVENPORT, SPARROW, AND GORDON
First Microbiology Seminar on Standardization ofMethods, San Francisco, Calif. EPA-R4-73-022, U.S.Environmental Protection Agency, Washington,D.C.
5. Butterfield, C. T. 1933. Observations on changes innumbers of bacteria in polluted water. Sewage WorksJ. 5:600-622.
6. Casper, L. A., R. C. Gordon, and E. W. Mueller. 1973.Design considerations for sampling programs in re-
mote areas. Working Paper No. 23. U.S. Environ-mental Protection Agency, College, Alaska.
7. Cohen, J., and H. I. Shuval. 1973. Coliforms, fecalcoliforms, and fecal streptococci as indicators of waterpollution. Water Air Soil Pollut. 2:85-95.
8. Daoust, R. A., and W. Litsky. 1975. Pfizer selectiveEnterococcus agar overlay method for the enumera-tion of fecal streptococci by membrane filtration.Appl. Microbiol. 29:584-589.
9. Dutka, B. J. 1973. Coliforms are an inadequate index ofwater quality. J. Environ. Health 36:39-46.
10. Dutka, B. J., M. J. Jackson, and J. B. Bell. 1974.Comparison of autoclave and ethylene oxide-steri-lized membrane filters used in water quality studies.Appl. Microbiol. 28:474-480.
11. Gallagher, T. P., and D. F. Spino. 1968. The signifi-cance of numbers of coliform bacteria as an indicatorof enteric pathogens. Water Res. 2:169-175.
12. Geldreich, E. E. 1970. Applying bacteriological param-
eters to recreational water quality. J. Am. WaterWorks Assoc. 62:113-120.
13. Geldreich, E. E. 1973. The use and abuse of fecal strep-tococci in water quality measurements, p. 54-68.Proc. First Microbiology Seminar on Standardizationof Methods, San Francisco, Calif. EPA-R4-73-022,U.S. Environmental Protection Agency, Washington,D.C.
14. Geldreich, E. E. 1974. Microbiology of water. J. WaterPollut. Control Fed. 46:1355-1372.
15. Geldreich, E. E., L. C. Best, B. A. Kenner, and D. J.Van Donsel. 1968. The bacteriological aspects ofstormwater pollution. J. Water Pollut. Control Fed.40:1861-1872.
16. Geldreich, E. E., R. H. Bordner, C. B. Huff, H. F.Clark, and P. W. Kabler. 1962. Type distribution ofcoliform bacteria in the feces of warm-blooded ani-mals. J. Water Pollut. Control Fed. 34:295-301.
17. Glantz, P. J. 1968. Microbiologic and Escherichia coliserologic tracing of microbial pollution. Researchpubl. no. 56. The Pennsylvania State University,University Park, Pa.
18. Gordon, R. C. 1972. Winter survival of fecal indicatorbacteria in a subarctic Alaskan river. EPA-R2-72-013.U.S. Environmental Protection Agency, Corvallis,Ore.
19. Hoadley, A. W., and C. M. Cheng. 1974. The recovery ofindicator bacteria on selective media. J. Appl. Bacte-riol. 37:45-57.
20. Hufham, J. B. 1974. Evaluating the membrane fecalcoliform test by using Escherichia coli as the indica-tor organism. Appl. Microbiol. 27:771-776.
21. Johnstone, D. L., and A. M. Kubinski. 1973. Survival ofintestinal bacteria in oligotrophic waters. Report no.
14. Washington State University, Pullman, Wash.22. Johnstone, D. L., and A. M. Kubinski. 1974. Survival of
Escherichia coli in oligotrophic waters. Circular no.
51. Washington State University, Pullman, Wash.23. Kenner, B. A., H. F. Clark, and P. W. Kabler. 1960.
Fecal streptococci II. Quantification of streptococci infeces. Am. J. Public Health 50:1553-1559.
24. Kenner, B. A., H. F. Clark, and P. W. Kabler. 1961.Fecal streptococci. I. Cultivation and enumeration of
streptococci in surface waters. Appl. Microbiol. 9:16-20.
25. Kittrell, F. W., and S. A. Furfari. 1963. Observations ofcoliform bacteria in streams. J. Water Pollut. ControlFed. 35:1361-1385.
26. Lin, S. 1973. Evaluation of coliform tests for chlorinatedsecondary effluents. J. Water Pollut. Control Fed.45:498-506.
27. Lin, S., R. L. Evans, and D. B. Beuscher. 1974. Bacte-riological assessments of Spoon River water quality.Appl. Microbiol. 28:288-297.
28. McCarthy, J. A., J. E. Delaney, and R. J. Grasso. 1961.Measuring coliforms in water. Water Sewage Works108:238-243.
29. McFeters, G. A., G. K. Bissonnette, J. J. Jezeski, C. A.Thomson, and D. G. Stuart. 1974. Comparative sur-vival of indicator bacteria and enteric pathogens inwell water. Appl. Microbiol. 27:823-829.
30. McFeters, G. A., and D. G. Stuart. 1972. Survival ofcoliform bacteria in natural waters: field and labora-tory studies with membrane-filter chambers. Appl.Microbiol. 24:805-811.
31. Mack, W. N. 1973. Investigations into the occurrence ofcoliform organisms from pristine streams. OWRRproject no. A-068-MICH. Michigan State University,East Lansing, Mich.
32. Mitchell, R. 1972. Ecological control of microbial imbal-ances, p. 273-288. In R. Mitchell (ed.), Water pollu-tion microbiology. John Wiley & Sons, Inc., NewYork.
33. Presswood, W. G., and L. R. Brown. 1973. Comparisonof Gelman and Millipore membrane filters for enu-merating fecal coliform bacteria. Appl. Microbiol.26:332-336.
34. Rose, R. E., E. E. Geldreich, and W. Litsky. 1975.Improved membrane filter method for fecal coliformanalysis. Appl. Microbiol. 29:532-536.
35. Ruediger, G. F. 1911. Studies on the self-purification ofstreams. J. Am. Public Health Assoc. 1:411-417.
36. Schaeffer, D. J., M. C. Long, and K. G. Janardan. 1974.Statistical analysis of the recovery of coliform orga-nisms on Gelman and Millipore membrane filters.Appl. Microbiol. 28:605-607.
37. Schallock, E. W., and F. B. Lotspeich. 1974. Low win-ter dissolved oxygen in some Alaskan rivers. EPA-660/3-74-008. U.S. Environmental Protection Agency,Corvallis, Ore.
38. Schiff, L. J., S. M. Morrison, and J. V. Mayeux. 1970.Synergistic false-positive coliform reaction on M-EndoMF medium. Appl. Microbiol. 20:778-781.
39. Shaw, M. K., A. G. Marr, and J. L. Ingraham. 1971.Determination of minimal temperature for growth ofEscherichia coli. J. Bacteriol. 105:683-684.
40. U.S. Environmental Protection Agency. 1971. Methodsfor chemical analysis of water and wastes. U.S. Envi-ronmental Protection Agency, Cincinnati, Ohio.
41. U.S. Environmental Protection Agency. 1974. Currentpractices in water microbiology. EPA-430/1-74-009.U.S. Environmental Protection Agency, Washington,D.C.
42. Van Donsel, D. J., E. E. Geldreich, and N. A. Clarke.1967. Seasonal variations in survival of indicator bac-teria in soil and their contribution to storm-waterpollution. Appl. Microbiol. 15:1362-1370.
43. Van Donsel, D. J., R. C. Gordon, and C. V. Davenport.1974. Preliminary study-comparative winter sur-vival of fecal bacteria in a subarctic river. Workingpaper no. 28. U.S. Environmental Protection Agency,College, Alaska.
44. Velz, C. J. 1970. Applied stream sanitation. John Wiley& Sons, Inc., New York.
APPL. ENVIRON. MICROBIOL.
Dow
nloa
ded
from
http
s://j
ourn
als.
asm
.org
/jour
nal/a
em o
n 22
Feb
ruar
y 20
22 b
y 45
.183
.93.
91.