February - US EPA
410
AP-42 Section Number: Reference Number: Title: 1 3 I .6 Lime and Cement Industry - Category Report, Volume I1 EPA-60017-87-007 USEPA February 1987 Source
Transcript of February - US EPA

AP-42 Section Number:
Reference Number:
Title:
1
3
I .6
Lime and Cement Industry - Category Report, Volume I1
EPA-60017-87-007
USEPA
February 1987
Source
EPA
Text Box
Note: This is a reference cited in AP 42, Compilation of Air Pollutant Emission Factors, Volume I Stationary Point and Area Sources. AP42 is located on the EPA web site at www.epa.gov/ttn/chief/ap42/ The file name refers to the reference number, the AP42 chapter and section. The file name "ref02_c01s02.pdf" would mean the reference is from AP42 chapter 1 section 2. The reference may be from a previous version of the section and no longer cited. The primary source should always be checked.

(i' United States Environmental Protection Agency
GEPA Research and Development
- AP-V Section - Reference -~ I Report Sect. __
EPA-6OOI7-r Reference - i-
F e b r u a r y 19f
L I M E AND CEMENT INDUSTRY
PARTICULATE EMISSIONS:
SOURCE C A T E G O R Y R E P O R T
Volume 11. C e m e n t I n d u s t r y
Prepared for
.Office of A i r Qual i ty P lann ing and S t a n d a r d s
Prepared by Air and Energy Engineering Research Labor at or y Research Triangle Park NC 2771 1

RESEARCH REPORTING SERIES
Research reports of the Office of Research and Development, US. Environmental Protection Agency, have been grouped into nine series. These nine broad cate- gories were established to facilitate further development and application of en- vironmental technology. Elimination of traditional grouping was consciousiy planned to foster technology transfer and a maximum interface In relared iieids. The nine series are:
1. Environmental Health Effects Research
2. Environmental Protection Technology
3. Ecological Research
4. Environmental Monitoring
5. Socioeconomic Environmental Studies
6. Scientific and Technical Assessment Reports (STAR)
7. Interagency Energy-Environment Research and Development
8. "Special" Reports
9. Miscellaneous Reports
This report has been assigned to the INTERAGENCY ENERGY-ENVIRONMENT RESEARCH AND DEVELOPMENT series. Reports in this series result from the effort funded under the 17-agency Federal EnergyEnvironment Research and Development Prcigram. These studios rele!e to EPAs mission to protect the public health and welfare from adverse effects of pollutants associated with energy sys- tems. The goal of the Program is to assure the rapid development of domestic energy supplies in an environmentally-compatible manner by providing the nec- essary environmental data and control technology. Investigations include analy- ses of the transport of energy-related pollutants and their health and ecological effects; assessments of, and development of, control technologies for energy systems; and integrated assessments of a wide range of energy-related environ- mental issues.
EPA REVIEW NOTICE
This report has been reviewed by the participating Federal Agencies. and approved for publication. Approval does not signify that the contents necessarily reflect the views and policies of the Government. nor does mention of trade names or commercial products constitute endorsement or recommendation for use.
This document is available to the public through the National Technical Informa- tion Service, Springfield, Virginia 22161.

EPA- 600 17- 87-007 February 1987
LIME AND CEMENT INDUSTRY PARTICULATE EMISSIONS: SOURCE CATEGORY REPORT
Volume 11. Cement Industry
. John S. Kinsey Midwest Research Institute
425 Volker Boulevard Kansas City, Missouri 64110
Contract 68-02-3891 Work Assignment No. 9
EPA Project Officer: Dale L. Earmon Air and Energy Engineering Research Laboratory Research Triangle Park, North Carolina 27711
Prepared for U.S. Environmental Protection Agency Office of Research and Development
Washington. DC 20460

ABSTRACT
The ob jec t ive of t h i s s t u d y was t o develop p a r t i c u l a t e emission f a c t o r s based on cu to f f s i z e f o r i nha lab le p a r t i c l e s f o r the cement industry. A f t e r a review of a v a i l a b l e information cha rac t e r i z ing pa r t i c - u l a t e emissions from cement p l a n t s , t h e d a t a were suuuuarized and r a t ed i n terms of r e l i a b i l i t y . Size s p e c i f i c emission f a c t o r s were developed from these d a t a for the major processes used i n the manufacture of cement. d e t a i l e d process d e s c r i p t i o n was presented with emphasis on f a c t o r s a f f e c t i n g t h e genera t ion of emissions. A replacement f o r Sect ions 8.6 (Port land Cement Manufacturing) of EPA r e p o r t AP-42, A Compilation.of A i r Po l lu t an t E m i s s i o n s Factors . was prepared, containing t h e s i z e s p e c i f i c emission f a c t o r s developed during t h i s program.
A
ii
I

. .
CONTENTS
PacJ-e
Abstract . . . . . . . . . . . . . . . . . . . . . . . . . . . . . . . . i i
1.0 Introduction . . . . . . . . . . . . : . . . . . . . . . . . 1-1 2.0 Industry Description . . . . . . . . . . . . . . . . . . . 2-1
2 .1 Introduction and industry overview . . . . . . . 2 - 1 2.2 Raw material . . . . . . . . . . . . . . . . : . . 2-11 2.3 Process description . . . . . . . . . . . . . . . 2-11 2.4 Control technology . . . . . . . . . . . . . . . 2-24
3.0 General Data Review and Analysis Procedures . . . . . . . . 3-1 3 . 1 Literature search and screening . . . . . . . . . 3-1
3.3 Particle size determination . . . . . . . . . . . 3-4 3.4 Particle size data analysis methodology . . . . . 3-12 -3.5 Emission factor quality rating system . . . . . . 3-18
3 . 2 Emission d a t a rpia1it.y r a t i n n system . . . . . . . 3-2
4.0 Particulate Emission Factor Development . . . . . . . . . . 4-1 4 .1 Review of specific data sets . . . . . . . . . . 4 - 1 4 .2 Results of data analysis . . . . . . . . . . . . 4-37 4.3 Development of candidate emission factors . . . . 4-51 4.4 Emission factor quality rating . . . . . . . . . . 4-65
5.0 Proposed AP-42 Section 8.6 . . . . . . . . . . . . . . . . 5-1
Appendices
A .
B . c . D .
E .
Excerpts from reference documents used in the development
Uncontrolled total particulate emission factor calcula-
iota1 particulate emission factor calculations for
Total particulate emission factor calculations for
Computer printouts of spline analyses for partjcle size
of particulate emission factors . . . . . . . . . . . . . tions . . . . . . . . . . . . . . . . . . . . . . . . . . B-1
controlled kilns . . . . . . . . . . . . . . . . . . . .
A-1
C-1
D-1
distributions . . . . . . . . . . . . . . . . . . . . . . E- 1
controlled coolers, mills. and crushing/screening . . . .
iii

FIGURES
.... Geographical distribution of portland cement plants in
the United States . . . . . . . . . . . . . . . . . . . . 2-4
Number
2-1
2-2
2- 3
3-1
3-2
3-3
4-1
4-2
8.6-1
8.6-2
8.6-3
Flow diagram for dry process . . . . . . . . . . . . Flow diagram for wet process . . . . . . . . . . . . Example output of "JSKPRG" . . . . . . . . . . . . . Example output of "JSKRAW" . . . . . . . . . . . . . Example output of "JSKLOG" . . . . . . . . . . . . . Size specific emission factors for cement kilns . . . Size specific emission factors for clinker coolers . Basic flow diagram of portland cement manufacturing
process . . . . . . . . . . . . . . . . . . . . . . Size specific emission factors for.cement kilns . . . Size specific emission factors for clinker coolers .
. . . 2-14
. . . 2-15
. . . 3-15
. . . 3-16
. . . 3-17
. . . 4-63
. . . 4-64
~ . . 5-3 ~
. . . 5-0
. . . 5-9
iv

I
I Number
2-1 2-2 2-3 2-4 2-5 2- 6
2-7 2-8
3-1 3-2 3- 3 4- 1 4-2
4-3
4-4
4-5
4- 6
4-7
4-8
4- 9
4- 10
4-11
4-12
TABLES
1984 Portland Cement Shipments from Plants in the U.S. . 1984 Cement Use by Customer Category . . . . . . . . . . Portland Cement Producers (USA). . . . . . . . . . . . . 1984 Clinker Production by Type of Fuel. . . . . . . . . Raw Materials Used in Portland Cement (1984) . . . . . . Typical Particle Size Distribution for Type I1 Portland
Cement . . . . . . . . . . . . . . . . . . . . . . . . Potential Sources of Air Pollutants in Cement Plants . . Distribution of Kiln Dust Collection Systems in Wet and
Dry Process Cement Plants. . . . . . . . . . . . . . . Equations Used for Particle Size Conversions . . . . . . Guide to Particle Size Measurement . . . . . . . . . . . Comparison of Computer Programs. . . . . . . . . . . . . Summarv of NSPS Data Collected bv EPA. . . . . . . . . .
& . 2-2 . 2-3 . . 2-5 . 2-10 . 2-12
. 2-25
. 2-26
. 2-28
. 3-7
. 3-10
. 3-13
. 4-3 S u m m a 6 of Particle Size Data f& Reference 20 -
ESP Inlet. . . . . . . . . . . . . . . . . . . . . . . . 4-8 Summary of Particle Size Data for Reference 21 -
Uncontrolled Clinker Cooler (Brink Impactor - August Tests) . . . . . . . . . . . . . . . . . . . . . . . . : 4-10
Summary of Particle Size Data for Reference 21 - Uncontrolled Clinker Cooler (Andersen Impactor Data - August Tests). . . . . . . . . . . . . . . . . . . . . . 4-11
Summary o f Particle Size Data for Reference 21 - Uncontrolled Clinker Cooler (Andersen Impactor Data - November Tests). . . . . . . . . . . . . . . . . . . . . 4-12
Summary of Particle Size Data for Reference 21 - Clinker Cooler Controlled by Gravel Bed Filter (August Test Series). . . . . . . . . . . . . . . . . . . . . . . . . 4-13
Summary of Particle Size Data for Reference 21 - Clinker Cooler Controlled by Gravel Bed Filter (November Test Series). . . . . . . . . . . . . . . . . . . . . . . . . 4-14
Summary of Particle Size Data for Reference 26 - Locations 3 and 9 (Brink Data) . . . . . . . . . . . .. . 4-17
Summary of Particle Size Data for Reference 26 - Location 9 (SASS Data) . . . . . . . . . . . . . . . . . 4-19
Summary of Particle Size Data for Reference 27 - Dry Process Kiln Controlled by a Baghouse Collector. . . . . 4-21
Summary of Particle Size Data for Reference 42 - No. 5 Kiln Baghouse Inlet. . . . . . . . . . . . . . . . . . . 4-28
Summary of Particle Size Data for Reference 42 - No. 5 Kiln Baghouse Outlet . . . . . . . . . . . . . . . . . . 4-29
V

TABLES (Concluded)
Number
4-13
4-14
4-15
4-16
4-17
4-18
4-19
4-20
4-21
4-22
4-23
4-24
4-25
4-26
4-27
4-28
4-29
4-30
4-31
4-32
4-33 8.6-1 8.6-2
8.6-3
8.6-4
Summary of Particle Size Data for Reference 46 - Kiln No. 2 Electrostatic Precipitator Inlet . . . . . . . . .
Summary of Particle Size Data for Reference 46 - Kiln No. 2 Electrostatic Precipitator Outlet. . . . . . . . .
Summary nf Uncontrolled Total Particulate Emission Factors for Cement Plants. . . . . . . . . . . . . . . .
Summary of Controlled Total Particulate Emission Factors for Cement Plants. . . . . . . . . . . . . . . . . . . .
Calculated Particle Size Distributions for Reference 20 - ESP Inlet.'. . . . . . . . . . . . . . . . . . . . . . .
Calculated Particle Size Distributions and Uncontrolled Emission Factors for Reference 21. . . . . . . . . . . .
Calculated Particle Size Distributions and Controlled Emission Factors for Reference 21. . . . . . . . . . . .
Calculated Particle Size Distributions and Emission Factors for Reference 26 . . . . . . . . . . . . . . . .
Calculated Particle Size Distributions and Controlled Emission Factors for Reference 27. . . . . . . . . . . .
Calculated Emission Factors for Reference 42 - No. 5 Kiln Baghouse Inlet. . . . . . . . . . . . . . . . . . .
Calculated Emission Factors for Reference 42 - No. 5 Kiln Baghouse Outlet . . . . . . . . . . . . . . . . . .
Calculated Emission Factors for Reference 46 - Kiln No. 2 Electrostatic Precipitator Inlet . . . . . . . . .
Calculated Emission Factors for Reference 46 - Kiln No. 2 Electrostatic Precipitator Outlet. . . . . . . . .
Summary of Candidate Emission Factors for Total Particulate Matter . . . . . . . . . . . . . . . . . . .
Candidate Size-Specific Emission Factors for Uncontrolled Wet Process Cement Kilns . . . . . . . . . . . . . . . .
Candidate Size-Specific Emission Factors for Uncontrolled Dry Process Cement Kilns . . . . . . . . . . . . . . . .
Candidate Size-Specific Emission Factors for Wet Process Kilns Controlled by Electrostatic Precipitators. . . . .
Candidate Size-Specific Emission Factors for Dry Process Cement Kilns Controlled by Baghouse Collectors . . . . .
Candidate Size-Specific Emission Factors for Clinker Coolers Controlled by a Gravel Bed Filter. . . . . . . .
Summary of Candidate Size-Specific Emission Factors for Cement Kilns . . . . . . . . . . . . . . . . . . . . . .
Summary of Candidate Emission Factors for Clinker Coolers. Uncontrolled Emission Factors for Cement Manufacturing . . Controlled Particulate Emission Factors for Cement
Manufacturing. . . . . . . . . . . . . . . . . . . . . . Size Specific Particulate Emission Factors for cement
Ki 1 ns . . . . . . . . . . . . . . . . . . . . . . . . . Size SDecific Emission Factors for Clinker Coolers. . . .
4-32
4-33
4-39
4-40
4-42
4-43
4-44
4-45
4-46
4-47
4-46
4-49
4-50
4-53
4-56
4-57
4-58
4-59
4-60
4-61 4-62 5-5
5-6
5-7 5-10
vi

SECTION 1.0
INTRODUCTION
The U.S. Environmental Protection Agency (EPA) is in the process of reviewing the pertinent technical criteria and data bases to determine whether a revised National Ambient Air Quality Standard (NAAQS) for par- ticulate matter based on particle size is warranted. a standard, the Clean Air Act requires that each state develop and submit State Implementation Plan (SIP) revisions which outline how they will at- tain and maintain the standard Any re?":cicns to t h e S I P %=:!d necc;;itate
the collection and use of information related to size-selective particulate emissions from new and existing sources.
Upon adoption of such
I
Since 1972 the document entitled "Compilation of Air Pollutant' Emission Factors" (AP-42) has been published by the EPA. This document contains a . compendium o f , emission factor reports for the most significant emission source categories. source categories and for updating existing emission factors as more infor- mation about sources and the control of emissions has become available. Up to this point, however, little information has been provided in AP-42 with regard to particle size characteristics of particulate emissions. To ad- dress the requirement for size-specific emission factors, the EPA is con- ducting research to characterize emissions i n the inhalable particulate (IP) size range for a variety of industrial sources.
Supplements to AP-42 have been published both for new
This report contains the existing particulate emission factor data base for portland cement plants, evaluates the available data, and provides a revised AP-42 Section (8.6) for this industry. Included in the revised
1- 1

Sect ion 8.6 a re t h e bes t a v a i l a b l e p a r t i c u l a t e emission f a c t o r s f o r p o r t -
l a n d cement p lan ts .
Th is r e p o r t i s organized by s e c t i o n as fo l lows:
Sec t ion 2.0 - I n d u s t r y D e s c r i p t i o n Sec t ion 3.0 - General Data Review and Ana lys is Procedures
Sec t ion 4.0 - P a r t i c u l a t e Emission Fac tor Development Sec t ion 5.0 - Proposed AP-42 Sect ion 8.6
The references a r e l i s t e d a t t h e end o f each sec t ion .
1- 2

SECTION 2.0
INDUSTRY DESCRIPTION
2.1 INTRODUCTION AND INDUSTRY OVERVIEW
Hydraulic cement is the basic binding agent in concrete and masonry construction. There are several types of cement in use: portland cement; portland-pozzolan cement; high alumina cement; special or corrosion-resisting cements and mortars; expansive hydraulic cement; masonry cement; and slag cements. *
Roughly 95% of the cement produced in the United States is portland cement. Portland cement is manufactured by the high .temperature burning o f calcareous material (e.g., limestone, oyster shells), argillaceous mate- rial (e.g., clay), siliceous material (e.g., sand, shale), and ferriferous materials to produce clinker. According to ASTM Specification C 219-84, portland cement is "a hydraulic cement produced by pulverizing portland ce- ment clinker and usually containing calcium sulfate."
There are five basic types of portland cement. Type I, which is pro- duced in the largest quantities, is used in general construction. Type I1 is formulated for moderate heat-of-hydration and moderate sulfate-resisting applications. Type I11 is high-early-strength (HES) cement. Type IV cement has a 15 to 35% lower heat of hydration than other types and has not been produced in the United States for about 20 years. Finally, Type V is highly sul fate-resi stant.
* None Produced since 1972.'
2-1

. .
Air-entraining agents (e.g., resinous materials) can be added to port- land cements in minute quantities. Air-entrainment increases the resistance of hardened concrete to scaling caused by alternate freezing and thawing and the use of de-icing salts. IIA, etc.l
Air entraining cements are classified as Type IA,
According to the U.S. Bureau of Mines, 70.9 million metric tons (77.9 million short tons) of portland and masonary cement were produced in 1984.2 The 1984 shipments of the various types of portland cement are shown in Table 2.L2 used. Special cements such as pozzolan, high alumina, corrosion-resisting, and controlled cements are manufactured i n relatively small amounts.
It can be seen that Types I and I1 are by far the most commonly
TABLE 2-1. 1984 PORTLAND CEMENT SHIPMENTS FROM PLANTS IN THE U.S.2
Quanti tya 103 Metric
lo3 Short tons tons (Mg)
General use and moderate heat (Types I and 11) 70,648 64,290
Hi g h- earl y- j treng t h (Type I I I ) 2,280 Sulfate-resisting (Type V) 479 436 Oil well 2,273 2,068 White 278 253
Expansive 50 46 Miscellaneous 839 763
Total or average' 77,881 70,872
2,505
Portland slag and portland pozzolan 808 735
Includes Puerto Rico. a
Includes waterproof, low-heat (Type IV), and regulated fast-setting cement.
Data may not add to totals shown due to independent rounding. C
2-2 I

V i r t u a l l y a l l p o r t l a n d cement i s used i n concrete f o r cons t ruc t i on . t ; Producers o f ready-mix concrete are the pr imary customers and the remainder i s purchased by concrete products manufacturers, highway con t rac to rs , b u i 1 d- i n g m a t e r i a l s dealers and government agencies. tomers and t h e i r r e l a t i v e share o f t o t a l cement consumption.
Table 2-2 l i s t s these CUS-
TABLE 2-2. 1984 CEMENT USE BY CUSTOMER CATEGORY2
Percent of Customer t o t a l purchases
Ready mixed concrete producers Concrete products manufacturers B u i l d i n g m a t e r i a l dealers Highway con t rac to rs A l l o the rs
69.3 12.8
5.7 3.9 8.3
100.0
Source: U.S. Bureau o f Mines, Minera ls Yearbook 1984, Vol. I, U.S. Government P r i n t i n g O f f i c e , Washington, D.C., 1985.
Dur ing 1982, t h e r e were 147 p o r t l a n d cement p l a n t s ope ra t i ng i n t h e
Uni ted state^.^ However, a number o f these p l a n t s have now been shut down
and thus t h i s f i g u r e may n o t repres'ent t h e i n d u s t r y a t t h e present t ime.
The geographical d i s t r i b u t i o n o f t h e va r ious p l a n t s i n ope ra t i ng d u r i n g 1982. are shown i n F igure 2 -1 w i t h the exact l o c a t i o n , type o f process, and pro-
duc t i on capac i t y l i s t e d i n Table 2-3.3 d ry processes are u t i l i z e d f o r producing p o r t l a n d cement nationwide.
As shown by Table 2-3, bo th wet and
According t o t h e U.S. Bureau o f Mines (BOM), a combination o f coal and
The amount o f c l i n k e r produced i n 1984, by f u e l type, i s
n a t u r a l gas was the type o f f u e l most used by U.S. p l a n t s i n 1984 t o produce
cement c l i n k e r . 2 shown i n Table 2-4 u s i n g BOM s t a t i s t i c s . *

2-4
Y- O
m
n m m
V
r
L 0 W a
.r
W L a m .- u

TABLE 2-3. PORTLAND CEMENT PRODUCERS (USA)a
Location Map index
No. State (Fiaure 2-11 Ci tv Plant
Type of, Production capacitv short lo1 metric
tons
Alabama 1 Ei rmingham Allied Products X 360 327 2 Calera Blue Circle Cement X 686 622 3 Demopol i s Citadel Cement X 750 680 4 Leeds Lehigh Portland X 463 420
Cement 5 Ragland National Cement 6 Theodore Ideal Basic Ind
X EO0 726 X 1,500 1,361
Arizona 7 Clarkdale Phoenix Cement Co. X 542 492 E ~ i ' l I i to California Portland X 1,700 1.542
Cement
Arkansas 9 Foreman Arkansas Cement x 850 771 . i 10 Okay Ideal Basic Ind. X 395 358
Ca 1 1 forn 1 a 11 Col ton California Portland X 1,080 980
12 Davenport Lone Star Ind. X 755 703 13 Lebec General Portland X ' 610 553 14 Lucerne Valley Kaiser Cement Corp. X X 1,015 1,500
52; i.56i 15 Mojave California Portland X 1,300 1,179
16 Mono1 i th Monolith Portland X 500 454
17 Oro Grande Riverside Cement . x 1,149 1,042 18 Permanente Kaiser Cement Corp. X 1,600 1,451 19 Redding Genstar Cement & Lime X 600 544 20 Riverside Riverside Cement X 838 760 21 San Andreas Genstar Cement & Lime X 630 571 22 Victorville Southwestern Port- x x 1,203 1.091
tolorado 23 Florence Ideal Basic Ind. X 885 803 24 Fort Collins Ideal Basic Ind. X 460 417 ' 25 Lyons Southwestern X 470 426
Cement
Cement
Cement
land Cement
Portland Cement
F 1 ori da 26 Erooksville Florida Mining & X 1,200 l.08e: Materials
27 Hialeah Lone Star Ind. X 1,200 1,088 28 Miami General Portland X 1,200 1,088 28A Miami Rinker Materials X 580 526 29 Palmetto Nat. Portland Cement NA MA -- Grinding only --
o f Florida 30 Tampa General Portland X 660 599
Georgia 31 Atlanta Blue Circle Cement X 630 571 32 C 1 i nc hf i el d Medusa Cement ,x x 790 717
Rawai I 33 Ewa Beach Oahu Cypress Hawaiian Cement X 280 254 34 Waianae, Oahu Kaiser Cement X 320 290
(Continued)
2-5

TABLE 2-3. ( con t inued)
L o c a t i o n Map index
No. S t a t e (F igu re 2-1 ) Ci ty P l a n t
Type o f P roduc t i on c a p a c i t y process 103 short 10' m e t r i c
Wet 0 r y tons tons
Idaho 35 lnkom Oregon P o r t l a n d Cement X 210 191
n 1 i n o i s 36 Oixon Lone S t a r I n c . X 600 544
38 La S a l l e I l l i n o i s Cement Co. ' X 400 363
37 Joppa M i s s o u r i P o r t l a n d X 1,314 1,192
39 Ogelsby Lone S t a r I nd . X 510 463
l n d i a n a 40 t r e e n c a s t l e Lone S t a r I nd . X 7 52 682 4 1 Logansport ' L o u i s v i l l e Cement X 460 417 42 M i t c h e l l Lehigh P o r t l a n d Cement X 725 658 43 Speed L o u i s v i l l e Cement X 1,260 1,143
l o u a . 44 D a v e n p o r t Davenport Cement X 850 771 45 Des Moines Monarch Cement X 300 272 46 Mason Ci ty Lehigh P o r t l a n d Cement X 750 680 46A Mason City Nor thwestern States X 1.150 1,043
P o r t l a n d Cement
Kansas 47 Bonner Spr ings Lone S t a r I nd . X 451 409 48 Chanute Ash Grove Cement X 516 468 49 Freedonia General P o r t l a n d Inc . X 407 369 50 Humboldt Monarch Cement X 600 544 5 1 Independence Lehigh P o r t l a n d X 380 345
Kentucky 52 Kosmosdale Kosmos Cement X 670 608
Lou is iana 53 New Or leans Lone S t a r I n d . Y 750 680
Reme 54 Thomaston M a r t i n M a r i e t t a X 480 455
Mary land 55 Hagerstown Lone S ta r I nd . X 475 431 56 Lime K i l n Coplay Cement X 1,100 998
Mich igan 58 Alpena N a t i o n a l Gypsum X 2,450 2,222 59 Char levo ix Medusa Cement x 1,300 1,179 60 O e t r o i t Peer less Cement X 600 544 6 1 Dundee Oundee Cement X 1,050 952 62 E s s e x v i l l e Aetna Cement MA NA -- G r i n d i n g o n l y - - 63 Wyandotte Wyandotte Cement NA NA -- G r i n d i n g o n l y --
Cement
57 Union B r i d g e Lehigh P o r t l a n d X 950 ' ' 862 Cement
M i s s i s s i p p i 64 A r t e r i a Texas Ind. X 480 435
66 C l a r k s v i l l e Dundee Cement X ~ 4 n n . i ~ n n M i s s o u r i 65 Cape Girardeau Lone S t a r l n d . X 1,000 907
. . _. _ _ -,- - 67 Festus R ive r Cement X 1,200 1,088 68 Hannibal Cont i nenta 1 Cemen t X 600 544 69 Independence M i s s o u r i P o r t l a n d X 564 512
Montana 70 Montana Ci ty Ka ise r Cement Corp. X 320 290 7 1 T r i d e n t I d e a l Bas ic Inc. X 330 299
(Continued)
2-6

. . .
TABLE 2-3. (continued)
Location Map index
No. State (Figure 2-1) City Plant Wet 0ry tons tons
Nebraska 72 Louisville Ash Grove Cement Co. X 790 717 73 Superior Ideal Basic Inc. X 235 213
Nevada 74 Fern 1 ey Nevada Cement Co. x 400 363
New Mexico 75 Ti jeras Ideal Basic Ind. X 505 450
New York 76 Catski 1 1 Lone Star Ind. X 580 526 77 Cementon Lehigh Portland X 550 499
Cement
land Cement,
land Cement
70 Glens Falls Glens Falls Port- x 450 408
79 Howes Cave Glens Falls Port- NA NA -- Grinding only -- 80 Ravena Atlantic Cement . X 1.500 1,361
North Carolina 81 Castle Hayne Ideal Basic Ind. X 550 499
Ohio 82 Fairborn Southwestern Port- X X 728 663
83 rn!dd!shrznch <..L *CIIICII. n jir0 27'2 Paulding General Portland X 554 503
05 Superior Lone Star Ind. X 275 249 84
86 Sylvania SHE Cement X 280 254 87 Zanesville SME Cement X 800 726
land Cement cuc ,----...
Oklahoma 00 Ada Ideal Basic Ind. X 610 553 89 Pryor Lone Star Ind. X 725 658 90 Tulsa Blue Circle Cement X 630 571
Oregon 91 Durkee Oregon Portland Cement X 500 454 92 Lake Oswego Oregon Portland Cement X 418 379
Pennsylvania 93 Bath Keystone Portland X 600 544
94 Cementon General Portland X 790 717 95 Egypt Coplay Cement NA NA -- Grinding only -- 96 Evansville National Gypsum X 875 794 97 Nazareth Coplay Cement Co. X 1,000 907 97A Nazareth Lonestar Ind. X 658 597 98 Northampton Martin Marietta X
99 Pittsburgh Lonestar Ind. X 420 381 100 Stockertown Hercules Cement X 700 635 101 Wampum Medusa Cement X 715 649 102 West Winfield Penn-West Cement Co. X 370 336 103 York Lehigh Portland X 136 123
Cement
Shut down ---- _-__ Cement
t Cement
(Continued)
2-7

TABLE 2-3. (continued)
Locat 1 on Map index
No. State (Fiaure 2-1) City Plant
Type of Pyduction catacity. process 10 short 10 metric
Wet Orv tons tons
South Carolina 104 Harleyville Giant Portland X 855 776
104A Harleyville Gifford-Hill b to. X 564 512 105 Holly Hill Sontee Portland X 1.55u 1.4Ub
Cement
Cement
South Oakota 106 Rapid City South Oakota Cement X X 1,200 l . O @
Tennessee 107 Chatanooga Signal Mountain X 477 433
108 Kingsport Dixie Cement X 330 299 109 Knoxvi 1 le Ideal Basic Ind. X 550 499 110 Richard City Dixie Cement Co. X 200 181
texas 111 Amarillo Southwestern Port- X 218 198
Cement
112 113 114 115
116 117
land Cement Euda Texas Cement Corpus Christi Centex Cement Dallas General Portland El Paso Southwestern Port-
land Cement Fort Worth General Portland Houston Gulf Coast Portland
Cement
X X X
X
X X
470 300 472 260
731 1.000
426 272 428 236
663 907
117A Houston Lone Star Ind. X 750 680 X 750 680 118 Hunter Texas Ind.
119 Midlothian Gifford-Hill Cement X 846 767
120 New Eraunfels General Portland X 925 E39 121 Oddessa Southwestern Port- X 553 502
122 Orange River Cement NA NA -- Grinding only -- 123 San Antonio Alamo Cement X 400 363 1 2 3 San Antonio Alamo Cemeqt X 750 680 1238 San Antonio Capitol Cement Oiv. X 338 307
125 Wac0 Lehigh Portland x x 420 381
119A Midlothian Texas Ind. X 1,200 1,088
land Cement
123C San Antonio Kaiser Cement X 490 444 124 Sweetwater Lone Star Ind. X 545 494
cement
Utah 126 Leamington Southwestern X 650 590 Portland Cement
127 Morgan Ideal Basic Ind. X 350 318 128 Salt Lake City Lone Star Ind. X 420 381
Virginia 129 Roanoke Lone Star Ind. X 1,200 1,088
130 Eellingham Columbia Cement X 425 386 131 Metaline Falls Lehigh Portland X 215 195
Washington
Cement 132 Seatt 1 e Ideal Basic Ind. X 490 444
(Continued)
2- 8

TABLE 2-3. (continued)
Location Map index
No. State (Figure 2-1) City Plant
Type of Pyduction cayacity, process 10 short 10 metric
Wet Dry tons tons
Washington 132A Seattle Oregon Portland Cement
X 752 682
West Virginia 133 Martinsburg Capitol Cement X 935 848
Wisconsin 134 Milwaukee St. Mary’s Wisconsin NA NA _ _ Grinding only - 135 Superior National Gypsum NA NA -- Grinding only -
Cement
boning 136 Laramie Monolith Portland X 485 44a
Basic data taken from References 3 and 4 with updated infOnMt$n Provided by industry personnel i n 1985.
a
2-9

. ! i :
2-10

2.2 RAW MATERIAL
. .
Raw materials must provide, in suitable form and proportions, compounds
Natural de- containing lime, silica, alumina, and iron. Natural argillaceous deposits such as clay, shale, and slate, supply both silica and alumina. posits of limestone or marl (a calcareous clay) can occasionally supply all three basic ingredients at the correct proportion for the manufacture of "natural cement". Usually, however, it is necessary to combine raw materi- als to produce the desired mix. As a general rule, approximately.l.7 to 1.8 tons of dry raw materials are required to produce one ton of Table 2-5 lists the types and relative quantities of different raw materials us'ed to achieve the proper blend of mineral components for the industry as a who1 e. 2 .
As Table 2-5 shows, the calcareous component, particularly limestone, i s the iargest constituent in cement. Limestone ana Clay are abundant all over the world. since the low value-to-weight ratio results in high transportation costs. Underwater deposits of materials are excavated by barge-mounted dredging. Material is pumped or loaded onto barges and moved by tugboats to cement plants. Although a few limestone and gypsum deposits are mined underground by room-and-pillar methods, most raw materials for the cement industry are quarried using surface mining methods.
Limestone is generally quarried at or near the cement plant
2.3 PROCESS DESCRIPTION
There are basically two commercial cement manufacturing processes: the wet process and the dry process. The wet process involves the grinding of raw materials with water to form a slurry containing 30 to 40% moishre. The slurry is blended, as required, and subsequently fed to the kiln. The dry process, on the other hand, does not introduce water during grinding and the raw materials are fed to the kiln in the form of a powder.
Until recently, the wet process had advantages over the dry process due to ease of handling and blending of raw materials as well as yielding higher
2-11

TABLE 2-5. RAW MATERIALS USED I N PORTLAND CEMENT (1984)*
n..,,+;+..a \ ("P"*I*J
l o 3 m e t r i c Percent o f Type o f raw m a t e r i a l l o 3 s h o r t tons tons (Mg) t o t a l
Calcareous: L i mestone 78,484 Cement rock ( i n c l u d i n g 27,010
marl) Oys te rshe l l
Arg i l laceous: C1 ay Shale Other
1,103
71,420 85.4 24,579
1,004
6,045 5,501 3,087 2,809
47 43
S i l i ceous : Sand 1,958 1,782 Sandstone and quar t z 696 633
Ferrous: I r o n ore, p y r i t e s , 1,232 1,121
m i l l s c a l e , and o t h e r m a t e r i a l
Other: Gypsum and anhydr i t e 3,967 B l a s t furnace s l a g 27 F l y ash 841 Miscel laneous o t h e r 296
7.4
2.1
1.0
T o t a l 124,793 113,561 100.0
Source: U.S. Bureau o f Mines, Minera ls Yearbook 1984, U*.S. Govenment P r i n t i n g O f f i c e , Washington, D.C., 1985.
1 s h o r t t o n = 2,000 l b . 1 m e t r i c t o n = lo6 g (Mg).
a

q u a l i t y c l inke r . However, improvements i n dry blending and mater ia i han- d l ing techniques, i n combination w i t h lower energy consumption used i n t h e dry process , has served t o minimize t h e advantages of th,e wet process over t h e dry process . Most new p l a n t s o r production l i n e s have turned t o dry processes i n view of increas ing energy c o s t s and favorable s h i f t s i n dry process technology.
Cement manufacturing involves four bas i c processing s tages : quarrying
and crushing; mixing and gr inding; burning and cool ing; and f i n i s h gr inding , packaging, and shipping. General flow diagrams f o r both dry and wet pro- cesses a r e shown i n Figures 2-2 and 2-3, respec t ive ly . ' Each processing s t age is b r i e f l y descr ibed i n .the following subsect ions.
As w i t h most f a c i l i t i e s i n t h e mineral products i ndus t ry , cement p l a n t s have two major ca t egor i e s of p a r t i c u l a t e emissions: t o t h e atmosphere throughsome type of s t a c k , vent , o r pipe (ducted sources ) ; and those which a r e emit ted d i r e c t l y from t h e source t o t h e ambient a i r ( f u g i t i v e sources) without such equipment. Ducted emissions a r e usua l ly t ranspor ted by an i n d u s t r i a l v e n t i l a t i o n system with one o r more f ans o r a i r movers and emit ted t o the atmosphere through a s tack . t h e other hand, can either be process sources , which e n t a i l some form of physical o r chemical change i n t h e mater ia l being processed ( i . e . , c rushe r s , sc reens , e t c . ) , or open dus t sources where no such change has taken p lace ( i . e . , roads, s to rage p i l e s , e t c . ). The above d e f i n i t i o n s w i l l be used throughout t h e remainder of t h i s discussion.
those which a r e vented
Fugi t ive sources , on
2 .3 .1 Quarrying and Crushing
Cement production begins w i t h e x t r a c t i o n of t h e raw ma te r i a l s , genera l ly from a quarry a t o r near t h e cement p l an t . some combination of l imestone, cement rock, marl , s h a l e , c l a y , sand, and i ron ore . Most depos i t s a r e worked i n open qua r r i e s having face heights ranging from 9 t o 60 m (30 t o 200 f t ) w i t h overburden depths between 15 t o 30 m (50 t o 100 f t ) . s
The raw mater ia l i s comprised of
2-13

0
t VI VI a, u 0 L n
L 0 le
5 L m m
N I
N
01 L m LL
a .r
2-14

ul ul al u 0 L n
m I N al L a m .r U
<\ 2-15
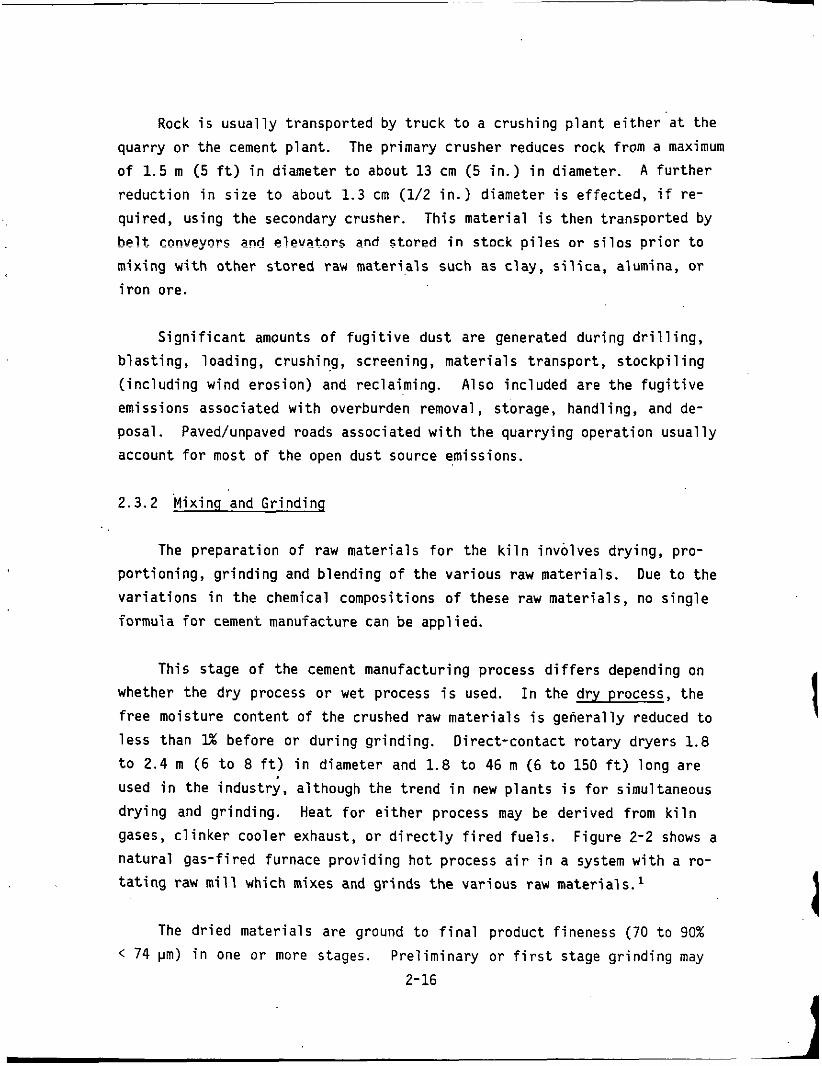
Rock i s usua l ly t r anspor t ed by truck t o a crushing p l an t e i t h e r a t t h e quarry o r t h e cement p l an t . of 1.5 m (5 f t ) i n diameter t o about 13 cm (5 i n . ) i n diameter. A f u r t h e r reduct ion i n s i z e t o about 1.3 cm (1/2 i n . ) diameter i s e f f e c t e d , i f re- qu i red , u s i n g t h e secondary crusher . T h i s mater ia l is then t r anspor t ed by hPl t cnnveynrs and elevators and stored i n s tock p i l e s or s i l o s p r i o r t o mixing w i t h o the r s t o r e d raw ma te r i a l s such a s c l a y , s i l i c a , alumina, o r i r o n ore .
The primary c rushe r reduces rock from a maximum
S i g n i f i c a n t amounts of f u g i t i v e d u s t a r e generated during d r i l l i n g , b l a s t i n g , loading, c rush ing , screening, ma te r i a l s t r a n s p o r t , s tockp i l ing ( inc luding wind eros ion) and reclaiming. Also included a r e t h e f u g i t i v e emissions a s soc ia t ed w i t h overburden removal, s to rage , handling, and de- posal. account f o r most of t h e open d u s t source emissions.
Paved/unpaved roads assoc ia ted w i t h the quarrying opera t ion usua l ly
2.3.2 'Mixing and Grinding
The prepara t ion of raw ma te r i a l s f o r the k i l n involves dry ing , pro- por t ion ing , gr inding and blending of the var ious raw mater ia l s . v a r i a t i o n s i n t h e chemical compositions of t hese raw ma te r i a l s , no s i n g l e iormuia f o r cement manufacture can be appl ied .
Due t o t h e
T h i s s t age of t h e cement manufacturing process d i f f e r s depending on whether t h e dry process o r wet process i s used. In the dry process , t h e f r e e moisture conten t of the crushed raw ma te r i a l s i s gene ra l ly reduced t o less than 1% before o r during gr inding. Di rec t -contac t ro t a ry dryers 1.8 t o 2 . 4 m (6 t o 8 f t ) i n diameter and 1.8 t o 46 m (6 t o 150 f t ) long a r e used i n the i n d u s t r i , al though t h e t rend i n new p l a n t s i s f o r simultaneous drying and gr inding. Heat f o r e i t h e r process may be der ived from k i l n gases , c l i n k e r cooler exhaust , o r d i r e c t l y f i r e d f u e l s . Figure 2-2 shows a na tura l gas - f i r ed furnace providing hot process a i r i n a system w i t h a ro- t a t i n g raw mill which mixes and g r inds t h e var ious raw mater ia l s . '
The d r i ed ma te r i a l s a r e ground t o f i n a l product f ineness (70 t o 90% Prel iminary o r f i r s t s t age gr inding may < 74 pm) i n one o r more s tages . 2-16

utilize a cylindrical ball mill, rod mill, or ring-roller mill.' second- or final-stage unit is usually a ball mill or a "tube" mill, which is a ball mill with a higher length-to-diameter ratio. Most of the more recent installations follow the secondary or tertiary crushing Operation with single-stage grinding using a roller mill.
The
Dry-process grinding units are usually operated in a closed circuit with air separators that split the mill output into coarse and fine frac- tions. The coarse fraction is returned to the mill for further grinding, and the fine fraction becomes finished raw-mix (raw meal). closed circuits have been used, with units in parallel, or series, or com- bination thereof, but the basic purpose is to minimize objectionable over- size and develop a product fineness best suited for effective combination i n the kiln. This finely ground material is conveyed either pneumatically or by mechanical means to blending, homogenizing, and/or storage silos f r o m
which it is withdrawn as kiln feed.
Various types of
Wet-process grinding uses'ball mills or compartment mills that are essentially the same as those used in the dry process except for feeding and discharge arrangements. Water is added to the mill with the crushed feed to form a slurry. Where clay i s used as a raw material, it is gen- erally added in suspension as a slip. Grinding may be done in one or two stages. that produce a final, more viscous, slurry that does not require thickener^.^ The various crushed materials may be proportioned ahead of grinding, as in the dry process, or each major component may be ground into separate slur- ries that are then proportioned and blended. Finished slurry fed to kilns may contain 30 to 40% water, or it may be further de-watered in vacuum filters and fed to the kiln as a "cake" containing about 20% water; this is referred to as the "semi-wet" process.
In some plants, mills are closed circuited with cyclones o r screens
The major sources of ducted emissions during mixing and grinding are rotary dryers and the grinding mill circuits. rotary dryers will entrain dust from the limestone, shale, or other materials
The hot gases passing through
2-17

being dried. velocity of the gases, the quantity and size of the fine particles, and their degree of dispersion i n the gas stream. A heavier dust concentration may be expected in dryers utilizing kiln exit gases (waste-heat dryers) be- cause of the dust carry-over from the kilns. Emissions from rotary dryers also include combustion-related pollutants such as sulfur dioxide (SO2), nitrogen oxides (NOx), carbon monoxide (CO), and volatile organic compounds
The concentration of dust in the exit gases is related'to the
(VOC) .
The most common dry grinding circuits, whether they use ball mills, compartment mills, or vertical units, are vented from mill discharge points to provide some air sweep through the mills to prevent mill dusting during grinding. In the normal closed circuits, vents may also be connected to mill discharge elevators, conveyors, and air separators to maintain the en- tire system under negative pressure. The heavily dust-laden air from these vents is conducted to a dust collector. In the case of "dry-in-the-mill" combination drying and grinding circuits, the final vent from the drying or closed-circuit separator or cyclone, which includes combustion-related gaseous pollutants as well as particulate matter, would be treated similarly. Condensed water vapor is also present in the exhaust from dry process raw mill circuits which produces a visible, opaque plume.
Fugitive emissions during mixing and grinding include the dust gener- ated during materials handling, transfer (belt transfer points, airslides, elevators, etc:), and storage (enclosed) operations. Figures 2-2 and 2-3 indicate the various fugitive emission points in the process f1ow.l
2.3.3 Burning or Clinker Production
2.3.3.1 Rotary Kiln--
are most commonly used in both the wet and dry manufacturing processes. Kiln length can be 30 to 230 m (90 to 750 ft) with diameters of 2 to 8 m (6 to 25 ft).1'4 The kiln is erected horizontally with a gentle slope o f 3.1 to 6.3% and rotates along its longitudinal axis.5
Blended and ground raw materials are fed to a rotary kiln. Rotary kilns
2- 18
I .
1
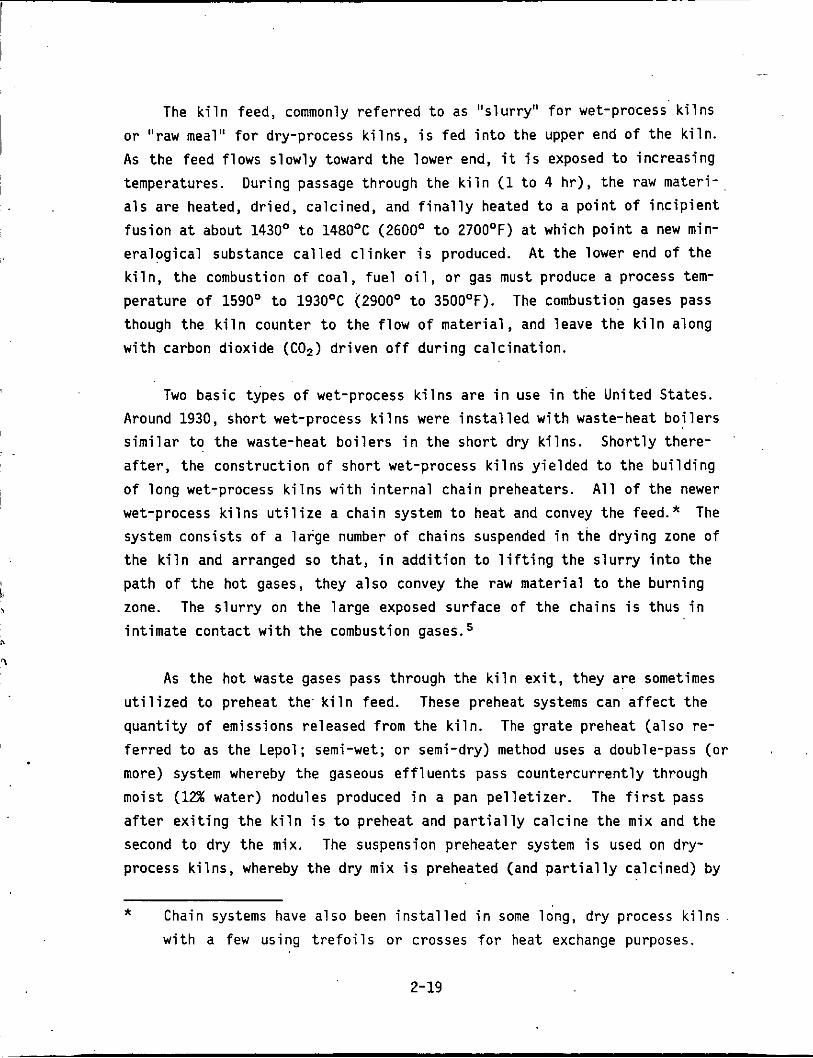
The k i l n feed, commonly r e f e r r e d t o as "slurry" f o r wet-process k i l n s o r "raw meal" f o r dry-process k i l n s , i s f e d i n t o the upper end o f t he k i l n . As t h e feed f lows s low ly toward the lower end, i t i s exposed t o i nc reas ing
temperatures. Dur ing passage through the k i l n (1 t o 4 hr ) , t he raw mater i - a l s a re heated, d r i e d , ca lc ined, and f i n a l l y heated t o a p o i n t o f i n c i p i e n t f u s i o n a t about 1430O t o 148OOC (2600' t o 27OOOF) a t which p o i n t a new min- e r a l o g i c a l substance c a l l e d c l i n k e r i s produced. A t t h e lower end o f t h e k i l n , t he combustion o f coal , f u e l o i l , o r gas must produce a process tem-
pe ra tu re o f 1590' t o 193OOC (2900° t o 35OOOF). The combustion gases pass though the k i l n counter t o the f l o w of m a t e r i a l , and leave t h e k i l n a long w i t h carbon d iox ide (C02) d r i v e n o f f d u r i n g c a l c i n a t i o n .
Two basic types o f wet-process k i l n s a re i n use i n t h e Un i ted States. Around 1930, s h o r t wet-process k i l n s were i n s t a l l e d w i t h waste-heat b o i l e r s s i m i l a r t o t h e waste-heat b o i l e r s i n t h e s h o r t d ry k i l n s . S h o r t l y there-
a f t e r , t he c o n s t r u c t i o n o f s h o r t wet-process k i l n s y i e l d e d t o the b u i l d i n g o f l ong wet-process k i l n s w i t h i n t e r n a l cha in preheaters. A l l o f t he newer wet-process k i l n s u t i l i z e a chain system t o heat and convey t h e feed.* The system cons is t s o f a l a r g e number o f chains suspended i n t h e d r y i n g zone o f t he k i l n and arranged so t h a t , i n a d d i t i o n t o l i f t i n g t h e s l u r r y i n t o the p a t h o f t h e h o t gases, they a l s o convey t h e raw m a t e r i a l t o the burn ing zone. The s l u r r y on t h e l a r g e exposed sur face o f t h e chains i s thus i n
i n t i m a t e con tac t w i t h t h e combustion gases.s
As t h e h o t waste gases pass through t h e k i l n e x i t , they a re sometimes u t i l i z e d t o preheat the. k i l n feed. These preheat systems can a f f e c t t h e
q u a n t i t y o f emissions re leased from t h e k i l n . The g r a t e preheat (a lso r e -
f e r r e d t o as the Lepol; semi-wet; o r semi-dry) method uses a double-pass ( o r
more) system whereby t h e gaseous e f f l u e n t s pass coun te rcu r ren t l y through
mo is t (12% water) nodules produced i n a pan p e l l e t i z e r . The f i r s t pass a f t e r e x i t i n g t h e k i l n i s t o preheat and p a r t i a l l y c a l c i n e the mix and the
second t o dry t h e mix. The suspension preheater system i s used on dry- process k i l n s , whereby t h e dry mix i s preheated (and p a r t i a l l y ca lc ined) by
* Chain systems have a l s o been i n s t a l l e d i n some long, d r y process k i l n s
w i t h a few us ing t r e f o i l s o r crosses f o r heat exchange purposes.
2-19

d i r e c t con tac t w i t h waste gases i n a mu l t i s t age cyclone-suspension process . The waste gases pass through one o r more cylones (normally fou r ) though which t h e mix passes countercur ren t ly .
The l a r g e s t s i n g l e source of ducted emissions i n p o r t l a n d i e m e n t p l a n t s Po l lu t an t s generated i n t h e k i l n c o n s i s t of p a r t i c u l a t e i s the ro t a ry k i l n .
mat ter a s well a s some combustion-related gases such as S O 2 , NO,, CO, and VOC. Emissions of p a r t i c u l a t e mat te r from ro ta ry k i l n s can be reduced by u t i l i z i n g a l a r g e r k i l n diameter ( a t the same feed and f i r i n g r a t e ) which lowers the gas ve loc i ty and t h u s entrainment of d u s t i n t h e e f f l u e n t gas stream.* Modification of a ro t a ry k i l n o r the addi t ion of a suspension pre- hea te r t h a t uses cyclones o r moveable g r a t e prehea ters a r e a l s o p a r t i a l l y effective i n c o n t r o l l i n g the dus t generated i n t h e k i l n . Additional cont ro l equipment i s normally used f o r s a t i s f a c t o r y c o l l e c t i o n of k i l n dus t p r i o r t o discharge t o the atmosphere.
Gaseous emissions from the combustion of fuel i n t h e k i l n a r e usua l ly not s u f f i c i e n t t o n e c e s s i t a t e t h e add i t ion of equipment t o control such emis- s ions . Most of t h e s u l f u r dioxide formed from t h e s u l f u r i n the fue l i s recovered a s i t combines w i t h t h e a l k a l i e s and a l s o w i t h t h e lime when t h e a l k a l i fume i s low. Nitrogen oxides can form a t k i l n temperatuers of 1430 t o 1650'C (2600' t o 3000'F). and are of concern. Combustion modif icat ion t o reduce NOx emissions from cement k i l n s have been s tudied by t h e EPA.6 Odoriferous hydrogen s u l f i d e and po lysu l f ides may a l s o be produced i n the drying of the s l u r r y o r i n t h e drying of t h e dry-process raw mater ia l when the l a t t e r i s composed of marl , s ea s h e l l s , s h a l e , c l a y , o r o the r su l fu r - conta in ing ma te r i a l .
The g r e a t e s t problem w i t h f u g i t i v e emissions as soc ia t ed w i t h r o t a ry ki lns involves t h e disposal of t h e d u s t c o l l e c t e d i n the a i r po l lu t ion cont ro l
* I f any type of suspension p rehea te r o r f l a s h c a l c i n e r i s r e t r o f i t t e d t o an e x i s t i n g k i l n , t h e l ength i s gene ra l ly reduced t o achieve t h e proper thermal p r o f i l e and r e t e n t i o n time.
2-20
.

system. The most d e s i r a b l e method f o r ' d ispos ing o f t he c o l l e c t e d dust i s
t o r e t u r n . i t t o t h e k i l n . The a l k a l i content o f t h e cement product , how- ever, must o f t e n be l e s s than 0.6% by weight ( c a l c u l a t e d as sodium oxide). Where t h e a l k a l i content of t he raw m a t e r i a l (e.g., c l a y ) going i n t o the
k i l n i s high, r e c y c l i n g o f k i l n dus t may n o t be poss ib le .
o f r e t u r n i n g dus t t o the k i l n are:
P r a c t i c a l methods
1. D i r e c t dus t r e t u r n t o k i l n feed p r i o r t o k i l n e n t r y by m ix ing d ry
dus t and k i l n feed ( e i t h e r wet o r dry) .
2. D i r e c t dus t r e t u r n t o t h e k i l n p a r a l l e l t o t h e k i l n feed ( e i t h e r wet o r dry) .
3. I n s u f f l a t i o n , which i s t h e r e t u r n o f d r y dus t i n t o the bu rn ing zone e i t h e r through the f u e l p i p e (as i s f r e q u e n t l y the case i n coal f i r e d k i l n s on u n i t coal p u l v e r i z e r s ) o r by a separate p i p e
p a r a l l e l t o t h e burner. Here t h e dus t e n t e r i n g the burn ing zone s i n t e r s i n t o small g ra ins o f c l i n k e r and i s discharged w i t h the c l i n k e r t o the cooler . I n t h i s process, t he c o l l e c t e d dus t i s
u s u a l l y pumped d r y from t h e c o l l e c t i n g u n i t a t t h e feed end t o t h e burner f l o o r and i n t o t h e bu rn ing zone through t h e k i l n hood.
There i s no s i n g l e s a t i s f a c t o r y method o f r e t u r n i n g a l l o f t h e c o l l e c t e d
dust t o t h e k i l n ; as a r e s u l t , t o c o n t r o l a l k a l i e s o r improve k i l n opera- t i o n , a t l e a s t p a r t o f t h e dus t must be disposed i n o t h e r ways.
K i l n dust has been, o r can be, used i n a number o f d i f f e r e n t ways, i n - c l u d i ng:
L a n d f i l l and s o i l stabilizer/neutralizer/fertilizer.
- Sub-base f o r roads.
I
Dumped i n t o s t r i p mines t o n e u t r a l i z e a c i d mine drainage.
2-21

. . F i l l e r s f o r bituminous paving ma te r i a l s and a s p h a l t i c roofi.ng ma- t e r i a l s .
Neut ra l ize a c i d i c waters of bogs, l akes , and streams ( a s appro- p r i a t e ) .
N e u t r a l i z e c e r t a i n indiust-rial wastes such a s spent p i c k l e l i q u o r , l e a t h e r t a n n i n g waste and co t ton seed d e l i n t i n g waste.
Waste s ludge s t a b i l i z a t i o n .
- S u b s t i t u t e f o r lime i n wastewater t reatment systems.
Absorption of SO, from s t ack gas i n wet scrubber s l u r r i e s .
Replacement of soda i n green g l a s s .
Disposal of d u s t , unless i t can be s o l d as a s u b s t i t u t e f o r o t h e r mate- r i a l s such a s those l i s t e d above, p re sen t s problems'with f u g i t i v e emissions. Since t h e c o l l e c t e d d u s t may range from a few hundred pounds pe r hour t o many tons, d i sposa l r equ i r e s a waste a rea and a means of moving dus t from t h e c o l l e c t o r t o the waste a rea . The c o l l e c t e d dus t may be mixed w i t h water and pumped t o waste ponds i n a manner s i m i l a r t o f l y ash dSsposa1 commonly p rac t i ced i n power genera t ing s t a t i o n s or p e l l e t i z e d p r i o r t o d isposa l using pan o r drum p e l l e t i z e r s . I t may a l s o be pumped dry or hauled by t ruck t o worked-out quarry a r e a s where r a i n and weather concrete t h e d isposa l p i l e i n t o a monoli thic mass. i n a pug screw a s i t i s discharged i n t o the t ruck. ' A n enclosed system has a l s o been used f o r t r u c k loading w i t h the displaced a i r vented through a dus t c o l l e c t o r .
Where trucks a r e used, usual ly the dus t i s dampened
F u g i t i v e emissions can a l s o be generated during t r a n s p o r t and handling of the d u s t from t h e c o l l e c t o r hopper, truck loading and unloading opera t ions , t r u c k t r a f f i c across paved and unpaved roads , a s well a s wind eros ion from t h e bed of open t rucks during t r a n s p o r t and from t h e disposal s i t e i t s e l f .
2-22

2.3.3.2 Clinker Coolers-- As the clinker is discharged from the lower end of the kiln, it Passes
through a clinker cooler that serves the dual purpose of reducing the tem- perature of the clinker before it is stored and recovering the'sensible heat for reuse inside the kiln as preheated primary or secondary combustion air as well as tertiary air for combustion in the precalciner. Planetary, Vi - brating, or grate type air-quenching coolers are used to permit a blast Of cooling air to pass either through or over a moving bed or stream of hot clinker. The cooled clinker is then conveyed by drag chains, vibrating troughs, or conveyor belts to storage.
Like the kiln, the clinker cooler can be a significant source of ducted emissions. Effluent gas from grate coolers, which contains particulate, is vented through a separate dust collection device. Fugitive emissions asso- ciated with clinker coolers are generated by materials handling, transport, and storage operations which include stockpiling and recovery of clinker from open piles with the associated wind erosion losses (Figures 2-2 and 2-3). ings or halls for convenience in handling and for weather protection (and, indirectly, for the control of fugitive dust emissions) has become more prevalent in newer plants.
The storage of clinker in enclosed silos or partially enclosed build-
2.3.4 Finish Grinding, Packaging, and Shipping
In the final stage of cement manufacture, clinker is ground into ce- ment. Interground with the clinker is a small amount of gypsum (normally 3 to 6%), which regulates the setting time of the cement when it is mixed with water and aggregate to make mortar or concrete.
Various grinding circuits are in use. The system may be two stage, with preliminary and secondary mills, or the entire process may be performed in a single compartment mill. Ball mills or tube mills normally are used. Crushers may be used ahead of the ball or tube mills. The grinding system may be open circuit, but most of the mills are closed-circuited with air separators. The final product has a fineness of about 90% less than 44 pm
(minus 325 mesh).5

The finished cement is transported by pneumatic pumps, mechanical screws, or belt conveyors, to silos for storage until it is shipped. Some portland cement is packaged i n 44-kg (96-lb) bags; however, most cement is transported in trucks, hopper cars, barges, and ships.
As with raw grinding, the major source of ducted emissions are the finish mills circuits. Clinker is ground in the same type of mills as used for the raw materials. The discharge from these mills is elevated to an air separator in closed-circuit grinding. Cement with the proper fineness is sent to storage, and the oversize is sent back to the mill for regrind- ing. The circuit is cooled by air passing through the mill and separator and finally into a dust collector.
Cement-material hand1 ing (such as pneumatic conveying of finished mate- rial, bagging, and bulk loading) is a potentially significant source of fu- gitive emissions. However, the high salvage value of the escaping material makes dust collection an economic necessity. Normally, material transfer points are completely enclosed and vented through dust collectors for prod- uct recovery. In-plant paved roads can also be a significant source of fugitive emission due to spillage of material during truck loading opera- tions. Table 2-7 provides a summary of the air pollutant sources typically found i n cement plants.
2.4 CONTROL TECHNOLOGY
2.4.1 Ducted and Process Fugitive Sources
2.4.1.1 Rotary Kilns-- Kiln dust is separated from exhaust gase U ing one r combi nati I
of the following types of equipment: cipitators (ESPs); baghouse collectors; and settling chambers.
cyclone separators; electrostatic pre- A number of
2-24
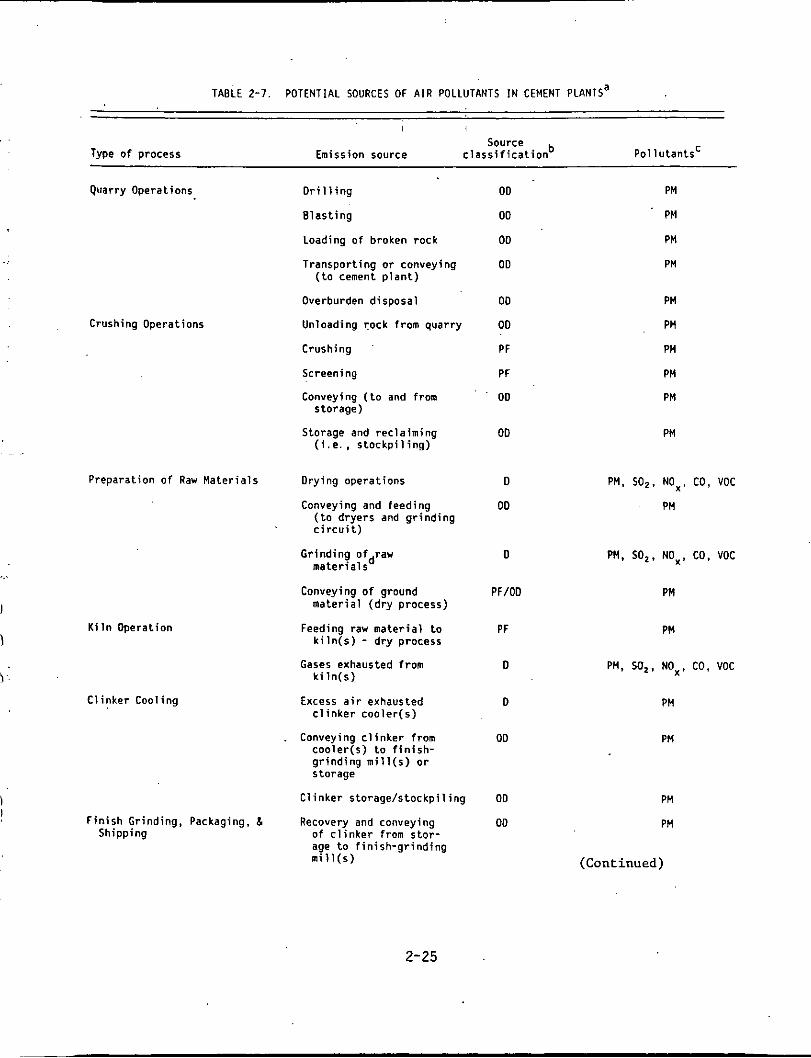
TABLE 2-7. POTENTIAL SOURCES o f AIR POLLUTANTS IN CEMENT P L A N T S ~
, ,
Crushing Operat ions
Source Type of process Emission source c l a s s i f i c a t i o n ~ o ~ l u t a n t s '
Quarry Operat ions O r i 11 i n g OD PM
B l a s t i n g DO PM
Loading o f broken rock 00 PM
T ranspor t i ng o r conveying OD PM ( t o cement p l a n t )
Overburden d i s p o s a l 00 PM
Unloading rock f rom quar ry 00 PM
Crushing PF PM
Screening Pf PM
Conveying ( t o and from OD PM s torage)
( i . e . , s t o c k p i l i n g ) Storage and r e c l a i m i n g 00 PM
...
Prepara t i on o f Raw M a t e r i a l s Dry ing opera t i ons D
Conveying and feed ing OD ( t o d r y e r s and g r i n d i n g c i r c u i t )
I
1 K i l n Operat ion
\
CI i n k e r Coo l i ng
G r i n d i n g ofdraw m a t e r i a l s
Conveying o f ground PF/OO m a t e r i a l ( d r y process)
k i l n ( s ) - dry process
k i l n ( s )
Feeding raw m a t e r i a l t o PF
Gases exhausted f rom D
Excess a i r exhausted D
Conveying c l i n k e r f rom OD
c l i n k e r c o o l e r ( s )
c o o l e r ( s ) t o f i n i s h - g r i n d i n g m i l l ( s ) o r s to rage
1 C l i n k e r s t o r a g e / s t o c k p i l i n g OD I
f i n i s h Gr ind ing , Packaging, h Recovery and conveying OD Shipping of c l i n k e r from s t o r -
age t o f i n i s h - g r i n d i n g m i l l ( s )
PM. S O 2 . NOx, CO, VOC
PM
PM. SO,, NOx, CO. VOC
PM
PM
PM, SO,. NOx. CO, VOC
PM
PM
PM
PH
(Continued)
2-25

i A B L E 2 - i . ( con t i nued)
Type of process Source
Emission source c l a s s i f i c a t i o n P o l l u t a n t s '
F i n i s h a r i n d i n a o f c l i n - 0 PM k e r , <yprum,-and add- t i v e s
Ai,; i:;a;ji;icdiiui, u; ::;OD f i n i s h e d p roduc t and conveying t o s torage
Storage s i l o ( s ) D
B u l k l o a d i n g opera t i ons 00 PH
Waste Dust Handl ing and Handl ing, t r u c k l oad ing / OD Disposal un load ing
PM
Miscel laneous Operat ions Paved and unpaved roads OD PM
Wind e r o s i o n from s tock- OD p i l e and exposed areas
PM
a Taken from Reference 1. PM - P a r t i c u l a t e Ma t te r
OD - Open Dust Source NO - N i t r o g e n Oxides PF - Process F u g i t i v e Source C 6 - Carbon Monoxide
SO, - S u l f u r D i o x i d e
VOC - V o l a t i l e Organic Compounds
Combust ion-re la ted p o l l u t a n t s for combinat ion d r y i n g / g r i n d i n g .
0 - Ducted Source
2-26

good references are available which describe the theory, operation and ap-
. .. . .
plicability of the control devices listed above and thus such will not be discussed
As of 1975, the most widely used particulate collection system for rotary cement kilns consisted of cyclones followed by an electrostatic pre- cipitator. The distribution of the various types o f dust collection equip- ment used in the 101 cement plants surveyed by Southern Research Institute in 1975 is shown in Table 2-8.' Since this survey was conducted over 11 years ago, the data shown in Table 2-8 probably does not represent cur- rent industry practice.
The effectiveness of the control devices listed in Table 2-8 is depen- dent on the characteristics of the gas stream and the particulate matter-- specifically the size of the particles, the moisture content of. the gas, the resistivity of the dust, and the concentration and composition of the dust. Mechanical collectors are not effective on submicrometer particles and, therefore, are used only as a precleaner to a fabric filter or ESP. As stated previously, the dust collected by these precleaners can be re- cycled to the kiln when its chemical composition does not significantly alter that of the final product.
As stated above, no external equipment is generally used in the cement industry f o r the control of gaseous pollutants. However, due to the alka- line nature of the particles, some SO2 removal can be achieved in the kiln and dust collection equipment. Various combustion modifications have been attempted for the control of NOx i n cement kilns but have been generally unsuccessful.
2.4.1.2 Clinker Coolers-- The clinker cooler i s another major air pollution source in cement
plants.' Dust collected from this source is returned to the process (usually clinker storage) rather than wasted. The types o f air pollution control equipment used to handle clinker cooler off-gas include: settling chambers; cyclones; granular bed filters; baghouse collectors; and electrostatic pre- cipitators.
- 2-27

TABLE 2-8. DISTRIBUTION OF KILN DUST COLLECTION SYSTEMS I N WET AND DRY PROCESS CEMENT PLANTS1
Type o f process and
number o f p l a n t s a
Ki ln-Dust C o l l e c t i o n System
S i n g l e dus t c o l l e c t o r Cyclones P r e c i p i t a t o r s Baghouses Wet scrubbers S e t t l i n g chamber
Combinations o f Dust C o l l e c t o r s b P r e c i p i t a t o r s and wet scrubbers
Cyclones and wet scrubbers Cyclones and p r e c i p i t a t o r s Cyclones and baghouses Cyc!onosj baghouses, and p r e c i p i t a t o r s Baghouses and p r e c i p i t a t o r s b Baghouses and wet scrubbers
Wet - 2
3 1 3 1 1
1 1
14 4 2 1 0
0 0 12 16
2 1 1
Source: Davis, T. A., and D. B. Hooks. Disposal and U t i l i z a t i o n o f Waste K i l n Dust from Cement Indus t r y , EPA-670/2-75-043, U. S. Environmental P r o t e c t i o n Agency, C i n c i n n a t i , Ohio, 1975.
a Data a re extremely dated and probably do n o t represent c u r r e n t i n d u s t r y p r a c t i c e .
It i s d o u b t f u l whether any wet scrubbers are p r e s e n t l y be ing used i n ope ra t i ng cement p l a n t s .
2-28

2.4.1.3 Other Ducted and Process Fugi t ive Sources--
These sources were l i s ted previous ly i n Table 2-7. There a r e o the r ducted and process f u g i t i v e sources w i t h i n cement
p l an t s . Capture and
c o l l e c t i o n systems using baghouse c o l l e c t o r s appear t o be most f requent ly appl ied t o cont ro l dus t emissions from t h e s e var ious sources although wet suppression ( w i t h water , s u r f a c t a n t s , foam, e t c . ) has been used success- f u l l y on crushing, sc reening , and ma te r i a l s handling opera t ions .
2.4.2 Open Dust Sources
As s t a t e d above, t h e r e a r e a number of open dus t sources as soc ia t ed w i t h cement p l a n t s including: d r i l l i n g ; b l a s t i n g ; ma te r i a l s s to rage , han- d l i n g , and t r a n s f e r opera t ions ; t r u c k load - id load-ou t ; c l i n k e r and raw mater ia l s to rage p i l e s ; vehicu lar t r a f f i c on paved and unpaved roads; and wind erosion. F u g i t i v e emissions from mate r i a l s handling, s to rage , loading and unloading opera t ions can be reduced by a v a r i e t y of d i f f e r e n t cont ro l technqieus. These include: enc losures and hoods ducted t o dus t co l l ec - t o r s ; wet dus t suppression using water , foam, o r chemicals; process modi- f i c a t i o n s , improved housekeeping, and combinations of t hese and o t h e r con t ro l s . P l an t roads can be paved, watered, t r e a t e d w i t h chemicals, or swept r egu la r ly t o minimize dus t reentrainment. guidance a s t o t h e var ious techniques app l i cab le t o such sources.
References 7 and 8 provide
2-29

REFERENCES FOR SECTION 2.0
1. R. F. Smith, etal, Mult imedia Assessment and Environmental Research Needs o f t he Cement Indus t r y , EPA-600/2-79-111 ( N T I S PB 299 210), U.S. Environmental P r o t e c t i o n Agency, C i n c i n n a t i , OH, May 1979.
2. U.S. Bureau o f Mines, Minera ls Yearbook 1984, Volume I, Metals and
Minera ls , U . S . Government P r i n t i n g O f f i c e , Washington, D.C., 1985.
3. Por t l and Cement P lan ts , P i t and Quar ry Pub l i ca t i ons , Inc . , Chicago, I L , 1982.
4. Muelberg, P. E., and B. P. Shepherd, I n d u s t r i a l Process P r o f i l e s f o r Environmental Use, Chapter 21, The Cement Indus t r y , EPA-600/2-77-023~
(NTIS PB 281 488), U.S. Environmental P r o t e c t i o n Agency, C i n c i n n a t i ,
OH, February 1977.
5. T. E. K r e i c h e l t , e t a l , Atmospheric Emissjons from t h e Manufacture o f Po r t l and Cement, Report No. 999-AP-17 (NTIS PB 190 236), U.S. Depart-
ment o f Heal th , Education, and Welfare, Pub l i c Hea l th Service, C i n c i n n a t i , Ohio, 1967.
6. Cont ro l Techniques f o r P a r t i c u l a t e Emissions from S ta t i ona ry Sources-
Volume 1, EPA-450/3-81-005a (NTIS PB 83-127479), U. S. Environmental
P r o t e c t i o n Agency, Research T r i a n g l e Park, NC, September 1982.
7. Cont ro l Techniques f o r P a r t i c u l a t e Emissions from S ta t i ona ry Sources-
Volume 2, EPA-450/3-81-005b (NTIS PB 83-127480), U. 5. Environmental P r o t e c t i o n Agency, Research T r i a n g l e Park, NC, September 1982.
8. S. C. Hunter, e t a l , A p p l i c a t i o n o f Combustion M o d i f i c a t i o n s t o Indus- t r i a l Combustion Equipment, EPA-600/7-79-015a (NTIS PB 294 2141, U.S. Environmental P r o t e c t i o n Agency, Research T r i a n g l e Park, NC, January 1979.
2-30
SECTION 3.0
GENERAL DATA REVIEW AND ANALYSIS PROCEDURES
3.1 LITERATURE SEARCH AN0 SCREENING
The first step of this investigation was an extensive search of the available literature relating to the particulate emissions associated with portland cement plants. This search included: data collected under the inhalable particulate (IP) emission characterization program; information contained i n the computerized Fine Particle Emission Inventory System (FPEIS); source test reports and background documents for Section 8.6'of AP-42 located in the files of the EPA's Office of Air Quality Planning and Standards (OAQPS); source test reports received industry; and MRI's own files (Kansas City and North Carolina). The search was thorough but not exhaustive. It is expected that certain additional information may also exist, but limitations in funding precluded further searching.
To reduce the large amount of literature collected to a final group of references pertinent to this report, the following general criteria were used:
1.
2.
Source testing must be a part of the referenced study. Some re- ports reiterate information from previous studies and thus were not considered.
The document must constitute the original source of test data. example, a technical paper was not included if the original study was already contained in a previous document. of the data could not be determined, the document was eliminated.
For
If the exact. source
3-1

I f t h e r e was no reason t o exclude a p a r t i c u l a r da t a set, each was as- The r a t i n g system used was t h a t speci- signed a r a t i n g as t o i t s q u a l i t y .
f i e d by t h e OAQPS f o r the prepara t ion of AP-42 S e c t i 0 n s . l r a t ed a s follows:
The da ta were
3-2
A f ina l s e t of re fe rence ma te r i a l s was compiled a f t e r a thorough re- view of the p e r t i n e n t r e p o r t s , documents, and information according t o the c r i t e r i a s t a t e d above. candidate emission f a c t o r s f o r p a r t i c u l a t e matter based on t o t a l mass and p a r t i c l e s i ze .
T h i s s e t of documents was f u r t h e r analyzed t o der ive
3.2 EMISSION DATA QUALITY RATING SYSTEM
As p a r t o f M R I ' s ana lys i s of t h e a v a i l a b l e d a t a , the f i n a l set of re ference documents were evaluated as t o t h e quan t i ty and q u a l i t y of the information contained in them. The fol lowing da ta were always excluded from cons idera t ion .
1.
2.
3.
4.
5.
Test s e r i e s averages reported in u n i t s t h a t cannot be converted t o t h e se l ec t ed repor t ing un i t s .
Test s e r i e s represent ing incompatible t e s t methods,
Test s e r i e s of con t ro l l ed emissions f o r which t h e control device i s n o t spec i f i ed .
Tes t s e r i e s in which t h e source process i s n o t c l e a r l y i d e n t i f i e d and descr ibed.
Test s e r i e s in which i t i s not c l e a r whether the emissions mea- sured were con t ro l l ed o r uncontrol led.
A - Multiple tests performed on the same source using sound methodol- ogy and reported in enough detail for adequate validation. These tests do not necessarily have to conform to the methodology spe- cified i n either the IP protocol documents, or by EPA reference test methods, although such were certainly used as a guide.
Tests that are performed by a generally sound methodology but lack enough detail for adequate validation.
B -
C - Tests that are based on an untested or new methodology or that lack a significant amount of background data.
0 - Tests that are based on a generally unacceptable method but may provide an order-of-magnitude value for the source.
The following criteria were used to evaluate source test reports for sound methodology and adequate detail:
1. Source operation. well documented in the report. The source was operating within typical parameters during the test.
The manner in which the source was operated is
2. Samplinq procedures. The sampling procedures conformed to a gen- erally accepted methodology. If actual procedures deviated from accepted methods, the deviations are well documented. When this occurred, an evaluation was made of how such alternative proce- dures could influence the test results.
3. Sampling and process data. Adequate sampling and process data are documented in the report. Many variations can occur without warning during testing and sometimes without being noticed. Such variations can induce wide deviations i n sampling results. If a large spread between test results cannot be explained by informa- tion contained in the test report, the data are suspect and were given a lower rating.
3- 3

,4 . Analysis and calculations. The test reports contain original raw data sheets. The nomenclature and equations used were compared to those specified by EPA (if any) to establish equivalency. The depth of review of the calculations was dictated by the reviewer's confidence in the ability and conscientiousness of the tester, which in turn was based on factors such as consistency of results and completeness of other areas of the test report.
As a general rule, tests conducted strictly for the purpose of devel- oping new source performance standards for a particular source category were not rated higher than 6. This is due to the fact that these tests represent facilities which are considered as especially well-maintained, operated and controlled plants and thus may not be truly representative of the industry as a whole.
3.3 PARTICLE SIZE DETERMINATION
There is no one method which is universally accepted for the determina- tion of particle size. A number o f different techniques can be used which measure the size of particles according to their basic physical pi-operties. Since there is no "standard" method for particle size analysis, a certain' degree o f ssbjective evaluation was used to determine i f a test series was performed using a sound methodology for particle sizing. The following is a brief explanation of how particle size is defined and the various methods available for particle size measurement.
3.3.1 Particle Size Definitions
Examination of particles with the aid of an optical or electron micro- scope involves the physical measurement of a linear dimension of a particle. The measured "particle size" is related to the particle perimeter or to the particle projected area diameter. Particle size measurement in this manner does not account for variation in particle density or shape.*

All laws describing the properties of aerosols can be expressed most simply for particles of spherical shape. To accommodate nonspherical par- ticles it is customary to define a ''coefficient of sphericity" which is the ratio of the surface area of a sphere with the same volume as the given particle to the surface area of the particle.2 An estimate of particle volume can be obtained from microscopic sizing, and by assuming a density, one can obtain an estimate of particle weight.
Because of large variations in particle density and the aggregated na- ture of atmospheric particles, it is useful to define other quantities as a measure of particle size based on their aerodynamic behavior. The S t o k e ' s diameter is defined as the .diameter of a sphere having the same settling velocity as the particle and a density equal to that of the bulk.materia1 from which the particle was formed,
where:
DS = Stoke's diameter (cm)
V s = terminal settling velocity of a particle in free fall (cm/sec)
q = viscosity of the fluid (gm/cm.sec)
g = gravitational constant (980.665 cm/secZ)
p = density of the particle (gm/cm3)
C(D ) = Cunningham's slip correction factor for spherical particles of diameter Dq (dimensionless)
with: I
A = CI + p exp(-y DS/2A) (3-3)
3- 5
I

--
CI = empirical constant (dimensionless) 5 1.23 - 1.246 p = empirical constant (dimensionless) 0.41 - 0.45 y = empirical constant (dimensionless) = 0.88 - 1.08 A = mean free path of the fluid at stated conditions (cm)
E ho (q/q0) (T/To)O” (Po/P) I (3-4)
rl, T’
= mean free path at reference conditions (cm) = gas viscosity at stated conditions (gm/cm.sec) = gas viscosity at reference conditions (gm/cm.sec) = absolute temperature (OK)
T = reference temperature = 296.16’K Po = absolute pressure (kPa) P = reference pressure = 101.3 kPa R8 = Reynold’s number (dimensionless)
For particles greater than a few microns i n diameter, a less rigorous form of Equation 3-1 can be used with reasonable accuracy according to the relationship: 4 ’ s
Ds = Re 5 0.05 (3-5)
where:
p, g, Ds, and q are as defined above; and
p ’ = density o f air at the appropriate temperature and pressure (gm/cm3)
Since dispersion and condensation aerosols are usually formed from many materials of different densities, it is more useful to define another param- eter called the aerodynamic diameter, which is the diameter of a sphere having the same settling velocity as the particle and a density equal to 1 g / ~ m j . * ’ ~ The classical aerodynamic diameter differs from the Stoke‘s diameter only by virtue of difference i n density, assumed equal to unity, and the slip correction factor, which, by convention, is calculated for the aerodynamic . equivalent diameter. From Equation 3-1:3
3-6

I , . ,:.
i ' I '. I
I ' , .
I
where OAe = " c l a s s i c a l " aerodynamic equ iva len t diameter (cm), w i t h Q, Vs, g, C as p r e v i o u s l y de f i ned i n Equation 3-1.
Equations r e q u i r e d f o r i n t e r c o n v e r s i o n between Stoke 's and aerodynamic diameters are presented i n Table 3-1.3
TABLE 3-1. EQUATIDNS USED FOR PARTICLE S I Z E CONVERSIONS3
Conversion equat iona Diameter d e f i n i t i o n Stoke ' s C lass i ca l aerodynamic
(given) diameter ( D S ) equ iva len t diameter (DAe)
7 I n AI L
Stoke 's diameter 1.0
1/23 C l a s s i c a l aerodynamic C(DAe)
1.0 diameter ( D A ~ ) S = DAe [pC(Ds)] .
__ ~~~~
a Notat ion: D = Stoke's diameter (pm) DS = C lass i ca l aerodynamic equ iva len t diameter (pm) pAe = P a r t i c l e dens i t y (g/cm3) C(Ds) , C(DAe), = S l i p c o r r e c t i o n f a c t o r s (dimensionless)--
see Equations 2, 3, and 4.
3.3.2 P a r t i c l e Size Measurement
As s t a t e d p r e v i o u s l y above, p a r t i c l e s i z e i s determined by measuring
c e r t a i n phys i ca l p r o p e r t i e s o f t h e p a r t i c u l a t e be ing analyzed, such as i t s i n e r t i a l , l i g h t s c a t t e r i n g , sedimentation, d i f f u s i o n a l , and e l e c t r i c a l
c h a r a c t e r i s t i c s . The s i z e d i s t r i b u t i o n o f an aerosol can be determined
3-7

either directly at the source (i.e.,. stack or vent) or indirectly by the collection of a bulk sample of the material for subsequent analysis in the laboratory. In either case, the instrument(s) utilized to make such a de- termination can be manual or automated depending on the individual technique.
The five basic methods for the direct measurement of particle size are:
1. Aerodynamic separators (cascade impactors, cyclones, elutriators, etc.)
2. Light-scattering optical particle counters
3. Electrical mobility analyzers
4. Condensation nuclei counters
5. Diffusion batteries
All of the above are extractive methods, with the exception of certain aero- dynamic separators.
Indirect methods for the determination of particle size include:
1. Sieving (wet, dry, sonic)
2. Sedimentation
3. Centrifugation (inertial separation)
4. Microscopy (optical and electron)
5. Others (acoustic, thermal, spectrothermal emission)
3-8

Table 3-2 provides a guide as to the various methods for the determina- tion of particle size based on certain physical properties of the particu- late and notes the size range in which each is generally applicable.6
In most respects instruments that fractionate an aerosol on the basis of the aerodynamic properties of its components probably give the best practical assessment of size. Once flow conditions have been selected for the device, the terminal settling velocities of the particles collected in each stage or part of the instrument can be determined, even though particle specific gravity and shape factor are ~ n k n o w n . ~ Unless the particle shapes are extremely irregular, the details of precise geometric form can be by- passed and the likelihood of the particle's capture by a dust-collecting system can still be determined. size properties is essential for the development o f appropriate emission factors, an assessment by aerodynamic techniques was emphasized in review-
Because the correct assessment o f particle
i n g and r a t i n g t h e indis:i&a! i-t- s&,; fo; s ~ i j f i d ;&ho:o:ojy.
Examples of aerodynamic particle sizing instruments are centrifuges, cyclones, cascade impactors, and elutriators. Each' of these instruments employs the unique relationship between a particle's diameter and mobility in gas or air to collect and classify the particles by size. For pollution studies, cyclones and impactors (primarily the latter) are more useful be- cause they are rugged and compact enough for in situ sampling. piing is generally preferred because the measured size distribution may be distorted if a probe is used for sample extraction. In the following two subsections, methods of using impactors and cyclones are discussed.
In situ Sam- -- --
3.3.2.1 Cascade Impactors-- Cascade impactors used for the determination of particle size in pro-
cess streams consist of a series of plates or stages containing either small holes or slits with the size of the openings decreasing from one plate to the next. In each stage of an impactor, the gas stream passes through the orifice or slit to form a jet that is directed toward an impaction plate. For each stage there is a characteristic particle diameter that has a 50%
3-9
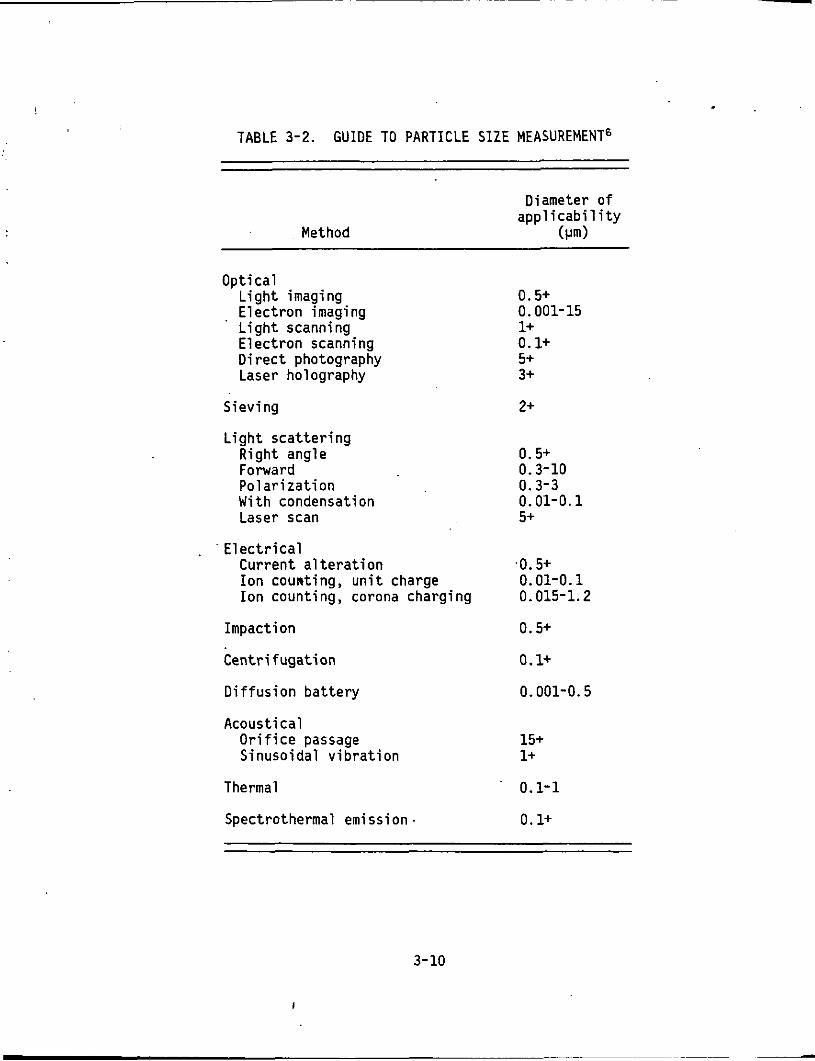
TABLE 3-2. GUIDE TO PARTICLE SIZE MEASUREMENT6
Method
Diameter of appl icab i 1 i t y
(pm)
Optical L i g h t imaging Electron imaging Light scanning Electron scanning Di rec t photography Laser holography
Sieving
Light s c a t t e r i n g Right angle Forward Po la r i za t ion W i t h condensation Laser scan
Current a l t e r a t i o n Ion count ing, u n i t charge Ion count ing , corona charging
E l e c t r i c a l
Impaction
Cent r i fuga t ion
Diffusion b a t t e r y
Acoustical O r i f i c e passage Sinusoidal v i b r a t i on
Thermal
Spectrothermal emission
0.5+ 0.001-15 1+ 0.1+ 5+ 3+
2+
0.5+ 0.3-10 0.3-3 0.01-0.1 5+
0.5+ 0.01-0.1 0.015-1.2
0.5+
0.1+
0.001-0.5
15+ 1+
0.1-1
0.1+
3-10
I

probability of impaction. This characteristic diameter is called ttie cut- point (Dso) of the stage. Typically, commercial instruments have six to eight impaction stages with a back-up filter to collect those particles which are either too small to be collected by the last stage or which are reentrained off the various impaction surfaces by the moving gas stream.?
The particle collection efficiency of a particular impactor jet-plate combination is determined by properties of the aerosol such as the particle shape and density, but the viscosity of the gas, and by the design of the impactor stage. There is also a slight dependence on the type of collec- tion surface used (glass fiber, grease, metal, etc.). Reentrainment, or particle bounce, is a significant problem with cascade impactors especially in the case o f high particulate loadings. This problem can be partially solved by using a preseparation device ahead of the impactor to reduce the overall loading of coarse particles.
3.3.2.2 Cyclone Separators--
cascade impactor to remove the larger particles. These cyclones are of the standard reverse-flow design whereby the aerosol sample enters the cyclone through a tangential inlet and forms a vortex flow pattern. Particles move outward toward the cyclone wall with a velocity that is determined by the geometry and flow rate in the cyclone and by their size. Large particles reach the wall and are collected.
Traditionally, cyclones have been used as a preseparator ahead of a
A series of cyclones with progressively decreasing cut-points can be used also instead o f impactors to obtain particle size distributions. The advantages are that larger samples are acquired, particle bounce is not a problem, and no substrates are required. Also, longer sampling times are possible with cyclones, which can be an advantage at very dusty streams, but a disadvantage at relatively clean streams. One such series cyclone system was developed by an EPA contractor specifically for the IP program.
, 3- 11
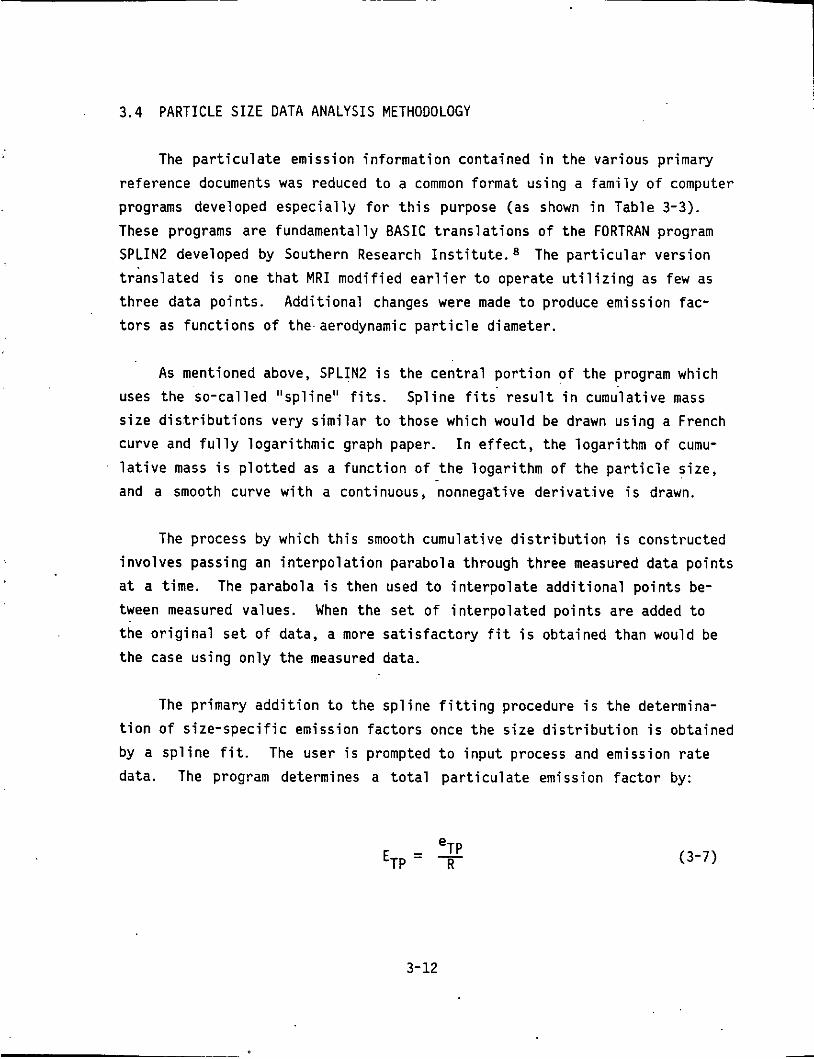
3.4 PARTICLE S I Z E DATA ANALYSIS METHODOLOGY
The p a r t i c u l a t e emission i n f o r m a t i o n contained i n t h e va r ious pr imary
re ference documents was reduced t o a common format us ing a f a m i l y o f computer
programs developed e s p e c i a l l y f o r t h i s purpose (as shown i n Table 3-3).
These programs a re fundamental ly BASIC t r a n s l a t i o n s o f t h e FORTRAN program SPLIN2 developed by Southern Research I n s t i t u t e . 8 The p a r t i c u l a r v e r s i o n
t r a n s l a t e d i s one t h a t M R I mod i f i ed e a r l i e r t o operate u t i l i z i n g as few as t h r e e da ta p o i n t s . Add i t i ona l changes were made t o produce emission fac- t o r s as f u n c t i o n s o f the-aerodynamic p a r t i c l e diameter.
As mentioned above, SPLIN2 i s t h e c e n t r a l p o r t i o n o f t h e program which
uses t h e so -ca l l ed " s p l i n e " f i t s . s i z e d i s t r i b u t i o n s very s i m i l a r t o those which would be drawn us ing a French curve and f u l l y l o g a r i t h m i c graph paper. I n e f f e c t , t he l o g a r i t h m o f cumu- l a t i v e mass i s p l o t t e d as a f u n c t i o n o f t h e l o g a r i t h m o f t h e p a r t i c l e s i ze ,
and a smooth curve w i t h a continuous, nonnegative d e r i v a t i v e i s drawn.
S p l i n e f i t s - r e s u l t i n cumu-lative mass
The process by which t h i s smooth cumulat ive d i s t r i b u t i o n i s const ructed
i nvo l ves pass ing an i n t e r p o l a t i o n parabola through t h r e e measured data p o i n t s a t a t ime. The parabola i s then used t o i n t e r p o l a t e a d d i t i o n a l p o i n t s be- tween measured values.
t h e o r i g i n a l s e t o f data, a more s a t i s f a c t o r y f i t i s obta ined than would be the case us ing o n l y t h e measured data.
When t h e s e t o f i n t e r p o l a t e d p o i n t s a re added t o
The pr imary a d d i t i o n t o t h e s p l i n e f i t t i n g procedure i s t h e determina-
t i o n o f s i z e - s p e c i f i c emission f a c t o r s once t h e s i z e d i s t r i b u t i o n i s obtained by a s p l i n e f i t .
data. The program determines a t o t a l p a r t i c u l a t e emission f a c t o r by: The user i s prompted t o i n p u t process and emission r a t e
- eTP ETP - - R (3-7)
3-12

TABLE 3-3. COMPARISON OF COMPUTER PROGRAMS
Fitted size JSKPRG distribution Spl i ne
JSKRAW JSKLOG Spline Log-normal
Input requirements: particle size data Largest particle diam- Largest particle Completed log-
eter; cumulative diameter; incre- normal size mass fractions; mental mass frac- distribution particle density tions; particle
density
process data Process and emis- Process and emis- Process and emis- sion rates sion rates sion rates - or - - or - - or - emission factor emission factor emission factor .
output: Size-specific emission factors ------------- ._-----_-_____ (English and metric units)
for selected aerodynamic particle diameters
3-13

where: ETP = total particulate qnission factor (lb/ton)
eTP = total particulate emission rate (lb/hr)
R = process weight rate (tons of cement produced/hr)
Emission factors for each particle size range are then obtained by multiply- ing ETP by the mass fraction associated with that range. The programs automatically convert the size-specific emission factors obtained from English units (lb/ton) to the appropriate metric units (kghetric ton), which are tabulated as a part of the output format (1 kg/metric ton = 1 kg/106 g = 1 kg/Mg). As an additional function, each program has the capability of converting from Stoke's diameter to aerodynamic diameter using the appropriate density correction (Table 3-1).
Most of the programs also require that a largest particle diameter be
This value provided to complete the size distribution. dynamic diameter) was assumed unless other data were available. was selected since this is the largest particle size which might be expected based on the limited data contained in the literature. A complete listing of each program is provided in Appendix A of Volume I with sample outputs shown i n Figures 3-1 t o 3-3.
A maximum size of 200 pmA (aero-
Due to the nature of the spline fit routine, a large-scale extrapola- tion (i.e., order of magnitude) of the data can result in a negative slope of the cumulative size distribution curve. In such cases, JSKLOG was used in its place. In JSKLOG, the data input to the program have already been fitted to a standard log-normal distribution utilizing a separate program written for the Texas Instruments Model 59 (TI-59) programmable calculator. This program was used whenever a spline fit was determined not suitable to adequately represent the distribution in the smaller particle size ranges.
3-14

'TES'r ILI: EXAMPLE CllJTPU'T O r ",.JSKFF:G"
X t F ~ . J ' T ' DkTA: F'RUCESS WEIGHT RtATE = 100 TONS F'RQD./HR TOTAL PAHTICULATE EKISSICN RCTE = 100 LP/HF: PARTICLE DENSITY = 2.44 G / C C
EE~S!JFIEKI S I Z E DISTRIPUTION
(.;e r u m j CUN. X <:: CUT
15 25 34
OIJTF'CJ'T LIATA: TP EMISSION FACTOR = 1 LF/T. , .5 KG/HT >
EMISSION FACTOR CUT (unAj CUH. Y. i CUT (LEVT ) ( K G M T )
t 6 2.5 1 1.25 2.5
10 15 20
. c J
1 . ? m o l 2.3787 2,73215 4.25364 6.74744 10 9053 14,567 17 + 9582
,0178801 0.94006E-03 ,023787 .0 118935 + 0273215 ,0136607 0425364 0212682
,109053 ,0545267 * 14567 .0729348 . 179582 .0897908
,0574744 ,0337372
Figure 3-1. Example output o f "JSKPRG."
3-15

15 10 9 16 J 0 c
15 25 34 50 100
,625 1 + 73804 1 2.37873 i ,zs 2,73213 2 .5 4 e 25356
6.74745 10 10.9053 i; 14,567
__ '.> 13 17.9581
c J
.0178804 8.94021~-03 ,0237873 0118937 027321s .Qi3C.&c1? ,0425356 0212683 eQ674745 ,0337373 L 109053 .OS45267 .14557 ,0725345 + 179581 .08979-37
F igu re 3-2. Example o u t p u t of "JSKRAW."
3-16

PARTICUL~TE EMISSION RATE = io0 LE/!+: PARTICLE DENSITY = 2.44 G/CC
UclTF'OT L'IATU: TP E H I S S I O N FACTOF: = 1 L W T ( .S KG/HT)
EHISSION FACTOR CU'T (un,A j Cut?, 7: .: CUT ( LB/T ) < KG/MT 1
625 1.788 .01788 8 e94E-03 1 2 , 3 7 9 ,02379 .0118?5 1.25 2 .732 ,02732 .013&& 3.5 4.254 .04254 ,02127 c J
1 0 15
6.747 10.9 14.57
Figure 3-3. Example output o f "JSKLOG."
3-17

. 3.5 EMISSION FACTOR QUALITY RATING SYSTEM
The quality of the emission factors developed from analysis of the test data was rated utilizing the following general criteria:l
A - Excellent: Developed only from A-rated test data taken from m a y :andom!y cho:cn faci!itie: i n t h e i!?d.stry popu!ation. The source category* is specific enough to minimize variability within the source category population.
- B - Above average: Developed only from A-rated test data from a reasonable number of facilities. Although no specific bias is evident, it is not clear if the facilities tested represent a random sample of the industries. As in the A-rating, the source category is specific enough to minimize variability within the source category population.
C - Average: reasonable number of facilities. Although no specific bias is evident, it is not clear if the facilities tested represent a random sample of the industry. As in the A-rating, the source category i s specific enough to minimize variability within the source category population.
Developed only from A- and B-rated test data from a
* D - Below average: The emission factor was developed only from A- and B-rated test data from a small number of facilities, and there is reason to suspect that these facilities do not represent a random sample of the industry. There also may be evidence of variability within the source category population. Limitations on the use of the emission factor are footnoted i n the emission factor table.
* Source category: A category i n the emission factor table for which an emission factor has been calculated (generally a single process).
3- 18

E - Poor: The emission f a c t o r was developed from C- and D-rated t e s t data, and the re i s reason t o suspect t h a t t he f a c i l i t i e s t e s t e d do n o t represent a random sample o f t h e i n d u s t r y . There
a l s o may be evidence o f v a r i a b i l i t y w i t h i n the source category populat ion. L i m i t a t i o n s on t h e use of these f a c t o r s a re always footnoted.
The use o f t h e above c r i t e r i a i s somewhat s u b j e c t i v e depending t o a l a r g e e x t e n t on t h e i n d i v i d u a l reviewer. D e t a i l s o f how each candidate emission f a c t o r was r a t e d a re prov ided i n each s e c t i o n o f t h i s repo r t .
3-19

REFERENCES FOR SECTION 3.0
. .
1.
-. 7 .
3.
4.
5.
6.
7.
8.
Technical Procedures f o r Developing AP-42 Emission Factors and Prepar- i n g AP-42 Sect ions, U. S. Environmental P r o t e c t i o n Agency, Research
T r i a n g l e Park, NC, A p r i l 1980.
S. C a l v e r t ; e t a l . ~ Wet Scrubber Systems Study. Volume I: Scrubber
Handbook, EPA-R2-72-118a (NTIS PB 213 OX), U. S. Environmental Protec-
t i o n Agency, Research T r iang le Park, NC, August 1972.
J. B. Galesk i , P a r t i c l e S ize D e f i n i t i o n s f o r P a r t i c u l a t e Data Ana lys is ,
EPA-600/7-77-129 (NTIS PB 276 470), U. S. Environmental P r o t e c t i o n Agency, Washington, D.C., November 1977.
J. P. Sheehy, e t a l . , Handbook o f A i r P o l l u t i o n , 999-AP-44 (NTIS PB 190
247), U.S. Department o f Heal th , Education, and Welfare, Durham, NC, 1968.
H. L. Green, and W. R. Lane, P a r t i c u l a t e Clouds: Dusts, Smokes and M i s t s , E.F.N. Spon, Ltd. , London, 1964.
R. Dennis, Handbook on Aerosols, TID-26608, Energy Research and Develop-
ment Admin i s t ra t i on , Washington, D.C., September 1978.
W. B. Smith, e t a l . , Technical Manual: A Survey o f Equipment and
Methods f o r P a r t i c u l a t e Sampling i n I n d u s t r i a l Process Streams, EPA- 600/7-78-043 (NTIS PB 282 501), U. S. Environmental P r o t e c t i o n Agency, Research T r i a n g l e Park, NC, March 1978.
J . W. Johnson, e t a l . , A Computer-Based Cascade Impactor Data Reduc-
t i o n System, EPA-600/7-78-042 ( N T I S PB 285 433), U. S. Environmental P r o t e c t i o n Agency, Resea rch T r i a n g l e P a r k , NC, March 1978.
3-20

SECTION 4.0
PARTICULATE EMISSION FACTOR DEVELOPMENT
This section describes the test data and methodology used to develop particulate emission factors for the cement industry.
4.1 REVIEW OF SPECIFIC DATA SETS
A total of 55 reference documents were collected and reviewed during the literature search conducted as part of this are listed at the end of this section along with an indication as to whether the document contains particle size data.
These documents
The original group of 55 documents were reduced to a final set of pri- mary references utilizing the criteria outlined in Section 3.0 of this re- port. For those reference documents not used, the following summarizes the reason(s) for their rejection:
Reference No.
1 2
3 4
5-7
a 9 19 22 23 28
Cause(s) for Rejection
No test method specified. No test method or plants specified; ranges of emission rates only. No test method specified. No test method or fuel type specified. No test method specified; little documentation; data for all kilns combined. Not original source of test data. Not original source of test data. Not original source of test data. Kiln dust disposal study -- no emissions data. Not original source of test data. Not original source of test data.
4-1

Reference No.
29 34 35 37 38 _ _ 41 45
47
49 55
Cause(s) for Rejection
Not original source of test data. SO,/NO data only - no particulate tests. Type o? process and fuel not specified. Type of process not specified. Type of process not specified. Type of control device not specified. Process description only - no test data (used as reference for review of other test reports). Data deleted due to nonconsistent combination of control devices. Sources tested not specified. Type of process not clearly specified (probably wet process).
The following is a discussion of the data contained in each of the pri- mary references used to develop candidate emission factors, according to reference number and date of publication. Init.ially, all. emission factor calculations were performed in terms of weight of pollutant per weight of cement produced. Later, the emission factors developed were converted to weight of pollutant per weight of clinker for those sources producing or processing this particular material (i.e., kilns and coolers).
4.1.1 References 10 through 17 (1971)
References 10 through 17 are source tests of nine different cement The purpose of these tests was to plants conducted by EPA contractors.
gather emissions data on well controlled plants to develop New Source Per- formance Standards (NSPS) for the cement industry. All of the tests were performed using EPA reference test methods with sampling conducted at the outlet of some type of dust collector. Emission factors were presented in each report in terms of pounds of particulate matter per ton of feed mate- rial. A summary of the data contained in References 10 through 17 is shown in Table 4-1.
Upon review of References 10 through 17, it was determined that the sampling protocol used and test results obtained were fairly well documented in each report. It was noted, however, that very little process operating
4- 2

. .
P 3” 0
+I
n 0) d
U .-
+I
3”
0 u
3
4- 3

VI c c
u E -D
e- c > o w u w
U
? E
P - .- .J E m
n e 4 0 c- .r w w Y ) E W m w w c L L € 3 o Vl- m o 0 0 W E = - 0 - L e 0 0. L U n .J u- c m w 0 - u
L O Y )
L . Y )
0 0 ) z u
V W c Y)
W + Y) W U L 3 0 VI
VI VI w w
L I *
c 0 c u 0 . W
e .J c
*
.- m - E
m - u L 0
w . L O z < * w
n
m C .
w o D L Z
S m
m
m
0 0
z
s 9 0 0
n m N 0 0
n
L W
0 0 u L W r c
u N
-
.r ?
d z
.J
3"
0 u I c x o+ E w . u c
0 -.J
w 3 m m
EZ
LD 0
f h
9 3
5 m
m
0 N d 0 0
3 0 N 0 0
N m 3 0 0
0
- .CY) "7% .r VI c - m Y C
NU c O L z u
- .-
r m
m
3 LD N
0
:: 01
0
h 9 N
0
0
2 m .J 0 P;
0 o L L
v)
0
- m
3 m
m
-01 nu 0 mcI NN 0 03 0 0 0 0 0 0 0 0 00 0 0 0 . . 0 0 00 0 _ - . - . 01- m N N q -01 3 N 0 0 00 0 0 00 00 00 00 00 0 0 0 0
00 00 00
= m
m
9 CI 0 0
0
h3 39 00 0 0 0 0
0 0
9
. .
n
4- 4
x
m
- - L
VI VI W " z - .J 0 c
% n m c c m n - x - - 0 L I c 0 U L W u .J W 9
W 5
g t 2 % 0 %
L 0 . .r u m c
W It L c w O L e
. w
L 3 w
L o . c c c m w L L 4 m m w c c
.C m
n
" k
.-
$ 2 VI Y ) r
m m

data were -collected for the dates and times during which testing took place. For this reason and the fact that these particular facilities represent well controlled, operated, and maintained plants (as specified by NSPS), a rating of B was generally assigned to the data. with either the operation of the process or in the collection of the samples was mentioned, a rating of C was assigned to the data (see Table 4-1). Copies o f pertinent sections of each test report are included in Appendix A.
For certain tests, where problems
4.1.2 Reference 18 (1974)
Reference 18 is a report of source tests conducted by an EPA contractor at a cement plant located i n Arizona. The purpose of these tests was to provide background data for the development of an NSPS for stone crushing. Individual sources tested i n this study included: a primary crusher; a .
primary screen; a conveyor transfer point; and a secondary crushing and screening plant. ..
The total mass emissions from each source tested were determined at the outlet of a baghouse collector utilizing EPA Method 5. Four runs were conducted at each test location with emission factors calculated based on the total amount of feed material. A summary of the test data presented in Reference 18 has also been shown in Table 4-1. For reasons similar to those presented above for References 10 through 17, a rating of B was likewise assigned to the Method 5 data contained in Reference 18. tions of the test report are contained in Appendix A.
Appropriate sec-
Eight particle size tests of the uncontrolled emissions from the pri- mary crusher were also conducted with five additional tests being performed on the emissions from the primary screen. In both cases the measurements were made upstream of a baghouse collector. No determination of total mass emissions were conducted at these sampling locations. of the particulate emitted from each source was made using a Brink Model B cascade impactor with cyclone precollector. Since no Method 5 tests were conducted at the same locations as the Brink tests, the data contained in Reference 18 could not be used in the development of size-specific emission factors.
The size distribution
4- 5

4.1.3 Reference 20 (19761
Reference 20 i s a study conducted by an EPA c o n t r a c t o r t o determine
the performance c h a r a c t e r i s t i c s o f t h ree i n d u s t r i a l e l e c t r o s t a t i c p r e c i p i - t a t o r s (ESPs). One o f t h e f a c i l i t i e s t e s t e d i n t h i s program was a wet pro-
cess cement k i l n f i r e d w i t h a combinat ion o f coal and coke oven gas. Tests
were mndnctec! a t the i n l e t and o u t l e t of t h e p r e c i p i t a t o r which represented
t h e u n c o n t r o l l e d and c o n t r o l l e d emissions from t h e k i l n . Un fo r tuna te l y , no
process data were c o l l e c t e d du r ing t e s t i n g based on an agreement w i t h p l a n t management. Since t h e purpose o f t h e s tudy was t o evaluate t h e performance
o f t h e ESP and n o t t o cha rac te r i ze t h e source, t he l a c k o f process data d i d
n o t c rea te a se r ious problem f o r t h e c o n t r a c t o r per forming t h e study.
Tes t i ng a t t he i n l e t was conducted u s i n g a B r i n k Model BMS-ll.cascade impactor f i t t e d w i t h a cyclone p r e c o l l e c t o r . The B r i n k impactor i s essen-
t i a l 1 y . a f i n e p a r t i c l e sampler and i s g e n e r a l l y n o t w e l l s u i t e d t o uncon-
t r o l l e d sources w i t h a s u b s t a n t i a l p o p u l a t i o n o f l a r g e p a r t i c l e s . A deter-
m ina t i on o f t o t a l mass l oad ing a t t h e ESP i n l e t was n o t performed d u r i n g the
program. A t t h e o u t l e t o f t he ESP, t o t a l mass emissions were determined us ing EPA Reference Method 5 w i t h an Andersen Mark I11 cascade impactor used
f o r determin ing p a r t i c l e s ize.
-. ihe data c o i i e c t e a i n t h i s study were n o t presented i n aily s i g n i f i c a n t
d e t a i l i n Reference 20. However, these da ta were entered i n t h e EADS-FPEIS data base (Test Ser ies No. 80) from which a p r i n t o u t was obtained. Since no
v e r i f i c a t i o n o f t h e EADS data cou ld be made, t h e values repo r ted were ac-
cepted a t face value. It was learned from conversat ions w i t h t h e c o n t r a c t o r t h a t t he t e s t r e s u l t s obta ined d u r i n g t h e study were entered d i r e c t l y i n t o
EADS under a separate e f f o r t w i t h t h e raw da ta never a c t u a l l y appearing i n a pub1 i shed r e p o r t . 30
Based on a review o f Reference 20 and telephone conversat ions w i t h the con t rac to r , i t was determined t h a t t h e p a r t i c l e s i z e data c o l l e c t e d a t t he
o u t l e t o f t he ESP were i n v a l i d . 5 6 These t e s t s were i n v a l i d a t e d due t o the
format ion o f a r t i f a c t s on the f i b e r g l a s s subs t ra tes used i n the Andersen
4-6

impactor du r ing sampling, which - c rea ted abnormally h i g h loadings t o be mea- sured. For t h i s reason, none o f t h e o u t l e t data f o r these t e s t s are pre-
sented i n t h i s r e p o r t o r used i n t h e development o f candidate emission fac- t o r s . A summary o f t he t e s t r e s u l t s c o l l e c t e d a t t h e i n l e t t o t h e E S P i s prov ided i n Table 4-2.
The i n f o r m a t i o n contained i n Reference 20 and i n t h e €ADS p r i n t o u t However, t h e conspicuous were determined t o be o f f a i r l y good q u a l i t y .
l a c k o f documentation d e f i n i t e l y lowered the o v e r a l l r a t i n g which cou ld be assigned t o t h e data us ing t h e c r i t e r i a es tab l i shed by OAQPS. Based on t h e
f a c t o r s s t a t e d above, a r a t i n g o f C was g i ven t o t h e data contained i n Ref-
erence 20 and t h e associated EADS p r i n t o u t . o f Reference 20 and the EADS p r i n t o u t a re a l s o inc luded i n Appendix A.
Copies o f p e r t i n e n t sec t i ons
4.1.4 Reference 2 1 (1976)
Reference 2 1 i s a study conducted by an EPA c o n t r a c t o r t o determine the f r a c t i o n a l e f f i c i e n c y c h a r a c t e r i s t i c s o f a gravel bed f i l t e r (Rexnord) c o n t r o l l i n g t h e emissions from a c l i n k e r cooler . Tes t i ng was conducted a t
bo th t h e i n l e t and o u t l e t o f t h e gravel bed us ing a number o f d i f f e r e n t p a r t i c l e s i z i n g instruments. Due t o t h e nature o f t h e source and i t s as-
soc ia ted emissions, on l y t h e data c o l l e c t e d by i n s i t u Sampling us ing cascade impactors a re o f i n t e r e s t i n t h e development o f s i z e - s p e c i f i c emis-
s i o n fac to rs .
Dur ing t h e sampling program, t e s t i n g was conducted over a several day p e r i o d i n bo th August and November o f 1975. I n the August t e s t se r ies , b o t h
t o t a l mass emissions and p a r t i c l e s i z e d i s t r i b u t i o n s were determined a t t h e i n l e t and o u t l e t o f t h e gravel bed f i l t e r . I n November, o n l y the i n l e t and o u t l e t p a r t i c l e s i z e d i s t r i b u t i o n was character ized.
The t o t a l mass emissions from t h e c l i n k e r coo ie r were measured a t t h e i n l e t t o t h e gravel bed and i n the s t a c k us ing EPA Reference Method 5. Dur ing t h e August t e s t s , t h e i n l e t p a r t i c l e s i z e d i s t r i b u t i o n was deter-
mined us ing bo th a B r i n k and an Andersen cascade impactor w i t h o n l y an
4- 7

, 4-8

Andersen u n i t used a t t h e o u t l e t . e l iminated from the program.
I n November, t h e B r i n k impactor was
A t o t a l of 17 t e s t s were conducted a t t h e inlet t o t h e gravel bed f i l - A t t h e out- ter using t h e Andersen impactor and e i g h t tests w i t h t h e B r i n k .
l e t , a t o t a l of 24 t e s t s were conducted u s i n g t h e Andersen impactor. The da ta obtained from these t e s t s a r e summarized i n Tables 4-3 through 4-7 f o r both t h e August and November tes ts .
The main purpose o f the s tudy descr ibed i n Reference 2 1 w a s t o eva lua te the e f f i c i e n c y of t h e cont ro l device not t o cha rac t e r i ze the emissions from the source. For t h i s reason, t h e process da t a included i n t h e r e p o r t were a t b e s t minimal. w i t h t h e B r i n k o r Andersen impactor were e i t h e r not c a l i b r a t e d o r otherwise had an undefined cu t -poin t a t the time of t e s t i n g . Also, as s t a t e d above, the use of a B r i n k impactor i s not the b e s t choice f o r t e s t i n g of uncon- t r o l l e d sources. For t h i s reason t h e B r i n k impactor da t a were e l imina ted from cons idera t ion i n t h e development of candidate emission f a c t o r s .
In add i t ion , t h e cyclone p reco l l ec to r s used i n conjunct ion
I t was also mentioned i n t h e r e p o r t t h a t a problem w i t h p a r t i c l e bounce had been observed w i t h the impactor samples co l l ec t ed as evidenced by the un- usua l ly high loadings on t h e backup f i l t e r s . w i t h t hese types of t e s t s , b u t can d e f i n i t e l y b i a s the results obtained. For the above reasons, a r a t i n g of C was assigned t o the da ta i n Reference 21. A copy of appropr ia te por t ions of t h e r e p o r t have been included i n Appendix A .
T h i s problem i s not uncommon
4 .1 .5 Reference 24 (1977)
Reference 24 i s an in-house compliance t e s t performed on a c o a l - f i r e d , wet process cement k i l n equipped w i t h an ESP. Emissions t e s t s f o r t o t a l p a r t i c u l a t e were conducted both upstream and downstream o f t h e ESP u t i l i z i n g EPA Method 5 protocol . emissions from t h e k i ln w i t h an add i t iona l s i x runs conducted of t h e con- t r o l l e d e f f l u e n t .
Twelve t e s t runs were performed of t h e uncontrol led
4-9

q ~ o o ~ m ~ o o ~ o OWdiNdiNO N
o o m m m o o o - 0 r t o l t - 0 0 ot.o~ooloolt 33330333
~ o ~ o h c m m m m N N N N N N N N . . . . . . . . m m m m m m m m
4-10

I n u w u e m
4-1 1

a W -1 0 E a W Y z CI -1 V
0 W -1 -1 s !i 0 U z 3
I
Lo I d W -I m I5
U r 0
I z c \
L
a C C II L a h .r u a r L
+ L II C
> L C C
r 4 C
.r
.r
r
u U
2
> m W o 4
. E o a v
b
a u I E m l a 0
m
d rl 1 4
P I E
0
cox
rl
Go4 I E Q 1 rl
b
Go4 I E r l l m
0 f-0
W E 1
h
.a
c, L m c, v)
W c, m 0
N rlrlNNdQ
4-12
c W Y m c,
VI c, c W E W k d VI m
h
4 X
w c W
.r
n n a
.N
v
rl
W U c W L W L W a 'c 0
Q m W m m n .. rl
k W
n m I-
O W Lc,
L V -
C L W z w m w
m - c , W m > u m
L a m N .r 0 VI-
W c , - a U ? .r c c, .r L mc,
c
E L
.r
c,n
a m
VI c 5 7
0 u m c 3 = 0 e 0) c c,
e
w W c m c, C 0 U
VI W m c m L W N
VI
W
u c, L m
VI
0
L m > W c c,
C
VI W
.r - ?
.r
.r
.r
7
.r
n
a .r
.r
a m
m w
m m
- 5 .
L c c , .r W W E
0 .r 7 -
V I U VI .r m E
- 2 , o w 0 L
v ) u
E g
5 W
VI 01
c, VI
L 0 c, u m E
m m
n .r
s c,
c, VI L .r L
w c m r U c, m U
W c 0
u - 2'
z VI W - U E +I
VI - .r
W
U
c, L m n W N
VI L m > 0
2, n U W c, m c E 0 w W
.r
.r
n
$ r W L
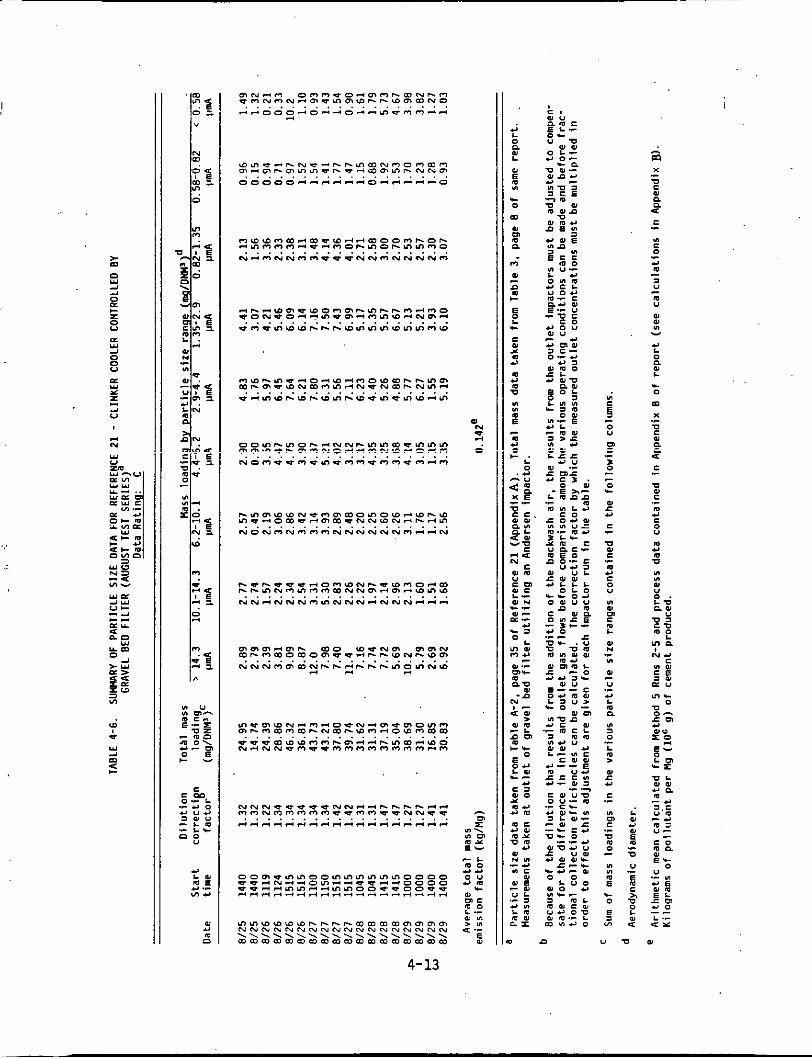
B
z 2 2
c r 0 u U W 2 0 0 u
Y L
2 u ?F.
N
4-13
2 L 0 P (Y
D
B Y)
L 0 m u m 9 P
0
0
0 m I-
- B L b
c (Y x 9 e 9 c 9 O Y) an s


!
I . .,
I 8 .
I
, '
!
I
i I
I ' 1
I ' I
1 .
Results of these tests showed an average uncontrolled emission' rate of 4.57 Mg/hr (5.03 tons/hr) with normal insufflation and 4.79 Mg/hr (5.27 tons/hr) at elevated insufflation rates. For the controlled emis- sions, an average emission rate of 13.03 kg/hr (28.70 lb/hr) was obtained for normal operation with a value of 17.51 kg/hr (38.57 lb/hr) obtained after upgrading the ESP. Appropriate excerpts from the test report have been provided in Appendix A.
A review of Reference 24 showed the data to be of good quality but somewhat lacking in documentation. A detailed description of the process was not provided which was also the case for calibration of the test equip- ment. Given the above factors, a rating of B was assigned to the test data contained in Reference 24.
4.1.6 Reference. 25 (1977)
Reference 25 reports the results of in-house compliance tests conducted -
on four coal-fired, dry process cement kilns equipped with a combination multiclone and ESP. The effluent gases from Kiln Nos. 2 and 3 are dis- charged through the north stack while Kiln Nos. 4 and 5 utilize the south stack for this purpose. Three test runs for total particulate were con- ducted on both the north and south stacks using EPA Reference Method 5.
The results of the above tests showed an average plant emission rate o f 10.6 kg/hr (23.4 lb/hr) for all four kilns. The clinker production rate during these tests was 15.1 Mg/hr (16.6 tons/hr), 14.3 Mg/hr (15.8 tons/hr), 15.7 Mg/hr (17.3 tons/hr), and 16.9 Mg/hr (18.6 tons/hr) for Kiln Nos. 4, 5, 2, and 3, respectively. Applicable portions of the test report have been provided in Appendix A.
It was found that the test data collected i n the above study were ob- tained using sound methodology and that adequate documentation was provided in the report. However, since calibration sheets for the test equipment were not included, a rating of B was assigned to the data contained in Ref- erence 25.
4-15

4.1.7 Reference 26A/B (1979)
Reference 26A/B i s t h e two volume r e p o r t o f a study conducted by an EPA c o n t r a c t o r o f t h e e f f e c t i v e n e s s o f var ious combustion m o d i f i c a t i o n s as a means o f improving thermal e f f i c i e n c y and c o n t r o l l i n g emissions i n indus-
t r i a l combustion equipment. The program p rov ided f o r t e s t s on a t o t a l o f -- 77 different i n d u s t r i a l combustion devices, some o f which i nc luded ana lys i s
f o r t r a c e element and organic emissions.
r o t a r y cement k i 1 ns.
O f t h e 22 devices tes ted , two were
The f i r s t u n i t t e s t e d (Locat ion 3) was a d r y process k i l n f i r e d w i t h a Test- combinat ion o f approximately 66% coke and t h e remainder n a t u r a l gas:
i n g f o r bo th t o t a l mass emissions and p a r t i c l e s i z e d i s t r i b u t i o n was con- ducted, between t h e m u l t i c l o n e and baghouse. T o t a l mass emissions were determined us ing EPA Reference Method 5 and p a r t i c l e s i z e w i t h a B r i n k
Model EMS-11 cascade impactor. One Method 5 r u n (Test 3-2) and one B r i n k
impactor t e s t (Test 3-3) were conducted d u r i n g t h e program w i t h no major sampling problems noted. A summary o f t h e r e s u l t s obta ined f o r t h e Loca- t i o n 3 k i l n i s p rov ided i n Table 4-8.
The second u n i t t e s t e d (Locat ion 9) was a wet process k i l n f i r e d w i t h n a t u r a l gas and equipped w i t h an ESP. Two s e r i e s o f t e s t s were conducted
on the Locat ion 9 k i i n . The f i r s t s e r i e s o f t e s t s were performed a t t h e
k i l n o u t l e t ( i n l e t t o ESP), and thus represent an u n c o n t r o l l e d f a c i l i t y . The sampling p o r t used f o r these t e s t s was l o c a t e d i n one o f two ducts
j o i n i n g t h e k i l n and ESP. Two Method 5 and two p a r t i c l e s i z e t e s t s were
conducted d u r i n g t h e f i r s t t e s t se r ies . The f i r s t Method 5 and impactor r u n (Tests 9-1A&C) were rep resen ta t i ve o f normal k i l n ope ra t i on w i t h t h e o t h e r two t e s t s (Tests 9-2F&G) performed a t reduced excess combustion a i r . Procedures and equipment i d e n t i c a l t o those descr ibed above f o r t h e Loca-
t i o n 3 k i l n were used i n bo th cases. t e s t s i s l i k e w i s e shown i n Table 4-8.
A summary of t h e r e s u l t s o f these
4-16
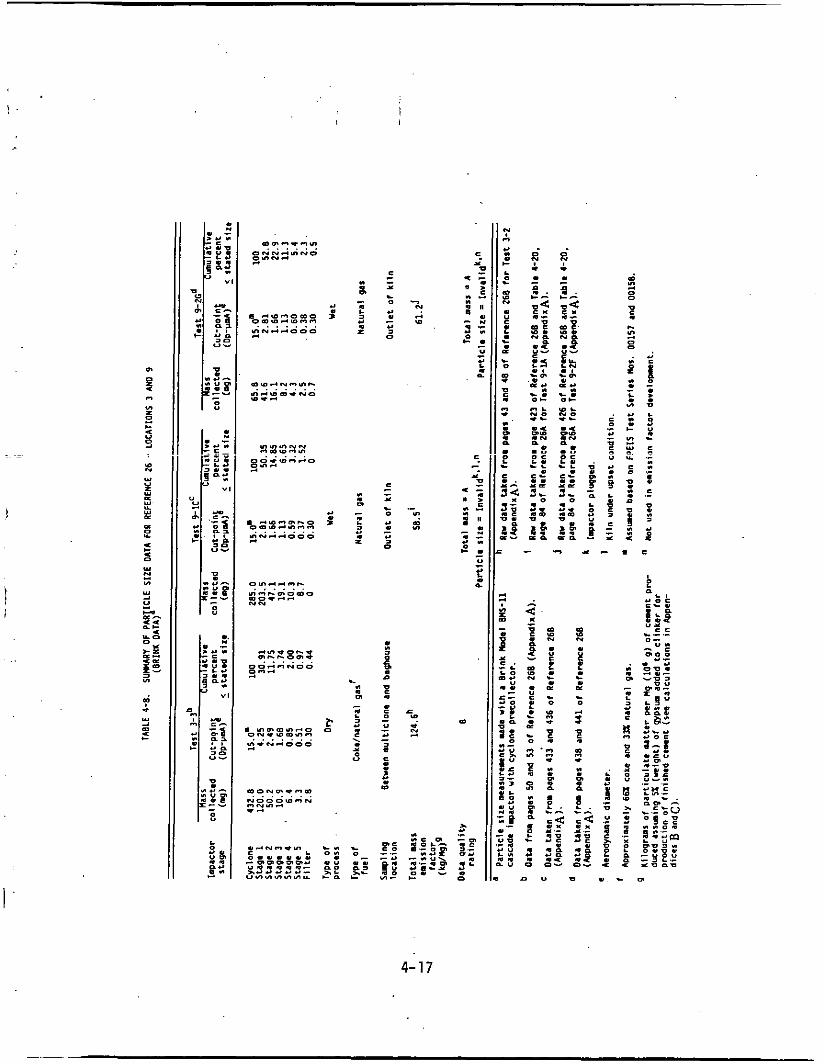
01
2
4-17

The second s e r i e s of t e s t s a t the Location 9 k i l n (Tes ts 9-3 t o 9-6) were conducted a t both t h e i n l e t and o u t l e t of t h e ESP using t h e EPA' s Source Assessment Sampling System (SASS) t r a i n and a modified Level I/Level I1 as- sessment f o r t r a c e elements and organics . The SASS t r a i n consists of a s e r i e s of cyclones w i t h nominal cu t -poin ts of 10, 3 , and 1 V m A , r e spec t ive ly . The r e s u l t s of t h e t e s t s using t h e SASS t r a i n a r e shown i n Table 4-9.
There were a number of problems noted w i t h t h e da t a i n Reference 26 f o r t h e t es t s conducted a t Location 9. The f i r s t major problem involved t h e plugging of t h e B r i n k impactor during Tes ts 9-1C and 9-2G and of the SASS t r a i n during Tes ts 9-3 and 9-4. T h i s plugging occurred a s a r e s u l t of t h e extremely high loadings encountered a t the k i l n o u t l e t wh ich r e s u l t e d i n terminat ion of each t e s t . Since the SASS t r a i n was a l s o r e l i e d upon f o r determining t o t a l mass emissions, these r e s u l t s a r e , l ikewise , i nva l id f o r Tes ts 9-3 and 9-4. In add i t ion , dur ing T e s t 9-1C the k i l n was experiencing an upset condi t ion . For the reasons s t a t e d , t h e da ta from Tes ts 9-1C, 9-2G, 9-3, and 9-4 were determined t o be ques t ionable and t h u s not used i n t h e de- velopment of candidate emission f a c t o r s .
The remainder of t h e test da t a contained i n Reference 26 were found t o be of genera l ly good q u a l i t y w i t h adequate documentation. The only major --hlcn: y I Y Y I fcund was t h e f a c t t h a t C R ! ~ CK t e s t was performed f o r t o t a l mass and p a r t i c l e s i z e on t h e Location 3 k i ln . ass igned t o Tes t 3-2 and 3-3 and a r a t i n g of A t o the remainder of the usable da t a i n Reference 26. provided i n Appendix A .
For t h i s reason a r a t i n g of B was
Copies of appropr i a t e s ec t ions of t h e two r e p o r t s a r e
4:l.B Reference 27 (1979)
Reference 27 i s a s tudy of t h e f i n e p a r t i c l e emissions from a v a r i e t y of source ca t egor i e s i n t h e South Coast Air Basin (Los Angeles) o f Cal i fo rn ia a s conducted by a con t r ac to r t o t h e C a l i f o r n i a Air Resources Board ( C A R E ) . Two of t h e tests included i n this s tudy were of the emissions from a dry process cement k i l n con t ro l l ed by a baghouse d u s t c o l l e c t o r .
4-18

4 c z5 v) VI
v) a U
m
I
W N
W V z W OL W U W a a 0 U
a l- a n W N n v)
W 1 0 n
k 2 U 0
m I d W J
b-
m a
m m e m c , o m c, ‘r
L
0 I
U
m > c
.C
7
c(
rl r- W
0 W
$
W OD W m
rl W
m .A
W W
z
0
N d
m
c, W
c 7
.r
n v) W
01 m I 0-7
‘0 .- 7
m > c CI
d N w
m m m N
d OD m m
m m N m
m d W m
P- N
m w
cr 0)
c
0 cn W
c
.r
a d
0-7 I
4
r- W
0 m
3 ui W
0
0 I n
m
r- N rl
0
m m rl
0
c, W
cr 0
a. v) W
c
a
LD I m
a
. N r- m N
x N r-
Y- a z
0 m r(
0
r- m t-l
0
cr W
c,
0
- a
n v) W
ID a m
c,
a 0 + z v ) .
4-19
I W c n U .r
c m 1c 0
0 n
I
U a
n u AS
3 : ln
c .- a E W
VI l n W m u c
U W W L U W
U W 0a L 0
c, c - W N
W U W
m c m
a N
a +
n’c
E m
o n c - W ) r l Y N e l .- d U W -
a! N N 0 c u c
W
0 L 0. v) W U
u c c.(
-
n
a ?
a W N
u W c, u W
0 u W
- 7
7
n 5 ln
0 z
U W ’c
I

During t h e sampling program, t e s t s were. r u n a t t h e o u t l e t of t h e bag-
The s i z e d i s t r i b u t i o n of t h e pa r t i cu - house while t h e k i l n was f i r ing coal and while f i r i n g na tura l gas. One t e s t was performed f o r each type of f u e l . l a t e emanating from t h e k i l n baghouse was determined using a SASS t r a i n .
The da ta obtained from the CARE s tudy were en tered i n t o the EADS-FPEIS system from which a p r i n t o u t was obtained. A suiimavy o f t h e da ta contained i n Reference 27 i s provided i n Table 4-10 w i t h a copy of t h e p e r t i n e n t sec- t i o n s of t h e d r a f t r e p o r t included i n Appendix A. Upon checking w i t h t h e con t r ac to r i t was learned t h a t t h e d a t a f o r Tes t Runs 9 and 18 were not changed i n the f i n a l r e p o r t from t h a t included i n t h e d r a f t a s shown i n Appendix A.
From an a n a l y s i s of Reference 27, i t was determined t h a t t h e p a r t i c l e s ize measurements were made using sound methodology, and the document does conta in adequate information f o r va l ida t ion . However, s ince only one t e s t was conducted f o r each type -of f u e l , a r a t i n g of B was assigned t o the da ta .
4.1.9 Reference 30 -(1979)
Reference 30 is the r epor t of a source tes t conducted on t h r e e coal- f i r e d , dry process cement k i l n s equipped w i t h suspension prehea ters and bag- house dus t c o l l e c t o r s . The k i l n baghouses were operated under a p o s i t i v e pressure w i t h the e f f l u e n t gases vented t o the atmosphere through a roof monitor i n s t ead of a stack(s).
Since the above baghouses were not equipped w i t h a s t a c k , s tandard source testing procedures were not used. p l e r s were i n s t a l l e d i n t h r e e of the s ix c e l l s of each baghouse t o measure t h e p a r t i c u l a t e emission r a t e from t h e k i l n s . A t o t a l of t h r e e t e s t s were conducted.on Baghouse Nos. 1 and 3 w i t h two t e s t s conducted on Baghouse No. 2. The results of t h e s e tests a r e summarized below:
Ins t ead , high volume-type a i r sam-
4-20

0 rl I *
W -1
4 I- m
0 N
0 U
N m
Eo
$4 ' r l
0
rl N
0
VI m cn
m
4-21
* m
U m
d N
m
N N
0
m U
0
7 m 0 U
U W N
L W >
0.
.r
7 a
m rl
VI c, VI W c, .c +r 0 m
L W Y c
U
c, 0 c e c al E W U
c 0
U W II)
.r -
m n U W c, m s U
m U
W
0 c,
- 7
n
n 4
v W e m
U
m U
W
0 c,
v al
In II)
7 a F
n
5 a
n 4 X U c W
.r
n n a v
c, L 0
al L e 0
Eo 0 rl I *
n
d
e E
i .
Q
U n U

Total Particulate
Baghouse/ Run Emission Rate Ki 1 n Feedrate Kiln No. - No. 1 b/hr kg/hr tons / h r Mg/hr
1 1 1.94 0.881 36.5 33.1 2 1.02 0.463 39.0 35.4 3 1.24 0.563 40.4 36.7
2 2 2.67 1.21 34.8 31.6 3 3.29 1.49 36.1 32.8
3 3 . 3.50 1.59 40.1 36.4 4 3.37 1.53 40.7 36.9 5 3.49 1.58 41.0 37.2
Applicable portions of the test report are provided i n Appendix A.
It was determined from an evaluation o f the information contained in Reference 30 that the measurements were conducted using a generally sound although nonstandard methodology. In addition, certain problems were noted with calibration of the sampling equipment used. Based on these factors, a rating of C was assigned to the data contained in Reference 30.
4.1.10 Reference 31 (1979)
Reference 31 is an internal report of source tests conducted on four coal-fired, dry process kilns located at a plant in Virginia. kilns (Nos. 1, 3, and 4) were equipped with a cooling/conditioning tower, multiple cyclone dust collector, and electrostatic precipitator connected in series. The fifth kiln (No. 5) was equipped with a Lepol preheater/ pelletizer and double chamber ESP.
Three of the
A minimum of six test runs were conducted on each kiln stack utilizing
Results of EPA Method 5. For the No. 5 kiln, testing was performed both with and with- out flue gas being bypassed to a raw grinding mill circuit(s). these tests are summarized below:
4-22

Total P a r t i c u l a t e Average Clinker
K i l n Stack Emission Rate Production Rate No. * 1 b/hr kg/hr tons /hr Mg/hr
1 28.4 . 12.9 14.1 12.8 3 23.6 10.7 14.4 13.1 4 28.9 13.1 19.0 17.2 5a 38.4 17.4 64 58 5b 20.3 9.2 66 60 5c 12.2 5.54 67 61
3r 5a = No gas bypass; 5b = Gas bypassed t o one raw m i l l ; 5c = Gas bypassed t o two raw mills.
I n l e t tests were a l s o conducted during t h e sampling program on t h e Kiln No. 5 ESP, b u t the da ta were de l e t ed from cons idera t ion due t o l ack of ade- quate documentation. Appropriate excerp ts from t h e t e s t r epor t have been included i n Appendix A.
Upon review of the s t ack da ta contained i n Reference 31, i t was de te r - mined t h a t the t e s t s were conducted u s i n g a genera l ly sound.methodology. However, some of t h e raw da ta Sheets f o r t h e No. 5 k i l n tests were found t o be missing from t h e repor t . .Also, no c a l i b r a t i o n da ta were included f o r t h e s t ack t e s t i n g equipment. assigned t o t hese data .
Based on t h e s e d e f i c i e n c i e s , a r a t i n g of B was
4.1.11 Reference 32 (1980)
Reference 32 is a source t e s t conducted of the e f f l u e n t from a gravel bed f i l t e r c o n t r o l l i n g t h e emissions from t h r e e grate- type c l i n k e r coolers . Three EPA Method 5 t e s t s were performed during t h e study. Resul ts of t hese tests were 6.72 kg/hr (14.8 l b / h r ) , 6.17 kg/hr (13.6 l b / h r ) , and 5.86 kg/hr (12.9 l b / h r ) , r e spec t ive ly , f o r an average c l i n k e r f eed ra t e of 76.0 Mg/hr (83.8 tons /hr ) . Appendix A.
Applicable por t ions of t h e t e s t r e p o r t a r e provided i n
4-23
I

I t was determined t h a t t h e da t a contained i n Reference 32 were of good q u a l i t y and t h e tes ts were well documented. ass igned t o the results of the above tests.
Therefore , a r a t i n g of A was
4.1.12 Reference 33 (1980)
Reference 33 i s a companion s tudy t o t h a t descr ibed i n Keference 32 above. Three EPA Method 5 tests were performed of t h e emissions from a c o a l - f i r e d , dry process k i l n equipped w i t h cyclones and baghouse dus t co l - l e c t o r . Resul ts of t h e s e tes ts ind ica t ed con t ro l l ed emission r a t e s of 3 .1 , 3.0, and 2.8 kg/hr (6 .9 , 6.6, and 6.1 l b / h r ) , r e spec t ive ly , a t an average c l i n k e r production r a t e of 30.0 Mg/hr (33 .1 tons /hr ) . Excerpts from the t e s t r epor t a r e provided i n Appendix A .
Upon eva lua t ion of t h e information contained i n Reference 33, i t was determined t h a t t h e t e s t protocol was sound and adequate documentation was provided. t o the t e s t da t a included i n Reference 33.
Using t h e c r i t e r i a developed by OAQPS, a r a t i n g of A was assigned
4.1.13 Reference 36 (1980)
Reference 36 i s t h e r epor t of a source t e s t conducted of t h e c o n t r o l l e d emissions from a c l i n k e r cooler equipped w i t h a baghouse. performed of t h e emissions from the coo le r baghouse using EPA Method 5. Results of t hese t e s t s i nd ica t ed an average p a r t i c u l a t e emission r a t e of 0.0499 kg/Mg of feed (0.0997 lb/ ton of feed) . t e s t r e p o r t a r e included i n Appendix A.
Three t e s t s were
Appropriate po r t ions of t h e
I t was determined from a review of Reference 36 t h a t the t e s t s were However, a thorough probably performed using a sound t echn ica l approach.
eva lua t ion could n o t be performed due t o t h e lack of adequate documentation w i t h regard t o t h e process t e s t e d , throughput r a t e s , c a l i b r a t i o n of t h e tes t equipment, e t c . Also, i t was i n f e r r e d from information contained i n
' t h e r e p o r t t h a t E P A Method 5 protocol was used, although t h i s f a c t was never c l e a r l y s t a t e d . For t h e above reasons, a r a t i n g of D was assigned t o t h e t e s t da t a included i n Reference 36.
4-24 I
4.1.14 Reference 39 (1981)
Reference 39 provides t h e r e s u l t s of source t e s t s performed on two c o a l - f i r e d , wet process k i l n s equipped w i t h ESPs. Three E P A Method 5 t e s t s
were conducted on each ESP s t ack f o r a t o t a l of s i x t e s t runs. Resul ts of t hese t e s t s showed an average p a r t i c u l a t e emission r a t e of 8.322 kg /h r (18.33 l b / h r ) and 7.90 kg /h r (17.4 lb /h r ) f o r K i l n Nos. 1 and 2, respec- t i v e l y . Excerpts from t h e t e s t r e p o r t a r e shown i n Appendix A.
I t was determined t h a t the tests repor ted i n Reference 39 were gen- e r a l l y of good qua l i ty . However, documentation o f process da t a on c l i n k e r production ( o r an appropr ia te conversion f a c t o r t o c a l c u l a t e such) was lack- ing. Assumptions had t o be made, t h e r e f o r e , t o c a l c u l a t e appropr ia te emis- s ion f a c t o r s from t h e a v a i l a b l e da t a . For t h e above reason, a r a t i n g of C was assigned t o t h e t e s t da t a i n Reference 39.
4.1.15 Reference 40 (1981)
Reference 40 is t h e r epor t of a source t e s t conducted a t a cement p l a n t loca ted i n Kansas. Test ing was performed on a t o t a l of fou r coa l - f i r ed , wet process k i l n s . Three of the k i l n s were c o n t r o l l e d by a common ESP (No. '2 s tack) w i t h t.he fou r th k i l n being equipped w i t h a separa te ESP (No. 4 s tack) .
Eight t e s t runs were conducted on t h e No. 4 s t ack w i t h an addi t iona l 16 runs performed on t h e No. 2 s t a c k using EPA Method 5. a l s o c o l l e c t e d upstream of the No. 4 p r e c i p i t a t o r u s i n g ASTM Power Tes t Code 27. F ina l ly , s i x Method 5 t e s t s were performed of t h e emissions from the Nos. 1 and 4 c l i n k e r coo le r s tack . These da ta were de l e t ed , however, s ince no cont ro l device was spec i f i ed . d u r i n g t h e study a r e summarized below:
I n l e t samples were
Resul ts of t h e k i l n t e s t s performed
Average Total P a r t i c u l a t e Emission Rate
Tes t Location ( l b / h r ) (kg/hr]
. No. 4 ESP i n l e t 2,202 999.7 No. 4 s t a c k 23.4 10.6 No. 2 s t a c k 25.2 11.4
4-25

It was determined t h a t t he da ta conta ined i n Reference 40 were df rea-
sonably good q u a l i t y b u t su f fe red from a l a c k o f adequate documentation. Also, no raw t e s t da ta were inc luded i n t h e r e p o r t which prevented va l i da - t i o n o f t h e sampling r e s u l t s .
t e s t da ta i n Reference 40.
A r a t i n g o f C was, t he re fo re , assigned t o the
4.1.16 Reference 42 (1983)
Reference 42 i s a s tudy conducted under the I P program o f t he emissions f rom a d r y process cement k i l n equipped w i th suspension preheater and bag-
house c o l l e c t o r (10-ce l l ) . The k i l n was f i r e d w i t h s o l i d f u e l c o n s i s t i n g o f a combinat ion o f coal and coke.
i n t h a t t h e f l u e gas temperature t o the main baghouse (10-ce l l ) i s c o n t r o l l e d w i t h a by-pass system con ta in ing water sprays and i t s own separate 3 - c e l l baghouse c o l l e c t o r . E f f l u e n t gas from t h e by-pass system i s vented t o the
atmosphere through a common s tack w i t h the main p a r t i c u l a t e c o n t r o l device.
Tes t i ng was conducted o n l y a t t he i n l e t t o the main (10 -ce l l ) baghouse and i n the stack. A separate v e l o c i t y t rave rse was performed i n t h e i n l e t duc t o f t h e by-pass system baghouse such t h a t t h e t o t a l uncon t ro l l ed emissions
from t h e k i l n cou ld be ca lcu la ted .
Th is p a r t i c u l a r k i l n i s somewhat unique
The general sampling p ro toco l used i n t h i s s tudy was t h a t developed f o r t h e I P program. A t t h e i n l e t , t h e t o t a l uncon t ro l l ed emissions from
t h e process were determined u t i l i z i n g EPA Method 5. The p a r t i c l e s i z e dis- t r i b u t i o n was obta ined from samples c o l l e c t e d by an Andersen High Capaci ty
Stack Sampler (HCSS) equipped w i t h a S i e r r a Inst ruments 15-FmA preseparator .
TWO Method 5 and f o u r p a r t i c l e s i z e t e s t s were conducted a t each o f f o u r
sampling quadrants f o r a t o t a l o f 8 and 16, respec t i ve l y .
A t t h e o u t l e t o f t h e baghouse, t h e t o t a l mass emissions ( c o n t r o l l e d )
from t h e k i l n , were determined u t i l i z i n g proposed EPA Method 17, w i t h t w o
t e s t s be ing conducted a t each o f f o u r sampling quadrants. The p a r t i c l e s i z e d i s t r i b u t i o n was l i k e w i s e obta ined us ing an Andersen Mark I11 cascade
impactor and S i e r r a Inst ruments 15 pmA preseparator . A t o t a l o f e i g h t
4-26

total mass and eight particle size tests were performed-at the baghouse outlet.
Tables 4-11 and 4-12 provide a summary of the results of this study with applicable portions of the document included in Appendix A. tests in Reference 42 were conducted according to the protocol developed for the IP program and are well documented, a rating of A was assigned to the data.
Since the
4.1.17 Reference 43 (1983)
Reference 43 is the report of a compliance test conducted at a cement plant located in Iowa. Tests were conducted of the controlled emissions from a coal-fired, dry process kiln equipped with an ESP and baghouse con- nected in parallel. Additional tests were also performed of the total emis- sions from a ciinKer cooier equipped with a baghouse dust collector. Ee- cause the emissions from the kiln were controlled by both an ESP and a baghouse, coupled with the fact that the test locations were not clearly de- fined, the data from the kiln tests were determined to be unsuitable for the development of consistent emission factors. Thus, these data were deleted from further consideration.
For the clinker cooler, three test runs were performed of the total mass emissions from the baghouse using EPA Method 5. were 1.2, 0.45, and 0.45 kg/hr (2.7, 1.0, and 1.0 lb/hr), respectively. Appropriate portions of the test report have been included in Appendix A.
Results of these tests
It was determined that the tests reported in Reference 43 were conducted There- using sound methodology and that adequate documentation was provided.
fore, a rating of A was assigned to the test data.
4.1.18 References 44 and 45 (1983)
Reference 44 provides the results of an annual compliance test conducted on a coal-fired, dry process kiln equipped with a suspension preheater/flash
4-27

4-28 I

0 - 0 - m o o 0 O O O h rlooo 0 0 0 0 0 0 0 0
O l * N r ( - tOr(cl . N*+- h U O N
(DInmY) UUr(N h h 9 m m m m m . . . . . . . .
P O N O O O h O 0 0 0 - . O O N O
0 0 0 0 0 0 0 0 . . . . . . . .
4-29
EnC0-m h m I o w Y),n.nY) LnLnYIY)
0 0 0 0 0 0 0 0 “ “ Y ” “ “ Y ”
m u o m 0 0 0 0 N m O N 0 0 9 0 Orloo O O N O . . . . . . .
O W 0 4 ooclo NNNN O O U O .
<,om 0 0 L 0
m w h m i-Y)Io(D LOyImY) m m m m . . . . 0 0 0 0 0 0 0 0
r ( O O N O O N O 0 0 0 - 0 0 0 0
0 0 0 0 00N0
h m O N 0 m - h N N O O ONNN . . . . r(r(r(r( S A A S
VI VI 9 n x n 0 c 9
L o c) m o r o L n r c 0 .
L .- Or * V I u w m a e ” “Io L
e n
n5
B ? 0 0 U
L o 4.2 B s .- 0 U
E m c
r
.-
a o m
E 1
VI L w c) o E
U
E c
o o m u 9 .- e m VI
v L o o c e 9 u c 9 .n
- B .- .-
.- % s
, D u n

c a l c i n e r and baghouse d u s t c o l l e c t o r . f i e d crusher equipped w i t h a baghouse and Fuller grate- type c l i n k e r cooler also equipped w i t h a baghouse. t h e t e s t r e p o r t i t s e l f , a technica l paper (Reference 45) was used t o der ive t h i s information.
Other sources t e s t e d were an unspeci-
Since no process desc r ip t ion was provided i n
During sampiing, t h r e e t e s t r u n s were perfura~ed u i t h e e m i ~ s i a n s f r ~ f i each of the above baghouses using EPA Reference Method 5 ( inc luding impinger catch). Since t h e type of c rusher and mater ia l being processed was not s p e c i f i e d , these p a r t i c u l a r da t a were de le t ed from cons idera t ion . Other- wise, t h e r e s u l t s of t h e t e s t s i nd ica t ed an average t o t a l mass emission r a t e of 0.04 kg/Mg (0.07 lb / ton) and 0.02 kg/Mg (0.04 lb / ton) f o r the k i l n and coo le r , r e spec t ive ly . cluded i n Appendix A .
Applicable po r t ions of t h e t e s t r e p o r t have been i n -
Based on a review of the information contained i n Reference 44, i t was determined t h a t t h e tests were conducted using s tandard EPA protocol w i t h t h e except ion t h a t t h e impinger catch was used t o c a l c u l a t e the emission r a t e s . I n a d d i t i o n , c e r t a i n o f t h e k i l n tests showed negat ive net f i l t e r weights obtaine'd during gravimet r ic analyses . The above f a c t o r s , coupled w i t h t h e fac t t h a t adequate process da t a (or desc r ip t ion ) was not included i n the tes t r e p o r t , r e s u l t e d i n a r a t i n g of C being assigned t o t h e t e s t da t a contained i n Reference 44.
4.1.19 Reference 46 (1983)
Another re ference used i n t h e development of candidate emission f a c t o r s i s a s tudy conducted under the IP program of a wet process cement k i l n equipped w i t h an ESP. suppl ied by a gra te - type clinker cooler . l e c t e d i n t h e f i r s t two f i e l d s of the ESP i s i n s u f f l a t e d back t o t h e k i l n f o r reprocessing. p r e c i p i t a t o r t o c h a r a c t e r i z e the uncontrol led and cont ro l l ed emissions from t h e Drocess.
The k i l n was f i r e d w i t h pulver ized coal w i t h preheat A c e r t a i n po r t ion of t h e dus t col-
Tes t ing was conducted a t both t h e i n l e t and o u t l e t of t h e
4-30

L ike Reference 42 above, t he general sampling p r o t o c o l used i n ' t h i s study was t h a t developed f o r t h e I P program.s8 A t t h e i n l e t , t he t o t a l uncon t ro l l ed emissions from t h e process were determined u t i l i z i n g EPA Method 5. The p a r t i c l e s i z e d i s t r i b u t i o n was obta ined from samples c o l - l e c t e d by an Andersen High Capaci ty Stack Sampler equipped w i t h a S i e r r a
Instruments 15-pmA preseparator. Two Method 5 and f o u r p a r t i c l e s i z e t e s t s were conducted a t each o f f o u r sampling quadrants f o r a t o t a l o f e i g h t and 16 t e s t runs, respec t i ve l y .
A t t h e o u t l e t o f t h e ESP, t h e t o t a l mass emissions ( c o n t r o l l e d ) from the k i l n were determined u t i l i z i n g proposed EPA Method 17, w i t h two t e s t s
be ing conducted a t each o f f o u r sampling quadrants. t r i b u t i o n was obta ined us ing an Andersen Mark I11 cascade impactor and S i e r r a Instruments 15-pmA preseparator. bo th t o t a l mass and p a r t i c l e s i z e a t t h e o u t l e t o f t h e ESP d u r i n g the sam- p l i n g program.
The p a r t i c l e s i z e d i s -
A t o t a l o f e i g h t t e s t s were performed f o r
The o n l y problem noted w i t h t h e above study were d i f f i c u l t i e s i n sample c o l l e c t i o n caused by a l a y e r o f dus t which had deposi ted i n t h e bottom o f t he ductwork a t t h e i n l e t t o t h e ESP.
p l i n g probe d u r i n g e n t r y and withdrawal from the duct, a s t e e l s leeve was i n s e r t e d through t h e t e s t p o r t s . However, t h e dust depos i t i n h i b i t e d t h e
accurate measurement o f gas v e l o c i t y a t t h i s sampling l o c a t i o n .
date t h e p o r t i o n o f t he duc t c o n t a i n i n g the dus t l a y e r , t he sampling p o i n t s were moved f a r t h e r i n t o t h e unobstructed p a r t o f t h e duc t where t e s t i n g was f i n a l l y conducted. It i s n o t known e x a c t l y how these var ious f a c t o r s i n f l u -
enced t h e t e s t r e s u l t s , b u t i t i s suspected t h a t t h e data does con ta in a
p o s i t i v e b i a s which i s r e f l e c t e d i n t h e unusual ly h i g h u n c o n t r o l l e d emission f a c t o r obta ined f o r t o t a l p a r t i c u l a t e emissions.
To prevent contaminat ion o f t h e sam-
To accommo-
Tables 4-13 and 4-14 p rov ide a summary o f t h e r e s u l t s o f t h i s study
w i t h app l i cab le p o r t i o n s o f t h e document i nc luded i n Appendix C.
t e s t s i n Reference 46 were conducted according t o t h e p r o t o c o l developed f o r t he I P program and a re w e l l documented, a r a t i n g o f A was assigned t o the o u t l e t data and a r a t i n g o f B t o t h e i n l e t data i nc luded i n t h e t e s t
repo r t .
Since the
4-31

4-32

I '
4-33

I
4.1.20 Reference 48 (1983)
Reference 48 i s a source emissions survey conducted a t a p l a n t loca ted i n Texas. w i t h a baghouse d u s t c o l l e c t o r ( s ) . Additional tes ts were a l s o performed on a c l i n k e r coo le r w i t h t h e emissions c o n t r o l l e d by a gravel bed f i l t e r . Since the type of cement manufacturing process was not s p e c i f i e d i n t h e re- p o r t , the k i l n da t a could not be used i n t h e development of candidate emis- s ion f a c t o r s . Therefore , only t h e da ta from t h e c l i n k e r cooler wil l be addressed.
Tes t ing was conducted on two c o a l - f i r e d cement k i l n s equipped
Three t e s t s were conducted of t h e t o t a l p a r t i c u l a t e emissions from t h e Results of t h e t e s t s showed emis- c l i n k e r coo le r s t a c k u s i n g EPA Method 5.
s ion r a t e s of 3.5, 3.0, and 1 .7 kg/hr (7.7, 6.6, and 3 .8 lb /hr ) f o r t h e t h r e e runs, respec t ive ly . Port ions of t h e t e s t r epor t have been included i n Appendix A f o r re ference purposes.
Upon review of the cooler t e s t da t a contained i n Reference 48, i t was determined t h a t the samp1,ing methodology was sound. However, documentation regarding the process and i t s opera t ion during t e s t i n g was somewhat lacking. Therefore , a r a t i n g of B was assigned t o t h e coo le r emissions d a t a i n Ref- erence 48.
4 .1 .21 Reference 50 (1984)
Reference 50 i s the r epor t of another annual compliance t e s t of the same p l a n t and sources descr ibed i n Reference 44 above. Again, only t h e emissions da t a from the k i l n and coo le r were found t o be appropr i a t e f o r the development of candidate emission f a c t o r s .
As w i t h t h e previous s tudy , three EPA Method 5 t e s t s were conducted on each source which included the impinger ca t ch . an average con t ro l l ed emission r a t e of 0.02 kg/Mg (0.04 lb / ton) f o r t h e k i l n and 0.0040 kg/Mg (0.0079 lb/ ton) f o r t h e c l i n k e r cooler . t e s t r e p o r t a r e provided i n Appendix A.
Resul ts of t h e s e t e s t s showed
Excerpts from t h e
4-34

' The above tests were conducted by the same contractor. and with s7milar
Thus, a rating of B was assigned documentation to that found i n Reference 44 above. However, i n this case, no negative filter weights were reported. to the test data contained i n Reference 50.
4.1.22 Reference 51 (1984)
Reference 51 reports the results of compliance tests conducted of the emissions from a Loesche (raw grinding) mill, grate-type clinker cooler, and coal-fired, dry process cement kiln at a plant located in Alabama. The emissions from the mill and kiln were controlled by a common ESP (kiln off- gas could be routed through the mill to the ESP or the mill could be by- passed). The cooler was equipped with a combination cyclone and gravel bed filter for the control of particulate emissions. Due to certain discrepan- cies found i n the test data for the kiln with ("mill on") and without the mill i n operation ("mill off"), only the "mill off" tests performed on the "main stack" were used to determine the emissions from the kiln itself.
A total of four tests were conducted on the main kiln stack with an additional three tests performed of the controlled emissions from the clinker cooler. All tests were run using standard EPA Method 5 protocol. Results of these tests are summarized below:
Total Particulate
Run Sampl i ng Emission Rate - No. Location kg/hr 1 b/hr
2 Main stack* 11.17 24.61 3 Main stack* 11.53 25.40 4 Main stack*. 7.600 16.74 5. Main stack* 7.110 15.66
8 Cooler stack 33.53 73.85 9 Cooler stack 17.67 38.92 10 Cooler stack 22.65 49.90
* Loesche mill off
4-35

Copies of appropr i a t e por t ions of t h e t e s t r e p o r t a r e included i n Appen- d ix A .
I t was determined from a thorough review of Reference 5 1 t h a t c e r t a i n po r t ions of the r e p o r t were missing. T h i s made c a l c u l a t i o n of app l i cab le emission f a c t o r s from t h e da ta much more d i f f i c u l t bu t not impossible. ever, from t h e information t h a t was a v a i i a b i e , a i l indicai ior is are i i i d t the
t e s t s were sound and adequately documented. For these reasons, a r a t i n g of B was assigned t o the t e s t r e s u l t s included i n Reference 51.
How-
4.1.23 Reference 52 (1984)
This re ference document i s the- r e p o r t of a p a r t i c u l a t e compliance t e s t conducted of t h e emissions from a coa l - f i r ed , wet process k i l n equipped w i t h an ESP. Three t e s t s were performed of the emissions from t h e k i l n down- stream of t h e ESP using EPA Method 5 protocol . Resul ts of these t e s t s ind i - ca ted an average t o t a l mass emission r a t e of 4 .4 k g / h r (9 .7 lb /h r ) f o r t h e t h r e e runs. Appropriate por t ions of t h e t es t r e p o r t can be found i n Appen- d ix A.
I t was determined from the information contained i n Reference 52 t h a t sound technical methodology was used and the tes t d a t a were adequately docu- mented. However, t h e major problem noted was t h e f a c t t h a t the k i l n feed- r a t e was expressed i n terms o f ga l lons per minute w i t h o u t a conversion fac- t o r t o mass per u n i t time. Assumptions had t o be made, t h e r e f o r e , i n the emission f a c t o r c a l c u l a t i o n s based on t h e r a t e d d a i l y production r a t e f o r t h e k i l n . For this reason, a r a t i n g o f C was assigned t o t h e t e s t r e s u l t s provided i n Reference 52.
4 .1 .24 Reference 53 (1985)
Reference 53 r e p o r t s t h e r e s u l t s of the 1985 annual compliance t e s t s conducted by t h e same con t r ac to r , on t h e same sources , a t the same p l a n t as t h a t discussed above f o r References 44 and 50. Method 5 protocol (with impinger ca t ch ) was used t o sample t h e emissions from t h e k i l n , c rushe r , and c l i n k e r coo le r baghouses. Resul ts o f these
As w i t h the o t h e r t e s t s , EPA
4-36

tests indicated controlled emission rates of 0.01 kg/Mg (0.02 lb/tori) and 0.00995 kg/Mg (0.0199 lb/ton) for the kiln and clinker cooler, respectively. Excerpts from the test report are shown in Appendix A.
As was the case for the other two reference documents discussed previ- ously, the tests reported in Reference 53 were found to be generally sound but with some deficiencies with regard to documentation of the processes tested and their operation during the study period. For these reasons, a rating of B was assigned to the test data.
4.1.25 Reference 54 (1985)
The final reference document used to develop candidate particulate emission factors for the cement industry is a compliance test of a coal- fired, wet process kiln equipped with an ESP. cvIIuuc.,su on the E:? s tack i i h ich i;esuiit.ii ~ I I ari average emission rate o f
-9.03 kg/hr (19.90 lb/hr). included in Appendix A.
Three EPA Method 5 tests were - - - A * . - * - A
Appropriate portions of the test report are
Upon review of the information contained i n Reference 54, it was de- termined that the tests were performed using sound methodology and were reasonably well documented. However, like many reports of this type, docu- mentation of the process and its operation during testing was minimal. For this reason, 'a rating of D was assigned to the data provided in Reference 54.
4.2 RESULTS OF DATA ANALYSIS
4.2.1 Total Mass Emissions Data
Both uncontrolled and controlled particulate emission factors were determined from the data contained in each,of the reference documents de- scribed above. In the case of uncontrolled emissions, only References 21, 24, 26, 40, 42, and 46 contained useful data. For References 21, 24, 26, and 40, the emission factors were determined from the raw test data by hand calculation. A copy of these calculations and any assumptions made are
4-37

shown in Appendix B. performed in terms of cement produced.
For the sake of.consistency, all calculations'were
With regard to References 42 and 46 , appropriate uncontrolled emission factors were extracted directly from the test reports (after conversion to metric units). iota1 pariiculaie siaiiei. as U ~ L ~ I I I I ~ I I ~ ~ I ulll " _ , ;,,, I c I L I L I I _ _ I---..._..__
is shown in Table 4-15.
A summary of the available uncontrolled emission factors for A-A---:--A C--- +ha ..--.niir r o C s r s n r n r l o r ~ ~ r n o n t c
For controlled processes, a procedure similar to that described above for determining uncontrolled emission factors was used. References 10 through 18, 21, 24, 25, 26A/B, 27, 30, 31, 32, 33, 36, 39 , 40 , 42, 43 , 44/45, 46, 48 , 50, 51, 52, 53, and 54 contained useful data. Except for References 27, 42, and 46, the controlled emission factors were calculated by hand from either emission factors expressed in terms other than mass of pollutant per metric ton of cement produced or from the raw test data. These calculations are shown in Appendix c for controlled cement kilns and Appendix D for other controlled emission sources. available controlled emission factors for total particulate matter is shown in Table 4-16 in terms of mass of particulate matter per mass of cement or clinker produced. All hand calculations were verified by a second analyst for quality assurance purposes.
A complete summary of all
4 . 2 . 2 Particle Size Data
Each of the specific data sets described above were processed through the appropriate computer program (described in Section 3 . 0 ) to obtain both the particle size distribution and size-specific emission factors (where available) for selected particle diameters. Copies of the ihdividual com- puter printouts have been included i n Appendix E with the results of the computer analyses summarized in Tables 4-17 through 4-25 in terms of cement produced. Any calculations needed to convert the raw data to the proper format for input to the computer were conducted manually and are also in- cluded in Appendix E.
4-38

TABLE 4-15. SUMMARY OF UNCONTROLLED TOTAL PARTICULATE EMISSION FACTORS FOR CEMENT PLANTS
Average t o t a l p a r t i c i l a t e emission f a c t o r Ref. Raw data a
Source type Fuel t ype No. t a b l e Nos. kg/Mg cement kg/Mg c l i nke r '
Wet process k i l n s Gas 26A/B 4-8 60 63
Coal 24 d 65 68 65
630 d 'j2e 40 46 4-24 600
Dry process k i l n Coal/coke, 42 4-27 I?ne 141!
2 1 4-3 and 4-4 4.4 4.6 C l i n k e r coo le r -
a Table number(s) from which t h e o r i g i n a l emission f a c t o r was reproduced.
To ta l mass emission f a c t o r ca l cu la ted i n terms o f e i t h e r kg o f p o l l u t a n t p e r Mg o f cement o r c l i n k e r produced.
'. Ca lcu la ted from t h e emission f a c t o r s i n prev ious column assuming 5% (wt . ) gypsum i n f i n i s h e d cement.
Emission f a c t o r s de r i ved by hand c a l c u l a t i o n from the raw t e s t da ta (see Appen- d i x B). pages 5 and 6 o f t he t e s t repo r t . Tables T-1-A and T-4, pages 16 and 20 o f t he t e s t repo r t .
Rounded t o two s i g n i f i c a n t f i gu res .
For Reference 24, t h e raw data were taken from Tables I 1 and 111, For Reference 40, t h e raw data was taken f r o m
e I n d i v i d u a l emission f a c t o r s inc luded i n average cons is t s o f t he a r i t h m e t i c mean o f f o u r separate t e s t runs ( i . e . , one r u d q u a d r a n t a t f o u r quadrants) making up a s i n g l e t e s t .
4-39

4-40
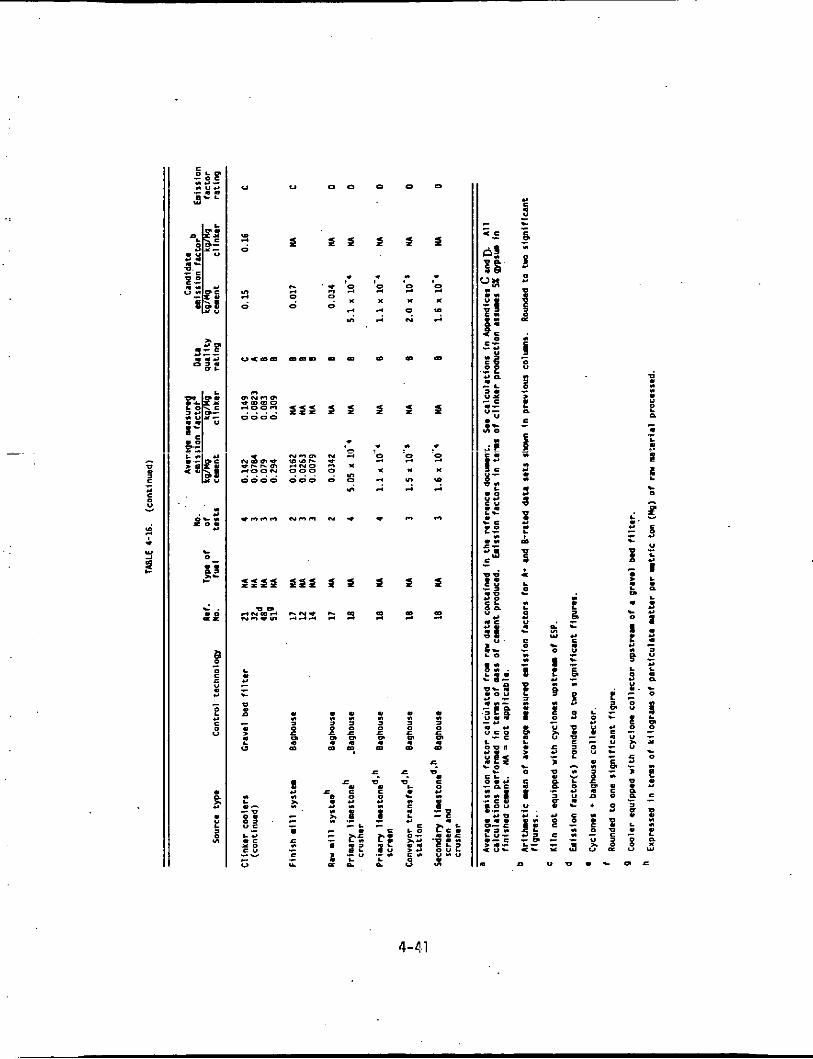
..
r c
w I I . e P . L
L
.. .. a E L
4-4.1

m L- W -I z 0 v) Y
- 0 N W V z " LL Y Y Y D:
LL z
n u v
4-42

TABLE 4-18. CALCULATE0 PARTICLi SIZE DISTRIBUTIONS AN0 UNCONTROLLED EMISSION FACTORS FOR REFERENCE 21
Oata Ratina: C
a Cumulative emission factor equal to or 111s than stated s ize (kqlM0) Claulat iue -SI I.
.qua1 t o or less than stated size' Total mass Type of Test Test 2. 5.0 10.0 1 . 0 20.0 2 . 5 ' 5.0 10.0 15.0 20.0 emission ir@actor date IO NO.^ p i pnl "mA p; gnl WA ".A p n l p"pA m A tactore
Acdenen 8/27 u 2 0 8/28 0950
1105 1440
8/29 1015 1400
11/4' 1100
lll5' 1430 1435 ,0935 0930 1415 1415
Standard devia- t ion (0 )
Standard 0.metric deviation (ag)
0.931 2.46 10.0 0.331 0.902 6.87 0.274 0.140 6.21 1.08 1.86 8.43
0.563 1.32 0.452 1.53
0.373 1.59
0.620 1.84 0.540 1.65 0.479 1.21 0.249 1.19 0.524 1.12 0.642 1.42
0.54 1.5
0.50 1.4
0.24 0.45
1.5 1.4
7.80 9.00
U . 8
9.53 9.11 1.41 8.65 7.31 7.96
8.6
8.4
1.7
1.2
22.1 19.2 18.5 20.1
19.9 21.5
31.2
21.9 21.5 19.3 21.6 19.4 20.0
21
21
3.2
1.1
34.0 32.4 32.0 32.2
32.5 33.9
47.4
34.0 33.8 32.0 34.4 32.3 32.5
34
34
4.1
1.1
0.042 0.015 0.012 0.048
0.025 0.020
0.017
0.027 0.024 0.021 0. oll 0.023 0.028
0.024
0.022
0.011
1.5
0.10 0.040 0.033 0.082
0.058 0.068
0.010
0.081 0.073 0.056 0.053 0.050 0.063
0.064
0.061
0.018
1.4
0.44 0.30 0.28 0.31
0.35 0.40
0.51
0.42 0.40 0.33 0.38 0.32 0.35
0.38
0.31
0.014
1.2
0.98 0.85 0.82 0.89
0.88 0.95
1.4
0.97 0.95 0.85 0.95 0.86 0.88
0.94
0.93
0. u
1.1
1.5 . 4.4 1.4 4 .4 1.4 4.4 1 . 4 4.4
1.4 4.4 1.5 4.4
2.1 4.4
1 . 5 4 . 4 1 . 5 4 . 4 1.4 4.4 1 . 5 4.4 1.4 4.4 1 . 4 4.4
1.5
1.5
0.19
1.1
4-43

TABLE 4-19. CbLCULLltO PLRllCL~ 511i OISlRI8UlIONS Iwo CONlROLLiO iMlSSlON FACTORS FOR RCfERi I ICL 21
oat. R.1ln.a: c
les t dale
8/25 iwa 1440
8/28 1045 1045 1415 1415
8/29 loo0 I000 1400 1400
1113 1545f
11301
11/5 m 5 f m.5f
I l l 4 1130'
n v e n g P
31.4 60.1 77.2 89.1 96.1 0.045 0.085 0.11 0.13 0.14 . 0 .14 31.1 56.0 63.6 83.2 94.8 0.053 0.080 0.090 .0.12 0.14 0.14
31.1 6 6 . 1 ' 8 3 . 1 91.0 95.0 0.044 0.094 0.12 0.11 0 .14 0.14 25.5 59.2 78.9 87.7 92.7 0.036 0.080 0.11 0.13 0.11 0 . 1 4 38.6 63.2 75.3 81.0 81.9 0.055 0.090 0.11 0.12 0.12 0. I 4
25.7 52.0 64,9 73.6 19.3 0.037 0.074 0.092 0.10 0.11 0.14 29.5 52.9 69.2 81.0 91.1 0.042 0.075 0.098 0.12 0.13 0. I4 35.6 59.0 72.9 01.4 86.7 0.051 0.084 0.10 0.12 0.12 0 .14 29.3 54.9 65.5 72.1 76.7 0.042 0.018 0.093 0.10 0.11 0. I4
29.2 57.6 70.3 78.3 81.4 0.042 0.082 0.10 0.11 0.12 0 . 1 4 29.8 53.4 6 8 . 9 76.1 80.9 0.012 0.076 0.098 0.11 0.12 0.14 39.9 61.3 73.4 00.0 84 .3 0.057 0.087 0.10 0.11 0.12 0. I4
30.9 53.1 68.0 74.4 78.8 0.044 0.076 0.097 0.11 0.11 0. I4 36.4 65.2 76.3 82.2 86.0 0.052 0.093 0.11 0.12 0.12 0.14 47.9 64.0 15.0 85.1 91.1 0.068 0.091 0.11 o , 1 2 0.13 0. I4
28.0 53.4 68.9 76.8 81.9 0.010 0.076 0.10 0.11 0 .12 0.14
40.1 62.6 75.3 Bl.8 90.5 0.057 0.089 0.10 0.12 0.11 0. I4
31.4 57.3 72.0 78.3 82.4 0.045 0.081 0.10 0.11 0.12 0. I4
51.0 93.7 95.6 97.6 98.6 0.072 0.13 0.14 0.14 0.14 0.14
19.9 92.3 95.1 97.5 98.5 0.11 0.13 0.14 0.14 0.14 0 . 1 4
64.4 80.9 87.8 92.5 95.1 0.092 0.12 0.13 0.13 0 .14 0 . 1 4 55.4 64.4 3 . 1 ez.8 e6.1 0.080 0.W: 0.11 0.12 0.12 0.14
76.0 94.5 98.3 100.0 100.0 0.11 0.13 0.14 0.14 0.14 0. I4
40 64 76 84 89 0.057 0.091 0.11 0.12 0.11
4-44

Y
?
: i !
! ,
I
! i !
I
!
4-45

n a z
n 0
- V I
0-0 W Q m
.r
m a u o
&e;- V I 0
m E r d c,
W > V I
c , W
3 L
v
m e
m - m - 9 " c,
W N
v) CI
0 W O E N N I .u
.u E =
. a m o E
1
. - m o a . E a
o m u . E N I
I4 (v
* Y
I
v- 0
W
+
0 z 0 r(
d rl
0
d r(
0
d d
0
0 d
0
0
0
0 0 d
m I- m
I-
m
0
b
Fi
ui
d
N m
VI
OI m
Ql
N N
0
N N
0
d N
0
0 N
0
co d
0
0 d
0
0
0 m
m rd m
Fi m
m
d m b
m N W
7
m 0 V
m rl
% 0
c, W
c,
0
7
a
c, m
c
Y
c, K W E W U
VI VI W U 0 L
7 .C
a 2 u m E 0 L v- VI c 0
In VI
E Y
.r
.r
w
C
VI c, O L Cro KC, .r u L W 0.7
L O W U 4
.r
a .
- a a 2% 0 0 U C
E m L u m
m o n
s c,
0 c,
U W u c 0 0:
a
u W U u 0 L
c, c W E QI U
e 0
a
n
h m
(D .o d
OI I: L 0)
L QI c, c, m E
c-
a
W c, m
n u n U
4-46

4
t; 2 z I
CI Y
3 =2 u 2
u. a
N N
* w 2 rn U c
Ly m 4 L
r C
3 L 0 C u 4
.-
2 .- v) v) u I c Ly v) L o n c 4 c 4
r Y - 3 n o c 4 C n 0
4 C 4 n C VI o C
0 N
(n
o u C L m .
.-
.-
- .-
- < x v e Ly 0 LL
r
4 C L 0
al L
e VI o C
+ e 0 -
m r VI
* * V I mal m u - 0 L
- L L .I 1 2 , ' * L 0 o
0 . 9 L - 0 C
E 4 O L
Ly O V I 0 0 ) U L
0
n uYI x r (
o.
.-
-
a n
e :
v)
0 c 2 0 e. .~ c
r Y)
0 r
- .r
s L c VI c 0 .- v) v) .- B - 4 C 0 C
0 C
n Ly c " 0) L L 0 u Ly c 4 L c 0
VI VI
.-
.- E Y
c m L C
YI n 0 r C
.-
r" Q a Y
c- 4 L r r\ urn .- Y 3- n L ~ y a e o .r r 9 C L OLy 0 -
4 m C E s m n L Lyo C - 4 .- L Y
C L 0 0
v)- v ) L .- r
m
.- E. we
€ 2
VI- VI 4 L
-c 4 C L o u C L L
i
0 c 4 - . U
4 . L L 4 0 r L
0 L o m
n L o m " 0
n .- o x L L L L
0 C E n L y L y
u n
o n
a .- a n
" 5 a -
5 s L e
D u n u

4-48

n u 0

Ln a o L n m 0 . O e m 0 w 0 0 0 0 0 0-4000 0 00000 00000 0
e 0 - 0 ~ ) m " w w Y)
. . . . . . . . . . .
m m w m -40) m m m - m l o e a a ~ 4 0 0 - 0 0 r l N O O + rl
0 0 0 0 0 0 0 0 0 0 0 . . . . . . . . . . .
- . - - - - .- --,- . _ " . _ . . _ ~ N N ~ ~ e N w O e 00000 0 - 0 0 0 0
00000 00000 0 . . . . . . . . . . .
a m w- In- m oor loo r ( N O O r ( 0 00000 00000 0
m L n N o m m e a a r l 01 . . . . . . . . . . .
m m w m r ( o .-a m e + o
00000 00000 0
ONInOe -roor(a 0 O O O O O 0-000 0 . . . . .
P-- m m N m m ~ o P - L O - O ~ - m o r ( N m m 0 0 - 0 0 O N O O O 0 O O O O O 00000 0 . . . . . . . . . . .
P - - L n 0 0 a m 0 - 0 - l l m N b b O W P- 0 0 0 0 0 + d O Q O o . . . . . 00000 00000 0
U C U W m w Y ) a o o m m w l . 00-4-- "00- 2 00000 o o o o o , o . . . . . . . . . . .
e e m m a m b m e a 0 0 0 0 0 0 0 0 0 0 z
e c 0
U L 0
m
E
- W 0 r( v
P L 0 a L a e & m E
* e m
U L L 9 a L 0
VI
L m 0
1
L 0
a U
0 L a c) c
- a .r
E c .-
n a n
: U
L 0
9
a 0
N
c 0 C
c L 0 c VI
L QJ a L 0 e e m E a e m
U
e L m a
- - 9 v
- a .r

A number o f no ta t ions should be made regard ing t h e p a r t i c l e s i z e da ta F i r s t , o n l y da ta f o r p a r t i c l e s l a r g e r
Th is p a r t i c u -
shown i n Tables 4-17 through 4-25.
than 2.5 pm (aerodynamic diameter) have been repor ted even though t h e s p l i n e equat ion was asked t o p r e d i c t values below t h a t s i z e range.
l a r lower c u t - o f f was se lec ted s ince t h i s i s t he smal les t p a r t i c l e diameter s p e c i f i e d by t h e EPA. I n add i t i on , t h e s i ze -spec i f i c emission f a c t o r s Gal-
cu la ted from the t e s t da ta have a l s o been repor ted i n each t a b l e even though they may n o t a c t u a l l y be used i n t h e development of t h e candidate emission fac to rs f o r t he process (see Sect ion 4.3 below). I n those cases where t h e
emission f a c t o r s were no t used, t h e va lues have been inc luded on ly f o r t h e sake o f in fo rmat ion .
Another n o t i o n which should be made i s i n regard t o t h e data conta ined i n Tables 4-17, 4-22, 4-23, 4-24, and 4-25 f o r References 20, 42, and 46, respec t i ve l y . Since the t e s t r e s u l t s have a l ready been analyzed by t h e
SPLINE r o u t i n e e i t h e r through the PADRE p o r t i o n o f t h e EADS sof tware o r as p a r t o f t h e study i t s e l f , no f u r t h e r da ta analyses were conducted. I n t h e
case o f Reference 20, t he cumulat ive mass loadings have been reproduced from the EAOS p r i n t o u t and the associated cumulat ive percentages back-ca lcu lated
by hand based on these data. emission f a c t o r s presented i n each r e p o r t have been reproduced from t h e t e s t repo r t s i n Tables 4-22 through 4-25.
For References 42 and 46, t he s i z e - s p e c i f i c
4.3 DEVELOPMENT OF CANDIDATE E M I S S I O N FACTORS
4.3.1 Tota l Mass Emissions
The most i d e a l s i t u a t i o n f o r t h e development o f candidate emission
f a c t o r s would be t o have a l a r g e number o f A-rated da ta se ts f rom which t o de r i ve such. As shown by the above d iscuss ion, such data were n o t a v a i l a b l e f o r t h e purpose o f t h i s study. I n ' t h e case o f uncon t ro l l ed r o t a r y k i l n s , data from o n l y f o u r t e s t se r ies ( represent ing t w o types o f f u e l ) f o r wet process k i l n s and one t e s t se r ies f o r d r y process u n i t s were found du r ing t h e ' l i t e r a t u r e search ( i n a d d i t i o n t o t h a t a l ready conta ined i n the o r i g i n a l
data base used t o develop the e x i s t i n g AP-42 emission fac to rs ) . It was f e l t
4-51

that these data did not significantly improve the existing data base, and thus no change is proposed for those factors already presented i n Table 8.6-1 (page 8.6-3) of AP-42 for uncontrolled kilns.
I
For uncontrolled clinker coolers, the current version of Section 8.6 of AP-42 does not contain a specific emission factor. As stated above, MRI found only one report which quantifies the uncontroiiea emissions from clinker coolers. In this instance, it was felt that the addition o f an un- controlled emission factor for clinker coolers was justified. This factor was developed simply by taking an arithmetic mean of the data from the four Method 5 tests conducted on the clinker cooler described i n Reference 21.
In the case of controlled emissions, the data base developed during the program is somewhat more extensive. Not all of these data are of the highest quality, however, with some sources having only one series of tests from which to develop an appropriate emission factor. Controlled emission factors were derived for: wet and dry process kilns; clinker coolers; pri- mary limestone crushers and screens; secondary 1 imestone crushers and screens; limestone conveyor transfer; raw mill system; and finish mill sys- tem. These factors were developed by taking an arithmetic mean of all available A- and 6-rated data sets for each specific control device, as shown previously in Table 4-16. The factors thus obtained are being pro- posed for inclusion in AP-42. A summary o f all candidate uncontrolled and controlled emission factors for cement plants according to type of process and control equipment are shown in Table 4-26.
4.3.2 Si ze-Spec? fi c Emissions
A s mentioned above, only limited particle size data were collected dur- ing the literature search for cement plants consisting of a total of nine test series. and one C-rated test series (Reference 20) were contained i n the information gathered for wet process kilns with one additional A-rated test series (Ref- erence 42) obtained for dry process units. tests (References 26 and 46) were included i n the data base for wet process
In the case of uncontrolled kilns, one A-rated (Reference 46)
For controlled kilns, two A-rated
4-52
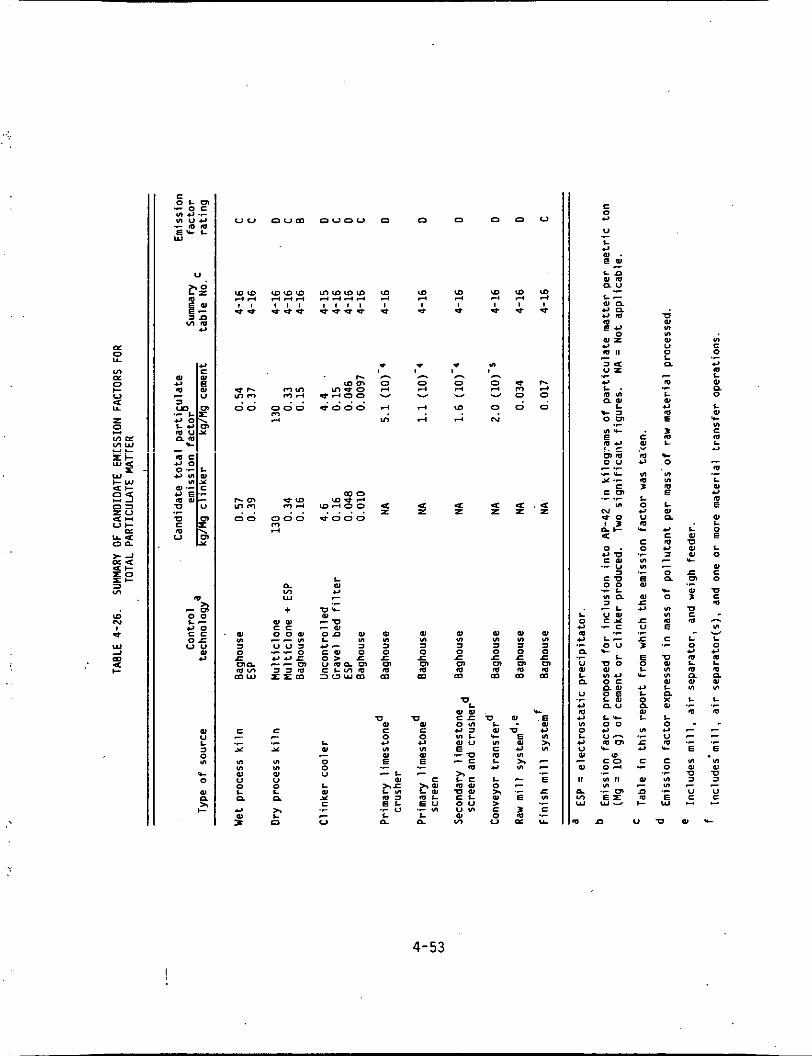
4-53

kilns with ESPs, as well as two additional A-rated tests (References' 27 and 42) for dry process units with baghouses. the same clinker cooler (Reference 21) is included in the data base repre- senting both the uncontrolled emissions from the process, as well as emis- sions control utilizing a gravel bed filter.
Finally, only one C-rated test of
According t n t h e OAQPS guidclincs, A- and &ram! d3t.a ShfMld not. he
combined with C- or D-rated data to develop emission factors for a particu- lar source. However, in the case o f uncontrolled wet process kilns, it was found necessary to combine B-rated data with C-rated data i n order to improve the overall quality of the emission factor. This was deemed ap- propriate since. it was felt that the inclusion of the C data would sig- nificantly enhance the overall applicability of the emission factor to a greater number of facilities and would not decrease the overall rating of the emission factor obtained.
To derive each emission factor, the information contained in Tables 4-17 through 4-25 was tabulated according to the type of process and control equipment, and the arithmetic mean and standard deviation calculated, wher- ever possible, for each particle size increment. The arithmetic mean was calculated from the data i n each column according to the relationship:
where: x = arithmetic mean
n = number of measurements
xi = individual measurements
The standard deviation was calculated according to the relationship:
where: (I = standard deviation with xi and n as defined as Equation (1)
4-54

. .
The geometric mean and s t a n d a r d ' d e v i a t i o n were a l s o ca l cu la ted , w i t h t h e standard geometric d e v i a t i o n be ing i n d i c a t i v e o f t h e o v e r a l l var iance i n t h e data.
according t o t h e r e l a t i o n s h i p :
The geometric mean was c a l c u l a t e d from the data i n each column
- x = geometric mean w i t h xi and n as de f i ned i n Equation (1) 9
where:
The standard geometric d e v i a t i o n was c a l c u l a t e d according t o t h e r e l a t i o n s h i p :
n r n xi - E 21'" n-1 u = exp 2
9 i=l (4)
where: u = standard geometric d e v i a t i o n w i t h xi and n as de f i ned i n F . . . . & : ~ ~ ,-. a C q U d L l U l l (11
Rather than u t i l i z i n g the emission f a c t o r s a c t u a l l y de r i ved from each study, t h e candidate emission f a c t o r f o r each s i z e increment was obta ined
by app ly ing t h e p a r t i c l e s i z e d i s t r i b u t i o n from t h e var ious data se ts t o e i t h e r t h e e x i s t i n g u n c o n t r o l l e d AP-42 emission f a c t o r ( a f t e r conversion t o
weight o f p o l l u t a n t h i t weight o f c l i n k e r i ns tead o f cement produced) o r t o those emission f a c t o r s de r i ved d u r i n g t h i s study (Table 4-26).
was used t o t a k e advantage o f t he g e n e r a l l y more extens ive data base which e x i s t s f o r t o t a l p a r t i c u l a t e emissions. It was f e l t t h a t t he emission fac- t o r s produced by t h i s technique would be more rep resen ta t i ve o f t h e t o t a l
i ndus t r y . 4-31.
Th is approach
The r e s u l t s o f t he above ana lys i s a re shown i n Table 4-27 through
I n t h e case o f u n c o n t r o l l e d c l i n k e r coolers , t h e above s t a t i s t i c s have been inc luded i n Table 4-18. The reader i s d i r e c t e d t o t h a t t a b l e f o r t h e candidate emission f a c t o r s f o r u n c o n t r o l l e d coolers . A summary o f t he can- d i d a t e emission f a c t o r s f o r cement k i l n s and c l i n k e r coo le rs are shown i n Tables 4-32 and 4-33, r e s p e c t i v e l y , and g r a p h i c a l l y i n F igures 4-1 and 4-2.
4-55

4-56

I N
I N
0 1
c o V I Z
.a3 I-
-
>1 c
- m 9 c o e
9 * L Y 9 0
.- a .-
. . L O Y z p:
0" v
c 0 ._
c Y Y 9 C
Y L IY 3 9 C * 0
0 Y U
0 Y L c U
a
,. 5
4-57

I
4-58

,
d 0 L =
" c I
i d .z =
o m L n . 4 00
00
'0'0 00
"e e m
%% bb
n N
<
N *
L * I
c - w L
: L I
.I L
c
L x
P . .. D
4-59

1440 1440
1119 1124 1515 1515
1100 1150 1515 1515
1045 1045 1415 1415
1000 1000 1400 1400
1545
1130 1130
094s 0945
31 31
31 26 39 28
26 30 16 29
29 30 40 40
31 36 48 31
51
80 16
64 56
60 56
66 59 63 53
52 53 59 55
58 53 61 63
54 65 €4 51
94
92 95
81 64
€4
63
13
1.2
71 M
84 79 15 69
65 69 73 66
10 69 13 75
68 16 15 12
96
96 98
88 14 16
16
9 0 % 0.16 0.050 83 95 0.16 0.059
0.096 0.12 0.14 0.15 0.090 0.10 0.13 ' 0.15
91 95 0.16 0.050 0.11 0.13 0.15 0.15 88 93 0.16 0.041 0.094 0.13. 0.14 0.15 81 85 0.16 0.062 0.10 0.12 0.13 0.14 11 82 . 0.16 0.045 0.085 0.11 0.12 0.13
14 79 0.16 0.041 0.083 0.10 0.12 0.13 0.085 0.11 0.13 0.15 o.ma 0 .12 0 . 1 3 n i r
83 91 0.16 0.040 81 81 ' 0.16 0.050 72 11 0.16 0.046
18 83 0.16 0.016 0.093 0.11 0.12 0 11 76 81 0.16 0.048 0.085 0.11 0.12 0.13 80 84 0.16 0.064 0.098 0.12 0.13 0 . 1 3 85 91 0.16 0.064 0.10 0.12 0.14 0.15
74 19 0.16 0.050 0.W6 0.11 0.12 0.13 82 86 0.16 0.058 0.10 0.12 0.13 0.14 85 91 0.16 0.017 0.10 0.12 0.14 0.15 18 82 0.16 0.050 0.091 0.12 0.12 0.13
98 99 0.16 0.082
98 99 0.16 0.13 100 loo 0.16 0.12
93 95 0.16 0.10 82 86 0.16 0.090
84 89 0.064
04 88 0.061
. .. . . .. 0.088 0.11 0.12 0.12
0.15 0.15 0.16 0.16
0.15 0.15 0.16 0.16 0.15 0.16 0.16 0.16
0.13 0.14 0.15 0.15 0.10 0.12 0.13 0.14
0.10 0.12 0.13 0.14
0.10 0.12 0. 13 0.14
9 . 1 1.8 6.9 0.024 0.021 0.015 0.013 0.011
1.1 1.1 1.1 1.4 1.2 1.1 1 .1 1.1
4-60

4-61

TABLE 4-33. SUMMARY OF CANDIDATE E M I S S I O N FACTORS FOR CLINKER COOLERS
Emission Fac tor Rat ing: E
Cumulative emission f a c t o r e q t a i t o o r l e s s than s t a t e d s i z e
s i zea Gravel bgd Uncontro l lede bed f i l t e r d O lmA) Uncont ro l led f i l t e r kg/Mg l b / t o n kg/Mg l b / t o n
Cumulative mass % equal tfi P a r t i c l e o r l e s s than s ta ted s i z e Gravel
2.5 5.0 10.0
0.54 1.5 8.6
40 0.025 0.050 0.064 0.13 64 0.067 0.13 0.10 0.20 76 0.40 0.80 0.12 0.24
15.0 21 84 0.99 2.0 0.13 0.26 20.0 34 89 1.6 3.2 0.14 0.28
Tota l mass emission f a c t o r
4.6 9.2 0.16 0.32
Aerodynamic diameter.
Rounded t o two s i g n i f i c a n t f i gu res .
U n i t we igh t o f p o l l u t a n t per u n i t we igh t o f c l i n k e r produced. t o t -c s j g n j f f c a n t f i gu res .
From Table 4-31.
Converted f rom u n i t weight o f p o l l u t a n t p e r u n i t we igh t o f cement ( f rom Table 4-18) t o weight/weight o f c l i n k e r produced assuming 5% gypsum i n f i n i s h e d cement.
a
From Tables 4-18 and 4-31.
Rounded
e
4-62

1000.0 I I I I 1 1 1 1 I I I I I I I 1 100.0
d . 1.0 I@ # -4 o.l
Wet Process Kiln with ESP Dry Process Kiln with Boghouse
0.01 10 100
0.1 1 .o
Aerodynamic' Particle Diameter ( p m A )
Figure 4-1. Size specific emission factors for cement kilns.
4-63

n
i L 0 0 4-
- - - - 1 a' Uncontrolled Coolers
- -
c -I
0.1 l . ~
F 1 I I I t l l l l I I I I I I I I 0.01 0.01
1.0 10.0 . 100.0
Aerodynamic Particle Diameter ( p m A )
n
2 b 0 4-
Figure 4-2. Size specific emission factors for clinker coolers.
4-64

4.4 EMISSION FACTOR QUALITY RATING
The quality of. the average emission factors contained in Tables 4-27 through 4-31 were rated utilizing the general criteria established by OAQPS as outlined in Section 3.0. it was found necessary to apply some lower quality particle size data to a B-rated emission factor. Because of this large difference in data quality, it became difficult to ascertain what the overall rating of the resultant emission factor should be. Generally, a B-rated emission factor should not be combined with C or D particle size data. amount of engineering judgment was employed to rate the quality of the emis- sion factors obtained. Even though the particle size data were sometimes only marginally acceptable, they were applied to a high quality emission factor. It would be expected, therefore, that something better than an order-of-magnitude estimate would be provided by such a procedure. For this reason, it was determined that a minimum o f D wouid be the most appro- priate for the resulting emission factors where large differences i n data quality existed.
In the case of uncontrolled wet process kilns,
For this reason, a certain
For the remainder of the candidate emission factors developed in this study for cement kilns, generally high quality particle size data were ap- plied to a lower quality total particulate emission .factor. Also, the ex- isting data base for particle size distribution was found to be extremely limited in most cases. Therefore, a rating of D was assigned to the re- sultant size-specific factors for cement kilns. In the case of clinker coolers, for which the original particle size data were rated C, a rating of E was assigned to the size-specific emission factors utilizing the cri- teria developed by the OAQPS.
4-65

REFERENCES FOR SECTION 4.0
1. Burke, E., "Dust Arrestment i n t h e Cement Indust ry , " Chem. Indus., 1312-1319, October 15, 1955.
*2. Verein Deutscher Ingenieure - R i c h t l i n i e n , Dust Prevention - Cement iriiiustry, V U L L V Y . ~ , = Rulllll11331u11 le,,,,,u,,.ud,y -, Federa! Republic o f West Germany, June 1961.
sin7 O ~ A tinv v.---:..:,.- D :..~,~i+~,,,,-, ,io.. i l l f t
3. Harr ison, B. P., Jr., "Baghouse Cleans 500°+ Cement K i l n Gases," A i r Eng., p. 14-16, March 1963.
*4. K r e i c h e l t , T. E., e t a l . , Atmospheric Emissions from the Manufacture o f Por t land Cement, Publ. No. 999-AP-17 (NT IS PB 190 236), U.S De- partment o f Health, Education and Welfare, Publ ic Heal th Service, C inc innat i , OH, 1967.
5. Vandegr i f t , A. E., etal., P a r t i c u l a t e P o l l u t a n t System Study, Vol- ume I: Mass Emissions, APTO-0743 (NTIS PB 203 128), U.S. Environ- mental Pro tec t ion Agency, Research T r i a n g l e Park, NC, May 1971.
*6. Vandegr i f t , A. E., e t a l . , P a r t i c u l a t e P o l l u t a n t System Study, Vol- ume 111: Handbook o f Emission Proper t ies , APTD-0745 (NTIS PB 203 522), U. S. Environmental P r o t e c t i o n Agency, Research Tr iang le Park, NC, May 1971.
*7. Shannon, L. J., e t a l . , P a r t i c u l a t e P o l l u t a n t System Study, Vol- ume 11: Fine P a r t i c l e Emissions, APTO-0744 (NTIS PB 203 521), U.S. Environmental Pro tec t ion Agency, Research Tr iang le Park, NC, May 1971.
* Ind ica tes repor ts conta in ing p a r t i c l e s i z e data.
4-66
-

a.
9.
10.
11.
12.
13.
14.
15.
Background In format ion f o r Proposed New Source Performance Standards: Steam Generators, Inc inera tors , Por t land Cement Plants , N i t r i c Ac id Plants, and S u l f u r i c Acid Plants, APTD-0711 (NTIS PB 2 0 2 4 5 9 ) , U.S.
Environmectal Protection AgencyiResearch Triangle Park, NC, August 1971
Standards o f Performance f o r New and Substant iaTly Modi f ied Por t land Cement Plants, Dra f t , U.S . Environmental Pro tec t ion Agency, Bureau of S ta t ionary Source Compliance, Durham, NC, August 1971.
Emissions from Wet Process. Cement K i l n and C l inker Cooler a t Maule Indus t r ies , Hialeah, F lo r ida , ETB Test No. 71-MM-01, U. S. Environ- mental Pro tec t ion Agency, Research Tr iang le Park, NC, March 1972.
Emissions from Wet Process Cement K i l n and C l inker Cooler a t Idea l Cement Company, Seat t le , Washington, ETB Test No. 71-MM-03, U.S . En- vironmental Pro tec t ion Agency, Research Tr iang le Park, NC, March 1972.
Emissions from Wet Process Cement K i l n and F i n i s h M i l l Systems a t I d e a l Cement Company, Cast le Hayne, North Carol ina, ETB Test No. 71-MM-04, U.S. Environmental Pro tec t ion Agency,' Research T r i a n g l e Park, NC, March 1972.
Emissions from Dry Process Cement K i l n a t Dragon Cement Company, Northhampton, Pennsylvania, ETB Test No. 71-MM-05, U.S. Environmen- t a l P r o t e c t i o n Agency, Research Tr iang le Park, NC, March 1972.
Emissions from Wet Process C l i n k e r Cooler and F i n i s h M i l l Systems a t I d e a l Cement Company, Houston, Texas, ETB Test No. 71944-06, U.S. Environmental Pro tec t ion Agency, Research Tr iang le Park, NC, March 1972.
Emissions from Wet Process Cement K i l n a t G ian t Por t land Cement, H a r l e y v i l l e , South Carol ina, ETB Test No. 71-MM-07, U.S. Environ- mental Pro tec t ion Agency, Research Tr iang le Park, NC, 1972.
4-67

16.
17.
"18.
"19.
"20.
"21.
"22.
23.
Emissions from Wet Process Cement K i l n a t Oregon Por t land Cement Company, Lake Oswego, Oregon, ETB Test No. 71-MM-15, U.S. Environ- mental P ro tec t i on Agency, Research T r iang le Park, NC, March 1972.
Emissions from Dry Process Raw M i l l and F i n i s h M i l l Systems a t I dea l C.CIIISI,* r,,mn=ntr *""'p""J, ~ j + ~ ~ ~ New Mex iCc , ET! rest No. ~ I - M M - Q ~ , U.S. E!-
v i ronmental P ro tec t i on Agency, Research T r iang le Park, NC, A p r i l 1972.
A i r P o l l u t i o n Emission Test, Ar izona Por t land Cement, R i l l i t o , Arizona, EPA P ro jec t Report 74-STN-1, U. S. Environmental P ro tec t i on Agency, Research T r iang le Park, NC, June 1974.
Davis, T. A. , e t a l . , Disposal and U t i l i z a t i o n o f Waste K i l n Dust from Cement Indus t ry , EPA-670/2-75-043 (NTIS PB 242825), U. S. Environ- mental P ro tec t i on Agency, C inc inna t i , OH, May 1975.
Nichols, G. B., and J. D. McCain, P a r t i c u l a t e C o l l e c t i o n E f f i c i e n c y Measurements on Three E l e c t r o s t a t i c P rec ip i t a to rs , EPA-600/2-75-056 (NTIS PB 248 220), U.S. Environmental P ro tec t i on Agency, Washington, D.C., October 1975.
McCain, J. D., Evaluat ion o f Rexnord Gravel Bed F i l t e r , EPA-600/2-76- 164 (NTIS PB 255 095), U.S. Environmental P ro tec t i on Agency, Research Tr iang le Park, NC, June 1976.
Greeni.ng, N. R., -1 e t a1 E l i m i n a t i o n o f Water P o l l u t i o n by Recycl ing Cement P lan t K i l n Dust, EPA-600/2-76-194 (NTIS PB 259 080), U.S. Environmental P ro tec t i on Agency, C inc inna t i , OH, J u l y 1976.
Muelberg, P. E., e t a l . , I n d u s t r i a l Process P r o f i l e s f o r Environmental Use, Chapter 21, The Cement Indus t r y , EPA-600/2-77-023~ (NTIS PB 281 4881, U.S. Environmental P ro tec t i on Agency, C inc inna t i , OH, February 1977.
4-68

I 24.
i , 25. ~
"26A.
"268.
"27.
"28.
*29.
30. I
Hurst , W. W . , P a r t i c u l a t e Emissions Test ing, Greencast le P lan t , Lone
S t a r I n d u s t r i e s , Houston, TX, July 1977.
Hurst , W. W . , P a r t i c u l a t e Emissions Test ing, Nazareth P lan t , Lone
S t a r I n d u s t r i e s , Houston, TX, January 1978.
Hunter, S. C., e t a l . , A p p l i c a t i o n o f Combustion M o d i f i c a t i o n s t o
I n d u s t r i a l Combustion Equipment, EPA-600/7-79-015a (NTIS PB 294 2141, U.S. Environmental P r o t e c t i o n Agency, Research T r i a n g l e Park, NC, January 1979.
Hunter, S. C., et al., Application of Combustion Modifications to Industrial Combustion Equipment: Data Supplement A, EPA-600/7-79-015b
(NTIS PB 293888), U. S. Environmental Protection Agency, Research
Triangle Park, NC, February 1979.
Taback, H. J., e t a l . , F ine P a r t i c l e Emissions from S t a t i o n a r y and Miscel laneous Sources i n t h e South Coast A i r Basin, KVB 5806-783 (NTIS PB 293 923), C a l i f o r n i a S ta te A i r Resources Board, Sacramento, CA, February 1979.
B a r r e t t , K. W . , A Review o f Standards o f Performance o f New S t a t i o n a r y Sources. - Por t l and Cement I n d u s t r y , EPA-450/3-79-012 (NTIS PB 80-
112089), U. S. Environmental P r o t e c t i o n Agency, Research T r i a n g l e Park, NC, March 1979.
Smith, R. F., and J. E. Levin, Mul t imedia Assessment and Environmental
Needs o f t h e Cement Indus t r y , EPA-600/2-79-111 (NTIS PB 299 210), U.S. Environmental P r o t e c t i o n Agency, C i n c i n n a t i , OH, May 1979.
Stack Emissions Survey o f Lone S t a r I n d u s t r i e s , I nc . , Po r t l and Ce-
ment P lan t , Maryneal, Texas, F i l e No. EA 795-09, Ecology Audi ts , I nc . ,
Dal las, TX, September 1979.
4-69

31.
32.
33.
34.
35.
36.
37.
38.
Hurst, W. W., Gas Process Survey, Roanoke No. 5 Kiln System; Lone Star Cement, Inc., Cloverdale, VA, October 1979.
Mease,. M. J., Test Report Stack Analysis for Particulate Emission, Clinker Coolers/Gravel Bed Filter, Mease Engineering Associates, Port Matilda, PA, March 1980.
Source Emissions Survey of Oklahoma Cement Company, Kiln No. 3 Stack, Pryor, Oklahoma, Mullins Environmental Testing Company, Addison, TX, March 1980.
Mullins, B. J., Source Emissions Survey o f Lone Star Industries, Inc., Kilns 1, 2, and 3, Maryneal, Texas, Mullins Environmental Testing Com- pany, Addison, TX, June 1980.
Arlington, W. D., Compliance Stack Test, Lone Star Florida, Inc. I Report 275-5, Kiln No. 3, South Florida Environmental Services, Inc., Belle Glade, FL, July 1980.
Arlington, W. D., Compliance Stack Test, Lone Star Florida, Inc. , Report 276-S, Cooler No. 3, South Florida Environmental Services, Inc., Belle Glade, FL, July 1980.
Compliance Stack Test Lone Star Florida/Pennsuco, Inc., Report 387-5, Kiln No. 3, South Florida Environmental Services, Inc., West Palm Beach, FL, July 1981.
Preliminary Stack Test, Lone Star Florida/Pennsuco, Inc., Report 391-P, Kiln No. 3, Precipitator Inlet Stack Outlet, South Florida Environmental Services, Inc., West Palm Beach, FL, July 1981.
' 39. Mullins, B. J., Source Emissions Survey o f Lone Star Industries, Inc., New Orleans, Louisiana, Mullins Environmental Testing Company, Addison, TX, November 1981.
4-70
40., Hurst , W. W . , Stack Emission Survey and P r e c i p i t a t o r E f f i c i ency
Tes t ing a t Bonner Spr ings P lan t , Lone Star I n d u s t r i e s , Inc. , Houston, TX, November 1981.
41. Johnson, L. A., F i e l d Data Source Test, Chemecology Corporat ion, P i t t sbu rg , CA, May 1982.
. .
'42. Hansen, M. D., and J. S. Kinsey. Characterization of Inhalable Partic- ulate Matter Emissions from a Dry Process Cement Plant,Volumes I and 11, EPA-600/X-85-332a and 332b. U. S. Environmental Protection Agency, Research Triangle Park, NC, February 1983.
43. 'Lonnes, P., Resul ts o f t he February 17 and 18, 1983, NSPS P a r t i c u l a t e Emission Compliance Test on t h e No. 8 K i l n a t t h e Lehigh Por t l and Cement P l a n t i n Mason City, Iowa, I n t e r p o l l , Inc. , B la ine , MN, March
1983.
44. Ste iner , J., Mojave P lan t ( K i l n , C l i nke r , and Crusher Baghouses) Annual Compliance Test, Report PS-83-93/Project 5081-83, Pape and
S te ine r Environmental Services, Bakers f ie ld , CA, May 1983.
45. Levine, S . , "New Mojave P l a n t o f C a l i f o r n i a Por t l and Under Computer Control , " P i t & Quarry , 82-87, J u l y 1983.
'46. Hansen, M. D., et al., Characterization of Inhalable Particulate Matter Emissions from a Wet Process Cement Plant, Volumes I, 11, and 111, EPA-600/X-85-343a, 343b, and 343c, U. S. Environmental Protection Agency, Research Triangle Park, NC. July 1983.
47. Lonnes, P., Resul ts o f t he June 22-24, 1983, NSPS P a r t i c u l a t e Emis - s i o n Compliance Test on the No. 8 K i l n a t t h e Lehigh Por t l and Cement P l a n t i n Mason City, Iowa, I n t e r p o l l , Inc . , C i r c l e Pines, MN, J u l y
1983.
4-71
I 48.
49.
50.
51.
52.
53.
54.
55.
56.
Source Emissions Survey o f Lehigh P o r t l a n d Cement Company, Waco,
- Texas, M u l l i n s Environmental T e s t i n g Company, Addison, TX, August
1983.
B o r r e l l i , .L., F i e l d Data Source Test, Chemecology Corporat ion, P i t t s b u r o , CA: August 1983.
S te ine r , J., Mojave P l a n t ( K i l n , C l i n k e r , and Crusher Baghouses)
Annual Compliance Test, Report PS-84-249/Project 5233-84, Pape and S te ine r Environmental Services, B a k e r s f i e l d , CA, May 1984.
Lehigh Por t l and Cement Company, Leeds, Alabama, P a r t i c u l a t e Compli- ance T e s t , CH,M H i l l , Montgomery, AL, October 1984.
Baker, R. L., Compliance Tes t Resul ts , P a r t i c u l a t e and S u l f u r Oxide
Emissions, Cementon K i l n , KVB, Inc., Engineer ing and Research D i v i -
s ion, I r v i n e , CA, December 1984.
S te ine r , J., Mojave P l a n t (K i - ln , Crusher, and C l i n k e r Baghouses)
Annual Compliance Test, Report PS-85-469/Project 5451-85, Pape and S t e i n e r Environmental Services, B a k e r s f i e l d , CA, May 1985.
A r l i n g t o n , W. O . , Lone S t a r F l o r i d a Holding, Inc. , Stack Tests f o r
P a r t i c u l a t e , SO2, NO,, and V i s i b l e Emissions, Report 810-S, K i l n
No., South F l o r i d a Environmental Services, I nc . , West Palm Beach, FL, August 1985.
Q u a r t e r l y Tes t i ng f o r Lone S t a r Cement, Davenport, C a l i f o r n i a , Report
PS-85-539/Project 5509-85, Pape and S te ine r Environmental Services, Bakers f i e ld , CA, September 1985.
Telephone communication between Joe McCain, Southern Research I n s t i -
t u t e , Birmingham, AL, and John Kinsey, Midwest Research I n s t i t u t e ,
Kansas City, MO, J u l y 28, 1983.
4-72

SECTION.5.0
PROPOSED A P - 4 2 SECTION 8.6
The proposed revision to Section 8.6 o f AP-42 is presented in the fol- lowing pages as it would appear in the document.
5-1

8.6 P O R W CEMENT MANUFACTURING
8.6.1 Process Descr ipt ionl-3
po r t i ana cement manufaccure accounts f o r about 9 5 percent of t h e cement product ion i n t h e United S ta tes . The more than 30 raw materials used t o make cement may b e d iv ided i n t o fou r b a s i c components: l i n e ( ca l ca reous ) , s i l i c a ( s i l i c e o u s ) , a l d n a ( a rg i l l aceous ) , and i r o n (f e r r i f e r o u s ) . Approximately 1575 kilograms (3500 pounds) of d ry raw m a t e r i a l s are required t o produce 1 metric t o n (2200 pounds of cement). weight i s removed as carbon d ioxide and water vapor. As shown i n Figure 8.6-1, t h e raw m a t e r i a l s undergo s e p a r a t e c rush ing af ter t h e quarrying opera t ion , and, when needed f o r processing. are proport ioned, ground and blended by e i t h e r a dry o r wet process. One b a r r e l of cement weighs 171 kilograms (376 pounds).
Between 45 and 65 percent of raw m a t e r i a l
I n t h e d ry process , moisture conten t of t h e rav material is reduced t o less The d r i e d materials a r e then
The k i l n is a long s t e e l cyl in- It i s s l i g h t l y i n c l i n e d , r o t a t i n g about
The pulver ized rav materials a r e fed i n t o t h e upper end,
than 1 percent , e i t h e r before o r dur ing gr inding . pulver ized and fed d i r e c t l y i n t o a r o t a r y k i ln . d e r wi th a r e f r a c t o r y b r i c k l i n ing . t h e long i tud ina l axis. t r ave l ing slowly t o t h e lower end. Kilns are f i r e d from t h e l o v e r end, so t h a t t h e r i s i n g hot gases pass through t h e raw mater ia l . Drying, decarbonating and ca l c in ing are accomplished a s t h e material t r a v e l s through t h e heated kiln and f i n a l l y burns t o i n c i p i e n t fu s ion and forms t h e c l inke r . The c l i n k e r is cooled, mixed wi th about 5 weight percent gypsm and ground t o t h e des i r ed f ineness . The product , cement, i s then s to red f o r later packaging and shipment.
Yi:h :!IC vc: prccess, a s?urr; is made by adding va:er :o t h e id:ial g r ind ing operat ion. s t ep . After t h e materials a r e mixed. excess water i s removed and f i n a l ad jus t - ments are made t o o b t a i n a des i r ed composition. This f i n a l homogeneous mixture is fed t o t h e k i l n s as a s l u r r y of 30 t o 40 percent moisture o r as a w e t f i l - t ra te of about 20 percent moisture. The burning, cool ing , a d d i t i o n of gypsum, and a to rage are then c a r r i e d ou t , as i n the d ry process.
The t rend i n t h e Por t land cement i n d u s t r y i s toward t h e u s e of t h e dry
Proport ioning may t a k e p l a c e before o r a f t e r t h e gr inding
process of c l i n k e r production. Eighty percent of t h e kilns b u i l t s i n c e 1971 uee t h e dry process, compared t o 46 percent of e a r l i e r k i l n s . D r y process k i l n s t h a t have become sub jec t t o new source performance s t anda rds (NSPS) s i n c e 1979 commonly are e i t h e r prehea ter o r p rehea te r lp reca lc ine r systems. a l low t h e s e n s i b l e heat in k i l n exhast gases t o h e a t , and p a r t i a l l y t o c a l c i n e , t h e raw feed be fo re i t e n t e r s t h e k i ln .
Both systems
Addit ion of a prehea ter t o 8 dry process k i l n permits u s e of a k i l n one half t o two t h i r d s s h o r t e r than those without a p rehea te r , because heat t r a n s f e r t o t h e dry feed is more e f f i c i e n t i n a p rehea te r t han i n t h e preheat ing zone of t h e k i ln .4 Also, because of t h e increased hea t t r a n s f e r effici 'ency, a prehea ter k i l n system requi res less energy than e i t h e r a w e t k i l n o r a dry k i l n without a prehea ter t o achieve t h e same amount of ca l c ina t ion . We: raw feed (of 20 t o 40 percent moisture) r equ i r e s a longer res idence t ime f o r preheat ing, which i s b e s t provided i n t h e k i l n itself. Therefore , w e t process p l an t s do not u s e
10186 Mineral Products Indus t ry 8.6-1 5-2 I
~~ i

.
r' 4
8.6-2 EMISSION FACTORS ' 5-3
10186

prehea te r systems. percent less f u e l than a wet process k i l n .
8.6.2 Emissions And control^^-*^^
A d ry process k i l n wi th a p rehea te r s y s t e m can use 50
P a r t i c u l a t e matter is t h e primary emission i n t h e manufacture of Por t land cement. emissions a lso inc lude t h e normal combustion products of t h e f u e l used f o r hea t i n t h e k i l n and i n drying ope ra t ions , inc luding oxides of n i t rogen and s m a i i amouncs of oxides of aui iur .
Sources of d u s t a t cement p l a n t s a r e 1) quarrying and crushing, 2) raw material s t o r a g e , 3) gr inding and blending (dry process o n l y ) , 4) c l i n k e r pro- duc t ion and cool ing. 5 ) f i n i s h gr inding , and 6) packaging. The l a r g e s t single point of emissions is t h e k i l n , which may be considered t o have t h r e e u n i t s , t h e feed system, t h e f u e l f i r i n g system, and t h e c l i n k e r cool ing and handling system. emissions con t ro l s y s t e m is i n j e c t i o n i n t o t h e k i l n burning zone f o r i n c l u s i o n i n t h e c l inke r . I f t h e a l k a l i content of t h e raw materials is too high, how- ever , some of t h e dus t is discarded o r t r e a t e d be fo re i t s r e t u r n t o t h e kiln. The maximum a l k a l i content of dus t t h a t can be recycled i s 0.6 percent (calcu- l a t e d as sodium oxide). raw material and c l i n k e r s to rage p i les , conveyors, s t o r a g e silos. loading/ unloading f a c i l i t i e s , and paved/unpaved roads.
The most d e s i r a b l e method of d i spos ing of t h e dus t co l l ec t ed by a n
Addit ional sources of dus t emissions are quarrying,
The complications of k i l n burning and t h e l a r g e volumes of .ma te r i a l handled have l e d t o t h e use of many cont ro l systems f o r dus t co l l ec t ion . The cement indus t ry gene ra l ly uses mechanical c o l l e c t o r s , e l e c t r i c p r e c i p i t a t o r s , f a b r i c f i l t e r (baghouse) c o l l e c t o r s , o r combinations of these t o con t ro l emissions.
To avoid excess ive a l k a l i and s u l f u r bu i ldup in t h e raw feed , some systems have an a l k a l i bypass exhaust gas system added between t h e k i l n and t h e preheat- e=. %=e cf t h e k i l c exhaust geses are ducted t o t h e a l k a l i bypass before t h e p rehes t e r , thus reducing t h e a l k a l i f r a c t i o n passing through t h e feed. P a r t i c u - l a t e emissions from t h e bypass are c o l l e c t e d by a s e p a r a t e con t ro l device.
Tables 8.6-1 through 8.6-4 g i v e emission f a c t o r s f o r cement manufacturing, inc luding f a c t o r s based on p a r t i c l e s i ze . S i z e d i s t r i b u t i o n s f o r p a r t i c u l a t e emissions from con t ro l l ed and uncontrol led k i l n s and c l i n k e r coolers a r e a l s o shown i n Figures 8.6-2 and 8.6-3.
S u l f u r d ioxide (Sq) may come from s u l f u r compounds i n t h e ores and in t h e f u e l combusted. The s u l f u r content of bo th w i l l vary from plan t t o p l an t and from region t o region. Information on t h e e f f i c a c y of p a r t i c u l a t e con t ro l devices on S q emissions from cement kilns is inconclusive. v a r i a b i l i t y of f a c t o r s such as feed s u l f u r conten t , temperature, moisture , and feed chemical composition. t h e a l k a l i and s u l f u r content of t h e raw materials and fuel.6
This is because of
Control ex ten t w i l l vary, of course, according t o
Nitrogen oxides (NQare a l s o formed dur ing f u e l combustion i n r o t a r y cement k i ln s . f u e l ( f u e l N 4 ) a s w e l l a s i n incoming combustion a i r ( thermal N4,). t i t y of N4, formed depends on t h e type of f u e l , i t s n i t rogen con ten t , combustion temperature , etc. l i n e cement and thus i s removed from t h e g a s stream.
The N 4 , emissions r e s u l t from t h e oxida t ion of n i t rogen in the The quan-
Like S q , a c e r t a i n po r t ion of t h e N4, r e a c t s w i t h the alka-
10/86 Mineral Prodycts Indus t ry 5 -4
8.6-3

0 .6 -4
N
0
- Q
0 9
9 N
4 - a
h ?
a
CI ?
a I
.n
a N N
P
P
z
r
2 0 - . n
.n n N
?i -
c
II m m " 0
a - 2 E n
D 0
n
0 9
9 N
I - a
c
a '4 n
a
4 4
a n N
P
P 9 0
I
YI
z n
0 N -
c
3 . m u
a z r .a
q; 0 0
- N 9 9 0 0
S I
9 s
9 9
9 9
9 s
S 9
2 9
9 s
s 9
S s
9 9 n m
9 9 0 3
N O
M i .a
EMISSION FACTORS 5-5

TABLE 8.6-2. CONTROLLED PARTICULATE EMISSION FACTORS FOR CEMENT MANUFACTURING~
Type of source
Control P a r t i c u l a t e Emission technology WMg l b / t o n Fac tor
Rating c l i n k e r c l i n k e r ~~ ~~
Wet process k i l n Baghouse 0.57 1.1 C
~ r y process k i l n Mult ic lone 130b 260b D
ESP 0.39 0.78 C
M u l t i cyc lone + ESP 0.34 0.68 C
Baghouse 0.16 0 -32 B
Clinker coo le r Gravel bed f i l t e r 0.16. 0.32 C
ESP 0.048 0.096 D Baghouse 0.010 0.020 C
P r i m a r y l imes tone c r u s h e s Baghouse 0.00051 0.0010 D
screenc Bag hous e 0.00011 0.00022 D
sc reen and c r u s h e s Baghouse 0.00016 0.00032 D
Conveyor t ransf e$ Baghouse 0.000020 0.000040 D
Raw m i l l systemcpd Baghouse 0.034 0.068 D
F in i sh m i l l systeme Baghouse 0.017 0.034 C
Primary l imes tone
Secondary l imestone
aReference 8. Expressed as kg part iculate/Mg ( l b p a r t i c u l a t e / t o n ) of c l i n k e r
bBased on a s i n g l e test of a dry process k i l n f i r e d with a combination of Not gene ra l ly a p p l i c a b l e t o a broad cross s e c t i o n
produced, except a s noted. ESP = e l e c t r o s t a t i c p r e c i p i t a t o r .
coke,and na tu ra l gas. of t h e cement industry.
CExpressed as mass of pollutant /mass of raw mate r i a l processed. dIncludes m i l l , a i r sepa ra to r and weigh feeder . eIncl.udes m i l l , a i r sepa ra to r ( s ) and one or more ma te r i a l t r a n s f e r operat ions. Expressed i n terms of u n i t s of cement produced.
10186 Mineral Products Indus t ry 5-6
8.6-5 i

w N Y m
8.6-6 EMISSION FACTORS 5-7
10/86

/.
$9 1
1 Uncontrolled Wet Process Kiln 2 Uncontrolled Dry Process Kiln 3 Dry Rocsu Kiln with Multiclons 4 Wet Process Kiln with ESP
Dry Process Kiln with Baghousm
0.01 10 100
0.1 I .o
Aerodynamic Particlo Diometor (pmA) Figure 8.6-2. S i t e s p e c i f i c emission fac tors for cement k i l n s .
10/86
~~
Mineral Proaucts Industry 5-8
a. 6-7
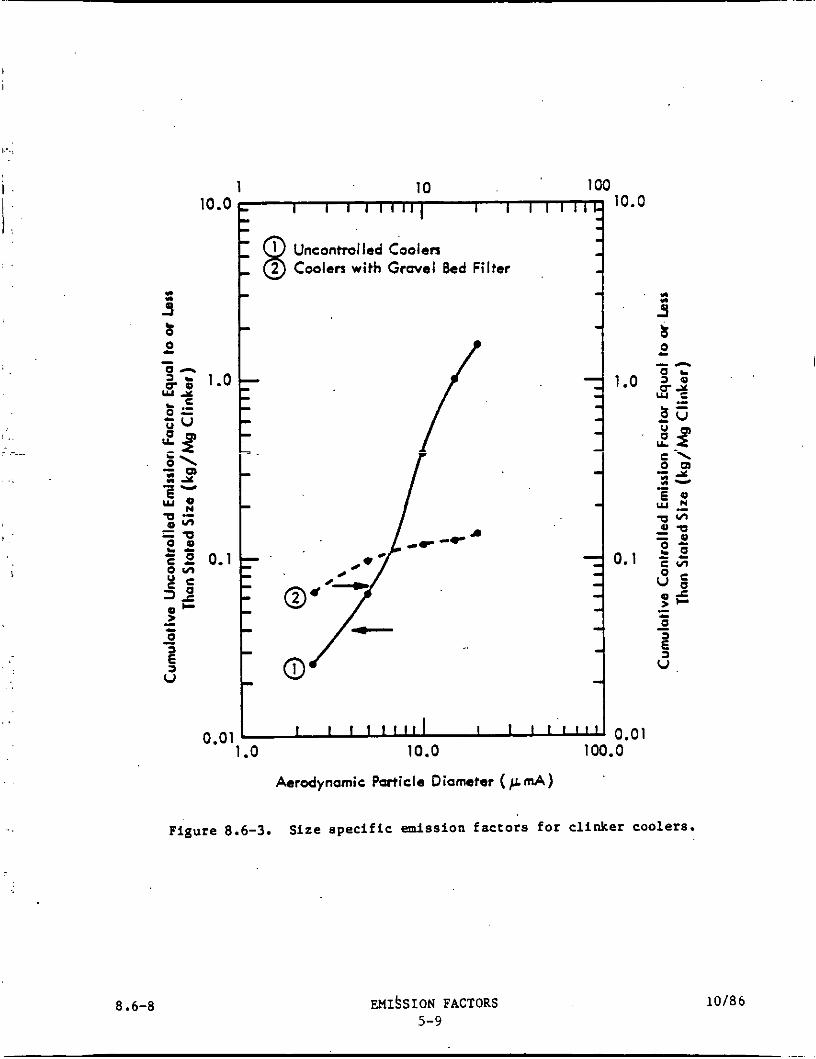
1 10 100
Figure 8.6-3. Size s p e c i f i c emission factors for cl inker coolers .
8.6-8 EMISSION FACTORS 5-9
10/86

TABLE 8.6-4. SIZE SPECIFIC EMISSION FACTORS FOR CLINKER COOLERSa
EMISSION FACTOR RATING: E
1 I P a r t i c l e Cumulative m a 2 Cumulative emission f a c t o r
< s t a t ed s izec < stated sized I a i d (*-> Ijncanerolled Gravel bed f i l t e r Uncon t ro l lg - Gravel bed f i l t e r
kg/Mg l b l r o n QlMg l b / ton I I 2.5 0.54 40 0.025 0.050 0.064 0.13
10.0 8.6 76 0.40 0.80 0.12 0.24 15.0 21 84 0.99 2.0 0.13 0.26 20.0 34 89 1.6 3.2 0.14 0.28
Total mass emission f a c t o r 4.6e 9.2' 0.16f 0.3Zf
5.0 1.5 64 0.067 0.13 0.10 0.20
- ~
aReferencc 8. bAcrodynamic diameter Cgounded t o two s ign i f i can t f igures. dUnlt weight of po l lu tsn t /un i t weight of c i inke r
eFrw Table 8.6-1. fFrom Table 8.6-2.
produced. Rounded t o two s ign i f i can t figure..
References f o r Sec t ion 8.6
1. T. E. Kre i che l t , et al., Atmospheric Emissions from t h e Manufacture of Por t land Cement , 999-AP-17, U. S. Environmental P ro tec t ion Agency, C inc inna t i , OH, 1967.
Background Information For Proposed New Source Performance Standards: Por t land Cement P lan t s , APTD-0711, U. S. Environmental P ro tec t ion Agency, Research Triangle Park, NC. August 1971.
2.
3. A Study of t h e Cement Industry in t h e S t a t e of Missouri , Resources Research, Inc., Reston, VA, December 1967.
4. Port land Cement P l a n t s - Background Information f o r Proposed Revisions t o Standards, EPA-450/3-85-003a, U. S. Environmental P ro tec t ion Agency, Research Triangle Park, NC, May 1985.
5 . Standards of Performance f o r Nev S ta t iona ry Sources, 36 FR 28476, December 23, 1971.
6. P a r t i c u l a t e Po l lu t an t System Study, Volume I, APTD 0 7 4 3 , U. S . Environ- mental P ro tec t ion Agency, Research Tr iangle Park, NC, May 1971.
10/86 I Mineral Products Indus t ry 5-10
8.6-9

7. Restr ic t ion of Emissions from Portland Cement Works, VDI Richt l in ien , Duesseldorf, West Germany, February 1967.
8. J . S. Kinsey, Lime and Cement Industry - Source Category Report, Vol. 11, EPA Contract No. 68-02-3891. Mldvest Research I n s t i t u t e , Kansas City, MO, August
. .
8.6-10
14, 1986.
' EMISSION FACTORS 5-11
10186

. APPFNnlX . . -. ._ -. . A
EXCERPTS FROM REFERENCE DOCUMENTS USED I N THE DEVELOPMENT OF PARTICULATE EMISSION FACTORS
I
Excerpts f rom
REFERENCE 10 (SECTION 4.0)
: Emissions from Wet Process Cement K i l n and C l i n k e r Cooler a t Maule .S. Environ- - - ndus t r i es , H ia lea or ida , e s t No.
]I,ental, P r o t e c t i o n kiei:y, Rese~:~hTTriangle'~a~~,ok,"March 1972.

Rufi Number
Date
Percent Excess Air
- TABLE I
RESULTS FOR CLINKER COOLER STACK NO. 1
1 2
2-25-71 2 -25-7 1
NA NA
106.2 110.0 Percent I t o kinetic Stack Flow Rate - S C W dry 19,473 17.369
Stack Flow Rate - ACFM wet 23,898 21,360
74.90 69.25 volume of Dry Gas Sampled - SCF*
Feed Rate - tons/hr
. . ,
Par t icu la tes .
41.2 41..2
3
2-25-71
NA
103.7
, 18.996
23,216
71.41
41.2
7 I e aJ
probe, Cyclone, & F i l t e r Catch
128 mg
c
‘0
.r 0.0263 0.0282 0.0203
gr/SCF* dry aJ 0.0214 0.0229 0.0166 3
4.203 3.286 m 4.381 0
VI gr/CF @ Stack Condition; m
c1
. . Total Catch
mg
gr/SCF* dry
gr/CF @ Stack Conditlons
1 bs/ h r
lbs/ ton feed
% Impinger Catch
*70°F. 29.92” Hg I NA - Not Applicable
138 ’ 104 134
0.0216
0.0224
4.596
0.112
4.5
6
A- 3
0.0307 0.0224
0.0249 . 0.0183
4.551 3.647
0.110 0 .OW5
8.0 9.6

TABLE I1
RESULTS FOR KILN STACK NO. 1
Run Number
Date
Percent Excess Air
Percent Isokinetic
Stack Flow Rate - SCFW dry
Stack Flow Rate - ACFM wet
Yolume of Dry Gas Sampled - SCF*
Feed Rate - tons/hr
Par t icu la tes
Probe, Cyclone, & F i l t e r Catch
m9
gr/SCF* dry
gr/CF @ Stack Conditions
1 bs/ h r
1
2-26-71
181
96.1
55,031
126,208
48-84
40.3
172'
0.0542.
0.0236
25.53
2
2-26-71
i a i 94.5
54,413
122,704
47.49
40.3
272
0.0882
0.0391
41.08
3
2-26-71
1 a i
96.2
52.018
1 i a ,324
46.17
40.3
r- I *
488 a 5
0.163
0.0715 T3
72.51 2
E .r
01 VI
u lbsl ton feed 0.634 1.01 9 1.7991 2
To ta l Catch
mg 189 321 51 8
gr/SCF* dry : 0.0596 0.104 . . 0.173
0.0260 0.0461 0.0759
20.07 48 54 76.99 . . grICF @ Stack Conditions
. . l b s j h r
lbslton feed 0.696 1.204 1.910.
Z Impinger Catch 9.0 , 15.3 5 .a
* 7OOF. 29.92" Hg

Excerpts from
REFERENCE 17 (SECTION 4.0)
Emissions from Dry Process Raw Mill and Finish Mill Systems at Ideal - - , U.S. En- Cement Company, Tijeras, New Mexico, ETB T est No. 71 MM 02 vironmental Protection Agency, Research Triangle Park, NC, April 1972.
. ..
A- 5

Table 4 ...
Run Number Date Percent Ex
SUIWARY OF PARTICULATE DATA FOR 1.10. 2 FII!ISH.I4ILL
1 (TRIAL) 3-2-71 L
s Air Percent Isokinetic
' 4886 1 Stack Flow Rate - SCFM* dry Stack Flow Rate - ACFM wet ' 6406
Volume of Dry Gas Sampled - SCF* Feed Rate - tons/hr
105.0
36.62 Not Ceasured
Particulates Probe, Cyclone, 6 Filter Catch
gr/SCF* dry 0.0167 gr/CF @ Stack Conditions 0.0127
39.7 mg ..
2 3-3-71 -
102.9 5261 6843
115.95 34.6
24.7 O.CO461 0.00354
3 3-3-71 - ' 103.6 5089 6631
112.E8 34.6 -
I CT
0) - n m + c
w 0)
35.0 'r
0.00477 VI a 0.00366 2
5 lbs/hr. . , 0.699 0.208 0.208 a
bs/ton feed -- 0 -00601 0.00601
Total Catch
mg 74.6 51 .D 51.2 gr/SCF* dry 0.0314 0.00677 . . O.OGFOE
gr/CF @ Stack Conditions 0.0239 0.00520 0 .a0536 lbslhr 1.31 0.305 0.3011 lbs/ton feed -- 0.00882 0 .CC579 % Impinger Catch 46.8 32.0 31 .G
* 70°F, 29.92" Hg
A-6

Table 5
SUf.?I!I\RY OF PARTICVLATE DP,TA FOR 110. 2 -F I i i ISH KILL
Run Number Date
Percent Excess Air Percent Isokinetic Stack Flow Rate - SCFM* dry Stack Flow Rate - ACFM wet Volume of Dry Gas Sampled - SCF* Feed Rate - tons/hr
1 3-6-71
.-
,114.3 14,178 19,267 77.5G 32.8
A I R SEPARATOR
2 3-6-71 L
111.6 13,838 10,842 73.95 32.8
-Particulates
Probe, Cyclone, h Filter Catch - 23.6 21.8 I
0..""?69 0.!?0?5? QI cr mg
" , - lEPP* A-.. e - , " Y L V'J - n gr/CF @.Stack Conditions 0.00344 . '. 0.00333 m
I- C
-0 QI VI 3
.e m
, .r lbs/hr. 0.569 .. 0.538
rlbs/ton feed 0.0173 0.0164
m
n Total Catch
mg 44.1 41.6 gr/SCF* dry 0.00876 0.00-266
gr/CF @ Stack Conditions 0.00644 0.00636 lbs/hr 1.063 1.024 lbs/ton feed 0.0324 0.0312 % Impinger Catch 46.5 47.6
* 70°F, 2 9 . 9 2 " Hg
A-7 .

Table 6
SUI'XARY OF P A R T I C U L A T E GATA FOR NO. 2 FIilISH PIILL FEED-0-!..'EIGHT
Run Number
Date
Percent Excess Air
Percent Isokinetic
Stack Flow Rate - SCFM* dry Stack Flow Rate - ACFM wet Volume of Dry Gas Sampled - SCF* Feed Rate - tonslhr
1 3-6-71
N A 106.2
.10,517 I Z , / Y I
100.34
. .
- _ -__
28.7
2 3-8-71
ti A 103.5 10,587
,98.39 28.7
r n n-.c IL,3130
Particulates
Probe. Cyclone, 6 Filter Catch 20.1 18.8
mg F
I d a8
n) I- E
-0
0.00308 0.00294 0.00240 0.00253
0.273 0.265
gr/SCF* dry
gr/CF @ Stack Conditions
lbs /hr . - n
lbslton feed O.OG953 0.00922 .r
Total Catch
mg gr/SCF* dry
gr1CF @ Stack Conditions
w a VI
n) + 2 33.7 31.1
0.00517 0.004 87 0.00425 0.00393
lbslhr 0.463 0.434 lbslton feed
% Impinger Catch 0.0161 0.0151 40.4 39.5
* 70°F, 29.92" Hg
A- 8

Table 1
SUKIUARY OF PARTICULATE DATA FOR NO. 2 EA? ;.!ILL
Run Number
Date Percent Excess Air
Percent Isokinetic
Stack Flow Rate - SCFM* dry Stack Flow Rate - ACFM wet Volume of Dry Gas Sampled - SCF* Feed Rate - tonslhr
, Particulates
Probe, Cyclone, h Filter Catch
mg gr/SCF* dry gr;CF $ S~ac 'n Ceidi i ions L 1
1 3-9-71 c
109.6 31 77 4684 , 84.47 53.1
172.5 0.0314 ".0??3
2 3-10-71 - 108.2 3210 4708 79.33 57.2
197.1 7 0.0383 I
0. C?6? a e - n
lbs/ton feed 0.01 61 O.Olf(3 E
lbs/hr. 0.855 1 .C49 m F
.r
I U
Total Catch 3
m mg 2c1 .1 213.4 m
n
W VI
c,
gr/SCF* dry 0.0367 0.C415 gr/CF @ Stack Conditions . 0.0248 0.0283
lbs/hr 0.998 1.140 lbslton feed o.oiaa 0.0199
14.2 7.9 % Impinger Catch
* 70"F, 29.92" Hg
A- 9
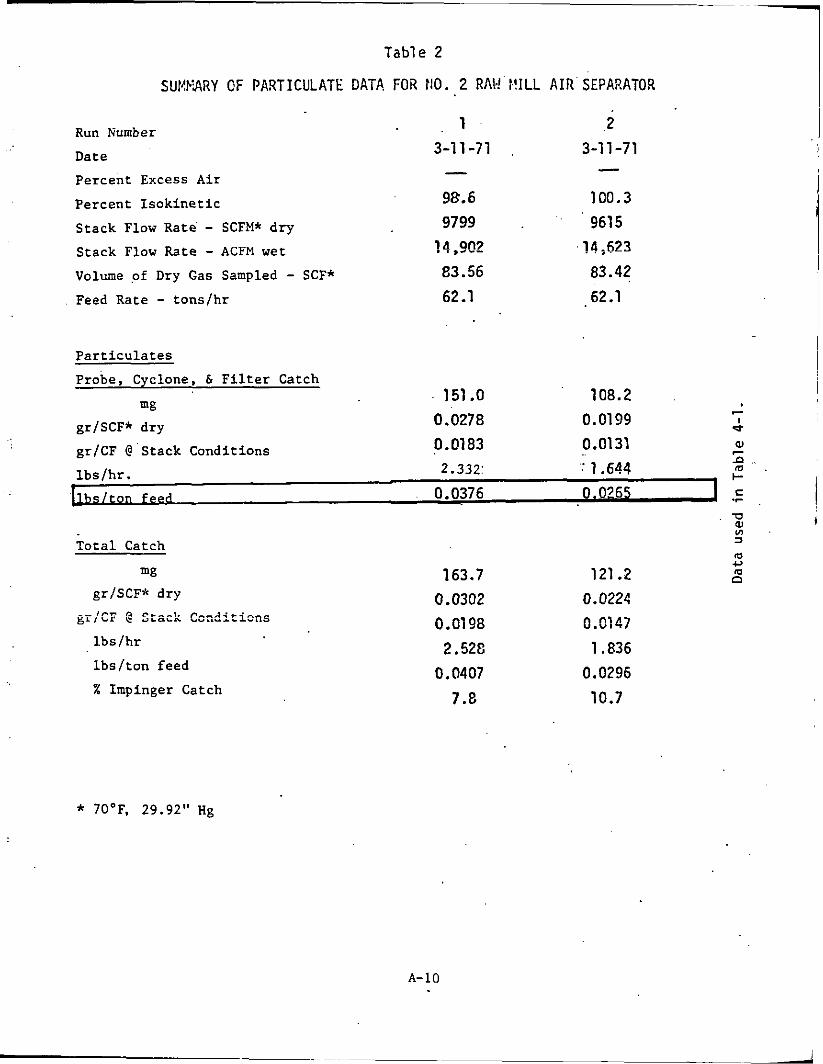
Table 2
SUISVARY CF P A R T I C U L A T E DATA Foil 110. 2 RAI:I'I.?ILL A I R ' S E P A R A T O R
1 ,2 3-11-71 3-11-71
Run Number
Date
Percent Excess Air
Percent Isokinetic 98.6 100.3 Stack Flow Rate' - SCFM* dry 9799 " 9615
Volume ,of Dry Gas Sampled - SCF* 83.56 83.42 Feed Rate - tonslhr 62.1 62.1
- -
Stack Flow Rate - ACFM wet 14.902 ' 14,623
Particulates Probe, Cyclone, & Filter Catch
151 .O 108.2 - mg I * 0)
gr/SCF* dry 0.0278 0.0199
- 0.0183 0.0131 n .. m .
gr/CF @'Stack Conditions
+ c .- .
w 0) VI J
c,
lbslhr. 2.332: .. 1.644
Iton feed 0.0376 0.0265
Total Catch m m 163.7 121.2 0 mg
gr/SCF* dry 0.0302 0.0224 0.0138 0.C147 2.528 1.836 lbslhr
0.0407 0.0296 lbs/ton feed
7.8 10.7 X Impinger Catch
. - I C - n c - - - . ~ - - r l i * . ~ , ~ & L , L * II ,,.A. u.U....A.?.-..-
* 70°F, 29.92" Hg
A-10

Table 3
SUI.ll,NRY OF PARTICCLiLATE DATA FOP, 110. 2 RNfl MILL FEEO-G-I:!EIGIIT
Run Number
Date
Percent Excess Air
Percent Isokinetic
Stack Flow Rate - SCFM* dry Stack Flow Rate - ACFM wet Volume of Dry Gas Sampled - SCF* Feed Rate - tonsjhr
.1 3-5-71 c
' 107.8 9646 12,250 89.47 62.7
2 .. 3-5-71
110.9 '9588
' . .12,256 91.51 62.7
. -
Particulates Probe, Cyclone, 6 Filter Catch .99.7 , 69.5
0.0172 c '0.0117 I e
mg
a ' R rn + E
u .
7
~. gr/SCF* dry :0.0135. 0.00914 . . .~
0.959 0.01 53
griCF @ Stack Condicions
lbs/hr.
~
1.418 !
.0.0226 - .- - a v) S Total Catch
mi? gr/SCF* dry
gr/CF @ Stack Conditions
lbs/hr lbs/ton feed
% Impinger Catch
* 70'F. 29.92" Hg
.. 112.1 0.0193 0.0152 1-.592 . 0.0254 11.1
rn w 81.6 m n 0.0137
0.0107 1.122
'0.0179 14.8
' A-11
Excerpts f rom
REFERENCE 11 (SECTION 4.0)
Emissions from Wet Process Cement K i l n and C l i n k e r Cooler a t I d e a l
Environmental’protection Aaency, Research T r i a n g l e Park, NC, March - - ‘Cement Compan , S e a t t l e , Washington, ETB T e s t No. 11 MM 03 , U . . S
A-12

TABLE 1
SUWRY OF PARTICULATE OATA FOR CLINKER COOLER
Run number 1 2 . 3
Date 3-18-71 3-19-71 3-19-71
Percent Excess A i r NA NA NA
Percent I s o k i n e t i c 105.7 105.3 101.9
Stack Flow Rate-SCFM* dry 95,699 94.971 94,100
Stack Flow Rate-ACFM wet 108.307 105,121 104,555
Volume o f Dry Gas Sampled SCF* 105.39 104.21 100.03
Feed Rate - tons/hr 103.4 102.8 104.9
Par t i cu la tes
Probe, Cyclone, & F i l t e r Catch
mg 351.0 386.0 453.3
gr/SCF* dry 0.0513 0.0571 0.0698
gr/CF @Stack Condit ions 0.0453 0.0516 0.0628
c I =r W - n m 1 bs/hr 42.0 46.4 56.3 c E
U al vl 2
c,
0
l bs / ton feed 0.406 0.452 0.536
Tota l Catch
mg 374.3 400.6 462.7
gr/SCF* dry 0.0547 0.0592 0.0712
gr/CF @Stack Condit ions 0.0483 0.0534 0.0641
.r
- m m
l bs /h r
l bs / ton feed
44.8 48.2 57.4
0.433 0.468 0.547
X Impinger Catch 6.22 3.49 2.03
* 7OoF, 29.92" Hg NA--Not Appl icable.
A-I3

TABLE 2
SIJM4RY OF PARTICULATE DATA FOR KILN STACK
Run Number '
Date
1 2
3-24-71 3-24-71
Percent Excess A i r 67.8. 67.8
Percent I s o k i n e t l c 93.5 89.9
Stack Flow Rate - SCFM* d ry 107.179 L 103.085
Stack Flow Rate - ACFM wet 286,431 288,505
Volume o f Dry Gas Sampled - SCF* 39.69
Feed Rate - tons/hr 101.7
36.68
101.7
P a r t i c u l a t e s
Probe, Cyclone, & F . i l t e r Catch
r I 0
aJ
mg 241 253.5
gr/SCF* dry 0.0935 . 0.1064 s m
l b s / h r 85.9 . 94.0 ..- t- c
-0
3
gr/CF @Stack Condit ions 0.0350 0.0380
- l b s / t o n feed o - a44 . . 1 : Tota l Catch
mg 262 281.8
gr/SCF* dry
gr/CF @Stack Condit ions
lbs/hr
0.1016
0.0380
93.4
0.1183
0.0422
104.4
l b s l t o n feed 0.918 1.027 .
X Implnger Catch 8.01 10.04
* 7OoF, 29.92" Hg
A-14

Excerpts from
REFERENCE 12 (SECTION 4.0)
Emissions from Wet Process Cement K i l n and F i n i s h M i l l Systems a t I d e a l Cement Company, Cast le Hayne, North Carol ina, t i 6 T e s t No. - - 04, U . S . Environmental P r o t e c t i o n Agency, Research Tr iang le Park, NC, March 1972.
A-15

Run !lumber
Percent Excess Air Percent Isokinet ic Stack Flow Rate - SCFII* d r y Stack Flow Rate - ACFH wet Volume of Dry Cas Sampled - SCFS Feed Rate - tons /hr
* Oate
.
1 4 -1.3-71 -
96.9 14,478 17,554 56.931 30.0
2 4-14-71
100.8 14,876 17,636 60.857 28.6
- 3
4 -14 -71 . . . -
97.4 14,453 16,677 54.777 30.1
Partfculates Probe. Cyclone, C F f l t e r Catch
m9 11.8 22.9 21.4 c gr/SCF* dry 0.00319 0.00579 0.00602 I
a
rn I-
- gr/CF @ S:sck Conditions 0.00263 0.00488 0.00521 lbs/hr. 0.391 0.729 0.737 lbsl ton fppd 55
n
0.0130 0.07 8 0.02fl5 - Total Catch
w 24.1 gr/SCF* dry 0.00652
gr/CF @ Stack Condftfons 0.00537 1 bs/hr 0.796 lbs / ton feed 0.0265 f ; Imninger catch 51 .O
-0 01 v)
ru c,
a
34.0 35.8 rn
4.00860 0.01 01 0 - 0.00725 0.0oen
n.
1.086 1.243 .
0.0380 0.0413 32.6 40.2
70°F, 29.92” Hg
A- I6

. . - Run Number 1 Date 4-13-71 Percent Excess Air -
, Pcrcznt Isokinettc 90.7 Stack Flow Rate - SCFV dry Stack Flow Rate - ACFH wet Yc1ur.e of Dry cas Sampled - SCFy Feed Rate - tons/hr
11,700 13,484 74.277 . 30.0
2 4-14-71 - 94.6
11,664 13,554 77.276 28.6
. 3 4-13-71 - 95.4 , ,
11.727,. 13,474 .
75.106 30.1
bar t icula tes Prob., Cyclone, 6 F f l t e r Catch
31.2 23.9 23.2 '7
I
al
mg O.CIClkd? n CO476 ' c! .nc495 e grlscF* AP"
gr/CF @ Stack Conditions 0.00561 o.oc'4c9 0 .@0431 z a lbs /hr . 0.643 0.467 . 0.493 I-
l b s / t o n feed 0.0214 .r
- * J
0.01.€3 0.0164 f r
- U aJ .VI z rn c)
- Total Catch
a n w 68.8 39.3 38.9
gr/SCF* dry 0.0122 0.00783 0.00708 gr/CF @ Stack Condittons 0.0106 0.00673 0.60693
1bs/ton feed 0.0306 0.0273 0.0265 1 bs/hr 1.217 0.781 Q.797
X Impinger Catch 46.9 39.2 37.8
, . 7OoF, 29.92'l Hg
A-17 . .

Run llumber 1 Onte 4-1 5-71
.Percent Excess' Air - - '
Percent Isokinetic 103.5 Stack Flow Rate - SCFV* dry Stack Flow Rate - ACF!.! wet Volume o f Dry Gas Sampled - SCF* Feed Rate - t ons /h r 31.1
5853 6827.
65.059
2 3 4-1 5-71 4-15-71
100.1 100.8 6087 5727 7073 6739
65.470 . 61 .?95 ',30.7 . 31.7
- -
' Particulates --L Probe Cyclone, t F!1 tw Catch
35.5 33.7 34.9 - gr/SCF* d r y o.oo8co 0.00793 0 .GOS67 e
gr/CF 3 Stack Condit ions 0.00719 0.00681 0.0@736 n
1 bs/hr . 0.421 0.408 0.424 lhscton feed 0.0135 0.01 33 0.0134 -0
I
aJ
I- C
mg
- I -
aJ Lo z1
+l m m n
Total Catch ' "9 54.2 54.6 56.0
- y/5CF* dry 0.0128 0.0128 0.0139 ar/CF 0 Stack Conditfons 0.0110 0.0110 0.0318
lbs/hr 0.638 0.669 0.682 .
Ibs/ton feed 0.0205 0.0218 0.0215 ?. Inpin9er Catch 34.5 38.3 37.7
7@'F, 29.92" Hg
A-18

E m i s Nort ment -
Excerpts from
REFERENCE 13 (SECTION 4.0)
m Dry Process Cement K i l n a t Dra c e s t No. 71- -
m k e k L k ; h T r i a n g l e $r
Cement Company, ) , U.S. Environ-
NC, March 1972.
A-19

- . . . . . . . .. TABLE I
SUMHARY OF PARTICULATE DATA FOR KILN STACK ' . : ._ 1 ' . ;' ,..2 ' . 3 . . . Run Number . . . ' > . . .
. .
Date . . 4-29-71 ' 4-29-71 4-30-71' Percent Excess A l r . . 322 ' 322 '.. 466 :
-.. ' 95.3 :.. . .. 95.4 ' 95.4 . ' Percent Isoklnet lc . - ' . . . , ''
Stack Flow Rate - S C W ' h dry . . ' 51,187' ' 50,643 . . . 50.013 . .
Stack Flow Rate - Am'mt Volume o f Dry bs 'Sampled SC? ' ' 89.75 . . . ' " .. Feed Rate' - tons/hr . ' .
Partfculates Probe, Cyclone, 6 F11 t e r Catch
. . . . .
. .
.. .
. . 69,269 . .
87.79 . . 44.33 . . . 45.75 42.93
. . 'y.69.470 69.169 ' ,
' ' ' 88.92' '; .- .: ..
. . . . . . .
. .
55.6 34.2 34.6 . . . . . . . . ., . . . .. 0.00607
I
al
.a l-
E
0.00954 . . . 0.00592 gr/SCF** dry gr/CF C Stack Condltlons 0.00702 0.00433 1 bs/hr. 4.146
w
0.00438. - 2.601 2.532
I lbs/ton feed 0.0942 0.0553 C.0606 J c
Xotal Catch m 118.5 106.7 100.1 c,
. . . : mg
griSCF* dry ' . . 0.0203 . 0.0185 3.0176 gr/CF C Stack Condltlons . .0.0150 0.0135 0.0127
1 bs/hr 8.907 8.002 7.502 1 bs/ton .feed 0.202 0.175 : 0.175 X Implnger Catch 53.1. . . 67;9 65.4
. . 70.F. 29.W Hg
A-20

Excerpts from
REFERENCE 14 (SECTION 4.0)
Emissions from Wet Process C l i n k e r Cooler and F i n i s h M i l l Systems a t
Environmental P r o t e c t i o n Agency, Research T r i a n g l e 'Park, NC, March 1972.
I d e a l Cement Company, Houston, Texas, ETB T e s t No. 71-MM-06 , U . . 5
A-2 1

TABLE I , . . .
SUMHARY OF RESULTS FOR CLINFER COOLER . . . .
aun Nunber 1 2
p8rcer.t Exccss A i r ' HA , . H A
c .^ -. J a t e o-ia-11 CiB-ii
percent I s o k i c e t i c 102.1,. 98.5 Stack Flow Fate - SCFP dry 104,057 100.432 s t ack Flow Rs:e - ACFPI wet 127.032 .126.664 volume o f O r y Cas Smplcd - SCF 101.07 94.15 Fced Rate : t ons /h r 61.13 62.7
3
HA 98.8
102.165 128.672
96.05 63.7
S - i & i i
Psrticulat?s . P n b e , Cyclone, G Fi1t.r Catch
w 11.8 20.5 14.2
0.001 80 0.00335 0.00228 - . gr/CF 9 S t x k Conditions 0.00147 0.00266 O..Wl80. d. gr/SCF* dry . .
0
- a 1bs;hr. 1.561 2.812 1.941
I Ibs i ton feed 0.0253 0.0448 0 . 0 3 d I- - - - Total Catch
n9 26.3 Y
or/SCF* dry 0.00401 0.00623 . 0.00373. 2 y / C F 0 Stack Cor.ditionS 0.00328 0.00494 0.00296
1L I * , . ,3.538 5,323 3.269 . . ,"S, .I,
llrslton feed 0.0572 0.0849 0.0513
'L Inpingcr Catch 55.1 46.2 39.1
* 79-F. 29.92" ill] HA - l o t Appllcable
A-22

TAGLE 2
SUMMARY OF RESULTS FOR FINISH HILL GRIHDIX SYSTEM . .
Run Number ,
. . . Date percent Exccss Ajr prrcent I sok ine f ic
SLack Flow Rate - 1.CFI.I wet \fa1 ume of Dry cas Sa;:pl c.d - , SCF Feed Rate tons/hr
StzCk F l o ~ k i t e - SCFl?* C I y
' 1 5-19-72
NA 109.0
26,360 35,185 140.35 34.6
- 2 3 5-1 9-71 5-20-71
NA "A 102.9 98.9
26,252 26,244 35,679 35,780 131.99 126.82 33.9 37.2
. . . . Par t icu la tes . .
PI-052, Cyc!o;ie, & Fflter Catch - . - -
mg ' ' 22.0 . . 26.9 17.1
- d- gr/SCF* dry 0.00241 0.0031 4 gr/CF I? Stack Conditions 0.00181 . .. .' 0,00231 0.00152 ~
lbs/hr.
0.00208 .. -
0.527 0 ;683 0.446 2 .
0.01201 I- E
' *
0.0201 pp . . 0.0152
Tota l Catch
mg -
cr/SCF* - . dry y / C F @ Stack Condi t ions
. lbs/ton f e d . . 1 bs/hr
2 Impingcr Catch
. .
32.9 37.8 0.00361 0.00441 0.00270 0.00324 0.791 .. 0.971 0.0229 0.0287 33.1 28.8
Q 0) v) = tu
0 27.9
0.00339 0.00248 0.761 0.0205
30.7
* 70°F. 23.92" Hg 1 NA - Not Applicable
A-23

Excerpts from
REFERENCE 1 5 (SECTION 4.0)
Emissions from Wet Process Cement K i l n a t G ian t Po r t l and Cement, R a r l e y v i l l e , South Carol ina, ETB T e s t No. 11-MM-07 , U.S. Envi- ronmental P r o t e c t i o n Agency, Research T r i a n g l e Park, NC, 1972.
A-24

. . . . . .
TABLE I S m z r y o f Coiibined Par t icu la te h i s s i o n s
, , . .. Kiln fuel
Yoluz?! o f Gas Sanpled - CSCFa Percent I.!oisture by Volute Averegc Stzcl: T c a p r a t u r e - O F Stzck Y o l m e t r i c Flcw Rztc - - o S C F i l b S:a;u. Yolucetric ti' ~ s t c - ACG'
Pcrcen t I ssk i t i i t i c Percent Excess A i r Percent Opacity Feed Rate - t o n / h r
.. '
.- . .- Paiiicu:atss - p o k e , -cjrcimz, 2nd i i l . t e r catch
Natural Gas
. 488.76 41.43 429.
48.132 ' 137.500 .96.8 ' 24.90
40.33 5-25
No. 6 Fuel O i l
'464.54 36.98
. 420. 56,282 .- - 146.753
-26.48
40 .OO
90.2 ..
5-25
1818.3 . 1375.9
0.0105 - 0.0152 . -
I 'e W
0.0524 0.0395 mg gr/DSCF
'grIACF F n m
I 1h' 1. . . l b l h r 21.6 20.5. .
t- c
-0 W VI
.. 0.536 0.513 .r
tan fcod
Pert icul a t % - tc ta l catt!?. a
Percent irqi::scr catch
m m c,
~ .. 0.. 2866.5
0.117 0.G914 0 -0408 0.350 48.6 45.8 1 .2.1 1.14
.. 3808.4
52.3 52.0
-
..
A-25

Excerpts from
REFERENCE 16 (SECTION 4.0)
A-26

TABLE I ~JM!IARY OF PARTICULATE TESTING
d 10-8-71
-5- 10-8-71
Run Number 9 10-7.10-8-71
Date
Percent Excess A i r
Percent I s o k i n e t i c
Stack Flow Rate - SCFM* dry
Stack Flow Rate - ACFM wet
33.0 34.3 34.3 106.7 101.2 101.6 46,976 54,699 55,577 120.1 35 133,718 135,988 73.449 78.702 80.246
52.1 57.0 58.0 ' Volume of Dry Gas Sampled - SCF*
Feed Rate - t ons /h r
P a r t i c u l a t e s
Probe, Cyclone, 6 F i l t e r Catch 192.9 165.4 152.6 0.0317 *
0.0129 Q
17.67 15.12 f 0.261Lz
0.0319 0.0377 - mg
- I grlSCF* d ry Q~!CF @ Stack Condit ions
l b s / h r .
~ I.
0.0125 0.0154 Y -
12.87
f p p a 0.247 0.309
E .C
Total Catch
mg gr/SCF* d r y
gr/CF @ Stack Conditions
l b s l h r
l b s l t o n feed
X Impinger Catch
'c1 al ul 3
U 185.'4 ra
0.0692 0.0439 0.0356 2 0.0270 0.0179 0.0145 27.86 20.57 16.90 0.535 0.361 0.291 53.8 14.0 10.8
330.2 224.4
* 70°F, 29.92" Hg
A-27 I

Excerpts from
REFERENCE 18 (SECTION 4.0)
A i r P o l l u t i o n Emission T e s t , Ar izona P o r t l a n d Cement, R i l l i t o , Arizona,
kL:ekh T r i a n g l e Park, N C t ’ J k e 1974. r o j e c t Report 74-S1N- .S. tnv i ronmenta l P r o t e c t l o n Agency,
A-28

TARLE 2 . . ._ _ _ - SUnnARY OF TEST RESULTS
PRIK4RY CRUSHER
. .
. .
Run Rumter
Date volume of G ~ S sampled - OSCF' Percent Cloisture by Volune Average Stack Tmpara ture - 'F Stack Volure t r ic Flov Rate - OSCm
. Suck Volumetric Flow Ute - ACFXC Percent Isokinetic Percent Excess Air Percent Opacity Feed,Rate - ton /hr
b
Par t i cu la t e s - prate. and m t e r catch
1 2 3 4
6-4-74 286.20
2.4 .79.0 23.469 27.198 114.3 _--
0 978.0
6-10-74 245.71
2.5 81 .o
22,351 26.430 109.1
0 904.0
_--
6-11-74 186.76
3.0
22.140 26.653 104.7
88.0
_-_ 0
1028.0
6-12-74 141.82
3.3 88.0
22.502 27.142 104.3
. _-_ 0
1010.0
66.06 75.13 61.13 66.91 0.00355 0.00471 0.00504 0.00727 f 0.00307 0.00398 0.00419 0.00602 , -
I t h r O.nd 0.90 . 0.96 1 nnn79 0 nnnai n nrn53
P a r t i c u i a t s - t o t a l catch
mg grtOSCF grtACF lb /hr l b l t o n feed
72.61 e 72.34 77.25 2 0.00391 e 0.00597 0.00839 ' 0.00337 e 0.00495 0.00695 0.85d e 1.13 1.62 0.00087 e 0.00110 0.00160
Percent inpinger catch 9 .0 e 15.5 13.4
a Ory Standard cubic f e e t a t 70.F. 29.92 i n . fis.
Ory standard cubic feet per minute a t 7a'F. 29.02 i n . Ho.
Actual cutic fee: per n inu te Calculated by averaging the concentration and area ra t io r e s u l t s
e Impinger water erroneously discarded
. .
A-29

TABLE 3 ... . SUMWRY OF TEST RESULTS
P R I M R Y SCREEN DE, ilqL?h.
Oa te Volwe of Gas Sampled - OSCF' Percent f:olsture by Voluee Averape Stack Tenperature - *F S:ack Voluni t r ic no?? Rate - OSCFd S u c k Vo!metriC Flow Rate - ACFI.:' Percent I sok lne t i c Percent Excess Air Percent Opacity Feed :ate - t on lh r
t
P e r t i c u l a t e s - probe. and m t e r ca t ch
W gr/:SCF gr/'Cr
1
6-4-74 328.07 1.7 82.0 13.636 15,.682 116.8
0' -_-
967.0
27.82 0.00131 0.00113
9
6-10-74 331.80 1.4 90.0 13,368 15,797 115.1
0 __- 965.0
37.94 0.00176
3 &
6-11-74 6-12-74 257.81 196.69
2.1 2.5 90.0 94.c 13.246 13,196 15.771 15.866 111.5 113.9
0 0 1023.0 1056.0
--- _--
31.51 28.34 0.00188 0.00222
0.00149 0.00158 0.0018C 1 V k r 0.17d 0.2Zd 0.23d 0.27* ' - I:.,.-, O.OOOIR J 013~77 n .mi77 3 117137 c !< - - .- Part icwiates - t o t a l ca t ch *
1 m 3
cg grlOSCF grlACF l b / h r lb/ ton feed
Percant impinger ca t ch
r_
1 30.38 P 39.25 a0.11
0.00143 e 0.03235 0.00316 0.00124 e 0.00197 0.00261 0.19d e 0.2gd 0.39' 0.00020 e 0.00028 0.00037
8.4 e 19.8 29.3
a Dry standard cubic f e e t a t 70.F. 29.92 i n . Hg.
Ory standard cubic f e e t per minute a t 7C.F. 29.02 i n . Hq.
P.ctu31 =tic fee: per n inu te
Calculated by averaging the concentration and area r a t i o r e s u l t s
e Inpinger water erroneously discarded
A-30
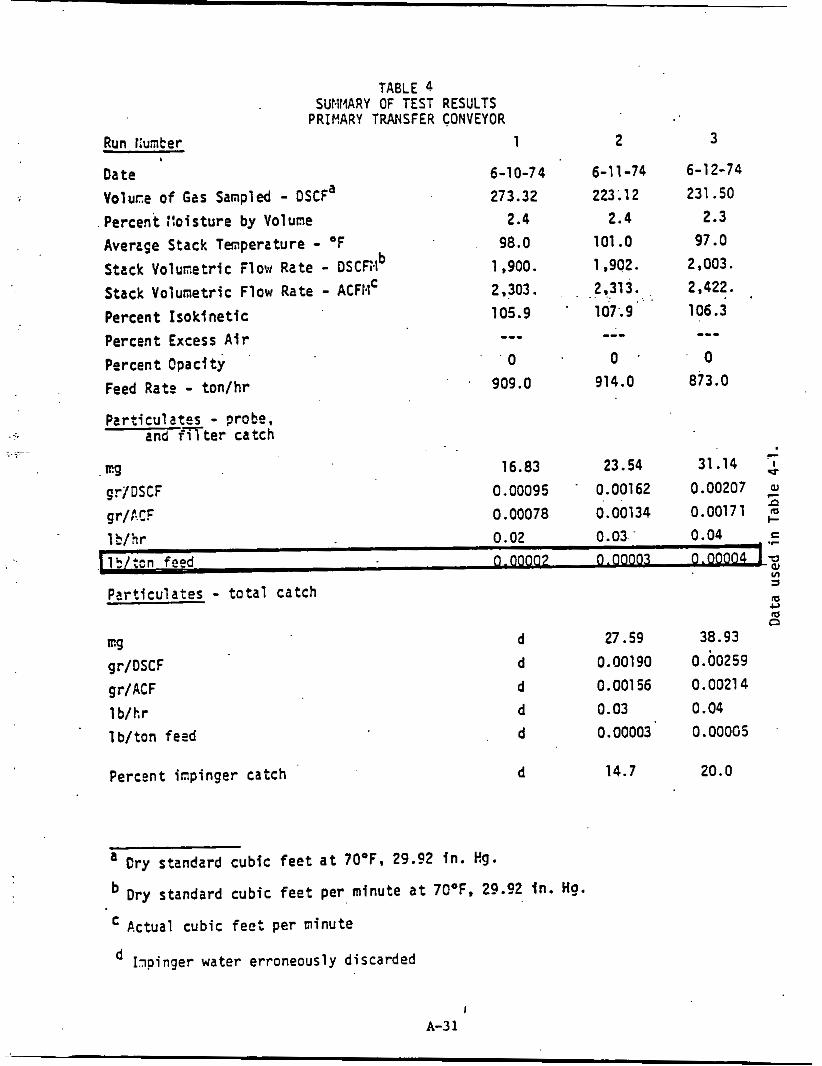
TABLE 4 SUt4MARY OF TEST RESULTS
PRIHARY TRANSFER CONVEYOR 2 3 Run llunter 1
Volute o f GZS Sampled - O S C F ~ Percent ;!oisture by VOlUne AveraSe Stack Temperature - "F Stack Volunetric Flow Rate - DScFi4
Percent bok1 netic Percent Excess Air Percent Opacity Feed Rate - ton/hr
Particulates - prohe; and i n t e r catch
Date 6-10-74 6-1 1-14 6-12-74
273.32 223;12 231 -50
98.0 101 .o 97.0 2.4 2.4 2.3
b 1.900. 1,902. 2,003. 2,422. Stack Volumetric Flow Rate - ACF14c 2.303. . . . 2.313. .. . . . .
105.9 ' l07;9' 106.3 --- --- ---
. . ' 0 0 . 0 914.0 873.0
' ' 909.0
- 16.83 23.54 31.14 cg
g r / K F 0.00078 0.001 34 0.00171 . 0.00162 0.00207 7
n gr/DSCF 0.00095 . .
l b / h r 0.02 0.03. 0.04 .C
0.00002 0.00003 0.00004 1 = aJ l5/:cn feed VI
Pcrticulates - to ta l catch 42
E
s m
n m
E9 gr/DSCF gr/ACF 1 b /h r 1 b / ton fead
Percent inpinger catch
d 27.59 38.93 d 0.001 90 0.00259 d 0.00156 0.00214 d 0.03 0.04 d 0.00003 0.00005
d 14.7 20.0
a Cry standard cubic f e e t a t 70OF. 29.92 i n . Kg.
Dry standard cubic feet per minute a t 7COF. 29.92 f n . Hq.
Actual cubic fee: per minute
Iloinger water erroneously discarded
A-3 1

Run llunter
TABLE 5 SUE!tIARY OF TEST RESULTS
SECONDARY SCREEN AN0 CRUSHER 1 2 3
Date voluae of G ~ S Sampled - O S C F ~ Percent Koisture by Volume Averaqe Stack Twverature - "F Stack Volurerric Flew Rate - DSC5.I Stack Volumetric Flow Rate - ACFLf Percent Isokinetic Percent Excess Air Percent Opacity Feed Rate - ton/hr
b
P e r t i c u l a t s - ?robe. and f i l t e r catch
ng gr/3SCF gr/?:CF
6-6-74 201L05
2.3 81 .O
9,277. 10,579. 102.2 ---
0 170.0
6-7-74 .173.87
2.2 77.0
8.711. 9.971. 99.3
0 ---
162.0
6-a-74 216.14
2.1 80.0
9.656. 11,045. 105.6
0 152.0
10.44 - 4.69 8.44 I e 0.00036 0.00075 -0.00074 Q)
0.00031 0.00065 0.00065 2 - .- I-
0.03 0.06 0.06 E 1 b / h r
.r
t1:on feed 0.00017 0.00034 0.00041 ~,
Partfculates - total catch
mg gr/DSCF gr/ACF l b / h r 1 b/ton feed
% 3
e m m a 6.12 12.25 d
0.00047 0.001 09 d 0.00041 0.00095 d 0.04 0.08 d 0.00022 0.00050 d
Percent ir.?ir,ger ca tch . 23.4 31.1 d
a Dry stantard cubic f e e t a t 70°F, 29.92 i n . Hg.
Dry standard cubic f e e t per r inute a t 7OoF, 29.02 in. Hg.
P.ctua1 cut ic fee: per minute
I A-32

Nich
Excerpts from
REFERENCE 20 (SECTION 4 .0)
1s . G. E.. Measurements on - D.C., October 1 9
A-33

I n. nnnn
A-34

- .
h U
E a 0 I&
m t! W m
N 0
0 z W -1 P S a (D
..
rr
-. 0 z 0 - c m W r
0
0 z E W a I- m
.. a
0 m 0 0 0
0 z m W
W m I- YI W I-
m W P l.
..
- a -
m
r.
Q
m
^, .. I U
m 4 0 m H C rl
‘c) al m a m U
0 m

d 0
0 z .. W -I b.
< 10
r
n
.. 0 z P I
c m W c
d 0
0 2
S W P c 10
.. a
0
0 0 0
0 z m W
U W 10
c VI W + m W L
m
..
-
- +
h ,2
S P 0 (L
10 W
P W m
-
A-36
N I U
V a u) a m U Io a
I

r. V
2 (L 0 U m W
e W m
M
I I I
8
I I
n I
I
rr 0
0 .. z
O O N !n"* .++ -a
c1 r.
r w w no. . .
W -1 P S
YI a
a o a m 0 0 0 - + + + + w w w w m r . o . m o ~ n c a n b 2 o . m . . . .
n
.. 0 z G - c m W I-
4 0 .. 0 z E W K I- m
a
0
0 0 0
0 z m Y
K W m I- m W c Ln w W 0. Y
m
..
-
A-3 7
N I e
E rl
-u al m 2 m Y
2

h u E Y 0 Y
VI
K W VI
t
I
I no
I t I I
rl
n
n 0
n u
V I V I V I l o o - - + +
w w .a- m - * - . . -*I 0.0- - + .+
w w 00.
- n
u * n - 0 % - . + + - w w
.a*
- m
0 . a - V I 0 - . - +
w w 0 - - m
10:
9 :
. . n.o
0 CI n o 4 . * + 2 w w
h V I C I h
r 4 m . .
.. 0 z
* O h - 0 0 0 - + + + + w w w w n r r m * * ~ I P
m n - N . . . .
Y
o o u n 0 0 0 - + + + + w w w w - . a m - m h - m . . . . p I m o . n
2 L e VI^ a
e VI W e
d 0 .. 0 z E W K I- VI
a
0 m 0 0 0 .. 0 z lrl W w K W ln
I , I I I
I W -I m c W N
VI
w J U
c K c 0.
a
I
I
n
-*r. 0 0 -
. . . - - n
N I U al rl e m c3
m m LI
n

.. . ....
... . - ~~
P. u r K 0 IL
VI W
K W m
w
c 0 .. u 2
W d 0 r m a
m
.. 0 2
Y w
I- In Y c
d 0
0 z .. x W
. K I- m
a
0 m 0 0 0
0 z m W
K W m
..
.. t m W t
m W L LL
..
I W J rn c W c1
II)
w d 0
t Y
0
a
I
I
a
I n L ? Q I - 0 - I . + +
P I w w I r.m I 0 - I . . I Qr.
I QI7b-l I N O - , . + +
m e w w I - * I h Q I 1 .
I n ,>
I o a r , loo- , .++ C l I m w w
j I 1: Cl 4
n-Qm 0 0 0 - + I + + w w w w w m o . - * O r > -
* m o a . . . . aoa*’) 0 0 0 - + + + + W W W Y n m r m a m n o . . . . d-n-
N I
U
a, i D m tl C 4
-e a,
1 m Y
P
m
m
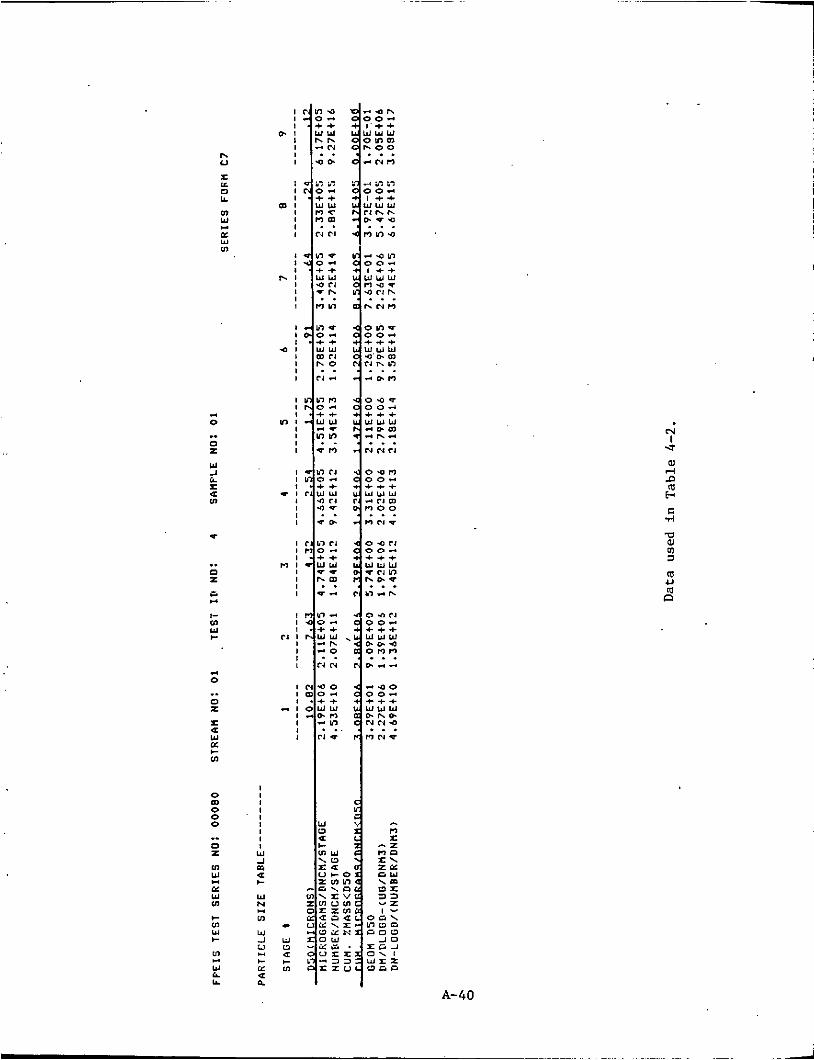
h u
m W
K
m
- Y
L = m a
.. 0 z L ,4
$- m W I-
- 0 .. 0 z = W K c UI
a
0 m 0 0 0 .. 0 z m W
K W m
- e m W e
A-40
N I
v
C d
W ly
1 m
m U
P a

h u
VI W I K W VI
h
e VI W I-
- 0
0 z f
W Y r VI
.. a
0
0 0
0 2
UI W
K Y Ln
e Ln W e Lo
W 0. IL
m 0 .
..
.,
-
I W 2 rn I-
W N
VI
a
- c E C 0
n n
, . . I n n
I o ~ l n 1 - 0 . . I . ++
c I W W W I - 0 . I c1 0 I . . t - CI
o . . ~ n no- .++ V Y W n h
ri n . . - -
" . O h 00 '
. . . - 4 -
A-4 1
N I U
W rl
m H
e
e d
V W Lo a m U m El

h u E Y 0 Y
m
E W m
w
p1 0
CI 2
W J 0. E
01
..
a
c
.. 0 2
CI w.
c m W e
4 0
ci z S
W K c u)
..
a
0 m 0 0 0
0 z m
(L W m c u) W c
..
ki!
2 W L Y
I I
W J a, c W N
u)
W J L1 w t Y
e
a
w
a
N I U a d
w C .rl
e m
'c1 a m a m
A-42

*. 0 .. 0 z Y
2 r In
e
.. 0 2:
c. - c In Y c
0
0 z r 4 W I c Ln
..
0 m 0 0 0
0 z In W
K Y In
I- 0 Y c In
w 6L Y
..
-
-
h u E Y 0 Y
v) w Y In
A-43
N
U I .
Ly rl D m c c rl
.El Ly m a m 4J m D

Excerpts f rom
REFERENCE 2 1 (SECTION 4.0)
McCain, J. D., Evaluat ion o f Rexnord Gravel Bed F i l t e r , EPA-600/ 2-76-164 ( N T I S PB 255 095) , U. 5. Environmental P ro tec t i on Agency, Research T r i a n g l e Park, NC, June 1976.
A-44
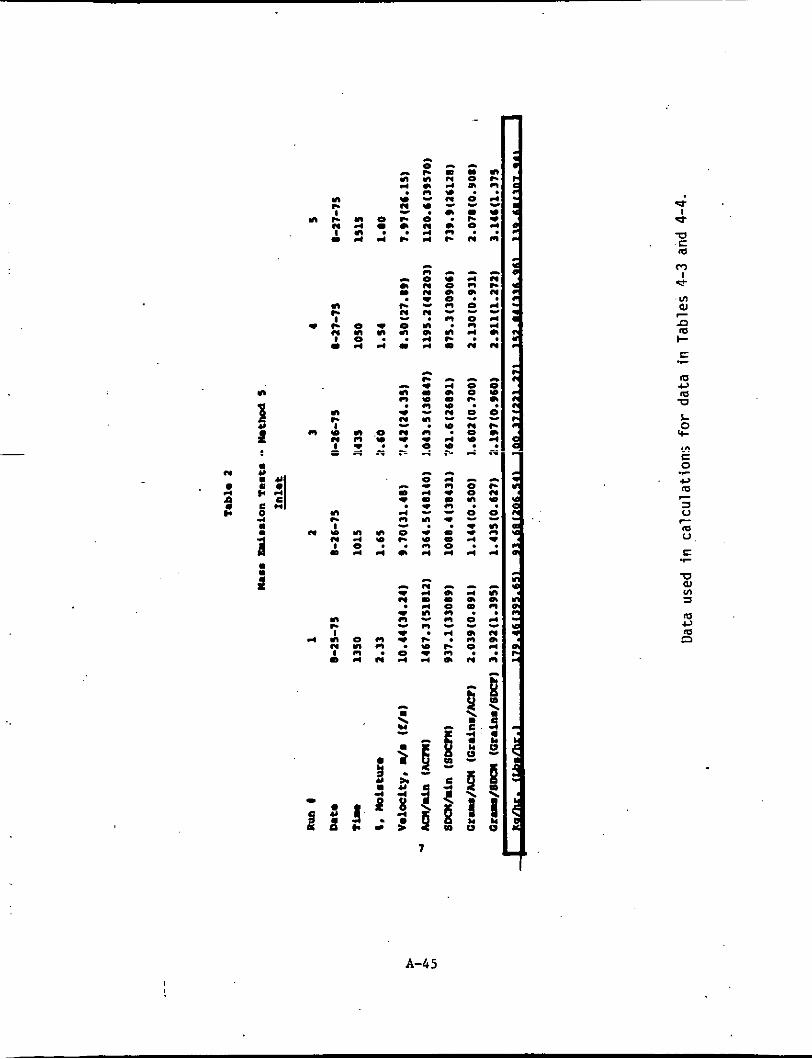
n
n
.
n c I e
N I
m
n c 1 c
N 1 m
n d
d n
s 0 d
s L? .:
d
V
c
c
m m c
0
0
r! n
0 c .I n
1 : 0 n d d
- n 0 n n : 1 n 01 d d
Y 0 0) 0 1 n n e 0
d n 4 0
1 0 n
N
n c I o
N I 0
n 4 0 d
n o d
d . 0 . 0 (D 0 r(
n
3
0 0
5 0 - . 4
d
1
* I e
m I e
S -
m c 3 U
U
7 m
S - U aJ v) a

n
n c I c N I .)
n n d
rl
- d 0
CI
W
c
2 1
0 a rl
n 4 0
0
* - a 3 e
n c I c N I 0
0 0 d d
0 d
N 0
c
m - 2
* N d N n 1 W c * d
.I W * d z 1 * c d d
e d
0
w
0
3
3
- a
a
n c I
m N I .)
n * w d
- A c * .)
W N d
a
: n
N
n c I W N I a
n d 0 d
- a c 0 N
W c 0
- a 0
d
- d 0 N c
e A d W d
n
- c 0
w . * W N
d
a m - a
- 0 d
3
3 0 a
0
- m d 0
0
9 c a
0
c
c
c
c
f 2: 4 Y .
2 j 8'
3
". c e
d
e n
4 W e
0
3 n e
6 e 4 u 4 Y Y P
A-46

i! ; a
f i ! Y .
a e .I
r( O
n I
c. a n I
.
U C m
A-4 7

. .. ... ... .." eec m a -
e . .
. 0 -!
n o .
n
i n
1 .. 4 I n f
c
c I
n o r nr l l L I V ...
ul I d 'L.
n c
c Y . o I
n
n o r 11-
e-. ... 01
m I-
7 n
E .r
-0 01 v) a
d . I.
o
-o- n c e ... onn
01 L CI E W
.I-
a I
b W .I I .
m#. $3 3 a
! f a . . . . .

. I
.: c. ::z::: :;: i ....... c oo-oooa -a- 2
0 c) c . *IO""' 0-e . ...... , .... . . . . . . . . . . . o o m m m n m ~ m a n w- c.
0 .- .I 4 - 0
: -.
h I
U
c c
al L c, c Y
.r
A-49

. ..
. 4 4 0
. Y * 4 4
4 4 I. 4 4
4 0
c, 0 S
A-50

3 E m
VI W
m I-
c n
, ' .C c Data 8/25 8/26 8/27 2/28 8/29 11/4
m * rolu/D.y 142 533. 961 . 1031 1064 1063 C, Productloll u L 0 + VI E 0
c,
3 V m V E
.r
m 7
7
.r
m c, m TI
A-5 1
ll/S
995

Excerpts from
REFERENCE 24 (SECTION 4.0)
Hurst, W. W . , Particulate Emissions Testing, Greencastle Plant, Lone Star Industries, Houston, TX, July 1977.
A-52

TABLE I
GREENCASTLE STACK EMISSIONS SURVEY PARTICULATE EMISSION RATE
1977
Exhaust Gas . Particulate Emission Rate Wn No. .Dace (1977). Temp. Volume Grains Ton - - O F ACEM - SCF Dru Dry x 10
Normal Operation: - 2.87 21.65 0 . 2 5
531 249.100 .ass 8.29 56.24 0.6e 3 5 - 9
5 5 - 10 334 240.700 ,009 1.31 8 . 8 2 n:!!
' .I 5 - 8 332 239.200 .020
AVC. 253,000 128.701
OPerJrion Following Precioitator Upgrading:
6 - 20 310 232,900 .OJ3 6.16 42.24 0.51 21
23 6 - 21 316 239,900 . 032 4.65 3q.98 0.37
6.00 11.90 0.50 25 6 - 22 307 256.700 , 052
AVC. 256.S00
These data mentioned i n Section 4.1.5 and-..ysed f o r calculations'ln Appendix E.
A-53

InEzIfflation . Race Run NO. TIHS
Soma1 Insuf f la r ion Rate: - 9 . 10 6
12, 12 6
13, 14 6
Ave.
Elevated InsuEflJrion E:
IS. 16 12
17. 18 12
19. 20 i 12
Ave .
Rhausc Gas
Precip. Rccip. input httpuc
. KF?f --
238,300 21,6;809 234.300 22?,?0i 228.600 . 219,900
231.800 214,900
224.100 21S.100
228,100 216,400
Dust Load
Precip. Prccfp. Precip. Inpue oucpuc , Ef:icit"cy TIEr TIHr z --
4.90 ,007 99.8
s.01 ,014 99.7 5.17 ,031 99.1
,017 99.6
s.10 .007 99.8
4.99 .Otl 99.6
5 . 7 2 . c25 99.3
These data mentioned I n Section 4.1.5 and used for calculations i n Appendix D.
A-54

GREESCASTLE EMSSION SW.vEy
PROCESS RATES, CCNSIXPTIO!~ AND PXODUCTIO::
Type of F u e l Rate Kiln TIHr Feed Run No. Date (1977) Fuel
1 5 - 8
3 5 - 9
S 5 - 10
Xve.
7 s - 1 2
9, 10 5 - 19
11, 1 2 5 - 20
13, 14 5 - 21
1 5 , . 1 6 S - 22 17, i a 5 - 23
19, 20 S - 24
Ave.
21 6 - 20 23 6 - 21
25 6 - 22
Ave.
Coal
Coal
Coal
Coal
Coal
Coal
Coal
Coal
Coal
Coal
Coal Coal
Coal
T I Hr - 18.5 135
18.0 135
17.5 135
18.0 135
18.0 135
16.5 125
16.0 125
15.75 125
16.0 12s 16.0 125
16.5 125
16.4 126
18.75 138
18.75 138
19.50 138
19.00 138
Data used for calculations in Appendices D and E.
A-55
I S l u r r y Water
31 .'l
33.3
33.3
32.6
33.3
33.1
33.1
33 , s
33.1
33.4
33.1
33.2
33.2
33.2
33.3
33.2
C l inke r Produced
T/Hr
81
79
79
79.7
77
74
75 76
76
75
77
75.7
88
a7 .
88
'87.7
Dust Disposed
T / Hr ~~
.146
.146
.146
.i46
.146
.146
,146
.146
.146
.146
.146
.146
.125
.125
f125
.125

Excerpts from
REFERENCE 25 (SECTION 4.0)
Hurst, W. W . , Particuiate Emissions Testing, Nazareth Plant, Lone Star Industries, Houston, TX, January 1Y/8.
A-56

R 17
8 17
X
U E al c C
.r
n a) 3 . c?? d. 17p?
E .r
v) E 0 42 .r
m 7 a U
m U
7
i ..
L 0 rc '0 aJ VI 3
hl ' n 0
2 9 d 0
'0 E m W
6.
E 0
42 u al v,
.r
f-
N 0; W 17
17 ai ai E
.r
U a, E 0 42 E
.C
E" m d
W
rl d
A-5 7
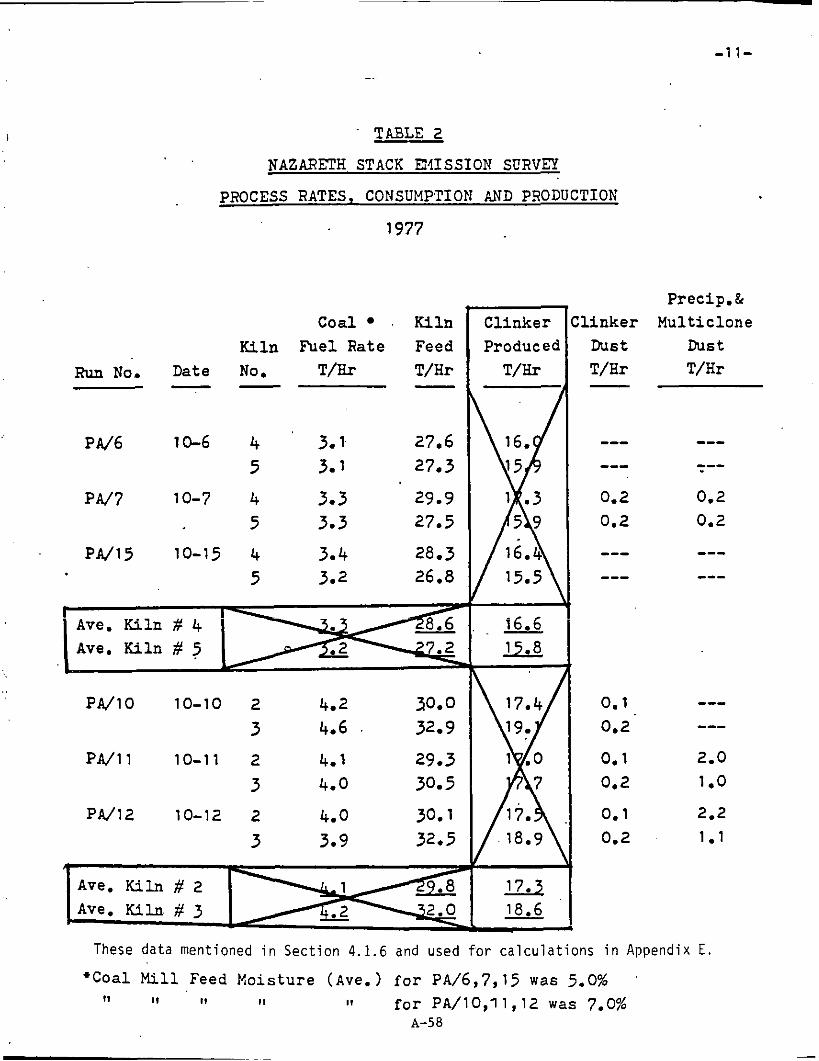
. TABLE 2
NAZARETH STACK ET4ISSION SERVEX
PROCESS RATES, CONSUMPTION AND PRODUCTION
1977
' Ave. Ki ln # 4 Ave. Kiln # 5
Coal . Kiln Kiln Fuel Rate Feed
T/Hr - ~ u n NO. Date No. T/fLr - -
Ave. Kiln # 2 Ave. Ki ln # 3
I
PU6 10-6 4 3.1 27.6 5 3.1 27.3
P U l O 10-10 2 4.2 30.0 3 4.6 . 32.9
P u l l 10-11 2 4.1 29.3 3 4.0 30.5
PA/12 10-12 2 4.0 30.1 3 3.9 32.5
Clinker Produced
T / b
15.5
- 16.6
17. 18.9
17.3 - 18.6 -
- 1 1-
Precip.& Multiclone
Dust T/Hr
These data mentioned i n Section 4.1.6 and used for calculations i n Appendix E .
*Coal Mill Feed Moisture (Ave.) f o r PA/6,7,15 was 5.0% 11 I 1 11 1 1 11 for PA/10,11,12 was 7.0%
A-5 a
, : I
Excerpts from
REFERENCE 26A (SECTION 4.0)
Hunter, S. C., et. a l . , A p p l i c a t i o n o f Combustion Mod i f i ca t i ons t o
.S. Environmental P r o t e c t i o n Agency, Research T r iang le Park, z:)ja:uary 1979.
. I n d u s t r i a l Combustion Equipment, EPA - 600/7 - - 79 0 lmT?TE4-
A-59

3 e
li I
P
I I . _ _ _
A-60
t .r
la U
Q m
L 0 'c
c , .r
-0 0) VI S

Natural Cas Rate - S t r i p charts on the rain gar line to the f a c i l i t y m a s w 3 the t o t a l natural gas demand. h i d e fmm several apace heaters. t h i s dcmand represents the natural qas f lau to the ki ln . during the t e s t period.) s e t by the operator based p i m a c i l y on his visual observation of clinker brightness and qua l i ty (e.9.. s ize , adhorence to the k i l n wall, etc.) i n the burning zone. .a such, the operator is manually conpensatinq for changes in feed rate, feed moisture content, etc.
(These space heaters vera not in service The natural gas flow is manually
Table 4-21 presents the t race specie sample train data and process
e l q h t s . The following sect ions discuss each tea:. The total part iculate
w i g h t for Tes t s 9-3 and 9-4 (upstream) of 7307 and 5548 p.g/J, respectively,
are somewhat buer than the NthOd 5 result of 9000-9800 nq/J.
Precipi ta tor Inlet Test Condi-dons-
- u1 I
Test 9-3 b a s to be terminated when tvo f i l t e r s had been aluweC.
e Mter 75 minutes elapsed time, tha vacuun p p inlet pressure limit, 76 kPa
(22.5 in. 8gVac) had been reached. An exadnation of the 1 urn cyclone cup W
rdvealcd that it, and not the f i l t e r , had plugged the system. The test was 3 7
tminsted based on t h i s condition. The la rges t nozzle sire avai lable .I c - - .r (19.1 am, 3/4 inch) vas m t large enough t o produce the n o m i d cyclone flow
rate due t o the re la t ive ly lov gas velocity. V W VI a m
n
Control m o m data for this t e s t a r e shown i n Figure 4-23 and indicate
a 2.9\ increase in k i l n discharge temperature over the test poriod (75 d n . ) .
Combustion air pr.eheat is ascomplished hy passing the air thmuqh the hot
c h i u e r discharged rkm the kiln. Thus, combustion air temperature 'entering
tb kiln will increase as the cl inker temperature .increases, and vice yersa. This is b o n e out by the observed 2-11 increase in combustion air temperature. ;
c, rn
T e s t 9-4, a repeat of T e s t 9-3, w a s a lso termLnated a t 75 &Utes
*lapsed time by a plugged 1 p cyclone. The qas m o i s t u r n C O n + q S . & r thi S ~
test was s igni f ica7t ly higher than the previous day's t e s t (44.7* vers- ''*31) e
(110-3\ versus 96.82).
This e f f e c t causcd a m r e mar:;ed departure from isokinet ic Samplin9
A-6 1 .

TAQLE 4-21. TRACE SPECTES AND OSANLCS SAWPLING CONOohIONS UCATIcN 9 - m T A R Y CEHEPPP lcTw
.
A-62

I.
z €4 0 . W In
2
In
la 0 In
2
In W H 0 W n4 v1
hl
3 b
C
c
8 .r
L 0 v-
8 .r
m
n c, m
A-63

In
el Ef ::
In w n u w a4 v1
A-64
t .r
m c.' m V
m c, m 0

A-65
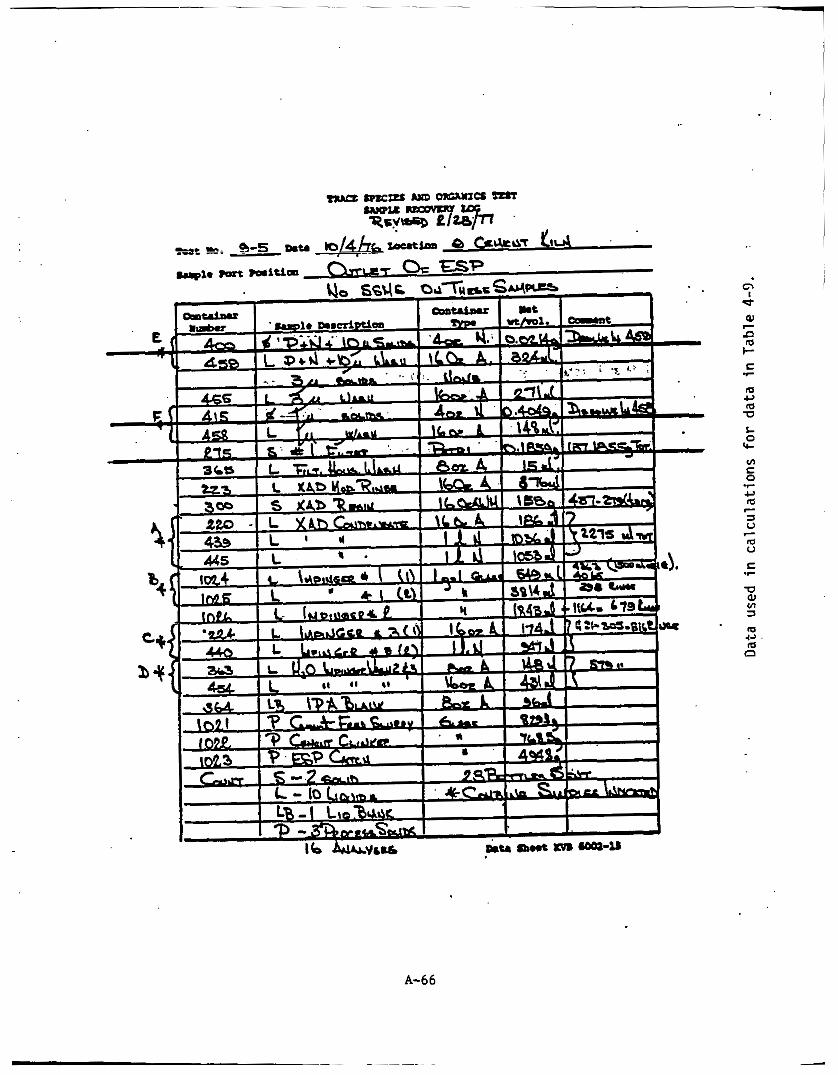
A-66
-

Excerpts from
REFERENCE 26B (SECTION 4.0)
Hunter, S. C., et al., Application of Combustion Modifications to Industrial Combustion Equipment: Data Supplement A, EPA-600/7-79-015b (NTIS PB 293888), U. S. Environmental Protection Agency- Research I - Triangle Park, NC, February 1979.
A-67
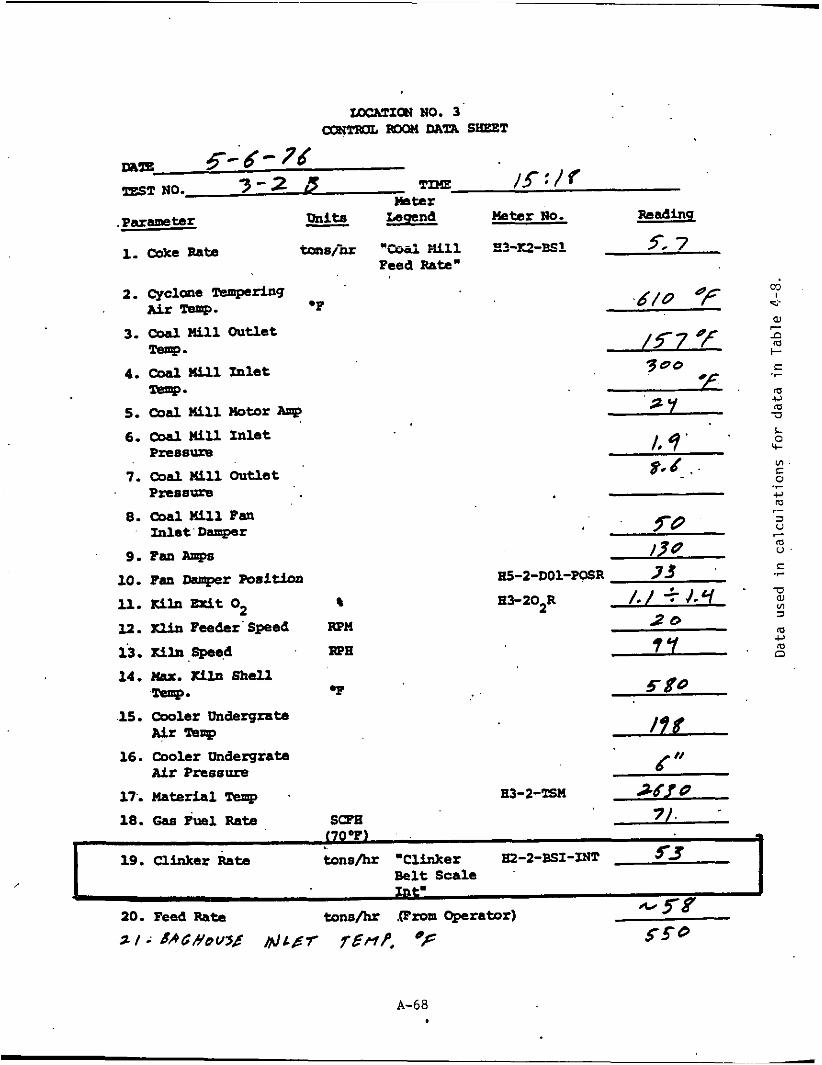
-1CH NO. 3 ROOM DAZa SEEET
19. Clinker Rate tons& "Clinker LP-2-BSI-INT 53 Belt Scale
2. cyclone -rfag
3. coal nil1 Outlet
4. coal nil1 Inlet
5. cod nil1 notor Anlp
AFr -w. *P
Temp.
nemp.
6. cwl Illlet PreSSuZa
7. cad nil1 Outlet
8. coal Kcll Pan
9. Psll XSPs
P n s s u m
Inlet Darnper
lo. an Dsmper maition
3.2. xlln Feeder Speed RPM
13. Kiln w e d RPE
ll. Mln E x i t o2 *
14. Xax. lciln Shell
15. Cooler llndergntn Air T e q
16. Cooler Undergratn Air Prassura
17. Maaterial Temp
Temp. .p
,
m U m U
9 7
mt.
L 0 +
5 80
d " E3-2-Tsn 36/ 0
A-68

A-69 l
c .r
e 0 u- VI c 0
S .r
-0 aJ VI a m m CI
0

I

TABLE 2 (Continued)
y3
y4
5 y5
y7
3 4
6 '6 P i l e
Total ~
*Any disaepsncy due to rounding off clhould be buried ia the k iWest Y cumulative b smaller thaa D F
l/. 9% 2 5 93 5. /3 ?. 3 t z /e 4 s
100.00*
m I
-3
E rl
m Y m n
A-7 1
1
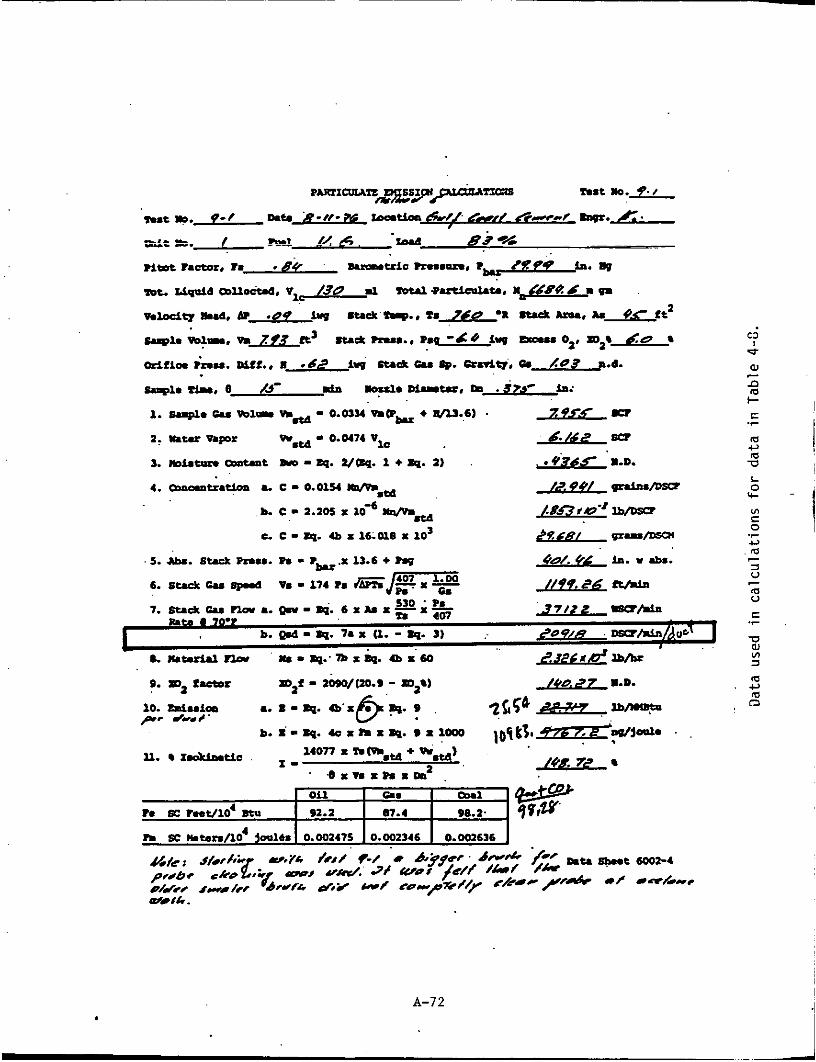
A-72

A-73 I

CA-2 UIPIClOR DATA SHEET
60-20
- d 4 % & de.,, 3 p . A-74
I

, . !
.A-75

A-76

TABLE 2 (Continued)
Total
*Any discrepancy due to roundFng off should be buried . . in the largest y. cumulative b d l e r than D F
loo. 00.
A-77

Excerpts from
REFERENCE 27 (SECTION 4.0)
Taback, H. J., e t a l . , Fine P a r t i c l e Emissions from S ta t i ona ry and Miscel laneous Sources i n t h e South Coast A i r Basin, KVB 5806-783
CA, February 1979. IS PB 293 9231, C a l i f o r n i a S ta te A i r Resources Board, Sacramento,
A-78

I I .
t sercorlt O f P a r t i c l e s
> l o p lo-3m 3-1- <lW
T M P . gne f i n d . 8 u 10 20
T e s t 18, coal f i n d 8 24 34 34
I
I
A-79

The mean p a r t i c l e size, including the impinger, for T e s t 18 is 15m and 23l1m*
for Test 9; iqnoring the b p i n g e r catch it is 27vm f o r both t e s t s . These re-
sults a r e s imi la r to o ther s ize d i s t r ibu t ion data avai lable i n the literature
(Ref. 4-13 and 4-14).
2. Chermcai C o ~ s i t b i i - - i & l s s 4-42 ~ 7 2 4-43 list the results fram t h e chemical analysis of the par t i cu la t e f rac t ion for each of the tests
discussed i n this section.
would expect. f r o m the uncombusted fuel.
f o r coal f i r i n g than natura l gas f i r ing .
t e n d s t o concentrate in the i q i n g e r s . As expected, su l f a t e concentration
is higher for coal f i r i n g than gas f i r i n g , due to higher su l fu r content of
t h e fuel.
are in the range of l\ of t h e total particulates. w e r e detected in trace auounts.
Calcium is the m O s t predominant species, as one
Carbon is second wst abundant. Its origin is wst likely The concentration of carbon is s l i g h t l y more
Sulfa te is t h i r d umst abundant and
Nitrates also tend t o end up in t h e M i n g e r . Iran and potassim
A l l other elements l i s t e d
3. Emissions and emission factors-Rdssions and emission fac tors can
be l i s t e d with several d i f fe ren t units. The following lists soue of these I 0 I F
emissions and fac tors based M these two tests alone. e
gr/DSCF
T/yr Ibhr
Test 9 (gas)
0.0056
22
5.9
Test 18 (eOal1
0.0099
40
12.5 ' .~ lb/tsn produced 0.21 0.43
Ib/bbl produced 0.041 0.084
01 F
2 I- C .r
ro c, m n
4.2.7 Calcination of Gypsum I I I
cypsum is a mineral t h a t OCCUL.~ in large deposits throughout t h e . uorld.
hehted mlightly, the following reaction occurs: It is hyorated calcim sulfate, d t h t h e formula CdO4.2B20. Wben
CaS04'2H20 - C&SQ,'l/2 H 2 0 + 1-1/2 li20(g)i hw 0 +19,700 sal.
A-80 KVB 5006-783
REFERENCE 30 (SECTION 4.0)
Stack Emissions Survey of Lone S t a r I n d u s t r i e s , I n c . , Port land Cement P lan t , Maryneal, Texas, F i l e No. t A 795 09 Audi t s , Inc., Da l l a s , TX, September 1979.
, Ecology -
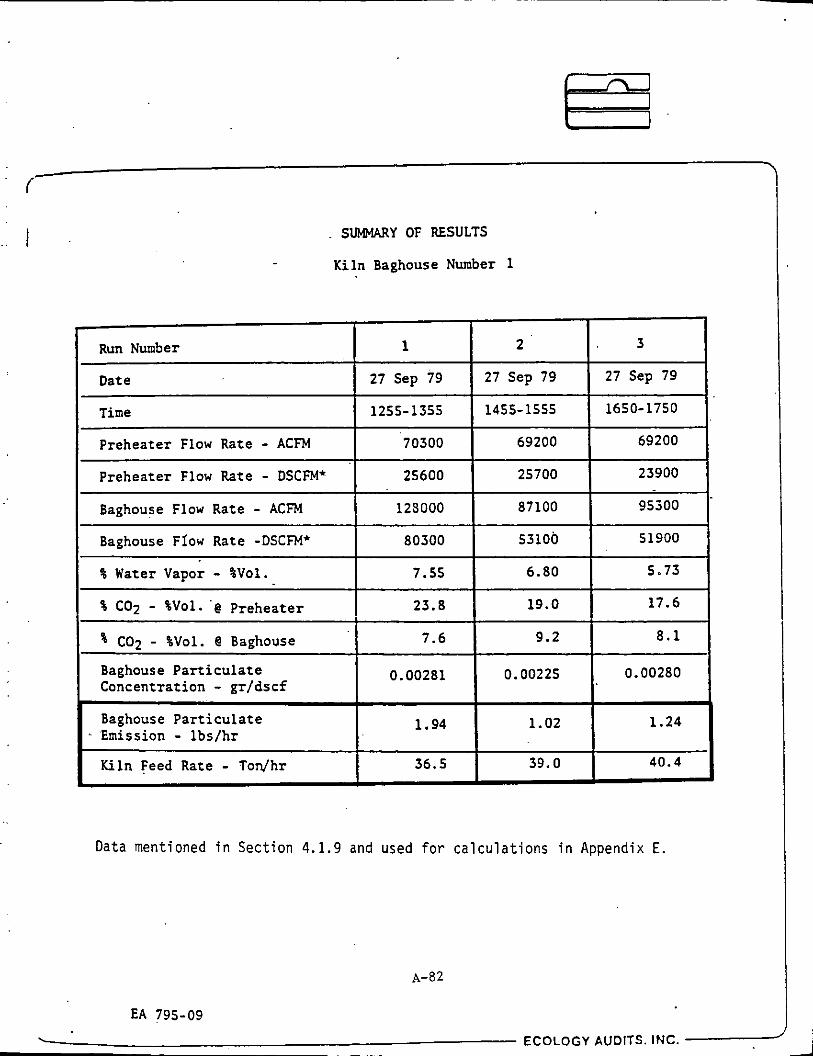
i-
1 2 Run Number
Date 27 Sep 79 27 Sep 79
SUMMARY OF RESULTS
Kiln Baghouse Number 1
3
27 Sep 79
Time
Prehea ter Flow Rate - ACFM
1255- 1355 1455-1555 1650-1750
70300 69200 69200
Prehea ter Flow Rate - DSCFM'
Baghouse Flow Rate - ACFM
Baghouse Flow Rate -DSCFM' I 80300 I 53100 I , 51900
25600 25700 23900
125000 87100 95300
% Water Vapor - %Vol.
% co2 - gVO1. .@ Prehea te r
7.55 6.80 5.73
23.0 19.0 17.6
Baghouse P a r t i c u l a t e I 0.00281 I 0.00225 1 0.00280 Concentration - gr fdsc f
% C02 - %Vol. C Baghouse
Baghouse P a r t i c u l a t e Emission - l b s / h r
7.6 9.2 8 . 1
I 1.94 I 1.02 I 1.24 I I 1
Kiln Feed Rate - Ton/hr 36.5 39.0 40.4 I I I
Data mentioned i n Sect ion 4.1.9 and used for c a l c u l a t i o n s i n Appendix E.
A-82
EA 795-09 . ECOLOGY AUDITS. INC.

:. I
1
' I I
I I
i . I I ..
Run Number 2
Date 28 Sep 79
I
i I
3
28 Sep 79
SUMMARY OF RESULTS
Kiln Baghouse Number 2
Time
Preheater Flow Rate - ACFM
1550- 1650 1735-1335
71300 71000
Baghouse Flow Rate - ACFM
Baghouse Frow Rate -DSCFM* '
% Water Vapor - $Vol. % co2 - %vOl- @ Preheater
% CO7 - %Val. @ Baghouse
~ ~ ~~
80300 138000
48600 E4900
6.65. 6.56
19.6 25.2
10.7 7.8
Baghouse Particulate Concentration - gr/dscf I I 0.03642 I 0.00453
Baghouse Particulate Emission - lbs/hr I . 2.67 '1- 3.29 I I
I I I
Kiln Feed Rate - Todhr I 34.8 ,I 36.1 I I
Data mentioned in Section 4.1.9 and used for calculations in Appendix E.
A-83
EA 795-09 L ECOLOGY AUnlTS, INC.

. : I
. Date I Time
I
I
I
I
I I
I
; I
I
I
; I
I
I
I
I
~
26 Sep 79 26 Sep 79 26 Sep 79
1041-1141 1255-1355 1510-1610
Preheater Flow Rate - ACFM
Preheater Flow Rate - DSCFM'
76200 72700 74500
28900 27200 27000
Baghouse Flow Rate - ACFM
Baghouse FIow Rate'-DSCFM'
0 Water Vapor - %Vol.
% CO2 - %Vol:C Preheater
c q - %':GI. 0 B a g h ~ ~ ~ a . P" Baghouse Par t icu la te Concentration - gr/dscf
Baghouse Par t icu la te Emission - lbs/hr
Kiln Feed Rate - Todhr
82100 81600 91600
48700 47700 S Z l O O
5.70 6.08 7.56
19.2 18.8 21.0
i l . 4 13.7 10.9
0.00840 0.00824 0.00782
3.50 3.37 3.49
40.1 40.7 41.0
Data mentioned i n Sect ion 4.1.9 and used for c a l c u l a t i o n s i n Appendix E.
A-a4
EA 795-09
~ ECOLOGY AUDITS, INC.

Excerpts from
REFERENCE 31 (SECTION 4 . 0 )
Hurst, W. W . , Gas Process Survey, Roanoke No. 5 Kiln System, Lone Star Cement, Inc. , Cloverdale, VA, October 1 Y / Y .
A-a5 I

...
W. J. Cavanaugh -2- November '1. 1979
Results showed average conditions for each Kiln System as follows:
Emission ACFM LbsIHr
Location Temp. OF - KFln Sr.nck
D k m Postponed
86,650 :r L 7 ~ 0 12.2
1 401 65,700 2 3 420 60,700 4 413 70.900
5 ** 326 192,000 l o , \ c o 20.3 5 *** 296
5 " 332 288,600 I(, 700 38.4
- , . B L B S
* No Gas Bypass ** Gas Bypass to one Raw Mill
**# Gas Bypass to two Raw Mills
Opacity nns Lear Stee, -
34
25 15.7 31 19.9 14 14 11
Respectfully submitted,
' o J . c e 3 . b e W. Hurst, P. E.
WWHItab
Data mentioned i n Sect ion 4.1.19 and used fo r c a l c u l p t i o n s i n Appendix E.
A-86

. .
. W O F Z W S S I O N suQ3EY
PROCESS PATE. CONSUIPTION AND PRODUCTION
1979
BM u 1 n
45-46 9-29 ' 1 47-48 9-30 1 49-50 10-1 1
Dace - NO. -
Avenge (Kiln 11)
2
2 .
Average (Kiln 12)
51-52 10-4 3 53-54 10-11 3 55-56 10-12 3
Average (Kiln .#3,)
39-40 9-19 4 41-42 9-20 4 4 3 4 9-27 0
Average (Kiln (4)
1-2 3-4 5-6 15-16 23-26 25-26 31-32
7-8 10
I 12 14
17-18 19-10 21-22
7-22 5 7-24 5 7-73 5 8-18 5 9-2 5 9-3 5 9-4 5
7-26 5 8-4. 5 8-5 5 8-6 5
8-22 5 8-23 5 8-30 5
Average (Kiln 15)
x me1 water BSCE Ln .- - co.1
3.3 6.9 3.4 5.6 3.4. 8.8
7.1 3.4 - -
2.7 2.3 2.8.
2.8
3.0 2.9 3 .O
3.0
8.5 9.3 9.4 9.9 9.8 9.5 9.4
9.5 9.3 9.5 9.3
9.5 9.7 8.7
9.4
-
-
-
7.3 . 7.2 7.4
7.3
5.4 6.3 6.6
6.1
4.9 5.0 7.3 5.2 6.8 5.1 6.6
5.0 5.2 4.8 8.3
3.7 7.2 4.4
5.7
-
-
- Data used for calculations i n Appendix E.
Feed a c e
21.9 20.7 11.0
21.2 -
22.1 21.9 20.7
21.6
26.0 25.6 32.1
27.9
95 105 105 105 110 110 110
102 100 102 105
105 105 110
105
-
-
-
a water
1s- &W
W X - 0.42 0.39 0.56
0.46 -
0.53 0.52 O A 8
0.51
0.W 0.38 0.38
o.l.0
0.30 0.28 0.32 0.34
0.42 0.38
0.29 0.36 0.32 0.38
0.36 0.38 0.52
0.36
-
-
p.30
-
T-3
14.6 13.8 14.0
14.1 -
14.7 14.6 13.8
15.4
17.3 18.4 21.4
-
19 .o - 59 66 66 66 69 69 69
64 63 64 66
66 66 69
66 -
CO0lL;a WdCsr c;ll/nin
22 25 26
20 -
26 25 24
25
24 25 29
26
37 48 49 49 50 50 51
44 61 46 47
05 44 5 1
48
-
-
-
A-07

Excerpts f rom
REFERENCE 32 (SECTION 4.0)
M. Mease, C l i n k e r Coolers/Gravel Bed F i l t e r , Mease Engineer ing Associates, P o r t Mat i lda , PA , March 1980.
J . , Test Report Stack Ana lys is f o r P a r t i c u l a t e Emission,
A-88 .

- R U J Run #2 Run #1 K i l n Feed Rate, Tons/Hour 140.8 148.8 148.8
C l i n k e r Feed Rate, Tons/Hour 83.8 83.8 83.8
(EPA R e g u l a t i o n s ) 14.9 14.9 lb.9 Allowable Emiss ion Rate,Lb./Hr.
A l lowab le Emiss ion Rate,Lb./Hr. 117.7 117.7 117.7 ( S t a t e o f Oklahoma R e g u l a t i o n )
( F r o n t H a l f of T r a i n ) 14.8 13.6 12.9 A c t u a l Emiss ion Rate, Lb./Hr.
A c t u a l Emiss ion R a t e , Lb./Hr. ( E n t i r e Sampl ing T r a i n ) 15.2 14.8 13.9
. P a r t i c u l a t e C o n c e n t r a t i o n , Grains/SCF ( F r o n t H a l f of T r a i n ) 0.012 0,011 0.011
P a r t i c u l a t e C o n c e n t r a t i o n , .. Grains/SCF ( E n t i r e Sampling T r a i n ) . 0,012 0.012 0.012
P a r t i c u l a t e Conc e n t r a t i o n , Gra ins /ACF ( F r o n t H a l f of T r a i n ) 0.008 0.008 0.007
.. P a r t i c u l a t e Concen . t r a t ion ,
G r a i n s / A C F ( E n t i r e Sampl ing T r a i n ) 0.009 0.008 0.008
D a t a mentioned i n Sec t ion 4.1.11 and used for c a l c u l a t i o n s i n Appendix F.
A-89
!

Raw Feed Tons/Hr
Coal Feed Tons/Hr
TOTAL FEED RATE
FOR
REXNORD CRAVIX BED
TOTAL KILN KILN #1 KILN 82 KILN #3 FEED RATE
40.2 40.9 51.9 133.0
- 4.5 - 5'. 1 6.2 15.8
44.7 46.0 58.1 148.8
I Clinker Prod. Tons 25.3 25.8 32.7 83.8 I Cooler Feed Rate Okla.
Allowable Emissions
Clinker Cooler
EPA 0.1 Lb/Ton kiln Feed with Coal
Oklahoma Allowable
Process Wt. Table
Clinker Production 83.8 Tons/Hr
14.9 lbslhr
3e.a" 30.6 40 .7 lfj.7 lbs/hr
Production rates are during time of testing 11 a.m. to 6 p.m. 3/25. 1980. Representatives,present during time of test vere - GCA representing EPA, Dr. Joyce Sheedy, Oklahoma Air Control, Chris Raper, Kaiser Engineers.
Data mentioned i n Sect ion 4.1.11 and used fo r c a l c u l a t i o n s i n Appendix F
A-90

REFERENCE 33 (SECTION 4.0)
Source Emissions Survey o f Oklahoma Cement Company, K i l n No. 3 Stack, P r y o r , Okl ahoma, M u l l i n s Environmental Tes t i ng Company, Addison, TX , March 19g 0.
A-91

SUWRY OF RESULTS
Kiln Number 3 Stack
Particulates
Total Catch
29.92 "Hg, 6B0F
Data mentioned in Section 4.1.12 and used for calculations in Appendix E.
. A-92 ,
M U L L I N S E N V I R O N M E N T A L TESTING CO., INC.

PRODUCTION DATA FACTORS
During Joy Baghouse Emission Test
Production Rates - For e igh t hours ope ra t ion 1 1 : O O a.m. - 7:00 p.m. ( 3- 2 8 - 80)
#3 Kiln
Raw Feeder Counts - 4i9.i i 6 = 52.5 tons raw p e r hour
= 52.5 tons /hr x 0.63 = 133.1 c l i n k e r t ons /h r )
Coal Feeder Counts -
47.89 = - = 47.a9 6.0 Tons c o a l / h r used a
Tota l k i l n f eed ra te 58.5 t ons /h r
Data used f o r calculations i n Appendix E .
80-38 A-93
/ MULLINS ENVIRONMENTAL TESTING CO., INC.
~ ~~

Excerpts f rom
REFERENCE 36 (SECTION 4.0)
A r l i ng ton , W. D . , Compliance Stack Test, Lone S t a r F lo r i da , Inc . Report 276-5, Cooler No. 3, South F l o r i d a Environmental Services: 'Inc., B e l l e Glade, FL, Jufy 1980.
A-94

“h’l RL” RUN3 AVERAGE
DATE OF TEST 7-9-80 7-9-80 7-9-80
11.68 20.81 18.46 16.98 - WSIa RAE (LBs.m.) 17.03 17 .03 17.03 17.03
PlIss1a RATE (LBS./TCN OF FEED) .0686 .1222 . lo84 7 1
ALLmABLE PlIsSIoN RATE ws.m .loo0 .loo0 .loo0 . .loo0
92.37 93.70 92.65 92.91 PERCENT ISOKINETIC --
I Data mentioned i n Section 4.1.13 a’nd used for calculations in Appendix F.
A-95
.

Excerpts from
REFERENCE 39 (SECTION 4.0)
M u l l i n s , B. J . , Source Emissions Survey o f l o n e S t a r Indust r ies , I n c . , New Orleans, Louisiana, M u l l i n s Environmental T e s t i n g ‘Company, Add ison , TX, November 1981.
A-96

, .
'.?
SUHNARY OF m S S I O N TESTS N e w Orleans
November 9 t h - 13, 1981 --
S t a c k Flow A R M
S t a c k Flov DSCM
X !rater Vapor N o 1
. . P a r t i c u l a t e s Front Ralf
CrainslCf @ S t a c k C o n d i t i o n s
I Emissions l b s l h r .
Kiln Feed Rate
Allowable Emission Rate l b s l h r .
rl.lol;able Emission Race l b s l h r
S u l f u r D iox ide Emissions l b s l h r .
U l o v c d by louisiana S t a t e
S u l f u r Dioxide Emissions by Test l b s l h r .
-onium l b s l h r - pp"
' :hlorides l b s l h r - ppm
P o t a s s i u m l b s l h r - ppm
h d i u a l b s l h r - ppn
S u l f a r e l b s l h r - ppm
Data mentioned i n Section 4.1.14 ahd L
Pounds of NH3 picked up i n the f i r s t b p i compounds w i t h SO2 and C 1 .
Kiln No. 1 .
252076
Us468
23.2
0.,0085
18.33
94.0 (k.)
50.7 (La.)
325 - 340
254.5
1.51(4.78)*
23.9
2.02
2.27
16.3
d for calcul i
11 had a l r a <
- .67(7.7)*
33.7
2.67
5 . 0 .
11.3
ms i n App
mgan to 1
KilnKo. 2
229817
112262
22.8
0.0088'
. 17 .4 I 83.0 (EPA)
26.9 (=A
325 - 340
95.4
l b s l h r
.77(3.94)*
16.5
2.01
2.06
7.3
l i x E .
m
ppn
. 3 (7.3)*
25.0
2.3
5.0
5.3
A-97

Kiln Number 2 during emission testing rias 93.0 tons per hour.
not considered part of the process *-eight under EPA Regulations.
Coal is
Identity of Emissions
Emissions from the process are fine particulates and combustion gases.
Coal is used as a source of fuel k-hich contains some sulfur; consequently,
the combustion gases are a mixture of water vapor, oxygen, carbon dioxide,
and sulfur dioxide.
calcined aragonite and clay.
The particulates are composed of calcined or semi-
Plant Operation
Plant operations were normal except f o r a time when the induced draft
fan cut out on Kiln Number 1.
the Kiln was back to normal operations.
Emission testing was-discontinued until
Ki In Number 1
Kiln Number 2
PRODUCTION DATA DURING TESTING
Raw Feed (tons/hr) 1 Allowable
Coal Feed Total Feed Emissions (tons/hr) (tons/hr) (lbs/hr)
Louisiana Regulation
11.0 94.0 50.66
EPA Regulation 83.0 I 11.0 83.0 24.9
Kiln Number 1 Under State Regulations Kiln Number 2 Installed after 1971, therefore,
must abide by EPA Regulations.
Data used for c a l c u l a t i o n s i n r+pendix ;E. 81-107 A-98
~~~

REFERENCE 40 (SECTION 4.0)
Hurst, W. W . , Stack Emission Survey and Precipitator Efficiency Test- ing at Bonner Springs Plant, Lone Star Industries, Inc., Houston, TX, November 1981.
A-99

Run Teat No. Location e 1 No. 6 Stk. 9-8 2 5 6 9 9-10
10 u *' 9-11
-
9-9
16 I'
AVERAGE
71 No. 2 S t k . 9-21 '2 9-21 27 9-22 28 'I 9-22 33 9-23 34 9-23 39 '' 9-24 41 9-24 45 " 9-25 46 '* 9-25 51 I' 10-5 52 'I 10-5 57 '* 10-6 58 " 10-6 63 10-7 64 10-7
AVEMGE
TABLE T-1 BOWER SPRINGS STACK EXISSION SURVEY
PARTICULAZE EMISSION RATE
~ U S T GAS Temp. Volume .r.. ACR( - 777 772 769 776 768 766 768
771
695 692 668 666 635 635 677 676 680 679 720 724 734 734 702 703
688
- 7S.900 64.100 72.900 66,700 67.200 63.500 55,500
66.500
99,300 105.400 96,100 ioo.9oa 90.300 85.100 108,900 110,600 103.700 111,400 114,700 118,400 119.000 127.200 102,600 97.400
105,700
"Average not including Runs 63 b 64
- 0.1612 0.0741 0.0690 0.0623 0.0764 0.0455 0.0222
0.0805
0.0308 0.0748 0.0206 0.0301 0.0171 0.0199 0.0360 0.0329 0.0607 0.0351 0.0240 0.1080 0.0788 0.0488 1.0470 0.6930
0.1472
0.042
1981
PARTICULATE EMISSION RAIE Grains/ Lbe./SCF-6
Dry x 10 Lbr.lHr. ZDnlDPy
- 23.5 10.6 9.9 8.9 10.9 13.6 3.2
- - 53.0 0.64 19.7 0.24 21.2 0.25 18.0 a. 22 21.0 0.25 25.9 0.31 4.7 0.06
11.5 a 0.31
4.h 10.7 2.9 4 . 3
2.5 2.8 4.9 4.7 8.4 5.0 3.4 15.4 11.3 7.0
147.0 99.0
16.3 0.20 40.6 0.48 11.6 0.14 18.4 0.22 10.0 0.12 10.7 0.13
20.4 0.25 20.1 0.21 34.4 0.41 21.0 0.25 U.l 0.16 62.6 0.75 44.8 0.54 29.0 0.35 531' 6.8 352* 4.2
20.8 77.25 0.93
Data mentioned i n Section 4.1.15 and used for calculat ions i n Appendix E.
A-100
I
d

15
TABLE 1-1 (Continued) BONNER SPRINGS STACK EMISSION SURVEY
PARTICULATE EKLSSION RATE 1981
EXRAUST CAS PARTICULATE EIISSION RATE Run Test Temp. Volume Grains1 Lbs./SCF-6 No. Locarion part .F. - A C R I D r y X 10 Lbs./Hr. TonlDaL - 67 NO. 4 SCk. 10-8 68 No. 4 Pptr.10-8 73 No. 4 Stk. 10-9 74 NO. 4 Pprr.10-9
71 No. 0 Stk. 10-22 78 No. 4 Pprr.10-22
83 No. 4 Sck. 10-23 04 Na. 4 Ppcr.10-23
734 722 742 795 758 780
751 761
70,500 106,100 75.500 80,200 J4.900
71.600 74,700 7k.400
.lo32 5.469 0.0413 7.960 .0177 6.804 .0183 6.666
14.7 781 5.9 1137 2.5 972 2.6 920
32.2 2613 12.5 2.391 5.5 1864 5 .8
1940
.I86
31.4 . 15 20.7 .Ob 22.4 .06
.. 23.3
AVERAGE - Stack 746 73.900 0.0451 6.4 14.0 0.17
AVERAGE - Pprr. 765 83.000 6.67 953 (2202) 26.4
87 NO. 1 11-2 638 47.200 0.0092 1.31 3.0 . 04
89 Cooler 11-3 635 48.400 0.0024 0.34 . 0.8 .01
90 Stack 11-3 637 52.100 0.0039 0.55 lC4 , .02
91 '* 11-4 671 51,100 0.0027 0.39 0.9 .01
92 'I 11-4 672 57,600 0.0034 0.48 1.3. . 02
88 6 d 11-2 638 52.300 0.0167 2.39 6.0 .07
AVERACE 649 51,500 0.0063 0.91 2.2 .03
Data used for calculations i n Appendix 0.
A-101 -

D.C. 1981 - 9-8 9-9 9-10 9- 11
9-21
9-22
9-23
9-24
9-25
10-5
10-6
10-7
TABLE 1-4
BONNRl SPRINGS SIACX M I S S I O N SIJRVE7
RATE PRODUCIION AND MNSUUPTION 1981
Fuel Used Syscam Under Coal b i s t u r e
TCSC LbslKln. z
NO. 4 Kiln Stk. 156 0.0 146 6.1 150 8.0 150 7.1
N o . 2 Kiln Sck. I
Kiln 1-24 Rr. 83 7.4 88 7.4 Kiln 2-24 Kr.
Kiln 3-0 Hr. '
Kil" 1-0 Hr. Kiln 2-24 Hr. Kiln 3-0 Hr.
Kiln l -OKr . Kiln 2-24 Hr. Kiln 3-12 Hr.
Kiln 1-0 Kr. Kiln 2-24 Hr. Kiln 5-Z4 iir.
Kiln 1-0 Kr. K i l n 2-24 Kr. Kiln 3-24 Kr.
K i l n 1-20 Kr. Kiln 2-24 Hr. Kiln 3-23.73 Hr.
Kiln 1-18 Hr. Kiln 2-23 Hr. K i l n 3-24 Hr.
- - 84 5.8
- -- 85 6.5 90 6.5
84 8.0 80 V."
a "
84 7.8 77 7.8
87 7.2 88 7 . 2 80 7.2
89 7.5 87 7.3 84 7.5
89 7.0 82 7.0 84 7.0
Data used for calculations in Appendix E.
A-102
Raw nix Used Ion/Kr. S l u m caco. a
31.0 31.0 31.4 32.0
17.86 17.17 -- . -
16.72 -- -
16.88 15.61
- 17.17 16.85
- 17.41 16.96
18:23 17.69 17.55
18.18 17.26 17.21
16.31 17.14 16.43
noiac - x
34.7 35.0 36.5 34.1
34.1 34.1 - -
34.5 - -
34.0 34.0
-- 34.1 34.:
- 34.0 34.0
33.8 33.8 33.8
34.3 36.3 34.3
34.1 34.1 34.1
79.2 79.2 79.3 79.2
80.3 80.3 - --
80.4 -- --
80.3 80.3
- 80.3 80.3
-- 80.3 80.3
79.9 79.9 79.9
79.8 79.8 79.8
79.7 79.7 79.7
- .inker :oduce ,nlHr.
16.8 16.9 17.0 17.4
9.9: 9.51 -. -
9.25 -. _.
9.31 8.6;
- 9.51 9 . 3
-- 9.6; 9.4:
10.1: 9.8: 9.71
10.m 9.55 9.5t
9.0t 9.5: 9.1: -

20
TABLE T-4 (Continued)
BONNER SPRINGS STACK EMISSION SURVEY RATE PRODUCTION AM) CONSUMPTION
Date 1981
10-8
'10-9 10-22 10-23
11-2
-
11-3 11-4
System Under Test
No. 4 Stack 6 Pptr. Input
I ,
I,
,I
No. 1 6 4 Clinker Cooler Stack
I ,
,*
Fuel Used Coal Moisture
Lbshlin.
151
150 154 155
'150
130 149
Data used for calculations in Appen
%
8.3
7.8 8.0 7.8
8.5
7 . 2 7.7
K D.
1981
Rav Mix Used Ton/Hr. Slurry
Dry Moist - %
31.3 33.9
30.7 33.7 79.6 30.6 35.3 79.9 30.1 35.0 79.9
31.1 33.7 79.9 17.3
16:l I 17.0 29.0 34.1 79.8 30.8 34.4 79.6
A-103
I

Excerpts from
REFERENCE 42 (SECTION 4.0)
Hansen, M. D., and J. S. Kinsey, Characterization of Inhalable Particulate Matter Emissions from a Dry Process Cement Plant, Volumes I and 11, EPA;600/X-85-332a and 332b, U. S. Environmental Protection Agency, Research Triangle Park, NC, February 1983.
A-104
I

n - n o 9 - 7 9 n - n w V Y Y Y
n m n m P C P ~ m n n - 971: -339 1-49 n - w w - - - n n - - w Y Y Y Y Y Y Y Y Y Y Y Y
< P 2 ...
u z C cl 2 a VI
w . el U C c f?: < e. E
.r d C c V 4
E -e, a, VI a a 7
n m 42 i;
el z C
- - o m 0-uo 0co.o . . . . nnn
- n o w 0 - 0 0 o n u u
n n w n . . . .
a L c, c w
.r .g a
Ei 0 .
< m
- -1
U I 0 3
d
- u u n m m N O I w o n - * m u * . . . .
C z
N I n L;i -1 CI C c
"I o n m u

" - 3 . a - m -"-!a- m m " l w . n m m m 0 0 0 0 0 0 0 0 . . . . . . . .
" " " V " " " V
m u n m 0 0 0 0
0 - 0 1 1 O O N O . . . . ? ? ? ? N O D O N
n w o - 0 0 - 0 N N N N
- m o r n 0 0 - 0 . . . . . ? ? ? ?
m a - m -m.0 .0 m m " - 3 m m m m m 0 0 0 0 0000 . . . . . . . .
- 0 0 - O O N O
0 0 0 0 O O N e 9 9 9 7 3393
N c - m o m O O n O N N N .
-010- 0 0 - 0 ? ? A 9 . . . -
01-00 mODr40 " - 3 . 0 . 0 - o m a a N N N N N N N N . . . . . . . .
. Y m u u m e o u - O N - nn01- . . . . m-11- ;did
- - - - "NN # # I , I , , , - N n U -run*
I , , , I , , , 0 0 0 0 0 0 0 0
W
m + - n
E .r
W L c1 c w
.r
A-106

. .,
N N I *
w A m 4 +
-4-107

l l O I . - O I l N e O N
0 0 0 0 0 0 0 - - 0 0 ????,: " 9 9 9 0 : c
o - n o * 0 I - I - w 0
0 0 0 0 0 0 0 - 0 0 0 ? ? ? ? ? 9 ' 1 9 4 9 7
0 o m
0 0 0 9 " 9
n n o n n """no n n n n n nnnnn x
m N I
U
A-108
I

. ._;
Excerpts f rom
REFERENCE 43 (SECTION 4.0)
Lonnes, P., Resul ts o f t h e February 17 and 18, 1983, NSPS Par t i cu - l a t e Emission Compliance Test on t h e No. 8 K. i l n a t t h e Lehi h P o r t l a n d Cement P lan t i n Mason City, I owa, I n t e r p o l 1 , Inc . ,'Blaine, MN, March 1983.
A-I09

Data mentioned in Section 4.1.17 and used for calculations in Appendix F
Table 1. Summary of the Results of the February 17, 1983 Particulate Emission Compliance Test on the No. 8 Kiln Cooler Stack
Volumetric.flow Actual (ACFM) Standard (DSCFM)
Kiln feed rate (tons/hr) Gas Temperature (Deg-F) Moisture Content ( X v/v) Gas Composition ( X v/v, dry)
Carbon dioxide Oxygen Nitrogen
Isokinetic variation (X) Particulate mass flow (lb/hr) Particulate concentration
Actual (gr/ACF) Standard (gr/DSCF)
- Kun i
80,000 60,400
136.4 193 2.70
0.03 20.90 79.07 97.6 2.7
0.004 0.005
Run 2 -
81,500 59,800
139.2 214 2.44
0.03 20.90 79.07
101.3 1.0
0.001 0.002
Kun 3 -
82,400 60,400
138.1 214 2.58
0.03 20.90 79.07
102.3 1.0
0.00.1 0.002
A-110

.: !
0
Y . m Scrubber: -
3 u Type Ap (across s c r u b b e r ) . in. H 0.
- .- - -
2 u Operating Ampa ' L
. :
Fan Raced H . P . operating V o l t ,
Llquid C i r c u l a t i o n Race g d i m i n . Z Hoke-up . Blowdo- g m . 0
v
3 Scrubbing Watir Changc l n t e ~ a l
S e t t l i n g Tank Cleaning l n t f r v a l " m
u m
BaRhourc: pucs€-Ter c1
Praasurc-PosiCivc . No Compnrtmfnrs $ . Type Cleanlng &z . Clean c y c l e u/a m i n .
Fan: Raced 1 I . P . . n l t c m i n p v o l t s GO .' Operating b p L & .
m:
Fan Ratcd 1I.P.- . OperatInC V O l C S . opcrncin* Amp.
Avg. Baghouse Ap -1.35 In N20. A? Renpc - Y/f .f i n . H*0 .
TYPC bP in. H20. Diameter
A-111

A-112

I..
Electrostat ic Precipitator: primary Primary Secondary se.c'ondi<y Spark
F i e l d v d t . ~ c Currant Vol tnge &rrenc Rate LL
:i no. , . '.- ("OlC.) (amrs) (KV) (ma) :'<per nin.7. 2 . . ..
A-I13 I

Excerpts from
REFERENCE 44 (SECTION 4.0)
S te iner , J . , Mojave Plant (Kiln, Clinker, and Crusher Baghouses)
-tal Services, Bakersfield, C A , May 1983. , Pape Annual Corn l iance Test, Report PS-83-93/P reject 5081-83 -
A-114 I

1 -
I
5-0 f
_l:l, 999
.. 2, - s : 3
E
3
c = 0 U
u x L 0 I,.
A-115
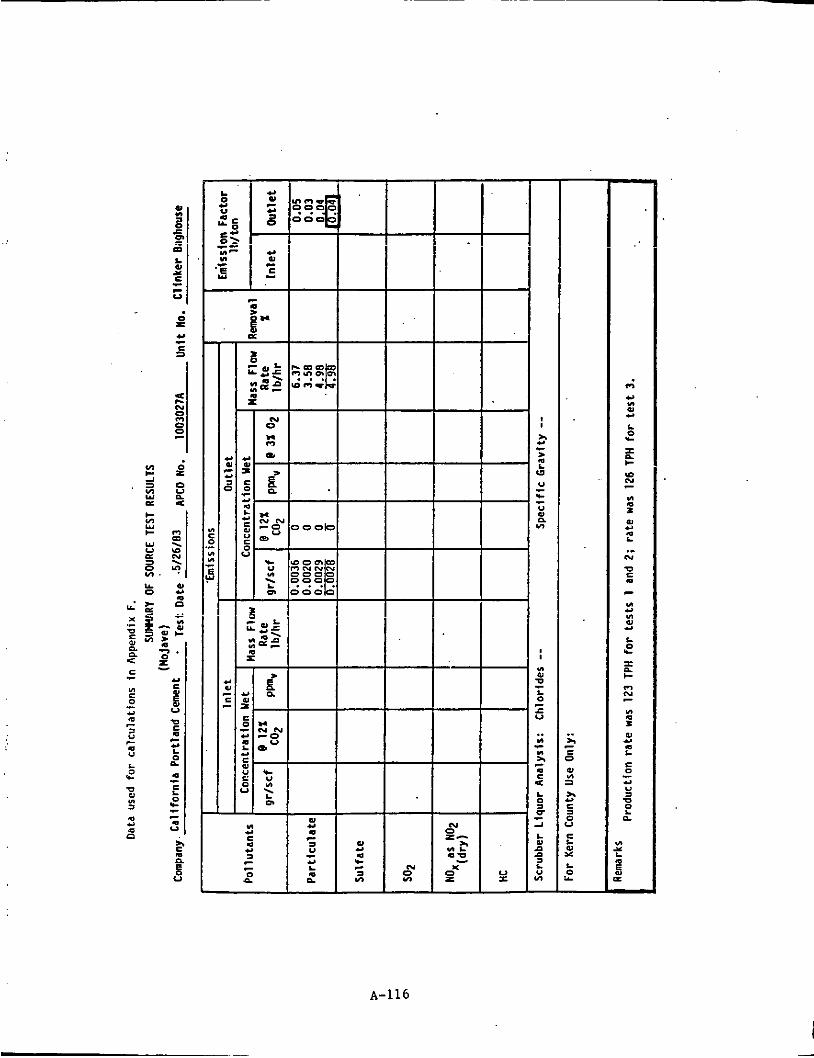
VI I- A 3 v1 Y
I- v1 Y I-
Y U
2 In Y 0
W
c P a L W a. c r c " d
El
L 4a c
z 8
P 8
N 0 F?
c
o 4
F? m . 10 N . y?
u Y m P
A-116

- Lxcerpts from
REFERENCE 46 (SECTION 4.0)
Hansen, M. D., et al., Characterization of Inhalable Particulate Matter Emissions from a Wet Process Cement Plant, Volumes I, 11, and 111, EPA 600/X-85-343a, 343b. and 343c, U. S. Environmental Protection Agency, Research Triangle Park, NC, July 1983.
I-..
A-117

Y A D
! . 2
A-118

..
U I c?
W -1 m 4 c
3--* m3-. -
.^*:CN r-3- a a - --w.-
. - a%- or-ca . . . . . . . .
E = - * O N N - i * - - c 3 - - - - , & .- .- c .- - .- c .- . . . . . . . . ,.- e
. .
U
I U
W rl e m CI
G rl
-0 al 0 3 al rl a m U
W Y rl U E w
-
A-119

z 0
n m w el m 2
U
0
m m
0 '9
m - 0
0 0 0 a ! ? ?
u ??
.- ..
x-
!
A-120

a m I O U U I N
0 0 0 0 0
- N o ? - . . . a m - m a * . n - m
0 0 0 0 0 9 9 - 9 9
- - 0
m m
0 9
a
0 9
n ? 0
U
0
e
U n
c
U
u M m Id 01 > m 3 m Y 0 c
W u c c .- .3 E, u u .d- u n W E
m m
u 3 Y m c * -3
m c * O Y
vra m - .3 6 M u s .* V I 0 V I C
V I V I
3:
.*
m a
m u 6 2
r u YL. 0 0 Y U
v1
E ei
Y 3
u a a - a n m o m 9 9-99 0 0 0 0 0
.n- nuuu- l N O O - .
0 0 0 0 0 . . . . .
b 0 Y m !4 m a 2 e e a
a
YI
c Y .3 3 u 0 Y U m
-
B .- c - - x u e S
5 u .a u W 2 2 c m - - Y .3 3 0 2 .- m d n 0
m Y 9 a Y m u Y
u N .3 VI
u d U .* Y u m a
c- m a c l n - o c 0 0 - 0'0
N aaN a o - N m 9 2 9 9 9 0 0 0 0 3 00000
n '9 0
n "! 0
M c Q
0
u M m Y VI
d U u
3 VI
0 Y
u 3
W
.4
m r
%
U N m a n l u o
0 0 0 0 0 9911:
m uaaIOr N N O O - .
0 0 0 0 0 . . . . .
V I % 0- c .C o u * V I urn * u L . 2 o u U C
n a
5 .3 3 0 u c .r( m Y n 0
m Y m
W
u Y m " c 0
.r( VI W .3
E z
2
VI
3 * Y
.n c.l
Y s CI
u N .*a
0 2 u s -3 3 . d I d I. 0 a
" 0
3
m n u w
A-I21

Excerpts f rom
REFERENCE 48 (SECTION 4.0)
Source Emissions Survey o f Lehigh Por t l and Cement Company, Environmental Tes t ing Company, Add ison,
A-122
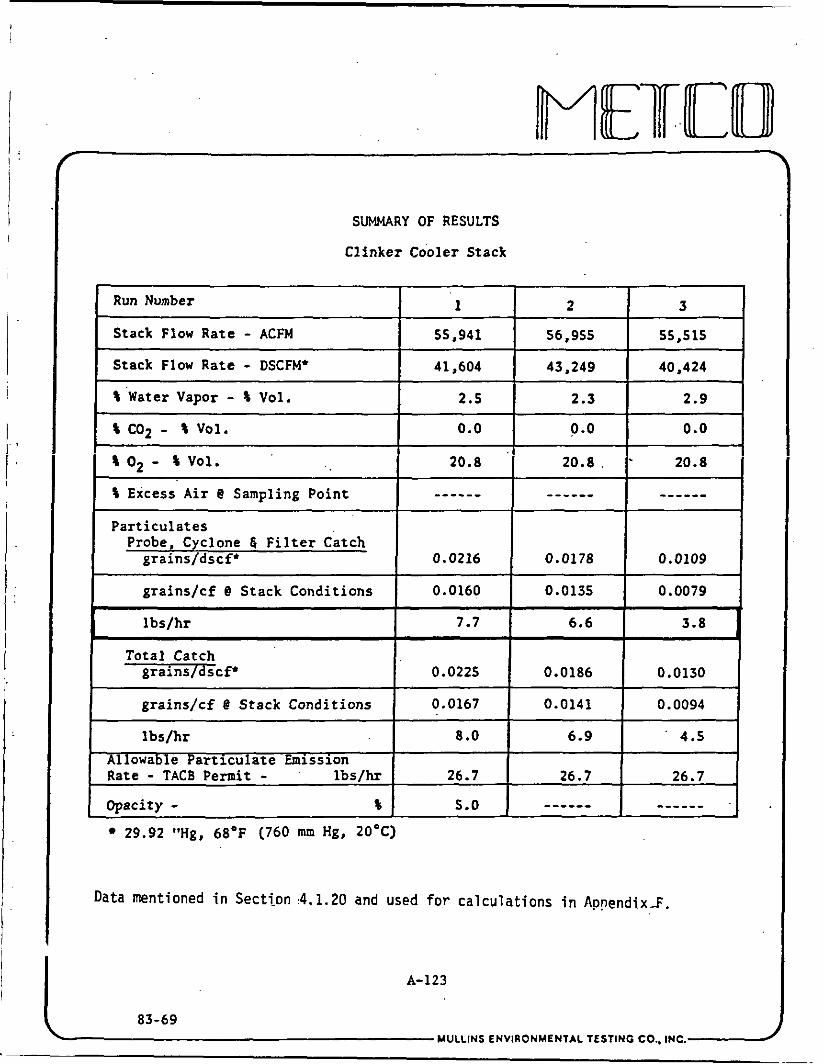
F f
Run Number
Stack Flow Rate - ACFM
SUMMARY OF RESULTS
Clinker Cooler Stack
1 2 3
55,941 56,955 55,515
s o2 - s VOl. 20.8 20.8. I' 20.8
8 Excess Air @ Sampling Point - -____ -----_ -----_
I Stack Flow Rate - DSCFM' I 41,604 I 43,249 I 40,424 I
grains/c€ @ Stack Conditions 0.0160 0.0135 0.0079 r
lbs/hr 7.7 6.6 3.8 r 4
I 8 Water Vapor - s vel.
lbs/hr Allowable Particulate Emission Rate - TACB Permit - lbs fhr
Opacity - S
I ~ 2.5 I 2.3 - 1 2.9 1
8.0 6.9 ' 4.5
26.7 26.7 26.7
5.0 ------ ------
I S c02 - s Val. I 0.0 I 0.0 I 0.0 I
I particulates I I I I I I grains/dscf' I 0.0216 I 0.0178 I 0.0109
Probe, Cyclone 8 Filter Catch
Total Catch I grains/dsc€* 1 ' 0.0225 I 0.0186 1 0.0130 I ~~
I grains/cf B Stack Conditions I 0.0167 I 0.0141 I 0.0094 I
29.92 "Hg, 68'F (760 mm Hg, 2ooc)
Data mentioned i n Section 4.1.20 and used for ca lcu la t ions i n Appendix-F.
A-123
83-69 I MULLINS ENVIRONMENTAL TESTING CO.. 1 N C . U

- ~~~ ~
Data used for calculations i n Appendix F.
LEHIGH PORTLAND CEMENT COMPANY ..o. 0O.x .In M I C M W A Y ” W X M
WACO. TEXAS 7W10
.,I; 7,1.,,,0
August 8, 1983 .
M r . B i l l M u l l i n s Mul l ins T e s t i n g METCO Addison, Texas
Dear S i r :
performed on August 2 and 3, 1983. B e l o w , please f i n d tes t r e s u l t s on s t a c k t e s t i n g t h a t w a s
K i ln & Raw Material Parameters During Ki ln S tack T e s t s on 8-2-83
T e s t # Feed Sc rew Revs. Coal Usage C l i n k e r P r o d u c t i o n Dryer Feed R a t e #1 I D Fan I n l e t Temp. # 2 I D Fan I n l e t Temp. % O 2 111 X i l n % 0 # 2 K i l n T i &
1 1361 10.78 t o n s 53.5 t o n s 84 TPH 415 450 2.1% 2.5% 8:39-10:18
- -2 1364 10.78 t o n s 56 t o n s 86 TPH 430 455 1.8% 2.1% 11:OO-12:41
- 3 1445 - 10 .6 Tons 59.4 Tons 77 TPH 430 450 2.1% 2.4% 13;22 -15:OO
While c o n d u c t i n g t h e t h r e e k i l n s t a c k sampling tes ts bo th k i l n s and t h e t h r e e d r y e r s were o p e r a t i n g under normai p l a n t p r a c t i c e s There were n o k i l n upsets or d e l a y s .
K i l n Parameters During C l i n k e r Cooler (Gravel Bed) S t a c k Tes ts 8/3/83
T e s t # Feed Screw Revs. Coal Usage C l i n k e r P r o d u c t i o n Dryer Feed Rate #l I D Fan I n l e t Temp. # 2 I D Fan I n l e t Temp. % O2 #1 Xiln % 0 # 2 K i l n T i m 2
.1 880
2 793
3 m-7 7.34 Tons 7.25 Tons 7.26
136.2 Tons 36 Tons 36.8 Tonsl’ --- --- --- 498 502 500 502 505 49 5 2% 2.4% 3.2% 3% 2.5% 2.8% 9:05-10:13 ll:09-Not rec. 13:15 - 14:26
During t h e f i r s t two c l i n k e r c o o l e r ( g r a v e l bed) s t a c k sampling
While conduct ing t h e t h i r d t es t , t es t s t h e r e were no unusual k i l n u p s e t s o r d e l a y s . Both k i l n s were o p e r a t i n g under normal c o n d i t i o n s . a f t e r 4 p o i n t s had been t a k e n , t h e back wash f a n s on t h e g r a v e l bed d u s t col lector s h o r t e d o u t and kicked o f f . The sampling probe was p u l l e d from t h e s t a c k a t 13:23 and an u p s e t c o n d i t i o n was c a l l e d . A f t e r e v a l u a t i n g t h e problem-€he d e c i s i o n was made t o conduct t h e remainder o f t es t 3 wi thou t t h e back wash f a n s . A t 13:28 t h e probe was p l aced back i n t h e s t a c k and a l l o p e r a t i n g pa rame te r s re-set.
A-124

2.. I I'Ulll
REFERENCE 50 (SECTION 4.0)
Steiner, J., Mojave Plant (Ki ln, . Clinker and Crusher Bahouses)
and Steiner Environmental Services, Bakersfield, CA, May 1984. , Pape Annual Compliance Test, Report P S - 8 4 - 2 4 h reject 5233 - 84
A-I25

A-126

TABLE A-I. S U W R Y OF SOURCE EMISSION TEST DATA
Baghouse O u t l e t LOCATION: K i l n
UNIT TESTED:
Test numbtr Oate T e s t c o n d i t i o n
Barometr ic pressure ( in. W l Stack pressure ( i n . Hg) Stack area (F tZ ) Elapsed sampling t ime bin) volume gas sampled (dscf) F f ac to r
GAS DATA Average gas v e l o c i t y (fPS) Average gas temperature ( O F ) Gas f l owra te (dscfm) cas a"*;ys;s ( : r J E?:;;.: 5::j:;
t a r h n d i o x i d e Oxygen Carbon monoxide Mater
EnlSSIOI: COIKENTRATION
F i l t e r a b l e p a r t i c u l a t e l g r /dsc f ) To ta l p a r t i c u l a t e ( s r l d s c f ) To ta l su l fa te ( g r l d s c f l
NO, (PP.)
F i l t e r a b l e p a r t i c u l a t e ( I b / h r I To ta l p a r t i c u l a t e I l b l h r ) To ta l s u l f a t e ( l b / h r ) SO3 ( l b / h r l SO2 ( l b / h r ) NO, (:b/hr)
SO3 ( P F I 502 (PPm)
ENISSIOI RATE
Lb/t+!atu-EElSSION FACTOR F i l t e r a b l e p a r t i c u l a t e To ta l ? a r t i c u l a t e To ta l s u l f a t e SO2 NO,
LblBbl -EMISSION FACTOR
To ta l o a r t i c u l a t e
- 1
5/15/84 231 TPH
26.20 26.11 87.28 72 47.131
63.3 259.0 198625
18.80 10.45
0.00 6.49
0.00; 0.001 0.00: 0.20
i 353.75 i 67.79 I I
j ' 47:;; j 1.88 I 0.50 4 143 .76
503.48
2 /I 5/84 36 TPH
26.20 26.11 87.28 72 47.0808
63.4 158.2 99435
18.38 10.50
0.00 6.35
3 5/15/84 245 TPH
26.20 26.11 87.28 72 48.2880
65.1 158.0 106805
18.50 11.10
0.00 5.53
O.CUbL U.LilnU 0.0065 O.OOi3 0.0011 0.0011 0.20 ~ 0.20
72.81 ! 73.45 152.50 ; 382.50
I
10.53 11.06
1.89 0.44
154.17 501.70
h e r a g e
63.9 258.4 201 621
0.30:: 0.0051 0.001 I 0.23
71 . 3 5 362.92
A-127

.. 2, c D
- :: = 2, c c 3 0 U
c L u Y
L 0 Y
A-128

TABLE A-3. S w A R Y OF SOURCE EMISSION TEST DATA
C 1 i nker Coo ler LOCATION: uaghouse O u t l e t UNIT TESTED:
Tes t number Date Tes t c o n d i t i o n
Baromet r ic pressure ( i n . W ) Stack Dressure.(in. Hg) s tack area ( F t Z ) Elapsed sampling t ime bin) volume gas sampled (dsc f ) F f a c t o r
GAS OATA Average gas v e l o c i t y ( fps ) Average gas temperature (OF)
G ~ S a n a l y s i s ( d r y percent bas i s ) ,-.- n -...*..- l . 4 c - A " > "~~ . I " " .-.- \ - - - ....,
Carbon d i o x i d e oxygen Carbon monoxide water
[MI 5 5 I ON COl iC ENTRATION F i l t e r a b l e p a r t i c u l a t e ( g r / d s c f ) To ta l p a r t i c u l a t e (g r /dsc f ) To ta l s u l f a t e (g r /dsc f ) SO3 ( w m ) so2 (ppm) NC, (PPm)
F i l t e r a b l e p a r t i c u l a t e (1 b / h r ) To ta l p a r t i c u l a t e (1 b/hr) To ta l s u l f a t e (1b:hr) SO3 ( l b / h r ) SO2 ( l b l h r ) NO, ( l b / h r )
h~!ISSION RATE
Lb/PWBtu-EMI SSION FACTOR F i l t e r a b l e p a r t i c u l a t e T o t a l p a r t i c u l a t e To ta l s u l f a t e 502 NO,
Lb/Bbl - E M I S S I O N FACTOR
To ta l p a r t i c u l a t e To ta l s u l f a t e
- 1
/17/84 50 TPH
26.26 26.25
106.14 72 63.9903
32.7 237.6 137895
0.0 20.9
0.0 0.38
0.001E 0.001f
2.18 2.18
_L_
2 5/17/84 250 TPH
26.26 26.25
106.14 72 62.1795
31 .8 234.4 i14259
0.0 20.9
0.0 0.66
0.0014 0.0014
1 .61 1.61
. .
-
- 3
i/18/84 !SO TPH
5.38
36.14 72 51.9962
16.36
31 .2 14.5 31 953
0.0 20.9
0.0 0.88
- Average
31 .9 235.5 134702
0.0014 ! 0.0015 o.0019 : 0.0017
1.60 2.10
-

Excerpts f rom
REFERENCE 5 1 (SECTION 4.0)
Lehigh Por t l and Cement Company, Leeds, Alabama, P a r t i c u l a t e tompl iance Test, CH,M m 1 , Montgomery, AL, October 1984.
A-130

!, :
5. Calculate stack gas volumetric flow rate. dry basis. s t d . conditions--
Data mentioned i n Section 4.1.22 and used for calculationsfn Appendix E.
A-I31

PART-l CULATC .~.IISS10?( DATA .CALCULATI ON. SIITET~
4. Calculate~serccnt moisture in gas stream--
5 . Cnlcularc sracl: cas volumetric f l o w rare, dry basis, std. conditions--
6. Calculate grain loading-- grains/sdcf - (15.4j)(grarn~)/~mstd - (15.45) UE)/(m)- c.@'73
1 . Calculate mass m i s s i o n rate--
A-132

PARTICULATE E!.IIS510?1 DATA CALCULATIOA SIIEEl - YONICOYCRf O W l C L
5. Calcuiare. stack pas volumsrric flow rare, dry basis. std. conditions--
6. Calculate grain loading-- grrinslsdcf - (15.43)(gram~)/~mstd - (lS.43)(=)/(=). fi.OlG7
~~~~ ~
1 . Calcularc mass emission rat+--
I I '
A-133

6. Ca1culare grain loading-- grains/sdcf - (15.4:) (grams)/"mstd - ( l S . 4 3 1 m / ( & - O.U79
1 . Cslculato mass emission r i c e - -
lbs lhr - (grains/sfdcf)(p.tgd)(l.43 I io-') . 1-1 . '
Ib+/hr . ( :- .!:-' b',y ) ( - (1 .43 I i o - ' ] - Data mentioned in Section 4.1.22 cnd used for calculations in Appendii E. .
,.PARTINLATE El4!.11SSION DATA CALCULATION SIIEET . . . . . .- . - . . ... I
4. Calculate,,percent moisture in stream--
5. Calculate stack gas volunctric flow rate. dry b a s i s , std. conditions--
A-I34

, . .
. .
, .
. ..
Lu
' 5 a . . .
U 2 a
A-135
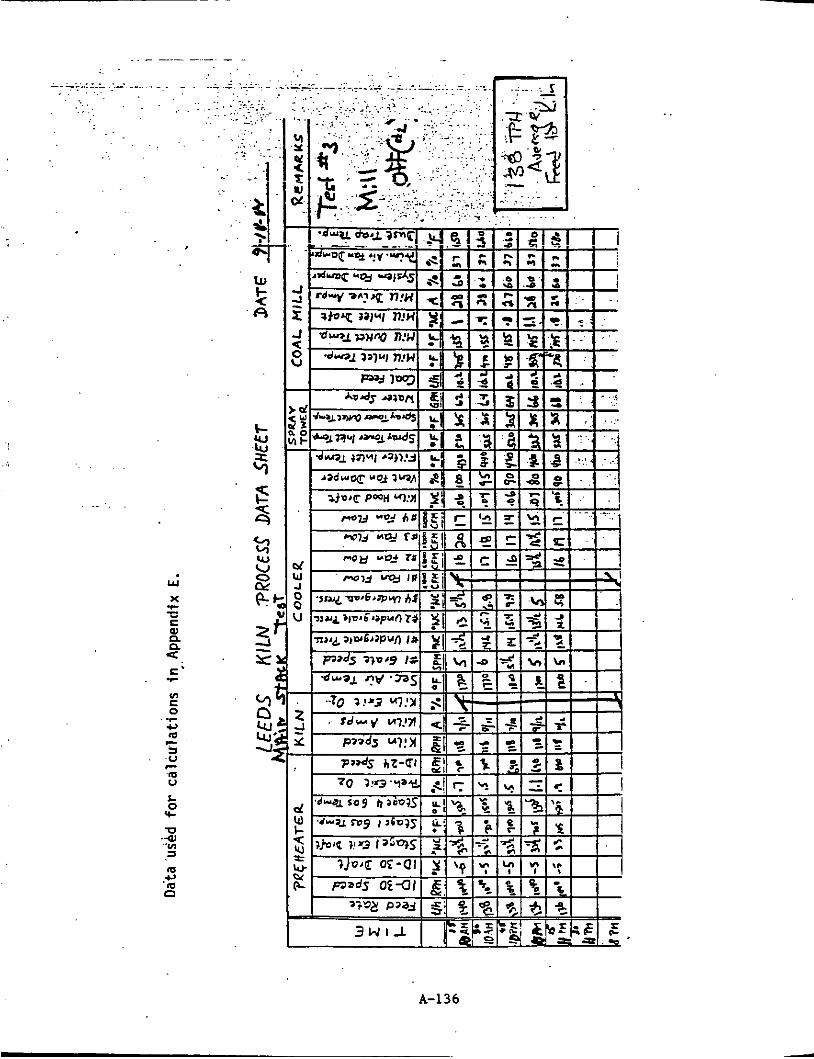
. . . . . . . . . . . -. . -. ..... . . . . . . . .
.. . . .... . . . . . .
. . . .
Y
x
E W
4
c I - n n
L 0
Y-
. . . . , . - . . . . . . . . . . . . . -_ . . . ..:.: . . ... .-.L-:.-T: .L ..L..-.L.:I:...::. :::.c
. . . . . . . . . . . . . . .......... . . , . .. ...... .... - . . . . . .

. . . . . . .
.. .. . . .. . - . ... . ....
w x 'El E al
4 E
.I-
n n
.,-
. . (CI V
L 0 w- U W VI a
A-137

. . ...... . . . . .
. . . . . .
. . . . . , . .
. .
. . . .
...
..
....
. . . . .
. .
Y
X
-0 E 0
4
.E
.#-
n n
.F
ul E 0 U
3 0
a U L. 0 + -0 aJ ul 3
c,
0
7
m c
c
m m
...
. . . . . . ... . . . . . . . . . . . . . . .-: . .
c- - w kJ
.. - .
G
A-138

, ' . ,
I ".
Data mentioned in Section 4.1.22 and used in calculations i n AlFendix F.
A-139

2. Calculate volume of water vapor in gas sample-- - l m l s H,O . Prams H ~ o 1 - (0.0474) [conde&ate ? iilica iel/ . ._ -
VWstd I (0.0474) ( 10 (0.0474) (Z3.f) - .* 1 , \ \ cu.ft. - 3 . Calculate .gas sacple volume at standard conditions--.
, ,a, )(A) - S C " . f t .
5 - 'msrd - ( 1 7 . 6 4 j ( m (a<(, - (L
4. Calculate.,perccnt moisture in, gas stre.zm--
5. Calculzte stack gas volumetric flow rate. dry basis, std. conditions--
6. Calculate grain loading-- grains/sd:f - (15.4J)(prams)/Vmstd - ( 1 5 . 4 5 ) ( 3 ) / ( = ) - o'052q- -
7. Calculate m n i s emission rate--
Data mentioned i n Section 4.1.22 and used for calculations in Appendix F.
A-140

PARTlCULATT: BJl lSSIOX DATA CALCULATICN bIILk1 , , YOWTGOHLR" OrFlCE I
i
4. Calculate percent ooisture in gar stream--
'vs 'msrd - "wrrd 3- 1.20
t 0.03bZ. 3.b 'wstd
5. Calculate stack par volumetric flow rare. dry basil. srd. conditions--
Qstpd - j600(l-B,,!V,AS 7;- S28 P.
- 3600 (1-a~ CU.ft
34. oz>- r,,Bk9,c3 'SK?d
6. C~lCulaCe grain loading-. prains/sdcf - (15.4:) (grams]lvnstd - (15.43) ( 2 3 1 / ( ~ . 0 . 0 5 4 -
7 . Calculate mass emission race--
Data mentioned In Section 4.1.22 and used for calculations In Appendix F.
A-141

. ,
. . . . . . . .
. .
. . .
. . . .
. . . . .,. ....
. .
U
x T) E a!
.I-
n
' E '
2 v
. . . . . . . .
- . .
c ' . . 3
. . . . . . . . . -. . . . . . . . . . . . . . . . . . . . .: ' ' , '. .o .~ . >. * . . .
. . .
-t . . :..._. . . . . . . . .. . . . . -:. ' t'
. . . . . . . . Y , ' t ., . . .
.- . .i >. 3
z a
w .'I
. . .... . . - . . . . :. ,- ... :. v)
. . u : o VJ
0 0
L
. . . .
. . .
I
C
A-142

. . . . . . . . . .............. . . . . . . . . . . . . . . . . . . . . . . . . . . . . . . . . . . . . . . . . . . .
. . . . . . . , . . , ., ,:; ~ .i b'
. . . . . . . . . . . . . . . . .
. . . .
. . . . . . . . . . . . . . . . . . . , . . . . . . . . . . .
.. ,. . . .. ..
:. : . . .
. .
Y
X
-0 E al
.,-
n = E -
L 0 IC
-0 al ?. In
(I:
U E -
1
1
A-I43

..... . . . ... >.
. . . . . . ~ -;,. . ........... . . . . .
. .
. . .
. . . - .......
Ln -i U E
0
m m .4J
'0
... . - . ... A-144

Excerpts from
REFERENCE 52 (SECTION 4 .0 )
Baker, R. L., Compliance Test Resul ts , P a r t i c u l a t e and S u l f u r Oxide Emissions, Cementon K i l n , nc., Engineer ing and Research D i v i - s ion, I r v i n e , CA , December?&:
. .
A-I45

::
SECTION 2.0
SUWARY OP TEST RESULTS
The r e s u l t s of the p a r u c u i a t e emission e o a p l i a x c tss: =-,;;uct& OR
*e k i l n exhaust s t ack of &high’s Cementon f a c i l i t y i n Cementon, New York,
are presented i n Table 2-1. This da t a represen- the emission l e v e l of the
k i l n exhaust s t a c k w h 5 l e f i r i n g pulver ized c o a l to produce approximately
1500 tnns per day of Po r t l ad cemrxt.
t-t,is f a c i l i t y is 0.05 g r a i n s per d r y stardard cubic foot .
The a p p l i c a b l e emissions l i m i t a t i o n for
TAB’S 2-1.. . PAXTICULATE L.XISSIONS RESIJLTS
~
P a r t i c u l a t e Emf s s fons Date T e s t NO. Time Period ( h r ) Gr/DSCF* lb/hr**
1 1 /a104 IC coup 1 1525 - 1657 11/9/84 Id2 (33mp 2 1316 - 1428
0.009 8.5
0.010 8.6 11/9/84 LC c c m p 3 1610 - 1722 0.013 12.0
A E S A G E 0.011
*Staxlard cord i t l ona 68-F a d 29.92 in Eq a t s t a c k oxygen l e v e l
“ & s m on .tack * d o c i t y =t%od cf ar.zlys’ i~
The emissions l e v e l s i n T&le 2-1 were cOmputed throrgh KVB’s Emission
Data Reduction Cbmputer Program (See Apperdix A a d R) W c h is i n accordance
with the appropr ia te E P A methods.
appears in ~ p p e r d i x 8 .
The raw test d a t a taken during each t e s t
A r e p r e s e n t a t i v e of the WYS DEC Region N vas presen t a t the t e s t s i t e
dur i rq the i n i t i a l compliance t e s t i n g day srd.was f u l l y cognizant of the
t e s t i r q p r o c d u r e s u s e .
l eve l s f o r the Cementon k i l n are wel l below the 0.05 GR/DSCF l i m i t .
CoWliance t es t filters are being preserved a d are ava i l ab le f o r inspec t ion
by t h e NYS DEC upon request .
me r e s u l t s i d i c a t e t h a t the particulate emission
The
KVB71-71500-2007 D304 2-1
. Data mentioned i n Sect ion 4.1.23 and used f o r c a l c u l a t i o n s i n Appendix E.
A-146

Data used for c a l c u l a t i o n s i n Appendix E.
KL'8, 1Nt. 16006 SKYPARK BLVD. I R V I N E , C . A . 92714 (714) 250-6?00
C M P A W - LEHIGH PDRTLW.ID CEt iE t4 l L O t P T I D N - CMEhTON Nf W < I T ( S ) - KILN EXHAUST STACK TEST DATE - 11-8-84 TEST NO. - C C W i l A ' 4 C E 1 TES? S I T E - S A C K . .
.COAL* PCT BY UT MO:ES/LB-FUEL
HY2RDGEt.l 4.73 4.730(-02) SULFUR 2.66 9 -3: 3-04) O X f G N 5.81 1.816(-0?) NITHCGEN 1.26. 4.500(-04> ASH 16.15
CAK6ON 69.39 5.7e3(-02)
12606 .OD 9702.0
PCT 6'1 UDLLME CAKED4 D I O X I D E 16.10
, O M G E N 8.00 & F P N R 3 4 U X I D E 0 . 0 1 N1TROCEt.I 47.62 WATER 28.26
31.60 2). 76 32.04
28.24 2e.07
ACFK A T S Y F L I N G PLAYE 9 2 5 9 ON: FUEL FLOW AND COnEVS?I014 CHEYlSTRY 19??65.2 STACK VELOCITY 237043.9
A-147 m71-11500-2007 D304

--
12e12.00 9727.0
PCT Bi U 3 i L M E ' 1 6 . 1 0
7 .50 0 . 0 3
4 6 - 2 ) 30.10
(-1 42O2?3.6 32800.0
29.79 -0 .BO 0.376 0.840 122.7 14 .0
INCDIEL
31 .SB 27.49 32.11 27.87 30.10
ie~154 .s FUEL FLOW AND CUnSUSTION CHEMISTRY STACK V E L O C I T Y 2430Ei.8
A-140 NB71-71500-2007 D304

Data used for c a l c u l a t i o n s i n Appendix E. K V B , INC. iEC06 SKTPARK BLVD. IRVINE, C . A . 92714 (714) 250-6200
+++*+ti** PART1 CULATE MISSIONS DkTA REDUCTI OId PROGRAY ++++*++++
CRFAh'f - LEHIG'! PORTWdD CEPlENl L K A T I O t d - CE:$EtFON Nf Ui lT(S) - K I L N E?(HAUST STACK TES'! W T E - 11-9-84 TEST NO. - COtiPLIW4CE 2 TEST SITE - S'IACK
* * + * + * * * * + + * + * * s i FUEL ANALYSIS
* t O l L + PCT BY Ln CAkEDN 70.68 HYDRDtEN 4.83 SULFUR 2.40 OXYGEN 5.53 NITROGEN 1.30 ,
&SH 15.26
HIGH HEATING WLUE(ETU/LB) EPA 'F FACTDR'(DSCF/VETU)
.+* i *+* .* f+*t*~t+#
MDLES.'LB-FUEL 5.89U(-02) 4.E3@(-02) 7.5LIUI - 0 4 ) I .728(-03) 4.643<-04)
12e12.00 9727.0
PCT BY UDLVIE 14.30 7.80 0.07 48.03 29.80
K:LK FEED(GPn) TOTAL HEAT INPUl (K3TWHR) FUEL FLW<LE.'HR) MRWESRIC PRE5SL'DE(lN. HG) STACK &IS STATIC PREES<.lN H2O) NOZZLE DIAHE?ER(IN) PITOT TUEE C O E F F I t l E N l DUCT AREA AT SarlPLlNG P W d E ( S 0 . FT) PROBE LENGTH t n ) PROEE W T E R l A L
32P00. 0 29.79 -0.70 0,376 C.840 122.7 14.0
INCCNEL
31 .DO 27.12 31.70 27.62 29. eo
, 2234c3.0 175733.0
A-149 KVB71-71500-2007 D304

Excerpts f rom
REFERENCE 53 (SECTION 4.0)
S te iner , J., Mojave P l a n t ( K i h , Crusher, and C l i n k e r Baghouses)
and S te ine r Environmental Serv ices, Bakers f i e ld , CA, May 1985. Annual Compliance Test,, Report PS-85-469/P r o j e c t . 5451-85 , Pape
A-150

...
W
x u E aJ n -_ n 4 E
VI c c Y
3 V
V
L 0 Y-
u W vl
'CI E
.r
.r
v
m 7 - m
a
m c.- N
d
e c 0
u u 0) co c
U
0
u E
.C
- .r
E" m + m
v) I- d
v) W
3
a i v) W I-
W U
3 0 Lo LL 0
,s- LL
a
z 3 v)
..
n .
.. .I h O W N O O . . m w e-
.. h n d h . . m m h U e-
I
A-I51
I

U 0
I I
* Y
> m L u U L
U W CL Lo
.C
.C
c
I 1
m W 0
a. 0 .c U
c - .. II)
m - 2,
E U L 0
0
-I
L W 0 0 a L U Lo
c
a c
-
.. sa - d W m a 2, c) E
0 U
c L W Y
L 0 b.
a
U
X
U E W
e
.r
n n
E ?
E 0
I-, - m
E 0 I-, V W VI
7
E c
U W E 0
E .C
E" '. , -
-NO I
A-I52

. . . . . . . . ~. . , . . . . . . .
TEST 44 3 hpcbSreinrrtrr ironmnd Services - . ~ . ~ . . - - .LOCATION . &h ; ..-. . , . . . , . .. . .. . . ~ ,
.EMlSSION RATE DATA -- 6B°F .-
S tandard Temperature. St = 68'F; 29.92 I n c h e s Hg . . . . . . . . . , . . , . . . . . . . ... . . .
. . . . . . . . . .. ' 'XEQ RAT . . T e s t '1 '. . - T e s t . 3 -"-Average
XEQ FF . . . .
. . ... .. ENTER: R-17 V,,,td .. . .. ~ ~ ~ - v 5 . J / 1 7 Y
. . - . R-26 Qs ~. . #/63Z&'a/63 7.12 /RF3 759s
R-22 02% & 9 5 /n,o 9,75 . .
LAB DATA . . .. ..
F r o n t H a l f Wash. (9) O.rn7@7 9.Ooyq7 O-R-G38
Back H a l f Ca tch ( 9 ) 0. map7 O.M/3Y O'.n?Wf3 Mass F i l t e r (9) 0 - 0 @ 7 / 0,.72
o,yp .. .. .o-zq ~ . .. .. . . F r o n t H a l f S u l f a t e (mg H2S04) ..- . - -
Back H a l f S u l f a t e (mg H2s04) L 07 D, 57 /, 56 t$02 Catch (mg H;SO4) . .4%.4q P&ZY %,99
RESULTS
F-Fac to r 1 F i l t . P a r t i c u l a t e g r / d s c f 6 #.@26 @,&7/5 0.
T o t a l P a r t i c u l a t e g r / d s c f 0 D,&& 0.W20 D.0036-
T o t a l S u l f a t e g r / d s c f 11 0.m5 6.OM3 o m 5 0.OOoq T o t a l S u l f a t e lb /h r 13 o.& 0. u5 0. €4 0.72
503 PPm 14 0.2 0, / L 0.2 so3 l b /h r 15 0,VB a26 0 ,7@ 0. VB
502 SO2 SO2 SO2
F i l t . P a r t l c u l a t e lb /h r 7 Y.E.0 S,S3 377 T o t a l P a r t i c u l a t e l b / h r 10 5,Bp 3,27 5.a 5*00
PP, 16 /6.97 &a /7,a< l b /h r 17 3, Y 7 '3v. 92 w.<7 33.573 e31 o2 18 a7,75 z , 9 7 s , u 5 MOL 1 b/MHBtu
S lb/MMBtu
F i 1 t. P a r t i c u l a t e lb /HYBtu
D a t a used for ca lcu la t i ons in,Appendix E.
A-153 I

- 7 - TEST 4 3, 3
LOCATION CLhRff '
hpc &&rinr, Wmnmentd S C M C C S
EHISSlON RATE DATA -- 6BoF
5isrda;d Temperature, St = 68'F; 2 9 . 9 2 inches Hg .~
XEQ FF XEQ RAT ENTER: R-17 vm ~ - >
. S L U
R-26 Q, R-22 02%
LAB DATA
F r o n t H a l f Wash (9)
Back H a l f Catch (9) F r o n t H a l f S u l f a t e
Mass F i l t e r (9)
H202 Catch (mg H2S04)
RESULTS
F-Fac to r
F i l t . P a r t i c u l a t e g r /dsc f
F i l t . P a r t i c u l a t e l b / h r
T o t a l P a r t i c u l a t e g r / d s c f T o t a l P a r t i c u l a t e l b / h r T o t a l S u l f a t e g r / d s c f
T o t a l S u l f a t e l b / h r
503 1 b / h r
SO2 l b / h r
503 PPm
SO2 PPm
SO2 e3x o2
1
11 13 14
15 1 6
17 18
SO2 lb/MMBtu
S 1 b/MMBtu F i l t. P a r t i c u l a t e tb/MMBtu
Data used f o r c a l c u l a t i o n s in Appendix F.
A-154

Excerpts from
- .
A r l i ng ton , W. D., Lone S ta r F l o r i d a Holding, Inc . , Stack Tests f o r Pa r t i cu la te , SO2, NOx, and V i s i b l e Emissions, Report 810-
k&: EL, August 1985. .
s, Kiln 0 . outh F l o r i d a Environmental Services, Inc . , West Palm
A-155
I

Data mentioned i n Sect ion 4.1.25 and used for c a l c u l a t i o n s i n Appendix E.
A-I56 I

A-157

APPENDIX B
UNCONTROLLED T O T A L P A R T I C U L A T E E M I S S I O N FACTOR CALCULATIONS
B-1
I

Run I
0.te
T L W
2
8-26-75
101s
1.65
9.10(J1.481
1J64.5(481401
1088.4 (J8431)
1.144~0.5001
1.43s 10.6271
91.68(206.S4)
3
8-26-75
1435
2.60
7.42t14.3%
1043.5116847)
761.6126891)
1.602l0.7001
1.191 I O . 9601
100.37(221.27)
4
8-17-75
1050
1.54
8 . 50 I27 .I91
ll95.21422031
875.3(30906)
1.13010.911~
z.91111.27a1
LS2.84(316.961
5
8-27-75
1515
1.10
7.97 (26.151
1120.6(195101
719.9 1 2 i l 2 8 l
2.070(0.9081
1.146(1.373
139.68 IJO7.941
B-2 1

lunl 4
8-21-15
l l o o 7.98 (26.18)
1.64
1 4 7 6 . a ( s a m i
1174.1 (414611
0.041 (0.0191
0.055 (0.024)
I . 87 ( 8 . 5 1 )
/ \ B-3

3 -
B-4

naacao-n 0-c - 0 n r n Q o r - w - 0 O ~ o 0 0 0 r n - n o w . . . . . . . . . . . .
a
1 . 1 o m m m m n nnn . . .
cncl corn ... 00- -4 I-- ,--
3 I a
n a D
5 . I Y
C 4
" .
.-(
0 4 0
' . ,
B-5

n I 4 0 d . c n
0 4
2 Y 0 0 c Y
0
4
3
g
a
L d . > U 0 Y c I
0
4 U
>. P m P C 4
T: 3
: 2 Y 0 d
.O m . 4 4
n: i
C 0
B-6
.e m . r n n a a

c e
c: 0 000000 000 : .. . O I C I d O ddd . . . . . . . . . . I
1 n
c o e ~ d a n m e a .I
e. -0C1o.ln . .me -.Ic 0 n . . . . . . . . . d 01000- d 1 - 4 A
a
B-7

.1
0
Y 0 c LI
. 0 4
I B-8

'I- -
.. ~~
I
L
. . . ..
7 5 - 11
9 . IO I - I9 11. 12 I - 10 IS. 14 5 - 11 IS. 16 5 - 11
I T . 1 1 5 - P 19. IO 5 - 26
A"..
e.1 16.0 . I& U . J
C M I 16.0 12s u.1 a.1 II.75 12s U.I e.1 16.0 12s 13.1 CMl 16.0 115 U . 6
CMI 16.1 116 11.1
CMl 16.5 iu sa.1
16.4 116 J J . 2
B- 9
n 74 I5 76
76 71 n
75.7
. IU ,146
. I46
,146
,146 . IU
,146
. Id6

B-10
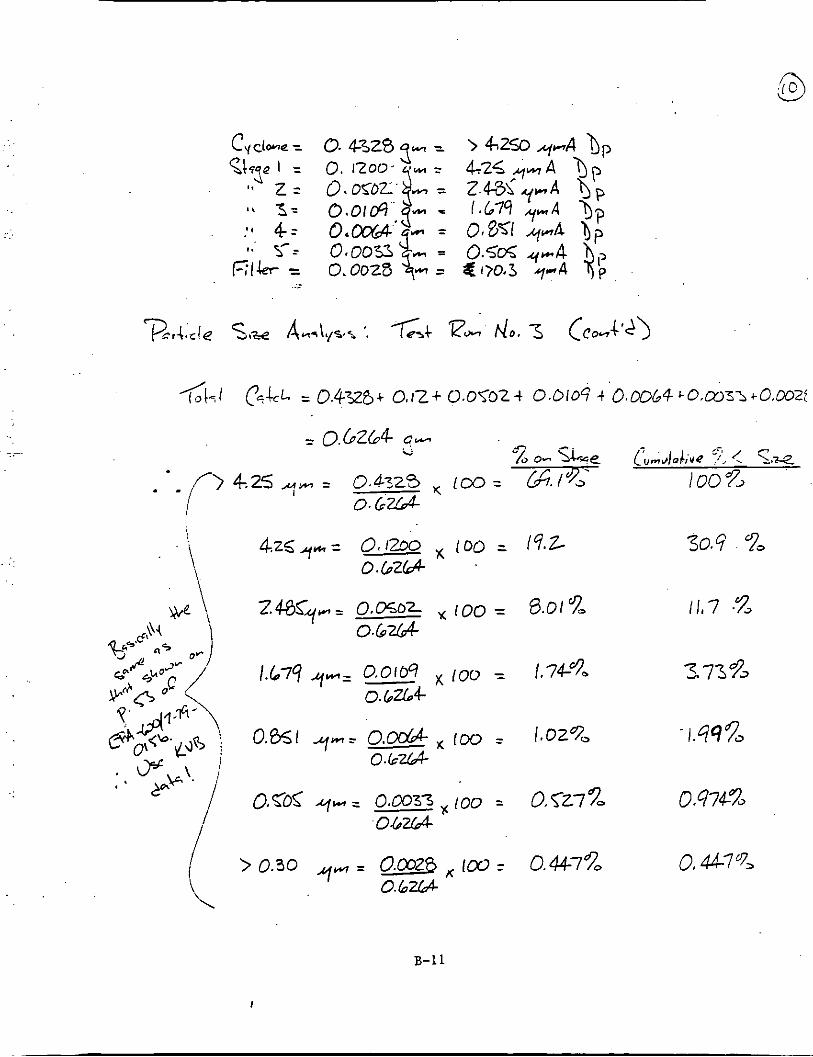
B-11

B-12 I
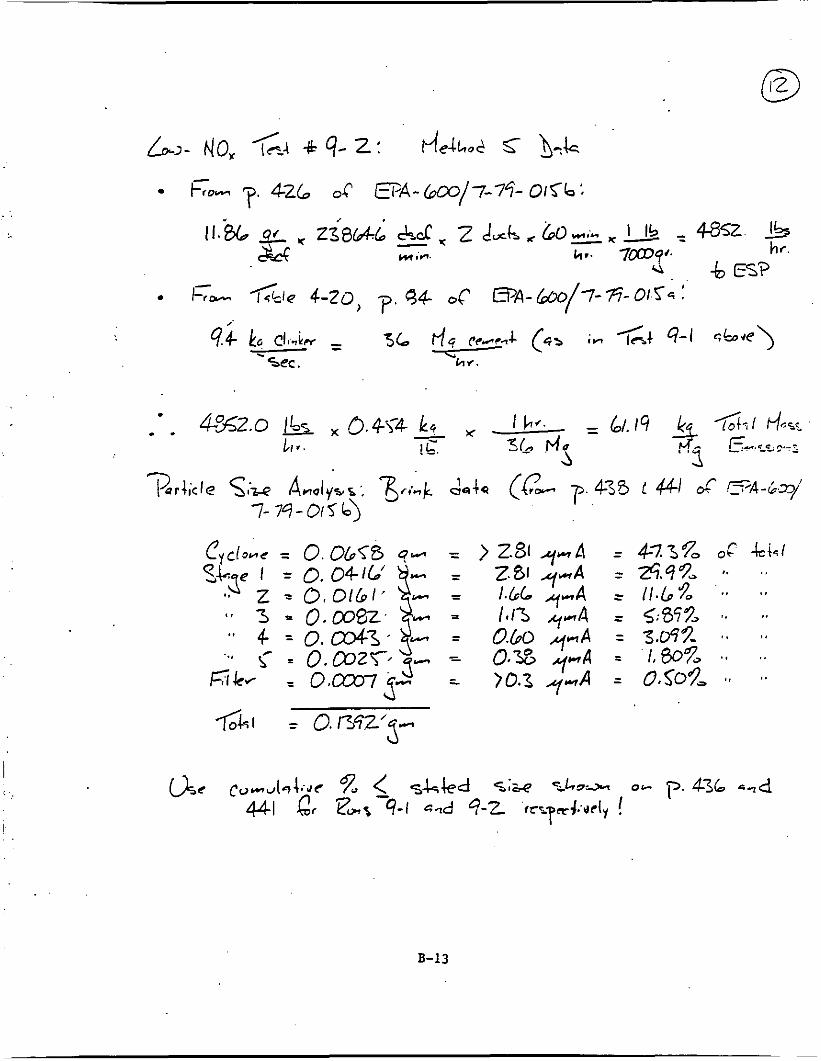
B-13

B-14

,
4 B-15

.
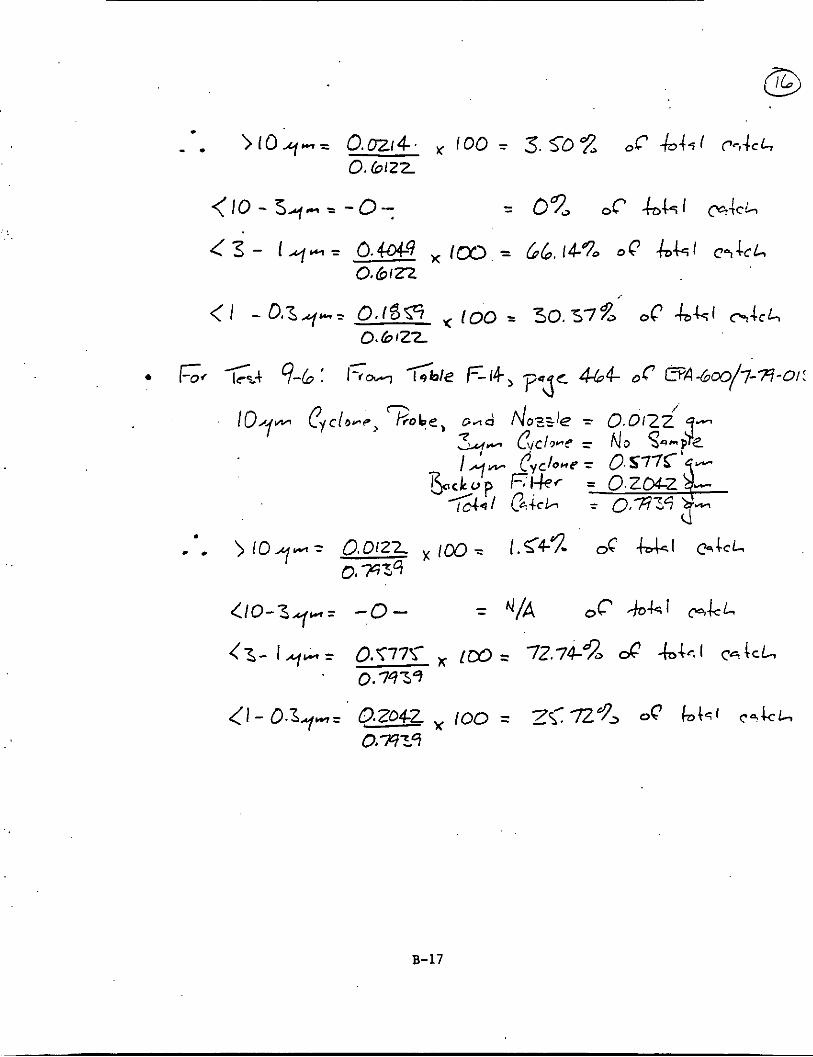
B-17

67.68 10-8 26U 12.1 98.7
71.7L 10-9 1>91 11.3 99.1
77.78 10-12 I€&& a.a 99.7
81.M 10-13 1960 1.8 99.7
104 m. 4 Irrsk'& UI 1.1 11.3 11.1 79.7
. 79.6 lab 1.0 10.6 11.3 ?*.* ua 7.8 10.1 11.0 7*.*
we.; 1Dy(lL 1w) 7.8 10.7 11.7 104
10-12 10-U
B-18

A P P E N D I X C
TOTAL PARTICULATE E M I S S I O N FACTOR CALCULATIONS FOR CONTROLLED K I L N S
c- 1
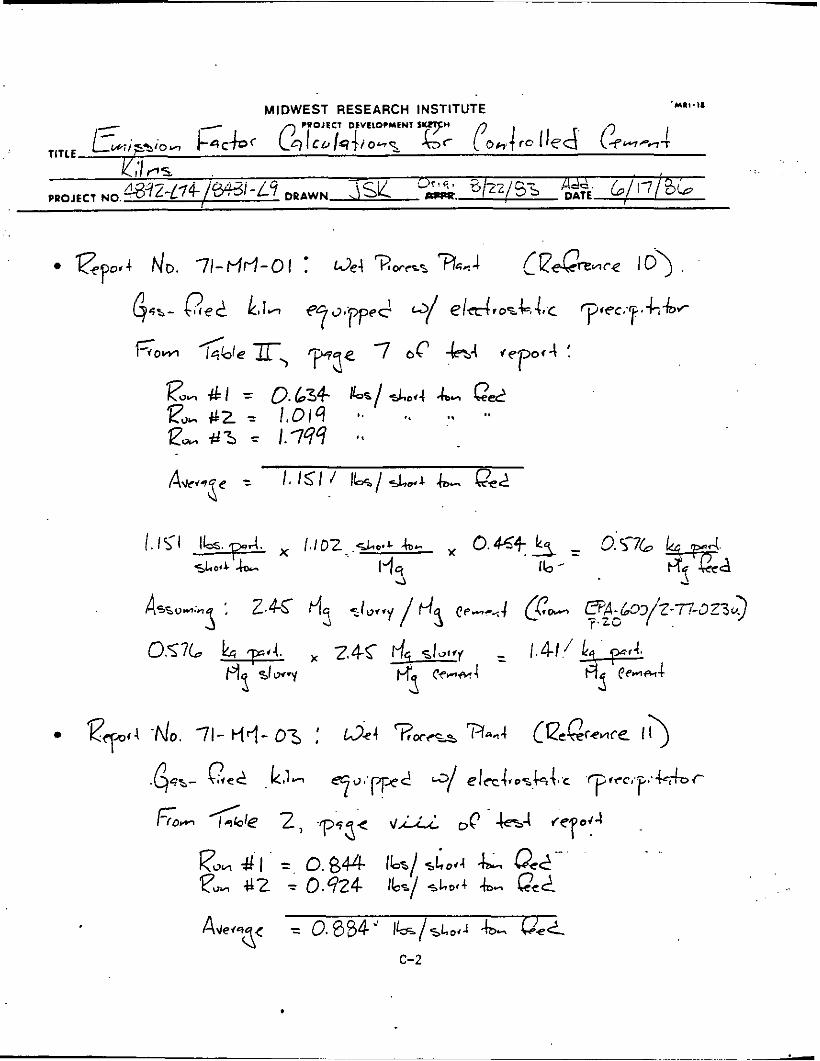

c-3

c-4

I!xllzu.r C L P"?:I**l,:c €:!,,to, t:;:
.F. ;.:r:.: s:r r r r . E?). m. a c a oY77) Irl..r.~~: - - - - mn.1 w: 1 1 - 8 331 139.100' .DYO 1.17 a
3 - 10 Iy 140.7W ,009 1.31 I - 9 aai 149.100 .osa a.n 16.14
1
a1a.000 11.70 I". .
10110"1., PnCIpIf . IOI
ai0 lS1.900 .MI 6.1b 41.14
6 - l a so7 136.700 ' .MI 6.00 I 41.90
11 6 - 10
as i - i i ire zs~.soo .oaz 4.61 iq.sa
_. .a
l a b A,.. II.17
-
?.ad TRr - 11.1 11.0 17.1
1a.o
ia.71 ia.71 19.10
19.00
13s 135 13s
131
1s 131 isa
iaa
I W.C.. - 11.;
u . 3 33.1
ll.6
ia.2. ia.2 13.3
u.1
c-5
*. IC? .
n.s -
0.1s 0.6Z
0.11
. - o.as
0.11 0.J7 0.10
O.&b
. . .

91.6
C-6

I : .
I !
I.
. .
PU6 10-6 4 5
PU? 1-7 4 5
PU15 1-15 4 5
AV.. PIn # 4 AT.. Kla # 5
P+/!O !h!ll 2 3
PUll 1-11 2 3
PUlZ 10.12 2 3
I... Kiln # 2 IV . . Kiln # 3
3- 1 27.6 3.1 27.3
3.3 29.9 3.3 27.5
3.4 28.3 3.2 26.8
m n k.2 _._- 4.6 32.9
4.1 29.3 4.0 30.5 4.0 30.1 3.9 52.5
- -. - 5-
0.2 0.2 0.2 0.2 - - - -
- e.
0.1 2.0 0.2 1.0
0.1 2.2 0.2 1.1
0.2. -
c-7

C-8

I :
4.5
n.ax n
n . a *78 1.001
lW 1.51
J J .
c-9
' !

c-10


3
c-12

,.. ,A .I.. *., 4.3 Y.' ,.D ... P . 1
.A ... .) 1-1 .A M I.. 7.3 M ,.e 1.2 M ..I ... Y O .A ,.I 1x0 ,.4 ... L l D
C-13


C-15

' 129617
UUK
22.8
I

C-17

c-18

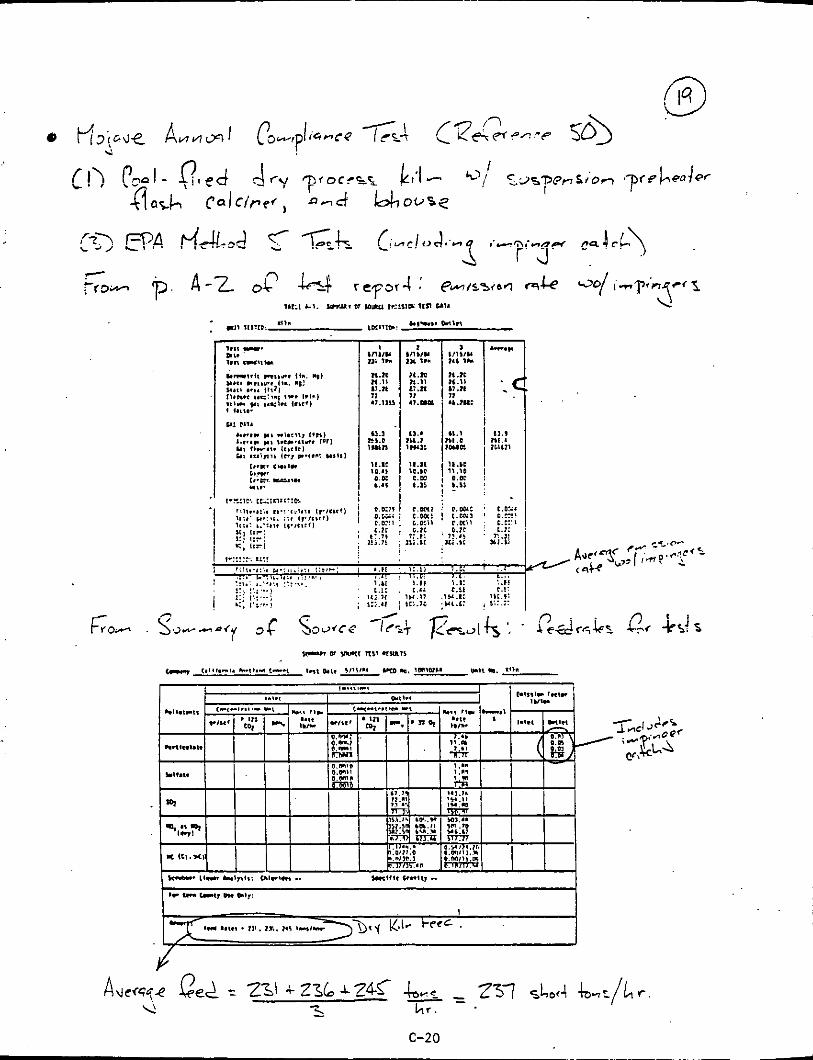
c-20

c-21

c-22

C-23

. .
C-24

I L
I I I E I
A P P E N D I X D
TOTAL PARTICULATE E M I S S I O N FACTOR CALCULATIONS FOR CONTROLLED COOLERS, M I L L S , A N 0 CRUSHING/SCREENING

MIDWEST RESEARCH INSTITUTE MIl.18

e
.. .
APPUmXX B
P L W Z PpoOf)(TfIW W A
mu 1/2S 8/26 1/27 2/21 1/29 11/4 ll/S
hoduc+ian -=/0.y 741 533. 961 1031 1064 1063. 995
D-3

Table 3
4 S
1-21-11 1-21-75
lloo . ' 1SlS
1 ~ 9 1 1 2 6 ~ 1 1 1 1.26123.811
1.64 1.31
1416.2IS21241 1342.5l474<
1114.21414611 1049.7(3701
0.04310.0191 0.0~410.011
o.oss(o.o24l 0.04318.01!
3.17~1.S31 2.14lb.04)
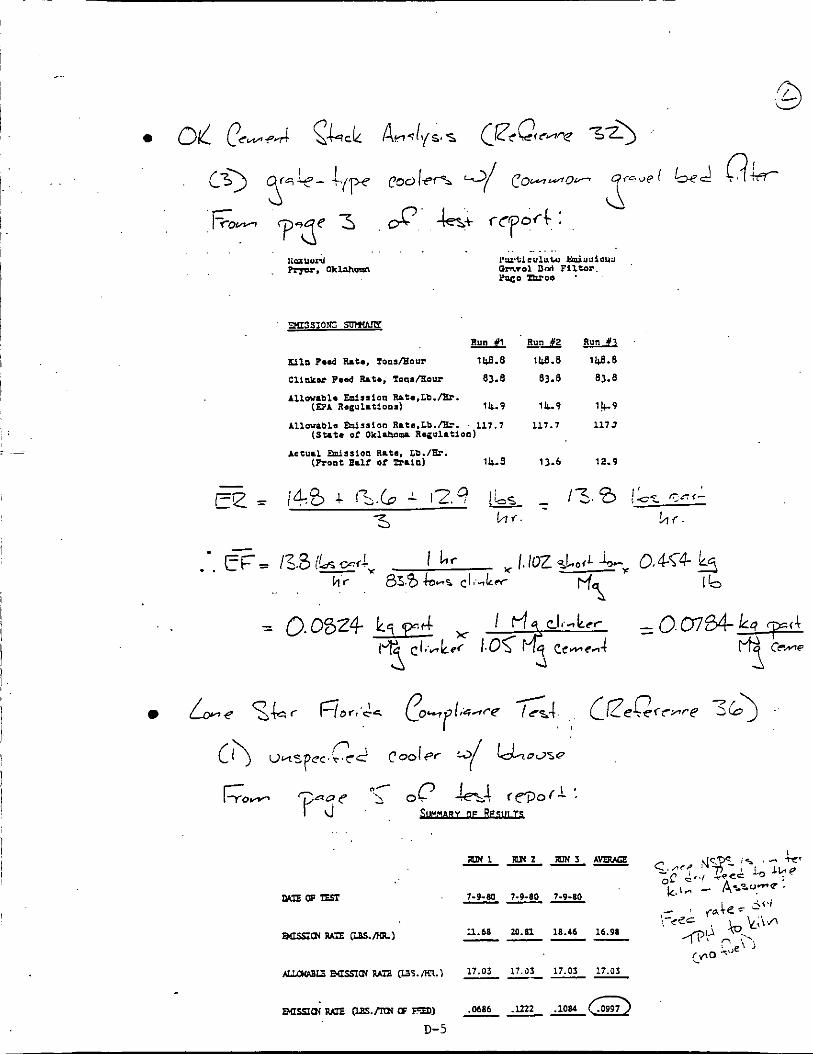

Run I 2 . 7
Run I1 1.0 Run 111 1.0
D-6

0
D-7

G o -


7
D-10

D-11


D-13
I

. . . .
- . . . . . . . .
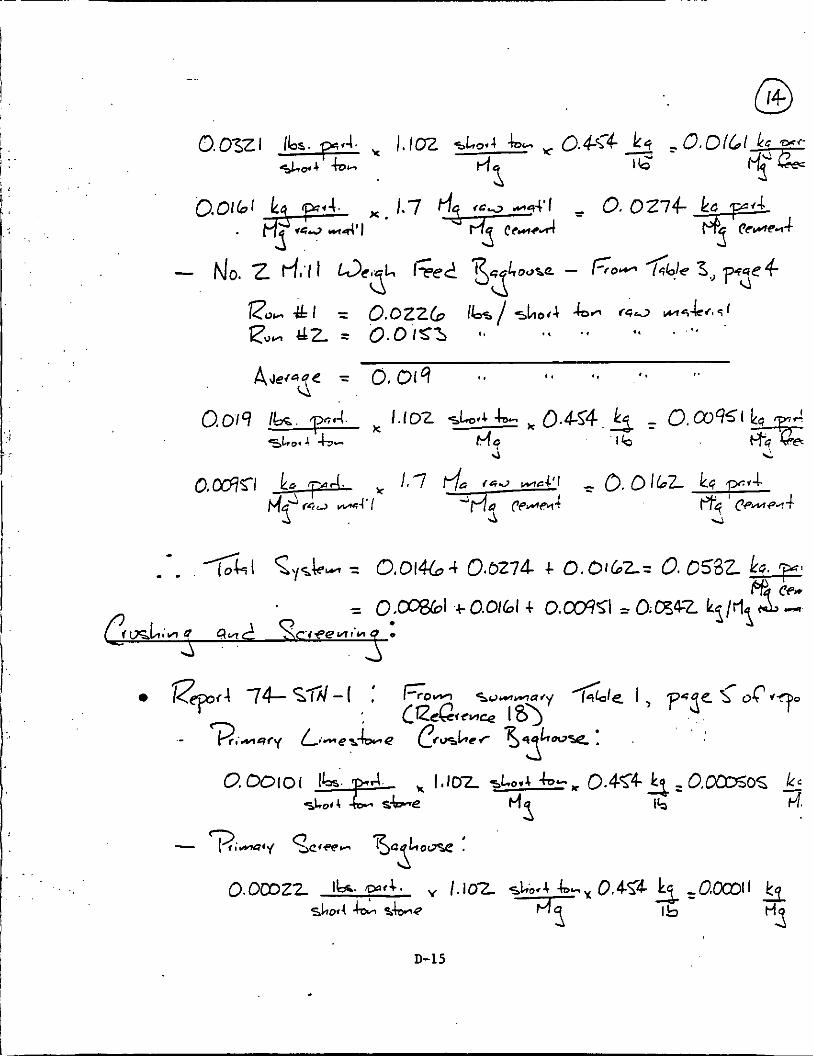
D-15
.

D-16

.. , . , I
I
APPENDIX E
COMPUTER PRINTOUTS OF S P L I N E ANALYSES FOR PARTICLE S I Z E D I S T R I B U T I O N S
E-1 I

RESULTS OF SPLINE ANALYSES FOR REFERENCE 2 1 (SECTION 4.0)
McCain, J. D., Eva lua t ion o f Rexnord Gravel Bed F i l t e r , EPA-600/ 2-76-164 (NTIS w 255 095) , U.S. Environmental P r o t e c t i o n Agency, Research T r i a n g l e Park, NC, June 1976.
I
E-2
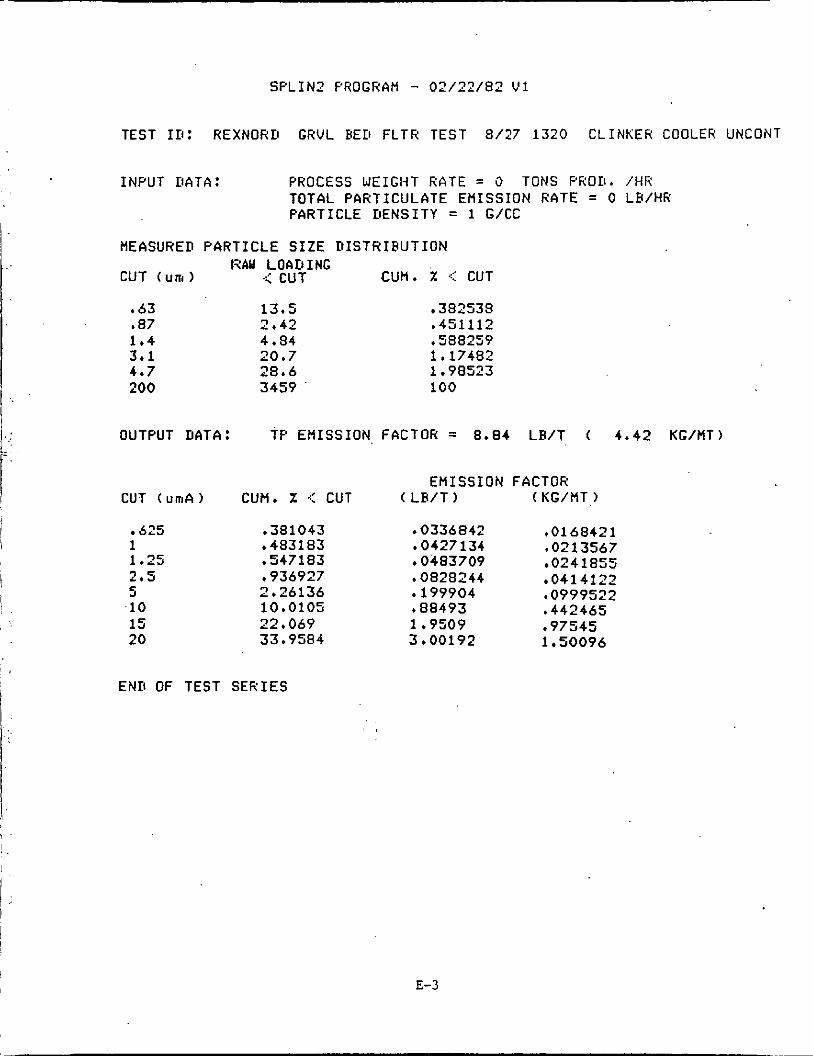
S P L I N 2 PROGKAfl - 0 2 / 2 2 / 8 2 '21
!
TEST I D : REXNORD GRVL HE11 FLTH TEST 8/27 1320 CLINKER COOLER UNCONT
INPUT DATA: PROCESS WEIGHT RATE = 0 TONS PHOII. i H R TOTAL PARTICULATE EMISSION RATE = 0 LB/HR PARTICLE DENSITY = 1 G/CC
MEASURED P A R T I C L E S I Z E D I S T R I B U T I O N RAbJ LOADING
CUT (uni ) .< CUT CUM. X <: CUT
.63
I . 4 . a7 _ . . 3.1 4.7 200
13.5 2.42
20.7 28.6 3459
4.94
382538 ,451112
1.17482 ,588259
1. 913523 100
OUTPUT DATA: TP EMISSION. FACTOR = 8.84 LA/T ( 4.42 KG/MT)
EMISSION FACTOR CUT ( u m A ) CUM. Z < CUT ( L B / T ) (KG/MT )
.3aio43 .033684? .oi 613421 625 ,0213567 1 .4a3i 83 ,0427134
1.25 .547ia3 ,0483709 024 1855 2.5 .936927 .oa28244 04 14122
2.26136 + 199904 ,0999522 10 10.0105 . 88493 e 442465 I= J
15 22.069 1.9509 * 97545 20 33.9584 3.00192 1 50096
END OF TEST SERIES
E-3

S P L I N 2 PROGRAM - 0 2 / 2 2 / 8 2 V I
TEST I D : REXNORD GRVL RED FLTR TEST 8 / 2 8 0950 CLINKER COOLER UNCONT.
INPUT DATA: PROCESS WEIGHT RATE = 0 TONS PROD. /HH TOTAL PARTICULATE EHISSION RATE = 0 LH/HH PARTICLE DENSITY = 1 G/CC
HE4SIIRETl P4RTICLE SIZE Tl!STRIRljTION RAY LOADING
CUM. X .: CUT CUT (urn ) < CUT
.63
1.4 3.1 4.7 200
t 87 4.65 .48 1.11 5 . 2 9 . 2 2737
168622 186029 22628 414848 748466 00
OUTPUT DATA: T P f M I S S I O N FACTOR = 8.84 LF/T ( 4.42 KG/MT)
E M I S S I O N FACTOR CUT ( u m A ) CUM. X < CUT ( L B / T ) (KG/MT )
625 1 1.25 2.5 5 10 15 20
. I68274 ,0148754 + 194842 017224 -213681 *0188894 .330523 -0292182
902135 0797488 6.87334 607604 19.1685 1 69445 32.3749 2.86194
7.4377E-03 8 6 1202E-03 9,44469E-03
01 46091 ,0398744 303802
e847246 1 t 43097
END OF TEST S E R I E S
E-4

TEST 111: HEXNORD GKUL BED FLTR TEST 8/28 1105 CLINKER COOLER UNCONT.
INPUT IlATA: PROCESS WEIGHT RATE = 0 TONS PROD, /HR TOTAL PARTICULATE EMISSION HATE = 0 LfVHR PARTICLE I lENSITY = 1 G/CC
HEASURED PARTICLE S I Z E D I S T R I B U T I O N
CUM. X .: CUT R A U LOADING CUT (urn 1 < CUT
.63 3.84
.E7 .52 1.4 2.66 3.1 7.32 4.7 11.1 200 4252
.09976?8 . ioi9ia
.i6409a ,346896 ,606367 100
OUTPUT DATA: TP EMISSION FACTOK = 8.84 LB/T ( 4.42 KG/f lT)
CUT ( u n i A ) CUM. X < CUT
625 .OS96615 1 116167 1.25 .146178 2.5 .273728 5 ,738515 10 6 27328
20 32.0187 15 1~1,5191
EMISSION FACTOR ( L R / T ) ( K G ~ M T )
7 + 92608E-03 .0102692 .0129221 -0241976 0652847 554558
1 -63709 2 + 83045
3.96304E-03 5.13459E-03 6.46107E-03 +0120983 ,0326424 ,277279 .E18544 1.41522 ,
END OF TEST SERIES
E-5

TEST
INPU
I D :
11 A
SPLIN~ PROGRAH - 02/22/82 v i
REXNORD GRVL PEL1 FLTR TEST 8/28 1440 CLINKER COOLER UNCONT.
PROCESS WEIGHT RATE = 0 TONS PROD. /HR TOTAL PARTICULATE EHISSION RATE = 0 LH/HR PARTICLE DENSITY = 1 G/CC
MEASURED PARTICLE S I Z E D ISTRIBUTION
CUT (uni ) < CUT’ CUM, X .[ CUT fiAW LOAIiING
.63 $87 1.4 3 .1 4 . 7 200
13 .5 2 .64 3 .26 6 . 4 4 9 . 3 2098
; 63287 ,755631 ,909457 1.21136 1 64734 100
OUTPUT DATA : TP EMISSION FACTOR = 8.84 LE/T ( 4 . 4 2 KG/).IT)
EMISSION FACTOR CUT (uniA ) CUM. X < CUT ( LB/T ) (KG/HT )
,625 629739 1 .a01271 1 .25 . a n 0 1 5 2.5 1.08396 5 1.86134 10 8.43077 is 20,0571 20 32.1942
.0556689
.0770861 -0958217
t 0708324
4 164543 ,745281
2 e 84597 1 -77305
,0278345 ,0354 162 ,038543 04791 08
.0822714 437264 ,836523 1.42298
END OF TEST SERIES
E-6

S P L I N 2 PROGRAM - 02/22/82 V 1
TEST I D : REXNORD GRVL BEL1 FLTR TEST 8/29 1015 CLINKER COOLER UNCONT.
INPUT DATA: FHOCESS WEIGHT RATE = 0 TONS PROKI. /HR . . TOTAL PARTICULATE EHISSION RATE = 0 LH/HR PARTICLE I l E N S I T Y = 1 G/CC
MEASURED P A R T I C L E S I Z E D I S T R I H U T I O N RAW LOADING
CUT (uni ) < CUT CUM. X .:: CUT
63 .87 1.4 3.1 4.7 200
5.89 2.04 2.31 7.44 12.2 2711
OUTPUT DATA: TP EMISSION FAC OH = 8.84 LB/T ( 4.42 KG/M
EM.ISS1ON FACTOR CUT (UIIIA) CUM. X <: CUT ( L B / T ) ( KG/MT )
.625 .24942 ,0220488 .0110244 1 .348ao8 0308347 .0154173 1.25 387148 0342239 ,017112
5 1.3178 e 116493 .OS82467 10 7.79999 689519 .34476 15 19.a807 1.75745 ,878725 20 32.5291 2 87557 1 43778
2.5 ,563013 .0497703 ,0248852
END OF TEST S E R I E S
E-7 I

SPLIN2 PROGRAH - 02/22/82 V 1
TEST I D : REXNORD GRVL REI1 FLTR TEST 8 / 2 9 1400 CLINKER COOLER UNCONT.
iiripui i jATA; PROCESS WEIGHT KATE = 0 TONS PROD. /HR TOTAL PARTICULATE EHISSION RATE = 0 LB/HR PARTICLE DENSITY = 1 G/CC
NEASUKED FnRTitiE SIZE DiSSRiBuTiON
CUH. Z .:: CUT RAW LOADING < CUT CUT (urn )
63 1.43 .87 '. 42 1.4 2.42 3 .1 9.34 4.7 1 4 . 4 200 2131
066234 1 ,0856874 197776
,630382 1.29735 100
OUTPUT DATA: TP EMISSION FACTOR = 8.84 LB/T ( 4.42 K W H T )
CUT (umA ) CUH. Z < CUT
,625 1 1.25 2.5 5
6 0660233 108576
.162436
.451709 ~ ..
1.53142 A ,99977
15 21.502 20 33.9387
EMISSION FACTOR ( LH/T ) (KG/MT )
5.83646E-03 2.91823E-03 9.59815E-03 4.79907Ey03 ,0143593 7 17967E-03 ~ 0 3 9 9 3 1 a01 99655 t 135378 0676888
1 + 90078 950389 3,00018 1 50009
.795579 39779
END OF TEST SERIES
E-8
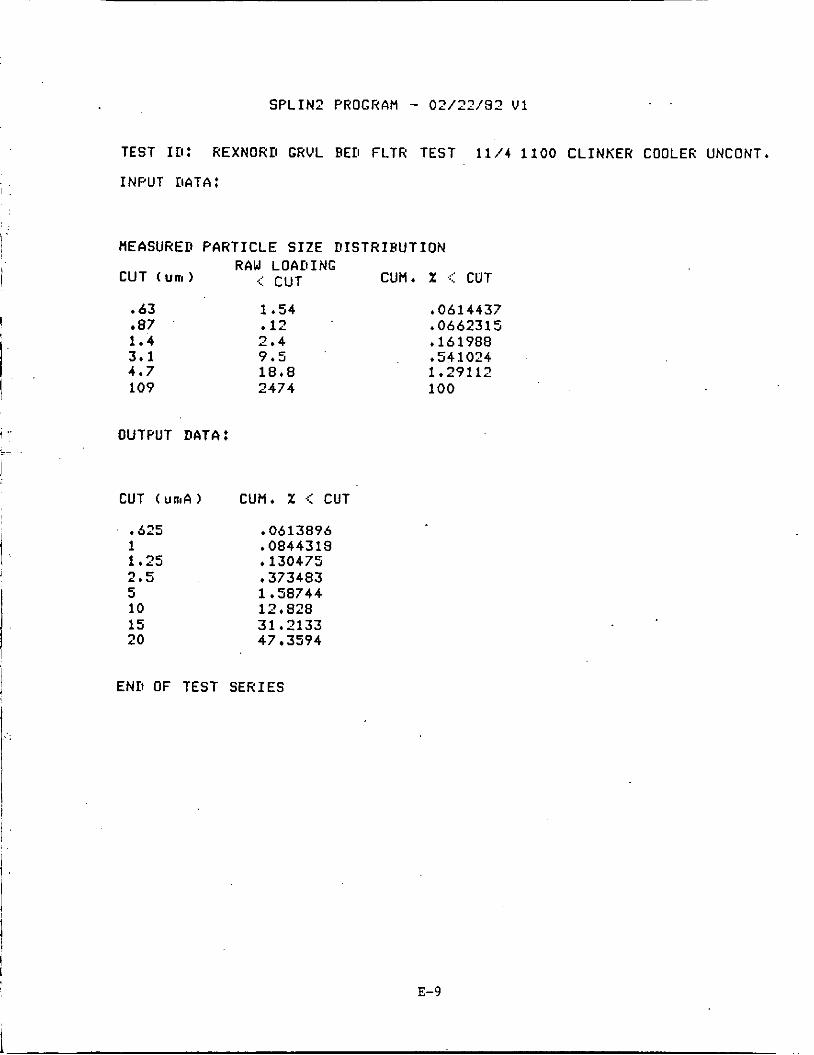
S P L I N 2 PROGRAM - 02/22/83 U1
TEST I D : REXNOHD CRUL RED FLTH TEST 11/4 1100 CLINKER COOLER UNCONT.
INPUT DATA:
flEASURED PARTICLE S I Z E U I S T R I R U T I O N RAW LOADING
CUT (urn ) < CUT CUM. % .:: CUT
.63 87
1.4 3 .1 4 . 7 109
OUTPUT DATA:
1.54 .12 2 . 4 9 . 5 18.8 2474
CUT (umA ) CUM. % .: CUT
.5?5 .0613896 1 .OS44318 1.25 t 130475 2.5 ,373483 5 1 ,58744 10 12,828 15 31 . a 3 3 20 4 7 3594
END OF TEST SERIES
,0614437 .0562315 ,161988 ,541024 1.29112 100
E-9

S P L I N 2 PROGHAH - 02/22/82 V I
T E S T In: REXNORKI GRVL BEL1 FLTH T E S T 1114 1430 C L I N K E R COOLER UNCONT.
IMPUT I f A T A t
RAW L O A D I N G C U T (UIII ) < C U T CU'H . Z .::I CUT
. 63 87 1.4 3.1 4.7 200
1 e47 t 53 3.7 10.7 14.9 1941
OUTPUT DATA:
CUT ( u a A ) CUM. X < CUT
.625 .0742731 1 .13809
2.5 .620457 1;25 + 229001
5 10 15 20
1 84401 9 5x88 21 ,8592 34 034
E N D OF T E S T S E R I E S
,0745323 .lo1404
,931517
100
.2a9003
i.5869a
E-10

J '
S P L I N 2 PROGRAM - 02/22/82 V I
TEST I D : HEXNORD GRVL BE11 FLTK TEST 11/4 1435 CLINKER COOLER UNCONT,
INFUT DATA:
NEASURED PARTICLE S I Z E D I S T R I B U T I O N
.63
.87 1.4 3.1 4.7 200
OUTPUT rl T
I
1.25 2 . 5
10 15 20
c .I
HAW LOADING .: CUT CUM. X <: CUT
1.52 67
2.53 8.53 12.4 1791
CUM. X <: CU7
.0830518 15093 .217659
1.65195 9.10763 21.4794 33 + 8098
,540163
END OF TEST SERIES
0836705 ,120552 + 259919 ,729365 1.41194 100
E-1 1,

S P L I N ? PROGRAM - 02/22/32 V I
TEST ID: HEXNOHII GHVL BE11 FLTR TEST 11/5 0935 CLINKER COOLER UNCONT,
INPUT DATA:
MEASURED PARTICLE SIZE D I S T H I R U T I O N
-63 .87 1.4 3.1 4.7 200
1.37 .23 1.12 14.5 9.11 2384
OUTPUT DATA:
CUT (urn&) CUH. Z <: CUT
+ 625 05674 1 0743156 1 .25 .0957273 2.5 ,479315 5 1 ,27271 10 7.41557 ?5 19 : 3026 20 31.9932
END OF TEST S E R I E S
0568387 ,066391 11 2848 ,714425 1 09239 100
E-12 I
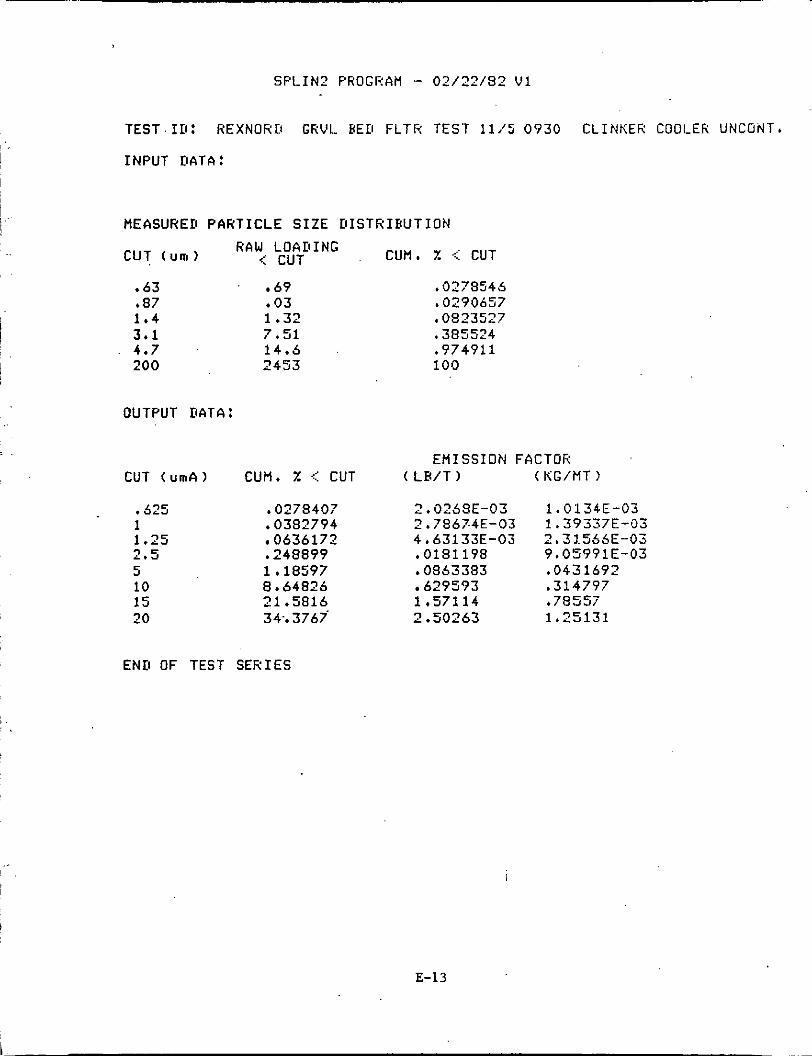
SPLIN? PROGRAM - 0 2 / 2 2 / 5 2 VI
TEST.111: HEXNORU GR'JL HE11 FLTR TEST 11,'s 0730 CLINKER COOLER UNCONT,
INPUT D A T A :
MEASURED PARTICLE SIZE DISTKIHUTION
CUM. X .::: CUT HAW L O A D I N G CUT (UIII ) < CUT
.63
1.4 3.1 4.7 200
. a7 69
.03 1.32 7.51 14.5 2453
.0278545 ,0290657 ,0823527 .385524 .974911 100
OUTPUT DATA:
EMISSION FACTOR CUT (UIIIA) CUM, 7: c: CUT ( LB/T ) ( K G / M T )
. 625 .0?7a407 2.025SE-03 1,0134E-03 1 .0382794 2.7S574E-03 1.37337E-03 1.25 0636172 4,53133E-03 2,31555E-03 2.5 .249899 .018119S 9.05791E-03 5 10 15
~~~~~ ~
-0853393 529593
1.57114
~~
.043 1692
.314797 ,78557
20 34.. 3767' 2 .SO263 1.25131
END OF TEST SERIES
.-
I
I
E-I3

SPLIN? PROGHAH - 02/22/82 V 1
TEST I D : REXNORLI GRVL BED FLTR TEST 1115 1415 CLINKER COOLER UNCON'T,
INPUT IlATA:
ElEASURED PARTICLE S I Z E D I S T R I B U T I O N
63 * 87 1.4 3.1 4 ,? 200
11.2 4.37
OUTPUT DATA :
CUT ( u r A ) CUM, ?: <: CUT
.625 ,238355 1 ~
1.25 2.5 5 10 15 20
,35747 388784 ,524195 1.12431
19.4183 7.30849
. 32 t 297
END OF TEST SERIES
.240?? * 334742 ,405904 577252
100 ,953497
E - 1 4

i i
i I i
I
I I j
I I
SF'LIN? F'ROGRAfl - O2/22/92.V1
TEST ID: REXNORD GRVL BED FLTR TEST 11,'s 1415 CLINKER COOLER UNCONT.
INPUT DATA: , ,
HEASUHED P A R T I C L E S I Z E D I S T R I R U T I O N RAW LOADING
CUT (uno) .:: CUT CUfl. Z .::I CUT
63 .87 1.4 3.1 4.7 200
OUTPUT DATA:
CUT (unaA)
,625
14.4 3.42 4.02 10.5 19.7 4232
UM. X c::
.334103 1 .442371 1 .?5 ,485414 2.5 .641642
10 7.96363 15 19.9808 20 32 * 525
5 1.41512
END OF TEST S E R I E S
.335123
.415953 509787 .757212 1,21705 100
UT
I
E-I5

SPLIN2 PROGRAH - 02/22/82 ‘21
TEST I D : REXNORD GRVL BED FLTR TEST 8/25 1440 CLINKER COOLER CONTR,
INPUT DATA: PROCESS WEIGHT RATE = 0 TONS PROD. /HR TOTAL PARTICULATE EMISSION HATE = 0 LB/HR PARTICLE DENSITY = 1 G/CC
MEASURED PARTICLE SIZE DISTRIBUTION RAW LOADING
CUT (urn ) CUT CUM. % .: CUT
.58 1.49
.82 96
2.9 4.41 4.4 4.83 6.2 2.9 10.1 2.57 14.3 2.77 200 2.89
1.35 2.13
5.97195 9 + 81964 18.3567 36 0321 55.3908 67.014 77 3146 88 4168 100
OUTPUT M T A : TP EHISSION FACTOR = ,284 LBIT ( ,142 KG/MT)
EMISSION FACTOR CUT ( URIA ) CUM. ‘ X < CUT ( LB/T ) (KG/MT )
625 1 1.25 2.5 5 10 15 20
6.6775 0189641 9.48205E-03 12.805 0363661 ,0181831 16.8045 0477249 a0238624 31.4062 0891 936 +0445968 60 0893 170654 -0853268 77.207 .219268 109634 a9.6819 + 254697 ,127348 96.1154 ,272968 -136484
I
END OF TEST SERIES
E-16

I- 1 I , ! I i
S P L I N 2 PROGRAM - 02/22/92 V 1
TEST I D : REXNOKD GRVL BED FLTH TEST 8/25 1440 CLINKER COOLER CONTH.
INPUT DATA: PROCESS WEIGHT RATE = 0 TONS PROD. /HH TOTAL PARTICULATE E H I S S I O N HATE = 0 LH/HR PARTICLE DENSITY =. 1 G/CC
hEASUHED PARTICLE S I Z E D I S T R I B U T I O N
CUh. X .: CUT RAW LOADING
<: CUT CUT (una )
.58 92 1.35 2.9 4.4 6.2 10.1 14.3 200
1.32 .15 1.56 3.07 1.76 .9 .45 2.74 2.79
8 9s522 9.97286 20.5563
53.3243 59.4301 62 + 4831 91 e0719 -. 100
41.384
OUTPUT DATA : TP EMISSION FACTOR = ,284 LB/T ( .142 KG/HT)
EMISSION FACTOR CUT ( u r A ) CUH. i! .: CUT ( L B / T ) ( KG/MT 1
-625 9.10535 1 13.2698
2.5 37.1069 5 JJ. 955 10 63 5517 15 83,2171
1 .25 18.4785
cc
20 94. a029
END OF TEST SERIES
t 0258592 .0376862 -052479
,158912
236336 .26924
105384
.la0487
-01 29296 .0188431 .0262395
079456 1 .0902434
.13462
,0526918
,118168
I E-i7 ~

S P L I N 2 PROGRAM - - 0 2 / 2 2 / 8 2 V 1
TEST I D : HEXNORTI GRVL BED FLTR TEST 8/26 1119 CL INKER COOLER CONTR.
INPUT DATA: PROCESS WEIGHT RATE = 0 TONS PROD. /HR TOTAL PARTICULATE E H I S S I O N RATE = 0 LB/HR PARTICLE EIENSITY = 1 G/CC
HEASURED P A R T I C L E S I Z E D I S T R I B U T I O N RAW LOADING
CUT ( UKI ) < CUT CUH. Y. CUT
.53 ,82 1.35 2.9 4.4 6.2 10.1 14.3 200
21 -86 1009 94 4.71505
3.36 18.4912 4.21 35.7524 5.97 60.2296 3.55 74.7848 2.19 83 7639 1.57 90.2009
, 2.39 100
OUTPUT DATA: TP EMISSION FACTOR = ,284 LB/T ( .142 KG/HT)
E M I S S I O N FACTOR CUT ( u n l A ) CUM. Z .: CUT ( L B / T 1 (KG/MT )
-625 1,30917 1 9.01402 1.25 15.7058 2.5 3 1 1306 5 66.2842 10 83 6507 15 90 9626 20 94 9789
3.71804E-03 + 0255998 0446046
t 0884 11 188247 237568
.a58334 t 26974
END OF TEST S E R I E S
E-1 8
1 8S902E-03 01 27999
,0223023 ,0442055 + 0941236 11 8784
+129167 13487

S P L I N ? PROGRAM - 02/22/82 V I
TEST I D : REXNOHD GRUL RED FLTH TEST 8/26 1124 CLINKER COOLER CONTR.
INPUT DATA: PROCESS WEIGHT HATE = 0 TONS PROD. /HH TOTAL PARTICULATE EHISSION RATE = 0 LB/HR PARTICLE DENSITY = 1 G/CC
HEASURED P A R T I C L E S I Z E D I S T R I B U T I O N HAW LOADING
CUT (urn ) < CUT CUH. % .:: CUT
.58 82
1.35 2.9 4.4 6.2 10.1 14.3 200
.33 - 7 1 2.33 5.46 6.45 4.47 3.06 2.24 3.9:
1.14345 3.6036 11.6771 30.596 52.9453 68.4338 79.0367 86 t 7983 4 A A A""
OUTPUT DATA: TP EMISSION FACTOR = ,584 LB/T ( e142 KG/HT)
E H I S S I O N FACTOR CUT (UIIIA) CUM. :! e: CUT ( L B / T 1 ( KG/t lT )
625 1 4989 1 6 + 08288 1.25 10.0044 2.5 25 5287 5 ' 59 2083 10 78.8946 15 57.7345 20 92,7485
4 e 25689E- 0172754
.0284 126
.0725014 + 168152 e224061 249166
.263406
E N D OF TEST SERIES
E-19
-03 2,12844E-03 8.63769E-03 -01 42063 .0362507 .0840758
,124583 .I31703
e11203

S P L I N ? PROGRAM - 02/22/32 U 1
TEST I D : HEXNORD GRUL BED FLTH TEST 8/26 1515 CLINKER COOLER CONTR,
INPUT I i A T A : PROCESS w E i G i i T RATE = ir 'TONS Fii'G11. , ' iR TOTAL PARTICULATE EMISSION RATE = 0 L W H H PARTICLE DENSITY = 1 G/CC
MEASURED PARTICLE S I Z E U I S T K I P U T I U N
.58 10.2 22 + 0207 82 .97 24.1149 1.35 2.38 29.253 2.9 6.09 42.4007 4.4 7.64 58 8947 6.2 4.75 69 1494
14.3 2.34 80.3757 200 9.09 100
10.1 2.86 75.3238
OUTPUT DATA : TP EMISSION FACTOR = .284 LB/T ( ,142 KG/MT)
E M I S S I O N FACTOR CUT ( UIIIA ) CUM, i! .: CUT ( LB/T ) (KG/MT )
625 1 !;25 2.5 5 10 15 20
22.3893 25.8958 28,30?3
,0635856 .0317928 -0735442 ,0367721 0803785 .040 1893
38 6325 .IO9716 .05485a2
75 2504 ,213711 . io~a56 63.1635 .1793a4 ,0896922
81,0395 ,2301 52 1 1 5076 84.8653 .241017 120509
END O F ' T E S T S E R I E S
E-20

S P L I N ? PROGRAfl - 02/22/82 VI
TEST 111: HEXNORTI GRVL BED FLTR TEST 9/25 1515 CLINKER COOLER CONTR.
INPUT DATA: PROCESS WEIGHT RATE = 0 TONS PROD. /HR TOTAL PARTICULATE EHISSION RATE = 0 LB/HR PARTICLE DENSITY = 1 G/CC
flEASUKED P A R T I C L E S I Z E D I S T R I H U T I O N
CUT ( u m ) RAW LOAI I ING tun. <: c u ~ < CUT
58 .82 1.35 2.9 4.4 6.2 10.1 14.3 200
1.1 1.52 3.11 6.14 6.21 3.9 3.42 2.54 8.87
2.98822 7.11753 1 5 . 5 5 6 4 3 2 . 2 4 6 7 49.1171 59.712 59.003 75.9033 100
OUTPUT DATA: TP E f l I S S I O N FACTOR = .284 L W T ( ,142 KG/HT)
EMISSION FACTOR CUT ( u m A ) CUM. X e: CUT ( L R / T ) (KG/MT )
625 3.5858 .0104677 1 10.0951 ,0286702 1 .25 14.0287 -0398415 2.5 28 0359 .0796217 5 53.3807 -151601 10 68 8504 .195535 15 ' 76.8012 ,218115 20 82.9322 232688
END OF TEST S E R I E S
5.23383E-03 -01 43351 .0199208 .0398109 .0758006 .0977676 .lo9058 .116344
E-21

S P L I N ? PROGRAM - 02/22/82 V 1
TEST ID: REXNORD CRVL BE11 FLTR TEST 9/27 1100 CLINKER COOLER CONTR.
INPUT ItATA: PROCESS WEIGHT RATE = 0 TONS PROII. /HR TOTAL PARTICULATE E f l I S S I O N HATE = 0 LH/HR PARTICLE DENSITY = 1 G/CC
MEASURED P A R T I C L E S I Z E D I S T R I B U T I O N
CUT (urn )
58 I 82 1.35 2.9 4 . 4 6.2 10.1 14.3 200
OUTPUT D T
CUT f u n 1 4 )
.625 1 1.25 2.5
10 15 20
= J
RAW LOkii iEiG < CUT
93 1 .54 3.43 7.16 7.8 4.37 3.14 3.31 12 .
TP Efl SSIOl
CUfl . % q: CUT
2,69324 8.37621 12.1146 25.7293 51 9623 64.9145 73.5565 79 + 3079
CUM. % c: CUT
2.12569 5.6433 13.6062 29.9794 47 8162 57 3093 64 9897 72.5589 100
FACTOR = - 2 8 . L- /T ( ,142 K-.’flT)
E f l I S S I O N FACTOR ( LEVT ) ( KG/MT )
7.6488E-03 3.8244E-03 .0237884 ,0118942 .0344056 ,0172028 ,0730711 ,0365356
147573 ,0737865 .le4357 -0921786
225234 11 2617 .208901 ,10449
E N D OF TEST S E R I E S
E-22

SPLIN2 PROGRAh - 02/22/32 V1
TEST I D : REXNORD GRVL PEII FLTR TEST 8/27 1150 CLINKER COOLER CON'Tli.
INPUT DATA: PROCESS WEIGHT RATE = 0 TONS PROD. /HR TOTAL PARTICULATE EhISSION RATE = 0 LH,'HH PARTICLE DENSITY = 1 G/CC
hEASUHED PARTICLE S I Z E D ISTRIBUTION
i: CUT R A W CUM. ;! .< CUT cur ( U ~ I ~
. 58 1 +43 . a2 1.41 1.35 4.14 2.9 7.5 4.4 .6.31 6.2 d.21 10.1 3.93 14.3 5.3
c
200 z.98
3.30942 6.57255 16.1537 33.5108 48.1139 60.1713 69.2664 -
100 a i , 5321
OUTPUT DATA: TP EMISSION FACTOR = e284 L E / T ( ,142 KG/HT)
EMISSION FACTOR CUT (umA ) 'CUM. X qz CUT < LH/T ) ( KG/hT 1
,625 3.85397 1 9 72082 1.25 14,3243 2.5 29 4809
10 69.2193 5 52.8883
15 83.0278 20 91.063~
0109453 5.47264E-03 + 0276071 ,0138036 .0406809 ,0203405
150203 0751 01 3
.23579? ,1179
.258621 ,12931 1
. oa37257 ,04 18629
,196503 ,098291 4
END OF TEST SERIES
E-23

. .
S P L I N 2 PROGRAM - 02/22/82 V I
TEST I D : REXNORD GRVL HE11 FLTR TEST 8/27 1515 C L I N K E R COOLER CONTH.
INPUT DATA: PROCESS WEIGHT RATE = 0 TONS PROD, /HR TOTAL PARTICULATE EMISSION RATE = 0 LH/Hf i PARTICLE DENSITY = 1 G/CC
HEASUHED P A R T I C L E S I Z E D I S T R I B U T I O N
CUH. X c: CUT KIN LOADING < CUT CUT (un i 1
.58 1 . 5 4 I 82 1.77 1.35 4.35 2.9 7.43
6.2 4.02 10.1 2.89 14.3 2.83 200 7.4
4.4 . . 5.55
4.07407 8.75552 20.291 39.9471 54.6551 65.291 72.9355 80 4233 100
OUTPUT DATA: TP EHISSION FACTOR = .2a4 LWT ( . ,142 KG/HT)
EMISSION FACTOR CUT 1 UITIA ) CUM. X %: CUT f L H / T ) .( KG/k lT)
t525 1 1.25
5 10 15 20
- r L I J
4 . a6637
18.1678
58.9552 . 72. a557
a5.6657
12.703
35.5927
81.372
.0138205 6.91024E-03
-0515964 .0257982 1oioa3 .05054 16
0360766 ,01803a3
167433 .oa37164 + 2069 1 103455 -231096 .115548 .24613 ,123055
END OF TEST S E R I E S
E-24

I
I :
,
1 . .
!
S P L I N 2 PROGRAH - 02/22/82 ul
TEST ID: REXNORD GRUL BED FLTR TEST 8/27 1515 CLINKER COOLER CONTII.
INPUT ItATA : PROCESS WEIGHT RATE = 0 TONS PROD, /HR TOTAL PARTICULATE EMISSION RATE = 0 LB/HR PARTICLE DENSITY = 1 G/CC
HEASURED PARTICLE S I Z E D I S T R I R U T I O N
CUM, i! .:: CUT RCIW LOADING
< CUT CUT ( U I T I )
* 53 .32 1.35 2 . 9 4.4 5.2 10.1 14.3 200
.9 1.47 4.01 5.99 7.11 3.12 2.48 2.25 11.4
2.26472 5.95377 15.0544 33 5437 51.535 59.385 55.5255 71.3135 100
OUTPUT DATA: TP EHISSION FACTOR = ,284 LB/T ( ,142 K G / M T )
EMISSION FACTOR CUT (UITIA) CUM + X .:; CUT < L B / T ) (KG/MT )
.525 2.8453 1 9.30074 1.25 14,1215 7.5 29 * 2995 5 54 3729 10 65 5378 15 72.0945 20 75.7437
8.08207E-03 ,0264141 s 040 1054 0832104
+ 155839 + 186127 204748 ,217952
4 04104E-03 e0132071 -0200527 a0416052 ,0779195 ,0930637 102374 108976
END OF TEST SERIES
i
E-25

. S P L I N 2 PROGRAM .- 02/22/82 "1
TEST rn: REXNORD GHVL B E D FLTR TEST ai28 1045 CLINKER COOLER CONTR,
INIz'UT DATA: F'KOCESS WEIGHT RATE = 0 TONS F K O D . /HK TOTAL PARTICULATE E H I S S I O N HATE = 0 LB/HH PARTICLE DENSITY = 1 G/CC
HEASUREU P A R T I C L E S I Z E D I S T R I B U T I O N
.55 ,8? 1.35 2.9 4.4 5.2 10.1 14.3 200
1.61 1.15 2.71 5.17 6.23 3.17
5.09171
17.2992 33 6496 53 * 3523 63.3776
a. 72855
100
1 i .25 2.5
10 15 20
L- .I
' EMISSION FACTOR CUM. X c:: CUT f L B / T ) ( KG/MT 1
5,74515 ,0163162 a. i5812~-03 11.7043 .0332415 ,0166208 15.7337 , 0 ~ 6 a m .0223419 29.2474 .oa30626 .0415313 57.5773 + 163519 ,081 7597 70.2614 .199542 ,099771 1 73.2653 -222274 ,111137 83.4329 + 236949 ,118475
END OF TEST S E R I E S
E-26
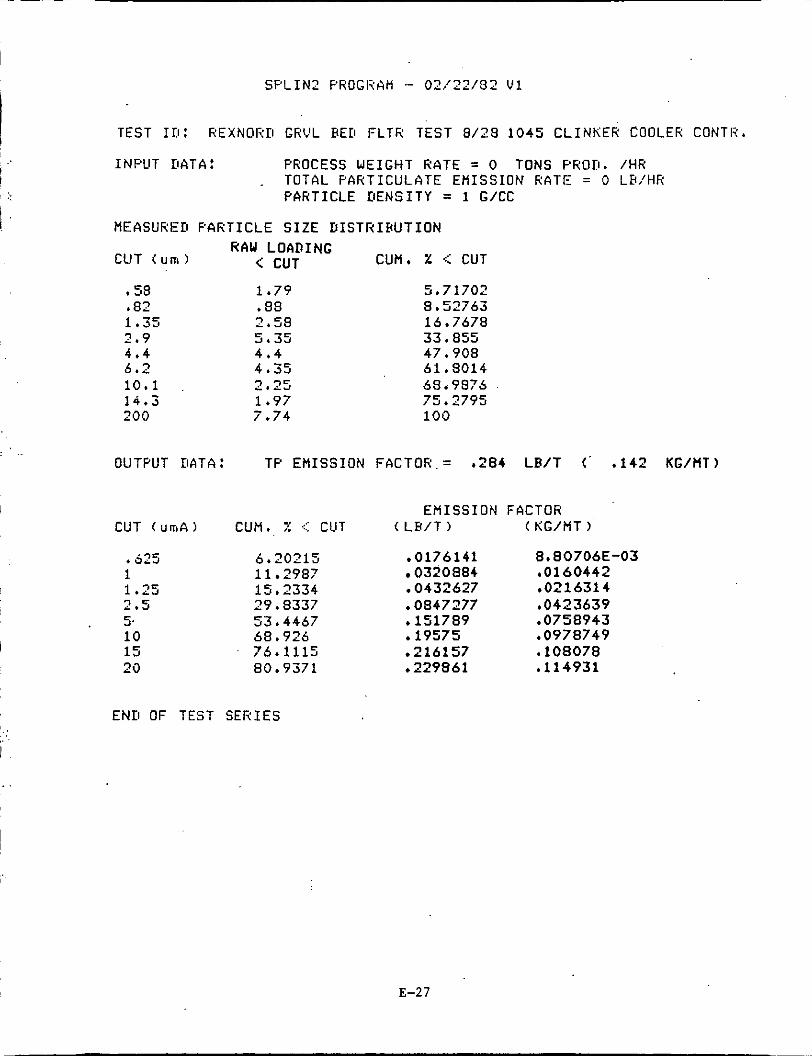
I I
OUTPUT D A . .4 : TP EMISS-- . I FACTOR.= e 2
S P L I N 2 FROGIi 'AM - 0 2 / 2 2 / 3 2 V 1
TEST ID: REXNOliIl GRVL HEfl F L T R TEST 8/28 1045 C L I N K E k COOLER CONTR.
INPUT DATA: PROCESS WEIGHT RATE = 0 TONS PROD. /HR . TOTAL PARTICULATE EMISSION RATE = 0 LB/HR
CUT (umi )
* 53 * 82 1.35 2 .9 4 . 4 5 .2 10*1 14.3 200
PARTICLE D E N S I T Y = 1 G/CC
MEASURED PARTICLE S I Z E D I S T H I H U T I O N
CUM. Z <: CUT HAW LOADING
< CUT
1.79 .88 2.58 5 .35 4 . 4 4 .35 2 .25 1.97 7.74
5 + 71702 8.52753 15 I 7578 33.855 47.908 51.3014 68.9875 75 * 2795 100
E M I S S I O N FACTOR CUT ( u ~ A ) CUH. X .:I: CUT ( LH/T ) (KG/MT )
t 525 6.20215 .0176141 8.80706E-03 1 11 2987 0320884 ,0160442 1 .?5 15 2334
5- 53.4457 -151789 ,0758943
,0432627 e 021 631 4 2.5 29 .a337 -0847277 ,0423639
10 68.926 .19575 ,0978749 15 75.1115 .216157 . io8078 20 80.9371 .229861 ,114931
' . I
END OF TEST SERIES
E-27

S P L I N ? FROGKAil - 02/22/32 U 1
TEST 113: KEXN0F:D GRVL BED FLTH TEST 3/28 1415 CL INKER COOLER CONTH.
INPUT DATA: PROCESS WEIGHT RATE = 0 TONS PROD. /HR TOTAL PARTICULATE EMISSION KATE = 0 LB/HH PARTICLE I IENSITY = 1 G/CC
KEASUHEn P A R T I C L E S I Z E D I S T K I H U T I O N
RAW LOACl IN t i CU? ( u s ) < CUT CUH. % q: CUT
f 5 8 .3? 1.35 2 . 9 4 . 4 6.2
. 10.1 14.3 200
5.73 1.92 3 5.57 5.26 3.25 2.6 2.14 7.72
15.4074 20 57 20.6367 43.6139 57.7575 66.4964 73.4875 79 2417 100
OUTPUT DATG : TP EHISSION FACTOR = ,284 L R / T ( .142 KC/MT)
E M I S S I O N FACTOR CUT (umA.) CUM, Z < CUT ( L B / T ) ( KG/HT )
1.25 2.5 f J
10 15 20
16.4663 0467642 23.6295 ,0671077 27.2883 0774988
61.3235 174159 73 3373 20842
39.9041 .113328
79.9919 .227177 04.2833 .239365
.0233821 ,0335538
.0566639
.OB70793 ,10421
11 9682
,0387494
11 3588
END OF TEST S E R I E S
E-28

i
S P L I N 2 PROGRAfl - 02/22/92 V 1
TEST Iri: REXNOHD GRVL BED FLTK TEST 8/28 1415 CLINKER COOLER CONTR,
INPUT DATA: PROCESS WEIGHT RATE = 0 TONS PROD. /HR TOTAL PARTICULATE EMISSION RATE = 0 L W H R PARTICLE DENSITY = 1 G/CC .
f lEASUREn P A R T I C L E S I Z E I I I S T H I H U T I O N
RAW LOADING < CUT CUM. % q: CUT CUT ( U ~ I )
.58 82
1.35 2.9 4.4 6.2 10.1 14.3 200
4.67 13.3276 1.53 17.6941 2.7 25.3995 6.67 44.4349 4.88 58.3619 3.58 68 8642 2.26 75.3139 2.96 83 7614 5.59 100
OUTPUT DATA : TP EMISSION FACTOR = ,284 LR/T ( ,142 KG/flT)
EMISSION FACTOR CUT ( u'mA ) CUM, Z < CUT ( L R / T ) ( KG/MT )
625 14.1999 0403277
1 e25 24,0315 .0682494 2.5 40.0748 .I13813 5 62.6490 177925
15 84 806 .240849 20 90.5017 257025
1 20.4602 + 0581069
10 ' . 75.2909 + 213826
END OF TEST S E R I E S
,0201638
,034 1247 ,0290535
,0569063 ,0889627 .I06913 120425 $128512
E-29

TEST I D : REXNORD GRVL BED FLTK TEST 8/29 1000 CLINKER COOLER CONTR,
INPUT DATA: PROCESS WEIGHT RATE = 0 TONS PROD. /HR TOTAL PARTICULATE EMISSION RATE = 0 LB/HR PARTICLE I iENSITY = 1 G/CC
HEASURED PARTICLE S I Z E DISTRIHUTION RAW LOADING
CUT ( u m ) < CLlT CUH. X < CUT
.sa ,a2 1-35 2.9 4.4 6.2 10.1 14.3 200
3.98 10.2869
2*53 21.22 5.13 34.4792 5.77 49 3926 4.14 60 0931
2.13 73 6366 10.2 100
1.7 14 6808
3.11 68.1313
OUTPUT DATA: TP EMISSION FACTOR = .2a4 LBIT ( ,142 KGIHT)
EHISSION FACTOR CUT (UIIIA) CUM. X e: CUT ( L H I T ) ( KGIHT )
t 625 11 + 1847 1 17.1466 1.25 20.1058
10 6a.0011
20 78.7868
2.5 30 + 9301 5 53.6993
15 74.3824
-0317644 ,0158822 0486963 ,0243482
. 0878414 ,0439207
.152506 ,0762531
,211246 105623 223755 1 I1877
057 1006 ,0285503
.193123 .0965616
END OF TEST SERIES
E-30
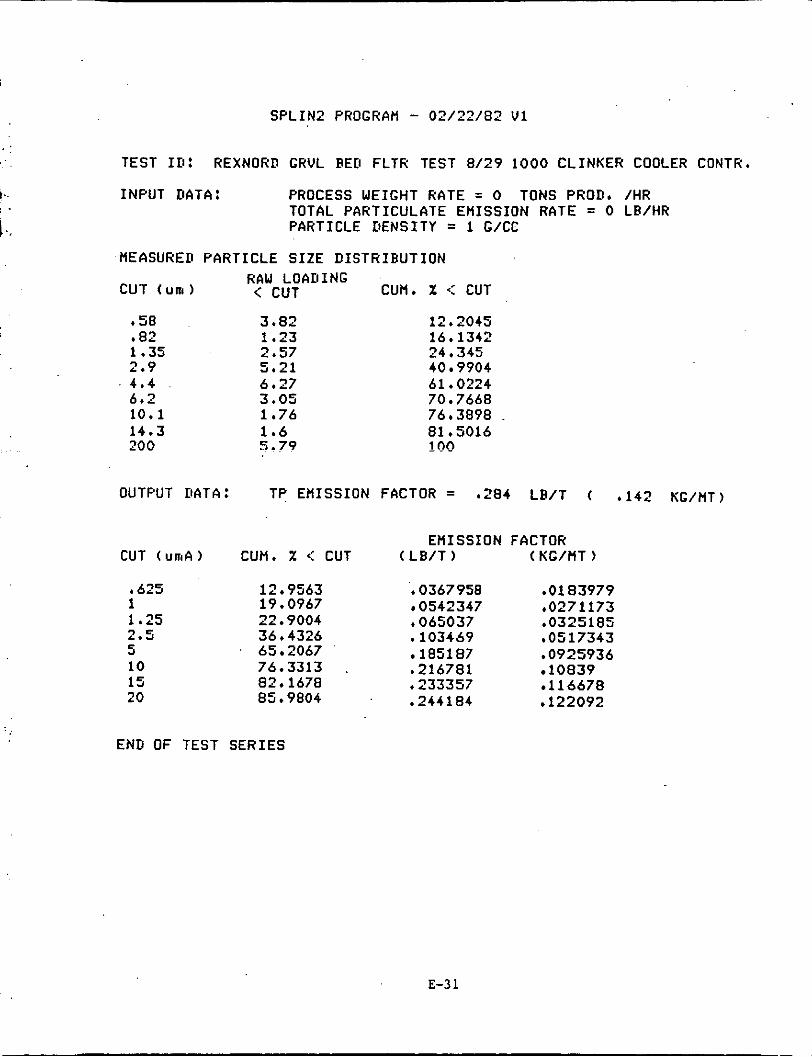
SPLIN2 PROGRAH -
TEST I D : REXNORD GRVL RED FLTK
I..
02/22/82 V 1
EST 8/29 1000 CLINKER COOLER CONTK,
INPUT DATA: PROCESS WEIGHT HATE = 0 TONS PROD. /HR TOTAL PARTICULATE Ef l ISSION RATE = 0 LR/HR PARTICLE DENSITY = 1 G/CC
HEASURED PARTICLE SIZE DISTRIBUTION RAW LOADING
CUT (uni ) < CUT CUfl. X <: CUT
.58 3.82 82 1.23 1.35 2.57 2.9 5.21 4.4 6.27 6.2 3.05 10.1 1.76 14.3 1.6 200 5 .79
12.2045 16.1342 24 + 345
61.0224 40 9904
70.7668 76.3898 . 81 -5016 In0
OUTPUT ItATA : TP Ef l ISSION FACTOR = ,284 LB/T ( a142 K G / f l T )
EHISSION FACTOR CUT (un iA) CUM. % c: CUT ( L B / T ) ( KG/flT )
I 625 12.9563 .0367958 1 19.0967 0542347 1.25 22.9004 ,065037 2.5 36.4326 .lo3469
65 2067 185187
15 82.1678 .233357 20 85.9804 ,244181
5 J
10 76.3313 , e216781
.0183979 ,0271173 03251 85 ,0517343 .0925936 10839 11 6678 ,122092
END OF TEST SERIES
E-3 1

SPLIN2 PROGRAM - 02/22/82 U t
TEST I D : REXNORIl GRVL BED FLTR TEST 8/29 1400 CLINKER COOLER CONTR.
INPUT DATA: PROCESS WEIGHT RATE = 0 TONS PROD, /HR TOTAL PARTICULATE EHISSION RATE = 0 L W H R PARTICLE DENSITY = 1 G/CC
MEASURED PARTICLE S IZE DISTRIBUTION
CUT (urn 1 RAW < CUT CUH, X < CUT
58 82
1.35 2.9 4.4 6.2 10.1 14.3 200
1 e27 1.28 2.3 3.93 1.55 1.15 1.17 1.51 2.69
7.53709 15.1335 28 7834 52 1068 61 + 3056 68.1306 -75.0742 84 0356 100
OUTPUT DATA : TP EHISSION FACTOR = .284 LR/T ( ,142 K G / M T )
EMISSION FACTOR CUT (urnA) CUM. X < CUT ( L B / T ) KG/MT )
-625 8.91414 1 20.1553 1.25 26 t 4484 2.5 47 + 8679 5 '63 + 9865 10 75.0186 15 85 + 136 20 91.0908
0253 162 0572411 0751 136
.135945 ,181722 ,213053 .241706 ,258698
,0126581 ,0286205 .0375568 ,0679725 ,0908608 .lo6526 120893
-129349
END OF TEST SERIES
E-32

1 :
S P L I N 2 PROGRAM - 02/22/82 V 1
TEST I D : REXNOHII GRVL BED FLTR TEST 8/29 1400 CLINKER COOLER CONTR.
INPUT DATA: PROCESS WEIGHT RATE = 0 TONS PROD. /HR TOTAL PARTICULATE EMISSION RATE = 0 LB/HR PARTICLE DENSITY = 1 G/CC
MEASURED PARTICLE S I Z E D I S T H I R U T I O N
< CUT CUT (urn ) RAW LOAKIING CUM. z < CUT
58 * 82 1.35 2.9 4.4 6.2 10.1 14.3 200
OUTPUT D
1.03 .93 3.07 6.1 5.19 3.35 2.56 1.68 6.92
TA : TP EMISS
3,3409 6.35744 16.3153 36.1012 52.9355 63.8015 72.1051 77 5543 100
ON FACTOR = ,284 L B / T ( ,142 KG/MT)
E M I S S I O N FACTOR CUT (un iA) CUM, X c: CUT ( LB/T ) (KG/MT )
625 3.8355 1 9.53263 1.25 14.36 2.5 31.4461 5 57.3494 10 71.9675 15 78.2745 20 82.4492
+ oioa928 5.44641E-03 .0270727 .0135363 .0407a23 .0203911 -0893069 0446535 .162872 0814361 -204388 ,102194 2223 -11115
.234156 .117078
END OF TEST S E R I E S
E-33
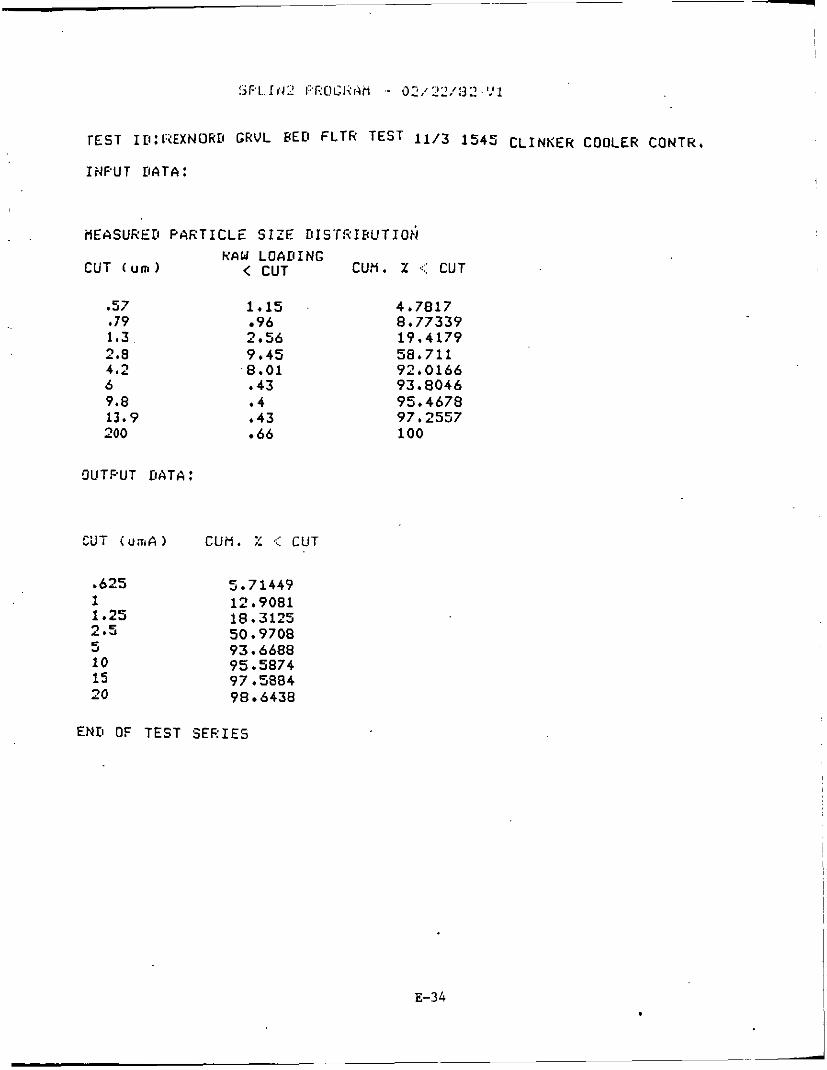
. . HEASUR'ED P A ~ ~ T I CLE s I ZE DI STR IHUT 10rj RAW LOADING
CUT (urn) < CUT CUtl. I ,::: CUT
.57 * 79 1,3 2.8 4.2 6 9.8 13.9 200
1.15 96 2.56 9.45 8.01 .43 . 4 .43 66
OUTPUT DATA :
.625 1 1.25 2.5 5 10 15 20
5 .?I449 12.9081 18.3125 50. 9708 93.6688
97.5884 95.5874
90 6438
END OF TEST SERIES
4.7817 8.77339 19.4179 58,711 92 0166 93.8046 95.4678 97.2557 100
E-34

TEST I ~ : I X X N U K D GRuL FLTR TEST 11/4 1130 CLINKER COOLER CONTR.
INPUT DATA:
HE A SURE D P AR T I CL E S I Z F D I S'T R I BUT I 0 N HAW LOADING
CUT ( u a 1 < CUT CUH. Z r:: CUT
.57
.79 1,3 2.8 4.2 6 9.8 13.9 200
t 57 6.97674 1.02 19.4614 2 .Sa 51 0404
t 64 91.0649 2.63 ~13.2313
.18 93.26~11
.I9 95.5936
.13 97.184~1
.23 100
C)LlTFUT DATA :
,625 1 - 1.25 47.9794 2.5 79 9024 5 92.2836 10 15 20
95.696 97 + 4834 98.4505
END OF TEST S E R I E S
E-35

INPUT DATA:
i iE A SUR E Kt PART I C L E S I Z E I! I S TR I BLI T I ON HAW LOADING
CUT ( u m ) < CUT cU!l. 1: CUT
.;7 .79 183 2.8 4.2 6 9.8 13.9 200
38 -68 2.22 3.36 .92 .34 16
.14
.Ol
DLITFUT DATA :
,625 6 32592 1 23.5358 1 ' 2 5 37,0932 2.5 76.0017 5 94.4541
1 5 100.05 20 100 425
10 98.2987
EN11 OF TEST SERIES
4 6285 12.9111 39.9513 80.877
96 2241 92 e 0828
98.173 99 t 8782 100
E-36

~ E A S U H E I I P A R T I C L E S I Z E r!IST!tIBUTION RAW LOADING
CUT (urn) < CUT cutl. z .::: cu7
.57 * 79 1.3 2.9 4.2 J 9 . 9 13.9 200
.97 86
2.51 3.78 1.16 .61 .51 .49 .99
W T P U T OATA :
,625
1.25 2.5 c J
10 1s 20
END OF T E S T S E R I E S
8.16498 15.404
68.3502 78.1145
87 5421 91 e 6657 100
36 532
83 2492
E-37

.57 t 79 1.3 2.8 4.2 6
11.9 200
9.8
1.12 1 *03 1.16 4 65 .2 t 56 38 .45 1.35
.625 1 1.25 :..I
10 15 20
- 5
5 .I
20.0986 39 8803 46 a7291
64 e386 74 s 3669 81 7644
56.4482
86.3878
16.2319 31.1594
57.3913 60.2899 68 t 4058 73.9131 80 4348 100
47.971
END OF TEST S E R I E S
E-38

RESULTS OF SPLINE ANALYSES FOR REFERENCE 26A AND 268 ( S E C n O N 4 . 0 1 _ . I,
nunter, S. i., e t a i . , i p p i i c a t i o n o f Combustion m o d i f i c a t i o n s t o a (NTIS PB 294 I n d u s t r i a l Combustion Equipment, EPA 600/7 79 015 - - -
14). U. S. Environmental P r o t e c t i o n Aaency, Research T r i a n g l e Park, NC,’january 1979; and
-
Hunter, S . C . , e t . a l . , Appl icat ion of Combustion Modifications t o I n d u s t r i a l Combustion Equipment: Data Supplement A, EPA-600/7-79-015b (NTIS PB 293888), U. S. Environmental P ro tec t ion Agency, Research Tr iangle Park, NC, February 1979.
E-3 9

TEST I D : KVB/EPA TEST RUN 3-2 MULTICLONE OUTLET
INPUT DATA: PROCESS WEIGHT RATE = 0 TONS PROD./HH TOTAL PARTICULATE EMISSION RATE = 6 LR/HR PARTICLE DENSITY = 1 G/CC
MEASURED S I Z E DISTHIRUTION
CUT( URI 1
.51 + 85 1.68 2.49 4.25 15 200
OUTPUT DATA:
CUT (UIIA)
625 1 1.25 2 . 5 5 10 15 20
CUM. X < CUT
44 .97. 2 3.74 11.75 30 91 100
TP EMISSION FACTOR = 249,2 LB/T ( 124.5 K G / M T )
EMISSION FACTOR CUM. X G: CUT ( LB/T ) (KG/MT )
,518263 1.54071 .770355 1 + 13034 2.8168 1 4084 1.40554 3.50261 1.7513 ~ ~~~
3.82099 9,5219 4.76095
24 + 2585 60,4521 30 226 14.3113 35.6637 17.8318
31.204 77.7603 38 8802 37 e 7452 94.0611 47.0305
END OF TEST SERIES
E-40

SPLIN? PROGRAM. - 02/22/32 V I
TEST In: KVR/EPA TEST HUN 9-1 K I L N OUTLET
INPUT DATA: PROCESS WEIGHT RATE = 0 TONS FROD./HR TOTAL PARTICULATE EHISSION KATE = 0 LEI/" PARTICLE DENSITY = 1 G/CC
CUT( uni )
37 .59 1.13 1.66 2.81 15 200
OUTPUT DATA:
CUT iuniA )
.625 1 1.25 2.5 5 10 15 20
HEASURED S I Z E DISTKIRUTION
END OF TEST SERIES
CUH. X < CUT
eo1 1.52 3.32 6.65 14; 85 50 35 100
TP EHISSION FACTOR = 117 LR/T ( 58.5 KG/HT)
EHISSION FACTOR CUM. X .< CUT ( LB/T ) i KG/HT )
1 68965 1.9769 .988451 2.95593 3 45844 1.72922
12 6416 14 7907 7 39536 25.6618 30 0243 15.0122 40 3874 47 * 2533 23.6266 50 4207 58 9922 29.4961 5 8 . 021 67 8845 33 9423
4 00466 4 ,68545 2.34272
E-4 1 11 I

5 P L I N 2 PROGRAM .- 02/22/82 V 1
TEST ID: KVB/EF'A TEST RUN 9-2 K I L N OUTLET
INPUT DATA: PROCESS WEIGHT RATE = 0 TONS PROD./HR TOTAL PARTICULATE EHISSION RATE =' 0 LWHR PARTICLE DENSITY = 1 G/CC
HEASUHECt SIZE DISTHIHUTION
CUT( URI ) CUH. Z .:: CUT
.38
.6 1.13 1.66 2.81 15 200
.5 2.3 5.4 11.3 22.9
100 5 2 . 8
OUTPUT DATA: TP EMISSION FACTOR = 122.4 L F / T ( 61.2 KG/HT')
CUT ( U R I A ) ' CUM. X < CUT
.625 2.40487 1 4.50161 1 e25 6.64121 2.5 19.9713
10 45.5373 15 53.0207 20 58.9687
3 4 066 F J
END OF TEST SERIES
EMISSION FACTOR ( L B / T ) (KG/HT )
2.94356 1.47178
8 12884 4.06442 24 4449 12.2225 41.6968 20 8484 55.7376 27,8688 64. a974 32 4487' 72,1777 36.0889
5.50997 2.75498
E-42

TEST I D :
INPUT UAT
SPLIN? PROGRAM .- 02/22/32 L'1
KL'H/EPA TEST 9-3 ESP INLET
PROCESS WEIGHT RATE = 0 TONS PROD* 1 IR TOTAL PARTICULATE EMISSION RATE = 0 LH/HR PARTICLE DENSITY = 1 G/CC
HEASUHED PARTICLE S I Z E D I S T R I H U T I O N
CUT ( U I I I ) RAW Z .: CUT CUM. 1 .:: CUT
1 3 10 200
6.71 24 .6 36.89 31 - 9 1
6.71 31.31 68-19 100
OUTPUT DbTA : TP E H I S S I O N FACTOR = 81.72 LB/T ( 40.86 K G / M T )
E M I S S I O N FACTOR CUT (UIIIA ) CUM. X G: CUT ( LH/T ) ( K G / M T )
.625 1 1.25 2 .5 5 10 15 20
2.72561 2 22737 1,11359 6.71 5.49341 2.74171 9.78224 7.99405 3.99702 25.5771 20.9016 10.450P
37.749 18.9745 46.1931 60.0176 JJ 584 79.6645 65,1018 32.5509 86 + 3007 70 525 35 2625
27.792 cc
END OF TEST S E R I E S
E-43

SPLIN? PROGRAM - 02/22/82 V I
TEST ID: KUB/EPA TEST 9-4 ESP INLET
INPUT DATA: PROCESS WEIGHT RATE = 0 TONS PROD. /HR TOTAL PARTICULATE EMISSION RATE = 0 LH/HR
. PARTICLE DENSITY = I G/CC
NEASUkED PARTICLE S I Z E D ISTRIHUTION
CUT (uni ) RAW X .: CUT CUM. X c:: CUT
1 8.24 3 23.39 10 35.84 200 32 * 53
9.24 31.63 67 + 47 100
' . OUTPUT DATA: TP ENISSION FACTOR = 72.9 LH/T ( 36.45 KG/MT)
EMISSION FACTOR CUT ( u m A ) CUM. X .< CUT ( LB/T ) (KG/MT )
625 3 + 83047 2.79242 1 8.24 6 00595 1.25 11.3895 8.30304 2.5 26,3925 19 ..24 0 1
10 67.2939 49 0573 15 78.731.9 57.3955 20 85.3165 62.1957
5 45.9572 33,5028
END OF TEST SERIES
1.39521 3.00348 .4.15152 9.52006 15.7514 24.5286
31,0979 28 5978
E-44

S P L I N ? PROGRAM - 02/22/02 V 1
TEST I D : KVH/EPA TEST 9-5 ESP OUTLET
INPUT DATA: PROCESS WEIGHT HATE = 0 TONS PROD,/HR TOTAL PARTICULATE EMISSION RATE = 0 L W H R PARTICLE I IENSITY = 1 G/CC
MEASURED S I Z E D I S T R I B U T I O N
CUT( UB ) CUM. X <: CUT
1 3 10 200
30 3639 96.4907 96 5007 100
PROCESS U A T A NOT A V A I L A B L E i E H I S S I O N FACTOR DIRECTLY I N P U T
OUTPUT DATA : TP EMISSION FACTOR = a254 LH/T ( ,127 KG/HT)
EMISSION FACTOR CUT ( u ~ A ) CUH. X c: CUT ( L H / T ) (KG/MT )
L 625 1 1.25 2.5 5 . 10
' 15 20
THIS DATA SET
2a 564 ,0725526 .0362763 41.137 ,10448~1 ,052244
67.111 ,170462 ,085231 47 * 545 .120764 .0603a22
82. a33 .210396 .i0519a
95 I97 243764 ,121882 97.481 ,247602 123801
92.677 ,2354 ,1177
WAS F I T TO A LOG-NORMAL S I Z E D I S T R I H U T I O N

SF'LIN? PROGHAH - 02/22/92 V 1
TEST ID: KUB/EPA TEST 9-5 ESP OUTLET
INPUT DATA: PROCESS WEIGHT RATE = 0 TONS PROD./HR TOTAL PARTICULATE E H I S S I O N RATE = 0 LEV" PARTICLE DENSITY = 1 G/CC
iiEAS.dREii iiiSiHiBUiiDM
CUT( uo ) CUH. 7: e: CUT
1 3 10 200
25.1174 99.4502 99 + 4602 100
F'HOCESS DATA NOT A V A I L A B L E i E H I S S I O N FACTOR DIRECTLY I N P U T
OUTPUT DATA : TP EHISSION FACTOR = .3 L B / T ( .15 KG/HT)
+ 525 1 1.25 2.5 5 10 15 20
THIS DATA SET
E H I S S I O N FACTOR (KG/HT ) CUT (uniA ) CUH. X ,:: CUT
15.736 29.91 31,479 52 799 93.439 94.107 91 696 9~1.917
IAS F I T TO A LOG-NORM
( L B / T )
.050209 09973 ,112437 198354
.284121
.293099
.296451
,250317
S I Z E DISTH
,025104 .044855 .0552195 .094192 ,125159 .142051 ,145544 I145225
HUTION
E 4 6
.- RESULTS OF SPLINE ANALYSES FOR REFERENCE 27 (SECTION 4.0)
Taback H. J., e t a l . , F ine P a r t i c l e Emissions front S ta t i ona ry and Miscelianeous Sources i n the South C oast A i r Basin, K V t l 58Ub-/83
CA, .February 1979. I IS Ptl 293 % 3 ) , C a l i t o r n i a S t a t e A i r Kesources Board, Sacramento,
I
,

S P L I N 2 PROGRAM - 02 /22 . /82 V I
TEST I D : KVEVARH PULVERIZED COAL TEST 18 BAGHOUSE OUTLET
INPUT DATA: PROCESS WEIGHT RATE = 0 TONS PROD. /HR TOTAL PARTICULATE EMISSION R A T E = 0 LH/HR PARTICLE DENSITY = 1 G/CC
MEASURED PARTICLE S I Z E D I S T R I H U T I O N
CUT ( u r n ) RAW % < CUT CUM. % <:: CUT
.99 34 34 3 34 58 10 24 92 200 a. 100
OUTPUT DATA : TP EMISSION FACTOR = .44 L - . I T ( . 2 2 K G / M
EMISSION FACTOR CUT (umiA) CUM, 7: c: CUT ( LB/T 1 ( KG/MT 1
525 1 1.25
22.5933 34 2755 40.5575
. 099a505 ,0499253
.i5oa12 ,0754051 ,178893 . ow4456
2.5 52 3054 ,274144 + 137072 5 79.3977 ,34935 .174675
15 95.8591 .4261a ,21309 20 98.9845 ,435532 + 21 7755
10 91.8575 ,404173 .2020a7
END OF TEST SERIES
E-48

SPLIN? PROGRAM - 02/22/82 V 1
TEST I D : KVEVARH NATURAL GAS TEST 9 HAGHOUSE OUTLET
INPUT DATA: PROCESS WEIGHT R A T E = o TONS w o r t . /HF; TOTAL PARTICULATE EMISSION KATE = 0 LH/HR PARTICLE I iENSITY = 1 G/CC
flEASURED PARTICLE S I Z E D ISTRIHUTION
.99 3 10 200
20 40 32 8.
20 60 92 100
OUTPUT DATA : TP EHISSION FACTOR = $22 LEVT ( .11 K G / M T )
EHISSION FACTOR , 3 r. I T I < KG,.iii CUT < G E , A > cun. x < CUT < L D I I I
.625 10.3974 ,0228744 ,0114372
1.25 25 t 6543 0586394. ,0293197 1 20.2616 .0445755 ,0222873
2 . 5
10 15 20
5 .I
52.3879 + 115253 ,0576267 75.0083 .165018 .0325091 91.693 ,201725 100862 97.8964 215372 ,107636 100.057 .220126 .I1 0053
END OF TEST.SERIES
E 4 9

I. REPORT NO. 2.
EPA-600 /7- 87-007
Lime and Cement Industry Particulate Emissions: L. T I T L E A N 0 SUBTITLE
Source Category Report; VolUme u. Cement Industry
1. AUTHORISI
John 5. Kinsey
Midwest Research Institute I. PERFORMING OROANlZATlON NAME A N D ADDRESS
425 Volker Boulevard Kansas City, Missouri 64110
3. RECIPIENT’S ACCESSIOWNO.
6. REPORT D A T E February 1987
6. PERFORMING ORGANIZATION CODE
0. PERFORMING ORGANIZATION REPORT N(
10. PROGRAM ELEMSNT NO.
68-02-3891, Task 9 12. SPONSORING AGENCY NAME A N D A D D R E S S
EPA, Office of Research and Development A i r and Energy Engineering Research Laboratory Research Triangle Park, NC 27711
13. TYPE O F REPORT A N D PERIOD COVEREt Task Final; 6/83 - 8/86 14. SPONSORING A G l N C Y CODE
EPA/600/13
Pollution Emission Portland Cement Industrial Processes Particles Dust Aerosols 8. DISTRIBUTION STATEMENT
Releme to Public
PA Form 2220.1 (9.73)
Pollution Control Stationary Sources Emission Factors Inhalable Particulate
13B llB, 13 C 13H 14G 11G 07D 21. NO. OF PAGES
406 22. PRICE

(e)
u)
VISITORS
I? 0 0 I
P- 50 I f-
0 0 W
. a n. W
0 2 E 0 ro 0
A
.- w
.- - 2