February MARKETS 175q4q 5M - Public Documents...
44
COMMODITY February o MARKETS 175q4q ANDTHE DEVELOPING COUNTRIES I l 5M Commoditiesandthe EastAsian crisis Oil pricescontinueto weaken Food pricesup slightly Metalsand minerals take a fall Cs~~De ||- Dee l l S~~ ee l BW ree 4 11 A.t Public Disclosure Authorized Public Disclosure Authorized Public Disclosure Authorized Public Disclosure Authorized Public Disclosure Authorized Public Disclosure Authorized Public Disclosure Authorized Public Disclosure Authorized
Transcript of February MARKETS 175q4q 5M - Public Documents...

COMMODITY February
o MARKETS 175q4qANDTHE DEVELOPING COUNTRIES I l 5M
Commodities and the EastAsian crisis
Oil prices continue to weaken
Food prices up slightly
Metals and minerals take a fall
Cs~~De||- Dee
l l S~~ eel BW ree 4
11 A.t
Pub
lic D
iscl
osur
e A
utho
rized
Pub
lic D
iscl
osur
e A
utho
rized
Pub
lic D
iscl
osur
e A
utho
rized
Pub
lic D
iscl
osur
e A
utho
rized
Pub
lic D
iscl
osur
e A
utho
rized
Pub
lic D
iscl
osur
e A
utho
rized
Pub
lic D
iscl
osur
e A
utho
rized
Pub
lic D
iscl
osur
e A
utho
rized

CONTENTS AND SUMMARY
SUMMARY PAGE 4 * COFFEE PAGE 13
Drought-induced production shortfalls inSPECIAL FEATURE Indonesia are keeping world prices at fairlym How IS THE ASIAN FINANCIAL CRISIS AFFECTING high levels. A large crop is expected in Brazil
COMMODITIES? PAGE 6 later this year, which should bring down
The recent currency devaluations and economic prices.
slowdown in five EastAsian countries have con- * TEA PAGE 14
tributed to sharp declines in some commodity Rising demand continues to push up prices
prices and lesser declines in others. at all the major auctions. Production is
beginning to recover from the ill effects ofENERGY drought in major producing countries,* COAL PAGE 8 except in Indonesia. Still, prices are likely to
Weak demand in Asia and Europe and rising remain high because of rising global demandsupplies in a number of countries lead to and low stocks.lower international spot prices. Prices are
expected to decline in 1998 because of FOODincreasing production and weak demand in FATS AND OILSAsia following the financial crisis. * FATS AND OILS PAGE 15
* NATURAL GAS PAGE 8 The effects of the currency crisis in East Asia
US gas prices, which began falling in mid- may not be as large as originally anticipated.
November, remain low due to mild weather. Prices enter a moderate but clear uptrend.Storage levels are above last year's levels, Stock to use rates are very low.
and a price spike this winter is now unlikely. * COCONUT OIL PAGE 15The EU agrees to liberalize up to a third of The currency crisis in East Asia is having lit-its gas market by 2010, but effective market tle effect on prices. Prices are likely to turn
CHANGE IN QUARTERLY opening by then is actually likely to exceed upward as expected lower yields for majorPRICES, 3Q97 TO 4Q97 50%, and prices to consumers are likely to producing countries become evident.Percent fall. * PALM OIL PAGE 16
Energy + 1.0 * PETROLEUM PAGE 9 Prices rebound to last year's levels. IndonesianNonenergy -5.6Total agriculture -5.2 Oil prices fall sharply on higher OPEC sup- export policies, in combination with lower
Beverages -6.6 plies and weaker demand because of mild yields, especially in Malaysia, are expected toTotal Food + 1.6Fats and oils +5.7 weather and the financial crisis in Asia. Unless put upward pressure on world prices.Grains -2.0 significant volumes of oil are kept off the mar- * SOYBEAN OIL PAGE 16Other foods -1.1
Raw matenals -12.4 ket, prices are apt to remain low this year. Iraq Prices are up again. Production is expectedTimber -20.4 remains an important wild card. The UN is to increase in South America due to favor-
Fertilizers + 1.5SMetals and minerals -7.9 proposing higher humanitarian exports, able weather conditions. Rising incomes
which would add to the downward pressure boost soybean oil consumption in India.
on prices. But if escalating confrontation withIraq over weapons inspections leads to mili- GRAINStary conflict, Iraqi exports could drop to zero * GRAINS. PAGE 17
for an extended period. Prices decline following large harvests andthe effects of the East Asian currency crisis.
BEVERAGES However, low stocks and the prospects of
* COCOA PAGE 13 poor crops in the coming year because of El
Prices resume upward at the end of the quar- Niiio could keep prices volatile.
ter as market fundamentals keep signaling a * MAIZE PAGE 17
deficit. El Nifio could have a negative impact Low stocks and the potential for lower yields
on the 1998/99 West African crop. make for uncertain prices in the coming
2 COMMODITY MARKETS AND THE DEVELOPING COUNTRIES
CONTENTS AND SUMMARY
growing season. If El Nifio reduces US maize FERTILIZERSyields, as happened with the last three El * FERTILIZERS PAGE 22
Ninios, higher prices are likely. Prices continue to diverge, with weak nitro-
* RICE PAGE 18 gen prices but firm phosphate and potash
Devaluation of the baht brings Thai rice prices. Lower grain prices may spell troubleprices down some 18% in US dollar terms. for 1998 prices, as farmers cut back on fertil-
World production is up slightly and stocks are izer application rates.adequate, which means that prices may * POTASSIUM CHLORIDE PAGE 23
remain low for the next few months. Efforts to promote more balanced fertilizer
* WHEAT PAGE 18 use in major developing countries keep
Large production combined with weakened import demand and prices firm. Majordemand in East Asia should keep prices low exporters are hoping to raise prices.
unless production falters. Stocks are expect- * TSP PAGE 23ed to build in 1997/98. TSP and DAP prices remain strong as import
demand continues to support prices. The
OTHER FOOD Asian currency crisis has not yet resulted in a
* BANANAS PAGE 1 9 substantial weakness in prices.Prices continue their seasonal decline. The * UREA PAGE 24
EU responds to the WTO decision against Prices remain weak as China turns to domes-the EU banana regime. tic production rather than imports to meet its
* SHRIMP PAGE 1 9 consumption demand. China had been theThe weak Japanese economy and currency largest nitrogen fertilizer importer in recentresult in lower imports and weaker prices. US years.imports are increasing thanks to a strongeconomy and to changing tastes for seafood. METALS AND MINERALS* SUGAR PAGE 20 * ALUMINUM PAGE 24
Prices rise, but declines are anticipated. Panic The drop in prices during the fourth quarterbuying spreads through East Asia. New sup- appears linked to the Asian crisis. However,plies are expected on the market. strong consumption in Western Europe and
the US is supporting prices.AGRICULTURAL RAW * COPPER PAGE 25
MATERIALS Further erosion of Asian demand and signif-
* COTTON PAGE 20 icant increases in global production severely
Prices are still declining because of the depress prices in the second half of 1997.
Southeast Asian financial crisis. A slight Continued oversupply and an expected
increase in production will add another downward trend in prices are expected for
400,000 tons to world stocks. India and 1998. LME prices in 1998 should average
Turkey are introducing cotton futures con- between $1,750/ton and $1,800/ton, though
tracts. price swings in either direction are possible
* RUBBER PAGE 21 depending on how the situation in AsiaInternational prices appear ready to crash. unfolds.Producer prices improve following devalua- * GOLD PAGE 26
tions. Debt burdens may well increase. Prices fall to an 18 l/2 year low of $276 before
* TIMBER PAGE 22 rallying to $300/toz. Central bank selling
Asian timber prices are down sharply follow- and weak demand from Asia are both keep-
ing currency devaluations and falling ing prices low. Some major producers are
demand. African timber prices remain steady experiencing bankruptcies, and others are
as European demand for timber recovers. cutting down on production.
FEBRUARY 1998 3

CONTENTS AND SUMMARY
* IRON ORE AND STEEL PAGE 27 Beverage prices fell 5. 1% during the quar-
Fundamentals in the iron ore market have sup- ter, pulled down by sharp declines in coffee
pliers seeking up to a 10% increase in prices in prices. Cocoa and tea prices were higher for1998. Performance in steel markets continues the quarter. Expectations of large Brazilian
to vary among the three main consuming crops for the coming year caused the sharpregions. Asian prices are down the most drop in coffee prices. Arabica prices fell 12%
because of the currency crisis and could drag during the quarter. but regained some of theirUS and European steel down as exports are losses during December. Tea prices were
diverted from Asian to more buoyant markets. strong, lifted by steady demand and lower pro-
duction in Indonesia and Kenva.COMMODITY PRICES Food prices were up slightly for the quar-
* COMMODITY PRICE INDICES PAGE 5 ter. but rice prices fell sharply due to the cur-* COMMODITY PRICE OUTLOOK PAGE 28 rencv devaluations in Thailand. Wheat and
maize prices r ose following sharp declines dur-SUMMARY ing the summer. Vegetable oil prices were up
The currencydevaluations and economic slow- because of low stocks and prospects of lower
down in five East Asian countries contributed production in East Asian countries due toto sharp price declines in some commodities, wveather-related problems. Other food prices
including tropical products such as natural rub- were largely unchanged, with higher prices
berandtimberandmetalssuchascopper,zinc. for meat and shrimp and lower prices for
and lead. The overall index of nonenergycom- bananas and citrus.moditv prices declined 5.6% from the third to Asian timber prices were lower due to the
the fourth quarter. The index of petroleum currencv devaluations in East Asia, withpricesrose 1.0%forthequarter,butfellsharplv Malavsian log prices down more than 10%.
near the end of the quarter, from 87.6 in However. African timber prices remained firm,
October to 74.7 in December-a 14.7% decline. witlh Cameroon log prices 3.3% higher dur-Rising OPEC quotas and falling demand ing the quarter.
sparked bv the East Asian crisis caused crude The index of metals and minerals prices
oil prices to tumble. The threat of increased fell 7.9% during the quarter due to cyclicalIraqi exports also raised concerns over future factors and the East Asian crisis. Zinc and cop-
supplies. At the end of November OPEC agreed per prices were down the most, with zinc dowvn
to boost production quotas by 10% for the first 32.8% and copper down 16.4% fromhalf of 1998. But with many OPEC countries September to December. Other metals also
already producing at or above their quotas, no suffering declines included lead (down
large increases in OPEC supplies are antici- 10.0%),nickel (8.1%),steel products (6.8%),pated. Non-OPEC supplies, especiallv from the and aluminum (3.5%). Gold prices continued
North Sea, have been rising following the end to fall, losing 9.5% for the quarter. However;
of the summer maintenance period. Growth prices recovered toward the end of the quar-in oil demand in Asia is expected to slow, and ter as demand increased in response to low
world oil demand is expected to growjtust 2.0% prices and an apparent end to central bankin 1998. down from 3.0% in 1997. selling-at least for now.
4 COMMODITY MARKETS AND THE DEVELOPING COUNTRIES

COMMODITY PRICE INDICES
ENERGY (CRUDE OIL) NONENERGY COMMODITIESIndex: cwuent US dobs (1990=100) Index: curnt US dolars (I990= 100)150 130
1209 120
90A
60 9
30 8083 84 85 86 87 88 89 90 91 92 93 94 95 96 97 98 83 84 85 86 87 88 89 90 91 92 93 94 95 96 97 98
TOTAL FOOD METALS AND MINERALSIndex: curnet US dobs (1990=100) Index: curtnL US dolars (1990 100)140 140
130
120 2
P.K0
70 683848.586878889909192939495969798 83848586878889909192939495969798
TABLE 1. WEIGHTED INDEX FOR PRIMARY COMMODITY PRICES FOR LOW- AND MIDDLE-INCOMEECONOMIES IN CURRENT DOLLARS(1990= 100)
Nonenrgy Metalscommad- Total agnl- Total Fats Other Total raii and
Energy ities culture Beverages food and oils Grains food rnaterals Timber Fertilizers minerals(l00)3 (100) (69.1) (16.9) (29.4) (10.1) (6.9) (12.4) (22.8) (9.3) (2.7) (28.2)
Annual1995 75.1 122.2 131.3 151.2 116.9 136.6 120.4 98.8 135.2 139.5 103.6 101.61996 89.3 1 15.1 125.5 126.5 123.6 147.0 140.6 95.0 127.1 139.5 1 19.8 89.11997 83.8 1 17.6 128.7 171.0 1 16.1 147.7 1 12.1 92.4 1 13.7 125.8 1 19.7 90.2
Quarterly1996Q4 101.4 1 10.8 120.7 124.0 1 16.8 147.8 118.4 90.5 123.3 139.9 123.0 85.11997Q1 91.8 119.3 130.0 150.7 122.5 154.5 122.7 96.3 124.4 140.2 124.2 92.51997Q2 80.4 126.0 139.6 197.8 119.5 151.8 116.5 94.8 122.4 140.5 120.0 93.11997Q3 81.1 116.0 126.0 173.6 110.2 138.5 105.7 89.5 111.3 124.3 116.4 91.31997Q4 81.9 109.4 119.4 162.1 112.1 146.3 103.6 88.7 97.2 98.7 118.2 84.1
Monthly1996Dec 103.2 110.7 119.7 120.1 117.4 150.2 117.9 90.3 122.4 135.8 123.0 87.41997 Jan 101.5 115.0 124.2 129.4 121.4 152.0 123.7 95.1 123.8 139.0 124.5 91.61997 Feb 89.3 1 19.2 130.0 151.3 122.2 153.9 122.6 96.0 124.3 140.2 124.1 92.11997 Mar 84.5 123.7 135.9 171.3 123.9 157.5 121.6 97.7 125.1 141.2 124.1 93.71997 Apr 78.2 124.0 137.4 179.8 124.7 158.0 119.4 100.4 122.4 140.0 122.5 91.21997 May 84.7 129.8 144.7 219.7 119.3 152.9 118.7 92.2 122.0 140.5 118.8 94.21997Jun 78.3 124.2 136.7 193.8 114.6 144.4 111.4 91.9 123.0 141.0 118.8 94.01997Jul 80.1 117.5 127.6 173.4 110.2 137.7 106.6 89.8 116.1 133.8 117.9 92.61997Aug 81.7 116.2 125.9 173.0 110.0 136.5 106.2 90.6 111.4 123.9 115.7 92.519975ep 81.6 114.2 124.5 174.2 110.5 141.2 104.2 88.8 105.9 114.2 115.7 88.819970ct 87.6 110.5 120.0 160.9 111.1 143.7 105.5 87.6 101.1 103.7 116.1 86.91997 Nov 83.4 109.4 119.1 156.4 113.4 149.4 102.4 90.0 99.0 100.8 118.5 84.51997 Dec 74.7 108.3 119.0 169.0 111.7 145.8 103.0 88.6 91.5 91.6 120.0 80.8
INte egWehted by average 1987-89 export values for low- and middle-nrcome economiesa. Cnrde oil indexSource: World Bank. Development Prospects Group
FEBRUARY 1998 5

SPECIAL FEATURE
HOW IS THE ASIAN FINAN- price changes and on their respective elastic-
CIAL CR ISIS AFFECTING ities. Fourth, the lowerworld market prices will
COMMODITIES? reduce export revenues for other exportersin Asia, Africa, and Latin America that have
The recent currency devaluations and eco- not devalued their currencies.
nomic slowdown in five East Asian countries(Indonesia, Republic of Korea, Malaysia, the SOME SPECIFIC EFFECTS ON COMMODITIES
Philippines, and Thailand) have contributed Asia, including Japan, consumes nearly a
to sharp declines in some commodity prices quarter of the world's oil while producing aboutand lesser declines in others. For some other 10% of it. However, Asia has accounted for acommodities, however, other factors offset the disproportionately large share of the growth
negative impact of the slower economic growth in oil consumption over the past decade-nearly
and currency devaluations, causing prices to 50%. But although oil prices have been sup-
rise during the second half of 1997. The Asian ported by this rapid demand growth, the levelregion has accounted for the greatest demand of OPEC supplies has been the more dominant
growth in many commodities in recent years, influence on prices. The recent decline in pricesmagnifying the impact of the economic crisis has had less to do with the Asian currency cri-
on commodities. The currency devaluations sis than with OPEC's decision to raise quotasshould also make exports from these coun- by 10% andwith the resumption ofIraqi exports.tries more competitive, which will pressure Among agricultural commodities, naturalproducers in Africa and Latin America. rubber, tropical timber, and rice experienced
the largest price declines because the five AsianECONOMIC EFFECTS OF THE CRISIS countries are large producers or exporters of
The crisis has had several economic effects these commodities (table 3). Metals prices were
on commodity markets. First, the prices of com- not as directly affected since the region is notmodities exported by the five Asian countries a dominant exporter of these commodities.
fell in US dollar terms as currencies were deval- The declines in metals prices from July toued. Second, slower economic growth and December, particularly for copper and zinc,
higher import prices have reduced import wereduetootherfactorsincludingrisingworlddemand. Third, the slower growth in the five supplies and generally slow growth, which in
Asian countries and the lower US dollar import Japan had predated the current crisis in Eastprices also affected economic growth and Asia. Some metals, such as aluminum, experi-
demand in other countries. Whether these off- enced price increases despite the crisis in Asia.setting effects increase or decrease import Natural rubber prices fell 22.7% fromJulydemand depends on the extent of income and to December largely because Thailand,
TABLE 2. SHARES OF THE FIVE ASIAN CURRENCY CRISIS COUNTRIES IN COMMODITY PRODUCTION,
CONSUMPTION, AND TRADE
(percentoge of world totols)
Commodity Production Imports Exports Consumption
Petroleum 3.6 8.3 4.6 5.9Oilseeds 4.2 7.9 0.2 5.4Grains 4.4 12.5 2.5 5.5Sugar 7.8 10.6 12.9 7.1Natural rubber 75.5 - 0.0 80.7 n.a.Aluminum 1.1 3.0 1.9 6.5Copper 4.1 8.1 1.6 7.8Lead 5.0 10.0 0.0 10.0Nickel 1.0 4.0 0.0 4.9
n.a. Not available.Source: World Bank staff calculations.
6 COMMODITY MARKETS AND THE DEVELOPING COUNTRIES

SPECIAL FEATURE
Indonesia, and Malaysia account for 70% of LONG-TERM EFFECTS
world production and their currency devalu- The longer-term effects of the Asian crisis
ations lowered international (US dollar) will depend on economic growth and
prices. Similarly, tropical hardwood prices fell exchange rates in the five Asian crisis coun-
because Malaysia, the Philippines, Thailand, tries and in the region as awhole. If economic
and Indonesia are all major exporters. And growth returns to its previous rate after a briefrice prices fell because Thailand accounts for adjustment, the effects on commodity demand
more than a quarter of world exports. Price will be small. However, if economic growth
declines were smaller for commodities for remains sluggish for a number of years, com-
which the five Asian countries are not major modity demand in the region will remain lowerexporters, and even rose for some commodi- than it would otherwise have been. The cur-
ties. The five countries account for 11% of rency devaluationswill keep the prices of major
coarse grain imports and 10% of wheat commodities produced in the region lowerimports. Wheat prices were up 6.2% and maize for a while and will reduce exports from other
prices were up 6.9%. The USDA's forecast is countries that do not devalue their curren-
for a 3% increase in world grain imports for cies. Tropical timber from Africa is an exam-1997/98, suggesting that any decline in world ple of a commodity that will likely see exports
demand would be small. Coffee prices also decline due to the lower prices of Asian
dropped, but the decline was due to increased exports, although African timber prices havesupplies in Africa and Latin America rather not yet declined along with the Asian prices.than to demand changes in Asia. The five Asian Rice exports from India and Pakistan could
countries account for less than 2% of world also be reduced because the devaluation ofcoffee imports. Cocoa and tea prices both rose the baht lowered Thai rice export prices.
during the second half of 1997. In fact, one of the effects of the currencyCopper and zinc prices fell 27-28% from devaluations in Asia is already being reflected
July to December for reasons largely unrelated in Thailand's rice exports. Thailand accountsto the Asian crisis. The five Asian countries for about one-third of world rice exports. The
account for only 8% of world copper con- baht was devalued from 25.78 baht/US$1 in
sumption and 8% of imports and 6% of zinc June 1997 to 37.395 baht/US$1 in October 1997consumption and 10% of imports. The drop (45.1% decline), while the US dollar price of
in lead and nickel prices was due in part to rice exports decreased from $323.3/ton inJunelower consumption in the Asian region, to $265.8/ton in October (17.8% decline).
though the five Asian crisis countries account Thailand's rice exports have been up sharply
for only 5% of world nickel consumption and since the new crop became available, with10% of lead consumption. Though Malaysia exports for the firstfive weeks of 1998 at 834,495
and Indonesia are large tin producers and tons, nearly double the 440,306 tons during the
account for about 40% of world exports, tin same period of 1997. The increase is due, inprices have not declined appreciably. part, to the devaluation of the Thai currency.
TABLE 3. COMMODITIES EXPERIENCING LARGEST PRICE DROPS, JULY-DECEMBER 1997
Average Percentoge changeCommodity Price unit january-june July December July to December
Copper LME, $/mt 2,463.4 2,450.5 1,762.3 -28.1Zinc LME, cents/kg 123.8 151.8 110.2 -27.4Natural rubber Malaysia, cents/kg 117.5 93.9 72.6 -22.7Lead LME, cents/kg 65.4 63.4 52.7 -16.9Rice Thai 5%, $/mt 329.8 320.0 269.7 -15.7Timber Logs, Malaysia, $/m 245.8 254.3 211.1 -17.0Nickel LME, $/mt 7,427.1 6,835.5 6,139.5 -10.2
Source: World Bank staff calculations.
FEBRUARY 1998 7

ENERGY
COAL NATURAL GAS5 = S 56.50 YEARLY (US dollars/mt) 3.82 3 0 (US doltals/nmbtu)
1981 US themoI, fo.b. Hompton JAN 2.5 Spot, Lonry Hub,Roods Norfolk ..96. Louisiana.
* - _6| \ 3.04
80 85 90 95
* 5 ~~~~~~~~~~48.501984
j _ l V \ 6 2.48 / \
t I ~~~ ~ ~~~~~~~~MAY 43 02.33
* ~~~~~~980DE39.1 2 9 997
1995~~~~~~~~~~~~~19
36.17 36.21 MAR1987 1997 1996
PRICES WEAKEN AS SUPPLIES GROW US PRICES RISE ON STRONG STORAGE DEMAND BUT
International coal prices weakened further FALL WITH MILD WEATHER
in the fourth quarter, hurt by faltering demand US natural gas prices rose in October and
and growing supplies. Steam coal contracts early November on strong demand for stor-for 1998 between Australian producers and age, early cold weather, and concerns about
Japan's Chubu Electric Power were settled at supply deliverability should the winter turn
$3 per metric ton (mt) below last year's levels. out to be colder than normal (traders recalledThe settlement is no longer seen as a bench- the price spikes of the past two winters).
mark, and otherJapanese utilities may push for However, prices started to recede from their
further cuts. The effects of the financial crisis peak in mid-November and were driven lower
in Asia are expected to weaken coal demand by warmer-than-normal temperatures in
this year (and possibly next), starting in the December. Prices fell further in January as
industrial sector and then spreading to electric mild weather continued to slow demand, and
power. Coal importers are likely to make more storage levels remained above last year's.
spot purchases at very competitive prices- Expectations for a mild winter have
given abundant supplies-and to reduce long- increased, as the El Nifio effect unfolded as
term contracts. Partly offsetting the effects of many predicted, at least for the heating regions
lower coal demand will be the switching away of North America. And because of surplus
from more expensive oil and liquefied natural inventories, not even a bout of late-winter cold
gas where possible, as is reportedly occurring weather is likely to result in sharply higherin the Republic of Korea. prices. Storage withdrawls in February and
Production continues to grow in a number March are expected to be higher than lastyear's
of countries, particularly in South Africa and low levels, which could see end-March inven-
Colombia, and Australia's higher-cost exports tories below last year's 990 billion cubic feetare being held up by the depreciating (Bcf). However, inventorieswould be well above
Australian dollar. Over the medium term pro- the record low of 758 Bcf in 1996 and should
ductivity improvements are expected to lower provide for a season of strong injection demand.prices, despite anticipated demand growth Butmuchwilldependontheweather.With
and eventual economic recovery in Asia. a very mild winter, prices could slip well below
Prices were relatively firm in the US. Coal $2 per million btu (mmbtu), though the rel-
demand by the electricity sector-which con- atively low storage levels should prevent too
sumes 90% of coal used in the US-grew 3% much gas from being dumped on the mar-despite slow growth in electricity demand. ket. In addition, lower gas prices would cap-
8 COMMODITY MARKETS AND THE DEVELOPING COUNTRIES

ENERGY
ture a portion of the dual-fuel market away PETROLEUMfrom oil, thereby strengthening demand. 23.23 40
Prices are expected to hover in the JAN
$2.00-$2.20/mmbtu range during much of 20
the year, reflecting little upward pressure. New 80 85 90 95 10
US pipeline capacity in 1997 has improved gasdeliverability and will reduce the chance of 20.04
bottlenecks. Some concerns remain over US 1937 J997MAYA
supply-particularly in the shallow-water Gulf \ 997
of Mexico-but production is expected to
increase steadily from the Gulf's deep-waterareas and more than compensate for losses JUN
(US doflorsIbblj 1997
elsewhere, particularly over the mid-term. Spot, aeroge ofBrent, 1709Duboi, ond West Texas DEC
Exports from Canada will also rise this year Intermediate 1997
following pipeline expansions, and further
expansions are due to be completed over the EXCESS SUPPLIES AND WEAKENING DEMAND HURT
1999-2002 period. PRICES
Gas prices fell slightly in Europe where con- Crude oil prices came under severe down-tracts are indexed to the price of petroleum ward pressure in late 1997, suffering multi-
products. In December the EU reached agree- ple blows from rising OPEC production,ment on liberalization of its natural gas mar- weakening demand stemming from the finan-
ket, paving the way for competition in some cial crisis in Asia, mild winter weather, andof the continent's most closed markets. expectations of increasing exports from Iraq.Liberalization is scheduled to be phased in Prices began the year at $24 a barrel but ended
over 10 years in three stages, and at least a it near $16 before dipping below $15 in early
third of the market will be able to pick sup- 1998. Unless a significant volume of produc-pliers by 2010. Effective market opening is tion is kept off the market, oil prices couldexpected to reach an even higher 44% by then, be relatively low this year.
and some analysts predict that it will reach Oil prices were reasonably stable during
50-60%, reasoning that once liberalization much of 1997, averaging$19abarrelbetween
starts, momentum will move it along quickly. February and November. Non-OPEC supplies
While the EU directive will not instantly failed to increase as expected, allowing OPECbring about a competitive market, it provides production to rise-albeit through quota vio-
a framework for a truly competitive market to lations-with little impact on prices. Tradersemerge. Market participants have been posi- took a run at prices in late September hop-
tioning themselves for some time in anticipa- ing to repeat the price spikes of the previoustion of greater competition. Some member winter when low stocks, cold weather, andstates are further advanced than others, par- the failure of Iraqi exports to enter the mar-
ticularly the UK. By the end of 1998 all cate- ket as expected led to a surge in prices.gories of UK consumers in all parts of the However, market conditions were muchcountry should be able to choose their gas sup- improved in 1997, as reflected in much higherpliers. The UK-Belgium Interconnector gas inventories, and the rally was short lived. Pricespipelinewillbegin operationin October1998, peaked at $21.50 in early October and, lack-facilitating exports of spot-price UKgas to buy- ing momentum and support from funda-
ers in the heart of Europe. Increased compe- mentals, they quickly receded.tition is likely to bring down the price of gas At the end of November OPEC agreed
delivered to consumers, andrealprices to pro- to raise production quotas by 10%, or 2.5
ducers are projected to decline over time. million barrels per day (mb/d), for the first
FEBRUARY 1 998 9

ENERGY
half of 1998, from 25.033 mb/d to 27.5 mb/d when the deal expires. With significantly(table 4). Quotas were raised 9.5% for all lower oil prices, Iraq will have to export
countries except Algeria, which garnered a greater volumes of oil to meet the dollar tar-
larger 21% increase. During the fourth quar- get. Exports averaged 1.1 mb/d under the
ter OPEC produced 27.85 million barrels a second arrangement, but may have to riseday (mb/d), which was 2.82 mb/d above its as high as 1.3 mb/d, depending on prices.old quota. All countries were producing The first 90-day period ends March 4, giving
above their previously assigned levels. Iraq little more than 50 days to reach its allot-
Venezuela was 0.93 mb/d above quota, fol- ted sales figure. It may have to strain its pro-lowed by Saudi Arabia at 0.63 mb/d over duction-export capacity of near 2 mb/d
(including its half share of Neutral Zone out- (domestic consumption is estimated at 0.6put), Nigeria at 0.46 mb/d, and Qatar at 0.30 mb/d).
mb/d. More troublesome for oil prices, the UN
DuringthequarterOPEC'sproductionwas is proposing to more than double Iraq's
ratcheted up some 0.57 mb/d, contributing humanitarian sales to $5.2 billion every six
to the weakness in prices. Most of the increase months. UN Secretary General Kofi Annanoccurred in the Gulf countries outside of Iraq. has said that $2 billion is inadequate to pre-
Saudi Arabia's production rose from 8.35 ventfurtherdeteriorationinlivingconditions
mb/d in the third quarter to 8.67 mb/d in and that the increase is badly needed to buy
December, only 0.09 mb/d below its new food, medicine, and other essential goods. It
quota. Kuwait's output in December was is uncertain whether Saddam Hussein willalready slightly above its new quota level of accept the increase, given his broader disputes
2.19mb/d,whileVenezuela,NigeriaandQatar with the UN over arms inspections and thewere producing well above their new quotas full lifting of sanctions, as well as the possi-in the fourth quarter, by a combined total of bility of military attacks from the US and some
1.25 mb/d. of its allies.
With many OPEC countries producing Non-OPEC supplies rose 0.82 mb/din thenear or above their new quotas in the fourth fourth quarter, with relatively large gains from
quarter, there was no flood of new OPEC pro- the North Sea following a return from sum-ductionatthestartofthisyear. OPEC'sJanuary mer maintenance and the start-up of new
productionwas estimated at 0.51 mb/d above fields. Elsewhere, much of the increase in
December's level, with Iraq accounting formost of the increase (0.45 mb/d). Moreover, TABLE 4. OPEC CRUDE OIL PRODUCTION
Algeria, Indonesia, Iran, and Libya will not be AND QUOTASMillirons of barrels per day
able to immediately raise output to their newassigned levels, and combined production 1995 /996 3Q97 4Q97 Quotas
Algera 0.76 0.82 0.85 0.86 0.908from these countries could be as much as 0.5 Indonesia 1.34 1.39 1.37 1.33 1.456
mb/d short in the first quarter. Nevertheless, Iran 3.65 3.67 3.58 3.72 3.942Iraq 0.55 0.58 1.22 1.21 1.314
OPEC production is expected to continue to Kuwait 1.84 1.81 1.83 1.88 2.1 90a
rise as countries broach their new quotas, and Libya 1.41 1.39 1.43 1.42 1.522Neutral Zone 0.43 0.48 0.54 0.55
as Iraq's exports rise to expected new levels Nigeria 1.93 2.15 2.28 2.32 2.042
in 1998. Qatar 0.45 0.49 0.65 0.68 0.414Saudi Arabia 7.94 7.91 8.08 8.35 8.761aIraq's third six-month tranche of oil UAE 2.20 2.23 2.25 2.24 2.366
exports began flowing in January-earlier Venezuela 2.75 2.94 3.22 3.29 2.583than anticipaed-whic add to te pTotal Crude 25.23 25.84 27.28 27.85 27.500
than anticipated-which addeda to the pres- NGLsb 2.42 2.61 2.83 2.86
sure on prices. Iraq is allowed to export $2.14 Total OPEC 27.66 28.45 30.12 30.71
billion in oil (higher than the $2 billion under a. Quota includes haf share of Neutra Zone.b. Natsral gus liquids.
the first two agreements) until early June, Source: Intemational Energy Agency and OPECNA.
10 COMMODITY MARKETS AND THE DEVELOPING COUNTRIES

ENERGY
TABLE 5. NoN-OPEC OIL SUPPLY in countries such as Angola, Brazil, andMillions of barrels per day Colombia.
995 1996 3Q97 4Q97 3Q97 to 4Q97 Weak demand has also contributed to theUnites States 8.61 8.59 8.53 8.55 0.02 decline in oil prices. Mild winter weather inCanada 2.40 2.46 2.58 2.62 0.04 the Northern Hemisphere curtailed oilUnited Kingdom 2.79 2.81 2.67 2.96 0.29Norway 2.91 3.23 3.14 3.36 0.22 demand at the peak of the heatig season.Other OECD I .31 1.35 1.43 1.41 -0.02 In addition, currency devaluations in severalatin America 2.58 2.68 2.80 2.84 0.04 Asian countries resulted in substantial
Middle East 1.87 1.89 1.88 1.89 0.01 increases in the cost of oil imports, and com-China 2.99 3.12 3.19 3.15 -0.04 panies immediately canceled contracts andOther Asia 2.14 2. 11 2.09 2.15 0.06FSU 7.13 7.07 7.28 7.26 -0.02 began running down stocks. It is uncertainEastern Europe 0.23 0.22 0.22 0.22 0.00 to what extent the reduction in demandProcess ng gain 1.46 1.52 1.56 1.60 0.04Tota non-OPEC 42.50 43.57 44.24 45.06 0.82 caused the fall in oil prices, given lags in data
Note: Includes natural gas iquids (NGLs), norsonventiona and other supply on consumption and the extent to whichsources.Source: Intemational EnergyAgency stocks were drawn down (table 6).
The reduction in economic activity result-
supplies occurred in Latin America, with ing from the financial crisis will affect the
notable gains in Colombia, Brazil, and Mexico growth of oil demand in 1998 and likely in
(table 5). 1999 as well. While the five affected AsianFor the full year 1997 non-OPEC supplies countries-Indonesia, the Republic of Korea,
were up less than 0.8 mb/d, falling short of Malaysia, the Philippines, and Thailand-the International Energy,Agency's (IEA)fore- account for only 6% of world oil demand,cast at the beginning of the year of slightly they have accounted for about a quarter of
more than 2.0 mb/d. The largest shortfalls the growth in oil demand (outside of the for-
were in the North Sea, where projected growth mer Soviet Union) over the past decade, ledwas 0.8mb/d but production was only mar- by especially large growth in Korea. All of
ginally higher than in 1996. Technical diffi- Asia, including China and Japan, hasculties and delayed start-up ofnew fields were accounted for half of the growth in oil
behind the failure. The non-OECD increase demand.
of more than 0.6 mb/d was also below Growth in oil demand in Asia (excludingexpected growth of 1.0 mb/d, with shortfalls China and Japan) is expected to slow to 0.2
TABLE 6. OIL CONSUMPTION
Millions of barrels per doy Percentage change
FSU and Developing FSU ond DevelopingOECD Eastem Europe countdes Total OECD Eastern Europe counares Total
1990 38.3 9.9 18.2 66.3 04 -4.4 3.7 0.51991 38.3 9.4 19.0 66.7 0.2 -4.7 4.6 0.71992 39.0 8.2 20.1 67.3 1 7 - 3.0 5.8 0.81993 39.2 7.0 2 .5 67.7 05 -14.6 7.1 0.61994 40.2 6.0 22.5 68.6 24 -14.3 4.5 1.31995 40.6 6.0 23.5 70.1 1 0 0.0 4.6 2.11996 41.3 5.5 24.9 71.7 1 9 -8.3 5.8 2.31997 41.8 5.7 26. 73.6 1 1 3.6 5.0 2.61 Q96 42.3 5.9 24.9 73.1 2.6 -6.3 5.2 2.7
2Q96 39.8 5.4 24.7 69 9 1 0 -5.3 6 3 2.33Q96 40.8 5.4 24.6 70.8 2.0 -3.6 5.6 2.84Q96 42.4 5.4 25.5 73.3 2.0 -11.5 5.8 2.1IQ97 42.0 5.7 25.9 73.6 -0.7 -3.4 4.1 0.7
2Q97 40.9 5.7 25.5 72. 2.8 5.6 3.2 3.13Q97 41.7 5.7 26.1 73.5 2.2 5.6 6. 3.84Q97 42.7 5.9 26.6 75.2 0.7 9.3 4.3 2.6
Source: lnternational Energy Agency and World Bank.
FEBRUARY 1998 11

ENERGY
mb/d, down from recent growth of around ket share. OPEC may, in fact, let events unfold0.6 mb/d. World oil demand is projected to without interference until its scheduled meet-increase by 1.5 mb/d or 2% this year, down ing in June.from nearly 3% last year (table 7). The IEA An important wild card is Iraq. Should
projects that non-OPEC supplies will rise by the UN allow exports of $5.2 billion every
just 1.4 mb/d-less than originally forecast- six months, Iraq would likely not be able tobecause of tightness in the equipment and sustain a level of production to meet this
services sector that is delaying the start-up of target at current low prices. Nevertheless,
new fields. the higher export level would allow theThe projections showlittle roomforgrowth country to maximize exports at around 1.5
in OPEC production. Assuming that OPEC mb/d, exacerbating the downward pressurecontinues near itsJanuary level of 31.0 mb/d on prices. However, Iraq might delay or
(including natural gas liquids), there would refuse acceptance of higher export levels,
be sizable stockbuilds in each of the quarters, fearing that acceptance would reduce thewith an annual average build in excess of 1.5 pressure on the UN to lift sanctions com-
mb/d (table 7). Should demand be lower than pletely. In addition, if US-led military strikes
expected and should Iraqi exports increase, against Iraq take place, that could disrupt
the implied build would be even higher. exports for an uncertain period. The dis-
Moderate shortfalls in non-OPEC supplies continuance of Iraqi exports this yearwouldwould do little to correct the imbalance. improve the oil market balance considerably,Without significant output reductions by but could still result in oil prices below lastOPEC, oil prices could remain low through- year's levels.out the year. A further downside risk is a spreading of
There appears to be little upside potential the East Asian financial crisis to other devel-on the demand side, either from cold weather oping countries, resulting in lower economicor from quick recovery in Asia. It is also doubt- growth and weaker oil demand. Again, with-ful that OPEC will take coordinated action to out significant volumes of production beingreduce output, given the conflicting positions taken off the market, the result could bewithin the organization-Venezuela's chronic extremely weak prices this year. Obviously,
overproduction and pronouncements about there is considerable uncertainty about oil
doing away with quotas, and the Gulf coun- prices, given the uncertainty surrounding
tries' (notably Saudi Arabia's) desire for mar- demand, Iraqi exports, and OPEC action.
TABLE 7. WORLD PETROLEUM DEMAND AND SUPPLYMilhions of barrels per day
1995 1996 IQ97 2Q97 3Q97 4Q97 1997 1Q98 2Q98 3Q98 4Q98 1998
DemandOECD 40.6 41.3 42.0 40.9 41.7 42.7 41.8 42.7 41.1 42.1 43.5 42.3FSU 4.8 4.3 4.3 4.4 4.5 4,6 4.4 4.7 4.5 4.3 4.8 4.6Other 24.7 26.1 27.3 26.8 27.3 27.9 27.4 28.2 27.7 27.9 28.9 28.2Total 70.1 71.7 73.6 72.1 73.5 75.2 73.6 75.6 73.3 74.3 77.2 75.1
SupplyOECD 18.0 18.4 18.6 18.2 18.3 18.9 18.5 19.0 18.6 18.8 19,7 19.0FSU 7.1 7.1 7.0 7.2 7.3 7.3 7.2 7.3 7.3 7.3 7.4 7.3Other 17.3 18.0 18.5 18.5 18.7 18.9 18.6 19.0 19.3 19.5 19.7 19.5OPECb 27.7 28.5 29.6 29.6 30.1 30.7 30.0 31.0 31.0 31.0 31.0 31.0Total 70.1 72.0 73.7 73.5 74.4 75.8 74.3 76.3 76.2 76.6 77.8 76.8
Stock change and miscellaneousOECD -0.3 -0.1 0.3 0.2 0.6 0.1 0.3Floating/transit 0.1 -0.1 0.1 0.5 0.5 -0.4 0.2Other/miscellaneous 0.3 0.5 -0.4 0.7 -0.2 0.9 0.2Total 0.1 0.3 0.1 1.4 0.9 0.6 0.8 0.7 2.9 2.3 0.6 1.7
Note: Includes natural gas liquids (NGLs), nonconventional, and other supply sources.a. Includes processing gains ( 1.6 mb/d in 1997).b. Includes NGLs (2.8 mb/d in 1997).Source: International Energy Agency and World Bank.
12 COMMODITY MARKETS AND THE DEVELOPING COUNTRIES

BEVERAGES
COCOA COFFEE Coffee prices(US centslkg) I 7655 (US centskg) 589.2 50o fall sharply dueICCO daiiy pnce, SEP 173 90 IC0 indicotor pnce, other MAY toep0cNew York ond Londoon 1997 DEC mid orabicr. New York 1997 to expected
N6883 /17 andBremenlHlmbN.0 large supplies
i 97 \ 80 85 90 95 100 from Brazil.
1990= 100
418.6 197.8A563 /tSEP 1997
56392.2A 2 997 3915 2 Q2IVAY ~~~~~~~~~~~~~~97DEC
1997 80 85 90 95 W 1997 \1997
JAN DIETONBAILA RO
I 996 ~~~~~~~~~~~~~~~~~~~~~~~~~~~~~~~~~353.3
Prices~~~~~~~~~~~~~~~~~~5 feli coe n oebro rcso rbc ofefl 2 nOVe 15.
200 1997
137.29 1~~~~~~~~~~~55 292.91FEB o JA 7
1997 ~~~~~80 85 90 95 JAN9 1973.Q3
162.1PRICIES SEESAW AS THE MARKET LOOKS PRICES FALL ON PROSPECTS OF A LARGE 1997
FOR DIRECTION BRAZILIAN CROP Q
Prices fell in October and November on Prices of arabica coffee fell 12% in the 150.7'997
reports that the West African crop was larger fourth quarter, before strengthening some- Q'
than expected, and investment funds were sell- what during December. This is the second con-ing futures contracts, possibly responding to secutive quarterly price decline brought onthe more optimistic crop forecasts. Estimates by expectations of a large Brazilian crop for
indicate that Ghanaian crops will be almost 1998/99. That crop will be harvested during13% percent higher than last year and that the next summer in the northern hemisphere,Ivorian crops will be up 5%. Crops in and preliminary forecasts call for a crop ofCameroon and Nigeria will also be higher, so 30 million bags, up from the 26 million bagsthattotalWestAfrican cocoaproduction ispro- produced during the 1997/98 season.
jected to be some 6% higher than last year. Colombia's 1997/98 crop which is currentlyOverall, however, the cocoa market is expected being harvested, is likely to be 7 million bagsto experience yet another year of structural higher than last year's crop, further depress-
deficit, estimated at between 150,000 and ing arabica prices.
200,000 tons, with production down 10% in Robusta prices increased slightly for theAsia and 13% in Latin America. Prices started fourth quarter, pulled up by substantial pricerising again in early December, a change that increases during December. The drought-some analysts attributed to the liquidation of induced (likely El Nifno-related) decline in
short positions held by investment funds. Prices Indonesian production contributed to thein the last quarter of 1997 were 17% higher strongerprices. Indonesia'scurrent (1997/98)than in the same quarter in 1996. Prices are crop is estimated at 5 million bags, some 30 per-expected to rise in 1998 because of a projected cent lower than last year's crop. The market isdeficit in the market-eading to lower inven- especially concerned about Indonesia's 1998/99tories and a lower stock to consumption ratio- crop. If dry weather continues for another fewand the potential negative impact of El Nifno months, the 1998/99 crop could be even loweron the size of the 1998/99 West African crop. than the current crop. Several analysts fear
Cocoa prices in the next six months will thatElNifiomayalsocausedryweatherin West
be influenced by the level of arrivals in C6te Africa. If that happens, robusta production in
d'Ivoire. Although some analysts estimate that the region could suffer a serious blow.
arrivals have been slower than anticipated, A hopeful spot on the production side isarrivals are expected to increase in early 1998. Vietnam, which has not been affected by El
FEBRUARY 1998 13

BEVERAGES
Ninlo and had another record crop of 5.3 mil- TEAlion bags in 1996/97. Vietnam has been the
(US cennRig) 248.!main reason for the good availability of robus- London auctions, 244.8 DEC
average fora tea. AUG 1997
tas in the world market during the 1990s. Its 1997
production has been skyrocketing since the 230Q8
early 1990s, when it produced about 1.5 mil- i9 /
lion bags. At more than 6 million bags, the 227.3
1997/98 crop may be as much as 20% higher /997
than the previous year's bumper crop. Thisincrease is the result of favorable weather, 205.7 350
additional output from recently maturing JUL1997 300
trees, and the depreciation of the currency, 250
which has raised the real price of coffee sub- 182.7 20JAN i50
stantially in local currency terms. Vietnam is 1996 80 85 90 95
likely to be the world's largest robusta pro-
ducer in 1998. HIGH GLOBAL DEMAND BOOSTS PRICES
The financial crisis in East Asia has so far Tea prices at four major auctions contin-
had only a limited impact on the world cof- ued upward in the fourth quarter in responsefee market. Most of the countries involved in to high global demand. The average London
the crisis do not have large world market shares price was 233¢/kg for the quarter, 28% abovein coffee production. Because Indonesia's cof- the same quarter last year in nominal terms.fee supply has been reduced by the drought, Mombassa prices, already buoyant, rose 55%the substantial depreciation of its currency in nominal US$ terms following strongerhas not had the effect of increasing supply and demand from Pakistan and Egypt. Indian
reducing prices The impact of the deprecia- prices rose 57% on firm demand from Russiation has reportedly been greater in Vietnam, and Central Asia. And Colombo prices werehowever. If inflation rates are controlled, the up 16%, despite Sri Lanka's record crops,depreciations in both countries will have a sig- because of increased demand from Russia, the
nificant positive impact on supply in the long Middle East, Egypt, and the UK.
run. Production was higher in Bangladesh,
Unless there are substantial production India, and Sri Lanka, but down in Indonesiadeclines in Indonesia and West Africa this year, because of drought. Global production for the
world coffee prices are expected to weaken first nine months of 1997 was the same as induring 1998. Barring abnormal weather, pro- 1996, but still lagged behind global demand.
duction in other countries should increase as Kenyan exports declined in 1997 due to aproducers respond to the high prices coffee drought that had lasted untilJune 1996. Other
has enjoyed in world markets over the past few exporters benefited from the sharp reductionyears. in Kenyan exports. For example, Sri Lanka's
Coffee prices have been especially volatile output was up 8%, while its export earningsin recent years, with prices of other milds ris- rose 22.6%.ing 112% in 1994 over the previous year and Global demand is expected to continue tothen rising 49 percent in 1997 over 1996. increase, especiallyinCentralAsia, the Middle
Robusta prices rose 126 percent in 1994 rel- East, Egypt, India, and Russia. Demand for teaative to 1993, but they did not increase in 1997 in such value-added form as tea bags andalong with other milds prices. Other milds packed tea has been increasing as well in manyprices are expected to fall sharply in l998while developing countries. This strong demand
robusta prices are expected to remain largely together with low global stocks is likely to keep
unchanged. prices firm at least until mid-1998.
14 COMMODITY MARKETS AND THE DEVELOPING COUNTRIES

FOOD
FATS AND OILS COCONUT OIL PricesoffatsSTOCKS ARE SET TO DECLINE 768.0 (USdollors!mt) and oils are on
The Southeast Asian currency crisis still AN Phbupkneslndonesr, an uptrend, leddominates the news for fats and oils, affect- by soybean oil.ing production, consumption, and prices.Although its real effects are still to be deter- 1990 100
/22.5mined, they may not be as large as originally 1997
anticipated. Tree crops, such as coconut and 637 0 \JUN 627 0 / 95palm oil, which are produced mainly in 997 OCT \ 997
Southeast Asian countries, take much longer 1997 Q2
to respond to price changes than do soybeans 1;,000 \\or groundnuts. It takes several years before a _ 0586.0
600 ~~~~~~DECdecision to expand the area planted to tree 0 00 1997
crops is translated into higher production. 80 85 90 95 1997 \ 1121
Therefore, any major supply-side impact of Q4
the devaluation is unlikely to show up soon PRODUCTION IS SET TO DECLINE
for tree crops. SoutheastAsia is less important The East Asian currency crisis had little 110.2
on the demand side, since the region accounts effect on coconut oil prices. Prices rose a mod- Q3
for only 7% of global demand, part of which erate 3% over last quarter's average (fromis used as inputs into other exportable goods. $593/ton to $608/ton) but remain 23% lower
Prices of fats and oils entered a moderate than a year ago ($753/ton).butclearuptrendduringNovemberandearly World production of coconut oil isDecembe. Oil World forecasts that this season's expected to decline slightly, from 3.17 millionworld production of the 17 major fats and tons in 1996/97 to 3.12 million tons inoils will reach some 101.1 million tons. That 1997/98 (October-September). While pro-represents a 315,000 ton upward revision since duction in the Philippines (the dominantthe last forecast, but it is still less than needed coconut oil producer) will increase from 1.22to catch up with growth in demand. to 1.30 million tons, production in Indonesia
Crop prospects are good for South (the second largest producer) is expected toAmerica, where expansion in planted areas suffer an almost 13% decline (from 0.8 to 0.71coupled with good weather is expected to million tons). Production in India (the thirdboost soybean and sunseed production. The largest producer) is expected to remain aboutBrazilian soybean crop is currently estimated the same (0.35 tons). The pattern is similarat more than 30 million tons.World stock to in exports: up in the Philippines (from 0.95use rates are on a sharp decline and may even to 1.00 million tons) and down in Indonesiadrop below the 1993/94 record low, due to (0.56 to 0.46 million tons).increased demand outside of East Asia. The US and the EU, the dominant coconut
Oil World reports the current strengthen- oil importers, will absorb 0.51 and 0.62 mil-ing of prices is likely to continue. Itfinds that lion tons (about68%) ofworldexports,whichsince fundamentals for fats and oils are bull- are expected to decline from 1.71 million tonsish, owing mainly to the prospective produc- in 1996/97 to 1.64 million tons. Coconut oiltion-consumption deficit and the need to exports account for about 3% of world tradesharply reduce oil stocks. in the 10 major oils.
USDA forecasts global oilseed production Oil World reports a more optimistic pricefor 1997/98 at a record 283.6 million tons, outlook from about March or April 1998up 22.8 million tons from last year. Soybean onward, when the drought-induced drops inoutpIut is forecast at 152.3 million tons, up Southeast Asian yields (and consequently in1.7 million tons from last year. production) begin to be felt.
FEBRUARY 1998 15

FOOD
PALM OIL SOYBEAN OIL580.0 (US doliars/mt) (US dollorslmt) 676.0FEB MoLoysidn, 5% butk, Dutch, crude, NOV1997 c.i.f NW Europe. fo.b., ex-mill. 1997
566.0 0 00562.0 DEC 700APR 199760
567.0 \ 99 500JAN 547.01996 OCT 400
\ t99o 80 85 90 95 622.0
DEC1997
550.0JUN000 534.0 1997 557.0
JAN SEPI600 996 997
490.0 527.0
200 JUL FEB80 85 90 95 1997 1997
PRICES REBOUND PRICES ARE ON THE RISE
Prices averaged $556/ton in the fourth Average prices are up more than 15% from
quarter, up 10% from their $509/ton level in the third quarter ($544/ton to 636/ton) and
the previous quarter and slightly higher than up 22% over the same quarter last year.the $548/ton of the last quarter of last year. World soybean oil production is expected
Palm oil accounts for 38% of world fats and to reach 22.39 million tons in 1997/98
oils trade. (October-September), 8% higher than last
World production of palm oil is projected to season. Production is expected to reach 7.67reach 17.59 million tons in 1997/98 million tons in the US, the world's dominant(October-September),some 350,000 tons more producer, followed by Brazil (3.86 millionthan a year ago. Production should reach 8.86 tons), the EU (2.92 million tons), Argentina
milliontons (2% lowerthanlastyear) inMalaysia, (2.17 million tons), and China (1.44 millionwhichaccountsformorethanhalfofworldpro- tons)-all substantially higher than theirduction, and 5.19 million tons (from 4.72 mil- 1996/97 levels.lion tons lastyear) in Indonesia, the second largest China is reported to have been in the mar-
production. The EU is expected to import 2 ket purchasing substantial amounts of soybean
million tons, while China, India, and Pakistan oil. With strong domestic demand and low lev-
together are expected to import 4.37 million els of stocks, China is expected to absorb abouttons, more than one-third of world trade. a third of world soybean oil imports (about
What happens in Indonesia will be a key 2.20 million tons). World imports are expectedfactorforthepalmoilmarket.Withlowstocks to reach 6.66 million tons, up 150,000 tons
and high domestic prices, the government of over last season. Argentina, Brazil, and the US
Indonesia is under pressure to curtail palm oil will export some 4.64 million tons (up fromexports. A sizable reduction in Indonesian 4.22 last season), accounting for more than
exports will inevitably shift demand to 70% of world soybean oil exports.Malaysian palm oil, further depleting Malaysian Oil Worldreports that these three major soy-
stocks and putting pressure on world prices. bean producers will sharply increase supplyOil World reports that, as in the case of during February-August 1998, bringing the
coconut oil, poor yield and production stocks to use ratio to 28.8% (it was 22.2% inprospects for next season are expected to add the same period of 1997). Favorable weatherto the bullish price outlook for palm oil in the conditions in South America are largelymonths ahead, aggravating the already tight responsible. Brazil will expand its plantingsworld supply situation for all fats and oils. by 10-11% over last season's.
16 COMMODITY MARKETS AND THE DEVELOPING COUNTRIES

FOOD
GRAINS MAIZE Grain prices
PRICES COULD RISE FROM CURRENT LOWS 276 (Usdoltoslnmt) slip 1.1%
The East Asian currency crisis reduced M9AR 2o.b. Gubco. during thedemand for grain imports, lowered export quarter, but riceprices for rice, and contributed to lower prices 1204 prices fail
OCTfor grains in the second half of 1997. Rice 1997 sharply.prices fell the most because of the currency
91.4 )990= 100devaluation by Thailand, the largest rice JAN I i2.9 122. 7
exportcr. Prices fell less for wheat and coarse 9996 AUG 19971997 ~~~1 3.5 Q
grains because Asia is not the major exporter, 75 DEC
but weaker Asian import demand contributed - I6.5
to the weakness in prices. 020 1997
Global grain supplies increased in 1997 on J75 JL
record wheat and rice production and near- 1
record coarse grain production. World grain
production in 1997/98 Uuly-June) is expected SHARPLY HIGHER PRICES ARE POSSIBLE
to rise 0.4% over the previous year and 8.9% Maize prices have stabilized since the sharp
over the preceding year. Combined with lower declines of last summer, and price increases 1059
import demand, this is expected to rebuild are now expected. Very low world stock levels Q3 10316
world grain stocks by about 3.0% and keep could make for volatile prices during 1998, Q4
prices from rising during the first halfof 1998. especially if El Ninio reduces yields during
World end-of-year grain stocks are up some the coming growing season. Though the East40 million tons, or 15.6% in the past two years. Asian currency crisis will weaken import
What happens to grain prices during the demand in the region, current estimates sug-second half of 1998 depends on next year's gest no dramatic decline in imports.harvest and on El Nifio. El Nifio has begun Total coarse grain production was downto dissipate and should end by mid-1998. Its 2.2 percentin 1997/98fromthepreviousyear,
global impact on grain production has been and with production expected to lag behindsmall, although certain countries, such as consumption, stocks are projected to fall aboutAustralia and Indonesia, have experienced 12% from last year. The world stock to usedroughts. However, in the past three El Nifios, ratio (a measure of the global reserves ofUS corn yields fell by at least one standard coarse grains) is expected to fall to 11.8% by
deviation from trend in the year following the the end of the 1997/98 crop year, close tostart of the El Ninlo. Thus there is a possibil- the all-time low of 11.3% in 1995/96. Thisity of lower than average corn yields in the extremely low stock level makes next year's
US next year. There was no similar effect on harvest critical to future price movements. Ifwheat and rice yields from the past El Nifios. yields are below trend during the coming year
El Ninlo remains a threat to maize yields dur- or if import demand rises significantly, pricesing the coming summer harvest and will likely could rise sharply. The East Asian currency
cause futures prices to be especially volatile. crisis may weaken demand slightly, but notEl Nifio has caused a severe drought in enough to weaken overall world demand,
Indonesia, reportedly leading to a large drop which is projected at 91.6 million tons inin rice production. Recent reports suggest the 1997/98-close to last year's 92.4 million tons.
need for Indonesia to import as much as 3 mil- Imports by the Republic of Korea, the largest
lion tons during the remainder of 1998. coarse grain importer of the most directlyIndonesia is the third largest producer and affected East Asian countries, are projected
consumer of rice, and imports of that size to total 7.8 million tons in 1997/98-down
would represent about 15% of world trade. 12.8% from the previous year.
FEBRUARY 1998 17

FOOD
RICE WHEAT356.0 (US dollars/mt) 183.5 (US dollars/mt)JAN Thoi, 5% broken, white, APR US, na. I Hard Red Winter,1997 indicative market suveny 1997 Gulffpore, prompt shipment.
price, fo.b. Bangkok. 175.7JAN1997
320.0JUL 7.1997 FEB
1997
as percentage Boo ~305 t 50.629.5 ~~~~~APR AUG
1986/87 l~~~~997 269.7 199717.1 ~~~~~~~~~~~~~~~~~~DEC
198 83 500 197 250 C44.6
300ILANDVN 200 DEG
: i 1 ~~~~Thailand accounts for about one-third of Wheat prices fell throughout the second
world rice exports, so when Thailand deval- half of 1997 after peaking in April at
1@ - 3 ~~~ued its currency by 45% in October, the US $183.5/ton f.o.b. Gulf for US hard red win-
dollar price of Thai 5% broken rice exports ter wheat exports. By Decemnber prices had
shrank from $323.2/ton to $265.8/ton, or fallen to $144.6/ton, largely because of a
17.8 %. No other major factor, such as a record record world wheat harvest of 604.7 million
crop or large exports from another country, tons, up 3.8% from the previous year. Stocks
appears to account for the decline in Thai rice are projected to rise to 129 million tons or
5prices.Thepriceofwhcat,theclosestsubsti- 22.% of total consumption by the end of
tute for rice, declined only 2.56% over the 1997/98. World consumption is expected to
~~~~~~~same period. World rice production will rise rise less than 1.0% in 1997/98 and world trade
7 80an estimated 1.9 % in 1997/98, while end-of- about 1.2%. The EastAsian currency crisis has
year stocks are expected to rise by about 1.7 had some effect on prices, although higher
million tons, to 14.4% of world consumption. production and stock levels accounted for
at.s:lzrs w i ~A previous devaluation of the baht in most of the decline.
'4!02 g X ' ~October 1984 had resulted in a similar decline Despite the currency crisis and slower eco-
in rice prices. Between October 1984 and nomic growth, wheat imports to the East Asian
9 .February 1985 the bahtwas devalued 21.5%, countries that were most directly affected
from 23.00 baht/US$I to 27.95 baht/US$1. (Indonesia, Republic of Korea, Malaysia,
The US dollar price of Thai rice exports fell Philippines, and Thailand) are still expected
from $256.25/ton in September 1984 to to rise slightly in 1997/98 to 12.6% of world
: ~~~~~$220.00/ton in February 1985, or a decline wheat trade, up from 12.0% in 1996/97.
of 14.15%. Thailand's share of world rice However, the full effects of the currency cri-
exports rose from 30.62% during the four sis on demand may take awhile to reveal them-
Is years before the devaluation (1980-83) to selves since imports are often planned several
Note 994/5 199Tha 37.26% in the four years following the deval- months in advance.etimatedw uation (1985-88) . Adjusto ents to the Thai Producfion in thefive largest exporters (the
rice sector were made both to stimulate pro- US, Canada, EU, Australia, and Argentina)
duction and tor restrain growth in consump- totaled 219 milliontons in 997/98, down from
tion. Average rice production rose 10.2% from 230 million tons in 1996/97. The decline fol-o
198cr83 to 1985-88, and consumption rose lowed an exceptional harvestplast year anddoes
3.6%. not likely reflect a trend.
18 COMMODITY MARKETS AND THE DEVELOPING COUNTRIES

FOOD
BANANAS SHRIMP71t5 (US doiurslmt) (US dololas/kg) J557APR Central ond South Amencan, US, GulfCbroon, headless SEP1997 importer' price. free-on-rod 26 30 count per pound, i997
(for.), US ports u,hoeesole New York
\ J ~~~~~~~~~~~~~~~~~~~~~~~DEC580.4 1997JAN 493.8 i91996 JUN
i997
60/5
500
400 JUL 400.! 39.8 MRa~~~~~~~~~~~~~~~~~t )3 .2 JA 996 5
300 1997 DEC i 996 980 85 90 95 1997 80 85 90 95
FREE-MARKET PRICES DECLINE JAPANESE IMPORTS FALL
Banana prices continued their seasonal The currency depreciations in East Asia
decline during the final months of 1997 as the have significantly affected the world shrimpanticipated El Nifno effects failed to appear. market, resulting in a decline in shrimp pricesPrices are expected to recover in February this quarter. The depreciation and continu-
and March. ing recession in Japan have slowed importsIn May 1997 a three-person WTO panel by raising the effective prices of imports.
ruled that the EU's banana import regime, Shrimpimports declinedbyabout7% between
including the import licensing procedures, January and October 1997. The effect of theare inconsistent with the GATT. The EU financial crisis on the Thai and Indonesianappealed, but the Appellate Body upheld and shrimp industry is less clear. Export prices are
even strengthened the panel finding in higher in local currency terms because of theSeptember 1997. In response to the finding, depreciations, but higher interest rates arethe European Commission (EC) proposed slowing investment, and prices of imported
a 10-year modernization program for tradi- inputs, such as fees and packaging materials,
tional suppliers and an end to import licens- are higher. The slowdown in domestic con-ing agreements. The proposal also includes sumption caused by the recession in Thailanda controversial two-tiered tariff quota. The and Indonesia will also result in higher exports.
current tariffquota of 2.2 million tons would US shrimp consumption and imports havebe maintained at a tariff of ECU 75/ton, and continued to rise in the buoyant US economy.an additional quota of 353,000 tons with a Imports were up 10% during the first 10
ECU 330/ton dutywould also be established. months of 1997 over the same period in 1996.The countries that brought the complaint- The new hazard analysis, critical control
Ecuador, Guatemala, Honduras, Mexico, and points (HACCP) program, designed to ensurethe US-are considering the EC response. the safety ofimported foods, will be of increas-
While the abolition of the licensing agree- ing importance to many shrimp exportingment is likely to please the US, Latin countries. The EU started to apply it earlyAmerican producers will probably seek last year, and the US has imposed it sincegreater access to EU markets. Smallholder December 18. Its application resulted in the
producers in the Caribbean and Africa that banning of Indian and Bangladeshi importsbenefited from the earlier regime are likely to the EU last year; imports from some coun-
to face additional price pressures, despite tries to the US might also be banned under
their modernization efforts. the program as it begins to take full effect.
FEBRUARY 1998 19

AGRICULTURAL RAW MATERIALS
SUGAR COTTON(US cents/kg) 27.23 179.4 (US cents/kg)worid, ISA daily pnrce, row, DEC JUL Cotton Outlook A Index,fob., stowed Coribbeon ports. 1997 177.7 1997 cif Lwerpool sod Europe.
/ A ~~~~A25.79 9JA6AUG 1 997 19 7.
24.91 P APR 1996
1996 25.09OCTI 997
80 225
JUN 7596 _0 75JAN ~~~~~~~196 ~V A 50
23.57 20 1 25 DEC1 996 80 85 90 95 80 85 90 95 1997
PRICES RISE BUT DECLINES ARE EXPECTED PRICES CONTINUE TO DECLINE BECAUSE OF EAST
World sugar prices rose during the final ASIAN CRISIS
quarter or 1997. However, futures markets are The International Cotton Advisoryin backwardation, and prices are expected to Committee estimates that world cotton pro-fall during the first quarter of 1998. duction for 1997/98 will be about 19.8 mil-
The financial crises in East Asia has pan- lion tons, including 1.8 million tons estimatedicked consumers in Indonesia, Malaysia, and for the Southern Hemisphere, the highest levelThailand. In Malaysia an unprecedented buy- since 1990/91. With consumption expected toing spree has emptied store shelves. Govern- reach 19.4 million tons, another 400,000 tonsment official are counseling consumers not would be added to world stocks, bringing themto hoard sugar, but consumers hope to stock to 9.5-10 million tons by the end of 1997/98.their own shelves before anticipated price The medium staple cotton indicator pricehikes. The Domestic Trade and Consumer (Cotlook A Index) averaged 168.50/kg, 6%Affairs Ministry delivered 5 tons of sugar to a lower than last quarter's 178¢/kg and almostKuala Lumpur suburb in early January to unchanged from the same quarter last year.demonstrate that sugar is in plentiful supply. Market pessimism was also reflected in theThe supplies were snapped up in two hours. New York futures market, with nearby con-The government has threatened to ration tracts down almost 6¢/kg during December.sugar. Smuggling from Thailand and Price projections for 1998/99 have been some-Singapore is rampant as "ant soldiers" and what lower as well, a reflection of concernswarms of consumers bring in new supplies. about the Southeast Asian financial crisis.Meanwhile, sugar refiners are warning of addi- Cotton production is expected to increasetional price increases to compensate for the in South America (Argentinia, Brazil, Bolivia,fallen ringgit. and Paraguay) following expansion in area
The incentive to smuggle sugar into planted and in Australia in response to prof-Malaysia from Thailand is also exacerbated by itable business conditions. Smaller produc-Thai government controls on domestic sugar tion increases are also expected inprices. Local prices remain at 12,000 baht francophone Africa and the EU. Unofficialper ton, roughly $100 per ton below the production estimates from China and early$320/ton offered for Thai-quality sugar on reports from the US indicate no change fromworld markets. As in Malaysia, hoarding con- last season. Lower production is expected intinues as consumers, producers, and retailers Turkey, however, following a reduction inanticipate further price increases. planted area.
20 COMMODITY MARKETS AND THE DEVELOPING COUNTRIES

AGRICULTURAL RAW MATERIALS
The currency devaluations and associated RUBBER Raw materialsfinancial disruptions in Southeast Asia are 123.1 122.7 (US cents/kg) prices tumbleaffecting consumption and imports of cot- JAN MAR Malayson, RSSIprompt 1 p
t996 1997 delivery, fo.b. Kula Lumpur 12.4i, pulledton in Indonesia, Malaysia, the Philippines, 1112 down by aand Thailand. But reduction in mill use (and JU20.4% drop inhence in cotton imports) in these countries timber prices.is expected to be temporary. Levels should
climb back to normal soon, if experience with 1990 10087.3 i24.4
other currency devaluations is any guide 93OCT 17 122.4
(Indonesia in 1983 and 1986, Philippines in JUL 1997 Q 19971996 Q
1983 and 1984, Mexico in 1994). 200
Analysts at the Beltwide Cotton Conference _ 0
of 1998 expressed a belief that US producers j 72.6
will switch from cotton to less risky crops such 80 85 90 95 1997 111.3
as corn and soybeans, now that the 1996 Farm Q3
Bill gives them greater flexibility to respond PRICES CRASH ON CURRENCY DEVALUATIONS
to market signals. Analysts there expressed The dollar price of rubber, which begantheir skepticism that genetically engineered to slip during the last quarter of 1997, appears
(Bt) cotton introduced in the market two years ready to crash during the first quarter of 1998. 972
ago will offer any yield increases, though it Anticipated currency declines in Indonesia, Q4
may boost cotton resistance to certain pests Malaysia, and Thailand have encouraged pro-(and hence reduce spraying costs). ducers to dump stocks and sell forward into
Cotton Outlook reported on the increased the dollar market wherever possible, taking
use by international cotton market participants deep dollar discounts in the process. Together,of New York futures as a hedging devise for the three countries produced more than 72%
non-US cottons. Uzbekistan sold a substantial of the world's natural rubber in 1996 accord-amount of its 1997/98 crop on an on-call basis. ing to the International Rubber StudiesNon-US merchants still make very limited use Group. SinceJune of 1997 the Malaysian ring-
of New York futures, however, so the absence git has lost nearly 45% of its values, the Thaiof internationaltradinginstrumentsotherthan baht more than 50%, and the IndonesianNew York futures continues to be a short- rupiah 79%. Because the three countries rep-
coming in the current pricing system. resent such a large share of the world mar-
It has been more than a year since Brazil ket, devaluations spill over and affect globallaunched a cotton futures contract at the Bolsa prices.
de Mercadorias & Futuros in Sao Paulo. The decline in dollar prices does not fully
Although the contract has been traded on a offset the devaluations, however, and farm
daily basis, average trading volume has been prices will rise. Consequently, in the longera low 58 contracts a day. The contract has not run, the devaluation will also spur production,yet attracted much attention from hedgers especially among smallholders, who frequently
or speculators. Turkey is almost ready to abandon rubber stands as prices fall but returnlaunch its own futures contract at the Izmir to tap trees when domestic prices rise. The
Mercantile Exchange. The Izmir contract, to currency turmoil will generate problems forbe traded in US dollars, is expected to incor- producers as well. Food prices for staples suchporate cotton produced in Uzbekistan, as rice, sugar, and cooking oil will rise, com-
Greece, and Egypt. India, which has a long plicating the setting of wages for plantationhistory of futures trading, is almost ready to workers. Further, producers, processors, and
reintroduce its cotton futures contract (as soon traders may find themselves overwhelmed by
as next season). unhedged dollar-denominated debt.
FEBRUARY 1 998 21

FERTILIZERS
* * TIMBER FERTILIZERS4JUN9 (USdoios/m
3) PRICES DIVERGE WITH PHOSPHATE AND POTASH
LOGS 264.9 aicr~,1997 Mloytsion, meronti, scies STRONG, NITROGEN WEAK
price by mporters, Tokyo.
Fertilizer markets continue to diverge, withprices weakening for nitrogen while remain-
_ 2406 242.0 / \ ing strong for phosphate and potash. The
1996 1997 / \ weakness in nitrogen is due primarily to
China's decision in early 1997 to ban imports227.42352 \OCT and rely on domestic production. Other fer-
1997 \ tilizer prices remain strong despite adequate400 _ ° \production capacity due to a combination of
200 strong import demand from China and India
200 21Ecl and tight supply controls by major producers.80 85 90 95 1997 The year ahead may see an end to the diver-
gence as current low world grain prices leadPRICES DROP IN ASIA BUT REMAIN STEADY to a weakening in phosphate and potashFOR AFRICAN TIMBER prices. Fertilizer demand depends heavily on
Asian log prices showed significant declines grain area planted and application rates. Rice
during the last quarter of 1997 due mainly to prices fell sharply during the summer as deval-
the sharp depreciation of currencies in the uation of the baht caused Thai export pricesregion and the collapse of demand. Malaysian to fall from $320/ton in July to $252/ton in
log prices fell 11% between the third and November for 5% broken white rice. Maize
fourth quarters, and by December 1997 prices prices fared little better, falling from an aver-were 18% below their December 1996 levels. age of $165.8/ton in 1996 to $117.1/ton in
The currency devaluations in Southeast 1997. Wheat prices have not done as badly,
Asia have dealt a heavy blow to timber demand though they slipped from $207.6/ ton in 1996in the region. For example, imports of tim- to $159.5/ton in 1997 and ended the year atber products by Thailand and the Philippines, $144.6/ton in December.
which had previously absorbed about 40% and The five Asian countries caught up in the
20% of Sarawak's sawntimber exports, have currency crisis were large net importers ofcome nearly to a standstill. In addition, hous- potash (table 8), accounting for about 10%ing starts inJapan during the fall of 1997 have of world imports in 1995. Malaysia was the
slowed more than 20% over the same period largest importer, with about 3.5% of world
last year. imports. These countries accounted for onlyIn Europe reports indicate that demand is a small share of nitrogen and phosphate fer-
improving in a number of countries, most tilizers on balance, although Indonesianotably the UK and France. These improve- accounted for about 3.6% of exports in 1995ments in demand have supported African log and Thailand for about 3.0% of imports.
and sawntimber prices in Europe. The sharpTABLE 8. NET FERTILIZER IMPORTS OF FIVEdrop in Asian timber prices has increased the ASIAN COUNTRIES, 1995
competitiveness of Asian timber in the Thousands oftons
European market. Malaysian meranti sawn- Country Nitrogen Phosphates Potash
wood prices in the UK market fell 22% Indonesia -890 1 360
between the third and fourth quarters of 1997. Korea, Rep of -148 -179 441Malaysia 49 177 706
The decline in Asian timber prices will even- Philippines 270 -106 150
tually affect African timber prices as European Thailand 729 0 326
users find opportunities to substitute Asian Total 20 -107 1,983
for African timber. Source: Food and Agriculture Organization.
22 COMMODITY MARKETS AND THE DEVELOPING COUNTRIES

FERTILIAERS
POTASSIUM CHLORIDE TSP11684 (US dollors/mnt) 181.9 (US dolors/mt)JAN Mussteofepotosh stondord JAN 8! 0 Triple superphosphbte,1996 grade, spot, fo.b. Vncose,r 1997 MAR spot, bulk. fo.b. US Guf
1997
172 5N. ~~~~~~~~~~~~~~~~~~~~~~~~~~~DEC116.50 i16.50 \ 1700 1997F99 997 J9UN/ TABLE 9. MAJOR
POTASH FERTILIZER20 2 PRODUCERS RANKED
BY 1 995 PRODUCTION00 i5O 4.3 ~ ~~~~~~~~~~~~~~~~~~Millions of tons
80 ~~~~~~~~~~163.5 OTPro - Con-600 8 85 AUG 1997 Country duction sumption
80 85 90 95 80 85 90 95 1997Canada 8,07 0.3 1
Germany 3.28 0.65PRICES REMAIN STRONG TSP AND DAP PRICES REMAIN STRONG Russian Fed 2.81 0.35
Potash prices held firm at $116.5/ton dur- TSP and DAP prices remained firm during Belarus 2.79 -Israel 1.33 0.03
ing the fourth quarter, prompting major sup- the fourth quarter at $168.7/ton for TSP and Jordan 1.07 _
pliers to push for price increases. Canpotex, $200.1/ton for DAP. Over the past three years us 0.84 4.92
the Canadian potash export association, has DAP prices have slipped from $216.6/ton in France 0.80 1.49Spain 0.64 0.41
reportedlyproposedpriceincreasesof$10/ton 1995 to $199.9/ton in 1997 while TSP prices UK 0.58 0.49
on muriate ofpotash. Tight supplies and a lack have risen from $1 49.6/ton to $171.9/ton. Others
of competition from the Baltic Sea exporters Prices have withstood the turmoil in Asia, Brazil 0.22 1.68
adds weight to their request. However,Japanese which has dampened demand somewhat. China 0.12 3.1!
buyers seem unlikely to accept such a price Efforts by China and India to improve bal- India I .16
increase, and discussions may continue for some ance in fertilizer use have strengthened the World 22.69 2F.11Soorce- Pond and Aerciltore
time. Recent contract settlements with China phosphate market while keeping nitrogen Organzatson.lend support to the demand for higher prices. prices weak. India altered its subsidy policiesThe Asian crisis has resulted in lower imports in 1997 to reduce the price of phosphate andin some countries, but the largest importers potash fertilizers and increase that of urea. As TABLE IO. MAJOR
such as China and India have notbeen affected. a result Indian imports reached arecord in 1997 PHOSPHATE
The Brazilian government raised import and are expected to rise even further in 1998 PRODUCERS RANKEDBY 1995 PRODUCTION
duties on fertilizers in November in an effort to about 1.2-1.4 million tons. The imbalance Minions oftons
to control inflation. The move increased the in use is common in South Asia, where nitro- Pro- Con-
duty on urea, TSP, ADP, and some other fer- gen use is encouraged on paddy rice for a quick Country duction sumption
tilizer imports by 3 percentage points to 9%. yield response, to the relative neglect of phos- us 10.50 4.09
The duty on muriate of potash remains below phate and potash, thereby threatening longer- Chnia 6207 8.82
that on most other fertilizers, at 3%. term soil fertility. Nitrogen fertilizers made up Russian Fed 1.93 0.35
The world potash market is heavily con- 70.8% ofchemical fertilizer applications in India Brazl 1.24 1.49
centrated in a few countries. Canada is the in 1995 and 64.4% in China, well above the Morocco 0.93 0.10Tunisia 0.74 0.04
largest producer and exporter of potash fer- world average of 60.2% (FAO). Chiina has been France 0.67 1.03
tilizers, with more than 8.1 million tons of pro- a large buyer of phosphate fertilizer in recent Mexico 0.43 0.22
duction in 1995 and 7.85 million tons of months.Asmuch as 1.5 million tonsare loaded Poland 0.43 0.30
exports. Other large producers and exporters for export to China, which could lead to over- World 33.80 31.02
include Germany, the Russian Federation, and supply and an end to further purchases. Sorce.- Food snd Agrn.olture
Belarus. Together, the four largest producers The US is the major producer and exporteraccounted for almost three-fourths of world of phosphate fertilizer. China is the secondproduction and 70% of world exports. largest producer and the largest importer.
FEBRUARY 1998 23

METALS AND MINERALS
UREA ALUMINUM188.5 (US dollrsl/mt) 3,000 1,7/0.6JAN Bagged, spot, fo.b. 2_500 AUG1997 W Europe. 2.00 10997
.000
80 85 90 95160.3APR 1,625.31997 MAY
1997
1,575.6 1,6 / 6
137.4 JAN SEPJUL 1 997 /97
2 197 129.2 E ,561.4
200 ~~~~~~~~~~~~~~APRp p 1025.5 (US dolrsmt 1997 \530.5
/00 SEP LME, prt-aoy/gots, DEC80 65 90 95 1997 high grade, crsh. 1997
CHINA'S IMPORT BAN KEEPS PRICES WEAK TURMOIL IN ASIA HURTS PRICES
TABLE I 1. MAJOR Urea prices remained weak as China's 1997 As with most other base metals the price ofNITROGEN PRODUCERS ban on imports continued to influence the aluminum has come under pressure followingRANKED BY 1995PRODUCTION market. China was the world's largest con- the financial crisis in Asia and weakeningMillions of tons sumer and importer of nitrogen fertilizer in demand. Prices in December are some 5% lower
Pro- Con- 1995. Prices, which averaged $205.5/ton in than they were in September-October. The
Countri duction sumptn 1996, fell to $146.1/ton in 1997, with fourth impact of the Asian crisis has been more imme-
US 14.24 11.1 quarter averages at $128.9/ton for West diate andsevere injapan than anticipated. TheIndia 8.77 9.82 Europe. India has been reluctant to purchase Japanese manufacturing sector, a surveyfound,Russian Fed 4.86 1.00 urea, given its high inventories, weak currency, was much less confident than in September.Canada 4.02 1.51Indonesia 2.82 1.84 and uncertainties about the new government. Some analysts predict that the recent crisis willUkraine 1.83 .63 Vietnam is expected to import about 1.6 mil- reduce aluminum consumption inAsia in 1998Netherands 1.70 .37 lion tons in 1998, which would put it among by24%fromprojectionsmadeearlierin 1997.Pakistan 1.60 1.92France 1.54 2.39 the major importers. In Western Europe, where the economic out-
World 86.74 78.74 China's plan to replace urea imports with look has been improving, strong growth of someSource: Food and Agnculture higher domestic production may have been 4% in the index of industrial production forOrganization. put on hold by weak urea prices and the ris- 1997 is helping aluminum consumption. Car
ing costs of constructing new production facil- sales in Europe were up about 10% during 1997,
ities. The plan was to achieve self-sufficiency giving a boost to aluminum consumption. Thein nitrogen fertilizer by 2000. The authori- US economy remains strong, with expansion in
ties have since postponed construction of sev- computer and automobile sales and construc-
eral new projects. The governmentwill instead tion spending continuing to boost growth inrenovate several smaller plants to increase aluminum consumption.capacity along the lines of its Ninth Five-Year Consumption growth in Western EuropePlan for the fertilizer industry. and the US is expected to remain strong into
India has reduced its subsidy on nitrogen 1998, but the combination of demand con-fertilizers while increasing that on phosphate traction in Asia and the availability of suffi-
and potash fertilizers in an effort to get farm- cient production capacity in the market will
ers to apply more balanced fertilizer to crops. likely result in a market surplus. Also, CISIn the past farmers have favored nitrogen exports could be higher than anticipated ifbecause of the quick yield response. However, consumption growth does not resume. Severalbalanced fertilizer applications are required analysts predict that prices will move within
to ensure longer-term soil fertility. the $1500 to $1650 range during 1998.
24 COMMODITY MARKETS AND THE DEVELOPING COUNTRIES

METALS AND MINERALS
COPPER quarter average was below that for 1996 Metals prices
2.6/2.6 (LAS dahas/dm) ($2,145/ton). This marks a year on year fall 7.9%, dueJUN LME, cathode and wre decline of approximately 11% despite the largelyto the1997 shopes, settlement pnce.
2,434.9 A tremendous momentum prices developed dur- East AsianJA997 / \ ing the first two quarters. crisis.
2 ,-391.2 \ Because of its severity, the financial crisisAPR in Asia is now expected to hurt merchant and
2,0523 producing sectors that have copper for sale. 1997 1997
i909C 9 Liquidity in the region has dissipated as banks-3000 refuse to roll over old loans, and some loans
5000 are being called in for immediate repayment.2000 These actions make it more difficult for con-1500 1,762.3 sumers to hold inventories as their workingIcOO DEC
80 85 90 95 1997 capital disappears. As a result, copper mater-
ial is being shipped back to LME warehouses.
PRICES PLUMMET AS UNCERTAINTY IN ASIA In Southeast Asia there are many worries.CONTINUES Analysts fear that the Hong Kong banking sec-
Spot prices plunged 20% during the fourth tor could continue to reduce funding for 84
quarter, from $2,147/ton on October 1 to regional infrastructure projects in Indonesia, Q4
$1,723/ton on December31.Theycontinued Malaysia, and Thailand. These cancellationstheir collapse in January 1998, breaking are drastically affecting the consumption of
through the $1,700/ton level and trading most copper wire and cable.recently on the London Metal Exchange Elsewhere in Asia, Japan is already facing(LME) at $1,687/ton. Three-month futures sluggish domestic demand for copper-upprices have retained the contango levels just over 1%. If its exports to all of Asia, which
reached during the second half of the third account for 40% of total exports, erode any
quarter, somewhere in the $25-$35 a ton range further, the ramifications for the Japanese
above spot prices. economy could be disastrous. Conditions areStocks remainedvirtually the same through- not much better in the Republic of Korea.
out the quarter, closing the quarter where they With Korean banks unable to confirm lettersopened it, at about 332,000 tons. China of credit, the ability of Koreans to import cop-remains the unknown factor for 1998 in the per materials is increasingly uncertain. Korea's
supply and demand equation. Analysts esti- absence from the market would represent amate that there will be a market surplus of serious blow since its copper demand is equal
180,000 tons in the Chinese market for 1997, to that of India and the ASEAN countries com-and this stockpiling could more than double bined.to 400,00 tons in 1998. Expected increases in By contrast, the US market remains strong.CIS exports could also push supplies higher Consumption of copper wire rod has beenthan current levels. brisk, and although the market is beginning
One need only look at the breakdown of to show signs of tightening there have been
average quarterly prices for 1997 to see how no shortages. Copper cable, tube, and stripthe erosion of demand in Asia has pushed markets are strong as well due to healthy con-prices consistently lower. Average quarterly struction activity and automotive sales.LME prices for spot copper in 1997 were Europe may currently be the strongest mar-
$2,421/ton (Jan-Mar),$2,505/ton (Apr-Jun), ket for copper. The business climate remains$2,259/ton (Jul-Sep), and $1,912/ton positive, and the construction sector is the(Oct-Dec). The drop in prices afterJuly, when only area of the economy that is still sluggish.the crisis began, is clear. Moreover, the fourth Sales in the automobile sectoirs ar-e stroing.
FEBRUARY 1998 25
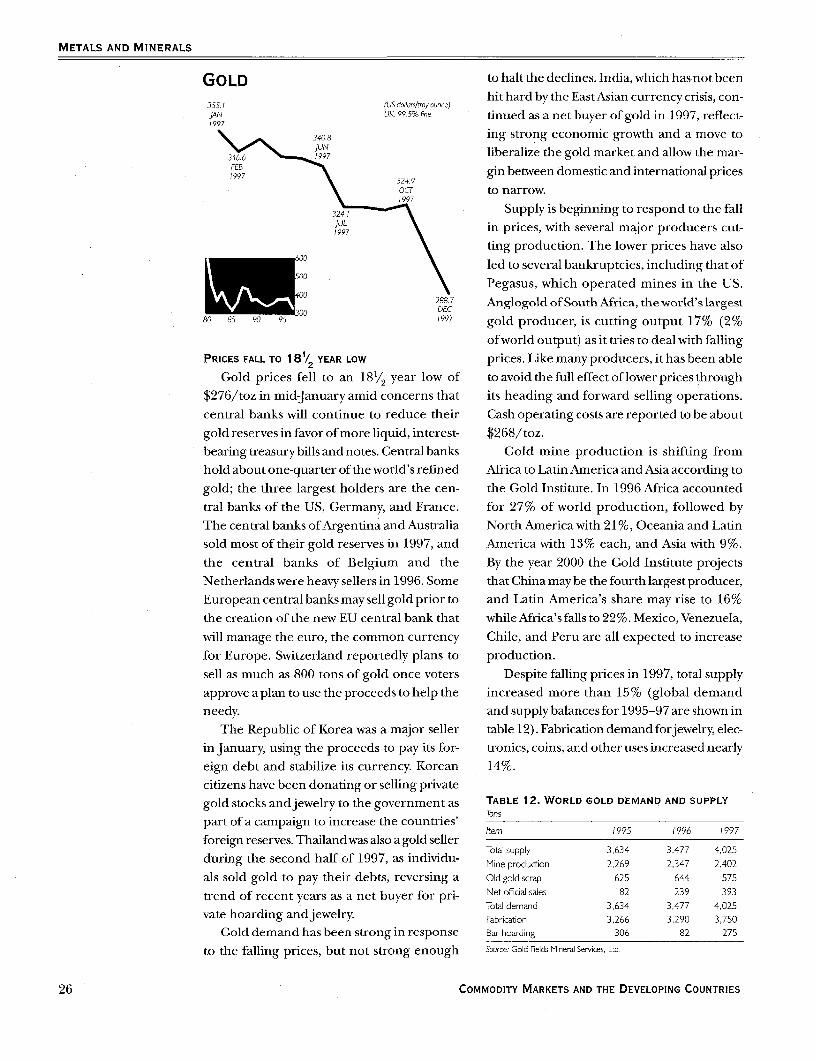
METALS AND MINERALS
GOLD to halt the declines. India, which has not beenhit hard by the East Asian currency crisis, con-
355.1 (US dollar/troy ounce)JAN UK, 99.5% fle. tinued as a net buyer of gold in 1997, reflect-997
\ 340.8 ing strong economic growth and a move tot9}97 liberalize the gold market and allow the mar-
1997 )324.9 gin between domestic and international pricesOCT to narrow.1997
324. i Supply is beginning to respond to the fall197 \in prices, with several major producers cut-
ting production. The lower prices have also600 led to several bankruptcies, including that of- 500 Pegasus, which operated mines in the US.0 0 288.7 Anglogold of South Africa, the world's largest
80 85 90 997 gold producer, is cutting output 17% (2%
of world output) as it tries to deal with falling
PRICES FALL TO 18 / YEAR LOW prices. Like many producers, it has been able2Gold prices fell to an 181/2 year low of to avoid the full effect of lower prices through
$276/toz in mid-January amid concerns that its heading and forward selling operations.central banks will continue to reduce their Cash operating costs are reported to be about
gold reserves in favor of more liquid, interest- $268/toz.bearing treasury bills and notes. Central banks Gold mine production is shifting fromhold about one-quarter of the world's refined Africa to Latin America and Asia according to
gold; the three largest holders are the cen- the Gold Institute. In 1996 Africa accountedtral banks of the US, Germany, and France. for 27% of world production, followed by
The central banks of Argentina and Australia North America with 21 %, Oceania and Latinsold most of their gold reserves in 1997, and America with 13% each, and Asia with 9%.
the central banks of Belgium and the By the year 2000 the Gold Institute projectsNetherlands were heavy sellers in 1996. Some that China may be the fourth largest producer,
European central banks may sell gold prior to and Latin America's share may rise to 16%
the creation of the new EU central bank that while Africa's falls to 22%. Mexico, Venezuela,
will manage the euro, the common currency Chile, and Peru are all expected to increase
for Europe. Switzerland reportedly plans to production.sell as much as 800 tons of gold once voters Despite falling prices in 1997, total supplyapprove a plan to use the proceeds to help the increased more than 15% (global demandneedy. and supply balances for 1995-97 are shown in
The Republic of Korea was a major seller table 12). Fabrication demand forjewelry, elec-in January, using the proceeds to pay its for- tronics, coins, and other uses increased nearly
eign debt and stabilize its currency. Korean 14%.
citizens have been donating or selling privategold stocks andjewelry to the government as TABLE 12. WORLD GOLD DEMAND AND SUPPLY
part of a campaign to increase the countries' TonsItem 1995 1996 1997
foreign reserves. Thailand was also a gold sellerTotal supply 3,634 3,477 4,025
during the second half of 1997, as individu- Mine production 2,269 2,347 2,402
als sold gold to pay their debts, reversing a Old gold scrap 625 644 575
trend of recent years as a net buyer for pri- Net official sales 182 239 393Total demand 3,634 3,477 4,025
vate hoarding andjewelry. Fabrication 3,266 3,290 3,750
Gold demand has been strong in response Bar hoarding 306 182 275
to the falling prices, but not strong enough Source: Gold helds Mineral Services, Ltd.
26 COMMODITY MARKETS AND THE DEVELOPING COUNTRIES

METALS AND MINERALS
IRON ORE AND STEEL fill import licenses before the close of theChinese new year.
33.25 YEARLY
32.50 1991 (US centsimt Fe) Exporters inJapan continue to be ham-93250 brnzdion, cvrd contract
1982 /\ pnceto Germany. pered by the financial crisis. The deprecia-
tions of Southeast Asian currencies have sentlocal currency prices ofJapanese exports soar-
28 88 ing throughout the region. That means that28.09 lne1980 Japanese steel markets can no longer count
on support from exports to other Asian coun-
tries, which has helped them through previ-
2547 ous economic slumps. As a result, Japanese1994 producers have been forced to lower pro-
23.50 duction for 1998.1988 At home, Japanese prices have slid by as
much as $30/ton. Demand continues to be
STEEL CONTINUES LOWER, IRON ORE HEADS depressed and is not likely to improve in theUPWARD near future. The automotive sector has been
Iron ore suppliers are expected to push for hit particularly hard-vehicle registrations
increases of up to 10% during this year's nego- in October fell 13% on a year on year basis.
tiations. Australian suppliers have already This marked the seventh straight monthlystarted talking with Japanese steel mills. decline in 1997-and the largest.Although the steel mills will try to keep price The long-term outlook for steel sheet in
increases below 10%, the iron ore market is Asia is for continued slack demand and pres-fundamentally strong and this strength should sure for even lower prices. Demand in thebe reflected in the final agreements. region will erode further over the Chinese new
The continuing economic problems afflict- year. China has been the only market in the
ing East Asia are stifling demand and exert- region exhibiting any signs of growth. As aing downward pressure on both sheet and long result, exporters are expected to divert steel
prices. Prices dropped $10/ton in November to the North American and European mar-for sheet shipped from the CIS, followed in kets during the first quarter of 1998.
December by declines of up to $30/ton for In the US, steel sheet markets have alreadynon-CIS steel sheet, as demand within East witnessed price cuts. In November, Nucor
Asia virtually collapsed. While sheet mills in announced price cuts of $25/short ton for
the region seek to increase sales through cold-rolled and coated coil, dropping prices
greater exports, the decline in currency val- to $435/ton and 490/ton. It had alreadyues has raised prices for importers. Lack of reduced hot-rolled coil by that amount inworking capital and loss of confidence have September. These price cuts were dictated byforced cancellations or long delays in con- the expansion of capacity and a sharp, sus-struction projects. tained increase in the amount of imports.
Price declines have been less dramatic for Prices were much stronger for US plate andlong products. Markets for higher-quality long could actually rise because stocks have been
products and billet experienced the most drawn down and imports from China, Russia,severe price drops, while products from the and Ukraine have been limited under trade
CIS even experienced slight increases because arrangements that guarantee reduced importsof rising Chinese consumption. Prices for CIS- from these nations.origin wire rod rose $5/ton to $253/ton. In Europe, sheet and long markets have
Strong Chinese demand has at times resulted continued to exhibit strength over the fourthin shortages, and buyers were scrambling to quarter.
FEBRUARY 1998 27

COMMODITY PRICE OUTLOOK
ENERGY
80j 70 perce-t 5.75 70 pe,-etlPrce in constant pt6lr
60: ~~~~~~~~~ ~ ~~~~~~~~prob~bl 4.5 1990 dnlnr obnnn60' . i i rbbility 4'PaeIcosnt i pombabiiity20,nnb.rbn 3225 |
40 Fife in onsant _990 dollars p m0
i970 3 99 990 20 2010 1970 . 980 10 20 2010
50 t 2.5
Price in Cocetent in n 70
dollars per million n r_
1/995 / 996 1/997 1 998 1/999 2000 1/995 1 996 1/997 1/998 1/999 2000
35 U
6.00 1 10 cent 8~~~~~~~~~~~~.00
4.00 pcnniy6.5
20 0 nlae 99 dll,
1970 1980 1990 2000 2010 1970 1980 90 20 200
25 Pri40 in perrent
30_245 -t3 P'bul X-
2 5~~~~~~~~~~~~~~~~~rc in r,n I d 0 -iiiii2@
3.25 2___ d _ 160 ___
1995 /996 1997 1998 /999 2000 /995 /996 1997 1998 1999 2000
2EERGE COMOIT MAKTSADTHEVLPNGCUNRE
| .00 iA 24 ---- I ;T 0eret | |8.0 AS :70ecn
2 . 51 .~~~~~~~~. 20s
* olr e klga0i I X
| 1995 19~~96 1997 1998 1 999 2000 1995 1996 1997 1 998 1999 2000
1< 121~~~~~~~~~~~~~~~~~~~~~
28~~~~~~~~~~~~~~17 COMMDIT MARKET 2000 2010 DEEOPN 970OUNTRIES2000

COMMODITY PRICE OUTLOOK
TEA Low stocks and strong demand COCONUT OIL Prices remain low FooDkeep prices high in 1998 FATS AND OILS
bZ.~ ~ ~ ~ ~~~ _ . ASAD0L
_ K _ImIhI
1995 / 996 1997 1998 i 999 200
PALM OIL Prices move up SOYBEAN OIL Prices on the rise
MAIZE Prices may rise from RICE Prices to fallrecent lows
i~~~~~~~~~~~~~~~~~~~970 IY0 980 1990002s
400 F
321
250Price in C_rrent
dolrs per metric ton200
1995 1996 1997 1998 9 1995 1996 97 1998 / 999 2000 -
FEBRUARY 1998 29
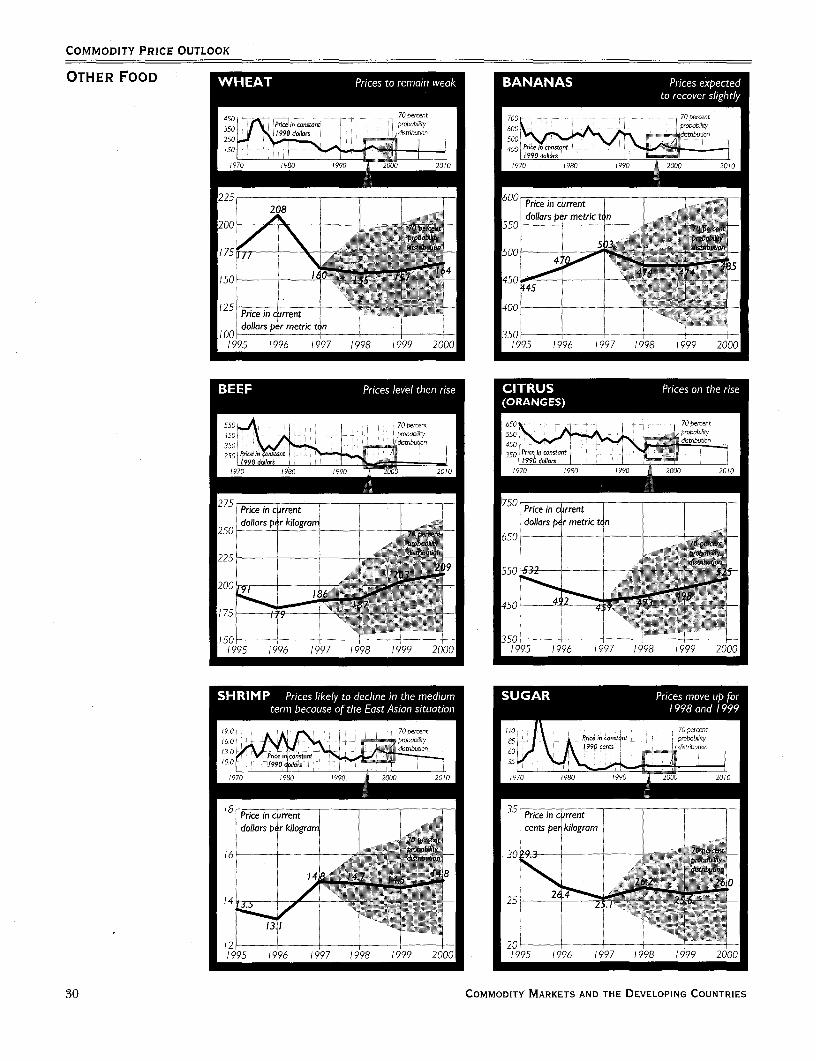
COMMODITY PRICE OUTLOOK
OTHER FOOD -
450 : Z:: t , P f 70 nent 70 per-t350 19dlls lI,o 60250 5?50 4
1970 1980 1990 2000 2010 1970 1990 990 2000 20(0
225 P i c e S j00s53jii
Price ic rrent1Prie M c rntdollars pe T r met Pricsin tprmntri I
/00*
*175
199 99_97 19 99 20 1995 1996 /997 1998 1999 2000
~~~~~~~~~~~~~~~~0 _
400 t O1O00lliE 000 p,| 60hly
350 0,su,b,st,cs 450 Onsta ti45
| 970 1980 t990 ^ 00 2010 1970 1980 1990 2000 2010
>1
12 4a, 3
|dollars per meti/ora t n - et efkigs
100 - ~~~~~~~~~~~~501995 1996 1997 1998 1999 2000 1995 1996 / 997 1998 1999 2000
(9.0 o 15
.0pe-cet 650 70pe-ce456.50 rc n aaqtprbabifiy350 4560 d98cnsIis silO-
1970 I900 (990 200 2010 1970 (980 1990 A 2000 2010
75 Price in c irrent ~~~~~~~~~~~Price in c ,rrent
F - 2~~~~~~~~0
1995 1996 /997 1998 1999 2000 1995 /996 / 997 1998 1999 2000
30 COMMODITY MARKETS AND THE DEVELOPING COUNTRIES

COMMODITY PRICE OUTLOOK
COTTON Prices reflect concerns _ AGRICUL-about East Asian crisis
TURAL400 70 percen; 250 P 70 perce-n320 pccbeb0ty 200o 90 olcy
250 \o 50 o 7--dtribubpon RAW| i 990c __
1970 980 1900 2000 2010 !970 1980 190 9 , 2000 2010 MATERIALS
225 - - Pi i _
* ! !* i 5 cents peCr kilogramn __
213~~~~~~~~~~~~~0
EEI /~~~~~~~~~~~995 1/996 1 997 1/998 1 999 2000
= _ ___B_ ~~~~~~~~FERTILIZERS
0 -. - a -~~~~~50-4
5001O 70 percent 300 I Price ;n conscent .70ecn|400 |,c nr ce mcnttont | p obcb; 200 1 990 _olr . - pisrocectyo
1990 delloce~~~~~~~~~~~~~~~~~~~~~~~~~~~~~0pec6
200:_ 00
325 Price in current 'l 75 Pri current i ren1 990 doliars S i I dollars permetricton
256 252 i i.2015
_250 -- -------- It 1/17 li2i U
225 - ---- +-8-~-~ - - - 100 - -
200 - - -- -- -- - -- -- - -- -- 7 -- F- 75- - -._ . .1995 1996 1997 1998 1999 2000 1995 1996 1997 998 1999 2000
TSP Lower prices up ahead ' UREA Prices remain weak
70 percent 30 _ P_ T. c_n 70- _
9S_ittlirVdiHt.D~~~~~~~~~c prbnbdt 5_
99904ll 200,rcvo
1970 1980 1990 2000 2010 - I ; _325F--
!T /Price in current 7-1' -1990 doNars I dollars per metric ton I
FEBRUARY 1998 31

COMMODITY PRICE OUTLOOK
METALS AND _
MINERALS 7 p0 e,0P,000--_ ty 5,000 P Price 70 pcuent
2,01 70 P _t fi_ _c ilar e ntizyo.1Sggl ,500 j uo
,500 <_<!!e|0. 2_ 4000 _ h 0 0 0 _If990 ddlas I~~~~~~~~~~300 ietntc
1970 1980 1990 2000 2010 1970 /980 /000 2000 20/0
_/995 1996 1997 199 /99 20 95 96 /9 98 /9 99 2000
*t70 /000 t000 2000 20tO *t70 1980 1000 2000 20t0
Pre i c2 ri cr e
dollars p r tray oun e ~ ~ ~ ~ ~ ~ ~ ~ ~ ~ ~ ~~ilirspe ntrc o
1 77,50, 2 ,5,,
1995 1996 1997 1998 1999 2000 1,501995 1996 1997 1998 1999 2000
32S COMMODITY MARKETS AND THE DEVELOPING COUNTRIES

COMMODITY PRICE OUTLOOK
TABLE Al. COMMODITY PRICES AND PRICE PROJECTIONS IN CONSTANT 1990 DOLLARS
Short-term Long-termActuol projections projections
Commodity Unit 1970 1980 1985 1990 1994 1995 1996 1997 1998 1999 2000 2005 2010
EnergyCoal, US $/mt ,, 59.88 67.96 41.75 33.10 32.87 32.65 33.78 32.21 31.69 31.21 29.61 27.67Crude oil, avg. spot $/bbl 4.82 51.22 39.62 22.88 14.41 14.41 7.91 17.80 15.42 15.40 14.96 14.24 13.84Natural gas, Europe $/mmotu .. 4.72 5.39 2.55 2.22 2.29 2.50 2,54 2.45 2.38 2.31 2.17 2.08Natural gas, US $/mmbtu 0.68 2.15 3.57 1.70 1.74 1.44 2.40 2.30 1.91 1.80 1.75 1.75 1.75
BeveragesCocoa c/kg 269.1 361.7 328.6 126.7 26.7 120.2 127.7 150.3 160.6 161.1 159.9 157.4 150.0Coffee, other mi ds c/kg 457.2 48 .6 470.9 197.2 300.1 279.5 236.4 386.9 280.3 223.6 206.9 190.4 181.2Coffee, robusta c/kg 362.8 450.6 386.0 1 18.2 237.7 232.4 158.4 161.2 159.7 152.3 150.5 144.7 131.8Tea, auctions, avg c/kg 358.8 250.4 263.5 205.1 143.1 128.1 148.2 195.0 190.1 170.9 159.6 151.4 140.5Tea, London, all c/kg 436.4 310.0 289.0 203.2 166.2 137.8 155.6 206.9 217.7 193.6 179.6 172.4 161.4
FoodFats and oilsCoconut oil $/mt 1,584 936.1 860.2 336.5 551.2 561.7 659.3 609.8 544.3 536.9 538.7 530.7 487.6Copra $/mt 896.5 629.0 562.6 230.7 378.7 367.8 428.9 402.7 412.8 378.5 354.9 344.8 318.2Groundnut meal $/mt 407.4 333.9 211.7 184.8 152.7 141.4 186.6 205.2 175.1 180.4 182.1 172.4 170.0Groundnut oil $/mt 1,509 1,193 1,319 963.7 928.0 831.2 787.1 938.0 771.1 704.2 658.4 538.2 477.7Palm oil $/mt 1,037 810.9 729.6 289.8 479.5 527.0 465.8 506.7 508.0 431.3 384.8 344.8 318.2Soybean meal $/mt 409.0 364.6 229.1 200.2 17L.6 165.2 234.7 256.0 217.7 198.1 196.7 204.7 201.6Soybean oil $/mt 1,142 830.2 833.7 447.3 558.6 524.4 483.8 524.3 576.1 523.7 495.9 453.5 424.3Soybeans $/mt 466.2 411.5 327.1 246.8 2285 217.5 267.4 274.2 258.6 2465 243.7 243.6 230.6
GrainsMaize $/mt 232.9 174.0 163.6 109.3 97.6 103.6 145.5 08.7 108.9 107.4 106.0 100.5 94.9Rice, Thai, 5% $/mt 503.6 570.6 287.0 270.9 242.8 269.2 297.3 281.8 258.6 259.7 265.1 254.9 253.7Sorghum $/mt 206.5 179.0 50.1 103.9 94.3 99.8 131.6 101.8 105.6 104.1 102.9 97.5 92.1Wheat, US, HRW $/mt 218.9 240.0 198.0 135.5 135.9 148.5 182.1 148.1 140.6 138.2 140.2 128.9 121.9
Other foodBananas $/mt 662.2 524.1 551.0 540.9 399.1 373.4 412.0 466.7 430.0 417.2 414.7 385.8 363.8Beef, US c/kg 520.1 383.4 314.0 256.3 211.7 160.0 156.6 172.3 170.0 178.5 179.1 170.2 164.1Oranges $/mt 670.0 556.0 580.7 531. 373.2 445.8 431.3 426.1 429.1 438.3 448.9 439.3 415.1Shrimp c/kg 1,108 1,421 1,529 1,079 1,186 1,136 1,151 1,370 1,334 1,276 1,266 1,162 1,087Sugar,world c/kg 32.79 87.75 13.04 27.67 24.22 24.56 23.12 23.27 23.80 22.51 22.27 21.16 22.49
Agricultural raw materialsTimberLogs, Malaysia $/m3 172.0 271.6 177.4 177.2 279.1 214.4 221.2 221.2 208.7 211.3 222.3 247.4 270.2Logs, Cameroon $/m3 17 .5 349.7 253.4 343.5 299.7 284.8 238.3 238.9 241.3 246.5 256.5 299.9 320.2Sawnwood, Maaysia $/m3 697.8 550.2 447.5 533.0 745.0 620.7 650.4 616.2 453.6 466.5 495.9 599.7 670.1
Other raw materialsCotton c/kg 269.7 286.5 192.1 181.9 160.0 78.5 155.6 62.2 156.0 54.0 153.1 142.4 135.1Rubber, RSSI, Malaysia c/kg 162.4 97.9 1 10.6 86.5 102.2 132.5 122.3 94.5 71.0 74.7 84.9 94.1 90.4Tobacco $/mt 4,290 3,162 3,807 3,392 2,395 2,214 2.676 3.277 3,084 2,905 2,779 2,534 2,339
FertilizersDAP $/mt 215.3 308.7 246.3 17 .4 56.8 181.7 187.0 185.6 186.0 76.0 169.3 156.7 138.4Phosphate rock $/mt 43.9 64.9 49.4 40.5 29.9 29.4 34.2 38.1 37.6 36.7 35.9 33.0 30.3Potasium chloride' $/mt 127.6 160.8 22.4 98. 95.9 98.8 102.6 108.2 107.1 06.9 106.9 90.0 90.3TSP $/mt 171.5 250.4 176.9 131.8 119.9 125.5 154.3 59.6 145.2 37.8 130.8 118.4 106.7Urea $/mt 191.4 308.6 198.7 157.0 134.2 177.4 180.3 135.6 136.1 40.8 148.8 140.2 131.8
Metals and mineralsAluminum $/mt 2,217 2,023 1,517 1,639 1,340 1,515 1,321 1,485 1,406 1,408 1,394 1.387 1,360Copper $/mt 5,645 3,032 2.066 2,661 2,094 2,463 2,013 2,114 1,640 1,650 1,640 1,574 1,550Gold $Aoz 143.5 844.7 463.4 383.5 348.4 322.3 340. 307.4 272.2 272.9 273.6 262.4 250.4Iron ore c/dmtu 39.23 39.02 38.71 30.80 23.11 22.61 25.06 26.81 26.93 26.41 26.08 24.59 22.40Lead c/kg 120.8 125.8 57.0 81.1 49.7 52.9 67.9 57.9 50.8 Sl.1 50.5 47.6 44.2Nicke $/mt 11,348 9,056 7,140 8,864 5,752 6,902 6,580 6,431 5,489 5,50i 5,430 5,135 4,876Silver c/toz 705.7 2866.9 895.2 482.0 479.5 435.5 454.7 454.2 440.0 448.9 444.6 397.3 362.4Tin c/kg 1,465 2,330 1,682 608.5 495.8 521.3 540.8 524.2 518.9 522.8 520.0 470.0 426.3Zinc c/kg 1 18.0 105.8 114.2 151.4 90.5 86.5 89.9 122.2 102.1 104.3 102.6 93.7 85.7
.. Not ava lable.Note: Computed from unrounded data and deflated by MUV (I1990= 100) Forecast as of February 20, 1998.a. Also known as muriate of potash.Source: World Bank, Development Economics Development Prospects Group
FEBRUARY 1998 33
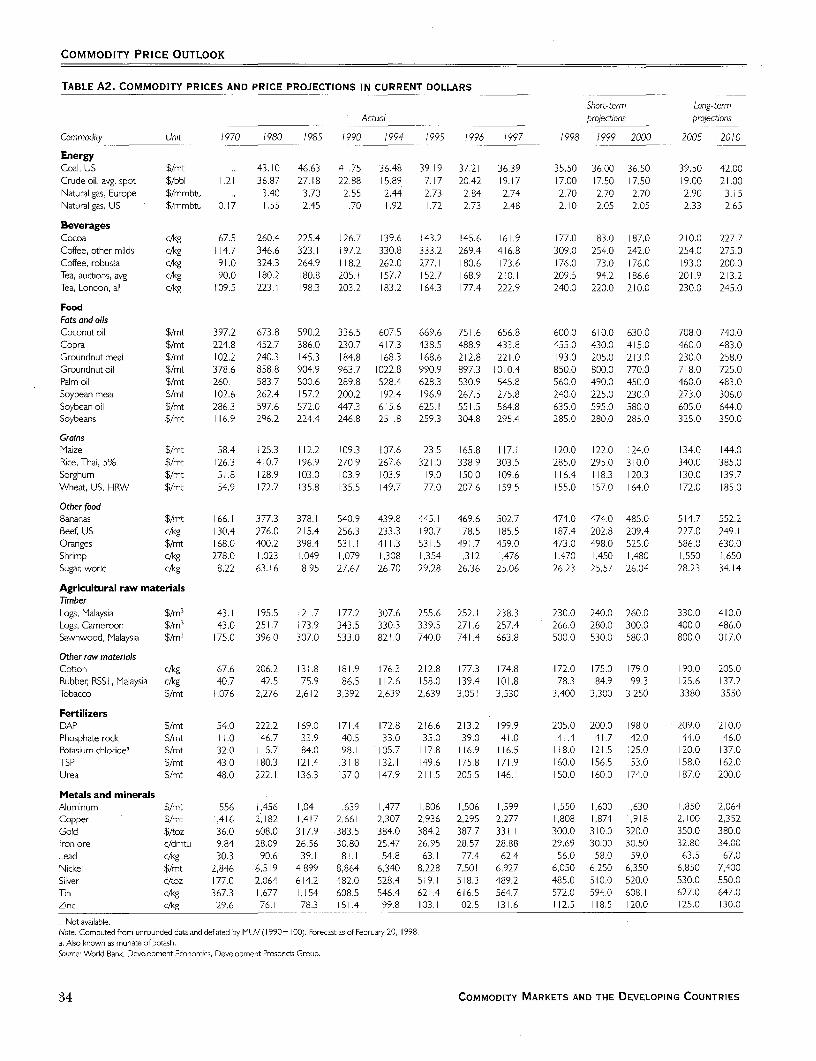
COMMODITY PRICE OUTLOOK
TABLE A2. COMMODITY PRICES AND PRICE PROJECTIONS IN CURRENT DOLLARS
Short-term Long-termActuol projections projections
Commodity Unit 1970 1980 1985 1990 1994 1995 1996 1997 1998 1999 2000 2005 2010
EnergyCoal, US $/mt .. 43.10 46.63 41.75 36.48 39.19 37.21 36.39 35.50 36.00 36.50 39.50 42.00Crude oil, avg. spot $/bbl 1.21 36.87 27.18 22.88 15.89 17.17 20.42 19.17 17.00 17.50 17.50 19.00 21.00Natural gas, Europe $/mmbtu .. 3.40 3.70 2.55 2.44 2.73 2.84 2.74 2.70 2.70 2.70 2.90 3.15Natural gas, US $/mmbtu 0.17 1.55 2.45 1.70 1.92 1.72 2.73 2.48 2.10 2.05 2.05 2.33 2.65
BeveragesCocoa c/kg 67.5 260.4 225.4 126.7 139.6 143.2 145.6 161.9 177.0 183.0 187.0 210.0 227.7Coffee, othermilds c/kg 114.7 346.6 323.1 197.2 330.8 333.2 269.4 416.8 309.0 254.0 242.0 254.0 275.0Coffee, robusta c/kg 91.0 324.3 264.9 118.2 262.0 277.1 180.6 173.6 176.0 173.0 176.0 193.0 200.0Tea, auctions, avg c/kg 90.0 180.2 180.8 205.1 157.7 152.7 168.9 210.1 209.5 194.2 186.6 201.9 213.2Tea, London, all c/kg 109.5 223.1 198.3 203.2 183.2 164.3 177.4 222.9 240.0 220.0 210.0 230.0 245.0
FoodFats and oilsCoconutoil $/mt 397.2 673.8 590.2 336.5 607.5 669.6 751.6 656.8 600.0 610.0 630.0 708.0 740.0Copra $/mt 224.8 452.7 386.0 230.7 417.3 438.5 488.9 433.8 455.0 430.0 415.0 460.0 483.0Groundnutmeal $/mt 102.2 240.3 145.3 184.8 168.3 168.6 212.8 221.0 193.0 205.0 213.0 230.0 258.0Groundnut oil $/mt 378.6 858.8 904.9 963.7 1022.8 990.9 897.3 1010.4 850.0 800.0 770.0 718.0 725.0Palm oil $/mt 260.1 583.7 500.6 289.8 528.4 628.3 530.9 545.8 560.0 490.0 450.0 460.0 483.0Soybean meal $/mt 102.6 262.4 157.2 200.2 192.4 196.9 267.5 275.8 240.0 225.0 230.0 273.0 306.0Soybean oil $/mt 286.3 597.6 572.0 447.3 615.6 625.1 551.5 564.8 635.0 595.0 580.0 605.0 644.0Soybeans $/mt 116.9 296.2 224.4 246.8 251.8 259.3 304.8 295.4 285.0 280.0 285.0 325.0 350.0
GrainsMaize $/mt 58.4 125.3 112.2 109.3 107.6 123.5 165.8 117.1 120.0 122.0 124.0 134.0 144.0Rce, Thai, 5% $/mt 126.3 410.7 196.9 270.9 267.6 321.0 338.9 303.5 285.0 295.0 310.0 340.0 385.0Sorghum $/mt 51.8 128.9 103.0 103.9 103.9 1 19.0 150.0 109.6 116.4 118.3 120.3 130.0 139.7Wheat, US, HRW $/mt 54.9 172.7 135.8 135.5 149.7 177.0 207.6 159.5 155.0 157.0 164.0 172.0 185.0
Other foodBananas $/mt 166.1 377.3 378.1 540.9 439.8 445.1 469.6 502.7 474.0 474.0 485.0 514.7 552.2Beef, US c/kg 130.4 276.0 215.4 256.3 233.3 190.7 178.5 185.5 187.4 202.8 209.4 227.0 249.1Oranges $/mt 168.0 400.2 398.4 531.1 411.3 531.5 491.7 459.0 473.0 498.0 525.0 586.0 630.0Shrimp c/kg 278.0 1,023 1,049 1,079 1,308 1,354 1,312 1,476 1,470 1,450 1,480 1,550 1,650Sugar, world c/kg 8.22 63.16 8.95 27.67 26.70 29.28 26.36 25.06 26.23 25.57 26.04 28.23 34.14
Agricultural raw materialsTimberLogs, Malaysia $/m3 43.1 195.5 121.7 177.2 307.6 255.6 252.1 238.3 230.0 240.0 260.0 330.0 410.0Logs, Cameroon $/m3 43.0 251.7 173.9 343.5 330.3 339.5 271.6 257.4 266.0 280.0 300.0 400.0 486.0Sawnwood, Malaysia $/m3 175.0 396.0 307.0 533.0 821.0 740.0 741.4 663.8 500.0 530.0 580.0 800.0 1017.0
Other raw materialsCotton c/kg 67.6 206.2 131.8 181.9 176.3 212.8 177.3 174.8 172.0 175.0 179.0 190.0 205.0Rubber, RSSI, Malaysia c/kg 40.7 142.5 75.9 86.5 112.6 158.0 139.4 101.8 78.3 84.9 99.3 125.6 137.2Tobacco $/mt 1,076 2,276 2,612 3,392 2,639 2,639 3,051 3,530 3,400 3,30D 3,250 3380 3550
FertilizersDAP $/mt 54.0 222.2 169.0 171.4 172.8 216.6 213.2 199.9 205.0 200.3 198.0 209.0 210.0Phosphate rock $/mt 11.0 46.7 33.9 40.5 33.0 35.0 39.0 41.0 41.4 41.7 42.0 44.0 46.0Potasium chloridea $/mt 32.0 1 15.7 84.0 98.1 105.7 1 17.8 1 16.9 116.5 118.0 121.5 125.0 120.0 137.0TSP $/mt 43.0 180.3 121.4 131.8 132.1 149.6 175.8 171.9 160.0 156.5 153.0 158.0 162.0Urea $/mt 48.0 222.1 136.3 157.0 147.9 211.5 205.5 146.1 150.0 160.0 174.0 187.0 200.0
Metals and mineralsAluminum $/mt 556 ,456 1,041 1,639 1,477 1,806 1,506 1,599 1,550 1,600 1,630 1,850 2,064Copper $/mt 1,416 2,182 1,417 2,661 2,307 2,936 2,295 2,277 1,808 1,874 1,918 2,100 2,352Gold $/toz 36.0 608.0 317.9 383.5 384.0 384.2 387.7 331.1 300.0 310.0 320.0 350.0 380.0Iron ore c/dmtu 9.84 28.09 26.56 30.80 25.47 26.95 28.57 28.88 29.69 30.00 30.50 32.80 34.00Lead c/kg 30.3 90.6 39.1 81.1 54.8 63.1 77.4 62.4 56.0 58.0 59.0 63.5 67.0Nickel $/mt 2,846 6,519 4,899 8,864 6,340 8,228 7,501 6,927 6,050 6,250 6,350 6,850 7,400Silver c/toz 177.0 2,064 614.2 482.0 528.4 519.1 518.3 489.2 485.0 510.0 520.0 530.0 550.0Tin c/kg 367.3 1,677 1,154 608.5 546.4 621.4 616.5 564.7 572.0 594.0 608.1 627.0 647.0Zinc c/kg 29.6 76.1 78.3 151.4 99.8 103.1 102.5 131.6 1 12.5 118.5 120.0 125.0 130.0
- Not available.Note: Computed from unrounded data and defated by MUV (1990= 100). Forecastas of February 20, 1998.a. Also known as muriate of potash.Source: World Bank, Development Economics, Development Prospects Group.
34 COMMODITY MARKETS AND THE DEVELOPING COUNTRIES

COMMODITY PRICE OUTLOOK
TABLE A3. WEIGHTED INDEX OF COMMODITY PRICES IN CURRENT DOLLARS AND IN CONSTANT 1990 DOLLARS1990=100
Agriculture
Nonenergy Food Row moterilis Metolscommod- Totol Totol Other Totol row and
Energy ities agncu/ture Beveroges food Fots and oils Groins foods motenols Timber Fertilizers mineroisYeor (/00) (l00)6 (69.1)x (16.9)x (29.4)x ("0,1)x (6.9)x (/2.4)a (22.8)0 (9,3)0 (2.7)0 (28.2)'
Current doliors
1980 161.2 125.9 138.3 182.4 139.3 148.7 34.3 134.3 104.6 79.0 128.9 95.11985 118.8 91.4 100.2 164.1 86.3 113.0 89.2 62.8 70.8 59. 89.0 70.2
1990 100.0 100.0 100.0 100.0 100.0 100.0 100.0 100.0 100.0 100.0 100.0 100.01991 84.7 95.3 97.6 92.9 99.2 104.5 01.7 93.4 99.2 104.2 102.4 88.91992 83.1 91.8 94.0 77.5 100.0 I1 .7 101.7 89.5 98.3 114.5 95.8 86.11993 73.6 91.4 98.8 83.6 98.6 111.5 93.7 90.7 110.3 152.4 83.7 73.91994 69.4 1 1.6 123.3 148.8 106.8 25.9 102. 93.9 25.8 156.6 93.4 84.61995 75.1 122.2 13 .3 51.2 1 6.9 136.6 120.4 98.8 135.2 139.5 103.6 101.61996 89.3 115.1 125.5 126.5 123.6 147.0 140.6 95.0 127.1 139.5 119.8 89.11997 83.8 117.6 128.7 171.0 116.1 147.7 1 2.1 92.4 113.7 125.8 119.7 90.21998 74.3 106.1 115.4 145.0 113.4 40.6 109.3 93.5 96.0 98.5 114.4 82.61999 76.5 104.5 112.1 130.0 11.1 131.1 11 .8 94.5 100.0 104.1 13.0 85.1
2000 76.5 106.7 114.6 127.4 112.5 129.4 116.2 96.5 107.8 113.7 111.5 86.82005 83.0 119.3 129.3 37.3 121.8 144.0 25.2 101.8 132.9 154.8 I15.8 95.12010 91.8 131.4 143.2 147.6 131.3 155.9 137.6 107.5 155.3 196.1 19.5 103.6
Constont 1990 dollars
1980 223.9 174.9 192.2 253.4 193.5 206.6 186.6 186.6 145.3 109.8 179. 132.11985 173.2 133.3 146.0 239.2 125.8 164.7 130.1 91.5 103.3 86.1 129.8 102.3
1990 100.0 100.0 100.0 00.0 100.0 100.0 100.0 100.0 100.0 100.0 100.0 100.01991 82.8 93.2 95.5 90.9 97.0 102.2 99.5 91.3 97.0 102.0 100.2 87.01992 78.0 86.1 88.1 72.6 93.8 104.7 95.4 84.0 92.2 107.3 89.8 80.81993 69.2 85.9 92.9 78.6 92.7 .04.9 88.1 85.3 103.7 143.3 78.7 69.51994 63.0 01.3 111.9 135.0 96.9 114.3 92.6 85.2 114.2 142.1 84.7 76.81995 63.0 102.5 110.2 126.8 98.1 114.6 101.0 82.9 113.4 117.1 86.9 85.21996 78.3 101.0 110.1 10.9 108.5 129.0 123.3 83.3 111.5 122.4 105.1 78.21997 77.8 09.2 119.5 58.8 107.8 137.2 104.1 85.8 105.6 116.8 111.2 83.81998 67.4 96.3 104.7 31.5 102.9 127.6 99.2 84.8 87.1 89.4 99.4 74.91999 67.3 92.0 98.6 14.5 97.8 115.4 98.4 83. 88.0 91.6 99.4 74.9
2000 65.4 91.2 98.0 108.9 96.2 110.7 99.3 82.5 92.2 97.3 95.4 74.22005 62.3 89.4 96.9 103.0 91.3 108.0 93.9 76.3 99.7 116.0 86.8 71.32010 60.5 86.6 94.3 97.2 86.5 102.7 90.7 70.9 102.3 129.2 78.7 68.2
Note: Fgures for 1998-2010 are projections. We ghts used are the average 1987-89 export values for ow- and middle-income economies. Forecast as of February 20, 1998.a. Percentage share of commodity group in nonenergy index.Source. WiVorld Bank Development Economics, Development Prospects Group
TABLE A4. INFLATION INDICES FOR SELECTED YEARS
C-5 M UV index3 US GDP deflator
Yeor 1990= i 00 % chonge 1990=100 % chonge
1980 71.98 64.541985 68.61 -0.95 83.77 5.66
1990 100.00 7.83 100.00 3.611991 102.23 2.23 103.95 3.951992 106.64 4.3 06.84 2.781993 106.33 -0.29 109.62 2.601994 110.21 3.65 112.18 2.341995 19.21 8.17 114.96 2.481996 113.99 -4.38 117.20 1.951997 107.72 -5.50 1 9.66 2.101998 110.23 2.32 121.94 1.901999 113.61 3.07 124.37 2.00
2000 1 16.95 2.94 126.86 2.002005 133.40 2.67 141.44 2.202010 151.77 2.61 157.70 2.20
Note. Figures for 1997-2010 are projectons. For 1996, US GDP deflator is actual; MUV is a preiimrnary estimate. Forecast as of january 5. 1998. Growth rates foryears1985, 1990, 2000. 2005 and 2010 are compound annua rates of change between adjacent end-point years; all others are annua growth races from the previous yeara. Unit value index n US dollar terms o manufactures exported from the G-5 countries (France, Germnany, Japan, UK, and US). we ghted proportionally tc the coun-tries' exports to the developing countr es.Source: G-5 MUV ndex, G-S GDP/GNP deflator and G 7 CPI World Bank US GDP deflator: US Department of Commerce.
FEBRUARY 1998 35

COMMODITY PRICE OUTLOOK
TABLE A5. COMMODITY PRICE PROBABILITY DISTRIBUTIONS IN CONSTANT 1990 DOLLARS
70% probability distribubon
Commodity Unit 1998 1999 2000 2005
EnergyCoal, US $/mt 25.40-39.01 24.21-39.17 23.09-39.33 18.37-40.85Crude oil, avg, spot $/bbl 11.34-19.50 11.00-19.58 10.47-l19.45 8.25-20.24Natural gas, Europe $/mmbtu 1.91-2.99 1.80-2.95 1.67-2.95 1.39-2.96Natural gas, US $/mmbtu 1.45-2.36 1.32-2.29 1.24-2.27 1.05-2.44
BeveragesCocoa ¢/kg 142-181 139-187 131-195 119-208Coffee, other milds ¢/kg 236-334 179-277 156-269 137-261Coffee, robusta ¢/kg 137-183 121-186 116-192 104-198Tea, auctions, avg. ¢/kg 173-210 145-196 126-190 116-183Tea, London, all ¢kg 198-241 165-223 142-214 133-208
FoodFats and oilCoconut oil $/mt 463-626 430-644 404-674 371-690Copra $/mt 351-474 303-454 266-444 241-448Groundnut meal $/mt 149-201 144-217 137-227 121-224Groundnut oil $/mt 656-887 563-845 494-823 377-699Palm oil $/mt 432-584 345-518 289-481 241-448Soybean meal $/mt 185-250 158-238 148-246 143-266Soybean oil $/mt 490-662 419-628 372-620 318-590Soybeans $/mt 220-298 197-296 183-304 171-317
GrainsMaize $/mt 87-131 84-132 81-134 65-141Rce, Thai, 5% $/mt 196-326 192-332 191-345 153-382Sorghum $/mt 84-127 81-128 78-130 63-136Wheat, US, HRW $/mt 107-177 102-177 101-182 77-184
Other foodBananas $/mt 361-499 323-512 312-513 239-509Beef, US ¢/kg 139-201 140-217 134-224 114-226Oranges $/mt 326-541 324-559 323-579 294-584Shrimp ¢/kg 1,214-1,467 1,1 11-1,468 1,063-1,519 930- ,522Sugar, world ¢/kg 20.42-27.18 17.96-27.06 17.36-27.19 14.39-27.94
Agricultural raw materialsTimberLogs, Malaysia $/m3 183-238 182-246 182-272 187-328Logs, Cameroon $/m3 212-275 212-286 210-313 226-397Sawnwood, Malaysia $/m3 398-516 401-542 406-605 454-794
Other raw materialsCotton ¢/kg 132-180 123-185 1 15-191 100-185Rubber, RSSI, Malaysia ¢/kg 57-85 55-94 62-108 61- 31Tobacco $/mt 2,529-3,456 2,281-3,530 2,085-3,474 1,698-3,370
FertilizersDAP $/mt 141-234 130-225 122-220 102-212Phosphate rock $/mt 29-47 27-47 26-47 21-45Potassium chloridea $/mt 81-135 79-137 77-139 54-126TSP $/mt 110-183 102-176 94-170 71-166Urea $/mt 103-171 104-180 107-193 84-196
Metals and mineralsAluminum $/mt 1,235-1,601 1,212-1,636 1,142-1,702 1,048-1,835Copper $/mt 1,440-1,868 1,420-1,916 I,342-2,003 1 .190-2,083Gold $/toz 207-343 202-348 197-353 157-380Iron ore ¢/dmtu 21.95-3 1.57 20.86-31.95 19.84-32.32 17.24-32.68Lead ¢/kg 38.65-64.05 37.76-65.14 36.34-65.07 3h.63-64.24Nickel $/mt 4,171-6,916 4,071-7,014 3,909-7,005 3,08 i -7,189Silver ¢/toz 334-554 332-572 320-574 238-576Tin ¢/kg 394-654 387-667 374-671 282-611Zinc ¢/kg 78-129 77-133 74-132 62-125
Note: Forecast as of February 20, 1998.a. Also known as muriate of potash.Source: World Bank, Development Economics, Development Prospects Group.
36 COMMODITY MARKETS AND THE DEVELOPING COUNTRIES

COMMODITY PRICE OUTLOOK
TABLE A6. COMMODITY PRICE PROBABILITY DISTRIBUTIONS IN CURRENT DOLLARS
70% probobility distribution
Commodity Unit 1998 1999 2000 2005
EnergyCoal, US $/mt 28.00-43.00 27.50-44.50 27.00-46.00 24.50-54.50Crude oil, avg. spot $/bbl 12.50-21.50 12.50-22.25 12.25-22.75 1 1.00-27.00Natural gas, Europe $/mmbtu 2.10-3.30 2.05-3.35 1.95-3.45 1.85-3.95Natural gas, US $/mmbtu 1.60-2.60 1.50-2.60 1.45-2.65 1.40-3.26
BeveragesCocoa ¢/kg 157-200 158-213 153-228 159-278Coffee, other milds ¢/kg 260-368 203-315 182-315 183-348Coffee. robusta ¢/kg IS -202 138-211 136-225 139-264Tea, auctions, avg. ¢/kg 191-232 165-223 147-222 155-244Tea, London, all ¢/kg 218-266 187-253 166-250 177-278
FoodFats and oilCoconut oil $/mt 510-690 488-732 473-788 495-920Copra $/mt 387-523 344-516 31 1-519 322-598Groundnut meal $Jmt 164-222 164-246 160-266 161-299Groundnut oil $/mt 723-978 640-960 578-963 503-933Palm oil $/mt 476-644 392-588 338-563 322-598Soybean meal $/mt 204-276 180-270 173-288 191-355Soybean oil $/mt 540-730 476-714 435-725 424-787Soybeans $/mt 242-328 224-336 214-356 228-423
GrainsMaize $/mt 96-144 95-150 94-156 87-188Rice. Thai, 5% $/mt 217-359 218-378 223-403 204-510Sorghum $/nnt 93-140 92-146 91-152 85-182Wheat. US, HRW $/mt 118-195 116-201 118-213 103-246
Other foodBananas $/mt 398-550 367-581 365-600 3 19-679Beef, US ¢/kg 154-221 159-246 157-262 152-302Oranges $/mt 360-596 369-635 378-677 393-779Shrimp ¢/kg 1,338-1,617 1,262-1,668 1,243-1,776 1,240-2,030Sugar, world ¢/kg 22.51-29.96 20.41-30.74 20.30-31.80 19.20-37.27
Agricultural raw materialsTimberLogs, Malaysia $/m3 202-262 207-279 213-318 249-437Logs, Cameroon $/m3 234-303 241-325 246-366 302-529Sawnwood, Malaysia $/m3 439-569 456-616 475-708 605-1,059
Other raw materialsCotton ¢/kg 146-198 140-210 134-223 133-247Rubber, RSSI, Malaysia /kg 63-94 63-107 72-126 82-175Tobacco $/mt 2,788-3,810 2,591-4,010 2,438-4,063 2,265-4,495
FertilizersDAP $/mt 156-258 148-256 143-257 136-282Phosphate rock $/mt 32-52 31-53 30-55 29-59Potassiumchloridea $/mt 90-149 90-156 90-163 72-168TSP $/mt 122-202 116-200 110-199 95-221Urea $/mt 114-189 118-205 125-226 112-262
Metals and mineralsAuminum $/mt 1,361-1,765 1,377-1,859 1.335-1,991 1,398-2,448Copper $/mt 1,587-2,059 1,613-2,177 1.570-2,343 1,587-2,779Gold $/toz 228-378 229-395 230-413 210-508Iron ore ¢/dmtu 24.20-34.80 23.70-36.30 23.20-37.80 23.00-43.60Lead ¢/kg 42.60-70.60 42.90-74.00 42.50-76.10 42.20-85.70Nickel $/mt 4,598-7,623 4,625-7,969 4.572-8,192 4,1 10-9,590Silver ¢/toz 369-611 3774650 374-671 318-769Tn ¢/kg 435-721 440-757 438-784 376-815Zinc ¢/kg 86-142 88-IS1 86-135 83-167
Note: Forecast as of February 20, 1998.a. Also known as muroae of potash.Source: World Bank, Deveopment Economics, Development Prospecs Group.
FEBRUARY 1 998 37
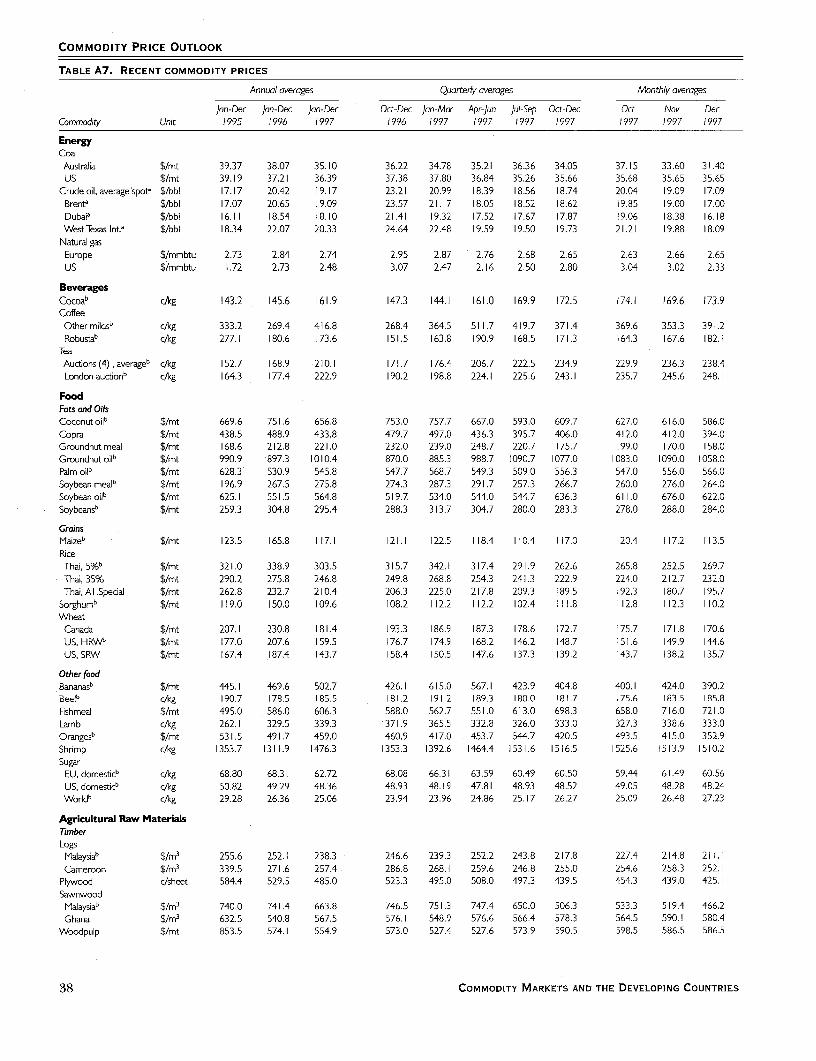
COMMODITY PRICE OUTLOOK
TABLE A7. RECENT COMMODITY PRICES
Annual averages Quorterly averages Monthly averages
Jan-Dec Jan-Dec Jan-Dec Oct-Dec Jan-Mar Apr-Jun Jul-Sep Oct-Dec Oct Nov DecCommodity Unit 1995 1996 1997 1996 1997 1997 1997 1997 1997 1997 1997
EnergyCoal
Australia $/mt 39.37 38.07 35.10 36.22 34.78 35.21 36.36 34.05 37.15 33.60 31.40US $/mt 39.19 37.21 36.39 37.38 37.80 36.84 35.26 35.66 35.68 35.65 35.65
Crude oil, average'spota $/bbi 17.17 20.42 19.17 23.21 20.99 18.39 18.56 18.74 20.04 19.09 17.09Brenta $/bbl 17.07 20.65 19.09 23.57 21.17 18.05 18.52 18.62 19.85 19.00 17.00Dubaia $/bbl 16.11 18.54 18.10 21.41 19.32 17.52 17.67 17.87 19.06 18.38 16.18West Texas Int.a $/bbi 18.34 22.07 20.33 24.64 22.48 19.59 19.50 19.73 21.21 19.88 18.09
Natural gasEurope $/mmbtu 2.73 2.84 2.74 2.95 2.87 2.76 2.68 2.65 2.63 2.66 2.65US $/mmbtu 1.72 2.73 2.48 3.07 2.47 2.16 2.50 2.80 3.04 3.02 2.33
BeveragesCocoab c/kg 143.2 145.6 161.9 147.3 144.1 161.0 169.9 172.5 174.1 169.6 173.9CoffeeOthermildSb c/kg 333.2 269.4 416.8 268.4 364.5 511.7 419.7 371.4 369.6 353.3 391.2Robustab c/kg 277.1 180.6 173.6 151.5 163.8 190.9 168.5 171.3 164.3 167.6 182.1
TeaAucbons (4), averageb c/kg 152.7 168.9 210.1 171.7 176.4 206.7 222.5 234.9 229.9 236.3 238.4London auctionb c/kg 164.3 177.4 222.9 190.2 198.8 224.1 225.6 243.1 235.7 245.6 248.1
FoodFats and OilsCoconut oilb $/mt 669.6 751.6 656.8 753.0 757.7 667.0 593.0 609.7 627.0 616.0 586.0Copra $/mt 438.5 488.9 433.8 479.7 497.0 436.3 395.7 406.0 412.0 412.0 394.0Groundnut meal $/mt 168.6 212.8 221.0 232.0 239.0 248.7 220.7 175.7 199.0 170.0 158.0Groundnut oilb $/mt 990.9 *897.3 1010.4 870.0 885.3 988.7 1090.7 1077.0 1083.0 1090.0 1058.0Paim o;i5 $/mt 628.3 530.9 545.8 547.7 568.7 549.3 509.0 556.3 547.0 556.0 566.0Soybean mealb $/mt 196.9 267.5 275.8 274.3 287.3 291.7 257.3 266.7 260.0 276.0 264.0Soybean oilb $/mt 625.1 551.5 564.8 519.7 534.0 544.0 544.7 636.3 611.0 676.0 622.0Soybeans' $/mt 259.3 304.8 295.4 288.3 313.7 304.7 280.0 283.3 278.0 288.0 284.0
GrainsMaize' $/mt 123.5 165.8 117.1 121.1 122.5 118.4 110.4 117.0 120.4 117.2 113.5RiceThai, 5%b $/mt 321.0 338.9 303.5 315.7 342.1 317.4 291.9 262.6 265.8 252.5 269.7Thai, 35% $/mt 290.2 275.8 246.8 249.8 268.8 254.3 241.3 222.9 224.0 212.7 232.0Thai,Al.Special $/mt 262.8 232.7 210.4 206.3 225.0 217.8 209.3 189.5 192.3 180.7 195.7
Sorghumb $/mt 119.0 150.0 109.6 108.2 112.2 112.2 102.4 111.8 112.8 112.3 110.2WheatCanada $/mt 207.1 230.8 181.4 193.3 186.9 187.3 178.6 172.7 175.7 171.8 170.6US, HRWb $/mt 177.0 207.6 159.5 176.7 174.9 168.2 146.2 148.7 151.6 149.9 144.6US, SRW $/mt 167.4 187.4 143.7 158.4 150.5 147.6 137.3 139.2 143.7 138.2 135.7
Other foodBananasb $/mt 445.1 469.6 502.7 426.1 615.0 567.1 423.9 404.8 400.1 424.0 390.2Beefb c/kg 190.7 178.5 185.5 181.2 191.2 189.3 180.0 181.7 175.6 183.5 185.8Fishmeal $/mt 495.0 586.0 606.3 588.0 562.7 551.0 613.0 698.3 658.0 716.0 721.0Lamb c/kg 262.1 329.5 339.3 371.9 365.5 332.8 326.0 333.0 327.3 338.6 333.0OrangeSb $/mt 531.5 491.7 459.0 460.9 417.0 453.7 544.7 420.5 493.5 415.0 352.9Shrimp c/kg 1353.7 1311.9 1476.3 1353.3 1392.6 1464.4 1531.6 1516.5 1525.6 1513.9 1510.2SugarEU, domesticb c/kg 68.80 68.31 62.72 68.08 66.31 63.59 60.49 60.50 59.44 61.49 60.56US, domestiCb c/kg 50.82 49.29 48.36 48.93 48.19 47.81 48.93 48.52 49.05 48.28 48.24Worldb c/kg 29.28 26.36 25.06 23.94 23.96 24.86 25.17 26.27 25.09 26.48 27.23
Agricultural Raw MaterialsTimberLogsMalaysia' $/m3 255.6 252.1 238.3 246.6 239.3 252.2 243.8 217.8 227.4 214.8 211.1Cameroon $/m3 339.5 271.6 257.4 286.8 268.1 259.6 246.8 255.0 254.6 258.3 252.1
Plywood c/sheet 584.4 529.5 485.0 523.3 495.0 508.0 497.3 439.5 454.3 439.0 425.1SawnwoodMalaysiab $/m3 740.0 741.4 663.8 746.5 751.3 747.4 650.0 506.3 533.3 519.4 466.2Ghana $/m3 632.5 540.8 567.5 576.1 548.9 576.6 566.4 578.3 564.5 590.1 580.4
Woodpulp $/mt 853.5 574.1 554.9 573.0 527.4 527.6 573.9 590.5 598.5 586.5 586.5
38 COMMODITY MARKETS AND THE DEVELOPING COUNTRIES
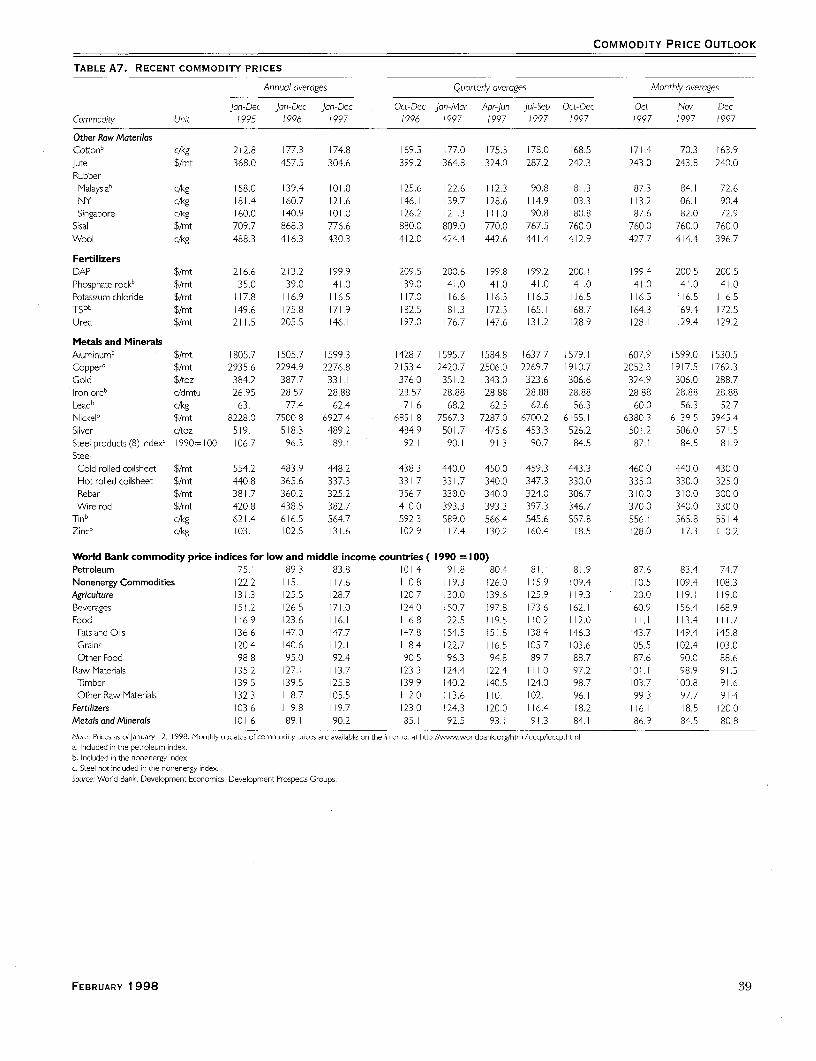
COMMODITY PRICE OUTLOOK
TABLE A7. RECENT COMMODITY PRICES
Annual overoges QuorteHy overages Monthly averages
jon-Dec Jon-Dec Jon-Dec Oct-Dec Jon-Mor Apr-Jun Jul-Sep Oct-Dec Oct Nov DecCommodity Unit 1995 1996 f997 1996 1997 1997 1997 997 1997 1997 1997
Other Raw MaterilasCotton' c/kg 212.8 177.3 174.8 169.5 177.0 175.5 178.0 168.5 171.4 170.3 163.9Jute $/mt 368.0 457.5 304.6 399.2 364.8 324.0 287.2 242.3 243.0 243.8 240.0RubberMalaysia' c/kg 158.0 139.4 101.8 25.6 122.6 1 12.3 90.8 81.3 87.3 84.1 72.6NY c/kg 181.4 160.7 121.6 146.1 139.7 128.6 1 14.9 103.3 113.2 106.1 90.4Singapore c/kg 160.0 140.9 101.0 26.2 121.3 1 1 1.0 90.8 80.8 87.6 82.0 72.9
Sisal $/mt 709.7 868.3 776.6 880.0 809.0 770.0 767.5 760.0 760.0 760.0 760.0Wool c/kg 488.3 416.3 430.3 412.0 424.4 442.6 441.4 412.9 427.7 414.4 396.7
FertilizersDAP $/mt 216.6 213.2 199.9 2D9.5 200.6 199.8 199.2 200.1 199.4 200.5 200.5Phosphaterockb $/mt 35.0 39.0 4 .0 39.0 41.0 41.0 41.0 4 .0 4 .0 41.0 4I.0Potassium chloride $/mt 117.8 6.9 116.5 117.0 116.6 116.5 116.5 116.5 116.5 116.5 116.5TSPb $/mt 149.6 75.8 171.9 182.5 181.3 172.5 165.1 168.7 164.3 169.4 172.5Urea $/mt 21 1.5 205.5 146.1 197.0 176.7 147.6 131.2 128.9 128.1 129.4 129.2
Metals and MineralsAluminumb $/mt 1805.7 1505.7 1599.3 1428.7 595.7 1584.8 1637.7 1579.1 1607.9 1599.0 /530.5Copper' $/mt 2935.6 2294.9 2276.8 2153.4 2420.7 2506.0 2269.7 1910.7 2052.3 1917.5 1762.3Gold $/toz 384.2 387.7 331.1 376.0 351.2 343.0 323.6 306.6 324.9 306.0 288.7Iron ore' c/dmtu 26.95 28.57 28.88 28.57 28.88 28.88 28.88 28.88 28.88 28.88 28.88Leadb c/kg 63.1 77.4 62.4 7 .6 68.2 62.5 62.6 56.3 60.0 56.3 52.7Nickel' $/mt 8228.0 7500.8 6927.4 6851.8 7567.3 7287 0 6700.2 6155.1 6380 3 6139.5 5945.4Silver c/toz 519. 518.3 489.2 434.9 501.7 475.6 453.3 526.2 501.2 506.0 571.5Steel products (8) index' 1990=100 106.7 96.3 89.1 92.1 90.1 91.3 90.7 84.5 87.1 84.5 81.9SteelCold rolled coilsheet $/mt 554.2 483.9 448.2 438.3 440.0 450.0 459.3 443.3 460.0 440.0 430.0Hot rolled coilsheet $/mt 440.8 365.6 337.3 33 .7 331.7 340.0 347.3 330.0 335.0 330.0 325.0Rebar $/mt 381.7 360.2 325.2 356.7 338.0 340.0 324.0 306.7 310.0 3 10.0 300.0Wire rod $/mt 420.8 438.5 382.7 410.0 393.3 393.3 397.3 346.7 370.0 340.0 330.0
Tinb c/kg 621.4 616.5 564.7 592.3 589.0 566.4 545.6 557.8 556.1 565.8 551.4Zinc' c/kg 103.1 102.5 131.6 102.9 17.4 130.2 160.4 1 18.5 128.0 1 17.3 1 10.2
World Bank commodity price indices for low and middle income countries (1990 = 100)Petroleum 75.1 89.3 83.8 101.4 91.8 80.4 81.1 81.9 87.6 83.4 74.7NonenergyCommodities 122.2 1 15.1 117.6 110.8 1 19.3 126.0 1 15.9 109.4 110.5 109.4 108.3Agriculture 131.3 125.5 28.7 120.7 130.0 139.6 125.9 1 19.3 120.0 1 19.1 1 19.0Beverages 151.2 126.5 171.0 124.0 150.7 197.8 173.6 162.1 60.9 56.4 168.9Food 1 16.9 123.6 16.1 116.8 122.5 119.5 1 10.2 1 12.0 111. 1 13.4 1 11.7Fats and Oils 136.6 147.0 47.7 147.8 154.5 151.8 138.4 146.3 143.7 149.4 145.8Grains 120.4 140.6 12.1 118.4 122.7 1 16.5 105.7 103.6 05.5 102.4 103.0Other Food 98.8 95.0 92.4 90.5 96.3 94.8 89.7 88.7 87.6 90.0 88.6
Raw Materals 135.2 127.1 13.7 123.3 124.4 122.4 111.0 97.2 101.1 98.9 91.5Timber 139.5 139.5 125.8 139.9 140.2 140.5 124.0 98.7 103.7 100.8 91.6Other Raw Materials 1 32.3 1 8.7 105.5 112.0 113.6 110. 102. 96.1 99.3 97.7 91.4
Fertilizers 103.6 1 9.8 1 19.7 123.0 124.3 120.0 1 16.4 118.2 116.1 118.5 120.0Metals and Minerals 101.6 89.1 90.2 85.1 92.5 93.1 91.3 84.1 86.9 84.5 80.8
Note Prsces as of January 2 1998. Month y updates of commod ty prices are xxx lable t, [he ictermet at hntp.//ww-w.wr dnank.orglicrn ieccpeiscp.a. Inc uded in the petroeurm index.b. Included in the nonenergy ndexc. Stee not inc uded in the nonenergy index.Source: World Bank. Development Economics, Development Prospecs Groups.
FEBRUARY 1998 39

COMMODITY PRICE OUTLOOK
COMMODITY DESCRIPTIONSEnergy Agricultural raw materialsCoal (Austrolian), thermal, 12,000 btuAb, less than I .096 sulfur, 14% ash, fo.b. piers, Timber
Newcastle/Port Kembla Logs (MolaysiGn), meranti, Sarawak, sale price charged by importers, Tokyo; prior toCoal (US), thermal, 12,000 btulb, lessthan 1.0% sulfur, 12% ash, f.o.b. piers, February 1993, average of Sabah and Sarawakweighted byJapanese import
Hampton Road/Norfolk volumesCrude oil (spot), average spot price of Brent, Dubai and West Texas Intermediate, Logs (West African), sapelli, high quality (loyal and marchand), fo.b. Cameroon
equally weighed Plywood (Southeast Asion), Lauan, 3-ply, extra, 9 1 m3 x 182 m3 x 4 mm, wholesaleCrude oil (spot), U.K. Brent 38 API, fo.b. U.K ports price, spot TokyoCrude oil (spot), Dubai Fateh 32 API, fo.b. Dubai Sawnwood (Moloysion), dark red seraya/meranti, select and better quality, GeneralCrude oil (spot), West Texas Intermediate (V\/TI) 400 API, f.o.b. Midland Texas Market Specification (GMS), width 6 inches or more, average 7 to 8 inches; lengthNatural Gas (Europe), average import border price 8 inches or more, average 12 to 14 inches; thickness I to 2 inch(es); kiln dry, c&fNaturol Gas (U.S.), spot price at Henry Hub, Louisiana UK ports
Beverages Sownwood (Ghanaian), sapele, bundled, fo.b. TakoradiCocoo (ICCO), International Cocoa Organization daily price, average of the first three Woodpulp (Swedish), softwood, sulphate, bleached, air-dry weight, cri.f North Sea
positions on the terminal markets of New York and London nearest three future portsOther raw materia/s
trading monthsCotton (cotton outlook, A index), middling I1-3/32 inch, c.i.f Europe
Coffee (ICO), International Coffee Organization indicator price, other mild Arabicas, Jute (Banglodesh), raw white D f o b. Chittagong/Chalnaaverage New York and Bremen/Hamburg markets, ex-dock Rube (Manlasa), raS no. in ba MaitagnRb Ecg Les
Coffee (ICO), International Coffee Organization indicator price, Robustas, average New Rubber (Malaysban), RSS no. a, in baies, Malayspan Rubber Exchange & LicensingYork and Le Havre/Marseilles markets, ex-dock Board, midday buyers'asking price for prompt or 30 days delivery, fo.b. Kuala
Tea (Auctions, average), leaf at Calcutta auction, and all tea at Colombo, London, and LumpurNairob/Mombssa autions aritmetic verags of wekly uotesRubber (any origin), RSS no. 1,in bales, Rubber Traders Association (RTA), spot, NewNairobi/Mombassa auctions, arithmetic averages of weekly quotes Yr
Teo (London ouctions), all tea, arithmetic averages of weekly quotes YorkRubber (Asian), RSS no. I, in bales, Rubber Association of Singapore Commodity
Foods Exchange (RASCE)/ Singapore Commodity Exchange, midday buyers' asking priceFats and ails for prompt or 30 days delivery; prior to June 1 992, spot, SingaporeCoconut oil (Philippines/lIndonesian), bulk, c.i.f. Rotterdam Sisal (East African), UG (rejects), c.i.f UKCopra (Philippines/lndonesion), bulk, c.i.f. N.W Europe Wool (Dominion), crossbred, 56's, clean, c.i.f UKGroundnut meal (Argentine), 48/50%, c..f Rotterdam FertilizersGroundnut oil (any origin), c.i.f RotterdamFetlzrPalm oil (Malaysian), 5% bulk, c.i.f. N. W Europe DAP (diommonium phosphate), bulk, spot, f.o.b. US GulfSoybealm mel (Mo nysiorin), Argentine 45/46% extraction, c.i.f. Rotterdam, Europr tPhosphate rock (Moroccan), 70% BPL, contract, fa.s. CasablancaSoybean meal (any origin), Argentine 45/46% extraction, cif. Rotterdam; prior to Potassium chloride (muriate of potash), standard grade, spot, fo.b. Vancouver
1990, US 44% TSP (triple superphosphate), bulk, spot, fo.b. US Gulf
Soybean oil (Dutch), crude, fo.b. ex-mill Urea (varying origins), bagged, spot, fob. West EuropeSoybeans (US), c.i.f. RotterdamGrains Metals and mineralsMaize (US), no. 2, yellow, fo.b. US Gulf ports Aluminum (LME) London Metal Exchange, unalloyed primary ingots, high grade, mini-Rice (Thai), 5% broken, WR, milled, indicative market price based on weekly surveys mum 99.7% purity, cash price
of export transactions (indicative survey price), government standard, f.o.b. Copper (LME), grade A, minimum 99.9935% purity, cathodes and wire bar shapes,Bangkok settlement price
Rice (Thai), 35% broken, WR, milled, indicative survey price, government standard, Gold (UK), 99.5% fine, London afternoon fixing, average of daily ratesf.o.b. Bangkok Iron ore (Brazilian), CVRD Southern System standard sinter f nes (SSF), 64.2% Fe (iron)
Rice (Thai), 100% broken, A. I Special, broken kemel obtained from the milling of WR content (dry weight) ores, moisture content 6.5%, contract price to Europe, fo.b.15%, 20%, and 25%, indicative survey price, government standard, fo.b. Tubarao, Unit dry metric ton unit (dmtu) stands for mt 1% Fe-unit. To convertBangkok price in cents/dmtu to $/dmt SSF (dry ore), multiply by percent Fe content. For
Sorghum (US), no. 2 milo yellow, fo.b. Gulf ports example, 28.88 cents/dmtu is $18.54 /dmt SSF To convert to wet mt SSF (naturalWheat (Canadian), no. I, Western Red Spring (CWRS), in store, St. Lawrence, export or wet ore), multiply by percent Fe content by (I minus percent moisture con-
price tent). 28.88 cents/dmtu is $17.34 /Aet mt SSF Iron ore in most countries isWheat (US), no. I, hard red winter, ordinary protein, export price delivered at the traded in terms of dry mt, and shipped in wet mt. For 1989-96, Fe content was
Gulf port for prompt or 30 days shipment 64.3% and moisture content 6.9%Wheat (US), no. 2, soft red winter, export price delivered at the Gulf port for prompt Lead (LME), refined, 99.97% purity, settlement price
or 30 days shipment Nickel (LME), cathodes, minimum 99.8% purity, official moming session, weekly aver-Other foods age bid/asked priceBananas (Central & South Americon), first-class quality tropical pack, importer's price to Silver (Handy & Harmon), 99.9% grade refined, New York
jobber or processor, f.o.r. US ports Steel products price index, 1990= 100, (apanese), composite price index for eightBeef (Australion/New Zealand), cow forequarters, frozen boneless, 85% chemical lean, selected steel products based on quotations fo.b. Japan excluding shipments to the
c.i.f US port (East Coast), ex-dock Un ted States and China, weighted by product shares of apparent combined con-Fishmeal (any origin), 64-65%, c&f Hamburg, nfs sumption (volume of deliveries) at Germany, Japan and the United States. TheLamb (New Zealand), frozen whole carcasses, wholesale price, Smithfeld market, eight products are as follows: rebar (concrete reinforcing bars), merch bar (mer-
London chant bars), w re rod, section (H-shape), plate (medium), hot rolled coil/sheet,Oranges (Mediterranean exporters) navel, EEC indicative import price, c.i.f Paris cold rolled coil/sheet, and galvanized iron sheetShrimp (US), frozen, Gulf brown, shell-on, headless, 26 to 30 count per pound, Tin (LME), refined, 99.85% purity, settlement price
wholesale price at New York Zinc (LME), special high grade, minimum 99.995% purity, weekly average bid/askedSugar (EU), European Union negotiated import price for raw unpackaged sugar from price, official morning session; prior to April 1990, high grade, minimum 99.95%
African, Caribbean and Pacific (ACP) under Lome Conventions c i.f European purity, settlement priceports
Sugar (US), import price, nearest future, c.i.f New YorkSugar (worid), Internationas Sugar Agreement (ISA) daily price, raw, fo.b. and stowed at
greater Caribbean ports
40 COMMODITY MARKETS AND THE DEVELOPING COUNTRIES
"6 . ..this may be the only sourceneeded for international, social,
and economic data."- Choice Magazine
World Development Indicators 1998
An award-winning series! Included in Choice Magazine's 34th annual Outstanding Academic Book list!
The second annual edition of the World Bank's flagship statistical reference-World Development Indicators1998. This award-winning publication provides an expanded view of the world economy for 148 countries-with chapters focusing on people, economy, environment, states and markets, world view, and global linksas well as introductions highlighting recent research on major development issues. The 1998 editionincludes some key indicators for 1997.
April 1998 390 pages Stock no. 14124 (ISBN 0-82134124-3) $60.00
World Development Indicators 1998 on CD-ROM
This comprehensive database contains underlying time-series data for the World Development Indicators andWorld Bank Atlas, now covering 1965-1996 for most indicators with some extending to 1997. Powerful fea-tures allow you to generate maps and charts and download your results to other software programs. RequiresWindows 3.1.TM
April 1998 Individual Version: Stock no. 14125 (ISBN 0-82134125-1) $275.00Network Version: Stock no. 14126 (ISBN 0-82134126-X) $550.00
World Bank Atlas 1998
One of the Bank's most popular offerings, the Atlas is designed as a companion to the World DevelopmentIndicators. Tables, charts, and colorful maps address the development themes of people, economy, envi-roinment, states and markets, world view, and global links. This easy-to-use book is ani international standardin statistical compilations and an ideal reference for office or classroom. Text, maps, and references appearin English, French, and Spanish.
April 1998. 64 pages. Stock no. 14127 (ISBN 0-82134127-8) $20.00
l Ei 53! |World Bank PublicationsSee order form on back. For US customers, contact The World Bank, P.O. Box 960, Herndon, VA 20172-0960. Phone:(703) 661-1580, Fax: (703) 661-1501. Shipping and handling: US$5.00. For airmail delivery outside the US, chargesare US$13.00 for one item plus US$6.00 for each additional item. Payrnent by US$ check drawn on a US bank payableto the World Bank or by VISA, MasterCard, or American Express. Customers outside the US may also contact theirlocal World Bank distributor.
Visit the World Bank's publications catalog on the World Wide Web:http://www.worldbank.org/
1310

Book and CD-ROM Order FormQuantity Title Stock # Price Total Price
Subtotal cost US$
Shipping and handlinge US$
Total US$
CHECK METHOD OF PAYMENTLI Enclosed is my check payable to the World Bank.
LI Charge my LI VISA IJ MasterCard L American Express
credit card account number
Expiration Date Signature (required to validate all orders)
u Bill me. (Institutional customers only. Purchase order must be included.)
PLEASE PRINT CLEARLY
Name
Address
City State Postal Code
Country Telephone
Customers in the United States: Complete this coupon and return to
The World BankP.O. Box 960Herndon, VA 20172-0960USA
To have your order shipped faster, charge by credit card by calling 703-661-1580 or send this completed ordercoupon by facsimile by dialing 703-661-1501.
Customers outside the United States: Contact your local Bank publications distributor for information on prices inlocal currency and payment terms. If there is no distributor in your country or region, send in your order using thecontact information provided above.
* SHIPPING AND HANDLING charges are $5.00 per order. If a purchase order is used, actual shipping will be charged. For air
mail delivery outside the United States, charges are $13.00 for one item plus $6.00 for each additional item. 1310
Commodity Markets and the Developing Countries
Not just the facts, unbiased analyses. The World Bank I Yes, please enter my subscription forisn't in the business of selling commodities. As an inter-national lender putting millions of dollars at risk every Commodity Markets and the Developing Countries,day, we demand objectivity regarding the commodities at US$150/yearmarkets that play such an important role in developing
countries. That is why you get unbiased forecasts that LI Enclosed is my check for US$150.00 drawn on a US bank and payable
are based on our own research. to the World Bank in US dollars. For payment in local currency, please ask
for the distributor in your area.
Four times a year World Bank commodity experts Charge my:
examine production, consumption, and factors fromclimate to exchange rates to give you the intelligence VISA MasterCard American Express
you need to make better decisions.Credit CardAccount Number Expiration Date
Only Commodity Markets covers such a wide rangeof the world's commodities-28 in all-with substan- Signature
tive yet succinct reports on: Name:
Company:
* Energy resources: coal, natural gas, petroleum Address:
* Foods and beverages: bananas, beef, citrus,shrimp, sugar; cocoa, coffee, tea; coconut oil,palm oil, soybean oil; maize, rice, wheat City/State/Postal Code:
* Agricultural raw materials: cotton, jute, rubber, Country:
timbertimber . Bill my organization. Institutional customers only. Please include a
* Fertilizers: potassium chloride, TSP, urea purchase order.
X Metals and minerals: aluminum, copper, gold,iron ore and steel Name:
Company:
Issued February, May, August, and November. Address:
Approximately 40 pageslISSN 1020-0967
City/State/Postal Code:
Country:
CQ028
Cut out form above and mail to:The World Bank
PO Box 7247-7956Philadelphia, PA 19170-7956
USA
To have your order shipped faster, call 201-476-2192 to charge by creditcard, or send this completed order coupon by facsimile to 201-476-2197.
Visit the World Bank's publications catalog on the World Wide Web: http://www.worldbank.org/

COMMODITYMMARKETS
ANDTHE DEVELOPING COUNTRIES
AWorld Bank Business Quarterly
Commodity Markets and the Developing Countriesis produced by the Development Prospects Group ofthe Development Economics Vice Presidency of theWorld Bank. For information about the contents callDonald Mitchell at 202-473-3854 or fax202-522-3564. The opinions expressed are those ofthe authors and should not be attributed in anymanner to the World Bank, to its Board of ExecutiveDirectors, or to the countries they represent. It ispublished quarterly in February, May, August, and 4 ,November. The annual subscription rate is $150.00. 4 /Send subscription orders to World BankPublications, Box 7247-7956, Philadelphia, PA 19170-7956, USA, telephone 201-476-2192 M4
© 1998 The International Bank for Reconstructionand Development/The World Bank1818 H Street, NW, Washington, DC 20433, USAAll rights reservedManufactured in the United States of AmericaVol. 5, no. 2ISSN 1020-0967ISBN 0-8213-4194-4
@) Printed on recycled paper