shair project - share, exhibit and commercialize emerging art

February 27, 2018

2
Forward looking statements and non-GAAP measuresCaution Regarding Forward-Looking Statements
This presentation contains forward-looking statements and forward-looking information within the meaning of applicable US and Canadian securities legislation (collectively, “forward-looking statements”), including, in particular, statements regarding the benefits and synergies of the IronPlanet transaction, future opportunities for the combined businesses of Ritchie Bros. and IronPlanet, future financial and operational results and any other statements regarding events or developments that Ritchie Bros. believes or anticipates will or may occur in the future. Forward-looking statements are statements that are not historical facts and are generally, although not always, identified by words such as “expect”, “plan, “anticipate”, “project”, “target”, “potential”, “schedule”, “forecast”, “budget”, “estimate”, “intend” or “believe” and similar expressions or their negative connotations, or statements that events or conditions “will”, “would”, “may”, “could”, “should” or “might” occur. All such forward-looking statements are based on the opinions and estimates of management as of the date such statements are made. Forward-looking statements necessarily involve assumptions, risks and uncertainties, certain of which are beyond Ritchie Bros.’ control, including risks and uncertainties related to: general economic conditions and conditions affecting the industries in which Ritchie Bros operates; Ritchie Bros.’ ability to successfully integrate IronPlanet's; the ability to realize anticipated growth, synergies and cost savings in the IronPlanet transaction; the maintenance of important business relationships; our ability to commercialize new platform solutions and offerings; deterioration of or instability in the economy, the markets we serve or the financial markets generally; as well as the risks and uncertainties set forth in Ritchie Bros.’ Annual Report on Form 10-K for the year ended December 31, 2018, which is available on the SEC, SEDAR, and Ritchie Bros.’ website. The foregoing list is not exhaustive of the factors that may affect Ritchie Bros.’ forward-looking statements. There can be no assurance that forward-looking statements will prove to be accurate, and actual results may differ materially from those expressed in, or implied by, these forward-looking statements. Forward-looking statements are made as of the date of this presentation and Ritchie Bros. does not undertake any obligation to update the information contained herein unless required by applicable securities legislation. For the reasons set forth above, you should not place undue reliance on forward-looking statements.
This presentation contains certain non-GAAP financial measures. For a discussion of non-GAAP measures and the most directly comparable GAAP financial measures, see the Appendix to this presentation as well as our earnings release and our Form 10-Q interim report, which are available at: investor.ritchiebros.com. These non-GAAP financial measures are not measures of financial performance in accordance with GAAP and may exclude items that are significant in understand and assessing our financial condition and results. Therefore, these measures should not be considered in isolation or as alternatives to measures of profitability, liquidity or other performance under GAAP. These measures may not be comparable to similarly-titled measures used by other companies.
This presentation also includes certain forward-looking non-GAAP financial measures. We are unable to present a quantitative reconciliation of this forward-looking non-GAAP financial information because management cannot reliably predict all of the necessary components of such measures. Accordingly, investors are cautioned not to place undue reliance on this information.All figures are in US dollars, unless otherwise noted.

Opening RemarksRavi Saligram, Chief Executive Officer
4
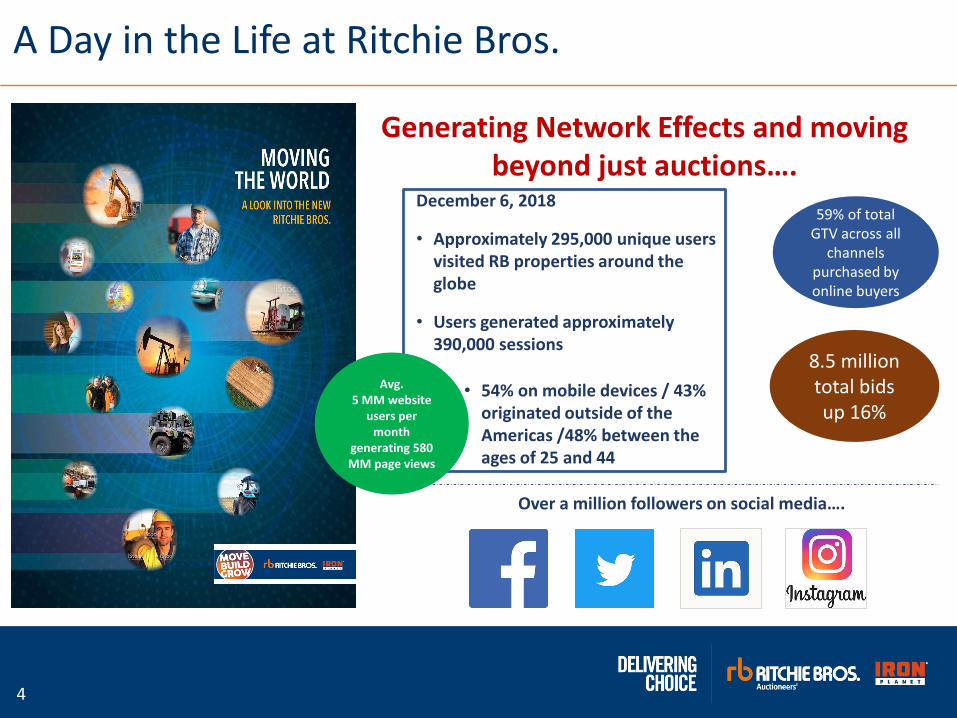
A Day in the Life at Ritchie Bros.
December 6, 2018
• Approximately 295,000 unique users visited RB properties around the globe
• Users generated approximately 390,000 sessions
• 54% on mobile devices / 43% originated outside of the Americas /48% between the ages of 25 and 44
Over a million followers on social media….
Generating Network Effects and moving beyond just auctions….
Avg. 5 MM website
users per month
generating 580 MM page views
8.5 million total bids up 16%
59% of total GTV across all
channels purchased by online buyers

5
Fourth Quarter Business & Financial ReviewSharon Driscoll, Chief Financial Officer

6
Higher revenue from inventory sales in US and Europe
Higher fee revenue associated with partial fee harmonization
Growth in other services Revenue led by RBFS
Q4 Consolidated Financial Performance
GROSSTRANSACTION
VALUE(GTV)
ADJUSTED OPERATING
INCOME(non-GAAP)
TOTAL REVENUES
AGENCY PROCEEDS(non-GAAP)
4Q18 4Q17
$1,338 $1,295
4Q18 4Q17
$356 $292
4Q18 4Q17
$56.3 $42.2
4Q18 4Q17
$193 $179
Agency proceeds growth
Disciplined expense management
Lower acquisition costs vs. 2017
14% Online growth led by strength in Canada and International
Modest Live auction growth; 23 fewer industrial auctions
Strong live auction comp growth; 70% of auctions posted year on year positive comps
All figures unadjusted unless otherwise noted. (In $US Millions except EPS)
+3% +22% +8% +33%
DILUTEDADJUSTED
EPS(non-GAAP)
4Q18 4Q17
$0.32 $0.26
Higher operating income offset by higher tax rate in 4Q18 vs. prior year
+23%
GTV growth and higher online volumes
Higher fee revenue associated with partial fee harmonization
Growth in other services revenue

7
Fourth Quarter A&M Segment – Agency Proceeds
Agency proceeds growth of 8% driven by GTV, strong online auction performance, partially offset by some inventory rate softness in the U.S.
Auctions and Marketplaces Agency Proceeds rate (non-GAAP) increased 80 basis points to 13.4% over 4Q17 due to continued overall market price performance and contributions from partial fee harmonization
$178,785
$193,133
A&M Agency Proceeds
4Q17 4Q18
+8%
In US$,(000)
13.1%
12.6%
13.4%
A&M Agency Proceeds Rate %

8
Fourth Quarter - Other Services
$4.6
$7.0
RBFS Revenue
4Q17 4Q18
In Millions USD
$90.5
$122.0
RBFS Funded Volume
4Q17 4Q18
In Millions USD
$3.0
$3.1
MascusRevenue
4Q17 4Q18
In Millions USD
Other Services Revenues improved 20%
RBFS Revenue growth of 50%
RBFS Funded Volume improved 35%
Mascus revenue growth of 3%

9
$132,079 $141,939
4Q17 4Q18
$92,983 $95,624
4Q17 4Q18
$39,096 $46,315
4Q17 4Q18
Fourth Quarter - Costs of Services / SG&A 4Q18 Total Revenue growth of 22% / Agency Proceeds growth of 8% outpacing SG&A growth of 3% 4Q18 SG&A leverage – roughly 200 basis point rate improvement (SG&A as a % of Agency Proceeds) vs. 4Q17 Costs of Services increased 18%
Costs of Services and SG&A Expenses (in $ US Thousands)
SG&A Expenses(as a % of Agency Proceeds)
+18%
+3%
+7%
Costs of Services SG&A Combined
2017 & 2018 (RB+IP) Combined Company
4Q17 52%
1Q18 57%
2Q18 49%
3Q18 55%
4Q18 50%
Reported Costs of Services of $46.3MM includes ancillary and logistical service expenses of $20.3MM
When ancillary and logistical service expenses are removed from Costs of Services, the net amount is $26.0MM, which represents 13% of Agency Proceeds and a 4% increase over 4Q17

10
Balance Sheet & Liquidity Metrics
Operating Free Cash Flow
(non-GAAP)
TTM Agency Proceeds Capex
Rate(non-GAAP)
Adjusted Net Debt/
Adjusted EBITDA(non-GAAP)
TTM Return OnInvested Capital
(non-GAAP)
4Q18 4Q17
$112MM $113MM
4Q18 4Q17
4.4% 5.6%
4Q18 4Q17
1.9X 2.9X
4Q18 4Q17
7.6% 6.2%
2018 Balance sheet and liquidity metrics (all unadjusted unless otherwise noted)
11
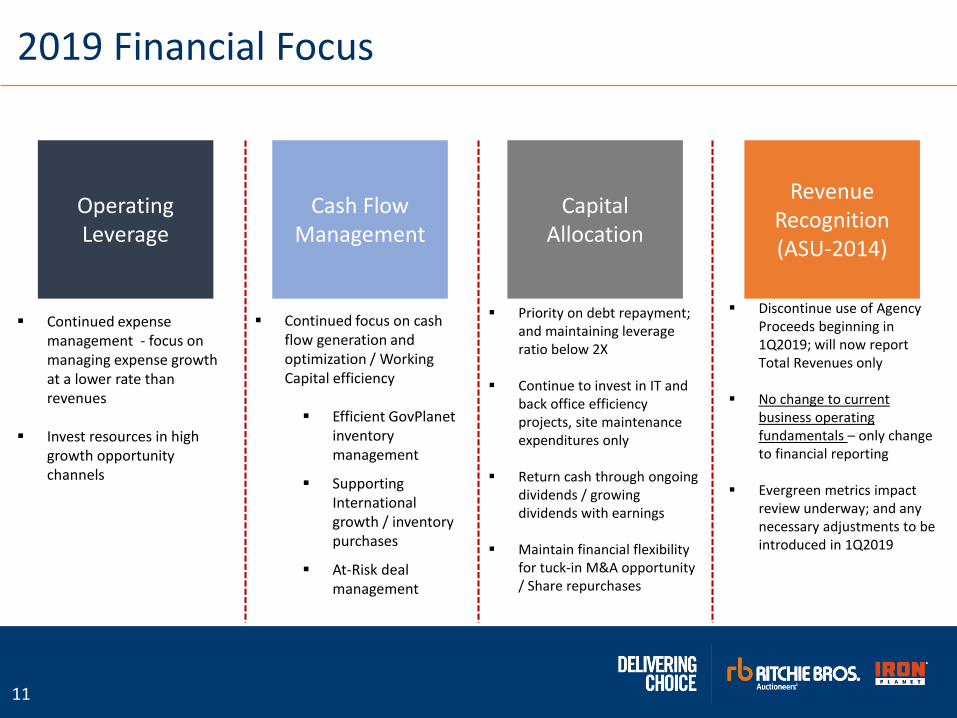
2019 Financial Focus
Capital Allocation
Cash Flow Management
Revenue Recognition(ASU-2014)
Operating Leverage
Continued expense management - focus on managing expense growth at a lower rate than revenues
Invest resources in high growth opportunity channels
Continued focus on cash flow generation and optimization / Working Capital efficiency
Efficient GovPlanet inventory management
Supporting International growth / inventory purchases
At-Risk deal management
Priority on debt repayment; and maintaining leverage ratio below 2X
Continue to invest in IT and back office efficiency projects, site maintenance expenditures only
Return cash through ongoing dividends / growing dividends with earnings
Maintain financial flexibility for tuck-in M&A opportunity / Share repurchases
Discontinue use of Agency Proceeds beginning in 1Q2019; will now report Total Revenues only
No change to current business operating fundamentals – only change to financial reporting
Evergreen metrics impact review underway; and any necessary adjustments to be introduced in 1Q2019

12
Strategic & Operational UpdateRavi Saligram, Chief Executive Officer

13
2018 Full Year Consolidated Financial Performance
GROSSTRANSACTION
VALUE(GTV)
TOTAL REVENUES
AGENCY PROCEEDS(non-GAAP)
2018 2017
$4,964 $4,468
2018 2017
$1,170 $971
2018 2017
$729 $611
All figures unadjusted unless otherwise noted. (In $US Millions except EPS)
Adjusted EPS
(non-GAAP)
2018 2017
$1.08 $0.81
Reported EPS
2018 2017
$1.11 $0.69
11% Reported
3% Like for Like
20% Reported 19% Reported
10.5% Like forLike
61% 33%
2H Agency Proceeds +10%2H SG&A +3%
14
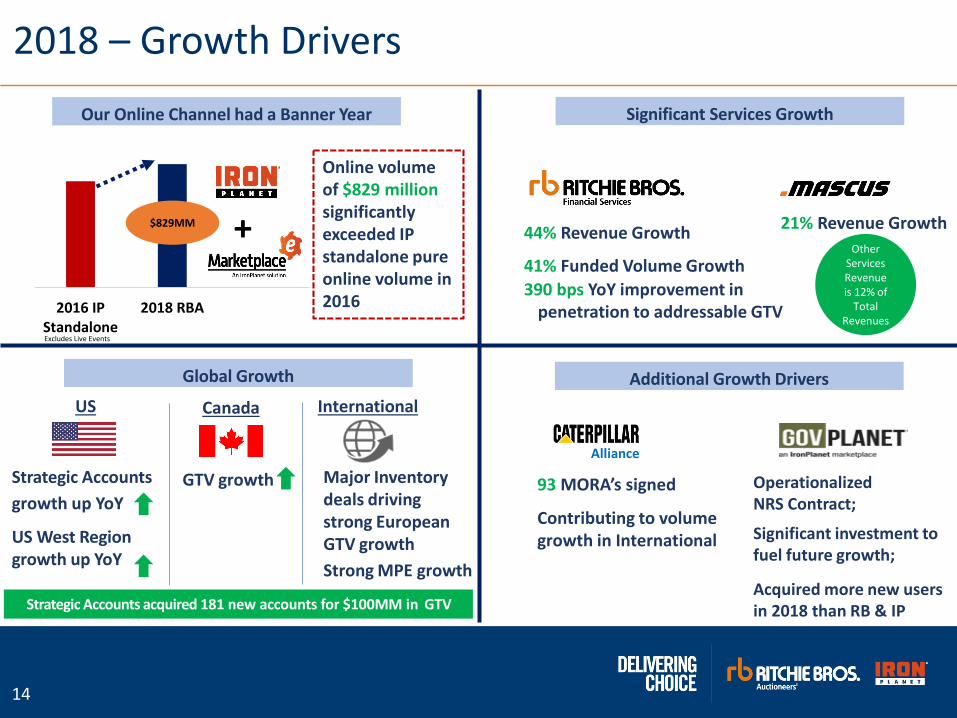
2018 – Growth Drivers
Strategic Accountsgrowth up YoY
US West Region growth up YoY
GTV growth
44% Revenue Growth
41% Funded Volume Growth390 bps YoY improvement in
penetration to addressable GTV
21% Revenue Growth
Our Online Channel had a Banner Year
2016 IPStandalone
2018 RBA
Online volume of $829 million significantly exceeded IP standalone pure online volume in 2016
$829MM
93 MORA’s signed
Contributing to volume growth in International
Significant Services Growth
Additional Growth Drivers
Operationalized NRS Contract;
Significant investment to fuel future growth;
Acquired more new users in 2018 than RB & IP
Global Growth
International
Excludes Live Events
Alliance
Strategic Accounts acquired 181 new accounts for $100MM in GTV
US Canada
Major Inventory deals driving strong European GTV growthStrong MPE growth
+Other
Services Revenue is 12% of
Total Revenues

15
Grow Auction Business Penetrate Upstream
2018 – Solid Progress Against our Strategic Objectives
• Live auction GTV growth with >65% auctions delivering comp growth
• Sales productivity positively inflecting in 2018
• Canadian Agriculture business improving
• Launched Marketplace-E – scaling well with International markets adopting quickly and early momentum in Canada
• Leveraging Marketplace-E to facilitate events in markets where RBA does not have physical presence e.g. Brazil.
• Launched Ritchie Bros. Asset Solutions in 4Q2018; the full service asset disposition solution for OEM’s, OEM Dealers and other large enterprises
In addition to our growth drivers….we made very good strides on our strategic objectives
88%
12%2017*
Live Onsite Online Marketplaces
83%
17%2018*
Live Onsite Online Marketplaces
GTV Mix – Live vs Online
• Supply Remained Tight but Demand Increased • Unique Listing Sellers -2% • Bids +16% / Bids Per Item+15%
* Reported GTV

16
Improve Customer Experience & Operational Efficiencies
2018 – Solid Progress Against our Strategic Objectives
• Integrated listings launched across RB and IP
• Digital & Sales Ops. managed more assets through IP Admin System than ever before
• Inspections in H2 higher than any prior year in IP history
• Built data lake connecting RB and IP customer data
• Moved Mascus + IP back office functions to Oracle
In addition to our growth drivers….we made very good strides our strategic objectives
• MARS Platform delivery is well underway; modules successfully tested in several auctions in 2018
• Re-Launched RitchieSpecs.com Added 4,000 specs
• Investments to promote mobile investments are driving incremental adoption – FY18 73% YoY increase in GTV purchased through the mobile app.

17
2018 Evergreen Model Metrics Review
1 - Constant Currency basis; 2 - Comparable basis; 3 – Adjusted basis
Description Target 2015/2016Combined 2017 2018
Agency Proceeds Growth Rate
High single digit to low teens
8.5%, 13.5%1 7.8% 19.4%[10.5% LFL]
EPS Growth Rate Low double digits to mid teens
16%2 -30%3 33%3
Agency Proceeds Capex Rate
<8.5% 4.1% 5.6% 4.4%
OFCF as a % of Net Income
>100% 135%2 129.1%3 95.1%3
ROIC 15% by 2021 15.3% 6.2% 7.6%
Dividend Payout Ratio 55% - 60% 55%3 83%3 64%3
Net Debt to EBITDA <2.5x 0.55X3 2.9X3 1.9X3
Agency Proceeds Adjusted EBITDA Rate
40% by 2019-run rate basis
39.2%3 31.4%3 35.3%3
Evergreen Model(Average annual expectation over a 5 to 7 year period)
18
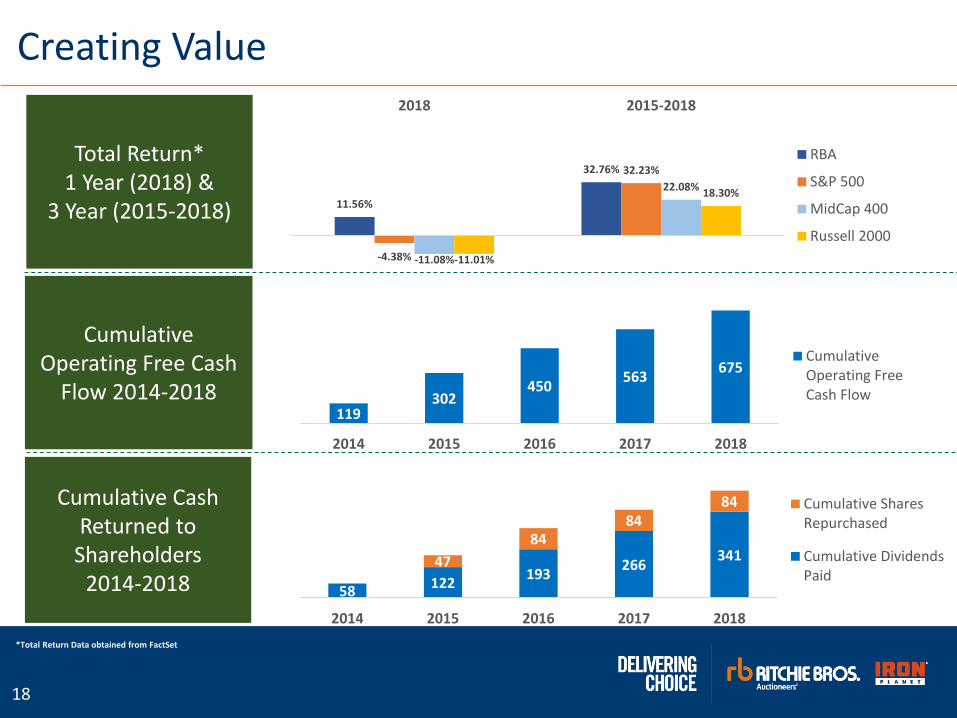
Creating Value
11.56%
32.76%
-4.38%
32.23%
-11.08%
22.08%
-11.01%
18.30%
2018 2015-2018
RBA
S&P 500
MidCap 400
Russell 2000
Total Return*1 Year (2018) &
3 Year (2015-2018)
Cumulative Operating Free Cash
Flow 2014-2018
Cumulative Cash Returned to
Shareholders 2014-2018 58 122 193 266 34147
8484
84
2014 2015 2016 2017 2018
Cumulative SharesRepurchased
Cumulative DividendsPaid
119302
450 563 675
2014 2015 2016 2017 2018
CumulativeOperating FreeCash Flow
*Total Return Data obtained from FactSet

19
Early look into 2019 Auction Highlights
Tipton, CAUS$23 million
5% growth
Largest Tipton, CA auction ever
Houston, TXUS$46 million
12% growth
Setting multiple site records
Total Gross Transactional Value $297 Million
7% growth
A new Company Record• Amount sold to online bidders – US$146+
million *new company record
• Total registered bidders (in person and online) – 15,900+ *new site record
• Registered online bidders – 11,300+ *new site record
• Total lots sold – 13,350+ *new company record
• Number of sellers – 1,150+ *new site record
Edmonton, ABCAD$69 million
15% growth
Focus on Safety: Proud to drive record results with no safety incidents

20
2019 Trends & Insights – Q1/1H Considerations
• Pricing momentum gradually moderating in Construction but strong in Transportation
• Monitoring pressure on rates and will pivot accordingly using deep data expertise; underwritten; mix
• Age of Equipment
• Macro uncertainties. Brexit, Trade Issues, Tariffs etc.…
• Fewer selling days in 1Q19 vs 1Q18
• End user projects/contracts healthy but not as robust as 2018• Supply constraints appear to be easing and 2019 is expected to be better than 2018 • Early GTV momentum in 2019 with Orlando, Houston and Tipton auctions• Will look to capitalize on high activity sectors where projects wind down to
completion • Stalemate/uncertainty on major infrastructure projects and pending elections in
Canada could release additional inventory • Pricing continues to be strong in Transportation
TAILWINDS
HEADWINDS
OTHER CONSIDERATIONS
• Q1 2018 Grande Prairie auction not re-occurring in 2019 totaling approximately $37 million in GTV
• Higher Effective Tax Rate in 2019

21
2019 Executional Priorities
Multi-channel New Customer Acquisition
Scale Marketplace-E
Grow our Government business profitably
Key Set of Reference Accounts for RB Asset Solutions
Efficient operations and improved customer service
1
2
4
5
3
Keep SG&A growth significantly lower than Agency Proceeds growth to drive incremental flow-through

22
Q&AMembers of the RBA Management Team

23
Appendix
24
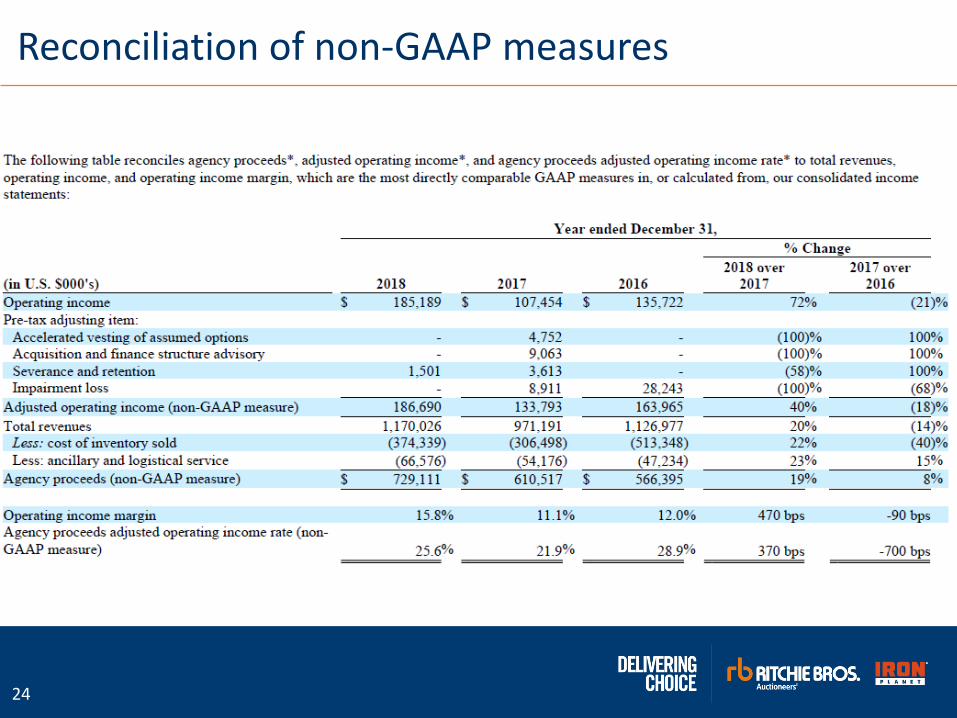
Reconciliation of non-GAAP measures

25
Reconciliation of non-GAAP measures

26
Reconciliation of non-GAAP measures

27
Reconciliation of non-GAAP measures

28
Reconciliation of non-GAAP measures

29
Reconciliation of non-GAAP measures

30
Reconciliation of non-GAAP measures

31
Reconciliation of non-GAAP measures

32
Topic 606 – Supplementary Schedule2018 2017 2016
GTV 4,964 4,468 4,335
Straight commissions % total GTV 84% 84% 75%Guarantee contracts % total GTV 9% 8% 12%Inventory contracts % total GTV 8% 8% 13%
Agency Proceeds 729 611 566
Service Revenues 750 624 556 Inventory Revenues 421 347 571 Total Revenues 1,170 971 1,127
Services Revenues % Total Revenues 64% 64% 49%Inventory Revenues % Total Revenues 36% 36% 51%

33
Ritchie Bros. Equipment Segment Mix: 2018 GTV
Notes: Equipment segments assigned by primary use of equipment make models. Oil and Gas, for example, has a significant component of equipment primarily classified in Construction not in the Oil and Gas segment.
Construction57%
Transportation17%
Agriculture, 9%
Oil & Gas, 2%
GovPlanet, 1%
Other, 13%
Equipment Segment Mix: 2018 GTV (USD)