February 2009 Investor Presentation...
33
Investor Presentation Investor Presentation February 2009
-
Upload
truongkhuong -
Category
Documents
-
view
219 -
download
0
Transcript of February 2009 Investor Presentation...
LONGHORN2008\Presentations\Non Deal Roadshow\Non Deal Roadshow Presentation\2008 Investor Presentation v34.ppt
Investor Presentation
Investor Presentation
February 2009

1
Forward Looking Statements
This presentation contains “forward-looking statements” within the meaning of the federal securities laws. These statements reflectmanagement’s current views with respect to future events and are subject to risk and uncertainties. We note that a variety of factors and uncertainties could cause our actual results to differ significantly from the results discussed in the forward-looking statements. Factors and uncertainties that might cause such differences include, but are not limited to: general economic, market, or business conditions; the availability of loans and fluctuations in the credit markets; the opportunities (or lack thereof) that may be presented to us and that we may pursue; fluctuations in costs and expenses including development costs; demand for new housing, including impacts from mortgage credit availability; lengthy and uncertain entitlement processes; cyclicality of our businesses; accuracy of accounting assumptions; competitive actions by other companies; changes in laws or regulations; changes in federal energy policies; demand for oil and gas; and other factors, many of which are beyond our control. Except as required by law, we expressly disclaim any obligation to publicly revise any forward-looking statements contained in this presentation to reflect theoccurrence of events after the date of this presentation.
2
Table of Contents
I. Near Term Strategic Initiatives
II. Company Overview
III. Real Estate
IV. Natural Resources
V. Financial Highlights
3
I. Near Term Strategic Initiatives

4
1. Generate significant cash flow, principally from sale of approximately 175,000 acres of HBU timberlands
2. Reduce debt $150 million
3. Repurchase up to 20% of outstanding common shares
4. Reduce investment in development
5. Lower operating costs
6. Improve minerals transparency and disclosure
Near term strategic initiatives are focused on enhancing near-term shareholder value and positioning Forestar to create long-term value
Note: Debt reduction and share repurchases will be funded by proceeds from asset sales
Near Term Strategic Initiatives

5
Value Creation – A Timing Issue
1 2 3 4 5 6 7 8 9 10 11 12 13 14 15 16 17 18 19 20
Ret
urn
Years to Value Realization
115K 115K -- 140K Acres140K Acres
160K 160K -- 185K Acres185K Acres
Entitle and Develop
HBU TimberlandHBU Timberland
ReturnReturn
Cost of Capital

6
Forestar Land Stratification

7
HBU Timberland Sale Initiatives
Actual2007
175,000Total HBU Timberland Sales
30,000 – 50,000Retail – Small Tract
40,000 – 50,000Special Use / Conservation
75,000 - 125,000Institutional
AcresMarket Segment
HBU timberland sales are ready for market and structured to maximize interest across buyer segments
8
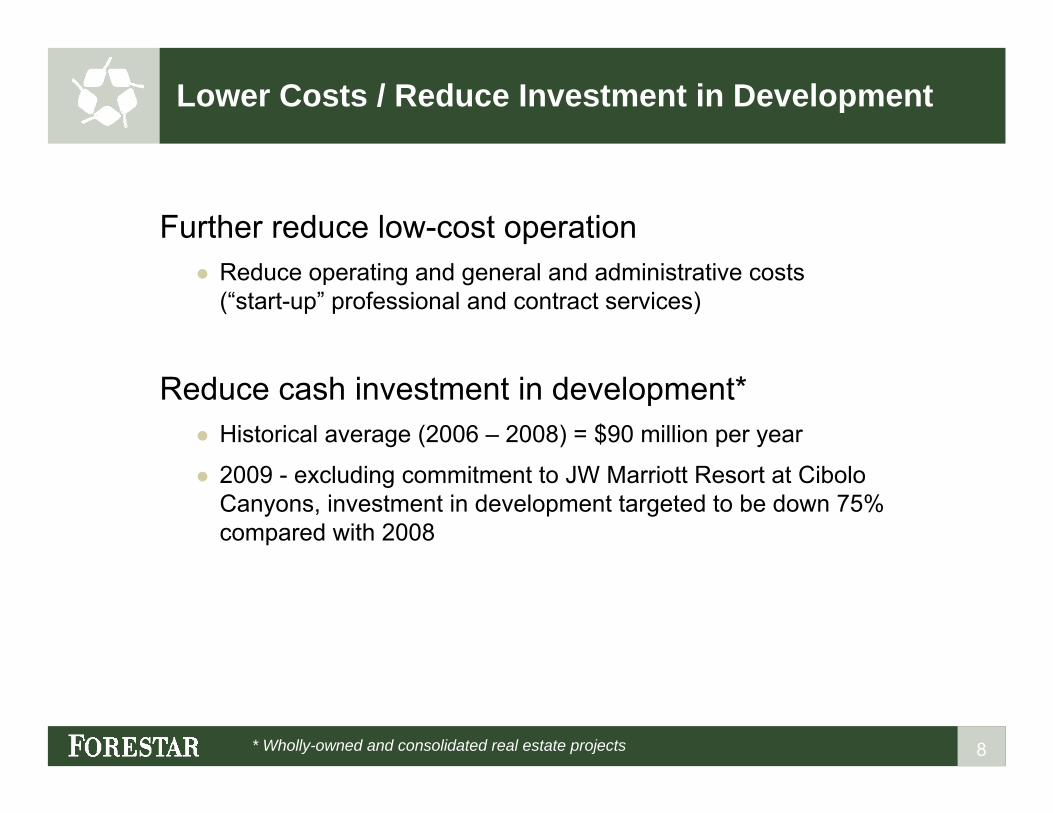
Lower Costs / Reduce Investment in Development
Further reduce low-cost operation● Reduce operating and general and administrative costs
(“start-up” professional and contract services)
Reduce cash investment in development*● Historical average (2006 – 2008) = $90 million per year
● 2009 - excluding commitment to JW Marriott Resort at Cibolo Canyons, investment in development targeted to be down 75% compared with 2008
* Wholly-owned and consolidated real estate projects

9
Improve Minerals Transparency
Future Bonus
Reserve Additions
Proven Reserves
Present Value DisclosureAcresValue Chain
476,000
121,000
25,000
Leasing ActivityAcres by Play
Available for Lease
Drilling ActivityAcres by PlayLeased
Net ProvenGas – MMCFOil – Barrels
Held by Production
+
+
= Net Asset Value
Min
eral
s Va
lue
Cre
atio
n
Improved minerals transparency anticipated to be provided with 2nd Qtr 2009 financial disclosures

10
Strategy
● Generate significant cash flow, principally from sale of approximately 175,000 acres of HBU timberlands
● Reduce debt $150 million● Repurchase up to 20% of outstanding common shares
● Move acres up the value chain by moving land located in growth corridors but not yet entitled, through the entitlement process, and into development
● Improve minerals transparency and disclosure
● Increase mineral acreage leased, lease rates, royalty interests and additional participation in production revenues
● Reduce investment in development
● Reinvest primarily in ten identified strategic growth corridors
Real Estate
Disciplined Investment
Natural Resources
The combination of our strategy, management expertise, stewardship and disciplined reinvestment in our business uniquely positions Forestar to maximize long-term value for shareholders
Near-Term
Long-Term
Near-Term
Long-Term
Near-Term
Long-Term
11
II. Company Overview
Forestar is focused on creating significant value for shareholders, customers, partners and employees by generating the greatest benefit from each and every acre of our land
12
Key Investment Highlights
Diversified and Unique Real Estate Portfolio● Portfolio located in some of the healthiest markets
Low Basis, Valuable Portfolio of Assets
Consistent Cash Flow from Natural Resources, Primarily Minerals
Disciplined Investment Criteria
Strategy Driven, Proven Management Team with Focus on Value Creation● Significant experience in real estate and natural resources
Attractive Historical Returns
13
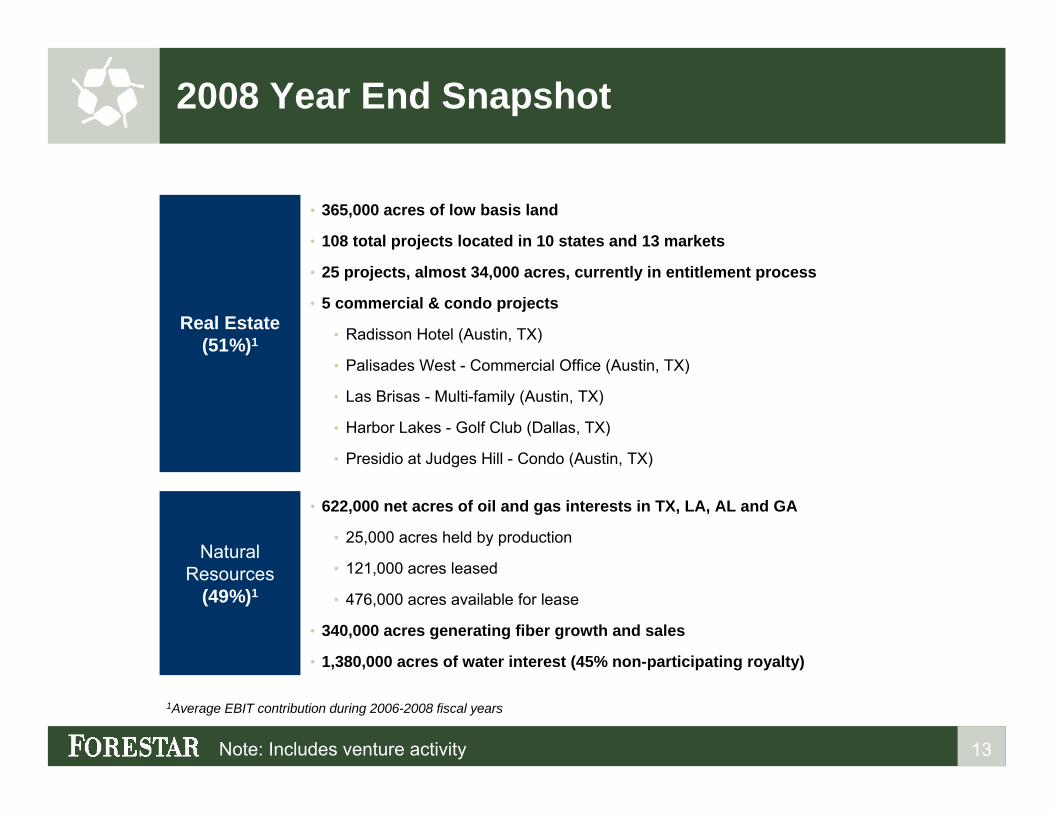
2008 Year End Snapshot
• 622,000 net acres of oil and gas interests in TX, LA, AL and GA
• 25,000 acres held by production
• 121,000 acres leased
• 476,000 acres available for lease
• 340,000 acres generating fiber growth and sales
• 1,380,000 acres of water interest (45% non-participating royalty)
Natural Resources
(49%)1
• 365,000 acres of low basis land
• 108 total projects located in 10 states and 13 markets
• 25 projects, almost 34,000 acres, currently in entitlement process
• 5 commercial & condo projects
• Radisson Hotel (Austin, TX)
• Palisades West - Commercial Office (Austin, TX)
• Las Brisas - Multi-family (Austin, TX)
• Harbor Lakes - Golf Club (Dallas, TX)
• Presidio at Judges Hill - Condo (Austin, TX)
Real Estate(51%)1
1Average EBIT contribution during 2006-2008 fiscal years
Note: Includes venture activity

14
Cibolo Canyons – San Antonio, Texas
●Forestar contributes 700 acres + $38 million●Economic development agreement includes
● Receipt of 9% hotel room revenues and 1.5% sales tax from resort through 2034
● Special improvement district reimbursements($49.5 million submitted at YE 2008)
Project Economics
● JW Marriott’s Largest Resort● 1,002 rooms● 140,000 sq. ft. meeting space● 42,000 sq. ft. clubhouse● 26,000 sq. ft. spa
●Two TPC championship golf courses
Resort and Golf Course
● 145 acres – 64 sold*●Multi-family and retail
Commercial
● 1,747 lots – 537 sold*●Multiple builders
● 1st and 2nd move-up, custom● Empty nester / active adult, condo
Residential
*Lot and acre sales as of 4th Qtr 2008
15
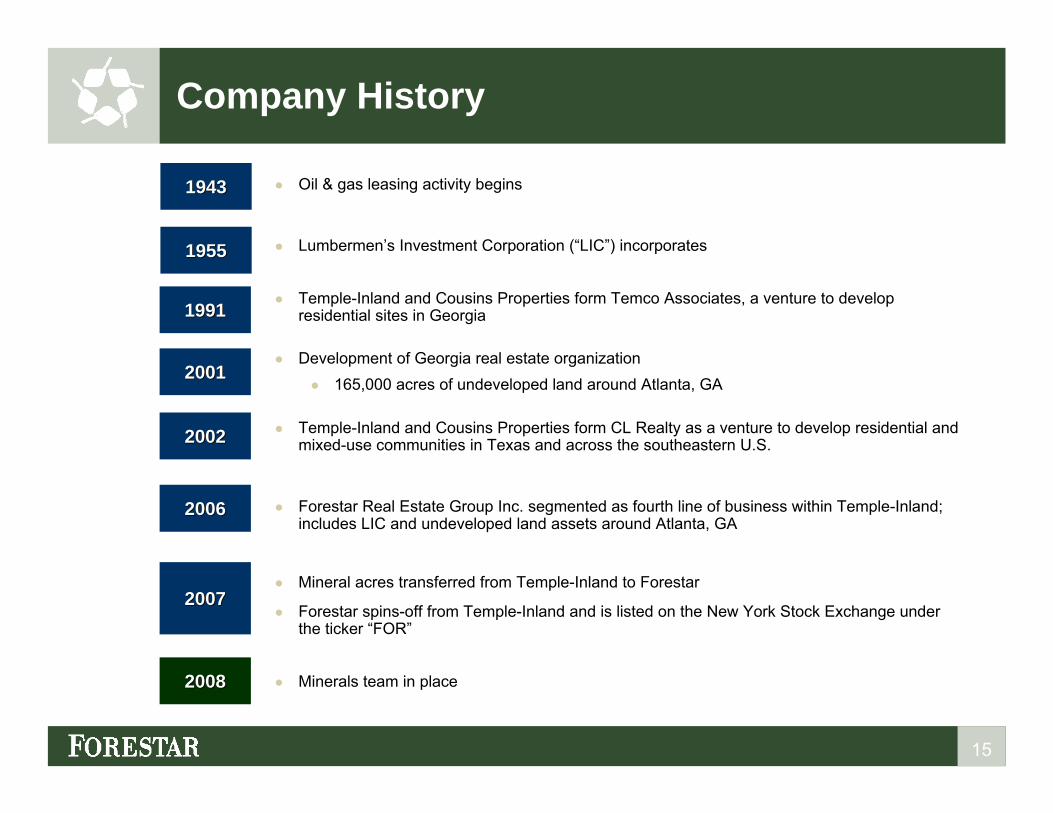
Company History
● Oil & gas leasing activity begins
● Lumbermen’s Investment Corporation (“LIC”) incorporates
● Temple-Inland and Cousins Properties form Temco Associates, a venture to develop residential sites in Georgia
● Development of Georgia real estate organization● 165,000 acres of undeveloped land around Atlanta, GA
● Temple-Inland and Cousins Properties form CL Realty as a venture to develop residential and mixed-use communities in Texas and across the southeastern U.S.
● Forestar Real Estate Group Inc. segmented as fourth line of business within Temple-Inland; includes LIC and undeveloped land assets around Atlanta, GA
● Mineral acres transferred from Temple-Inland to Forestar
● Forestar spins-off from Temple-Inland and is listed on the New York Stock Exchange under the ticker “FOR”
● Minerals team in place
19551955
19911991
20012001
20022002
20062006
20072007
20082008
19431943

16
III. Real Estate Overview
Forestar is committed to maximizing long-term shareholder value through entitlement activity. Securing entitlements creates the largest proportional increase in real estate value and requires minimal capital investment
17
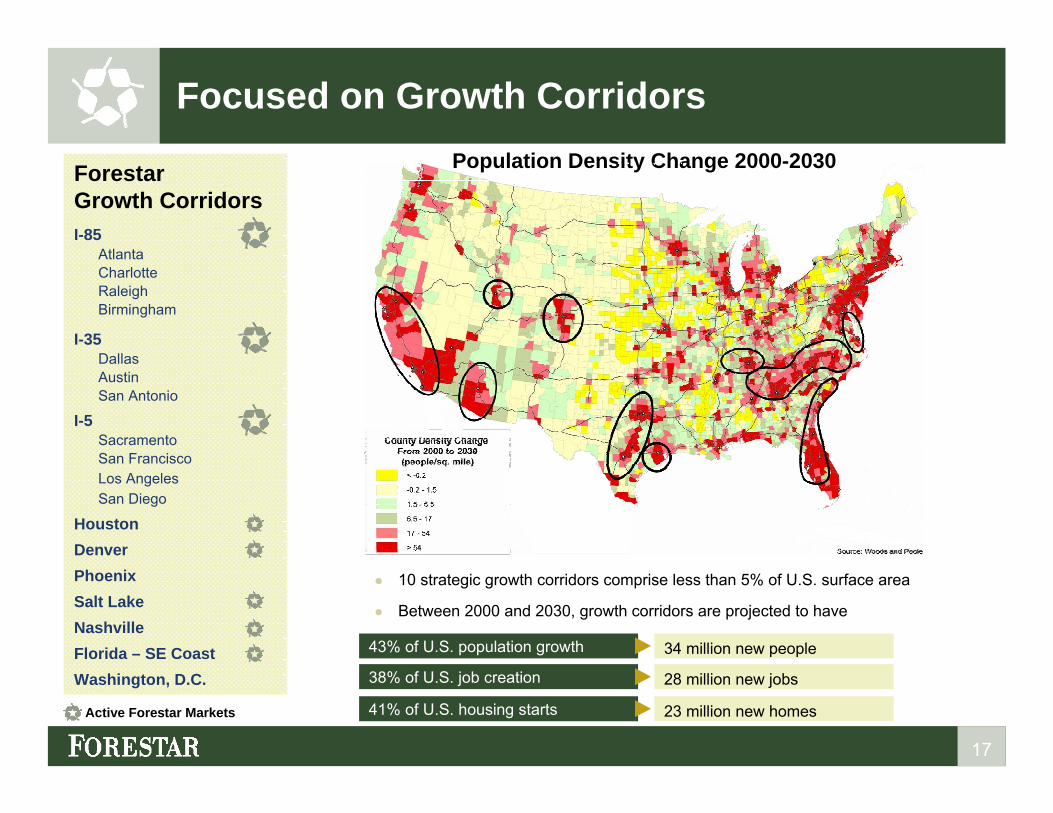
Focused on Growth CorridorsPopulation Density Change 2000-2030Forestar
Growth CorridorsI-85
AtlantaCharlotteRaleighBirmingham
I-35DallasAustinSan Antonio
I-5 SacramentoSan FranciscoLos AngelesSan Diego
HoustonDenverPhoenixSalt LakeNashvilleFlorida – SE CoastWashington, D.C.
Active Forestar Markets
● 10 strategic growth corridors comprise less than 5% of U.S. surface area
● Between 2000 and 2030, growth corridors are projected to have
38% of U.S. job creation 28 million new jobs
41% of U.S. housing starts 23 million new homes
43% of U.S. population growth 34 million new people
18
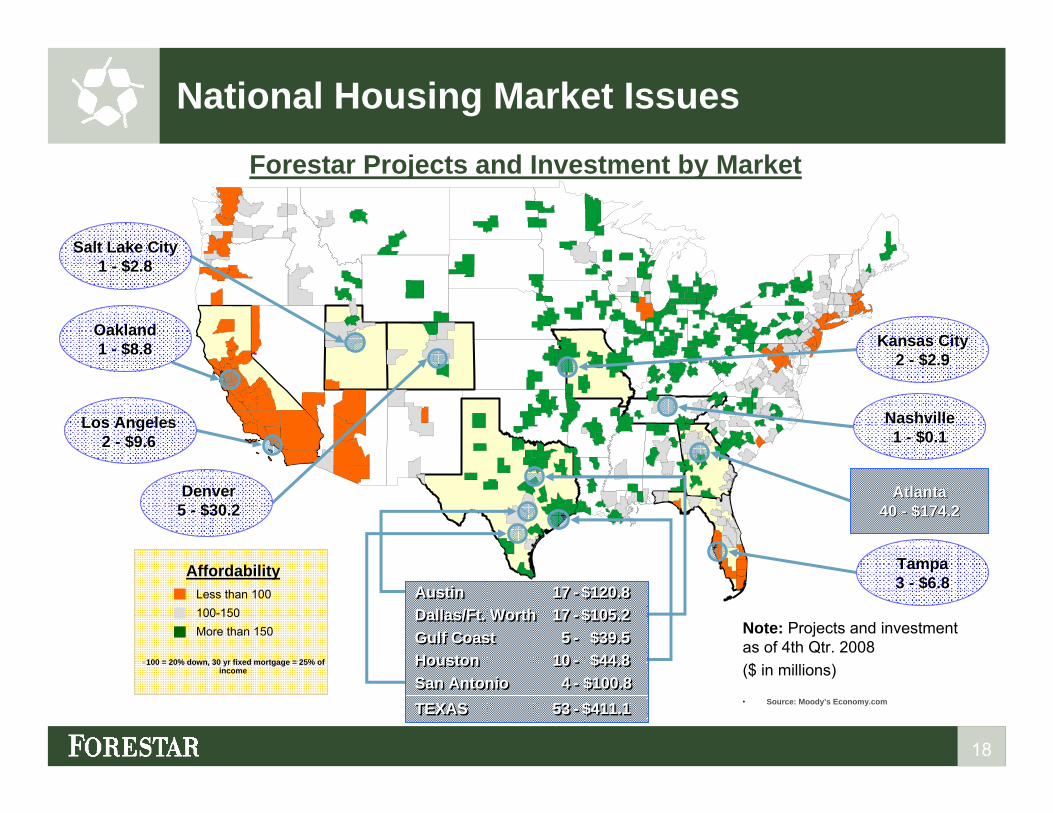
National Housing Market Issues
• Source: Moody’s Economy.com
AtlantaAtlanta40 40 -- $174.2$174.2
Note: Projects and investment as of 4th Qtr. 2008 ($ in millions)
Forestar Projects and Investment by Market
●100 = 20% down, 30 yr fixed mortgage = 25% of income
Less than 100100-150More than 150
Affordability
Salt Lake City1 - $2.8
Salt Lake City1 - $2.8
Oakland1 - $8.8
Oakland1 - $8.8
Denver5 - $30.2Denver
5 - $30.2
Los Angeles2 - $9.6
Los Angeles2 - $9.6
Kansas City2 - $2.9
Kansas City2 - $2.9
Tampa3 - $6.8Tampa3 - $6.8
TEXAS 53 - $411.1TEXAS 53 - $411.1
Austin 17 - $120.8Austin 17 - $120.8Dallas/Ft. Worth 17 - $105.2Dallas/Ft. Worth 17 - $105.2Gulf Coast 5 - $39.5Gulf Coast 5 - $39.5Houston 10 - $44.8Houston 10 - $44.8San Antonio 4 - $100.8San Antonio 4 - $100.8
Nashville1 - $0.1
Nashville1 - $0.1
19
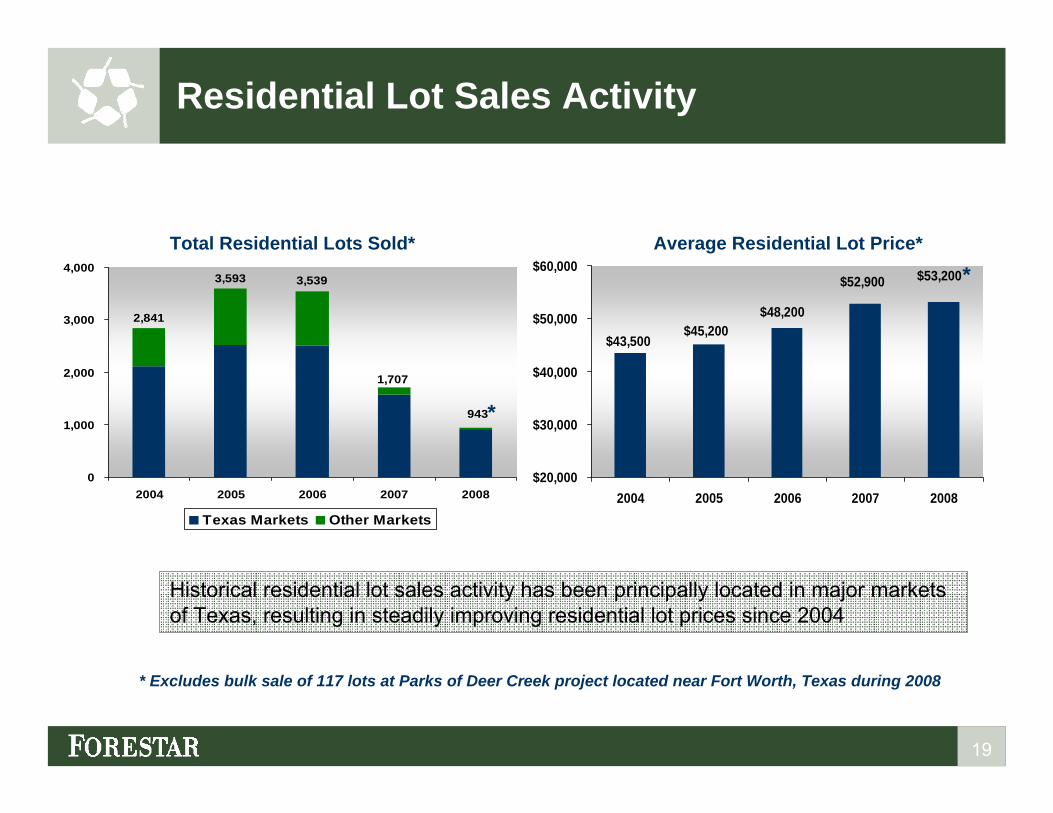
Residential Lot Sales Activity
Historical residential lot sales activity has been principally located in major markets of Texas, resulting in steadily improving residential lot prices since 2004
* Excludes bulk sale of 117 lots at Parks of Deer Creek project located near Fort Worth, Texas during 2008
$53,200
$45,200$43,500
$48,200
$52,900
$20,000
$30,000
$40,000
$50,000
$60,000
2004 2005 2006 2007 2008
3,539 3,593
2,841
943
1,707
0
1,000
2,000
3,000
4,000
2004 2005 2006 2007 2008
Texas Markets Other Markets
Total Residential Lots Sold* Average Residential Lot Price*
*
*
20
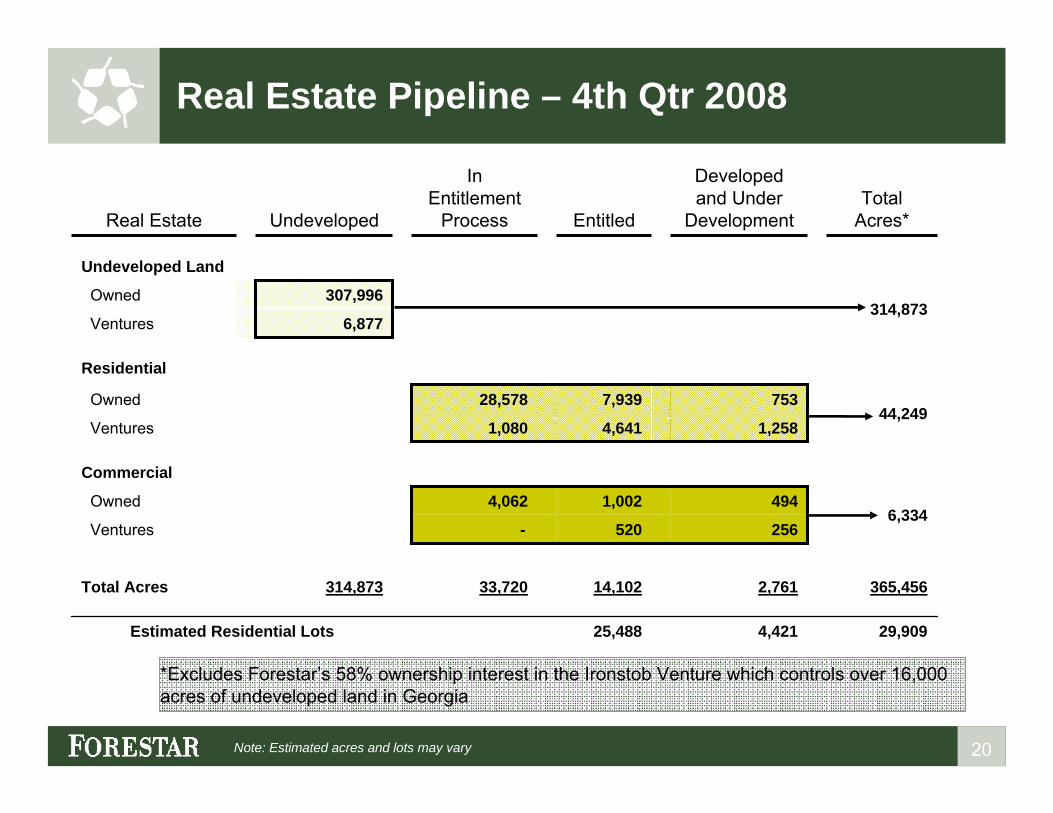
Real Estate Pipeline – 4th Qtr 2008
29,9094,42125,488Estimated Residential Lots
365,4562,76114,10233,720314,873Total Acres
256520-Ventures6,334
4941,0024,062Owned
Commercial
1,2584,6411,080Ventures44,249
7537,93928,578Owned
Residential
6,877Ventures314,873
307,996Owned
Undeveloped Land
Total Acres*
Developed and Under
DevelopmentEntitled
In Entitlement
ProcessUndevelopedReal Estate
Note: Estimated acres and lots may vary
*Excludes Forestar’s 58% ownership interest in the Ironstob Venture which controls over 16,000 acres of undeveloped land in Georgia

21
Atlanta – Forestar’s Largest Market
Atlanta, GA
● 9th largest metropolitan statistical area in the U.S.
● Population of 5.0 million, will double by 2025
● A leader innew building permit activity
● Home to 12 Fortune 500 companies
● World’s busiest airport
Assets and Performance
● 300,000 acres of low basis land
● In Entitlement
- 19 projects
- 28,060 acres
● Projects Entitled
- 17 projects
- 6,420 acres
• 5,510 residential lots
• 740 commercial acres
Atlanta, GA Entitlement Activity

22
Investment Discipline
● Acquisition and development activity driven by return on cost discipline● Target 35% Return On Cost (ROC), including proforma interest carry● Historical returns1
● Residential projects: 20%+ IRR, 35%+ ROC
● Commercial projects: 30%+ IRR, 40%+ ROC
● Development example:● 288 acres
● 819 lots
1 Represent historical average returns since 20002 Costs include proforma interest carry
35%Return on Cost$29,800$8.5 millionProfit$84,200$24.4 millionTotal Costs$64,000$18.5 millionDevelopment
$20,200$5.9 millionLand Investment
Costs2
$114,000$32.9 millionLot Sales
RevenuesPer AcreTotal Illustrative Project Cash Flow
Time
Cum
ulat
ive
Cas
h Fl
ow
Cumulative Interest Carry
Cumulative Positive Cash Flow
Cumulative Negative Cash Flow
23
IV. Natural Resources
Value creation opportunity and recurring cash flow

24
Minerals – A Strategic FocusVa
lue
Royalty Interest
Leased
Available for Lease
25,000
121,000
476,000
● 18–27% of production revenues
● Additional participation in production revenues
● $100-$400 / acre upfront payment; up to 3 year lease
● Focus on increasing leasing activity
● Business development focus
● Development of minerals website
● Participation in industry conferences
● TX and LA mineral acres located in prolific production regions
● Exploration activity driven by location, technology and oil & gas pricing
Note: Net acres and wells as of 4th Qtr. 2008
Value ChainNet
Acres Strategic Initiatives
New minerals team has extensive experience and a proven track record of creating value through mineral leasing, royalties and additional participation in production

25
Western Minerals – Prolific Production Region
Texas and LouisianaTotal net acres: 365,000Available for lease: 228,000Leased: 112,000Held by production: 25,000
15% of the continental U.S. gas production
10 active oil and gas plays
Note: Net acres as of 4th Qtr. 2008
26
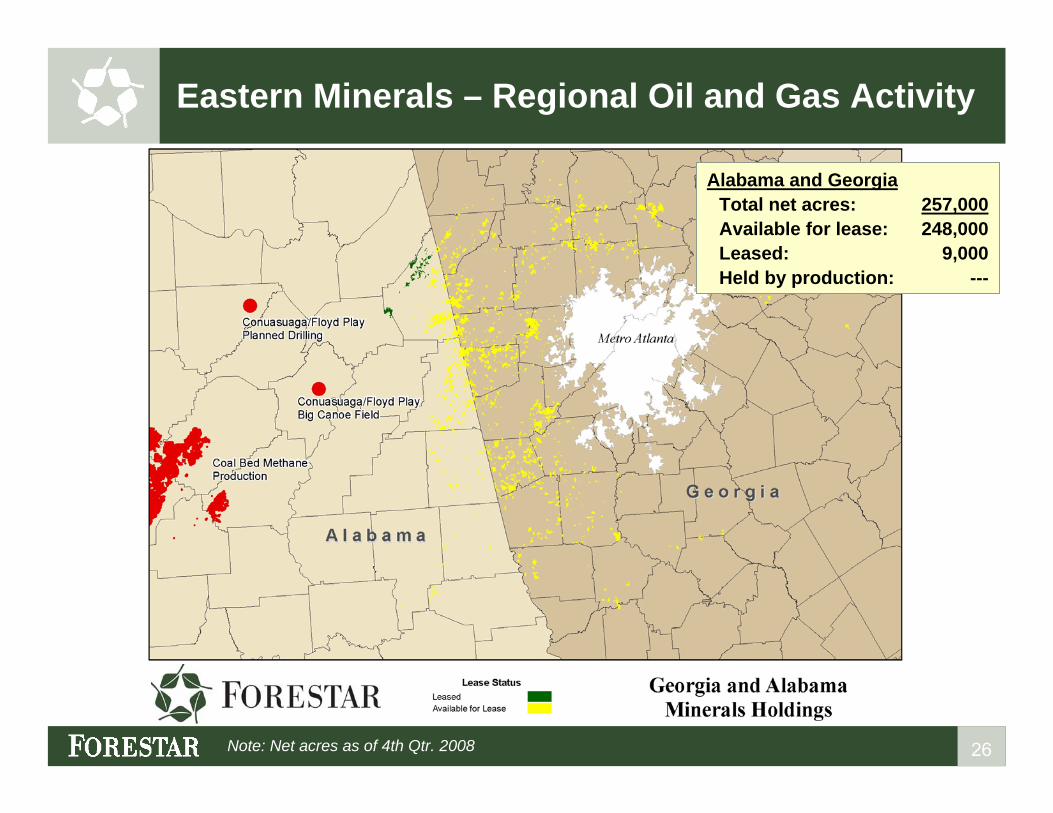
Eastern Minerals – Regional Oil and Gas Activity
Alabama and GeorgiaTotal net acres: 257,000Available for lease: 248,000Leased: 9,000Held by production: ---
Note: Net acres as of 4th Qtr. 2008
27
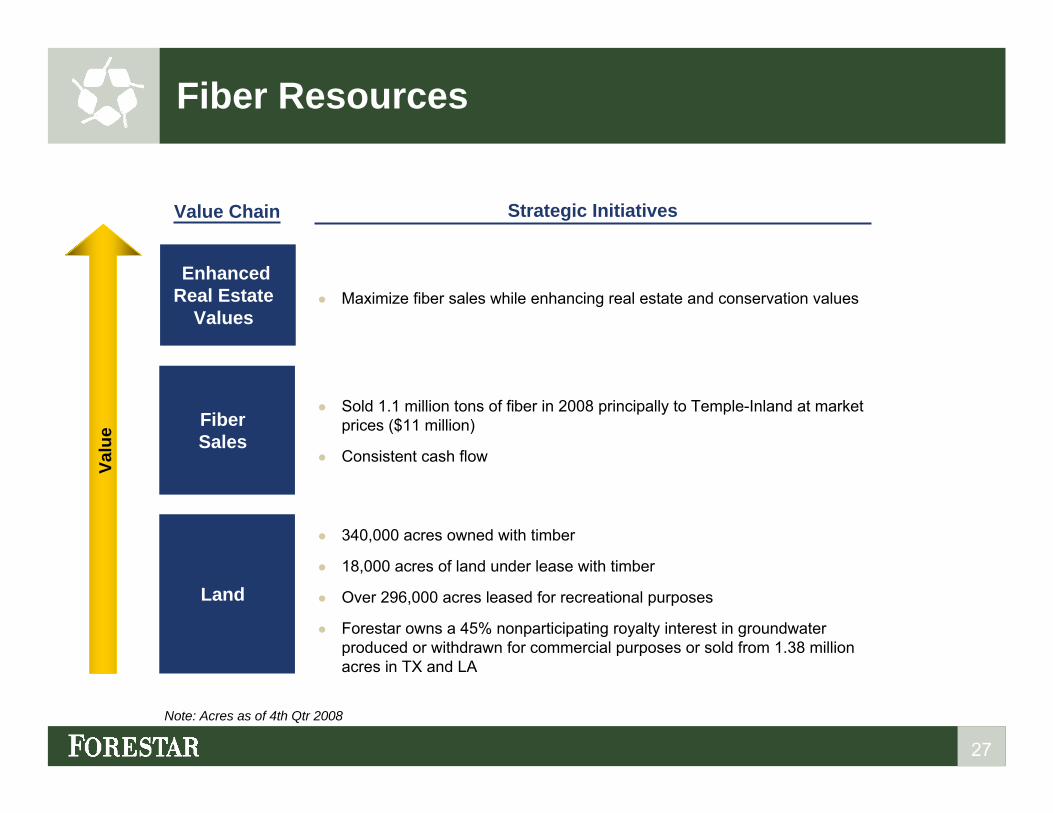
Fiber ResourcesVa
lue
Enhanced Real Estate
Values
FiberSales
Land
● Maximize fiber sales while enhancing real estate and conservation values
● Sold 1.1 million tons of fiber in 2008 principally to Temple-Inland at market prices ($11 million)
● Consistent cash flow
● 340,000 acres owned with timber
● 18,000 acres of land under lease with timber
● Over 296,000 acres leased for recreational purposes
● Forestar owns a 45% nonparticipating royalty interest in groundwater produced or withdrawn for commercial purposes or sold from 1.38 million acres in TX and LA
Note: Acres as of 4th Qtr 2008
Value Chain Strategic Initiatives

28
V. Financial Highlights
29
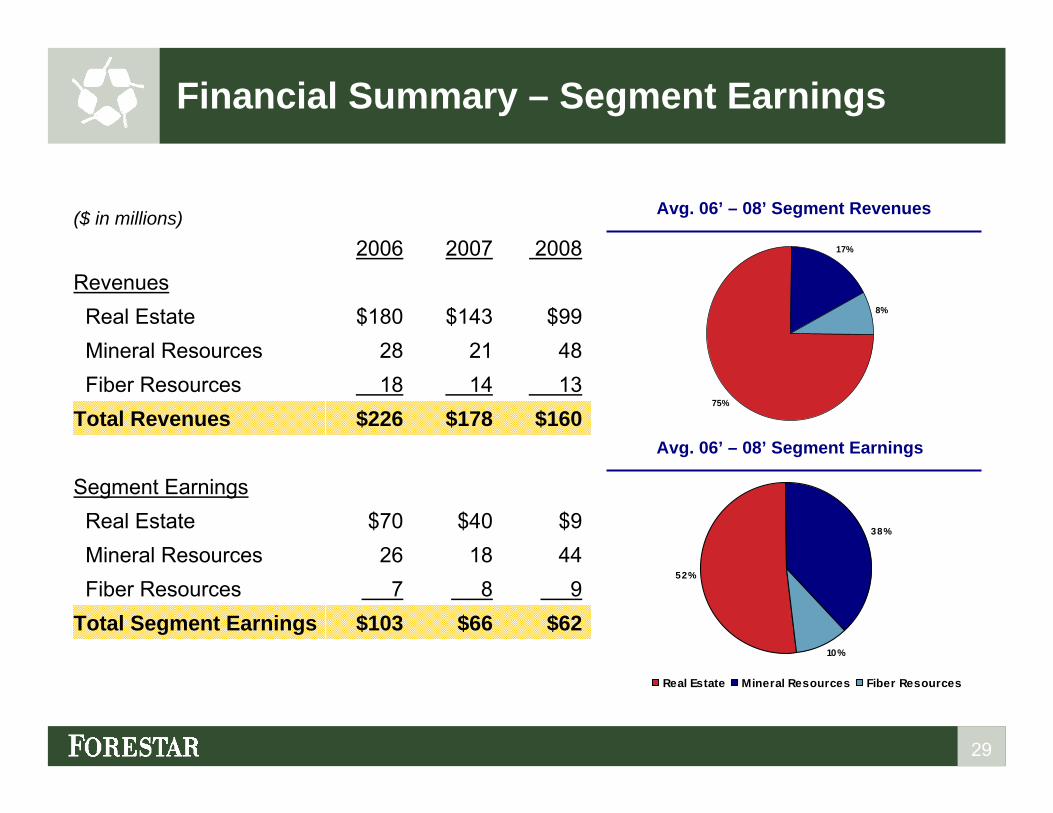
Financial Summary – Segment Earnings
$668
18$40
$1781421
$143
2007
$629
44$9
$1601348
$99
2008
Segment Earnings
26Mineral Resources$70Real Estate
$103Total Segment Earnings7Fiber Resources
$226Total Revenues18Fiber Resources28Mineral Resources
$180Real EstateRevenues
2006($ in millions) Avg. 06’ – 08’ Segment Revenues
Avg. 06’ – 08’ Segment Earnings
75%
17%
8%
52%
10%
38%
Real Estate Mineral Resources Fiber Resources

30
Financials - Debt Capacity
Senior credit facility includes $175mm term loan and $290mm revolving line of credit
● Includes $100mm sublimit available for letters of credit and $25mm swing line sublimit
● Matures December 2010
$102Other consolidated venture non-recourse debt*
$182 Unused Borrowing Capacity
(48)Letter’s of Credit and liquidity requirement
(235)Borrowings Under Senior Credit Facility
$465Senior Credit Facility
Q4 2008($ in millions)
* Consolidated venture debt is principally non-recourse to Forestar

31
Near Term Initiatives
Generate significant cash flow, principally from saleof approximately 175,000 acres of HBU timberland
(-) Reduce debt $150 million
(-) Repurchase up to 20% of outstanding common shares
(-) Reduce investment in development
(-) Lower operating expenses
+ Improve Minerals Transparency
= Enhance Shareholder Value

32