February 2008 Zoning Amendments in North...
32
Special Series No. 24 February 2008 Zoning Amendments in North Carolina David W. Owens
Transcript of February 2008 Zoning Amendments in North...
CB 3330 Knapp-Sanders BuildingChapel Hill, NC 27599(919) 966-5381www.sog.unc.edu
School of Government
Institute of Government
Master of Public Administration Program
Special Series No. 24
February 2008
Zoning Amendments in North Carolina
David W. Owens

Special Series No. 24
February 2008
Zoning Amendments in North Carolina
David W. Owens

The School of Government at the University of North Carolina at Chapel Hill works to improve the lives of North Carolinians by engaging in practical scholarship that helps public officials and citizens understand and strengthen state and local government. Established in 1931 as the Institute of Government, the School provides educational, advisory, and research services for state and local governments. The School of Government is also home to a nationally ranked graduate program in public administration and specialized centers focused on information technology, environmental finance, and civic education for youth.
As the largest university-based local government training, advisory, and research organization in the United States, the School of Government offers up to 200 classes, seminars, schools, and specialized conferences for more than 12,000 public officials each year. In addition, faculty members annually publish approximately fifty books, periodicals, and other reference works related to state and local government. Each day that the General Assembly is in session, the School produces the Daily Bulletin, which reports on the day’s activities for members of the legislature and others who need to follow the course of legislation.
The Master of Public Administration Program is a full-time, two-year program that serves up to sixty students annually. It consistently ranks among the best public administration graduate programs in the country, particularly in city management. With courses ranging from public policy analysis to ethics and management, the program educates leaders for local, state, and federal governments and nonprofit organizations.
Operating support for the School of Government’s programs and activities comes from many sources, including state appropria-tions, local government membership dues, private contributions, publication sales, course fees, and service contracts. Visit www.sog.unc.edu or call 919.966.5381 for more information on the School’s courses, publications, programs, and services.
Michael R. Smith, DeanThomas H. Thornburg, Senior Associate DeanFrayda S. Bluestein, Associate Dean for ProgramsTodd A. Nicolet, Associate Dean for Information TechnologyAnn Cary Simpson, Associate Dean for Development and CommunicationsBradley G. Volk, Associate Dean for Administration
FACULTYGregory S. AllisonStephen Allred (on leave)David N. AmmonsAnn M. AndersonA. Fleming Bell, IIMaureen M. BernerMark F. BottsJoan G. BrannonMolly C. BroadMichael CrowellShea Riggsbee DenningJames C. DrennanRichard D. DuckerRobert L. FarbJoseph S. FerrellMilton S. Heath Jr.Norma Houston (on leave)
Cheryl Daniels HowellJoseph E. HuntWillow S. JacobsonRobert P. JoyceKenneth L. JoynerDiane M. JuffrasDavid M. LawrenceDona G. LewandowskiJames M. MarkhamJanet MasonLaurie L. MesibovKara A. MillonziJill D. MooreJonathan Q. MorganRicardo S. MorseTyler MulliganDavid W. Owens
William C. RivenbarkDale J. RoenigkJohn RubinJohn L. SaxonShannon H. SchelinJessica SmithKarl W. SmithCarl W. Stenberg IIIJohn B. StephensCharles SzypszakVaughn UpshawA. John VogtAimee N. WallJeff WeltyRichard B. WhisnantGordon P. WhitakerEileen Youens
© 2008School of GovernmentThe University of North Carolina at Chapel Hill
Use of this publication for commercial purposes or without acknowledgment of its source is prohibited. Reproducing, distributing, or otherwise making available to a non-purchaser the entire publication, or a substantial portion of it, without express permission, is prohibited.
Printed in the United States of America
This publication is printed on permanent, acid-free paper in compliance with the North Carolina General Statutes.Printed on recycled paper
12 11 10 09 08 1 2 3 4 5
ISBN 978-1-56011-582-3

ContentsOverview of Zoning Amendments 1
Survey 2
Number and Types of Amendments Considered 4Text Amendments 4Map Amendments/Rezonings 4
Administration and Process 6Fees 6Information Provided to Petitioners 7
Decision-Making Process 7Hearings 7Presentation of Information 8Length of Hearings 9Additional Hearings 10Protest Petitions 10
Decisions Made and Factors Influencing Outcomes 12Outcomes 12Time to Reach Decisions 12Factors Influencing Decisions 13Impact of Recommendations 14Consistency of Decisions with Plans 15Conflicts of Interest 17
Judicial Review 17
Appendix A Applicable Portion of Survey Instrument 19
Appendix B List of Responding Jurisdictions 23


1
Zoning Amendments in North Carolina
Overview of Zoning Amendments
Over five hundred North Carolina cities and counties have adopted zoning ordinances. These ordinances regulate many aspects of land use and development. For example, a zoning ordinance determines whether a particular property can be devoted to residential, commercial, industrial, or other uses. It sets minimum lot sizes and defines the permissible density of development for new projects. It regulates, for example, the amount of required open space on a lot, how close a structure can be located to a property line, or where fences can be placed. Zoning also often deals with development-related issues by regulating matters such as how much parking a business must provide and what kind of signs are allowed. In short, for landowners, neighbors, and the community at large, zoning ordinances play a critical regulatory role in shaping the charac-ter of a community’s development.
There is substantial public interest in how zoning ordi-nances are amended, as this is the process by which the rules for development are created and modified. If a landowner can secure a rezoning from low-density residential to commercial use, the value of the land is likely to increase several fold. If neighbors can limit the amount of development on a nearby vacant parcel, they can inhibit increases in traffic and noise and other harmful effects on the neighborhood. If a town can manage the location of new industrial development, it can significantly affect the cost (and its ability) to provide needed water, sewer, roads, and other public services. Many issues regarding the type and intensity of future land uses are resolved by amendments to the zoning ordinance.
Given the impact zoning ordinances have on landown-ers, neighbors, and the public, it is not surprising that there is a considerable body of law setting standards that cities and counties must follow in the adoption and amendment of these
ordinances.1 This report reviews the law and practice of zoning ordinance amendment in North Carolina. It summarizes the rules set by the legislature and courts for the process that local governments must follow and reports the results of a survey of how this process is applied by the state’s cities and counties.
North Carolina cities and counties consider a relatively high volume of zoning amendments. Our survey respondents reported that over 4,500 petitions for zoning amendments were taken up in the previous year. This is more than the reported number of special and conditional use permits and variances combined that are considered each year. The rezoning of an individual parcel of land is thus the most common land use regulatory decision considered by city councils, county boards of commissioners, planning boards, and boards of adjustment.
Consideration of zoning amendments is for the most part relatively routine. A substantial majority of the jurisdictions, especially those other than large cities, reported that most rezonings are noncontroversial. Nearly half of the jurisdic-tions reported that only occasionally does a person other than the petitioner and staff appear at a rezoning hearing. Only 14 percent of the jurisdictions reported that attorneys appear frequently or more often at these hearings. Only 6 percent of the rezonings considered were the subject of a protest petition (which triggers a three-fourths majority requirement for city council adoption). Court appeals of rezoning decisions are rare—less than 1 percent of these decisions end up in court.
The vast majority of proposed zoning amendments are decided relatively quickly. The typical rezoning hearing lasts between fifteen minutes and an hour. Ninety-two percent of the jurisdictions reported that a typical rezoning petition is decided in less than ninety days.
1. For a more detailed analysis of the legal issues involved with zoning amendments, see David W. Owens, Land Use Law in North Carolina 65–82 (2006).
2 Special Series No. 24 | David W. Owens
Most proposed zoning amendments are approved. The approval rate for text amendments was reported to be 82 percent, with another 9 percent pending. The approval rate for zoning map amendments (rezonings) was reported to be 76 percent, with another 9 percent pending.
The role of plans and the planning process in guiding these decisions is receiving increased attention at both the state and local levels. State legislation effective in 2006 requires explicit, written consideration of adopted plans as part of the process of making decisions on zoning amendments. Most frequently city and county staff members prepare the required analysis of plan conformance, and 98 percent of the jurisdictions reported that rezonings were frequently or more often consistent with their plans. Inconsistency with the jurisdiction’s adopted plans was the second most frequently cited ground for denial of rezoning petitions.
Apparently the zoning amendment process is becoming more complex, particularly in jurisdictions with large popula-tions or fast growth rates. Neighborhood concerns about development drive a good deal of this complexity. By far the most common reason cited for denial of rezoning petitions is inconsistency of the project with the surrounding neighbor-hood. Neighborhood support or opposition was cited by a large majority of jurisdictions as influencing the outcome of rezon-ing votes. More frequently cities and counties are also using conditional zoning to tailor regulations to particular site condi-tions. Over a third of all rezonings in the state are now made to conditional zoning districts. Survey respondents reported this trend is increasing, particularly in larger cities.
Survey
The School of Government periodically surveys North Carolina cities and counties regarding zoning practices. The 2002 survey concerned experiences with zoning variances.2 The 2004 survey addressed types of ordinances adopted,3 experiences with spe-cial use permits,4 and municipal extraterritorial jurisdiction.5
The 2006 survey queried North Carolina local governments about zoning amendments; those responses are summarized here. That survey also asked local governments about the num-ber and type of zoning districts in ordinances, use of design standards, and experiences with traditional neighborhood design projects; these topics are covered in a separate report.6
2. David Owens and Adam Brueggemann, A Survey of Experience with Zoning Variances (Chapel Hill: School of Government Special Series No. 18, Feb. 2004).
3. David W. Owens and Nathan Branscome, An Inventory of Local Government Land Use Ordinances in North Carolina (Chapel Hill: School of Government Special Series No. 21, May 2006).
4. David W. Owens, Special Use Permits in North Carolina Zoning (Chapel Hill: School of Government Special Series No. 22, April 2007).
5. David Owens, The North Carolina Experience with Municipal Extraterritorial Planning Jurisdiction (Chapel Hill: School of Government Special Series No. 20, Jan. 2006).
6. David Owens and Andrew Stevenson, An Overview
The 2006 zoning survey was conducted in two phases. First, in September and October 2006, we began updating our list of North Carolina cities and counties having zoning ordinances. To determine whether additional jurisdictions had adopted zoning since our earlier surveys, an inquiry as to whether zon-ing had been adopted was sent to all cities and counties that had responded to previous surveys saying they did not have zoning as well as to those that had not responded at all to previ-ous surveys. We later sent e-mail inquiries to those jurisdictions that did not respond to the written queries, searched govern-ment websites, and made telephone inquiries to determine whether zoning had been adopted in those jurisdictions.
We were thus able to confirm that 509 of North Carolina’s 643 cities and counties had adopted zoning ordinances as of late 2006. In addition to the 509 jurisdictions reporting adop-tion of zoning, 24 municipalities reported that county zoning was by mutual agreement applied within the municipality. Forty-seven jurisdictions confirmed that they had not adopted or applied zoning ordinances. We had no responses from 63 jurisdictions, primarily municipalities with populations of less than 1,000. These results are set out in Table 1.
We then sent surveys to all jurisdictions confirmed to have adopted zoning seeking information about zoning districts, design standards, and experiences with zoning amendments. The surveys were mailed to each jurisdiction’s planning director if this person could be identified. For jurisdictions without a planning director, the survey was mailed to (in order of prior-ity) the zoning administrator, the manager or administrator, the clerk, or the chief elected official. Each jurisdiction was asked to have the survey completed by the person within the jurisdiction who most directly works with zoning amendments.
This survey was mailed in mid-October 2006 to the 509 jurisdictions in the state known to have zoning ordi-nances—433 incorporated cities and 76 counties. The portion of the survey instrument related to zoning amendments is reproduced in Appendix A. A second copy of the survey was mailed in late November 2006 to all jurisdictions that had not responded to the initial mailing. E-mail reminders were sent in January 2007 to all nonresponding jurisdictions for which electronic contact information was available.
The response rate was very high and the responses provide an excellent representational cross section of cities and coun-ties in North Carolina. In all, 358 of the 509 jurisdictions in the state responded, a 70 percent response rate (Table 2). The response rate of counties and jurisdictions with larger popula-tions was particularly strong. The combined 2005 population of all responding jurisdictions totaled over 7.6 million, some 90 percent of the state’s overall population. The population of responding jurisdictions is set out in Table 3. A list of respond-ing jurisdictions is provided in Appendix B.
of Zoning Districts, Design Standards, and Traditional Neighborhood Development in North Carolina Zoning Ordinances (Chapel Hill: School of Government Special Series No. 23, Oct. 2007).

Zoning Amendments in North Carolina 3
Table 1. Adoption of Zoning by Jurisdiction Type and Population
Population Zoning adopted No zoning Use county zoning No response Total
Municipalities 433 23 24 63 543< 1,000 132 23 18 54 227
1,000–9,999 231 0 6 9 24610,000–24,999 41 0 0 0 41
> 25,000 29 0 0 0 29Counties 76 24 na 0 100
1,000–24,999 19 17 na 0 36> 25,000 57 7 na 0 64
All jurisdictions 509 47 24 63 643
Table 2. Survey Response by Jurisdiction Population
PopulationNumber of jurisdictions
No. responding
Response rate (%)
Municipalities 433 295 68
< 1,000 132 68 521,000–9,999 231 173 75
10,000–24,999 41 30 73
> 25,000 29 24 83Counties 76 63 83
1,000–24,999 19 14 74> 25,000 57 49 86
All jurisdictions 509 358 70
Table 3. Population of Responding Jurisdictions
Total 2005 population
Population of responding jurisdictions
Percentage of population represented
by responding jurisdictions
Municipalities 4,398,251 3,857,715 87.7Counties
(unincorporated areas)
4,019,839 3,755,257 93.4
Total 8,418,090 7,612,972 90.4
The data reported below is based on the number of jurisdic-tions responding to a particular survey question.7 Since all respondents did not answer every question, the number of those actually responding to a particular query is noted in each table (indicated by n = x).
7. The survey responses were coded and initial data summary tables prepared by Andrew Stevenson, a graduate student in public administra-tion and planning at the University of North Carolina at Chapel Hill.
The survey is based on the responses of the staff persons who most directly work with the zoning amendment process in each jurisdiction. While most of the survey questions deal with objective measures, some involve the perceptions and observations of those most familiar with the process. Readers should keep this “insider perspective” in mind when consider-ing responses.

4 Special Series No. 24 | David W. Owens
Number and Types of Amendments Considered
Text AmendmentsThe survey asked cities and counties how many separate peti-tions for zoning ordinance text amendments had been filed in the past year. The responding jurisdictions reported that 1,520 proposed text amendments were considered. Of these, 1,245 (82 percent) were adopted during the year and 9 percent were still pending. The remainder were denied or withdrawn. City and county responses are provided in Table 4.
Table 4. Petitions for Text Amendment in the Past Year
Petitions received
Number adopted
Percentage adopted
Number pending
Percentage pending
Cities 1,238 1,017 82 97 8Counties 282 228 80 37 13
Total 1,520 1,245 82 134 9
Not surprisingly, the median number of text amendments considered was related to population size, particularly for cit-ies. For example, cities with populations between 1,000 and 9,999 had a median of two text amendment petitions while the median number of petitions in cities with populations over 25,000 was nine.
Most text amendments are proposed by the local government staff. The responding jurisdictions reported that 59 percent of the text amendment petitions in the past year originated with the city or county staff. Twenty percent were proposed by members of the public, 10 percent by the city or county governing board, 9 percent by the planning board, and 2 percent by miscellaneous others (such as the board of adjustment, the school board, another unit of government, or a neighborhood or business association).
The need to bring ordinances into conformance with state statutory amendments had some residual effect on the number of reported text amendment proposals. Major amendments were made to the zoning statutes in 2005, most of which became effective on January 1, 2006. While most local ordi-nances were updated to reflect these amendments in the year prior to this survey, some local governments did not make their requisite text amendments until the period covered by the sur-vey (six municipalities expressly reported this to be the case).
Map Amendments/RezoningsOne of the most common zoning amendments is a zoning map amendment, typically referred to as a “rezoning.” A petition is made, often by an individual property owner, to change the zoning classification applied to a particular parcel of land (for example, a petition is made to rezone the property located at 1525 Oak Street from a single family residential zoning district to a neighborhood commercial zoning district).
Consideration of rezoning petitions is the most common type of zoning decision a local government board must make. Responding jurisdictions reported that they received 3,029 rezoning petitions in the past year. By way of general compari-son, Table 5 and Figure 1 show the number of applications made for quasi-judicial zoning approvals—variances and spe-cial or conditional use permits—and the zoning amendments discussed in this report. The data is from the same universe of jurisdictions—all of the cities and counties in North Carolina with zoning ordinances, and the three surveys involved all had similar response rates. The numbers are not directly compa-rable, as there is an interval of two years between each of the three surveys and slightly different jurisdictions responded to each survey. But the three surveys are sufficiently close in time and the three populations sufficiently similar to provide a good indicator of the relative frequency that each type of decision arises.
Table 5. Frequency of Types of Zoning Approvals Sought
Type of approval (year surveyed)Total sought in previous year
Variance petitions (2002) 1,806
Special and conditional use permit applications (2004)
2,207
Zoning text amendments (2006) 1,520
Zoning map amendments (rezonings) (2006)
3,029
Figure 1. Annual Volume of Approvals Sought
0
500
1000
1500
2000
2500
3000
3500
RezoningVariance
SUP
Text amendment
No.
of z
onin
g ap
prov
als s
ough
t

Zoning Amendments in North Carolina 5
Table 6. Rezonings Sought by Type
Type of rezoning Municipal (number) Municipal (%)
County (number) County (%) Total petitions made Percentage of total
To conventional district
1,135 52 604 70 1,739 57
To overlay district 72 3 39 5 111 4To floating district 58 3 10 1 68 2To conditional use
district496 23 154 18 650 21
To conditional district
406 19 55 6 461 15
Total 2,167 862 3,029
Rezoning petitions can seek to place property into one of several different types of zoning districts. The most common type of rezoning sought is to change the zoning to a different conventional zoning district, such as a rezoning from single family residential to highway commercial. Conventional zon-ing districts (also sometimes termed “general use districts” or “base districts”) are those with a variety of permitted land uses in each district. Conventional zoning districts may also include some uses allowed only by special or conditional use permits.
Alternatively, the proposal may be to place the property in an overlay zone. These are special zones in which requirements are imposed in addition to the basic or underlying zoning dis-trict requirements. Typical overlay districts include floodplain districts, historic districts, airport districts, and highway cor-ridor districts.
A zoning ordinance may also include floating districts, districts that are defined in the text of the ordinance but are applied or mapped only upon petition.8 Examples include mobile home park districts, shopping center districts, and mixed-use districts. Special mixed-use districts, often termed “planned unit development” (PUD) districts, usually require a minimum acreage and an overall concept plan for development of the entire tract prior to rezoning.
Zoning districts that include detailed site-specific condi-tions may also be created. North Carolina law allows two types of zoning districts that apply site-specific development stan-dards—conditional use districts and conditional zoning. Both are allowed only upon petition of the landowner. Conditional use district (CUD) zoning is involved when a landowner requests that property be placed in a new zoning district having no permitted uses, only special or conditional uses. No new use of land may be undertaken within the district unless a special or conditional use permit is first secured. Often there is one conditional use district to correspond with each conventional zoning district, with all of the permitted uses in a particular
8. The use of unmapped floating zones for planned unit developments, planned industrial parks, and shopping centers has been upheld by the North Carolina courts. See Allgood v. Town of Tarboro, 281 N.C. 430, 189 S.E.2d 255 (1972); Armstrong v. McInnis, 264 N.C. 616, 142 S.E.2d 670 (1965).
zoning district being converted to special or conditional uses in the parallel special/conditional use district. An alternative developed in the 1990s is purely legislative conditional zoning. This method eliminates the conditional use permit and incor-porates all the site-specific standards directly into the zoning district regulations (and then applies that zoning district only to the single parcel that is the subject of the rezoning petition).
The majority of rezoning petitions—57 percent—considered by responding jurisdictions in the past year were for rezoning to conventional zoning districts. However, over a third of all rezoning petitions were reported to include site-specific condi-tions. Thirty-seven percent of all rezoning petitions were for conditional use districts or conditional districts. These results are shown in Table 6 and Figure 2.
Figure 2. Type of Rezoning Sought
0
500
1000
1500
2000
ConventionalOverlay
FloatingCUD CZ
No.
of r
ezon
ing
petit
ions

6 Special Series No. 24 | David W. Owens
There was a significant difference between the municipal and county experiences on this point. Counties were far more likely to have petitions for conventional rezonings. Seventy per-cent of all rezoning petitions in counties were for conventional rezoning, compared to 52 percent for municipalities. By con-trast, cities much more frequently consider purely legislative conditional zoning. Nineteen percent of all municipal rezoning petitions were for conditional rezoning, as compared to only 6 percent for counties. These results are shown in Table 6 and Figures 3 and 4.
This municipal propensity toward greater use of conditional zoning is even more pronounced for cities with high popula-tions. The twenty-four responding cities with populations over 25,000 reported over half of their rezoning petitions were for conditional or conditional use district rezonings. For these cities, 40 percent of their petitions were for conventional rezonings, 32 percent for conditional rezonings, and 22 per-cent for conditional use district rezonings. This is particularly significant given that these cities have a population of over 2.7 million and handled approximately one-third of all of the rezonings in the state. For the six cities with populations over 100,000, only a third of the total rezoning petitions were for conventional rezonings (37 percent were for conditional rezon-ings and 24 percent for conditional use district rezonings).
Cities and counties of all population sizes reported a trend toward more rather than less use of conditional and conditional use district zoning. Twenty-seven percent of both responding cities and counties noted more use and only 4 percent of the cit-ies and 6 percent of the counties reported less. Larger cities were far more likely to report a trend toward more use of conditional zoning. Sixty-three percent of cities with populations over 25,000 and 50 percent of cities with populations between 10,000 and 25,000 reported a trend toward more use of conditional zoning. By contrast, only 27 percent of the counties and 22 percent of the cities with populations in the 1,000 to 10,000 population range reported a trend toward increased use of conditional zoning.
For the most part, rezonings were sought to allow either commercial or residential land uses for both conventional and conditional rezonings. Cities with populations under 25,000 and counties with unincorporated populations over 25,000 reported commercial rezonings as most common; cities with
populations over 25,000 and counties with unincorporated populations under 25,000 reported residential rezonings as their most common type of petition. Cities with populations over 25,000 reported that rezonings to office and institutional uses were less frequent but not uncommon and more populous counties reported the same for industrial uses.
Administration and Process
FeesReasonable application fees can be charged to offset the cost of processing petitions for zoning amendments.9 The amount of the fee charged cannot exceed the administrative cost to the local government for conducting the review process.
A substantial majority of jurisdictions charge a fee for proposed zoning text amendments. Seventy-one percent of responding cities and 65 percent of responding counties charge such a fee, typically in the $100 to $200 range. Table 7 shows the median fee charged by jurisdictions of varying population groups for a proposed text amendment.
Table 7. Median Fee Charged for Proposed Zoning Text Amendment
Population Median fee
Municipalities $175< 1,000 100
1,000–9,999 15010,000–24,999 200
> 25,000 200Counties 225
1,000–24,999 250> 25,000 200
9. Homebuilders Ass’n of Charlotte v. City of Charlotte, 336 N.C. 37, 442 S.E.2d 45 (1994).
Figure 3. Types of Rezonings Sought in Municipalities
Conventional 52% Floating 3%
Overlay 3%
CUD 23%
CZ 19%
Conventional 70% Floating 1%
Overlay 5%
CZ 6%
CUD 18%
Figure 4. Types of Rezonings Sought in Counties

Zoning Amendments in North Carolina 7
Table 8. Types of Information Provided by Local Government Staff to Persons Seeking a Rezoning
Population
Zoning districts, forms, and
procedures (%)Adopted
plans (%)Political
climate (%)Expected items (%)
Rezoning alternatives (%) Other (%) None (%)
Municipalities 84 65 70 71 70 6 7< 1,000 (n = 56) 54 25 29 35 31 1 18
1,000–9,999 (n = 164) 90 54 69 72 65 1 5
10,000–24,999 (n = 29) 93 83 90 83 83 7 3
> 25,000 (n = 24) 100 96 92 92 100 13 0
Counties 95 48 76 76 79 8 41,000–24,999
(n = 14) 100 50 86 71 79 7 0
> 25,000 (n = 49) 90 45 65 80 78 8 8
It is even more common to charge a fee for a proposed zoning map amendment. Eighty-nine percent of responding municipalities and 97 percent of responding counties charge a fee for map amendment petitions. The amount of the fee charged for a proposed map amendment varies significantly. Approximately three-fourths of the cities and nearly two-thirds of the counties reported use of a flat fee for zoning map amend-ment petitions, typically in the $100 to $500 range, though several were as high as $1,000. It is not uncommon for jurisdic-tions to add to this set fee the cost of newspaper advertisements and postage for mailing hearing notices.
A quarter of the cities and over a third of the counties reported using a sliding fee scale for rezoning petitions. This is most common within jurisdictions with higher populations. Most often the variable considered in setting the fee was the number of acres or lots affected. This was particularly true with counties. Other factors used by jurisdictions in setting sliding fees were the type of land use involved (with higher fees common for proposed rezonings to nonresidential uses) and whether the rezoning sought was to a conventional or conditional district (with higher rates for proposed conditional districts). Most of the jurisdictions with sliding fee scales had a minimum fee (typically in the $250 to $500 range) and several had maximum fees (typically in the $1,000 to $4,000 range).
Jurisdictions using a sliding fee scale should ensure that the amount of the fee charged does not exceed the cost of process-ing the rezoning petition. Charging a higher fee for projects that have higher processing costs is legally permissible, but it is not legally permissible to charge a higher fee because a project is larger, because the applicant has a greater ability to pay the fee, or to discourage a particular type of application.10
10. It may be permissible to recoup a higher portion of actual costs from larger projects—such as setting a fee to recoup 50 percent of the pro-cessing costs for a small project and 75 percent of the processing costs for a large project—provided the actual fee charged does not exceed a reason-able estimate of actual processing costs.
Information Provided to PetitionersThe process of securing a rezoning or a zoning text amend-
ment can be daunting for persons unfamiliar with these governmental procedures. Therefore most local government staffs provide a variety of background information to those petitioning for amendments.
Virtually all cities and counties provide basic information about the zoning ordinance and forms that must be used to initiate the process. The only modest exception is municipali-ties with very small populations (and over half of these provide such information).
When a zoning map amendment is being proposed, about three-fourths of both cities and counties also provide information on alternatives to rezoning, tips about items the governing board expects to see addressed during the process, and advice on the likelihood of success and the political climate for rezoning. Again, the only exception to this general rule is municipalities with populations under 1,000. About half of the jurisdictions reported providing information about adopted plans when rezonings are proposed. The percentage of jurisdic-tions providing each of these types of information is shown in Table 8.
Decision-Making Process
HearingsState law requires a public hearing before the governing board prior to the adoption, amendment, or repeal of any zoning ordinance. Any zoning ordinance adoption, amendment, or repeal made without a properly noticed hearing will be voided if a timely legal challenge is made.

8 Special Series No. 24 | David W. Owens
These mandated public hearings are legislative in nature.11 The purpose of the hearing is to inform the elected officials of the nature of the proposed action and to allow members of the public to express their views on the matter directly to the deci-sion makers.
State statutes require advertisement of these public hear-ings. Notice for all public hearings on zoning map and text amendments must be published in the newspaper. In addition, if a zoning map amendment is proposed, notice of the hearing must be mailed to neighbors and posted on the site. In addi-tion to these statutory requirements, an increasing number of local governments post a notice of the hearing on their websites (and a few jurisdictions now have authority to substitute this Internet posting for the notice published in the newspaper).
North Carolina local governments were surveyed about a variety of factors related to these mandated public hearings. The survey asked how long they typically last, who appears, and how often multiple hearings related to the same petition are held.
Presentation of InformationAt a typical zoning amendment hearing, the staff summarizes the matter before the board, the proponent of the action explains the request, and public comment is invited. Often governing board members ask questions of clarification as needed.
Most responding local governments reported that a staff presentation is made to the governing board at rezoning hearings. Ninety-two percent of responding counties and 79 percent of responding cities reported that they make staff presentations. As for the content of these presentations, virtually all jurisdictions making staff reports provide factual information regarding the rezoning petition. Most also provide background information on the particular site involved and on the relationship of the proposal to adopted plans (the provision of information regarding consistency with plans is discussed in more detail in a subsequent section of this report). A majority of jurisdictions also provide a staff recommendation regarding the decision; site plans; and videos, photographs, or building elevations. Table 9 summarizes these responses.
11. The general statutory guidance for legislative public hearings is North Carolina General Statutes (hereinafter G.S.) § 160A-81 for cities and § 153A-52 for counties. These statutes allow the governing board to “adopt reasonable rules governing the conduct of the public hearing, including but not limited to rules (i) fixing the maximum time allotted to each speaker, (ii) providing for the designation of spokesmen for groups of persons supporting or opposing the same positions, (iii) providing for the selection of delegates from groups of persons supporting or opposing the same positions when the number of persons wishing to attend the hearing exceeds the capacity of the hall, and (iv) providing for the maintenance of order and decorum in the conduct of the hearing.”
Table 9. Information Provided by Staff at Rezoning Hearing (n = 228)
Type of information Percentage providing
Factual information on petition
98
Background information on site
87
Information/analysis on relation to plan
81
Recommendation on decision
72
Site plans 64Video, photographs,
building elevations51
Information on similar past rezoning petitions
45
The only substantial differences among jurisdictions regard-ing staff presentations are strongly related to population size. Cities with populations under 1,000 usually make no staff presentations—77 percent of these jurisdictions make no staff presentation at all. By contrast, only 2 percent of the cities with populations over 10,000 reported making no staff presentation. In addition, the presentations made by small-population cities are far more likely to include only basic information on the petition and far less likely to include background information such as photographs or analysis of past similar rezoning petitions.
Neighbors and other members of the public are often quite interested in proposed rezonings. Survey respondents reported that it is fairly common for persons other than the petitioner and staff to appear at rezoning hearings. Over half (53 percent) of the responding jurisdictions reported this happens fre-quently or more often. Only 16 percent reported that it rarely or never happens. These results are summarized in Table 10 and Figure 5.
Table 10. Frequency Person Other than Petitioner or Staff Appear at Rezoning Hearing (n = 331)
Frequency No. of jurisdictions Percentage
Never 8 2Rarely 46 14
Occasionally 100 30Frequently 74 22
Almost always 66 20
Always 37 11

Zoning Amendments in North Carolina 9
Table 11. Frequency Attorney Appears for Petitioner at Rezoning Hearings (n = 332)
Frequency No. of jurisdictions Percentage
Never 50 15Rarely 128 39
Occasionally 109 33Frequently 39 12
Almost always 5 2Always 1 0
The only substantial variation in these results is with the more populous cities, where attorneys are more likely to be involved in rezoning hearings. Thirty-eight percent of the cities with populations over 25,000 and 33 percent of those with populations between 10,000 and 25,000 reported that attorneys appear for the petitioners frequently or more often at rezoning hearings.
Length of HearingsCities and counties consider a tremendous variety of zoning amendments. Some amendments are technical, routine, and noncontroversial. The hearings on these are often perfunctory. The staff will give a very brief explanation, no one will appear to speak on the matter, the board will have no questions, and the hearing is promptly closed. On the other end of the spectrum, some zoning hearings involve highly controversial issues with tremendous political implications. At these hearings the meeting room is often packed, sometimes overflowing, with video transmission to spill-over rooms. Law enforcement is sometimes called in to maintain order. It is not unusual for these hearings to extend into the early morning hours or to be continued for several meetings. Our survey did not explore either of these extremes. Rather, the survey addressed how routine and more common zoning amendment hearings are conducted. Therefore it inquired about jurisdictions’ experi-ences with “typical” zoning amendments.
The survey asked about the duration of the typical zoning hearing, including time spent for public comment and govern-ing board deliberation. For the most part, the responses were similar for both cities and counties. Jurisdictions reported that their zoning hearings typically take between fifteen minutes and an hour. Seventy-two percent of the jurisdictions reported hearings on text amendments take this amount of time. Sixty-nine percent of the jurisdictions reported the same for hearings on conventional rezonings. As would be expected, hearings on conditional rezonings usually take longer. These tend to be somewhat more controversial and, given the individualized nature of the zoning restrictions, more complex. Thus it is not surprising that 30 percent of the jurisdictions reported hearings on typical conditional rezonings last more than an hour. These results are summarized in Table 12 and Figure 6.
Figure 5. Frequency Persons Other Than Petitioner/Staff Appear
RarelyNever
Occasionally
Frequently
Almost alwaysAlways0
5
10
15
20
25
30
Perc
enta
ge o
f res
pond
ents
Again, the only substantial variation in these results occurs with cities with very small populations. Forty-two percent of cities with populations under 1,000 reported that persons other than the petitioner and staff rarely or never appear at rezoning hear-ings, while none of the cities with populations over 10,000 reported the same.
This phenomenon represents a substantially higher level of public involvement than typically occurs with quasi-judicial hearings. As might be expected where witnesses are testifying rather than citizens commenting, earlier survey results indi-cated that participation by persons other than staff and the applicant is considerably less for special use permit hearings and even less frequent for variance hearings. Thirty-six percent of jurisdictions reported that a person other than the applicant or staff appeared frequently or more often at special use permit hearings; only 21 percent of jurisdictions reported the same for variance hearings.
Rezoning hearings for the most part remain the province of citizens, not lawyers. A majority of responding jurisdictions (54 percent) reported that attorneys never or only rarely appear at a rezoning hearing on behalf of petitioners. Only 14 percent of the jurisdictions reported that attorneys appear frequently or more often. These results are summarized in Table 11.

10 Special Series No. 24 | David W. Owens
Table 12. Length of Time Board Spends on Typical Hearing
Length of Time
Percentage for text
amendment (n = 316)
Percentage for conventional
rezoning (n = 307)
Percentage for
conditional rezoning
(n = 226)
< 15 minutes 10 11 6
15–30 minutes 42 43 28
30–60 minutes 30 26 36
> 60 minutes 18 18 30
Figure 6. Length of Typical Hearing
0
10
20
30
40
50 Text AmendmentConventionalConditional
< 15 minutes 15–30 30–60 > 60
Perc
enta
ge o
f res
pond
ents
The reported length of a typical zoning hearing was generally consistent for all jurisdiction population groupings with one exception. Jurisdictions with small populations were far more likely to report longer zoning hearings. For example, 36 percent of cities with populations under 1,000 reported that a typical conventional rezoning hearing lasted over an hour, compared to only 13 percent of cities with populations over 25,000 reporting the same. This was also true of counties with lower populations in their zoning jurisdictions. These responses are consistent with earlier survey results. Lower-population jurisdictions reported having longer hearings than their more populous counterparts on both variances and special use permits.
Additional HearingsAfter receiving comments at the public hearing on a proposed zoning amendment, the city council or county board of com-missioners will sometimes modify the proposed amendment before adopting it. A second advertised public hearing is
required if the amended proposal is substantially different from the version initially advertised for hearing.12
Our survey indicates that it is uncommon to hold addi-tional hearings. Three-quarters of the responding jurisdictions reported that additional hearings are never or only rarely held. Only 3 percent of the jurisdictions reported that this happens fre-quently or more often. These results are summarized in Table 13.
Table 13. Frequency Additional Hearing Is Required for Zoning Amendment (n = 324)
Frequency No. of jurisdictions Percentage
Never 98 30
Rarely 148 46
Occasionally 70 22
Frequently 5 2
Almost always 1 0
Always 2 1
The more populous cities were slightly more likely to report additional hearings, but re-hearings are uncommon even for the largest cities. Forty-six percent of the cities with popula-tions over 25,000 reported that additional hearings are held only occasionally.
Protest PetitionsThe provision for a protest petition was included in the state’s 1923 zoning enabling act to provide a degree of certainty and stability in zoning while allowing the governing body sufficient flexibility to amend the ordinance to reflect changing needs and circumstances. The provision in North Carolina zoning law for a protest petition, North Carolina General Statute § 160A-385(a) (hereinafter G.S.), specifies that these petitions are mandatory for cities. Counties, on the other hand, do not have the authority to allow protest petitions.13
The statutory protest petition provides that if a sufficient number of those most immediately affected by a zoning change object to a proposed zoning amendment, the amendment may be adopted only if approved by a supermajority of the governing board. When a valid protest petition has been filed, G.S. 160A-385(a)(1) provides that adoption of the proposed amendment requires the favorable vote of three-fourths of “all the members of the city council.” This statute also provides that, for purposes of the protest petition, vacant positions on
12. Heaton v. City of Charlotte, 277 N.C. 506, 518, 178 S.E.2d 352, 359–60 (1971).
13. The General Assembly can provide exemptions for individual local governments. For example, local legislation provides that the protest peti-tion does not apply in Greensboro but is applicable for Durham County.
Zoning Amendments in North Carolina 11
the board and members excused from voting are not to be con-sidered as “members of the board” in computing the requisite supermajority. The protest petition only applies to zoning map amendments (prior to 2006 the statute also applied to text amendments). Protest petitions are most often made when neighbors object to the rezoning of a parcel, but the provision also applies to the creation and application of new overlay zon-ing districts.
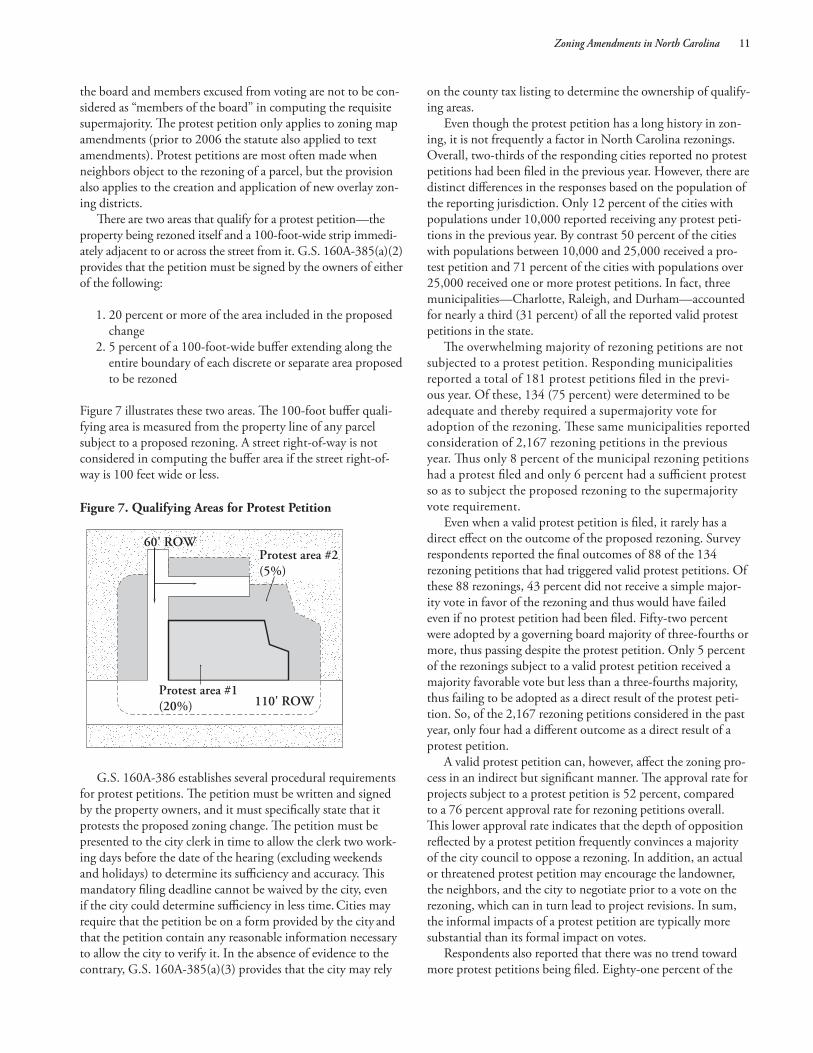
There are two areas that qualify for a protest petition—the property being rezoned itself and a 100-foot-wide strip immedi-ately adjacent to or across the street from it. G.S. 160A-385(a)(2) provides that the petition must be signed by the owners of either of the following:
1. 20 percent or more of the area included in the proposed change
2. 5 percent of a 100-foot-wide buffer extending along the entire boundary of each discrete or separate area proposed to be rezoned
Figure 7 illustrates these two areas. The 100-foot buffer quali-fying area is measured from the property line of any parcel subject to a proposed rezoning. A street right-of-way is not considered in computing the buffer area if the street right-of-way is 100 feet wide or less.
Figure 7. Qualifying Areas for Protest Petition
Protest area #1(20%)
Protest area #2(5%)
60' ROW
110' ROW
G.S. 160A-386 establishes several procedural requirements for protest petitions. The petition must be written and signed by the property owners, and it must specifically state that it protests the proposed zoning change. The petition must be presented to the city clerk in time to allow the clerk two work-ing days before the date of the hearing (excluding weekends and holidays) to determine its sufficiency and accuracy. This mandatory filing deadline cannot be waived by the city, even if the city could determine sufficiency in less time. Cities may require that the petition be on a form provided by the city and that the petition contain any reasonable information necessary to allow the city to verify it. In the absence of evidence to the contrary, G.S. 160A-385(a)(3) provides that the city may rely
on the county tax listing to determine the ownership of qualify-ing areas.
Even though the protest petition has a long history in zon-ing, it is not frequently a factor in North Carolina rezonings. Overall, two-thirds of the responding cities reported no protest petitions had been filed in the previous year. However, there are distinct differences in the responses based on the population of the reporting jurisdiction. Only 12 percent of the cities with populations under 10,000 reported receiving any protest peti-tions in the previous year. By contrast 50 percent of the cities with populations between 10,000 and 25,000 received a pro-test petition and 71 percent of the cities with populations over 25,000 received one or more protest petitions. In fact, three municipalities—Charlotte, Raleigh, and Durham—accounted for nearly a third (31 percent) of all the reported valid protest petitions in the state.
The overwhelming majority of rezoning petitions are not subjected to a protest petition. Responding municipalities reported a total of 181 protest petitions filed in the previ-ous year. Of these, 134 (75 percent) were determined to be adequate and thereby required a supermajority vote for adoption of the rezoning. These same municipalities reported consideration of 2,167 rezoning petitions in the previous year. Thus only 8 percent of the municipal rezoning petitions had a protest filed and only 6 percent had a sufficient protest so as to subject the proposed rezoning to the supermajority vote requirement.
Even when a valid protest petition is filed, it rarely has a direct effect on the outcome of the proposed rezoning. Survey respondents reported the final outcomes of 88 of the 134 rezoning petitions that had triggered valid protest petitions. Of these 88 rezonings, 43 percent did not receive a simple major-ity vote in favor of the rezoning and thus would have failed even if no protest petition had been filed. Fifty-two percent were adopted by a governing board majority of three-fourths or more, thus passing despite the protest petition. Only 5 percent of the rezonings subject to a valid protest petition received a majority favorable vote but less than a three-fourths majority, thus failing to be adopted as a direct result of the protest peti-tion. So, of the 2,167 rezoning petitions considered in the past year, only four had a different outcome as a direct result of a protest petition.
A valid protest petition can, however, affect the zoning pro-cess in an indirect but significant manner. The approval rate for projects subject to a protest petition is 52 percent, compared to a 76 percent approval rate for rezoning petitions overall. This lower approval rate indicates that the depth of opposition reflected by a protest petition frequently convinces a majority of the city council to oppose a rezoning. In addition, an actual or threatened protest petition may encourage the landowner, the neighbors, and the city to negotiate prior to a vote on the rezoning, which can in turn lead to project revisions. In sum, the informal impacts of a protest petition are typically more substantial than its formal impact on votes.
Respondents also reported that there was no trend toward more protest petitions being filed. Eighty-one percent of the

12 Special Series No. 24 | David W. Owens
municipalities reported either that the number of filings was about the same over time or that while frequency varied, there was no overall trend in the number of filings. About the same number of jurisdictions reported a trend toward less frequent filings (9 percent) as did toward more frequent filings (11 percent). The only difference among population groups of cities was that 24 percent of the cities with populations over 25,000 reported a trend toward more filings while 23 percent of the smallest-population cities (those with populations under 1,000) reported less frequent filings.
Decisions Made and Factors Influencing Outcomes
OutcomesThe majority of proposed zoning ordinance amendments considered by cities and counties in North Carolina are fairly routine and attract little attention beyond those most directly affected. When asked what proportion of all zoning amend-ment petitions would be considered controversial, two-thirds of the responding cities and three-fourths of the responding counties reported that less than 25 percent of the petitions fit this category. Cities with larger populations were considerably more likely to report zoning controversy. About a third of the cities with populations over 10,000 reported that 25 to 49 percent of their zoning petitions were controversial. Almost a quarter of the cities with populations over 25,000 reported the same for more than half of their zoning petitions.
The overwhelming majority of proposed zoning text and zoning map amendments are adopted. Responding jurisdic-tions reported that 1,245 of 1,520 proposed text amendments (82 percent) had been adopted in the past year. Another 134 (9 percent) were still pending. These jurisdictions reported that 2,300 of 3,029 proposed map amendments (76 percent) had been adopted in the past year. Another 258 (9 percent) were still pending. In both instances the adoption rate was about the same for cities and counties.14
Interestingly, the reported approval rate was about the same for conventional and conditional rezonings. For all responding jurisdictions, the approval rate for rezonings to conventional zoning districts was 78 percent, while it was 77 percent for rezonings to conditional districts and 73 percent for rezonings to conditional use districts. The approval rates for zoning amend-ments for overlay and floating districts were slightly lower. Jurisdictions reported 67 percent of the map amendments to add overlay districts had been adopted; 69 percent of the pro-posed floating district amendments had been adopted. These results are summarized in Table 14.
14. Rezoning petitions that have not been adopted or are still pending have not necessarily been denied. Many zoning ordinances include a man-datory waiting period between the time a rezoning petition is denied and the time another rezoning petition can be made for the same parcel. To avoid the waiting period, petitioners in some jurisdictions will voluntarily withdraw a rezoning petition if the petitioner believes the proposal cannot readily be modified to address concerns raised during the review process and therefore faces a serious possibility of being denied.
Table 14. Approval Rates for Proposed Rezonings
Type of map amendment
Number proposed
Percent approved
Percent pending
To conventional district 1,739 78 7
Add overlay district 111 67 9
To floating district 68 69 16
To conditional use district 650 73 10
To conditional district 461 77 11
For the most part, the reported approval rate was similar for cities and counties. One difference is that counties had higher approval rates (and lower pending rates) for overlay and float-ing zoning district proposals.
Time to Reach DecisionsDespite the complexity of the process, most local governments reported that the typical rezoning decision-making process is relatively expeditious. The overwhelming majority of North Carolina cities and counties—88 percent—reported making final decisions on typical rezoning petitions within two to three months of receipt of a completed rezoning petition. These results are summarized in Table 15 and Figure 8.
Table 15. Length of Time to Reach Decision on Typical Rezoning (n = 320)
Time period No. of jurisdictionsPercentage of jurisdictions
< 30 days 14 431–60 days 165 5261–90 days 115 36
91–180 days 19 6> 181 days 7 2

Zoning Amendments in North Carolina 13
Figure 8. Time to Reach Decision on Typical Rezoning
0
20
40
60
80
100
120
140
160
180
< 30 days 31–60 61–90 91–180 > 180
No.
of j
urisd
ictio
ns
City and county responses did not differ significantly. Nor was there a difference based on the population size of the juris-diction, with the modest exception that very low-population municipalities (those with populations under 1,000) were slightly more likely to reach a decision in less than thirty days.
Factors Influencing DecisionsIt has long been posited that one of the principal objectives of many zoning ordinances is to minimize the harm to neighbors from inappropriate adjacent land uses. Our survey confirms this notion.
The survey asked jurisdictions to identify the most common reasons offered by governing boards to justify denial of rezonings. Respondents could check all of the rationales for denial com-monly cited by the governing board. By far the most common
reason for denial—cited by 85 percent of responding jurisdic-tions—was that the proposal was inconsistent with surrounding land uses. Also, the most commonly cited open-ended rationale under the “Other” category was neighborhood opposition, which is often generated by neighbors’ perceptions of incompat-ibility. This concern about land use compatibility predominated for both cities and counties and for all jurisdiction population ranges. Two other reasons were cited as common justifications for denial by about half of the jurisdictions—plan inconsistency and traffic impacts. These responses are summarized in Table 16.
Table 16. Most Common Grounds Cited for Denial of Rezoning (n = 292)
Reason Number Percentage citing
Inconsistent with surrounding land uses
248 85
Inconsistent with plans 150 51Traffic impacts 126 43
Environmental impacts 54 18Inadequate water or sewer 36 12
Inadequate school capacity 16 5Miscellaneous others 33 11
While jurisdictions of all sizes cited inconsistency with sur-rounding land uses, responses about other rationales for denial varied according to a jurisdiction’s population size. For exam-ple, 83 percent of cities with populations over 25,000 cited traffic impacts as a ground for denial, while only 11 percent of towns with populations under 1,000 did so. Larger cities were also more likely to cite plan inconsistency and inadequate school capacity as grounds for denial, while small cities were more likely to cite inadequate water and sewer capacity. These variations are shown in Table 17.
Table 17. Most Common Grounds Cited for Denial of Rezoning by Jurisdiction Size (%)
Population group
Inconsistent with surrounding
land usesPlan
inconsistencyTraffic impacts
Environmental impacts
Inadequate water and sewer
Inadequate school capacity Other
Municipalities 87 53 48 19 13 5 15< 1,000 (n = 36) 86 33 11 19 22 0 6
1,000–9,999 (n = 144) 88 48 42 18 11 5 10
10,000–24,999 (n = 29) 86 69 55 14 10 3 10
> 25,000 (n = 24) 88 63 83 25 8 13 33
Counties 78 54 45 22 14 6 91,000–24,999
(n = 12) 75 42 42 25 17 0 8
> 25,000 (n = 44) 80 66 48 18 11 11 9

14 Special Series No. 24 | David W. Owens
Impact of RecommendationsThe appearance of neighbors to support or oppose a proposed rezoning is perceived to have a significant impact on the likelihood of adoption of a rezoning. Seventy-two percent of the responding jurisdictions reported neighborhood support increased the chances of a rezoning being approved. Similarly, 70 percent of the jurisdictions reported that neighborhood opposition increased the likelihood of a rezoning petition being denied. These results are summarized in Tables 18 and 19.
Table 18. Effect of Neighbors’ Appearance at Hearing to Support Rezoning Petition (n = 333)
ImpactNo. of
jurisdictions Percentage
Reduces chance of approval 2 1Has no effect 36 11
Increases chance of approval 240 72Don’t know 55 17
Table 19. Effect of Neighbors’ Appearance at Hearing to Oppose Rezoning Petition (n = 333)
ImpactNo. of
jurisdictions Percentage
Reduces chance of approval 233 70Has no effect 34 10
Increases chance of approval 8 2Don’t know 58 17
Generally these responses were similar for cities and coun-ties and for all jurisdictions regardless of population size, but there were several notable variations. Counties were somewhat more likely to report that neighborhood support increased the chances of approval. Also, the smaller the municipal population, the more likely it was to report no impact from neighborhood support of or opposition to a rezoning. Seventeen percent of the cities with populations under 1,000 reported no effect from neighborhood support, while only 4 percent of the cities with populations over 25,000 reported no effect. Eighty-five percent of the cities with populations over 10,000 reported that neighborhood opposition decreased the chances for approval of a rezoning, but only 43 percent of the cities with populations under 1,000 reported this effect. This phenomenon may be related to the greater personal familiarity small-town officials have with the sites and issues involved in a proposed rezoning (but, on the other hand, these officials are more likely to know the petitioners and neighbors involved as well).
By contrast, the appearance of an attorney for either the petitioner for or opponents to a rezoning is reported to have only a modest impact. A majority of the responding jurisdic-tions (52 percent) reported this has no impact on the outcome. Only 12 percent of the jurisdictions reported that this repre-
sentation increased the chances of success for the represented party. Given the relative infrequency that attorneys appear in most rezoning hearings, a substantial number of jurisdictions reported they did not know the impact of attorney appear-ances. These responses are summarized in Table 20.
Table 20. Effect of Attorney’s Appearance at Hearing on Rezoning Petition (n = 328)
ImpactNo. of
jurisdictions Percentage
Reduces chance of success for represented party 3 1
Has no effect 170 52Increases chance of success
for represented party 40 12
Don’t know 115 35
The only notable difference between jurisdictions on this response was that the more populous cities and counties, who have far more experience with attorney participation in rezon-ing hearings, were less likely to report they did not know the impact of an attorney’s appearance. For example, only 16 per-cent of the cities with populations over 25,000 reported they did not know the impact of an attorney’s appearance (while 61 percent of these large cities reported an attorney’s appear-ance had no effect and 23 percent reported it improved the chances of success for the represented party).
In addition to comments and recommendations from the petitioner, neighbors, and their representatives, city and county governing boards may also seek advice on rezonings from members of their professional planning staffs. State law also requires that the governing board seek comments from the city or county planning board.
The survey indicates that these recommendations are influential, as governing board decisions are usually consis-tent with staff and planning board recommendations. These recommendations are not binding; only a modest number of jurisdictions reported that the governing board always follows them. However, 93 percent of the jurisdictions reported that the staff recommendation is followed frequently or more often, and 96 percent reported the same for planning board recommenda-tions. Tables 21 and 22 and Figure 9 summarize these results.
Table 21. Frequency Rezoning Decision Is Consistent with Staff Recommendations (n = 295)
Frequency No. of jurisdictions Percentage
Never 2 1Rarely 4 1
Occasionally 15 5Frequently 110 37
Almost always 153 52Always 11 4

Zoning Amendments in North Carolina 15
These responses varied only modestly among cities and counties and different population groups. County boards of commissioners were slightly more likely than their municipal counterparts to follow staff recommendations, largely due to the fact that municipalities with populations under 1,000 were modestly less likely to follow these recommendations (perhaps because few of these jurisdictions have an in-house profes-sional planning staff). Cities and counties varied only slightly as regards following planning board recommendations. There was also little variation among cities with differing populations, with the exception that governing boards in small-population cities were modestly more likely to follow their planning boards’ recommendations.
Consistency of Decisions with PlansThe zoning statutes require planning boards and governing boards to consider their jurisdictions’ adopted plans as zoning amendments are made. The statutes do not mandate consis-tency with the plan, only plan consideration. The question thus arises: How often are rezoning decisions that are inconsistent with previously adopted plans made?
Although not mandated to do so, most of the more populous North Carolina cities and counties have adopted comprehensive or land use plans. A 1998 survey reported that 83 percent of the state’s counties, 70 percent of the cities with populations over 10,000, and 50 percent of the cities with populations under 10,000 had adopted a plan.15
The zoning statutes were amended in 2005 to strengthen the role of adopted plans in the consideration of zoning amendments. G.S. 160A-387 and G.S. 153A-344 require planning board recommendations prior to initial adoption of zoning and mandate referral of proposed zoning amendments to the planning board for review and comment. G.S. 160A-383 and G.S. 153A-341 require that planning board review of zon-ing amendments include written comments on the consistency of the proposed amendment with the comprehensive plan and any other relevant plans (such as a small area plan, a corridor plan, or a transportation plan) adopted by the governing board. However, a statement from the planning board that the pro-posed amendment is inconsistent with a plan does not preclude the governing board from adopting the amendment.
The governing board must approve a statement on plan consistency before adopting or rejecting any zoning amend-ment. The governing board decision does not have to be consistent with the plan, but any inconsistency must be identified and explained. The governing board statement must also explain why the board believes that the action taken is reasonable and in the public interest. The statement on plan consistency approved by the governing board is not subject to judicial review.
15. Center for Urban and Regional Studies, University of North Carolina at Chapel Hill, Land Development Plan Guidelines for North Carolina Local Governments: Incorporating Water Quality Objectives in a Comprehensive Planning Framework 1 (1999).
Table 22. Frequency Rezoning Decision Is Consistent with Planning Board Recommendations (n = 329)
Frequency No. of jurisdictions Percentage
Never 1 0Rarely 1 0
Occasionally 10 3Frequently 116 35
Almost always 180 55Always 21 6
Figure 9. Frequency Rezoning Decision Consistent with Recommendations
Sta�Plan Bd.
0
10
20
30
40
50
60
NeverRarely
Frequently
Almost always
OccasionallyAlways
Perc
enta
ge o
f res
pond
ents
The survey examined how cities and counties have begun to comply with this new statutory mandate. About three-fourths of both cities and counties reported that their jurisdictions’ planning staffs prepare the initial draft statement on plan con-sistency considered by the planning board and the governing board. In municipalities with small populations, the petitioner or a board member often undertakes this task. Table 23 sum-marizes these results.

16 Special Series No. 24 | David W. Owens
Table 23. Preparation of First Draft of Plan Consistency Statement (%)
PetitionerPlanning or zoning staff
Local government
attorney
Consultant for local
government
Planning board
memberGoverning
board member Other
Municipalities 14 73 3 2 6 2 1< 1,000 (n = 51) 24 41 4 6 17 6 2
1,000–9,999 (n = 173) 18 72 3 2 3 1 1
10,000–24,999 (n = 30) 11 83 3 0 3 0 0
> 25,000 (n = 24) 4 96 0 0 0 0 0
Counties 17 77 6 0 0 0 01,000–24,999
(n = 13) 23 69 8 0 0 0 0
> 25,000 (n = 47) 11 85 4 0 0 0 0
Two-thirds of the jurisdictions reported that rezonings are either always or almost always consistent with adopted plans. Less than 4 percent of responding jurisdictions reported less than frequent consistency. Table 24 and Figure 10 summa-rize these responses. The results for cities and counties were substantially similar. They were also generally the same across population categories, with the exception of small-population towns being modestly more likely to report more frequent con-sistency between rezoning and plans.
Table 24. Frequency Rezoning Is Consistent with Plans (n = 306)
Frequency No. of jurisdictions Percentage
Never 2 0Rarely 2 0
Occasionally 7 2Frequently 90 29
Almost always 162 53Always 43 14
Figure 10. Rezoning Consistent with Plans
Perc
enta
ge o
f res
pond
ents
0
10
20
30
40
50
60
NeverRarely
Occasionally
Frequently
Almost alwaysAlways
The survey also inquired as to whether the number and types of rezonings undercut the purpose and intent of adopted plans. Just under half of the responding jurisdictions reported this does not happen at all. Another third reported it happens
only modestly. Only 2 percent of the jurisdictions reported that rezonings significantly undercut adopted plans. The remainder did not know.
One goal of the 2005 legislation mandating the plan con-sistency statement for all zoning amendments was to encourage greater familiarity with and use of plans by elected officials. Having just under a year’s experience with this new mandate, local governments reported this is happening to a moderate degree. A quarter of the local governments reported that the new legislation had made their elected officials more familiar with the substance of adopted plans, and just over half reported no noticeable impact (the rest of the respondents indicated they did not know the impact). While the responses were fairly consistent for cities and counties of all sizes, there were two exceptions. Thirty-eight percent of the cities with populations between 10,000 and 25,000 reported the requirement had made their elected officials more familiar with the plans, while only 10 percent of the cities with populations under 1,000 reported the same thing. This moderate increase in familiarity with the plans led to a similar increase in perceived rezoning and plan consistency. Just under a quarter of the jurisdictions
Zoning Amendments in North Carolina 17
reported that this statutory mandate had, in this first year, led to rezonings being more consistent with adopted plans (while about two-thirds reported no noticeable impact).
Conflicts of InterestThe courts16 and state statutes have imposed important conflict-of-interest limitations on land development regulatory policy decisions. In 2005 the zoning statutes were amended to specifically address conflicts of interest. G.S. 160A-381(d) and G.S. 153A-340(g) provide that members of city councils and county boards of commissioners “shall not vote on any zoning map or text amendment where the outcome of the matter being considered is reasonably likely to have a direct, substan-tial, and readily identifiable financial impact on the member.” These statutes also apply the same prohibition to advisory boards making recommendations on zoning amendments.
Some city and county codes also have ethics provisions regarding the disclosure of financial interests in matters coming before elected officials as well as requirements for nonparticipa-tion in such matters. Many of the local code provisions apply to advisory boards as well as to elected officials.
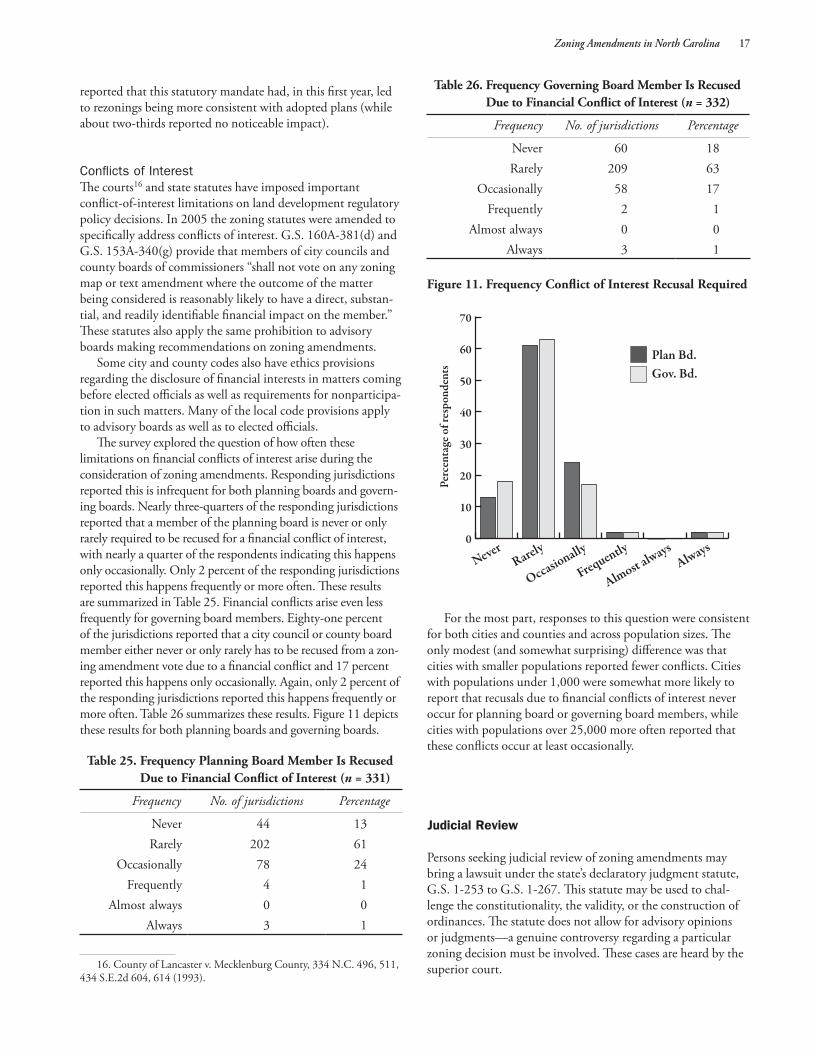
The survey explored the question of how often these limitations on financial conflicts of interest arise during the consideration of zoning amendments. Responding jurisdictions reported this is infrequent for both planning boards and govern-ing boards. Nearly three-quarters of the responding jurisdictions reported that a member of the planning board is never or only rarely required to be recused for a financial conflict of interest, with nearly a quarter of the respondents indicating this happens only occasionally. Only 2 percent of the responding jurisdictions reported this happens frequently or more often. These results are summarized in Table 25. Financial conflicts arise even less frequently for governing board members. Eighty-one percent of the jurisdictions reported that a city council or county board member either never or only rarely has to be recused from a zon-ing amendment vote due to a financial conflict and 17 percent reported this happens only occasionally. Again, only 2 percent of the responding jurisdictions reported this happens frequently or more often. Table 26 summarizes these results. Figure 11 depicts these results for both planning boards and governing boards.
Table 25. Frequency Planning Board Member Is Recused Due to Financial Conflict of Interest (n = 331)
Frequency No. of jurisdictions Percentage
Never 44 13Rarely 202 61
Occasionally 78 24Frequently 4 1
Almost always 0 0Always 3 1
16. County of Lancaster v. Mecklenburg County, 334 N.C. 496, 511, 434 S.E.2d 604, 614 (1993).
Table 26. Frequency Governing Board Member Is Recused Due to Financial Conflict of Interest (n = 332)
Frequency No. of jurisdictions Percentage
Never 60 18Rarely 209 63
Occasionally 58 17Frequently 2 1
Almost always 0 0Always 3 1
Figure 11. Frequency Conflict of Interest Recusal Required
NeverRarely
Occasionally
Frequently
Almost alwaysAlways
Perc
enta
ge o
f res
pond
ents
0
10
20
30
40
50
60
70
Plan Bd.Gov. Bd.
For the most part, responses to this question were consistent for both cities and counties and across population sizes. The only modest (and somewhat surprising) difference was that cities with smaller populations reported fewer conflicts. Cities with populations under 1,000 were somewhat more likely to report that recusals due to financial conflicts of interest never occur for planning board or governing board members, while cities with populations over 25,000 more often reported that these conflicts occur at least occasionally.
Judicial Review
Persons seeking judicial review of zoning amendments may bring a lawsuit under the state’s declaratory judgment statute, G.S. 1-253 to G.S. 1-267. This statute may be used to chal-lenge the constitutionality, the validity, or the construction of ordinances. The statute does not allow for advisory opinions or judgments—a genuine controversy regarding a particular zoning decision must be involved. These cases are heard by the superior court.

18 Special Series No. 24 | David W. Owens
Only a party with standing may bring a suit challenging a zon-ing ordinance amendment. The burden of establishing standing is on the party bringing the action. To have standing, a person must have a specific legal interest in the subject matter affected and be directly and adversely affected by the decision.17 A citizen or a taxpayer may not file a lawsuit as a member of the general public to bring a conceptual challenge to a legislative decision. G.S. 153A-348 and G.S. 160A-364.1 provide that a suit chal-lenging a zoning amendment must be filed within two months of the legislative action that is the subject of the challenge.
Litigation challenging legislative zoning decisions is rela-tively rare. Only 21 of 339 responding jurisdictions (6 percent) reported having a rezoning decision challenged in court in the past year. Judicial challenges were made to 26 of the 3,029 rezoning decisions made in the previous year, an appeal rate of less than 1 percent. As shown in Table 27, this appeal rate is even lower than those previously reported for decisions on vari-ances or special and conditional use permits.
Table 27. Frequency of Judicial Review Sought
Type of approval (year surveyed)Total number
soughtPercent appealed
to court
Variance petitions (2002) 1,806 2.5Special and conditional use permit applications (2004)
2,207 1.6
Zoning map amendments (rezonings) (2006)
3,029 0.9
Trial courts usually uphold the original decision of the city or county governing board. Responding jurisdictions reported ten cases had been decided in the previous year. Of these, the local government’s decision was upheld in seven cases and reversed in one, and two decisions were remanded for further local government action.
This low rate of appeals and of judicial reversal is in part explained by the limited role of judicial review in legislative zoning decisions. Courts do not review the wisdom or social desirability of the decision on whether to adopt a rezoning or a text amendment. The action taken by the governing board is presumed by the courts to be valid and can be reversed only if there was a failure to follow mandated procedures or if the ordinance is arbitrary, capricious, or violates the constitutional rights of an affected party.
17. Taylor v. City of Raleigh, 290 N.C. 608, 620, 227 S.E.2d 576, 583 (1976). See also Davis v. City of Archdale, 81 N.C. App. 505, 344 S.E.2d 369 (1986).

19
Appendix AApplicable Portion of Survey Instrument
Part Two: Zoning Amendments
7. Is a fee currently charged for a person to request a zoning map amendment (a rezoning)?
___ No___ Yes. The amount of the fee is $______________
8. Is a fee currently charged for a person to request a zoning text amendment?
___ No___ Yes. The amount of the fee is $________________
For the following questions about zoning amendments, please use the most recent 12 month period that is convenient for you or for which you have readily available information (you can use the past calendar year, fiscal year, or most recent 12 months). If you do not have precise numbers readily available, please make your best esti-mate where possible. The period you considered in completing this information was: ____________ to ____________.
Month/year Month/year
9. How many separate petitions for zoning text amend-ments were filed in this period? ______
10. Of these, please estimate how many of the proposed text amendments originated from each of these sources:
____ Local government staff____ Planning board____ Governing board____ Member of public____ Other. Please list: ______________________
11. How many of these text amendments were adopted in this period? ________
How many are still pending? __________
12. How many petitions for zoning map amendments of each of the following types were filed and adopted in this period?
Rezoning to a conventional district: _____ Filed ______ Adopted ______ PendingRezoning to an overlay district: _____ Filed ______ Adopted ______ PendingRezoning to a floating district: _____ Filed ______ Adopted ______ PendingRezoning to conditional use district: _____ Filed ______ Adopted ______ PendingRezoning to conditional district: _____ Filed ______ Adopted ______ Pending
13. What were the three most common land uses for which rezonings of any type were requested in your jurisdiction in this 12-month period?
1. ____________________ Most common2. ____________________ Second most common3. ____________________ Third most common
14. If your jurisdiction uses conditional rezonings or conditional use district rezonings, what were the three most common land uses for which this type of rezoning was requested in your jurisdiction in this 12-month period?
1. ____________________ Most common2. ____________________ Second most common3. ____________________ Third most common4. ____________________ Not applicable

20 Special Series No. 24 | David W. Owens
15. If your jurisdiction uses conditional rezonings or conditional use district rezonings, is there a trend in your jurisdiction towards more or fewer proposed rezonings to receive this type of rezoning?
___ More___ Fewer___ About the same___ No particular trend___ Not applicable
16. Does the staff (either routinely or upon request) provide information other than required forms to persons considering petitioning for zoning map amendments?
___ No___ Yes. If yes, what type of information is provided (check
all that apply): ___ Information about zoning districts, forms, and/
or procedures ___ Information about adopted municipal plans ___ Advice or information about their likelihood of
success, political climate for rezonings, success of similar petitions
___ Advice or information on items council will expect to see addressed, typical conditions imposed on similar projects
___ Information on alternatives to a rezoning ___ Other. Please specify: ____________________ __________________________________ __________________________________
17. Who typically prepares the first draft of the required statement addressing whether a proposed zoning amendment is consistent with the plan, is reasonable, and in the public interest?
____ Petitioner____ Local government planning or zoning staff____ Local government attorney____ Consultant for local government____ Planning board member____ Governing board member____ Other. Please specify: _______________________
18. What is the typical amount of time the decision-making board spends on an individual request for zoning text amend-ment (including the public hearing, debate, and making a decision)?
___ Less than 15 minutes___ 15 to 30 minutes___ 31 to 60 minutes___ More than 60 minutes
19. What is the typical amount of time the decision-making board spends on an individual request for rezoning to a con-ventional zoning district (including the public hearing, debate, and making a decision)?
___ Less than 15 minutes___ 15 to 30 minutes
___ 31 to 60 minutes___ More than 60 minutes
20. What is the typical amount of time the decision-making board spends on an individual request for rezoning to a con-ditional or conditional use district rezoning (including the public hearing, debate, and making a decision)?
___ Less than 15 minutes___ 15 to 30 minutes___ 31 to 60 minutes___ More than 60 minutes___ Not applicable
21. Does the local government staff (including other staff working for the government, such as COG staff or private consultant) make a presentation to the decision-making board regarding rezonings?
___ No___ Yes. If yes, does the presentation include: (Check all
that apply) ___ Factual information regarding the rezoning
petition ___ Information/analysis on relation to adopted
plans ___ Background information about the particular
site involved ___ Information on past similar rezoning requests ___ Video, photographs, or building elevations ___ Site plans ___ Recommendation regarding decision ___ Other. Please specify: ____________________ __________________________________ __________________________________
22. How often does a person other than the petitioner and or city staff member appear at the public hearing on a rezoning?
___ Never___ Rarely___ Occasionally___ Frequently___ Almost Always___ Always
23. How often do attorneys appear on behalf of the peti-tioner for a rezoning?
___ Never___ Rarely___ Occasionally___ Frequently___ Almost Always___ Always

Zoning Amendments in North Carolina 21
24. Does the appearance of an attorney at a rezoning hear-ing to represent the petitioner or opponent affect the outcome of the decision?
___ Reduces chances for success for represented party___ Has no effect on outcome___ Increases chances for success for represented party___ Don’t know
25. Does the appearance of neighbors at the hearing to support a rezoning petition affect the outcome of the decision?
___ Reduces chances of approval___ Has no effect on outcome___ Increases chances of approval___ Don’t know
26. Does the appearance of neighbors at the hearing to oppose a rezoning petition affect the outcome of the decision?
___ Reduces chances of approval___ Has no effect on outcome___ Increases chances of approval___ Don’t know
27. Have any protest petitions objecting to a proposed rezoning been filed in your jurisdiction in this period?
___ Yes___ No
28. If any protest petitions were filed in this period, please provide the numbers for each of the following:
___ Total number of protest petitions filed___ Number determined to be adequate to trigger ¾
supermajority requirement.
29. For those rezonings where an adequate protest petition was filed, what was the result on the vote on the rezoning:
___ Number that did not receive majority vote in favor ___ Number that received a majority in favor but not a ¾
majority in favor___ Number that received a ¾ majority in favor or higher
30. Is there an overall trend in the past five years as to how frequently protest petitions have been filed objecting to zoning amendments?
___ More frequently filed___ Less frequently filed___ About the same over time___ Frequency varies from year to year, but no overall trend
31. How often is a zoning amendment submitted to a second public hearing because the governing board wants to consider a proposal that is substantially different from the amendment submitted to the initial public hearing?
___ Never___ Rarely___ Occasionally___ Frequently___ Almost Always___ Always
32. How often is a member of the planning board excused/abstain from voting on a zoning amendment due to a conflict of interest?
___ Never___ Rarely___ Occasionally___ Frequently___ Almost Always___ Always
33. How often is a member of the governing board excused/abstain from voting on a zoning amendment due to a conflict of interest?
___ Never___ Rarely___ Occasionally___ Frequently___ Almost Always___ Always
34. If staff recommendations are made on rezonings, how often is the governing board’s decision consistent with that recommendation?
___ Never___ Rarely___ Occasionally___ Frequently___ Almost Always___ Always
35. How often is the governing board’s decision on rezon-ings consistent with the planning board’s recommendation?
___ Never___ Rarely___ Occasionally___ Frequently___ Almost Always___ Always
36. How often is the governing board’s decision on rezoning consistent with officially adopted plans?
___ Never___ Rarely___ Occasionally___ Frequently___ Almost Always___ Always
37. In 2005 legislation was adopted that requires statements on plan consistency be approved by the planning board and governing board when acting on any zoning amendment. Has this had an effect on your governing board’s familiarity with the substance of plan provisions?
___ More familiar with the plan___ Less familiar with the plan___ No noticeable impact___ Don’t know

22 Special Series No. 24 | David W. Owens
38. What has been the effect of the 2005 legislative require-ment for statements on plan consistency been on how often a rezoning decision is consistent with adopted plans?
___ More often consistent with plans___ Less often consistent with plans___ No noticeable impact___ Don’t know
39. To what extent does the number and type of rezonings approved by your governing board undercut the purpose and intent of the comprehensive plan and overall zoning scheme?
____ Not at all____ A modest amount____ A significant amount____ Don’t know
40. If a rezoning petition is denied, what are the most common reasons for the denial stated by the governing board (check all that apply)?
____ Plan inconsistency____ Traffic impacts____ Inadequate water and sewer____ Inadequate school capacity____ Inconsistent with surrounding land uses____ Environmental impacts____ Other. Please specify: _______________________ __________________________________ __________________________________
41. What proportion of the total number of rezoning peti-tions considered in your jurisdiction during this period would be considered to be controversial (as opposed to a routine mat-ter that attracts little public interest or concern)?
___ less than 25%___ 25–49% ___ 50–74%___ 75% or more
42. What is the typical period from the time a completed rezoning petition is filed to the time a decision is made?
___ Less than 30 days___ 31 to 60 days___ 61 to 90 days___ 91 to 179 days ___ 180 days or longer
43. Were any of the rezoning decisions made by your board during this 12-month period appealed to superior court?
___ No___ Yes. If so, how many? ___
44. Have there been any superior court decisions during this 12-month period on rezonings that were appealed to court?
___ No___ Yes. If yes, how many court decisions: ___ Upheld the decision ___ Reversed the decision ___ Remanded the case for further action.
If you would like to add any general comments about zoning amendments in your jurisdiction, please do so in the space below.

23
Municipalities
Population < 1,000AlamanceAuroraBald Head IslandBanner ElkBayboroBear GrassBeech MountainBelvilleBogueBunnCandorCastaliaCaswell BeachChimney RockColumbiaComoConwayDillsboroDoverDuckEast LaurinburgEllerbeFalconFalklandFoxfire VillageGreeneversHamiltonHarrellsHayesvilleHighlandsHobgood
HoffmanJacksonLaskerLittletonLucamaMagnoliaMiddlesexMomeyerMorvenNew LondonNewton GroveNorthwestOcean Isle BeachOrientalParktonPeachlandPikevillePowellsvilleRed CrossRoxobelSalemburgSaratogaStarStovallSugar MountainTaylortownTeacheyTopsail BeachTurkeyVassWalnut CreekWashington ParkWhite LakeWhitsett
WinfallWintonWoodland
Population 1,000–9,999
AberdeenAhoskieAndrewsAngierArchdaleAydenBadinBeaufortBelhavenBelwood*Bermuda RunBessemer CityBeulavilleBiltmore ForestBlack MountainBladenboroBlowing RockBoiling Spring LakesBrevardBroadwayBurgawCajah’s MountainCantonCape CarteretCarolina BeachCarthageCherryvilleChina Grove
ClaremontClintonCoatsColumbusConoverCramertonCreedmoorDallasDavidsonDentonDrexelDunnEast SpencerEdenton*ElizabethtownElkinElm CityEmerald IsleErwinFairbluffFairviewFarmvilleFletcherFour OaksFranklinFranklintonGibsonvilleGlen AlpineGranite FallsGreen LevelHamletHarrisburgHaw RiverHertford
HildebranHillsboroughHudsonJamestownKill Devil HillsKingKitty HawkKnightdaleLa GrangeLake WaccamawLandisLaurel ParkLelandLibertyLocustLongviewMadisonMaidenManteoMarionMarshallMarshvilleMarvinMaxtonMebaneMidlandMills RiverMineral SpringsMorehead CityMount OliveMount AiryMurfreesboroMurphyNags Head
Appendix B List of Responding Jurisdictions
*Joint city-county survey response filed.

24 Special Series No. 24 | David W. Owens
NewportNorth WilkesboroNorwoodOak IslandOak RidgeOxfordPilot MountainPine Knoll ShoresPine LevelPinebluffPinevillePittsboroPleasant GardenPlymouthPrincetonRamseurRandlemanRanloRichlandsRiver BendRobersonvilleRockinghamRolesvilleRoseboroRose HillRowlandRoxboroRutherford CollegeRutherfordtonSaint PaulsScotland NeckShallotteSiler CitySouthportSpartaSpencerSpindaleSpruce PineStanfieldStokesdaleSummerfieldSunset BeachSurf CitySwansboroSylvaTabor CityTaylorsvilleTrinityTroutmanTroyTryonUnionvilleValdese
WadesboroWalkertownWallaceWarsawWashingtonWaxhawWaynesvilleWeavervilleWeddingtonWeldonWendellWentworthWesley ChapelWest JeffersonWhitevilleWilkesboroWilliamstonWilson’s MillsWindsorWingateWintervilleWoodfinYadkinvilleZebulon
Population 10,000–24,999AlbemarleAsheboroBooneCarrboroClaytonCorneliusElizabeth CityFuquay-VarinaGarnerGrahamHavelockHendersonvilleIndian TrailKernersvilleKings MountainKinstonLaurinburgLexingtonLincolntonLumbertonMint HillMooresvilleNewtonPinehurstReidsvilleRoanoke Rapids
ShelbySouthern PinesTarboroWake Forest
Population > 25,000 ApexAshevilleBurlingtonCaryChapel HillCharlotte*Durham*FayettevilleGastoniaGoldsboroGreensboroGreenvilleHickoryHigh PointJacksonvilleMatthewsMonroeRaleighRocky MountSalisburySanford*ThomasvilleWilmingtonWinston-Salem*
Counties
Unincorporated Population < 25,000AlleghanyAnsonCamdenCaswellChowan*CurrituckDareEdgecombeHertfordMadisonMontgomeryNorthamptonPasquotankPerquimansPolkScotland
WarrenWashingtonWilson
Unincorporated Population > 25,000AlexanderBladenBrunswickBuncombeBurkeCabarrusCaldwellCarteretCatawbaChathamCleveland*ColumbusCravenCumberlandDavidsonDavieDurham*ForsythFranklinGastonGranvilleGuilfordHalifaxHarnettHendersonHokeIredellJacksonJohnstonLee*LenoirLincolnMcDowellMecklenburg*MooreNashNew HanoverOnslowOrangePenderPersonPittRandolphRichmondRobesonRockinghamRowan
SampsonStanlyStokesSurryUnionWakeWataugaWayneWilkesYadkin
*Joint city-county survey response filed.


CB 3330 Knapp-Sanders BuildingChapel Hill, NC 27599(919) 966-5381www.sog.unc.edu
School of Government
Institute of Government
Master of Public Administration Program
About the Author
David W. Owens is the Gladys H. Coates Distinguished Professor of Public Law and Government at the School of Government, the University of North Carolina at Chapel Hill, where he teaches and advises state and local officials about land use planning and regulation.
Other School of Government Publications
Introduction to ZoningThird edition, 2007 David W. OwensA revised edition, this book provides a clear explanation of zoning law for citizen board members and the public. It serves as both an introduction for citizens new to these issues and a refresher for those who have been involved with zoning for some time. Each chapter deals with a distinct aspect of zoning, such as where a city can apply its ordinance, the process that must be followed in rezoning property, or how an ordinance is enforced. Although North Carolina ordinances and cases are cited, this book is useful to residents of other states who are interested in zoning law.
An Overview of Zoning Districts, Design Standards, and Traditional Neighborhood Design in North Carolina Zoning OrdinancesSpecial Series No. 23, October 2007David W. Owens and Andrew StevensonThis publication summarizes responses to a 2006 survey of North Carolina local governments about the number and type of zoning districts in ordinances, use of design standards, and experiences with traditional neighbor-hood design projects.
Land Use Law in North Carolina2006David W. OwensA legal reference work for those interested in the law related to development regulation in North Carolina, this book builds and expands on the material originally covered in two editions of Legislative Zoning Decisions: Legal Aspects. It addresses various components of local government jurisdiction for development regulation, procedures for adopting and amending ordinances, spot zoning, contract zoning, vested rights, nonconformities, and consti-tutional limits on regulatory authority. New topics covered include quasi-judicial procedures, special and condi-tional use permits, variances, ordinance administration, and enforcement.
Special Use Permits in North Carolina ZoningSpecial Series No. 22, April 2007David W. OwensVirtually all North Carolina cities and counties with zoning use special and conditional use permits to provide flexibility in zoning ordinances and to secure detailed review of individual applications. This publication first examines the law related to the standards for these permits and the process required to make decisions about applications. Based on a comprehensive survey of North Carolina cities and counties, it then discusses how cities and counties have exercised this power.
Inventory of Local Government Land Use Ordinances in North CarolinaSpecial Series No. 21, May 2006David W. Owens and Nathan BranscomeThis report summarizes the responses of North Carolina cities and counties to a survey asking about their adoption of ordinances related to land use. Each local government was asked whether it had adopted zoning, subdivision regulations, housing codes, and a variety of other related regulations. In addition to the summary, the appendix includes two large charts showing the status of ordinance adoption for each county and city that responded to the survey.
ISBN 978-1-56011-582-3 Shop online: www.sog.unc.eduEmail orders to [email protected] or call 919.966.4119