February 2001 February 2001 Globo Cabo Overview Operational Results Financial Performance Growth...
47
February 2001
-
Upload
myron-page -
Category
Documents
-
view
214 -
download
1
Transcript of February 2001 February 2001 Globo Cabo Overview Operational Results Financial Performance Growth...

February2001
February2001

• Globo Cabo Overview
• Operational Results
• Financial Performance
• Growth Opportunities
• Globo Cabo Overview
• Operational Results
• Financial Performance
• Growth Opportunities
TopicsTopics

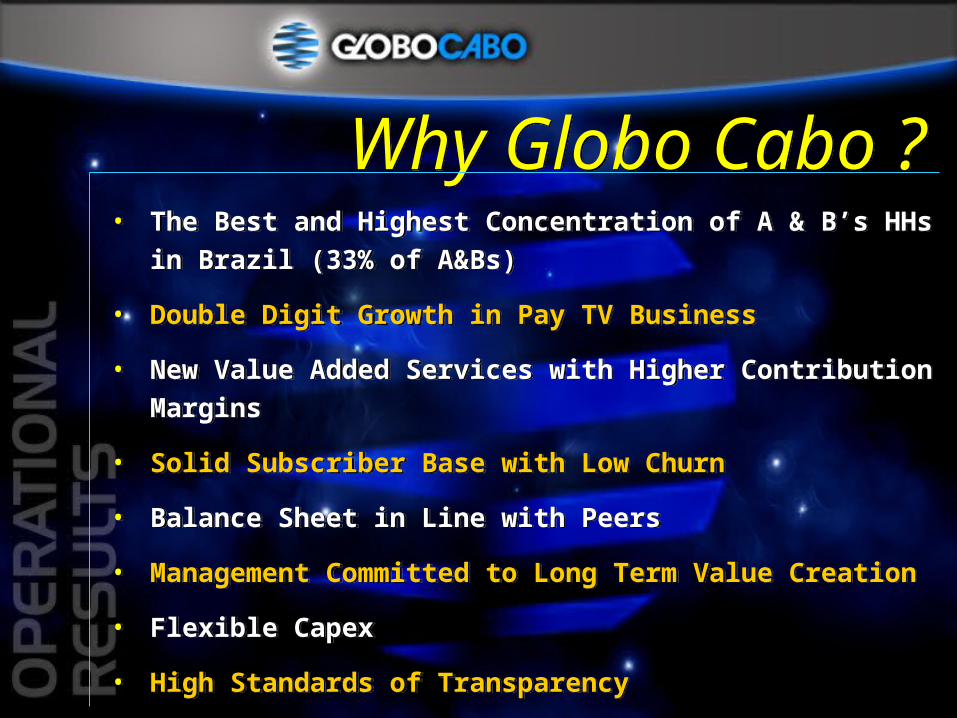
Why Globo Cabo ?Why Globo Cabo ?• The Best and Highest Concentration of A & B’s HHs in
Brazil (33% of A&Bs)
• Double Digit Growth in Pay TV Business
• New Value Added Services with Higher Contribution Margins
• Solid Subscriber Base with Low Churn
• Balance Sheet in Line with Peers
• Management Committed to Long Term Value Creation
• Flexible Capex
• High Standards of Transparency
• The Best and Highest Concentration of A & B’s HHs in Brazil (33% of A&Bs)
• Double Digit Growth in Pay TV Business
• New Value Added Services with Higher Contribution Margins
• Solid Subscriber Base with Low Churn
• Balance Sheet in Line with Peers
• Management Committed to Long Term Value Creation
• Flexible Capex
• High Standards of Transparency
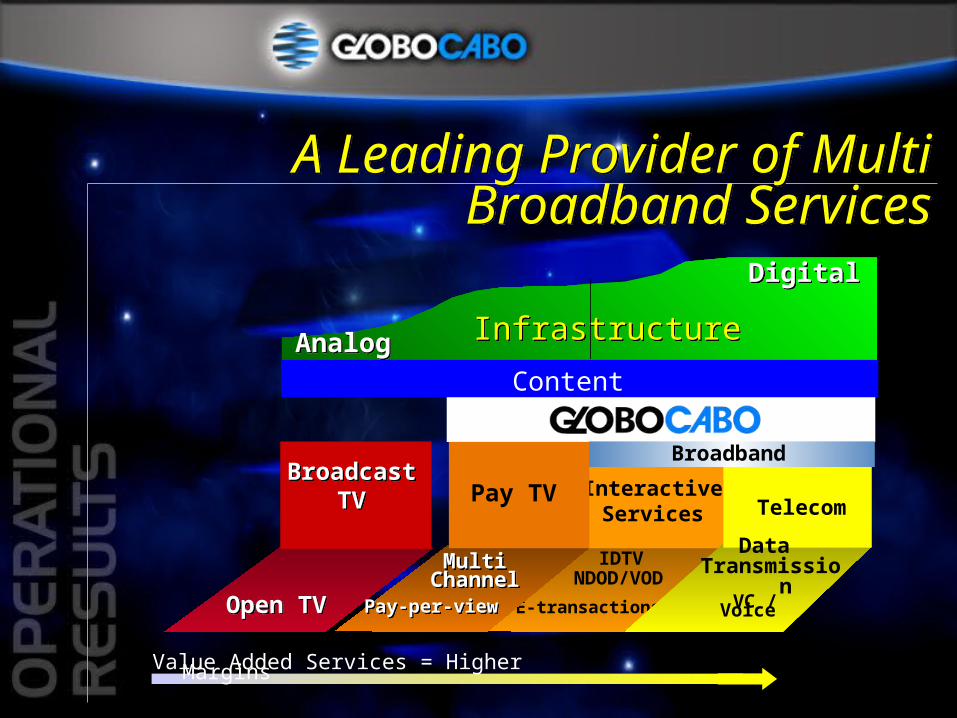
NDOD/VOD
E-transactions
Interactive Services
IDTV
Open TV
Open TV
Broadcast
TV
Broadcast
TV
InfrastructureInfrastructureAnalogAnalog
DigitalDigital
Value Added Services = Higher Margins
Pay TV
Pay-per-viewPay-per-view
MultiChannel
MultiChannel
VC / Voice
Telecom
Data Transmissio
n
Broadband
Content
A Leading Provider of Multi Broadband Services
A Leading Provider of Multi Broadband Services
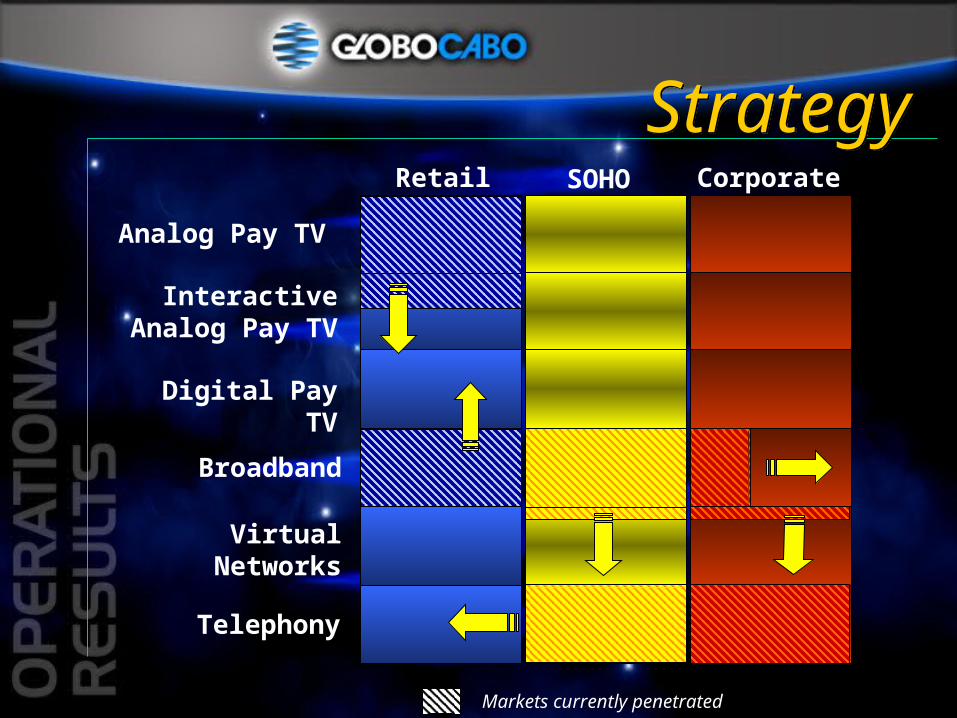
StrategyStrategyCorporateRetail SOHO
Analog Pay TV
Interactive Analog Pay TV
Digital Pay TV
Broadband
Virtual Networks
Telephony
Markets currently penetrated

Unique Distribution Platform in Latin AmericaUnique Distribution Platform in Latin America34,000 + Km. high qualitycable network. More than6MM homes passed
Present at 67 cities including the
main metropolitan areas
Combined company creates
a quasi-nationwide platform
Franchise areas cover 10 million homes
34,000 + Km. high qualitycable network. More than6MM homes passed
Present at 67 cities including the
main metropolitan areas
Combined company creates
a quasi-nationwide platform
Franchise areas cover 10 million homes
The operations addressover 45% of
Brazilian GDP
NorthMidwestNortheastSoutheastSouth

Market ShareMarket Share
Globo Cabo
58%
Market Shareper TechnologyMarket Share
per Technology
KU Band37%
KU Band37%
MMDS10%
MMDS10%
C Band1%
C Band1%
Market ShareMSOs
Market ShareMSOs
Globo Cabo45%
NetSat16%
NetSat16%
DirecTV13%
DirecTV13%
TVA10%TVA10%
Independ.9%
Independ.9%
Canbrás4%
Canbrás4% TVFilme
3%TVFilme
3%Outras0.4%
Outras0.4%
Cable
52%

Cable TV Subscribers(1.8MM)
Cable TV Subscribers(1.8MM)
Market ShareMarket Share
Globo Cabo80%
TVA6%TVA6%
Algar2%
Algar2%
Others4%
Others4%TVA Sul
2%TVA Sul
2%
Canbrás6%
Canbrás6%

• Exclusive Brazilian programming• Exclusive Brazilian programming
Exclusive ContentExclusive Content
• Access to prime sport events• Access to prime sport events- Soccer: World Cup & Regional Soccer- Formula One- Olympic Games- World Championship Volleyball
- Soccer: World Cup & Regional Soccer- Formula One- Olympic Games- World Championship Volleyball
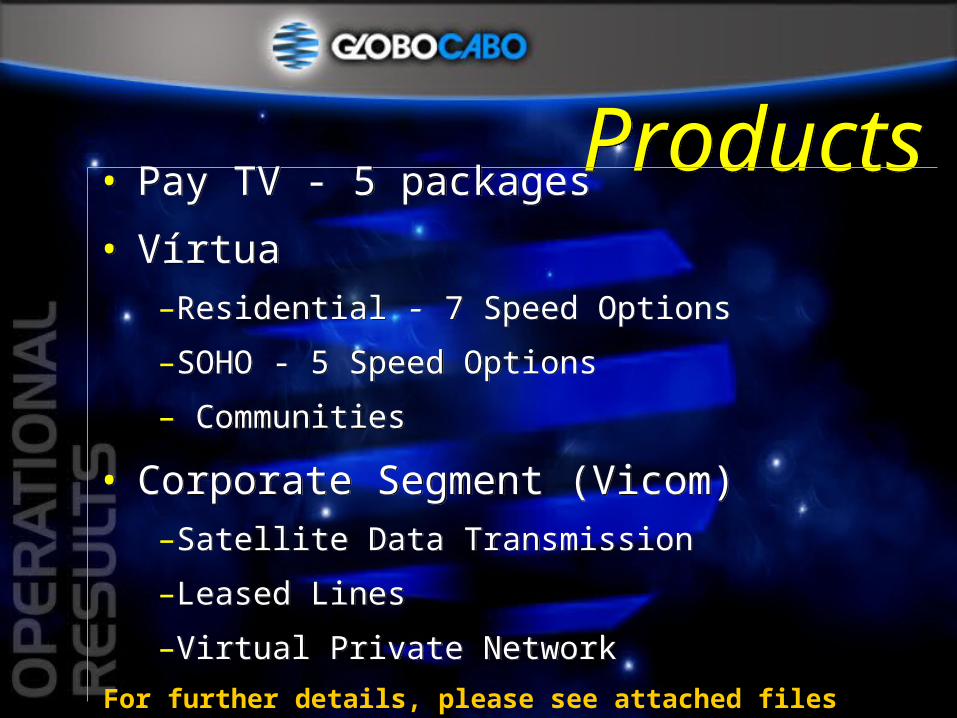
ProductsProducts• Pay TV - 5 packages
• Vírtua –Residential - 7 Speed Options
–SOHO - 5 Speed Options
– Communities
• Corporate Segment (Vicom)–Satellite Data Transmission
–Leased Lines
–Virtual Private Network
• Pay TV - 5 packages
• Vírtua –Residential - 7 Speed Options
–SOHO - 5 Speed Options
– Communities
• Corporate Segment (Vicom)–Satellite Data Transmission
–Leased Lines
–Virtual Private Network
For further details, please see attached files
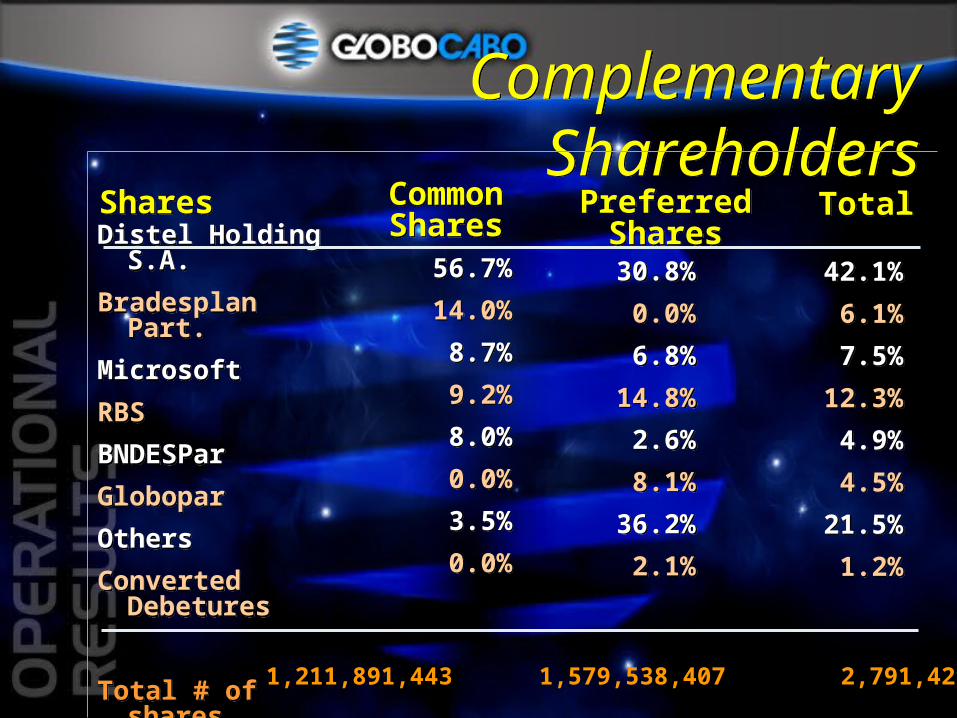
TotalTotalCommonShares
CommonShares
PreferredShares
PreferredSharesDistel Holding
S.A.
Bradesplan Part.
Microsoft
RBS
BNDESPar
Globopar
Others
Converted Debetures
Total # of shares
Distel Holding S.A.
Bradesplan Part.
Microsoft
RBS
BNDESPar
Globopar
Others
Converted Debetures
Total # of shares
56.7%
14.0%
8.7%
9.2%
8.0%
0.0%
3.5%
0.0%
56.7%
14.0%
8.7%
9.2%
8.0%
0.0%
3.5%
0.0%
SharesShares
Complementary Shareholders
Complementary Shareholders
30.8%
0.0%
6.8%
14.8%
2.6%
8.1%
36.2%
2.1%
30.8%
0.0%
6.8%
14.8%
2.6%
8.1%
36.2%
2.1%
42.1%
6.1%
7.5%
12.3%
4.9%
4.5%
21.5%
1.2%
42.1%
6.1%
7.5%
12.3%
4.9%
4.5%
21.5%
1.2%
1,211,891,443 1,579,538,407 2,791,429, 850


Subscriber Base: Dec.97
Additions: Jan.98 - Dec.99
Disconnections: Jan.98 - Dec.99
Subscriber Base: Dec.99
1,132
390
509
1,013
* excluding Net Sul
Subscriber Evolution X Churn (in
Thousand) *Subscriber Evolution X Churn (in
Thousand) *

Globo Cabo SubscribersGlobo Cabo Subscribers
Excluding Net Sul and UnicaboExcluding Net Sul and Unicabo
Annualized Organic GrowthAnnualized Organic Growth
Globo Cabo SubscribersGlobo Cabo Subscribers
Annualized Overall GrowthAnnualized Overall Growth
Subscribers GrowthSubscribers Growth
Including Net Sul and UnicaboIncluding Net Sul and Unicabo
1Q001Q00 2Q002Q00 3Q003Q00 4Q004Q00
949949 965 1,0081,008 1,0451,045
5.7%5.7% 7.1% 19.1%19.1% 15.1%15.1%
1,3481,348 1,416 1,4681,468 1,5051,505
4.9%4.9% 21.7% 15.5%15.5% 10.4%10.4%

Subscribers Mix and ARPUSubscribers Mix and ARPU
47,6 49,3 49,3 48,7 48,9
30,4 27,0 24,3 22,7
17,6 19,9 20,4 21,5 23,4
34,3
5,03,00,70,40,62,52,6
4Q99 1Q00 2Q00 3Q00 4Q00
Advanced Plus Master Standard Others
29.2
33.5 33.9 34.8

ARPU (Total)*ARPU (Total)*
Globo CaboGlobo Cabo 4141
Globo Cabo +Net Sul Globo Cabo +Net Sul
4141
Latin AmericaLatin America
4646USAUSA
3131UKUK
1111
2828
GermanyGermany
ARPU(Monthly Fee)
ARPU(Monthly Fee)
3535
3030
2525
4545
1010
ARPU - ComparisonARPU - Comparison
3636
Source: Company reports (US GAAP)
3Q00 in US$
3Q00 in US$
* Includes Hook-up fee, PPV and other revenues

Churn Rate(Quarterly annualized)Churn Rate(Quarterly annualized)
Consolidated Globocabo
17,7%15,4%14,7%15,9%
24,9%21,6%
15,4%12,4%
18,1%15,3%15,4%16,6%
27,1%31,5%
17,2%
12,2%
1Q99 2Q99 3Q99 4Q99 1Q00 2Q00 3Q00 4Q00

22,1%
16,1%
27,8%
29,50%
18,20%
15,40%
0,0%
5,0%
10,0%
15,0%
20,0%
25,0%
30,0%
35,0%
Annual Churn Rate (Pro Forma) Annual Churn Rate (Pro Forma)
1998 1999 2000
Consolidated Globo Cabo (excl.Unicabo and Net Sul)

Broadband StrategyBroadband Strategy•Over 2.4 MM Homes adequated by Dec’00
•A&B’s HPs in major cities
•Segmenting into Residential, SOHO and Corporate
•Differentiate pricing according to bandwith usage and speed
•Strengthen commercial partnerships with major portals
•Build intranet
•Continue developing community concept (eg. Fleury, Bandeirantes School)

Two Way Homes Passed(in thousands)
Vírtua - EvolutionVírtua - Evolution
280
1Q00
568
2Q00
1,113
3Q00
1,068
1Q00
8,929
2Q00
14,792
3Q00
Subscribers
2,390
4Q00 4Q00
28,136

Virtua: Developing CommunitiesVirtua: Developing Communities• Bandeirantes School• Bandeirantes School
• McDonald´s• McDonald´s
• Xerox
• Fleury Laboratory• Fleury Laboratory
• Kodak
• BankBoston
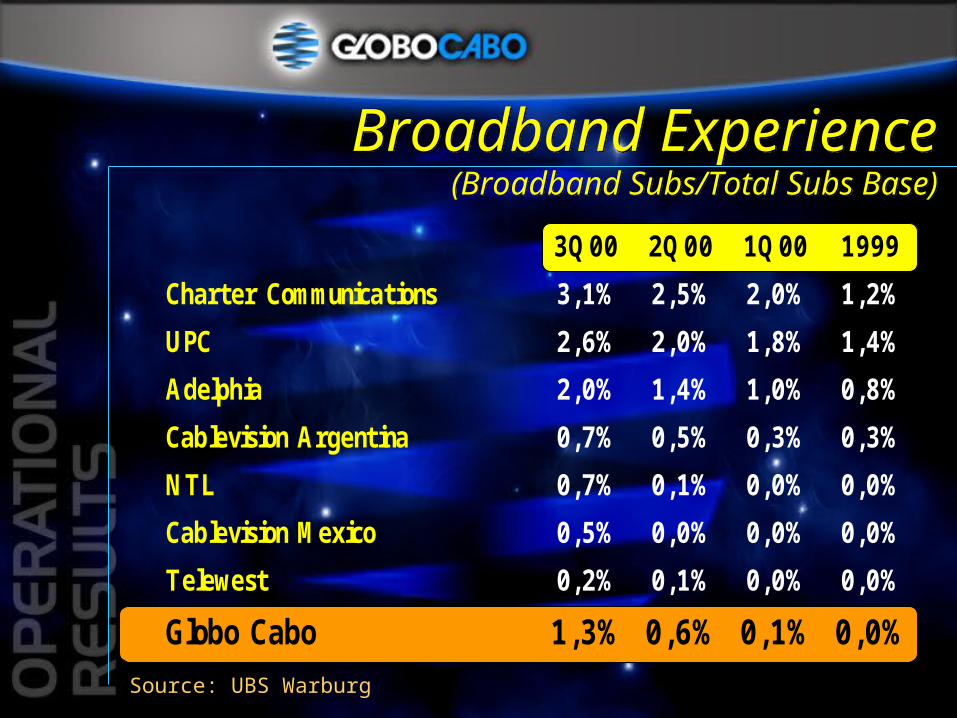
Broadband Experience(Broadband Subs/Total Subs Base)
Broadband Experience(Broadband Subs/Total Subs Base)
3Q00 2Q00 1Q00 1999
Charter Communications 3,1% 2,5% 2,0% 1,2%
UPC 2,6% 2,0% 1,8% 1,4%
Adelphia 2,0% 1,4% 1,0% 0,8%
Cablevision Argentina 0,7% 0,5% 0,3% 0,3%
NTL 0,7% 0,1% 0,0% 0,0%
Cablevision Mexico 0,5% 0,0% 0,0% 0,0%
Telewest 0,2% 0,1% 0,0% 0,0%
Globo Cabo 1,3% 0,6% 0,1% 0,0%
Source: UBS Warburg


3Q003Q00 9M999M99Net RevenueNet Revenue 153.8153.8 374.7374.7
EBITDA EBITDA 37.437.4 101.0101.0
EBITDA margin %EBITDA margin % 24.3%24.3% 27.0%27.0%
Depreciation& AmortizationDepreciation& Amortization
(61.0)(61.0) (177.4)(177.4)
Net InterestExpensesNet InterestExpenses
(51.9)(51.9) (322.9)(322.9)
Income (loss)Income (loss) (72.5)(72.5) (392.5)(392.5)
3Q993Q99123.1123.1
34.934.9
28.4%28.4%
(58.1)(58.1)
(84.3)(84.3)
(104.1)(104.1)
9M009M00430.4430.4
93.693.6
21.7%21.7%
(153.7)(153.7)
(93.1)(93.1)
(153.1)(153.1)
Key Indicators - US GAAPKey Indicators - US GAAP
Consol. (US$ million)

3Q993Q99 2Q002Q00
Net RevenueNet Revenue 100%100% 100%100%
Direct OperatingDirect Operating 48.7%48.7% 49.5%49.5%
Programmers and royalties. . . . . .Programmers and royalties. . . . . . 28.7%28.7% 30.6%
30.6%Network expenses . . . . . . . . . . . . . Network expenses . . . . . . . . . . . . . 5.2%5.2% 4.4%4.4%
Customers relations. . . . . . . . . . . . Customers relations. . . . . . . . . . . . 2.3%2.3% 2.6%2.6%Payroll and benefits . . . . . . . . . . . .Payroll and benefits . . . . . . . . . . . . 6.1%6.1% 6.5%6.5%Other costs (third parties). . . . . . .Other costs (third parties). . . . . . . 6.4%6.4% 5.4%5.4%
Selling/ AdministrativeSelling/ Administrative 22,9%22,9% 27.7%27.7%Selling . . . . . . . . . . . . . . . . . . . . . . .Selling . . . . . . . . . . . . . . . . . . . . . . . 4.3%4.3% 7.6%7.6%General & Administrative . . . . . . .General & Administrative . . . . . . . 16.6%16.6% 16.0%16.0%Bad debt expense. . . . . . . . . . . . . .Bad debt expense. . . . . . . . . . . . . . 0.8%0.8% 1.6%1.6%
Other . . . . . . . . . . . . . . . . . . . . . . . .Other . . . . . . . . . . . . . . . . . . . . . . . . 1.2%1.2% 2.5%2.5%
EBITDAEBITDA 28.4%28.4% 22.8%22.8%
EBITDA CompositionEBITDA CompositionUS GAAPUS GAAP
3Q003Q00
100%100%
48.7%48.7%
28.6%28.6%4.9%4.9%2.6%2.6%6.4%6.4%6.2%6.2%
27.0%27.0%8.7%8.7%
17.0%17.0%1.8%1.8%
-0.5%-0.5%
24.3%24.3%

3Q993Q99 3Q003Q00
Short Term DebtShort Term Debt 437.1437.1 188.9188.9Commercial loans . . . . . . . . . . . . . . . . . . . . . Commercial loans . . . . . . . . . . . . . . . . . . . . . 178178 86.686.6Current portion of long-term debt. . . . . . . .Current portion of long-term debt. . . . . . . .258.9258.9 102.4102.4
Long Term DebtLong Term Debt 337337 597.5597.5
Total DebtTotal Debt
764.1764.1
786.4786.4
Net DebtNet Debt
774.1774.1
658.3658.3
100.4100.4 37.8
37.8(258.9)(258.9) (102.4)(102.4)
Globo Cabo Debt Structure
Globo Cabo Debt Structure
US GAAPUS GAAP
Senior Guaranteed Notes - 2004. . . . . . . . . Senior Guaranteed Notes - 2004. . . . . . . . . 185185 185185Net Sul Notes. . . . . . . . . . . . . . . . . . . . . . . . . Net Sul Notes. . . . . . . . . . . . . . . . . . . . . . . . . BNDES (R$-denom.) . . . . . . . . . . . . . . . . . . . BNDES (R$-denom.) . . . . . . . . . . . . . . . . . . .
808091.991.9
808084.884.8
Convertible Debentures 2006. . . . . . . . . . . Convertible Debentures 2006. . . . . . . . . . . 00 212.1212.1Others . . . . . . . . . . . . . . . . . . . . . . . . . . . . . . Others . . . . . . . . . . . . . . . . . . . . . . . . . . . . . . Current portion of LT debt . . . . . . . . . . . . . . Current portion of LT debt . . . . . . . . . . . . . .
Cash . . . . . . . . . . . . . . . . . . . . . . . . . . . . . . . . Cash . . . . . . . . . . . . . . . . . . . . . . . . . . . . . . . . 128.1128.110.110.1
Consol. (US$ million)
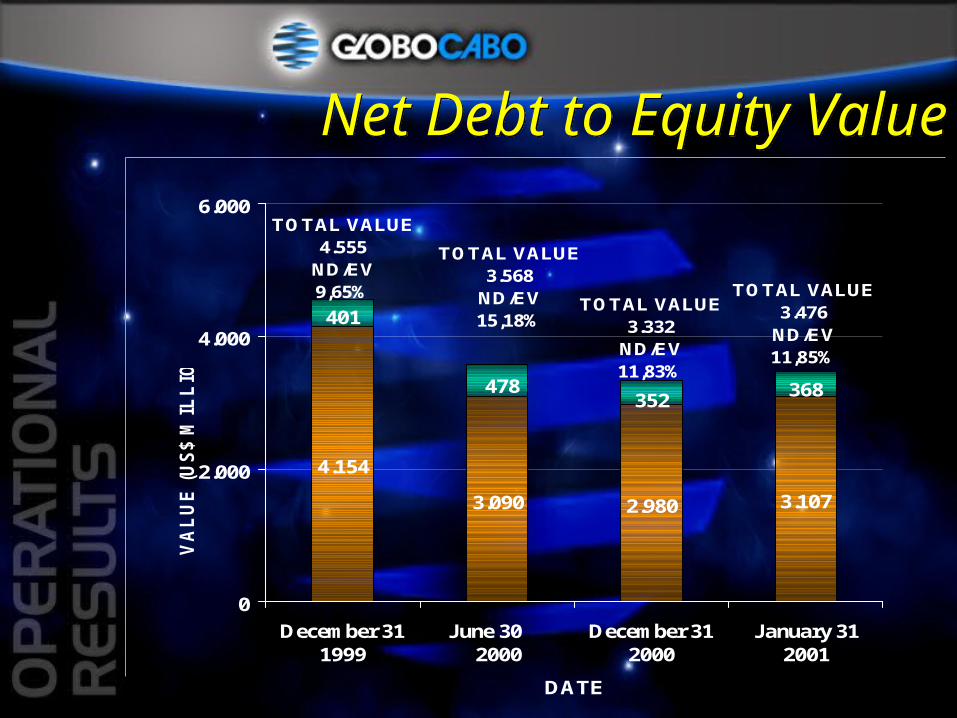
4.154
3.090 2.980 3.107
368352
478
401
0
2.000
4.000
6.000
December 311999
June 30 2000
December 312000
January 312001
DATE
VA
LU
E (
US
$ M
ILL
ION
)
TOTAL VALUE4.555
ND/EV9,65%
TOTAL VALUE3.568
ND/EV15,18%
TOTAL VALUE3.332
ND/EV11,83%
TOTAL VALUE3.476
ND/EV11,85%
Net Debt to Equity ValueNet Debt to Equity Value

Debt/Subs.Debt/Subs.
Globo CaboGlobo Cabo
2,1382,138Cablevision (NY)Cablevision (NY)
1,9231,923 3,4033,403
Comcast (Center/East Coast)Comcast (Center/East Coast)
703703
3,3423,342Cox (West Coast) Cox (West Coast) 1,2831,283
3,8423,842
3,9043,904
Debt/EBITDADebt/
EBITDA
1,5401,5405.95.9
5.95.9
7.87.8
6.36.3
Debt - Comparable TableDebt - Comparable Table
Europe IndustryEurope Industry
Argentine IndustryArgentine Industry
FV/Subs.FV/
Subs.
8.48.4
5.35.3
Source: companies´annual reports (US GAAP)
535535 2,3722,372
3Q00 - in US$
3Q00 - in US$

Pro-formaPro-forma
20002000 20012001 20022002 20032003 20042004 20052005 20062006
74
1010
64
77
185
84
NotesNotesConvertible debenturesConvertible debentures
* Includes Vicom and Net Sul* Includes Vicom and Net Sul
4840
FRNs-Net SulFRNs-Net Sul
Total debt: US$ 786.4 MMTotal debt: US$ 786.4 MM
Amortization Schedule*
Amortization Schedule*
74 64 8555
3932
Trade FinancingTrade Financing
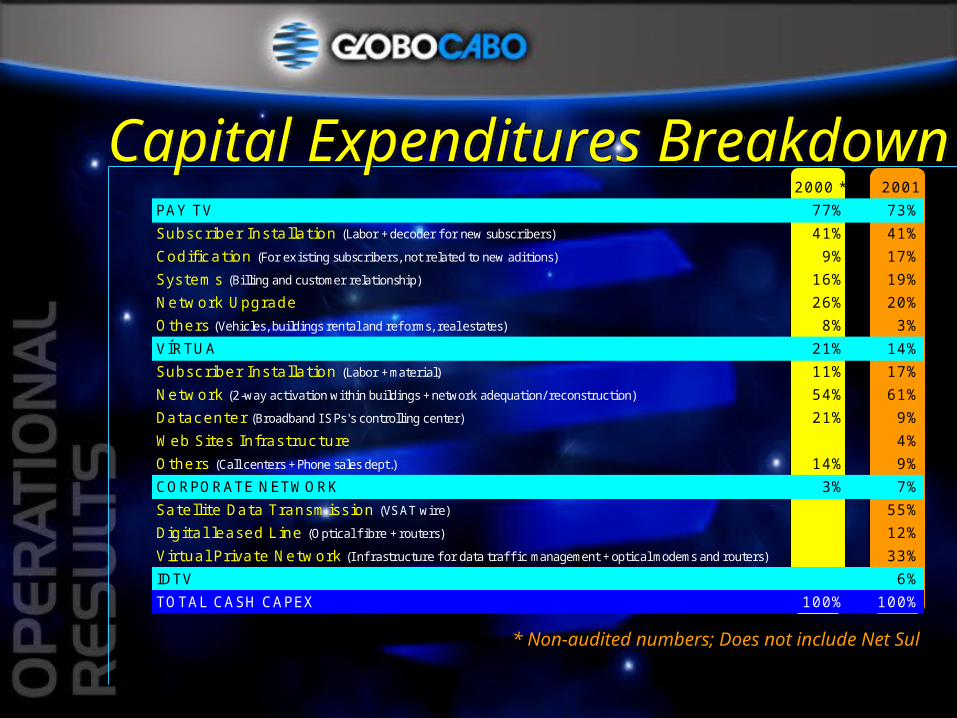
Capital Expenditures BreakdownCapital Expenditures Breakdown
* Non-audited numbers; Does not include Net Sul
2000 * 2001
PAY TV 77% 73%
Subsc riber Installation (Labor + decoder f or new subscribers) 41% 41%
Codification (For existing subscribers, not related to new aditions) 9% 17%
Systems (Billing and customer relationship) 16% 19%
Network Upgrade 26% 20%
Others (Vehicles, buildings rental and ref orms, real estates) 8% 3%
VÍRTUA 21% 14%
Subsc riber Installation (Labor + material) 11% 17%
Network (2-way activation within buildings + network adequation/ reconstruction) 54% 61%
Datacenter (Broadband I SPs's controlling center) 21% 9%
Web Sites Infrastruc ture 4%
Others (Call centers + Phone sales dept.) 14% 9%
CORPORATE NETWORK 3% 7%
Satellite Data Transmission (VSAT wire) 55%
Digital leased L ine (Optical fi bre + routers) 12%
Virtual Private Network (I nf rastructure f or data traffi c management + optical modems and routers) 33%
IDTV 6%
TOTAL CASH CAPEX 100% 100%

• Minimum Cash levels: US$ 50MM in 2001-2003
• Stretch Short term obligations
• Fifty percent of debt obligations in local currency
· Debt/Cash Flow 5.0 and EBTIDA/Int Expenses 2
in 2003
• Hedge Short term obligations
• Keep EVA positive growth trend
• Work to minimize potential equity overhang
• Improve transparency levels
Financial ObjectivesFinancial Objectives


Num
ber
of
subsc
ribers
(in
mill
ions) 4.7104.710
4.217 4.2173.7103.710
3.378 3.378
6.4806.480
5.498 5.498
20002000 20012001 20022002 20032003 20042004 20052005
SatelliteMMDSCable TV
SatelliteMMDSCable TV
Projected Subscriber Cable TV Growth
Projected Subscriber Cable TV Growth
Source: Pay TV Survey nº 39 Source: Pay TV Survey nº 39
2017 2164
36803115
26522409
1999Total: 2.973
Cable TV: 1.754
7.3%
11.3%
10.1%
17.5%
18.1%
(1999-2005 annual CAGR: 13.2%) (Based on a GDP CAGR = 2%)

Total franchise covers 10 million homesTotal franchise covers 10 million homes
A
B
C
Others
Total
A
B
C
Others
Total
SegmentsSegments
967
2,262
1,833
1,081
6,143
967
2,262
1,833
1,081
6,143
HPs(000)HPs
(000)
15.8
36.8
29.8
17.6
100
15.8
36.8
29.8
17.6
100
%%
625
677
138
28
1,468
625
677
138
28
1,468
Subs.(000)Subs.(000)
42.6
46.1
9.4
1.9
100
42.6
46.1
9.4
1.9
100
65
30
8
3
23.9
65
30
8
3
23.9
Penetr.(%)
Penetr.(%)
755
1,282
323
40
2,400
755
1,282
323
40
2,400
Subs.(000)Subs.(000)
31.4
53.4
13.5
1.7
100
31.4
53.4
13.5
1.7
100
78
57
18
4
39.1
78
57
18
4
39.1
%%Penetr
%.Penetr
%.%%
Sep/2000Sep/2000 TargetTarget
Hypothetical Growth Targets
Hypothetical Growth Targets

Multiproducts Broadband Penetration Targets
Multiproducts Broadband Penetration Targets
Multiproducts ARPUOptions (US$)
Multiproducts ARPUOptions (US$)
Pay TV Standard Package
Pay TV Master Package
87
71
42
25
14
All Multiproducts Package
All Multiproducts Package excluding Voice IP / Others
Pay TV Digital Package
65%
20%
15%
-
-
35%
65%
-
-
- -
-
-
-
100%
20002000
32
32
0
32
32
0
ARPU (US$)ARPU (US$)
Pay TV Digital
BroadBand Related
Voice IP/Others
Pay TV Digital
BroadBand Related
Voice IP/Others
42
29
16
42
29
16
TargetTargetARPU(US$)ARPU(US$)
Pay TV Analog
BroadBand Related
Others
Pay TV Analog
BroadBand Related
Others
Segment ASegment A Segment CSegment CSegment BSegment B
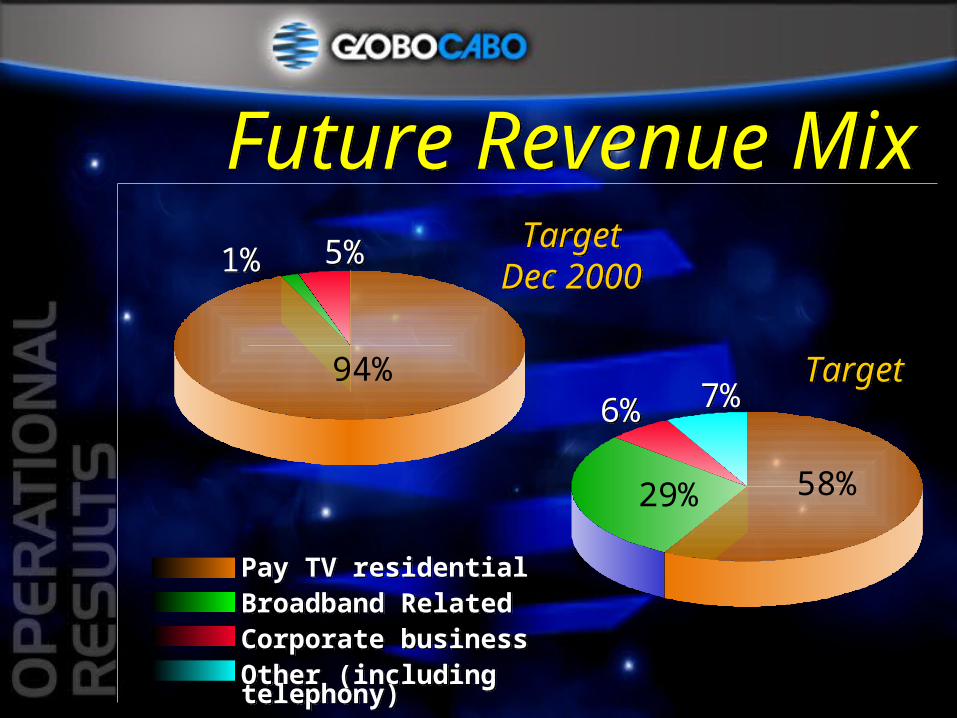
Pay TV residentialBroadband RelatedCorporate businessOther (including telephony)
Pay TV residentialBroadband RelatedCorporate businessOther (including telephony)
TargetDec 2000
TargetDec 2000
TargetTarget94%
1%1% 5%5%
58%29%
6%6% 7%7%
Future Revenue MixFuture Revenue Mix

Interactivity: New Feature Being Introduced By Q2/01Interactivity: New Feature
Being Introduced By Q2/01• Globosat developing exclusive, interactive contents
• Globosat developing exclusive, interactive contents
- Phase I - analogic- Phase II - digital- Phase I - analogic- Phase II - digital
• 50% of decoders (GI, Scientific Atlantic) already allow for interactivity• 50% of decoders (GI, Scientific Atlantic) already allow for interactivity
- Olympic Games / Free Jazz Festival / Davis Cup- Ability to choose different programs- E-commerce (eg. buy products from soccer team)
- Olympic Games / Free Jazz Festival / Davis Cup- Ability to choose different programs- E-commerce (eg. buy products from soccer team)

• Based on achievement of operational
and financial goals - EBITDA - # of new services subs
- # of Subs - Customer satisfaction
• Based on achievement of operational
and financial goals - EBITDA - # of new services subs
- # of Subs - Customer satisfaction
Pacto - Annual Bonus Program
Pacto - Annual Bonus Program
Mngt Commitment/Compensation
Mngt Commitment/Compensation
Bravo - Long Term Incentive Plan
Bravo - Long Term Incentive Plan
• Based on stock value appreciation• Based on stock value appreciation
- “phantom stocks” - 3 year vesting period- “phantom stocks” - 3 year vesting period
Pacto/Bravo represent up to 50% of total compensation Pacto/Bravo represent up to 50% of total compensation

www.globocabo.comwww.globocabo.com
Leonardo PereiraLeonardo Pereira
Augusto RochaAugusto Rocha
Renato Pinto CoelhoRenato Pinto Coelho
[email protected]@globocabo.com.br
[email protected]@globocabo.com.br
[email protected]@globocabo.com.br
Contacts - Additional Informations
Contacts - Additional Informations

• Some information in this presentation discuss our indicative targets for the breakdown between our various lines of business, type and number of subscribers and penetration rates. This information is provided only to explain how we wish to expand our business, and we are making no projections as to our ability to meet these targets.
• Some information in this presentation discuss our indicative targets for the breakdown between our various lines of business, type and number of subscribers and penetration rates. This information is provided only to explain how we wish to expand our business, and we are making no projections as to our ability to meet these targets.
Forward-Looking Statements
Forward-Looking Statements
• These targets constitute forward looking statements. Many factors could cause our actual results to differ materially from these targets, including economic and political factors in Brazil, the development of competing technologies, our access to the capital needed to meet these targets and the emergence of rigorous competition in our key markets.
• These targets constitute forward looking statements. Many factors could cause our actual results to differ materially from these targets, including economic and political factors in Brazil, the development of competing technologies, our access to the capital needed to meet these targets and the emergence of rigorous competition in our key markets.


Attachments

Products Pay TVProducts Pay TV
Pay per view - 3 channels- shows, football plays, fights and movies. Channels “a la carte”- SexyHot, Playboy and PSN
PackagePackage ChannelsChannels Installation*Installation* Monthly feeMonthly fee
AdvancedAdvanced 6565 R$ 150,00R$ 150,00 R$ 76,90R$ 76,90
PlusPlus 5050 R$ 76,89R$ 76,89
MasterMaster 4545 R$ 100,00R$ 100,00 R$ 56,90R$ 56,90
StandardStandard 3030 R$ 40,00R$ 40,00 R$ 28,90R$ 28,90
Vírtua TVVírtua TV 2020 No feesNo fees R$ 12,33R$ 12,33
* Prices for automated bill paying option
Not marketed
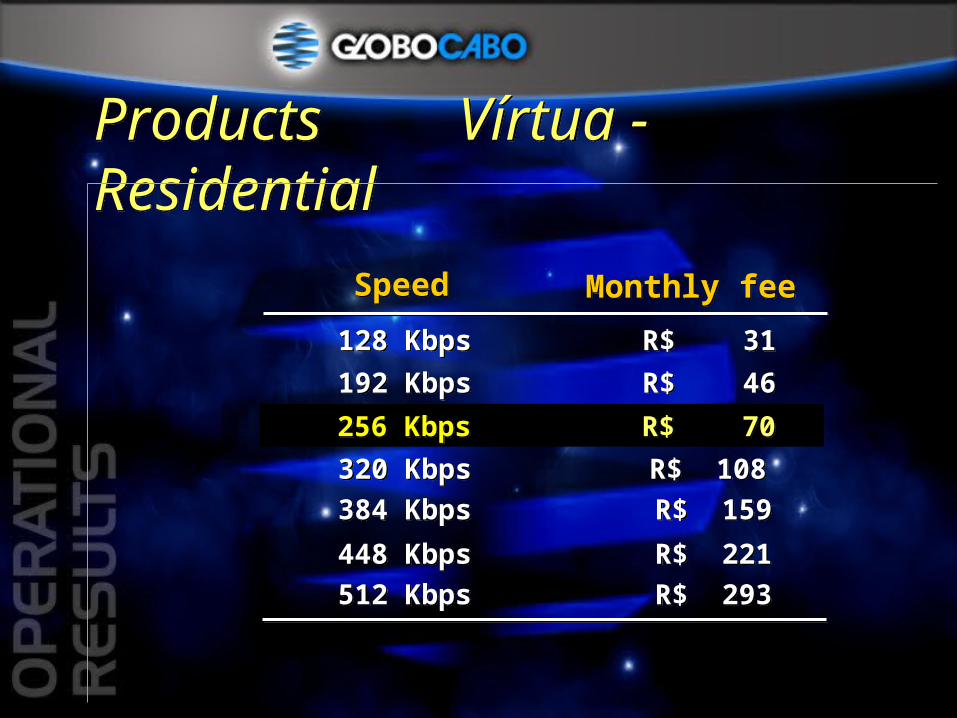
SpeedSpeed Monthly feeMonthly fee
128 Kbps128 Kbps R$ 31R$ 31
192 Kbps192 Kbps R$ 46R$ 46
320 Kbps320 Kbps R$ 108R$ 108
384 Kbps384 Kbps R$ 159R$ 159
448 Kbps448 Kbps R$ 221R$ 221
512 Kbps512 Kbps R$ 293R$ 293
Products Vírtua - ResidentialProducts Vírtua - Residential
256 Kbps256 Kbps R$ 70R$ 70

Products Vírtua - SOHO
Products Vírtua - SOHO
Virtua ProfessionalVirtua Professional
Virtua EnterpriseVirtua EnterpriseSpeed Traffic Monthly fee
320 Kbps 5 GB R$ 240384 Kbps 10 GB R$ 399448 Kbps 15 GB R$ 499512 Kbps 25 GB R$ 599
Speed Traffic Monthly fee
64 to 256 Kbps64 to 256 Kbps 3 GB R$ 145
Installation: R$ 279Equipment: R$ 299 (loyalty promotion) or R$ 599 cash

Corporate Division
Corporate Division(Vicom
)(Vicom
)Data Transmission
Satellite
Digital Radio
Urban and Interurban Fiber Optic Rings
IP Cable Modem Networks
Technical Support and Network Management
Consulting in Telecommunications
ProductsProducts