FEB Market Performance
12
RSPO Roundtable on Sustainable Palm Oil Table 1 : Key Statistics for Certification, Area (hectarage), APC, Sales & Uptake 2008 2009 2010 2011 2012 2013 No of SCC Companies n/a n/a n/a 114 214 236 No of SCC Facilities n/a n/a n/a 283 547 612 No of Growers Certified 5 10 19 29 43 43 No of Palm Oil Mills Certified 16 34 77 135 188 196 Area (hectarage) Production Area (ha) 106384 264952 644816 1130969 1526273 1724047 Certified Area (ha) 125288 304421 718080 1299891 2105433 2198252 CSPO (mt) 163364 1357511 2773567 4798512 8184200 8174115 CSPK (mt) 41811 321322 640316 1111998 1896702 1973403 Sales CSPO Sales through SG,MB n/a 98044 438515 831010 984138 189699 CSPO Sales through B&C 4452 245813 842619 1659516 2495277 193593 Total CSPO Sales 4452 343857 1281134 2490526 3479415 383292 Uptake CSPO Sales / Supply (mt) 2.7% 25.3% 46.2% 51.9% 51.7% As at February 2013 Annual Production Capacity Certification (Accumulated)
-
Upload
nurul-hanis -
Category
Documents
-
view
216 -
download
0
description
Market performance
Transcript of FEB Market Performance

RSPO Roundtable on Sustainable Palm Oil
Table 1 : Key Statistics for Certification, Area (hectarage), APC, Sales & Uptake
2008 2009 2010 2011 2012 2013
No of SCC Companies n/a n/a n/a 114 214 236
No of SCC Facilities n/a n/a n/a 283 547 612
No of Growers Certified 5 10 19 29 43 43
No of Palm Oil Mills Certified 16 34 77 135 188 196
Area (hectarage) Production Area (ha) 106384 264952 644816 1130969 1526273 1724047
Certified Area (ha) 125288 304421 718080 1299891 2105433 2198252
CSPO (mt) 163364 1357511 2773567 4798512 8184200 8174115
CSPK (mt) 41811 321322 640316 1111998 1896702 1973403
Sales CSPO Sales through SG,MB n/a 98044 438515 831010 984138 189699
CSPO Sales through B&C 4452 245813 842619 1659516 2495277 193593
Total CSPO Sales 4452 343857 1281134 2490526 3479415 383292
Uptake CSPO Sales / Supply (mt) 2.7% 25.3% 46.2% 51.9% 51.7%
As at February 2013
Annual
Production
Capacity
Certification
(Accumulated)

RSPO Roundtable on Sustainable Palm Oil
C1. Production Area (ha) by Year

RSPO Roundtable on Sustainable Palm Oil
C2. Production Area (ha, %) by Country

RSPO Roundtable on Sustainable Palm Oil
C3. CSPO & CSPK Supply (mt) by Year

RSPO Roundtable on Sustainable Palm Oil
C4. CSPO & CSPK Supply (mt) by Year

RSPO Roundtable on Sustainable Palm Oil
C5. CSPO Sales (mt) via SG/MB, B&C
(mt)

RSPO Roundtable on Sustainable Palm Oil
C6. CSPO Uptake (%) by Year
RSPO Roundtable on Sustainable Palm Oil
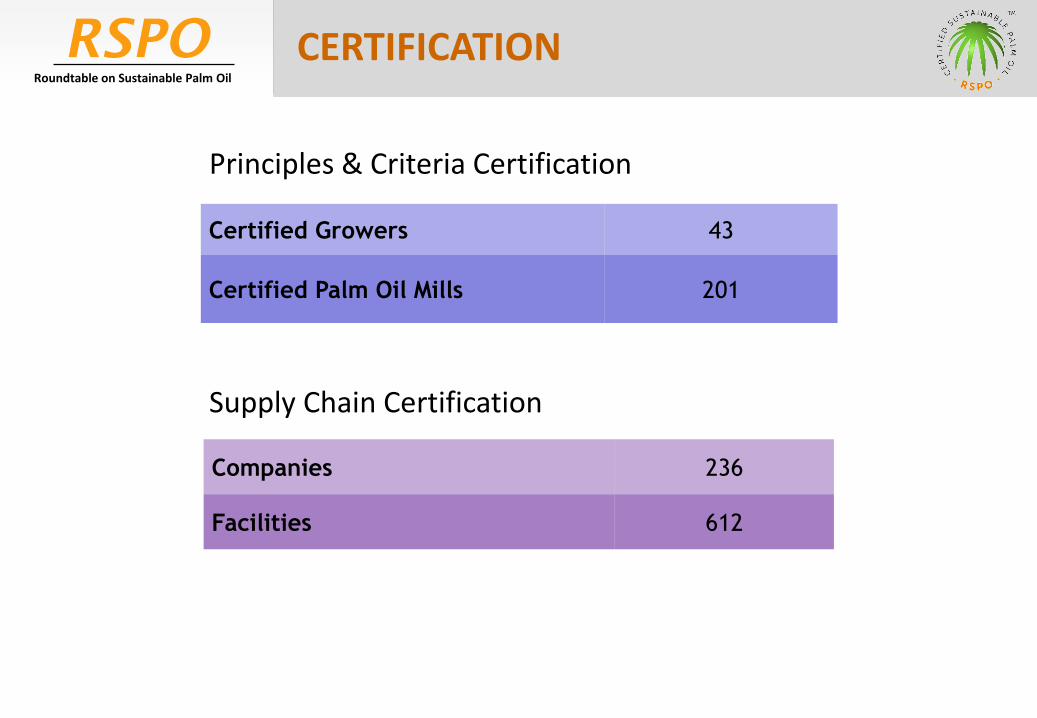
Principles & Criteria Certification
CERTIFICATION
Companies 236
Facilities 612
Supply Chain Certification
Certified Growers 43
Certified Palm Oil Mills 201
RSPO Roundtable on Sustainable Palm Oil
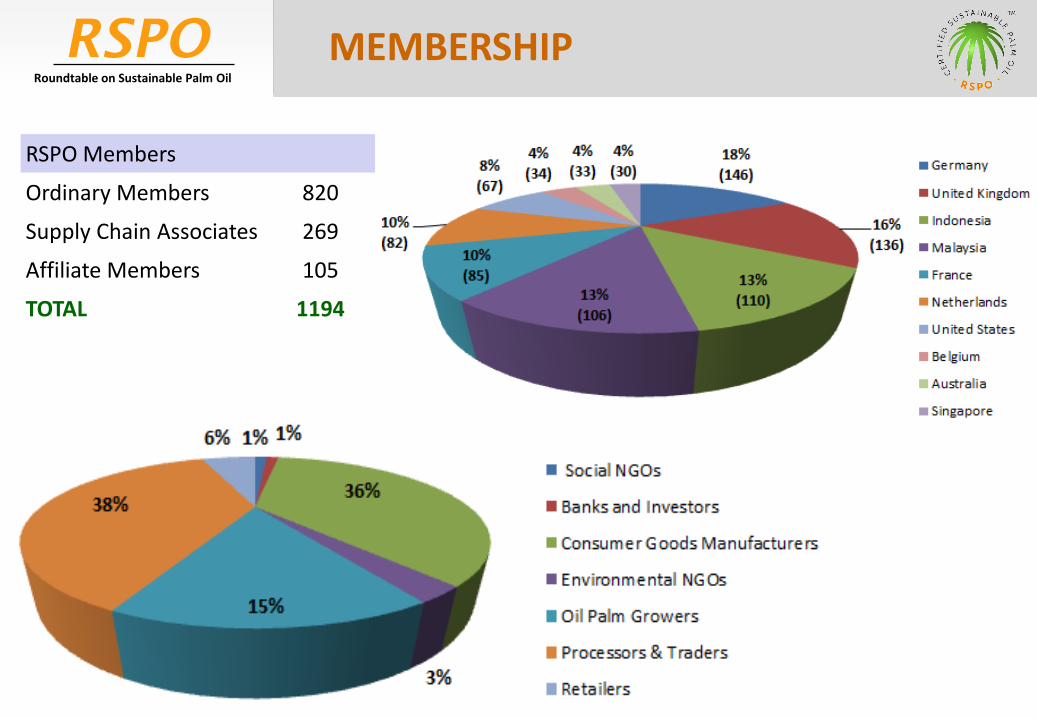
MEMBERSHIP
RSPO Members
Ordinary Members 820
Supply Chain Associates 269
Affiliate Members 105
TOTAL 1194

RSPO Roundtable on Sustainable Palm Oil
TRADEMARK
Stakeholders Total
Consumer Goods Manufacturers
48
Growers 5
Processors & Traders 30 Retailers 11 Supply Chain Associate 11
Grand Total 105
Total Licensees by Stakeholder
RSPO Roundtable on Sustainable Palm Oil
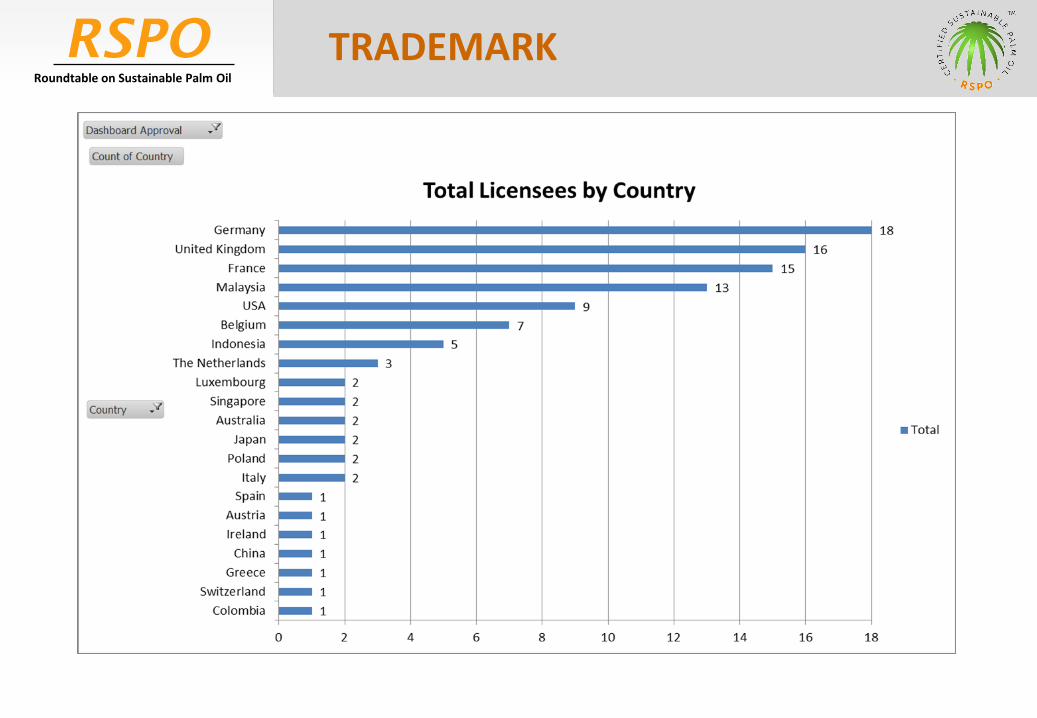
TRADEMARK

RSPO Roundtable on Sustainable Palm Oil
QUICKFACTS SNAPSHOT
For the complete version of Quickfacts, you may click the link below: http://www.rspo.org/en/key_documents