Feb 2015 Calgary Housing Stats from CREB
28
CALGARY REGIONAL HOUSING MARKET STATISTICS C R E B ® C a l g a r y R e g i o n a l H o u s i n g M a r k e t S t a t i s t i c s Page 1 CITY OF CALGARY ACTIVE LISTINGS February sales activity remains low Calgary, March 2, 2015 - Year-over-year new listings growth eased from 37 per cent last month to nine per cent in February. However, as sales activity remained below long term averages for the month, Calgary inventory levels rose to 5,474 units in February. “While housing supply levels continue to be higher than we have seen in this market for some time, they remain below February 2008 record highs of nearly 7,000 units” said CREB® chief economist Ann-Marie Lurie. “If the pace of growth in new listings continues to ease, this could place some downward pressure on the supply growth in the resale market.” After the first two months of the year, there have been 6,236 new listings come onto the Calgary market. However, the new listings gains have varied depending on price range and segment. Detached homes have continued to see a decline in new listings in the under $400,000 segment, while both the apartment and the attached product have recorded listing growth in the over $300,000 price range. “It’s really important for consumers to consider what segment of the market they are buying or selling in when they make any real estate decisions,” said CREB® president Corinne Lyall. “The inventory, demand and price movement will vary based on the community, price range and product type.” City of Calgary sales totaled 1,217 in February, a 34 per cent decline over the previous year’s activity. While sales fell across all product types, the rate of decline was higher in the apartment and attached sectors of the city. “Everyone has different reasons for making a move and so it’s difficult to predict how buyers will react to this market,” said Lyall “Buyers who have been waiting for more inventory to come on the market may find what they are looking for today. If they are in a position to make a buying decision they certainly can take advantage of the lower interest rates.” Months of inventory remain elevated at 4.5 months due to supply gains relative to slower sales in February. This placed downward pressure on pricing over the past month. Unadjusted detached benchmark prices totaled 516,000 in February, a year-over- year increase of six per cent, but a 0.5 per cent fall over January figures. Meanwhile, attached and apartment benchmark prices totaled 354,600 and 296,000 respectively. Both represented a decline over previous month’s levels. The variation in price is more extreme when considering the average price. In February the average price rose by 0.3 percent relative to January, but fell by 4.2 per cent compared to last year. This does not come as a surprise given how the composition of the sales influences the change. Benchmark prices provided changes over time on similar properties, providing a clearer indication of pricing trends. “Expectations vary significantly when talking about the impact that lower oil prices will have on the housing market,” said Lurie. “This wide range in forecasts is often related to assumptions about how long the cycle will last and the resulting impact to employment and net migration.” “These differences in expectations will likely persist until there is some firm data to support assumptions about Calgary’s employment levels,” said Lurie. . Inventory climbs in Calgary’s housing market - 1,000 2,000 3,000 4,000 5,000 6,000 7,000 8,000 Feb. 2005 Feb. 2006 Feb. 2007 Feb. 2008 Feb. 2009 Feb. 2010 Feb. 2011 Feb. 2012 Feb. 2013 Feb. 2014 Feb. 2015 Detached Estimated inventory Apartment Estimated inventory Attached Estimated inventory Source: CREB®
-
Upload
jerry-charlton -
Category
Real Estate
-
view
286 -
download
0
Transcript of Feb 2015 Calgary Housing Stats from CREB

CALGARY REGIONALHOUSING MARKET STATISTICS
C R E B ® C a l g a r y R e g i o n a l H o u s i n g M a r k e t S t a t i s t i c s
Page 1
CITY OF CALGARY ACTIVE LISTINGS
February sales activity remains low
Calgary, March 2, 2015 - Year-over-year new listings growth eased from 37 per cent last month to nine per cent in February. However, as sales activity remained below long term averages for the month, Calgary inventory levels rose to 5,474 units in February. “While housing supply levels continue to be higher than we have seen in this market for some time, they remain below February 2008 record highs of nearly 7,000 units” said CREB® chief economist Ann-Marie Lurie. “If the pace of growth in new listings continues to ease, this could place some downward pressure on the supply growth in the resale market.” After the first two months of the year, there have been 6,236 new listings come onto the Calgary market. However, the new listings gains have varied depending on price range and segment. Detached homes have continued to see a decline in new listings in the under $400,000 segment, while both the apartment and the attached product have recorded listing growth in the over $300,000 price range. “It’s really important for consumers to
consider what segment of the market they are buying or selling in when they make any real estate decisions,” said CREB® president Corinne Lyall. “The inventory, demand and price movement will vary based on the community, price range and product type.” City of Calgary sales totaled 1,217 in February, a 34 per cent decline over the previous year’s activity. While sales fell across all product types, the rate of decline was higher in the apartment and attached sectors of the city. “Everyone has different reasons for making a move and so it’s difficult to predict how buyers will react to this market,” said Lyall “Buyers who have been waiting for more inventory to come on the market may find what they are looking for today. If they are in a position to make a buying decision they certainly can take advantage of the lower interest rates.” Months of inventory remain elevated at 4.5 months due to supply gains relative to slower sales in February. This placed downward pressure on pricing over the past month. Unadjusted detached benchmark prices totaled 516,000 in February, a year-over-year increase of six per cent, but a 0.5 per cent fall over January figures.
Meanwhile, attached and apartment benchmark prices totaled 354,600 and 296,000 respectively. Both represented a decline over previous month’s levels. The variation in price is more extreme when considering the average price. In February the average price rose by 0.3 percent relative to January, but fell by 4.2 per cent compared to last year. This does not come as a surprise given how the composition of the sales influences the change. Benchmark prices provided changes over time on similar properties, providing a clearer indication of pricing trends. “Expectations vary significantly when talking about the impact that lower oil prices will have on the housing market,” said Lurie. “This wide range in forecasts is often related to assumptions about how long the cycle will last and the resulting impact to employment and net migration.” “These differences in expectations will likely persist until there is some firm data to support assumptions about Calgary’s employment levels,” said Lurie. .
Inventory climbs in Calgary’s housing market
-
1,000
2,000
3,000
4,000
5,000
6,000
7,000
8,000
Feb.2005
Feb.2006
Feb.2007
Feb.2008
Feb.2009
Feb.2010
Feb.2011
Feb.2012
Feb.2013
Feb.2014
Feb.2015
Detached Estimated inventory Apartment Estimated inventoryAttached Estimated inventory Source: CREB®
Summary Stats Economic RegionTotal Residential
C R E B ® C a l g a r y R e g i o n a l H o u s i n g M a r k e t S t a t i s t i c s
Page 2
Feb-14 Feb-15 Y/Y % Change
2014 YTD 2015 YTD Y/Y % Change
CITY OF CALGARYm_CYTDTotal Sales 1,850 1,217 -34.22% 3,289 2,096 -36.27%m_CYTDTotal Sales Volume $893,148,607 $562,612,232 -37.01% $1,559,841,518 $967,769,535 -37.96%m_CYTDNew Listings 2,711 2,950 8.82% 5,107 6,236 22.11%m_Cm_CInventory 2,641 5,474 107.27%
Months of Supply 1.43 4.50 215.08%Sales to New Listings Ratio 0.68 0.41 -39.55% 0.64 0.34 -47.81%
m_cYTDSales to List Price Ratio 98.59% 97.55% -1.06% 98.37% 97.56% -0.82%m_cYTDDays on Market 30 35 18.11% 34 37 8.82%m_cYTDBenchmark Price $431,400 $456,300 5.77% $428,850 $457,700 6.73%m_cYTDMedian Price $424,900 $420,000 -1.15% $421,200 $420,000 -0.28%m_cYTDAverage Price $482,783 $462,294 -4.24% $474,260 $461,722 -2.64%m_cYTDIndex 201 213 5.77% 200 213 6.72%
SURROUNDING AREAm_SYTDTotal Sales 373 270 -27.61% 642 491 -23.52%m_SYTDTotal Sales Volume $174,973,415 $131,561,906 -24.81% $296,566,136 $237,105,682 -20.05%m_SYTDNew Listings 664 749 12.80% 1,289 1,517 17.69%m_Sm_SInventory 1,360 1,765 29.78%
Months of Supply 3.65 6.54 79.29%Sales to New Listings Ratio 0.56 0.36 -35.83% 0.50 0.32 -35.01%
m_SYTDSales to List Price Ratio 97.19% 96.60% -0.61% 97.30% 96.76% -0.56%m_SYTDDays on Market 60 53 -11.87% 64 61 -5.68%m_SYTDBenchmark Price $398,100 $431,200 8.31% $396,050 $430,850 8.79%m_SYTDMedian Price $389,900 $405,000 3.87% $394,950 $402,500 1.91%m_SYTDAverage Price $469,098 $487,266 3.87% $461,941 $482,904 4.54%m_SYTDIndex 176 190 8.31% 175 190 8.79%
CREB® ECONOMIC REGIONm_CYTDTotal Sales 2,223 1,487 -33.11% 3,931 2,587 -34.19%m_CYTDTotal Sales Volume $1,068,122,022 $694,174,138 -35.01% $1,856,407,654 $1,204,875,217 -35.10%m_CYTDNew Listings 3,375 3,699 9.60% 6,396 7,753 21.22%m_Cm_CInventory 4,175 7,246 73.56%
Months of Supply 1.88 4.87 159.46%Sales to New Listings Ratio 0.66 0.40 -38.97% 0.61 0.33 -45.71%
m_ YTDSales to List Price Ratio 98.36% 97.37% -1.01% 98.19% 97.40% -0.81%m_ YTDDays on Market 35 38 10.11% 40 43 7.50%m_ YTDBenchmark Price $426,500 $451,900 5.96% $424,000 $453,050 6.85%m_ YTDMedian Price $417,900 $418,400 0.12% $416,450 $417,575 0.27%m_ YTDAverage Price $480,487 $466,829 -2.84% $472,248 $465,742 -1.38%m_ YTDIndex 198 210 5.96% 197 210 6.85%
For a list of definitions, see page 20.

Summary Stats City of Calgary
C R E B ® C a l g a r y R e g i o n a l H o u s i n g M a r k e t S t a t i s t i c s
Page 3
Feb-14 Feb-15 Y/Y % Change 2014 YTD 2015 YTD Y/Y %
ChangeDETACHED
m_CYTDTotal Sales 1,080 739 -31.57% 1,937 1,273 -34.28%m_CYTDTotal Sales Volume $597,771,928 $389,275,663 -34.88% $1,050,095,811 $670,370,135 -36.16%m_CYTDNew Listings 1,556 1,674 7.58% 2,955 3,511 18.82%m_Cm_CInventory 1,469 2,946 100.54%
Months of Supply 1.36 3.99 193.08%Sales to New Listings Ratio 0.69 0.44 -36.40% 0.66 0.36 -44.69%
m_cYTDSales to List Price Ratio 98.62% 97.60% -1.03% 98.37% 97.60% -0.78%m_cYTDDays on Market 29 34 18.06% 33 35 6.06%m_cYTDBenchmark Price $486,800 $516,000 6.00% $483,550 $517,300 6.98%m_cYTDMedian Price $480,000 $470,000 -2.08% $471,000 $475,000 0.85%m_cYTDAverage Price $553,493 $526,760 -4.83% $542,125 $526,607 -2.86%m_cYTDIndex 202 214 6.00% 200 214 6.99%
ATTACHEDm_CYTDTotal Sales 410 261 -36.34% 729 452 -38.00%m_CYTDTotal Sales Volume $177,552,880 $106,296,121 -40.13% $309,084,634 $183,316,147 -40.69%m_CYTDNew Listings 576 681 18.23% 1,083 1,386 27.98%m_Cm_CInventory 532 1,217 128.76%
Months of Supply 1.30 4.66 259.35%Sales to New Listings Ratio 0.71 0.38 -46.16% 0.67 0.33 -51.55%
m_cYTDSales to List Price Ratio 98.92% 97.66% -1.28% 98.67% 97.78% -0.91%m_cYTDDays on Market 30 34 14.87% 34 37 8.82%m_cYTDBenchmark Price $334,300 $354,600 6.07% $332,700 $355,300 6.79%m_cYTDMedian Price $353,500 $347,900 -1.58% $350,250 $344,500 -1.64%m_cYTDAverage Price $433,056 $407,265 -5.96% $423,984 $405,567 -4.34%m_cYTDIndex 196 208 6.08% 195 208 6.80%
APARTMENTm_CYTDTotal Sales 360 217 -39.72% 623 371 -40.45%m_CYTDTotal Sales Volume $117,823,799 $67,040,448 -43.10% $200,661,073 $114,083,253 -43.15%m_CYTDNew Listings 579 595 2.76% 1,069 1,339 25.26%m_Cm_CInventory 640 1,311 104.84%
Months of Supply 1.78 6.04 239.83%Sales to New Listings Ratio 0.62 0.36 -41.34% 0.58 0.28 -52.46%
m_cYTDSales to List Price Ratio 97.97% 97.08% -0.92% 97.87% 96.97% -0.91%m_cYTDDays on Market 33 40 23.34% 36 46 27.78%m_cYTDBenchmark Price $283,700 $296,000 4.34% $282,250 $297,350 5.35%m_cYTDMedian Price $289,950 $267,500 -7.74% $283,475 $268,000 -5.46%m_cYTDAverage Price $327,288 $308,942 -5.61% $322,088 $307,502 -4.53%m_cYTDIndex 198 207 4.34% 197 208 5.35%
CITY OF CALGARYm_CYTDTotal Sales 1,850 1,217 -34.22% 3,289 2,096 -36.27%m_CYTDTotal Sales Volume $893,148,607 $562,612,232 -37.01% $1,559,841,518 $967,769,535 -37.96%m_CYTDNew Listings 2,711 2,950 8.82% 5,107 6,236 22.11%m_Cm_CInventory 2,641 5,474 107.27%
Months of Supply 1.43 4.50 215.08%Sales to New Listings Ratio 0.68 0.41 -39.55% 0.64 0.34 -47.81%
m_cYTDSales to List Price Ratio 98.59% 97.55% -1.06% 98.37% 97.56% -0.82%m_cYTDDays on Market 30 35 18.11% 34 37 8.82%m_cYTDBenchmark Price $431,400 $456,300 5.77% $428,850 $457,700 6.73%m_cYTDMedian Price $424,900 $420,000 -1.15% $421,200 $420,000 -0.28%m_cYTDAverage Price $482,783 $462,294 -4.24% $474,260 $461,722 -2.64%m_cYTDIndex 201 213 5.77% 200 213 6.72%
For a list of definitions, see page 20.
Summary Stats Census Metropolitan AreaTotal Residential
C R E B ® C a l g a r y R e g i o n a l H o u s i n g M a r k e t S t a t i s t i c s
Page 4
Feb-14 Feb-15 Y/Y % Change 2014 YTD 2015 YTD Y/Y %
ChangeCITY OF CALGARY
m_CYTDTotal Sales 1,850 1,217 -34.22% 3,289 2,096 -36.27%m_CYTDTotal Sales Volume $893,148,607 $562,612,232 -37.01% $1,559,841,518 $967,769,535 -37.96%m_CYTDNew Listings 2,711 2,950 8.82% 5,107 6,236 22.11%m_Cm_CInventory 2,641 5,474 107.27%
Months of Supply 1.43 4.50 215.08%Sales to New Listings Ratio 0.68 0.41 -39.55% 0.64 0.34 -47.81%
m_cYTDSales to List Price Ratio 98.59% 97.55% -1.06% 98.37% 97.56% -0.82%m_cYTDDays on Market 30 35 18.11% 34 37 8.82%m_cYTDBenchmark Price $431,400 $456,300 5.77% $428,850 $457,700 6.73%m_cYTDMedian Price $424,900 $420,000 -1.15% $421,200 $420,000 -0.28%m_cYTDAverage Price $482,783 $462,294 -4.24% $474,260 $461,722 -2.64%m_cYTDIndex 201 213 5.77% 200 213 6.72%
AIRDRIEm_a YTDTotal Sales 106 98 -7.55% 173 163 -5.78%m_a YTDTotal Sales Volume $40,889,717 $39,183,829 -4.17% $66,645,092 $63,891,466 -4.13%m_a YTDNew Listings 148 230 55.41% 271 453 67.16%m_a m_aInventory 139 368 164.75%
Months of Supply 1.31 3.76 186.36%Sales to New Listings Ratio 0.72 0.43 -40.51% 0.64 0.36 -43.63%
m_aYTDSales to List Price Ratio 98.66% 98.45% -0.21% 98.48% 98.49% 0.01%m_aYTDDays on Market 34 35 4.86% 36 38 5.56%m_aYTDBenchmark Price $345,600 $378,000 9.38% $344,450 $377,700 9.65%m_aYTDMedian Price $379,375 $400,000 5.44% $382,438 $388,491 1.58%m_aYTDAverage Price $385,752 $399,835 3.65% $385,232 $391,972 1.75%m_aYTDIndex 182 200 9.38% 182 199 9.65%
ROCKYVIEWm_MYTDTotal Sales 141 78 -44.68% 239 156 -34.73%m_MYTDTotal Sales Volume $82,767,748 $51,032,277 -38.34% $135,467,520 $99,823,726 -26.31%m_MYTDNew Listings 278 257 -7.55% 534 546 2.25%m_Mm_MInventory 631 726 15.06%
Months of Supply 4.48 9.31 107.98%Sales to New Listings Ratio 0.51 0.30 -40.16% 0.45 0.29 -36.16%
m_ YTDSales to List Price Ratio 96.19% 95.34% -0.88% 96.57% 95.69% -0.91%m_ YTDDays on Market 73 56 -23.34% 74 66 -10.81%m_ YTDBenchmark Price $513,300 $558,400 8.79% $509,900 $556,550 9.15%m_ YTDMedian Price $470,000 $497,500 5.85% $472,750 $488,125 3.25%m_ YTDAverage Price $587,005 $654,260 11.46% $566,810 $639,896 12.89%m_ YTDIndex 166 181 8.79% 165 180 9.15%
CALGARY CMAm_CYTDTotal Sales 1,991 1,295 -34.96% 3,528 2,252 -36.17%m_CYTDTotal Sales Volume $975,916,355 $613,644,509 -37.12% $1,695,309,038 $1,067,593,261 -37.03%m_CYTDNew Listings 2,989 3,207 7.29% 5,641 6,782 20.23%m_Cm_CInventory 3,532 6,575 86.16%
Months of Supply 1.77 5.08 186.20%Sales to New Listings Ratio 0.67 0.40 -39.38% 0.63 0.33 -46.91%
m_ YTDSales to List Price Ratio 98.38% 97.36% -1.04% 98.22% 97.38% -0.85%m_ YTDDays on Market 33 36 10.91% 37 39 5.41%m_ YTDBenchmark Price $430,700 $456,600 6.01% $428,200 $457,700 6.89%m_ YTDMedian Price $427,000 $425,000 -0.47% $423,000 $425,000 0.47%m_ YTDAverage Price $490,164 $473,857 -3.33% $480,530 $474,065 -1.35%m_ YTDIndex 199 211 6.02% 198 212 6.89%
For a list of definitions, see page 20.
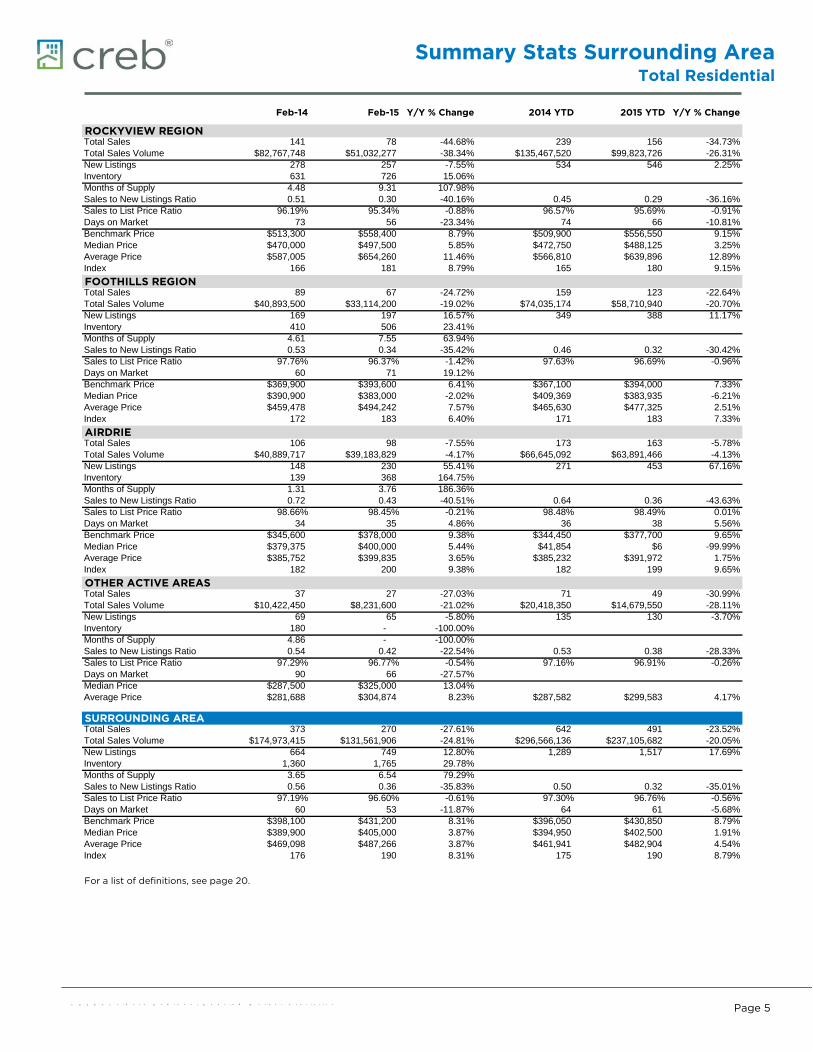
Summary Stats Surrounding AreaTotal Residential
C R E B ® C a l g a r y R e g i o n a l H o u s i n g M a r k e t S t a t i s t i c s
Page 5
Feb-14 Feb-15 Y/Y % Change 2014 YTD 2015 YTD Y/Y % Change
ROCKYVIEW REGIONm_mYTDTotal Sales 141 78 -44.68% 239 156 -34.73%m_mYTDTotal Sales Volume $82,767,748 $51,032,277 -38.34% $135,467,520 $99,823,726 -26.31%m_mYTDNew Listings 278 257 -7.55% 534 546 2.25%m_mm_mInventory 631 726 15.06%
Months of Supply 4.48 9.31 107.98%Sales to New Listings Ratio 0.51 0.30 -40.16% 0.45 0.29 -36.16%
m_ YTDSales to List Price Ratio 96.19% 95.34% -0.88% 96.57% 95.69% -0.91%m_ YTDDays on Market 73 56 -23.34% 74 66 -10.81%m_ YTDBenchmark Price $513,300 $558,400 8.79% $509,900 $556,550 9.15%m_ YTDMedian Price $470,000 $497,500 5.85% $472,750 $488,125 3.25%m_ YTDAverage Price $587,005 $654,260 11.46% $566,810 $639,896 12.89%m_ YTDIndex 166 181 8.79% 165 180 9.15%
FOOTHILLS REGIONm_mYTDTotal Sales 89 67 -24.72% 159 123 -22.64%m_mYTDTotal Sales Volume $40,893,500 $33,114,200 -19.02% $74,035,174 $58,710,940 -20.70%m_mYTDNew Listings 169 197 16.57% 349 388 11.17%m_mm_mInventory 410 506 23.41%
Months of Supply 4.61 7.55 63.94%Sales to New Listings Ratio 0.53 0.34 -35.42% 0.46 0.32 -30.42%
m_ YTDSales to List Price Ratio 97.76% 96.37% -1.42% 97.63% 96.69% -0.96%m_ YTDDays on Market 60 71 19.12% 65 77 18.46%m_ YTDBenchmark Price $369,900 $393,600 6.41% $367,100 $394,000 7.33%m_ YTDMedian Price $390,900 $383,000 -2.02% $409,369 $383,935 -6.21%m_ YTDAverage Price $459,478 $494,242 7.57% $465,630 $477,325 2.51%m_ YTDIndex 172 183 6.40% 171 183 7.33%
AIRDRIEm_a YTDTotal Sales 106 98 -7.55% 173 163 -5.78%m_a YTDTotal Sales Volume $40,889,717 $39,183,829 -4.17% $66,645,092 $63,891,466 -4.13%m_a YTDNew Listings 148 230 55.41% 271 453 67.16%m_a m_aInventory 139 368 164.75%
Months of Supply 1.31 3.76 186.36%Sales to New Listings Ratio 0.72 0.43 -40.51% 0.64 0.36 -43.63%
m_aYTDSales to List Price Ratio 98.66% 98.45% -0.21% 98.48% 98.49% 0.01%m_aYTDDays on Market 34 35 4.86% 36 38 5.56%m_aYTDBenchmark Price $345,600 $378,000 9.38% $344,450 $377,700 9.65%m_aYTDMedian Price $379,375 $400,000 5.44% $41,854 $6 -99.99%m_aYTDAverage Price $385,752 $399,835 3.65% $385,232 $391,972 1.75%m_aYTDIndex 182 200 9.38% 182 199 9.65%
OTHER ACTIVE AREASm_OYTDTotal Sales 37 27 -27.03% 71 49 -30.99%m_OYTDTotal Sales Volume $10,422,450 $8,231,600 -21.02% $20,418,350 $14,679,550 -28.11%m_OYTDNew Listings 69 65 -5.80% 135 130 -3.70%m_Om_OInventory 180 - -100.00%
Months of Supply 4.86 - -100.00%Sales to New Listings Ratio 0.54 0.42 -22.54% 0.53 0.38 -28.33%
m_OYTDSales to List Price Ratio 97.29% 96.77% -0.54% 97.16% 96.91% -0.26%m_OYTDDays on Market 90 66 -27.57% #N/A #N/A #N/Am_OYTDMedian Price $287,500 $325,000 13.04% #N/A #N/A #N/Am_OYTDAverage Price $281,688 $304,874 8.23% $287,582 $299,583 4.17%
SURROUNDING AREAm_SYTDTotal Sales 373 270 -27.61% 642 491 -23.52%m_SYTDTotal Sales Volume $174,973,415 $131,561,906 -24.81% $296,566,136 $237,105,682 -20.05%m_SYTDNew Listings 664 749 12.80% 1,289 1,517 17.69%m_Sm_SInventory 1,360 1,765 29.78%
Months of Supply 3.65 6.54 79.29%Sales to New Listings Ratio 0.56 0.36 -35.83% 0.50 0.32 -35.01%
m_SYTDSales to List Price Ratio 97.19% 96.60% -0.61% 97.30% 96.76% -0.56%m_SYTDDays on Market 60 53 -11.87% 64 61 -5.68%m_SYTDBenchmark Price $398,100 $431,200 8.31% $396,050 $430,850 8.79%m_SYTDMedian Price $389,900 $405,000 3.87% $394,950 $402,500 1.91%m_SYTDAverage Price $469,098 $487,266 3.87% $461,941 $482,904 4.54%m_SYTDIndex 176 190 8.31% 175 190 8.79%
For a list of definitions, see page 20.
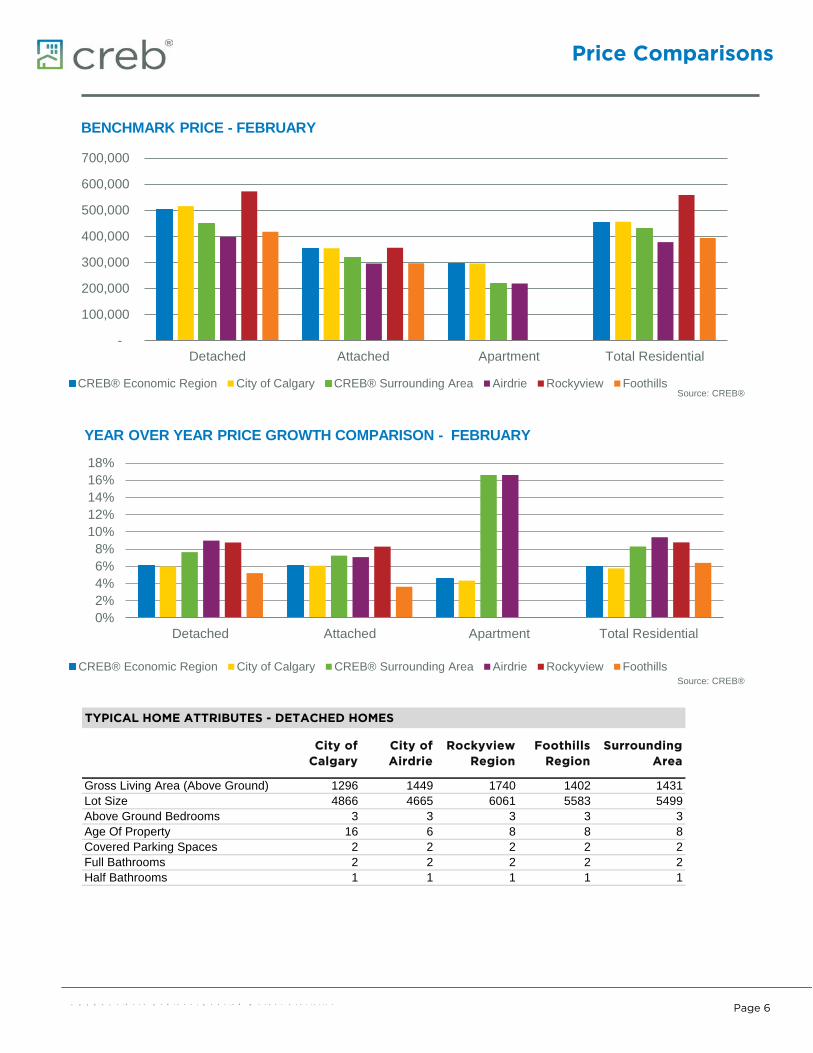
Price Comparisons
C R E B ® C a l g a r y R e g i o n a l H o u s i n g M a r k e t S t a t i s t i c s
Page 6
TYPICAL HOME ATTRIBUTES - DETACHED HOMES
City of Calgary
City of Airdrie
Rockyview Region
Foothills Region
Surrounding Area
Gross Living Area (Above Ground) 1296 1449 1740 1402 1431Lot Size 4866 4665 6061 5583 5499Above Ground Bedrooms 3 3 3 3 3Age Of Property 16 6 8 8 8Covered Parking Spaces 2 2 2 2 2Full Bathrooms 2 2 2 2 2Half Bathrooms 1 1 1 1 1
-
100,000
200,000
300,000
400,000
500,000
600,000
700,000
Detached Attached Apartment Total Residential
BENCHMARK PRICE - FEBRUARY
CREB® Economic Region City of Calgary CREB® Surrounding Area Airdrie Rockyview FoothillsSource: CREB®
0%2%4%6%8%
10%12%14%16%18%
Detached Attached Apartment Total Residential
YEAR OVER YEAR PRICE GROWTH COMPARISON - FEBRUARY
CREB® Economic Region City of Calgary CREB® Surrounding Area Airdrie Rockyview FoothillsSource: CREB®
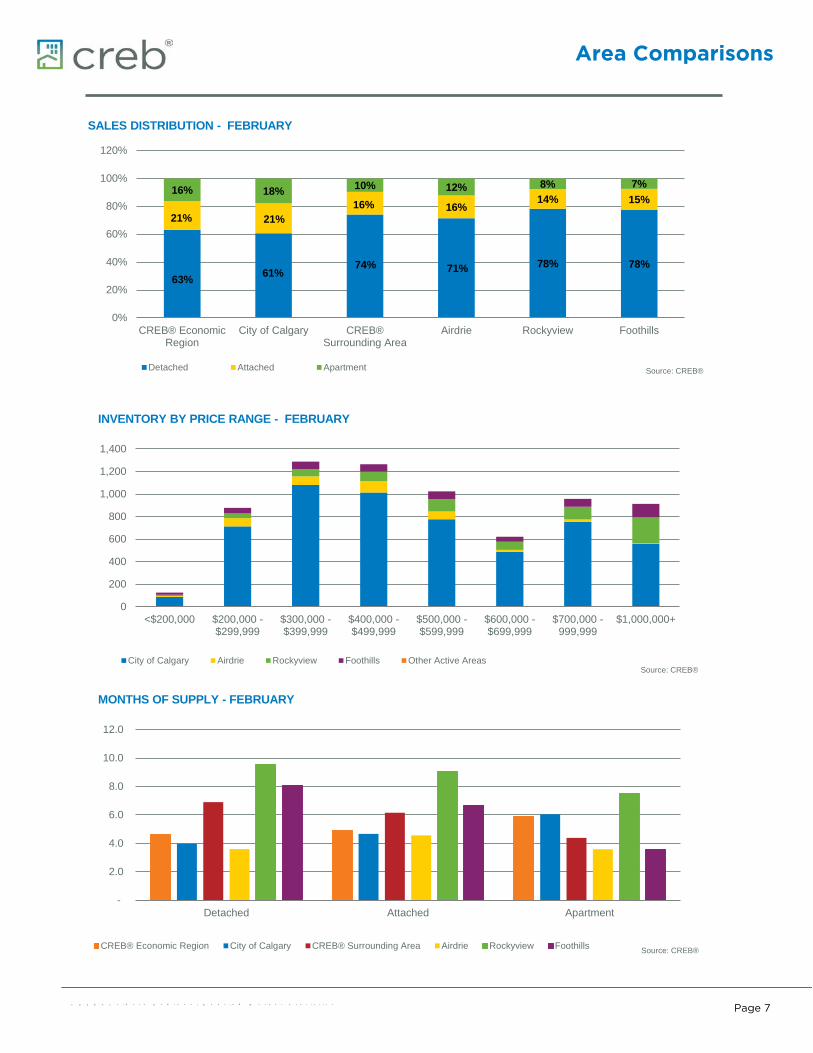
Area Comparisons
C R E B ® C a l g a r y R e g i o n a l H o u s i n g M a r k e t S t a t i s t i c s
Page 7
-
2.0
4.0
6.0
8.0
10.0
12.0
Detached Attached Apartment
MONTHS OF SUPPLY - FEBRUARY
CREB® Economic Region City of Calgary CREB® Surrounding Area Airdrie Rockyview Foothills Source: CREB®
63% 61% 74% 71% 78% 78%
21% 21% 16% 16%
14% 15% 16% 18% 10% 12% 8% 7%
0%
20%
40%
60%
80%
100%
120%
CREB® EconomicRegion
City of Calgary CREB®Surrounding Area
Airdrie Rockyview Foothills
SALES DISTRIBUTION - FEBRUARY
Detached Attached Apartment Source: CREB®
0
200
400
600
800
1,000
1,200
1,400
<$200,000 $200,000 -$299,999
$300,000 -$399,999
$400,000 -$499,999
$500,000 -$599,999
$600,000 -$699,999
$700,000 -999,999
$1,000,000+
INVENTORY BY PRICE RANGE - FEBRUARY
City of Calgary Airdrie Rockyview Foothills Other Active AreasSource: CREB®

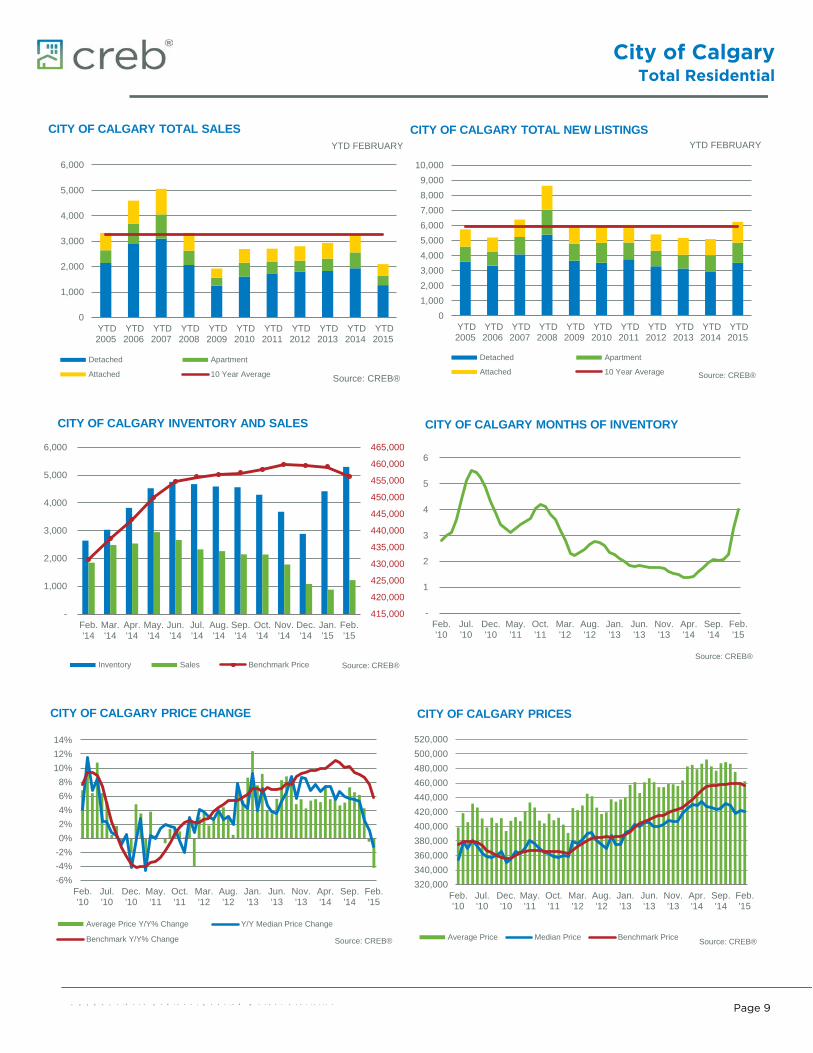
City of CalgaryTotal Residential
C R E B ® C a l g a r y R e g i o n a l H o u s i n g M a r k e t S t a t i s t i c s
Page 8
Jan. Feb. Mar. Apr. May Jun. Jul. Aug. Sept. Oct. Nov. Dec.2014 01/01/14 02/01/14 03/01/14 04/01/14 05/01/14 06/01/14 07/01/14 08/01/14 09/01/14 10/01/14 11/01/14 12/01/14
m_CM_RSales 1,439 1,850 2,481 2,539 2,945 2,664 2,328 2,263 2,146 2,145 1,779 1,082 m_CM_RNew Listings 2,396 2,711 3,319 3,753 4,327 3,817 3,219 3,147 3,259 2,919 2,093 1,380 m_Cm_CInventory 2,181 2,641 3,033 3,820 4,528 4,759 4,678 4,591 4,559 4,292 3,681 2,882 m_cm_Days on Market 40 30 28 27 27 29 33 35 36 37 38 43 m_cm_Benchmark Price 426,300 431,400 437,600 443,400 449,800 454,800 456,100 456,700 457,300 458,400 459,900 459,500 m_cm_Median Price 417,500 424,900 430,000 429,000 435,000 428,000 426,450 423,000 425,000 431,250 429,000 417,250 m_cm_Average Price 463,303 482,783 484,877 478,870 486,481 492,230 482,678 477,101 487,211 488,706 486,431 475,193 m_cm_Index 199 201 204 207 210 212 213 213 213 214 215 214
2015 01/01/15 02/01/15 03/01/15 04/01/15 05/01/15 06/01/15 07/01/15 08/01/15 09/01/15 10/01/15 11/01/15 12/01/15m_CM_RSales 879 1,217 m_CM_RNew Listings 3,286 2,950 m_Cm_CInventory 4,420 5,296 m_cm_Days on Market 41 35 m_cm_Benchmark Price 459,100 456,300 m_cm_Median Price 422,000 420,000 m_cm_Average Price 460,930 462,294 m_cm_Index 214 213
Feb-14 Feb-15 YTD2014 YTD2015CALGARY TOTAL 02/01/14 02/01/15 02/01/14 02/01/15
m_Cytd_ >$100,000 - - - - m_Cytd_ $100,000 - $199,999 36 38 77 56 m_Cytd_ $200,000 - $299,999 283 189 517 329 m_Cytd_ $300,000 -$ 349,999 240 120 424 233 m_Cytd_ $350,000 - $399,999 256 182 462 282 m_Cytd_ $400,000 - $449,999 223 176 404 305 m_Cytd_ $450,000 - $499,999 184 141 337 234 m_Cytd_ $500,000 - $549,999 150 104 283 175 m_Cytd_ $550,000 - $599,999 99 70 174 132 m_Cytd_ $600,000 - $649,999 86 39 129 76 m_Cytd_ $650,000 - $699,999 70 35 117 70 m_Cytd_ $700,000 - $799,999 83 56 133 91 m_Cytd_ $800,000 - $899,999 48 29 85 42 m_Cytd_ $900,000 - $999,999 26 11 39 20 m_Cytd_ $1,000,000 - $1,249,999 32 13 49 28 m_Cytd_ $1,250,000 - $1,499,999 12 6 22 13 m_Cytd_ $1,500,000 - $1,749,999 10 3 15 5 m_Cytd_ $1,750,000 - $1,999,999 6 2 10 2 m_Cytd_ $2,000,000 - $2,499,999 3 2 7 2 m_Cytd_ $2,500,000 - $2,999,999 - - 2 - m_Cytd_ $3,000,000 - $3,499,999 1 - 1 - m_Cytd_ $3,500,000 - $3,999,999 2 1 2 1 m_Cytd_ $4,000,000 + - - - -
1,850 1,217 3,289 2,096
0%
5%
10%
15%
20%
25%
30%
35%
<$200,000 $200,000 -$299,999
$300,000 -$399,999
$400,000 -$499,999
$500,000 -$599,999
$600,000 -$699,999
$700,000 -999,999
$1,000,000+
YTD FEBRUARY CITY OF CALGARY SALES BY PRICE RANGE
YTD 2012 YTD 2013 YTD 2014 YTD 2015 Source: CREB®
City of CalgaryTotal Residential
C R E B ® C a l g a r y R e g i o n a l H o u s i n g M a r k e t S t a t i s t i c s
Page 9
0
1,000
2,000
3,000
4,000
5,000
6,000
YTD2005
YTD2006
YTD2007
YTD2008
YTD2009
YTD2010
YTD2011
YTD2012
YTD2013
YTD2014
YTD2015
YTD FEBRUARY
CITY OF CALGARY TOTAL SALES
Detached Apartment
Attached 10 Year Average Source: CREB®
01,0002,0003,0004,0005,0006,0007,0008,0009,000
10,000
YTD2005
YTD2006
YTD2007
YTD2008
YTD2009
YTD2010
YTD2011
YTD2012
YTD2013
YTD2014
YTD2015
YTD FEBRUARY CITY OF CALGARY TOTAL NEW LISTINGS
Detached Apartment
Attached 10 Year Average Source: CREB®
415,000
420,000
425,000
430,000
435,000
440,000
445,000
450,000
455,000
460,000
465,000
-
1,000
2,000
3,000
4,000
5,000
6,000
Feb.'14
Mar.'14
Apr.'14
May.'14
Jun.'14
Jul.'14
Aug.'14
Sep.'14
Oct.'14
Nov.'14
Dec.'14
Jan.'15
Feb.'15
CITY OF CALGARY INVENTORY AND SALES
Inventory Sales Benchmark Price Source: CREB®
-
1
2
3
4
5
6
Feb.'10
Jul.'10
Dec.'10
May.'11
Oct.'11
Mar.'12
Aug.'12
Jan.'13
Jun.'13
Nov.'13
Apr.'14
Sep.'14
Feb.'15
CITY OF CALGARY MONTHS OF INVENTORY
Source: CREB®
-6%-4%-2%0%2%4%6%8%
10%12%14%
Feb.'10
Jul.'10
Dec.'10
May.'11
Oct.'11
Mar.'12
Aug.'12
Jan.'13
Jun.'13
Nov.'13
Apr.'14
Sep.'14
Feb.'15
CITY OF CALGARY PRICE CHANGE
Average Price Y/Y% Change Y/Y Median Price Change
Benchmark Y/Y% Change Source: CREB®
320,000340,000360,000380,000400,000420,000440,000460,000480,000500,000520,000
Feb.'10
Jul.'10
Dec.'10
May.'11
Oct.'11
Mar.'12
Aug.'12
Jan.'13
Jun.'13
Nov.'13
Apr.'14
Sep.'14
Feb.'15
CITY OF CALGARY PRICES
Average Price Median Price Benchmark Price Source: CREB®
City of CalgaryDetached
C R E B ® C a l g a r y R e g i o n a l H o u s i n g M a r k e t S t a t i s t i c s
Page 10
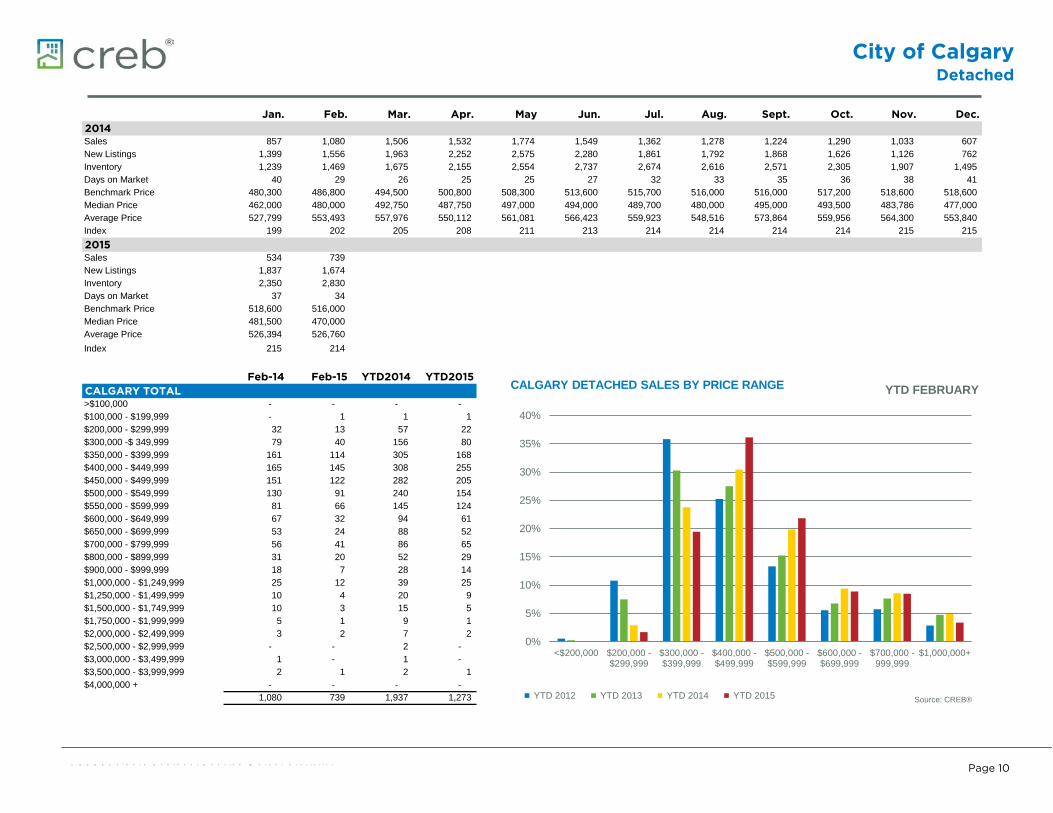
Jan. Feb. Mar. Apr. May Jun. Jul. Aug. Sept. Oct. Nov. Dec.2014 01/01/14 02/01/14 03/01/14 04/01/14 05/01/14 06/01/14 07/01/14 08/01/14 09/01/14 10/01/14 11/01/14 12/01/14
m_CM_d Sales 857 1,080 1,506 1,532 1,774 1,549 1,362 1,278 1,224 1,290 1,033 607 m_CM_d New Listings 1,399 1,556 1,963 2,252 2,575 2,280 1,861 1,792 1,868 1,626 1,126 762 m_Cm_CInventory 1,239 1,469 1,675 2,155 2,554 2,737 2,674 2,616 2,571 2,305 1,907 1,495 m_cm_Days on Market 40 29 26 25 25 27 32 33 35 36 38 41 m_cm_Benchmark Price 480,300 486,800 494,500 500,800 508,300 513,600 515,700 516,000 516,000 517,200 518,600 518,600 m_cm_Median Price 462,000 480,000 492,750 487,750 497,000 494,000 489,700 480,000 495,000 493,500 483,786 477,000 m_cm_Average Price 527,799 553,493 557,976 550,112 561,081 566,423 559,923 548,516 573,864 559,956 564,300 553,840 m_cm_Index 199 202 205 208 211 213 214 214 214 214 215 215
2015 01/01/15 02/01/15 03/01/15 04/01/15 05/01/15 06/01/15 07/01/15 08/01/15 09/01/15 10/01/15 11/01/15 12/01/15m_CM_d Sales 534 739 m_CM_d New Listings 1,837 1,674 m_Cm_CInventory 2,350 2,830 m_cm_Days on Market 37 34 m_cm_Benchmark Price 518,600 516,000 m_cm_Median Price 481,500 470,000 m_cm_Average Price 526,394 526,760 m_cm_Index 215 214
Feb-14 Feb-15 YTD2014 YTD2015CALGARY TOTAL 02/01/14 02/01/15 02/01/14 02/01/15
m_Cytd_ >$100,000 - - - - m_Cytd_ $100,000 - $199,999 - 1 1 1 m_Cytd_ $200,000 - $299,999 32 13 57 22 m_Cytd_ $300,000 -$ 349,999 79 40 156 80 m_Cytd_ $350,000 - $399,999 161 114 305 168 m_Cytd_ $400,000 - $449,999 165 145 308 255 m_Cytd_ $450,000 - $499,999 151 122 282 205 m_Cytd_ $500,000 - $549,999 130 91 240 154 m_Cytd_ $550,000 - $599,999 81 66 145 124 m_Cytd_ $600,000 - $649,999 67 32 94 61 m_Cytd_ $650,000 - $699,999 53 24 88 52 m_Cytd_ $700,000 - $799,999 56 41 86 65 m_Cytd_ $800,000 - $899,999 31 20 52 29 m_Cytd_ $900,000 - $999,999 18 7 28 14 m_Cytd_ $1,000,000 - $1,249,999 25 12 39 25 m_Cytd_ $1,250,000 - $1,499,999 10 4 20 9 m_Cytd_ $1,500,000 - $1,749,999 10 3 15 5 m_Cytd_ $1,750,000 - $1,999,999 5 1 9 1 m_Cytd_ $2,000,000 - $2,499,999 3 2 7 2 m_Cytd_ $2,500,000 - $2,999,999 - - 2 - m_Cytd_ $3,000,000 - $3,499,999 1 - 1 - m_Cytd_ $3,500,000 - $3,999,999 2 1 2 1 m_Cytd_ $4,000,000 + - - - -
1,080 739 1,937 1,273
0%
5%
10%
15%
20%
25%
30%
35%
40%
<$200,000 $200,000 -$299,999
$300,000 -$399,999
$400,000 -$499,999
$500,000 -$599,999
$600,000 -$699,999
$700,000 -999,999
$1,000,000+
YTD FEBRUARY CALGARY DETACHED SALES BY PRICE RANGE
YTD 2012 YTD 2013 YTD 2014 YTD 2015 Source: CREB®
City of CalgaryDetached
C R E B ® C a l g a r y R e g i o n a l H o u s i n g M a r k e t S t a t i s t i c s
Page 11
0
500
1,000
1,500
2,000
2,500
3,000
3,500
YTD2005
YTD2006
YTD2007
YTD2008
YTD2009
YTD2010
YTD2011
YTD2012
YTD2013
YTD2014
YTD2015
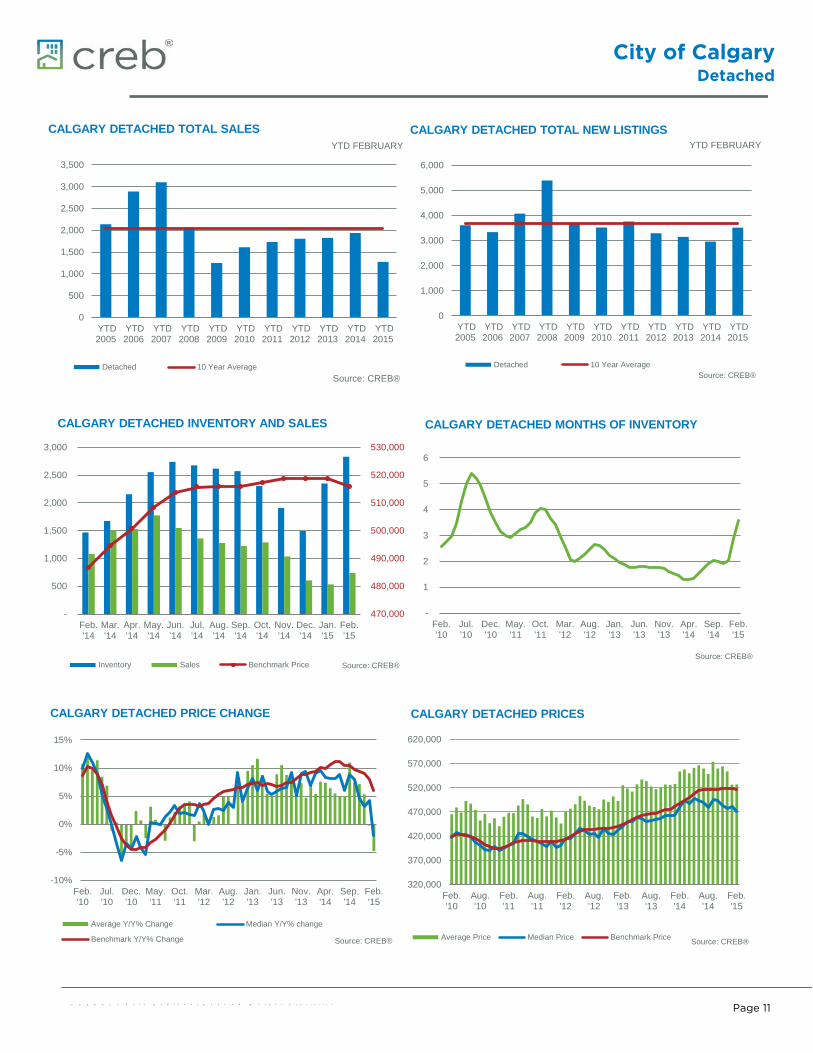
YTD FEBRUARY
CALGARY DETACHED TOTAL SALES
Detached 10 Year AverageSource: CREB®
0
1,000
2,000
3,000
4,000
5,000
6,000
YTD2005
YTD2006
YTD2007
YTD2008
YTD2009
YTD2010
YTD2011
YTD2012
YTD2013
YTD2014
YTD2015
YTD FEBRUARY CALGARY DETACHED TOTAL NEW LISTINGS
Detached 10 Year AverageSource: CREB®
470,000
480,000
490,000
500,000
510,000
520,000
530,000
-
500
1,000
1,500
2,000
2,500
3,000
Feb.'14
Mar.'14
Apr.'14
May.'14
Jun.'14
Jul.'14
Aug.'14
Sep.'14
Oct.'14
Nov.'14
Dec.'14
Jan.'15
Feb.'15
CALGARY DETACHED INVENTORY AND SALES
Inventory Sales Benchmark Price Source: CREB®
-
1
2
3
4
5
6
Feb.'10
Jul.'10
Dec.'10
May.'11
Oct.'11
Mar.'12
Aug.'12
Jan.'13
Jun.'13
Nov.'13
Apr.'14
Sep.'14
Feb.'15
CALGARY DETACHED MONTHS OF INVENTORY
Source: CREB®
-10%
-5%
0%
5%
10%
15%
Feb.'10
Jul.'10
Dec.'10
May.'11
Oct.'11
Mar.'12
Aug.'12
Jan.'13
Jun.'13
Nov.'13
Apr.'14
Sep.'14
Feb.'15
CALGARY DETACHED PRICE CHANGE
Average Y/Y% Change Median Y/Y% change
Benchmark Y/Y% Change Source: CREB®
320,000
370,000
420,000
470,000
520,000
570,000
620,000
Feb.'10
Aug.'10
Feb.'11
Aug.'11
Feb.'12
Aug.'12
Feb.'13
Aug.'13
Feb.'14
Aug.'14
Feb.'15
CALGARY DETACHED PRICES
Average Price Median Price Benchmark Price Source: CREB®
City of CalgaryAttached
C R E B ® C a l g a r y R e g i o n a l H o u s i n g M a r k e t S t a t i s t i c s
Page 12
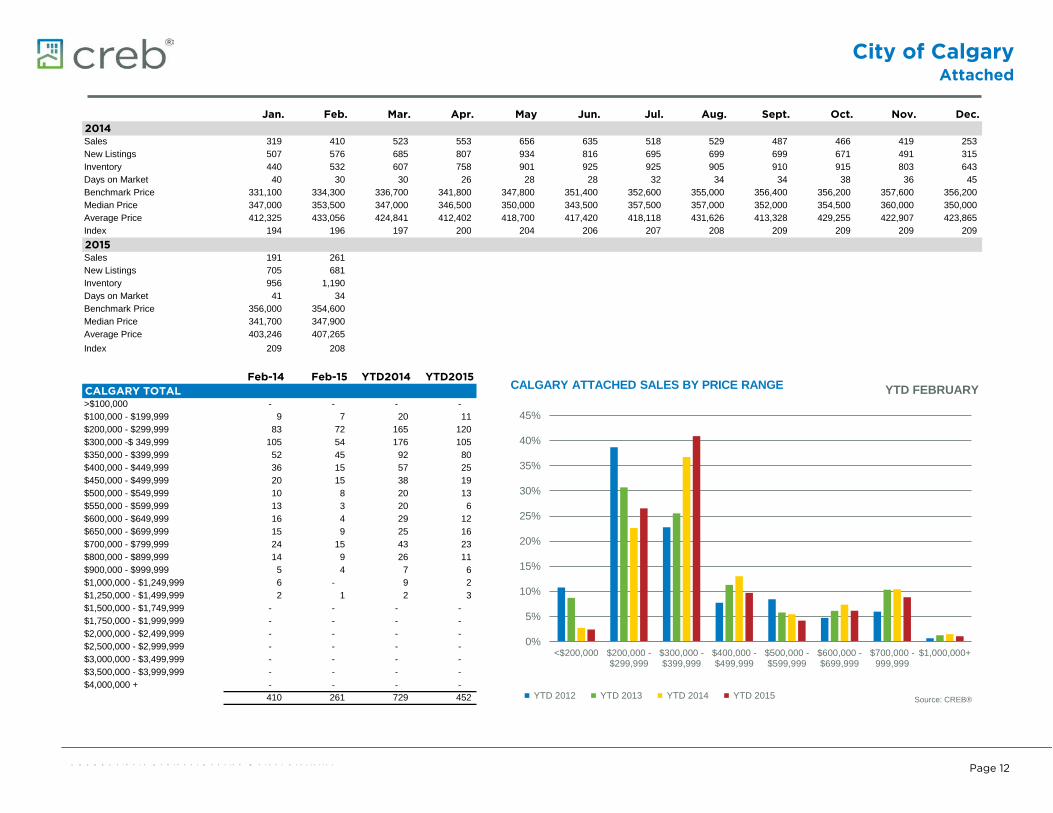
Jan. Feb. Mar. Apr. May Jun. Jul. Aug. Sept. Oct. Nov. Dec.2014 01/01/14 02/01/14 03/01/14 04/01/14 05/01/14 06/01/14 07/01/14 08/01/14 09/01/14 10/01/14 11/01/14 12/01/14
m_CM_ASales 319 410 523 553 656 635 518 529 487 466 419 253 m_CM_ANew Listings 507 576 685 807 934 816 695 699 699 671 491 315 m_Cm_CInventory 440 532 607 758 901 925 925 905 910 915 803 643 m_cm_Days on Market 40 30 30 26 28 28 32 34 34 38 36 45 m_cm_Benchmark Price 331,100 334,300 336,700 341,800 347,800 351,400 352,600 355,000 356,400 356,200 357,600 356,200 m_cm_Median Price 347,000 353,500 347,000 346,500 350,000 343,500 357,500 357,000 352,000 354,500 360,000 350,000 m_cm_Average Price 412,325 433,056 424,841 412,402 418,700 417,420 418,118 431,626 413,328 429,255 422,907 423,865 m_cm_Index 194 196 197 200 204 206 207 208 209 209 209 209
2015 01/01/15 02/01/15 03/01/15 04/01/15 05/01/15 06/01/15 07/01/15 08/01/15 09/01/15 10/01/15 11/01/15 12/01/15m_CM_ASales 191 261 m_CM_ANew Listings 705 681 m_Cm_CInventory 956 1,190 m_cm_Days on Market 41 34 m_cm_Benchmark Price 356,000 354,600 m_cm_Median Price 341,700 347,900 m_cm_Average Price 403,246 407,265 m_cm_Index 209 208
Feb-14 Feb-15 YTD2014 YTD2015CALGARY TOTAL 02/01/14 02/01/15 02/01/14 02/01/15
m_Cytd_ >$100,000 - - - - m_Cytd_ $100,000 - $199,999 9 7 20 11 m_Cytd_ $200,000 - $299,999 83 72 165 120 m_Cytd_ $300,000 -$ 349,999 105 54 176 105 m_Cytd_ $350,000 - $399,999 52 45 92 80 m_Cytd_ $400,000 - $449,999 36 15 57 25 m_Cytd_ $450,000 - $499,999 20 15 38 19 m_Cytd_ $500,000 - $549,999 10 8 20 13 m_Cytd_ $550,000 - $599,999 13 3 20 6 m_Cytd_ $600,000 - $649,999 16 4 29 12 m_Cytd_ $650,000 - $699,999 15 9 25 16 m_Cytd_ $700,000 - $799,999 24 15 43 23 m_Cytd_ $800,000 - $899,999 14 9 26 11 m_Cytd_ $900,000 - $999,999 5 4 7 6 m_Cytd_ $1,000,000 - $1,249,999 6 - 9 2 m_Cytd_ $1,250,000 - $1,499,999 2 1 2 3 m_Cytd_ $1,500,000 - $1,749,999 - - - - m_Cytd_ $1,750,000 - $1,999,999 - - - - m_Cytd_ $2,000,000 - $2,499,999 - - - - m_Cytd_ $2,500,000 - $2,999,999 - - - - m_Cytd_ $3,000,000 - $3,499,999 - - - - m_Cytd_ $3,500,000 - $3,999,999 - - - - m_Cytd_ $4,000,000 + - - - -
410 261 729 452
0%
5%
10%
15%
20%
25%
30%
35%
40%
45%
<$200,000 $200,000 -$299,999
$300,000 -$399,999
$400,000 -$499,999
$500,000 -$599,999
$600,000 -$699,999
$700,000 -999,999
$1,000,000+
YTD FEBRUARY CALGARY ATTACHED SALES BY PRICE RANGE
YTD 2012 YTD 2013 YTD 2014 YTD 2015 Source: CREB®
City of CalgaryAttached
C R E B ® C a l g a r y R e g i o n a l H o u s i n g M a r k e t S t a t i s t i c s
Page 13
0
200
400
600
800
1,000
1,200
YTD2005
YTD2006
YTD2007
YTD2008
YTD2009
YTD2010
YTD2011
YTD2012
YTD2013
YTD2014
YTD2015
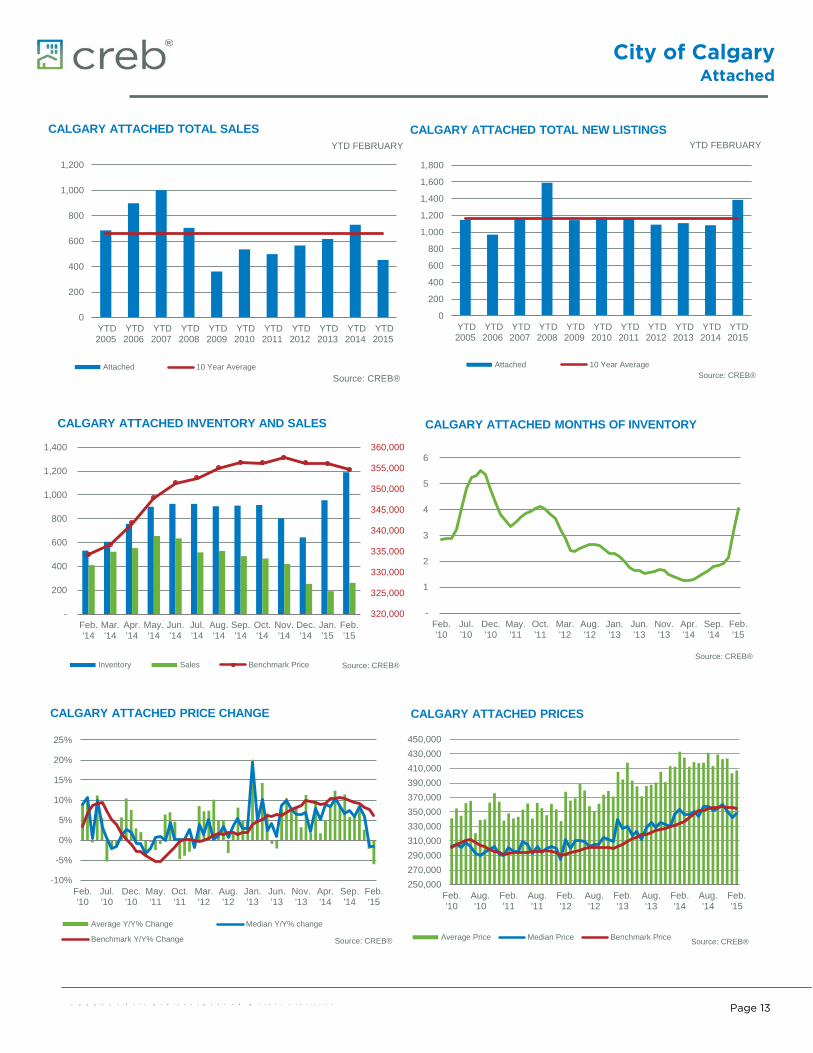
YTD FEBRUARY
CALGARY ATTACHED TOTAL SALES
Attached 10 Year AverageSource: CREB®
0
200
400
600
800
1,000
1,200
1,400
1,600
1,800
YTD2005
YTD2006
YTD2007
YTD2008
YTD2009
YTD2010
YTD2011
YTD2012
YTD2013
YTD2014
YTD2015
YTD FEBRUARY CALGARY ATTACHED TOTAL NEW LISTINGS
Attached 10 Year AverageSource: CREB®
320,000
325,000
330,000
335,000
340,000
345,000
350,000
355,000
360,000
-
200
400
600
800
1,000
1,200
1,400
Feb.'14
Mar.'14
Apr.'14
May.'14
Jun.'14
Jul.'14
Aug.'14
Sep.'14
Oct.'14
Nov.'14
Dec.'14
Jan.'15
Feb.'15
CALGARY ATTACHED INVENTORY AND SALES
Inventory Sales Benchmark Price Source: CREB®
-
1
2
3
4
5
6
Feb.'10
Jul.'10
Dec.'10
May.'11
Oct.'11
Mar.'12
Aug.'12
Jan.'13
Jun.'13
Nov.'13
Apr.'14
Sep.'14
Feb.'15
CALGARY ATTACHED MONTHS OF INVENTORY
Source: CREB®
-10%
-5%
0%
5%
10%
15%
20%
25%
Feb.'10
Jul.'10
Dec.'10
May.'11
Oct.'11
Mar.'12
Aug.'12
Jan.'13
Jun.'13
Nov.'13
Apr.'14
Sep.'14
Feb.'15
CALGARY ATTACHED PRICE CHANGE
Average Y/Y% Change Median Y/Y% change
Benchmark Y/Y% Change Source: CREB®
250,000270,000290,000310,000330,000350,000370,000390,000410,000430,000450,000
Feb.'10
Aug.'10
Feb.'11
Aug.'11
Feb.'12
Aug.'12
Feb.'13
Aug.'13
Feb.'14
Aug.'14
Feb.'15
CALGARY ATTACHED PRICES
Average Price Median Price Benchmark Price Source: CREB®
City of CalgaryApartment
C R E B ® C a l g a r y R e g i o n a l H o u s i n g M a r k e t S t a t i s t i c s
Page 14
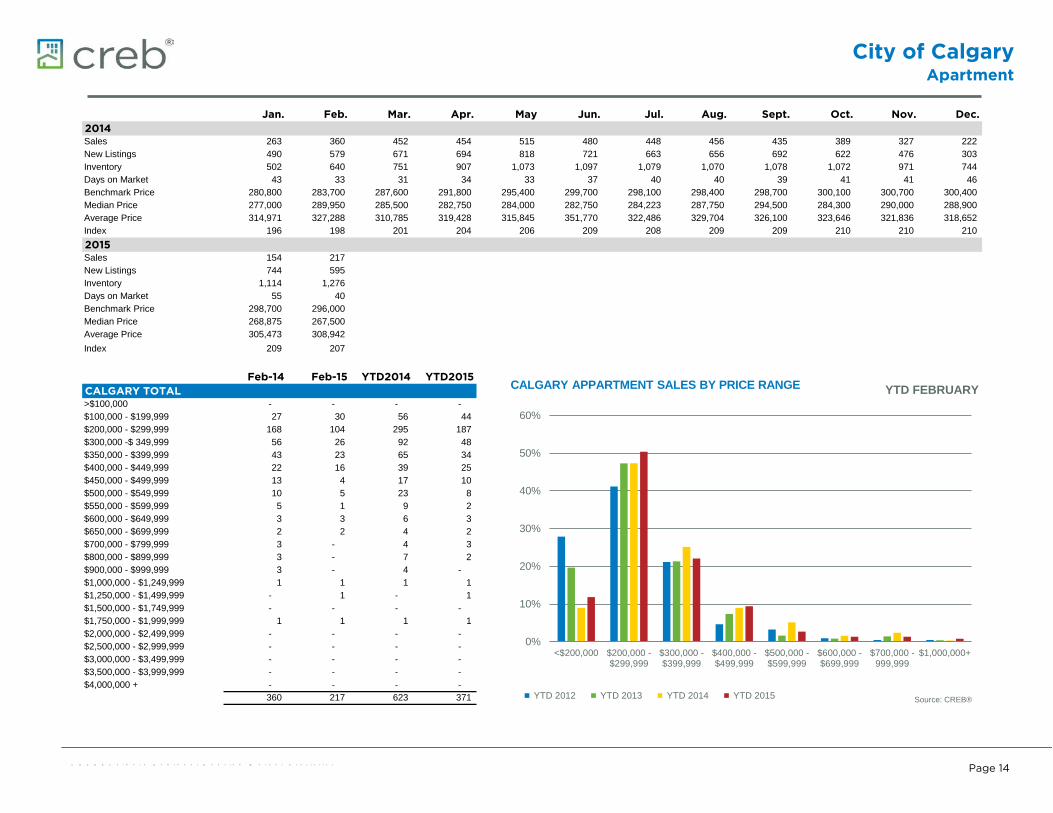
Jan. Feb. Mar. Apr. May Jun. Jul. Aug. Sept. Oct. Nov. Dec.2014 01/01/14 02/01/14 03/01/14 04/01/14 05/01/14 06/01/14 07/01/14 08/01/14 09/01/14 10/01/14 11/01/14 12/01/14
m_CM_a Sales 263 360 452 454 515 480 448 456 435 389 327 222 m_CM_a New Listings 490 579 671 694 818 721 663 656 692 622 476 303 m_Cm_CInventory 502 640 751 907 1,073 1,097 1,079 1,070 1,078 1,072 971 744 m_cm_Days on Market 43 33 31 34 33 37 40 40 39 41 41 46 m_cm_Benchmark Price 280,800 283,700 287,600 291,800 295,400 299,700 298,100 298,400 298,700 300,100 300,700 300,400 m_cm_Median Price 277,000 289,950 285,500 282,750 284,000 282,750 284,223 287,750 294,500 284,300 290,000 288,900 m_cm_Average Price 314,971 327,288 310,785 319,428 315,845 351,770 322,486 329,704 326,100 323,646 321,836 318,652 m_cm_Index 196 198 201 204 206 209 208 209 209 210 210 210
2015 01/01/15 02/01/15 03/01/15 04/01/15 05/01/15 06/01/15 07/01/15 08/01/15 09/01/15 10/01/15 11/01/15 12/01/15m_CM_a Sales 154 217 m_CM_a New Listings 744 595 m_Cm_CInventory 1,114 1,276 m_cm_Days on Market 55 40 m_cm_Benchmark Price 298,700 296,000 m_cm_Median Price 268,875 267,500 m_cm_Average Price 305,473 308,942 m_cm_Index 209 207
Feb-14 Feb-15 YTD2014 YTD2015CALGARY TOTAL 02/01/14 02/01/15 02/01/14 02/01/15
m_Cytd_ >$100,000 - - - - m_Cytd_ $100,000 - $199,999 27 30 56 44 m_Cytd_ $200,000 - $299,999 168 104 295 187 m_Cytd_ $300,000 -$ 349,999 56 26 92 48 m_Cytd_ $350,000 - $399,999 43 23 65 34 m_Cytd_ $400,000 - $449,999 22 16 39 25 m_Cytd_ $450,000 - $499,999 13 4 17 10 m_Cytd_ $500,000 - $549,999 10 5 23 8 m_Cytd_ $550,000 - $599,999 5 1 9 2 m_Cytd_ $600,000 - $649,999 3 3 6 3 m_Cytd_ $650,000 - $699,999 2 2 4 2 m_Cytd_ $700,000 - $799,999 3 - 4 3 m_Cytd_ $800,000 - $899,999 3 - 7 2 m_Cytd_ $900,000 - $999,999 3 - 4 - m_Cytd_ $1,000,000 - $1,249,999 1 1 1 1 m_Cytd_ $1,250,000 - $1,499,999 - 1 - 1 m_Cytd_ $1,500,000 - $1,749,999 - - - - m_Cytd_ $1,750,000 - $1,999,999 1 1 1 1 m_Cytd_ $2,000,000 - $2,499,999 - - - - m_Cytd_ $2,500,000 - $2,999,999 - - - - m_Cytd_ $3,000,000 - $3,499,999 - - - - m_Cytd_ $3,500,000 - $3,999,999 - - - - m_Cytd_ $4,000,000 + - - - -
360 217 623 371
0%
10%
20%
30%
40%
50%
60%
<$200,000 $200,000 -$299,999
$300,000 -$399,999
$400,000 -$499,999
$500,000 -$599,999
$600,000 -$699,999
$700,000 -999,999
$1,000,000+
YTD FEBRUARY CALGARY APPARTMENT SALES BY PRICE RANGE
YTD 2012 YTD 2013 YTD 2014 YTD 2015 Source: CREB®

City of CalgaryApartment
C R E B ® C a l g a r y R e g i o n a l H o u s i n g M a r k e t S t a t i s t i c s
Page 15
0
200
400
600
800
1,000
1,200
YTD2005
YTD2006
YTD2007
YTD2008
YTD2009
YTD2010
YTD2011
YTD2012
YTD2013
YTD2014
YTD2015
YTD FEBRUARY
CALGARY APARTMENT TOTAL SALES
Apartment 10 Year AverageSource: CREB®
0
200
400
600
800
1,000
1,200
1,400
1,600
1,800
YTD2005
YTD2006
YTD2007
YTD2008
YTD2009
YTD2010
YTD2011
YTD2012
YTD2013
YTD2014
YTD2015
YTD FEBRUARY CALGARY APARTMENT TOTAL NEW LISTINGS
Apartment 10 Year AverageSource: CREB®
275,000
280,000
285,000
290,000
295,000
300,000
305,000
-
200
400
600
800
1,000
1,200
1,400
Feb.'14
Mar.'14
Apr.'14
May.'14
Jun.'14
Jul.'14
Aug.'14
Sep.'14
Oct.'14
Nov.'14
Dec.'14
Jan.'15
Feb.'15
CALGARY APARTMENT INVENTORY AND SALES
inventory Sales Benchmark Price Source: CREB®
-
1
2
3
4
5
6
7
Feb.'10
Jul.'10
Dec.'10
May.'11
Oct.'11
Mar.'12
Aug.'12
Jan.'13
Jun.'13
Nov.'13
Apr.'14
Sep.'14
Feb.'15
CALGARY APARTMENT MONTHS OF INVENTORY
Source: CREB®
-20%
-15%
-10%
-5%
0%
5%
10%
15%
20%
25%
Feb.'10
Jul.'10
Dec.'10
May.'11
Oct.'11
Mar.'12
Aug.'12
Jan.'13
Jun.'13
Nov.'13
Apr.'14
Sep.'14
Feb.'15
CALGARY APARTMENT PRICE CHANGE
Average Y/Y% Change Median Y/Y% change
Benchmark Y/Y% Change Source: CREB®
200,000
220,000
240,000
260,000
280,000
300,000
320,000
340,000
360,000
Feb.'10
Aug.'10
Feb.'11
Aug.'11
Feb.'12
Aug.'12
Feb.'13
Aug.'13
Feb.'14
Aug.'14
Feb.'15
CALGARY APARTMENT PRICES
Average Price Median Price Benchmark Price Source: CREB®
AirdrieTotal Residential
C R E B ® C a l g a r y R e g i o n a l H o u s i n g M a r k e t S t a t i s t i c s
Page 16
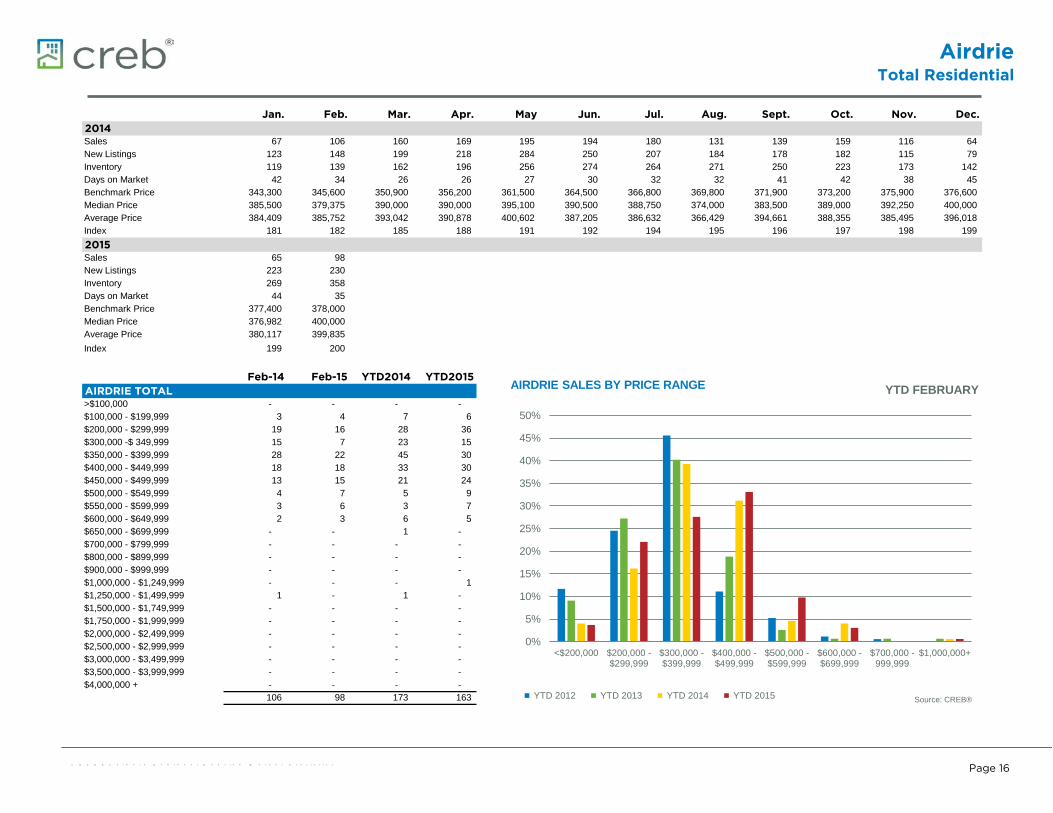
Jan. Feb. Mar. Apr. May Jun. Jul. Aug. Sept. Oct. Nov. Dec.2014 01/01/14 02/01/14 03/01/14 04/01/14 05/01/14 06/01/14 07/01/14 08/01/14 09/01/14 10/01/14 11/01/14 12/01/14
m_AIR_RSales 67 106 160 169 195 194 180 131 139 159 116 64 m_AIR_RNew Listings 123 148 199 218 284 250 207 184 178 182 115 79 m_Am_AInventory 119 139 162 196 256 274 264 271 250 223 173 142 m_AIR_Days on Market 42 34 26 26 27 30 32 32 41 42 38 45 m_AIR_Benchmark Price 343,300 345,600 350,900 356,200 361,500 364,500 366,800 369,800 371,900 373,200 375,900 376,600 m_AIR_Median Price 385,500 379,375 390,000 390,000 395,100 390,500 388,750 374,000 383,500 389,000 392,250 400,000 m_AIR_Average Price 384,409 385,752 393,042 390,878 400,602 387,205 386,632 366,429 394,661 388,355 385,495 396,018 m_AIR_Index 181 182 185 188 191 192 194 195 196 197 198 199
2015 01/01/15 02/01/15 03/01/15 04/01/15 05/01/15 06/01/15 07/01/15 08/01/15 09/01/15 10/01/15 11/01/15 12/01/15m_AIR_RSales 65 98 m_AIR_RNew Listings 223 230 m_Am_AInventory 269 358 m_AIR_Days on Market 44 35 m_AIR_Benchmark Price 377,400 378,000 m_AIR_Median Price 376,982 400,000 m_AIR_Average Price 380,117 399,835 m_AIR_Index 199 200
Feb-14 Feb-15 YTD2014 YTD2015AIRDRIE TOTAL 02/01/14 02/01/15 02/01/14 02/01/15
m_Aytd_ >$100,000 - - - - m_Aytd_ $100,000 - $199,999 3 4 7 6 m_Aytd_ $200,000 - $299,999 19 16 28 36 m_Aytd_ $300,000 -$ 349,999 15 7 23 15 m_Aytd_ $350,000 - $399,999 28 22 45 30 m_Aytd_ $400,000 - $449,999 18 18 33 30 m_Aytd_ $450,000 - $499,999 13 15 21 24 m_Aytd_ $500,000 - $549,999 4 7 5 9 m_Aytd_ $550,000 - $599,999 3 6 3 7 m_Aytd_ $600,000 - $649,999 2 3 6 5 m_Aytd_ $650,000 - $699,999 - - 1 - m_Aytd_ $700,000 - $799,999 - - - - m_Aytd_ $800,000 - $899,999 - - - - m_Aytd_ $900,000 - $999,999 - - - - m_Aytd_ $1,000,000 - $1,249,999 - - - 1 m_Aytd_ $1,250,000 - $1,499,999 1 - 1 - m_Aytd_ $1,500,000 - $1,749,999 - - - - m_Aytd_ $1,750,000 - $1,999,999 - - - - m_Aytd_ $2,000,000 - $2,499,999 - - - - m_Aytd_ $2,500,000 - $2,999,999 - - - - m_Aytd_ $3,000,000 - $3,499,999 - - - - m_Aytd_ $3,500,000 - $3,999,999 - - - - m_Aytd_ $4,000,000 + - - - -
106 98 173 163
0%
5%
10%
15%
20%
25%
30%
35%
40%
45%
50%
<$200,000 $200,000 -$299,999
$300,000 -$399,999
$400,000 -$499,999
$500,000 -$599,999
$600,000 -$699,999
$700,000 -999,999
$1,000,000+
YTD FEBRUARY AIRDRIE SALES BY PRICE RANGE
YTD 2012 YTD 2013 YTD 2014 YTD 2015 Source: CREB®

AirdrieTotal Residential
C R E B ® C a l g a r y R e g i o n a l H o u s i n g M a r k e t S t a t i s t i c s
Page 17
0
50
100
150
200
250
300
YTD2005
YTD2006
YTD2007
YTD2008
YTD2009
YTD2010
YTD2011
YTD2012
YTD2013
YTD2014
YTD2015
YTD FEBRUARY
AIRDRIE TOTAL SALES
Total Residential 10 Year AverageSource: CREB®
050
100150200250300350400450500
YTD2005
YTD2006
YTD2007
YTD2008
YTD2009
YTD2010
YTD2011
YTD2012
YTD2013
YTD2014
YTD2015
YTD FEBRUARY AIRDRIE TOTAL NEW LISTINGS
Total Residential 10 Year AverageSource: CREB®
320,000
330,000
340,000
350,000
360,000
370,000
380,000
390,000
-
50
100
150
200
250
300
350
400
Feb.'14
Mar.'14
Apr.'14
May.'14
Jun.'14
Jul.'14
Aug.'14
Sep.'14
Oct.'14
Nov.'14
Dec.'14
Jan.'15
Feb.'15
AIRDRIE INVENTORY AND SALES
inventory Sales Benchmark Price Source: CREB®
-
1
2
3
4
5
6
Feb.'10
Jul.'10
Dec.'10
May.'11
Oct.'11
Mar.'12
Aug.'12
Jan.'13
Jun.'13
Nov.'13
Apr.'14
Sep.'14
Feb.'15
AIRDRIE MONTHS OF INVENTORY
Source: CREB®
-15%
-10%
-5%
0%
5%
10%
15%
20%
Feb.'10
Jul.'10
Dec.'10
May.'11
Oct.'11
Mar.'12
Aug.'12
Jan.'13
Jun.'13
Nov.'13
Apr.'14
Sep.'14
Feb.'15
AIRDRIE PRICE CHANGE
Average Y/Y% Change Median Y/Y% change
Benchmark Y/Y% Change Source: CREB®
250,000
270,000
290,000
310,000
330,000
350,000
370,000
390,000
410,000
Feb.'10
Aug.'10
Feb.'11
Aug.'11
Feb.'12
Aug.'12
Feb.'13
Aug.'13
Feb.'14
Aug.'14
Feb.'15
AIRDRIE PRICES
Average Price Median Price Benchmark Price Source: CREB®

Region of RockyviewTotal Residential
C R E B ® C a l g a r y R e g i o n a l H o u s i n g M a r k e t S t a t i s t i c s
Page 18
Jan. Feb. Mar. Apr. May Jun. Jul. Aug. Sept. Oct. Nov. Dec.2014 01/01/14 02/01/14 03/01/14 04/01/14 05/01/14 06/01/14 07/01/14 08/01/14 09/01/14 10/01/14 11/01/14 12/01/14
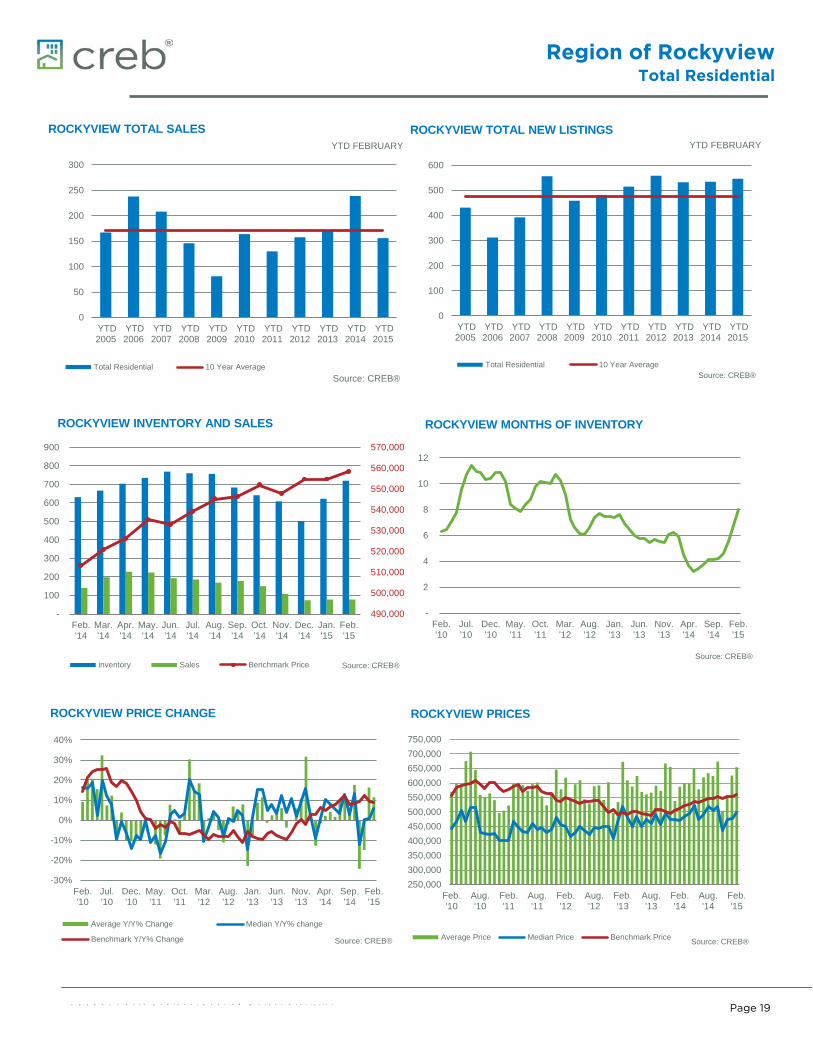
m_mdrv_Sales 98 141 198 228 224 194 186 170 178 151 108 74 m_mdrv_New Listings 256 278 327 330 352 357 289 264 256 237 196 127 m_mm_mInventory 570 631 666 703 735 769 760 757 683 641 608 502 m_mdrvDays on Market 76 73 55 49 54 57 63 58 58 68 54 70 m_mdrvBenchmark Price 506,500 513,300 521,000 526,000 535,200 532,800 539,000 545,100 546,400 551,900 547,900 554,700 m_mdrvMedian Price 475,500 470,000 485,000 495,500 524,000 475,000 490,000 520,000 506,000 520,000 435,000 475,000 m_mdrvAverage Price 537,753 587,005 599,022 599,400 649,548 578,289 618,967 633,890 623,992 673,230 504,264 557,609 m_mdrvIndex 164 166 169 170 173 172 174 176 177 179 177 180
2015 01/01/15 02/01/15 03/01/15 04/01/15 05/01/15 06/01/15 07/01/15 08/01/15 09/01/15 10/01/15 11/01/15 12/01/15m_mdrv_Sales 78 78 m_mdrv_New Listings 289 257 m_mm_mInventory 622 720 m_mdrvDays on Market 76 56 m_mdrvBenchmark Price 554,700 558,400 m_mdrvMedian Price 478,750 497,500 m_mdrvAverage Price 625,531 654,260 m_mdrvIndex 180 181
Feb-14 Feb-15 YTD2014 YTD2015ROCKYVIEW TOTAL 02/01/14 02/01/15 02/01/14 02/01/15
m_mytd_ >$100,000 - - 1 - m_mytd_ $100,000 - $199,999 6 - 8 1 m_mytd_ $200,000 - $299,999 14 11 26 22 m_mytd_ $300,000 -$ 349,999 12 5 19 7 m_mytd_ $350,000 - $399,999 16 7 28 15 m_mytd_ $400,000 - $449,999 17 7 26 19 m_mytd_ $450,000 - $499,999 17 9 30 20 m_mytd_ $500,000 - $549,999 9 6 16 10 m_mytd_ $550,000 - $599,999 10 4 15 10 m_mytd_ $600,000 - $649,999 4 4 12 6 m_mytd_ $650,000 - $699,999 6 4 7 6 m_mytd_ $700,000 - $799,999 6 3 12 6 m_mytd_ $800,000 - $899,999 7 5 11 12 m_mytd_ $900,000 - $999,999 3 2 7 3 m_mytd_ $1,000,000 - $1,249,999 6 4 11 8 m_mytd_ $1,250,000 - $1,499,999 2 3 3 4 m_mytd_ $1,500,000 - $1,749,999 1 1 1 1 m_mytd_ $1,750,000 - $1,999,999 2 - 3 - m_mytd_ $2,000,000 - $2,499,999 1 2 1 3 m_mytd_ $2,500,000 - $2,999,999 2 - 2 - m_mytd_ $3,000,000 - $3,499,999 - 1 - 3 m_mytd_ $3,500,000 - $3,999,999 - - - - m_mytd_ $4,000,000 + - - - -
141 78 239 156
0%
5%
10%
15%
20%
25%
30%
<$200,000 $200,000 -$299,999
$300,000 -$399,999
$400,000 -$499,999
$500,000 -$599,999
$600,000 -$699,999
$700,000 -999,999
$1,000,000+
YTD FEBRUARY ROCKYVIEW SALES BY PRICE RANGE
YTD 2012 YTD 2013 YTD 2014 YTD 2015 Source: CREB®
Region of RockyviewTotal Residential
C R E B ® C a l g a r y R e g i o n a l H o u s i n g M a r k e t S t a t i s t i c s
Page 19
0
50
100
150
200
250
300
YTD2005
YTD2006
YTD2007
YTD2008
YTD2009
YTD2010
YTD2011
YTD2012
YTD2013
YTD2014
YTD2015
YTD FEBRUARY
ROCKYVIEW TOTAL SALES
Total Residential 10 Year AverageSource: CREB®
0
100
200
300
400
500
600
YTD2005
YTD2006
YTD2007
YTD2008
YTD2009
YTD2010
YTD2011
YTD2012
YTD2013
YTD2014
YTD2015
YTD FEBRUARY ROCKYVIEW TOTAL NEW LISTINGS
Total Residential 10 Year AverageSource: CREB®
490,000
500,000
510,000
520,000
530,000
540,000
550,000
560,000
570,000
-
100
200
300
400
500
600
700
800
900
Feb.'14
Mar.'14
Apr.'14
May.'14
Jun.'14
Jul.'14
Aug.'14
Sep.'14
Oct.'14
Nov.'14
Dec.'14
Jan.'15
Feb.'15
ROCKYVIEW INVENTORY AND SALES
inventory Sales Benchmark Price Source: CREB®
-
2
4
6
8
10
12
Feb.'10
Jul.'10
Dec.'10
May.'11
Oct.'11
Mar.'12
Aug.'12
Jan.'13
Jun.'13
Nov.'13
Apr.'14
Sep.'14
Feb.'15
ROCKYVIEW MONTHS OF INVENTORY
Source: CREB®
-30%
-20%
-10%
0%
10%
20%
30%
40%
Feb.'10
Jul.'10
Dec.'10
May.'11
Oct.'11
Mar.'12
Aug.'12
Jan.'13
Jun.'13
Nov.'13
Apr.'14
Sep.'14
Feb.'15
ROCKYVIEW PRICE CHANGE
Average Y/Y% Change Median Y/Y% change
Benchmark Y/Y% Change Source: CREB®
250,000300,000350,000400,000450,000500,000550,000600,000650,000700,000750,000
Feb.'10
Aug.'10
Feb.'11
Aug.'11
Feb.'12
Aug.'12
Feb.'13
Aug.'13
Feb.'14
Aug.'14
Feb.'15
ROCKYVIEW PRICES
Average Price Median Price Benchmark Price Source: CREB®
Region of FoothillsTotal Residential
C R E B ® C a l g a r y R e g i o n a l H o u s i n g M a r k e t S t a t i s t i c s
Page 20
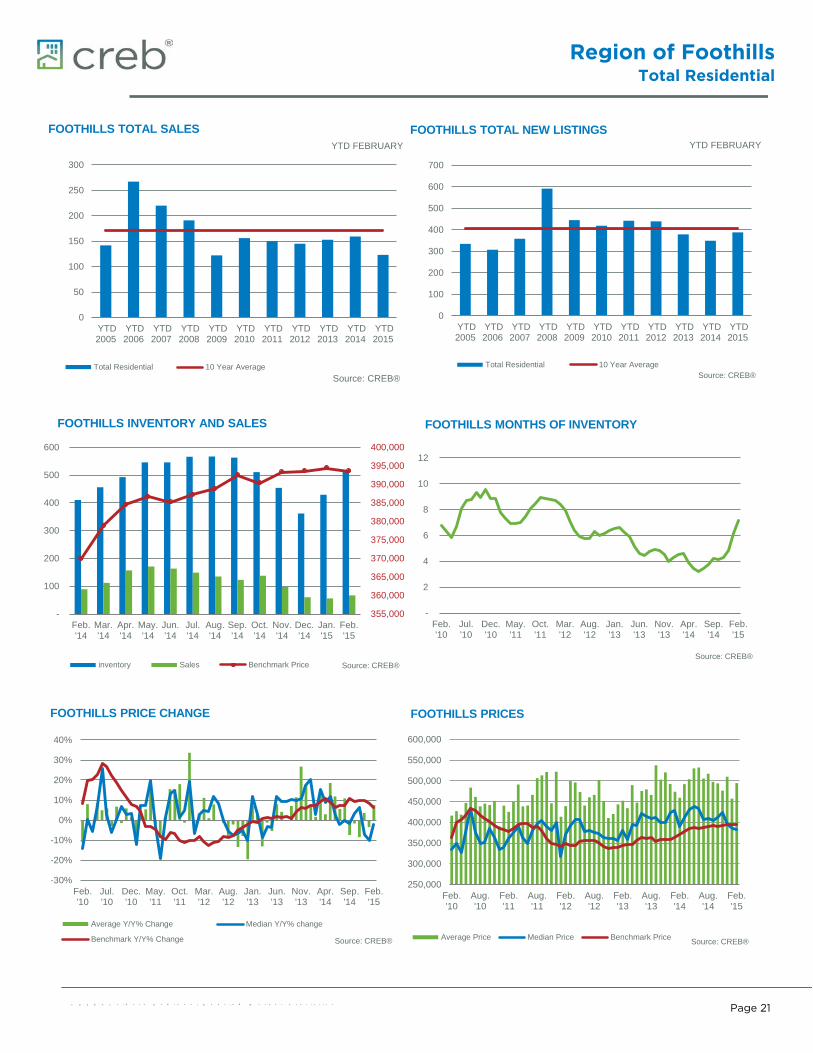
Jan. Feb. Mar. Apr. May Jun. Jul. Aug. Sept. Oct. Nov. Dec.2014 01/01/14 02/01/14 03/01/14 04/01/14 05/01/14 06/01/14 07/01/14 08/01/14 09/01/14 10/01/14 11/01/14 12/01/14
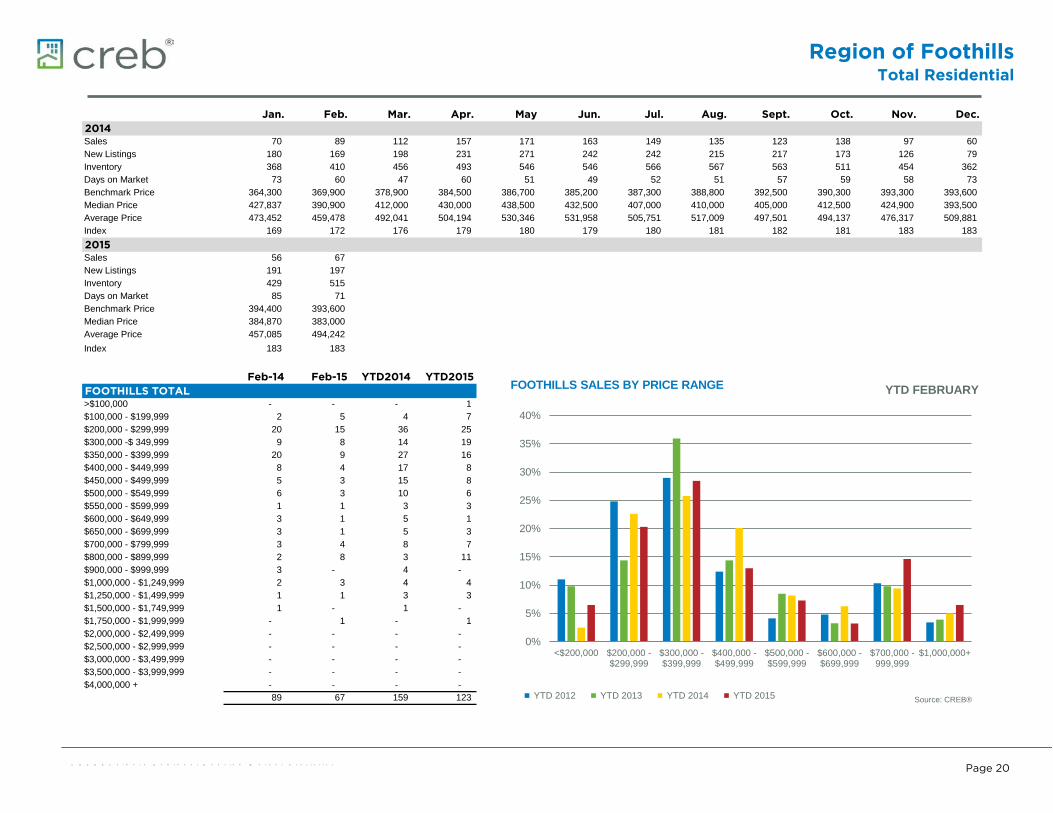
m_mdFHSales 70 89 112 157 171 163 149 135 123 138 97 60 m_mdFHNew Listings 180 169 198 231 271 242 242 215 217 173 126 79 m_mm_mInventory 368 410 456 493 546 546 566 567 563 511 454 362 m_mdFDays on Market 73 60 47 60 51 49 52 51 57 59 58 73 m_mdFBenchmark Price 364,300 369,900 378,900 384,500 386,700 385,200 387,300 388,800 392,500 390,300 393,300 393,600 m_mdFMedian Price 427,837 390,900 412,000 430,000 438,500 432,500 407,000 410,000 405,000 412,500 424,900 393,500 m_mdFAverage Price 473,452 459,478 492,041 504,194 530,346 531,958 505,751 517,009 497,501 494,137 476,317 509,881 m_mdFIndex 169 172 176 179 180 179 180 181 182 181 183 183
2015 01/01/15 02/01/15 03/01/15 04/01/15 05/01/15 06/01/15 07/01/15 08/01/15 09/01/15 10/01/15 11/01/15 12/01/15m_mdFHSales 56 67 m_mdFHNew Listings 191 197 m_mm_mInventory 429 515 m_mdFDays on Market 85 71 m_mdFBenchmark Price 394,400 393,600 m_mdFMedian Price 384,870 383,000 m_mdFAverage Price 457,085 494,242 m_mdFIndex 183 183
Feb-14 Feb-15 YTD2014 YTD2015FOOTHILLS TOTAL 02/01/14 02/01/15 02/01/14 02/01/15
m_mytd_ >$100,000 - - - 1 m_mytd_ $100,000 - $199,999 2 5 4 7 m_mytd_ $200,000 - $299,999 20 15 36 25 m_mytd_ $300,000 -$ 349,999 9 8 14 19 m_mytd_ $350,000 - $399,999 20 9 27 16 m_mytd_ $400,000 - $449,999 8 4 17 8 m_mytd_ $450,000 - $499,999 5 3 15 8 m_mytd_ $500,000 - $549,999 6 3 10 6 m_mytd_ $550,000 - $599,999 1 1 3 3 m_mytd_ $600,000 - $649,999 3 1 5 1 m_mytd_ $650,000 - $699,999 3 1 5 3 m_mytd_ $700,000 - $799,999 3 4 8 7 m_mytd_ $800,000 - $899,999 2 8 3 11 m_mytd_ $900,000 - $999,999 3 - 4 - m_mytd_ $1,000,000 - $1,249,999 2 3 4 4 m_mytd_ $1,250,000 - $1,499,999 1 1 3 3 m_mytd_ $1,500,000 - $1,749,999 1 - 1 - m_mytd_ $1,750,000 - $1,999,999 - 1 - 1 m_mytd_ $2,000,000 - $2,499,999 - - - - m_mytd_ $2,500,000 - $2,999,999 - - - - m_mytd_ $3,000,000 - $3,499,999 - - - - m_mytd_ $3,500,000 - $3,999,999 - - - - m_mytd_ $4,000,000 + - - - -
89 67 159 123
0%
5%
10%
15%
20%
25%
30%
35%
40%
<$200,000 $200,000 -$299,999
$300,000 -$399,999
$400,000 -$499,999
$500,000 -$599,999
$600,000 -$699,999
$700,000 -999,999
$1,000,000+
YTD FEBRUARY FOOTHILLS SALES BY PRICE RANGE
YTD 2012 YTD 2013 YTD 2014 YTD 2015 Source: CREB®
Region of FoothillsTotal Residential
C R E B ® C a l g a r y R e g i o n a l H o u s i n g M a r k e t S t a t i s t i c s
Page 21
0
50
100
150
200
250
300
YTD2005
YTD2006
YTD2007
YTD2008
YTD2009
YTD2010
YTD2011
YTD2012
YTD2013
YTD2014
YTD2015
YTD FEBRUARY
FOOTHILLS TOTAL SALES
Total Residential 10 Year AverageSource: CREB®
0
100
200
300
400
500
600
700
YTD2005
YTD2006
YTD2007
YTD2008
YTD2009
YTD2010
YTD2011
YTD2012
YTD2013
YTD2014
YTD2015
YTD FEBRUARY FOOTHILLS TOTAL NEW LISTINGS
Total Residential 10 Year AverageSource: CREB®
355,000
360,000
365,000
370,000
375,000
380,000
385,000
390,000
395,000
400,000
-
100
200
300
400
500
600
Feb.'14
Mar.'14
Apr.'14
May.'14
Jun.'14
Jul.'14
Aug.'14
Sep.'14
Oct.'14
Nov.'14
Dec.'14
Jan.'15
Feb.'15
FOOTHILLS INVENTORY AND SALES
inventory Sales Benchmark Price Source: CREB®
-
2
4
6
8
10
12
Feb.'10
Jul.'10
Dec.'10
May.'11
Oct.'11
Mar.'12
Aug.'12
Jan.'13
Jun.'13
Nov.'13
Apr.'14
Sep.'14
Feb.'15
FOOTHILLS MONTHS OF INVENTORY
Source: CREB®
-30%
-20%
-10%
0%
10%
20%
30%
40%
Feb.'10
Jul.'10
Dec.'10
May.'11
Oct.'11
Mar.'12
Aug.'12
Jan.'13
Jun.'13
Nov.'13
Apr.'14
Sep.'14
Feb.'15
FOOTHILLS PRICE CHANGE
Average Y/Y% Change Median Y/Y% change
Benchmark Y/Y% Change Source: CREB®
250,000
300,000
350,000
400,000
450,000
500,000
550,000
600,000
Feb.'10
Aug.'10
Feb.'11
Aug.'11
Feb.'12
Aug.'12
Feb.'13
Aug.'13
Feb.'14
Aug.'14
Feb.'15
FOOTHILLS PRICES
Average Price Median Price Benchmark Price Source: CREB®
Surrounding AreaTotal Residential
C R E B ® C a l g a r y R e g i o n a l H o u s i n g M a r k e t S t a t i s t i c s
Page 22
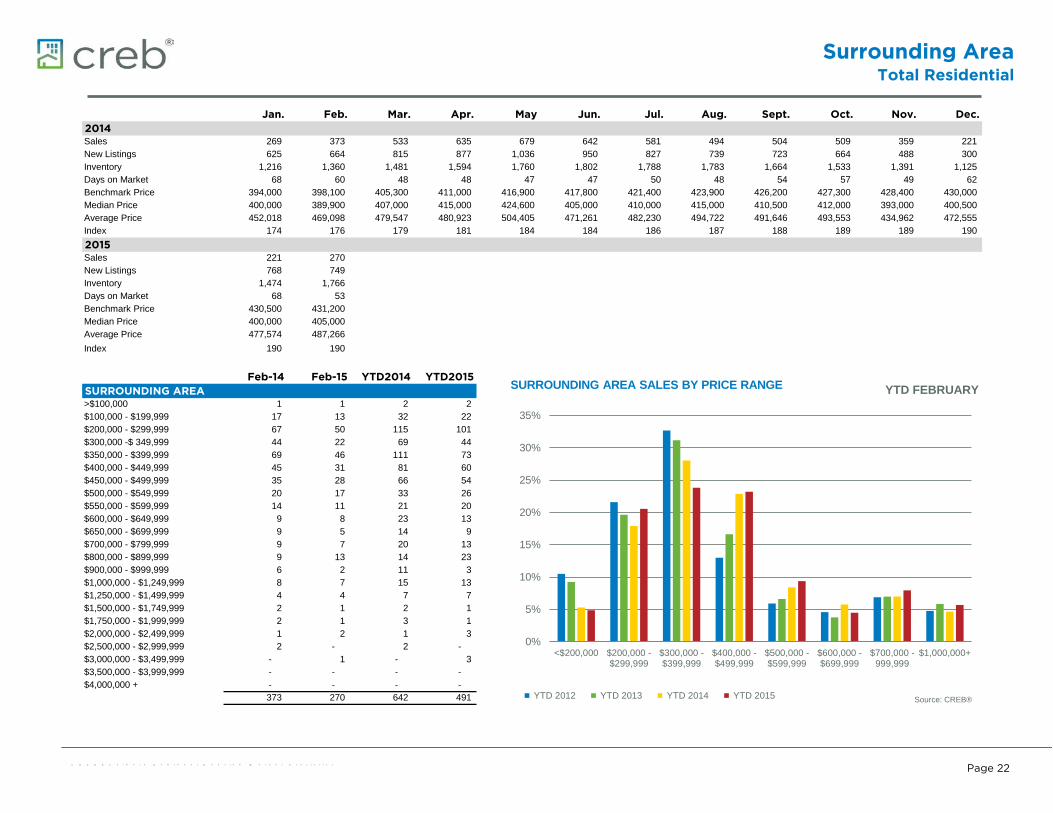
Jan. Feb. Mar. Apr. May Jun. Jul. Aug. Sept. Oct. Nov. Dec.2014 01/01/14 02/01/14 03/01/14 04/01/14 05/01/14 06/01/14 07/01/14 08/01/14 09/01/14 10/01/14 11/01/14 12/01/14
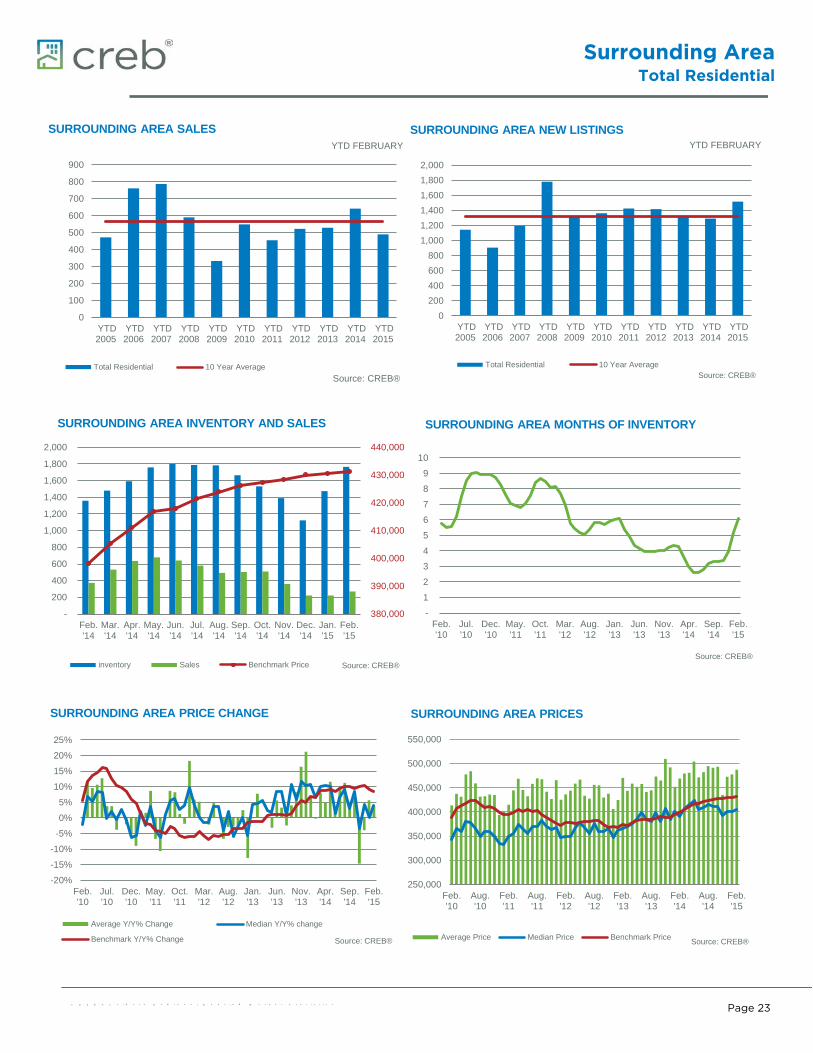
m_SA_R Sales 269 373 533 635 679 642 581 494 504 509 359 221 m_SA_R New Listings 625 664 815 877 1,036 950 827 739 723 664 488 300 m_Sm_SInventory 1,216 1,360 1,481 1,594 1,760 1,802 1,788 1,783 1,664 1,533 1,391 1,125 m_SA_Days on Market 68 60 48 48 47 47 50 48 54 57 49 62 m_SA_Benchmark Price 394,000 398,100 405,300 411,000 416,900 417,800 421,400 423,900 426,200 427,300 428,400 430,000 m_SA_Median Price 400,000 389,900 407,000 415,000 424,600 405,000 410,000 415,000 410,500 412,000 393,000 400,500 m_SA_Average Price 452,018 469,098 479,547 480,923 504,405 471,261 482,230 494,722 491,646 493,553 434,962 472,555 m_SA_Index 174 176 179 181 184 184 186 187 188 189 189 190
2015 01/01/15 02/01/15 03/01/15 04/01/15 05/01/15 06/01/15 07/01/15 08/01/15 09/01/15 10/01/15 11/01/15 12/01/15m_SA_R Sales 221 270 m_SA_R New Listings 768 749 m_Sm_SInventory 1,474 1,766 m_SA_Days on Market 68 53 m_SA_Benchmark Price 430,500 431,200 m_SA_Median Price 400,000 405,000 m_SA_Average Price 477,574 487,266 m_SA_Index 190 190
Feb-14 Feb-15 YTD2014 YTD2015SURROUNDING AREA 02/01/14 02/01/15 02/01/14 02/01/15
m_Sytd_ >$100,000 1 1 2 2 m_Sytd_ $100,000 - $199,999 17 13 32 22 m_Sytd_ $200,000 - $299,999 67 50 115 101 m_Sytd_ $300,000 -$ 349,999 44 22 69 44 m_Sytd_ $350,000 - $399,999 69 46 111 73 m_Sytd_ $400,000 - $449,999 45 31 81 60 m_Sytd_ $450,000 - $499,999 35 28 66 54 m_Sytd_ $500,000 - $549,999 20 17 33 26 m_Sytd_ $550,000 - $599,999 14 11 21 20 m_Sytd_ $600,000 - $649,999 9 8 23 13 m_Sytd_ $650,000 - $699,999 9 5 14 9 m_Sytd_ $700,000 - $799,999 9 7 20 13 m_Sytd_ $800,000 - $899,999 9 13 14 23 m_Sytd_ $900,000 - $999,999 6 2 11 3 m_Sytd_ $1,000,000 - $1,249,999 8 7 15 13 m_Sytd_ $1,250,000 - $1,499,999 4 4 7 7 m_Sytd_ $1,500,000 - $1,749,999 2 1 2 1 m_Sytd_ $1,750,000 - $1,999,999 2 1 3 1 m_Sytd_ $2,000,000 - $2,499,999 1 2 1 3 m_Sytd_ $2,500,000 - $2,999,999 2 - 2 - m_Sytd_ $3,000,000 - $3,499,999 - 1 - 3 m_Sytd_ $3,500,000 - $3,999,999 - - - - m_Sytd_ $4,000,000 + - - - -
373 270 642 491
0%
5%
10%
15%
20%
25%
30%
35%
<$200,000 $200,000 -$299,999
$300,000 -$399,999
$400,000 -$499,999
$500,000 -$599,999
$600,000 -$699,999
$700,000 -999,999
$1,000,000+
YTD FEBRUARY SURROUNDING AREA SALES BY PRICE RANGE
YTD 2012 YTD 2013 YTD 2014 YTD 2015 Source: CREB®
Surrounding AreaTotal Residential
C R E B ® C a l g a r y R e g i o n a l H o u s i n g M a r k e t S t a t i s t i c s
Page 23
0
100
200
300
400
500
600
700
800
900
YTD2005
YTD2006
YTD2007
YTD2008
YTD2009
YTD2010
YTD2011
YTD2012
YTD2013
YTD2014
YTD2015
YTD FEBRUARY
SURROUNDING AREA SALES
Total Residential 10 Year AverageSource: CREB®
0200400600800
1,0001,2001,4001,6001,8002,000
YTD2005
YTD2006
YTD2007
YTD2008
YTD2009
YTD2010
YTD2011
YTD2012
YTD2013
YTD2014
YTD2015
YTD FEBRUARY SURROUNDING AREA NEW LISTINGS
Total Residential 10 Year AverageSource: CREB®
380,000
390,000
400,000
410,000
420,000
430,000
440,000
-
200
400
600
800
1,000
1,200
1,400
1,600
1,800
2,000
Feb.'14
Mar.'14
Apr.'14
May.'14
Jun.'14
Jul.'14
Aug.'14
Sep.'14
Oct.'14
Nov.'14
Dec.'14
Jan.'15
Feb.'15
SURROUNDING AREA INVENTORY AND SALES
inventory Sales Benchmark Price Source: CREB®
-
1
2
3
4
5
6
7
8
9
10
Feb.'10
Jul.'10
Dec.'10
May.'11
Oct.'11
Mar.'12
Aug.'12
Jan.'13
Jun.'13
Nov.'13
Apr.'14
Sep.'14
Feb.'15
SURROUNDING AREA MONTHS OF INVENTORY
Source: CREB®
-20%
-15%
-10%
-5%
0%
5%
10%
15%
20%
25%
Feb.'10
Jul.'10
Dec.'10
May.'11
Oct.'11
Mar.'12
Aug.'12
Jan.'13
Jun.'13
Nov.'13
Apr.'14
Sep.'14
Feb.'15
SURROUNDING AREA PRICE CHANGE
Average Y/Y% Change Median Y/Y% change
Benchmark Y/Y% Change Source: CREB®
250,000
300,000
350,000
400,000
450,000
500,000
550,000
Feb.'10
Aug.'10
Feb.'11
Aug.'11
Feb.'12
Aug.'12
Feb.'13
Aug.'13
Feb.'14
Aug.'14
Feb.'15
SURROUNDING AREA PRICES
Average Price Median Price Benchmark Price Source: CREB®

Economic RegionTotal Residential
C R E B ® C a l g a r y R e g i o n a l H o u s i n g M a r k e t S t a t i s t i c s
Page 24
Jan. Feb. Mar. Apr. May Jun. Jul. Aug. Sept. Oct. Nov. Dec.2014 01/01/14 02/01/14 03/01/14 04/01/14 05/01/14 06/01/14 07/01/14 08/01/14 09/01/14 10/01/14 11/01/14 12/01/14
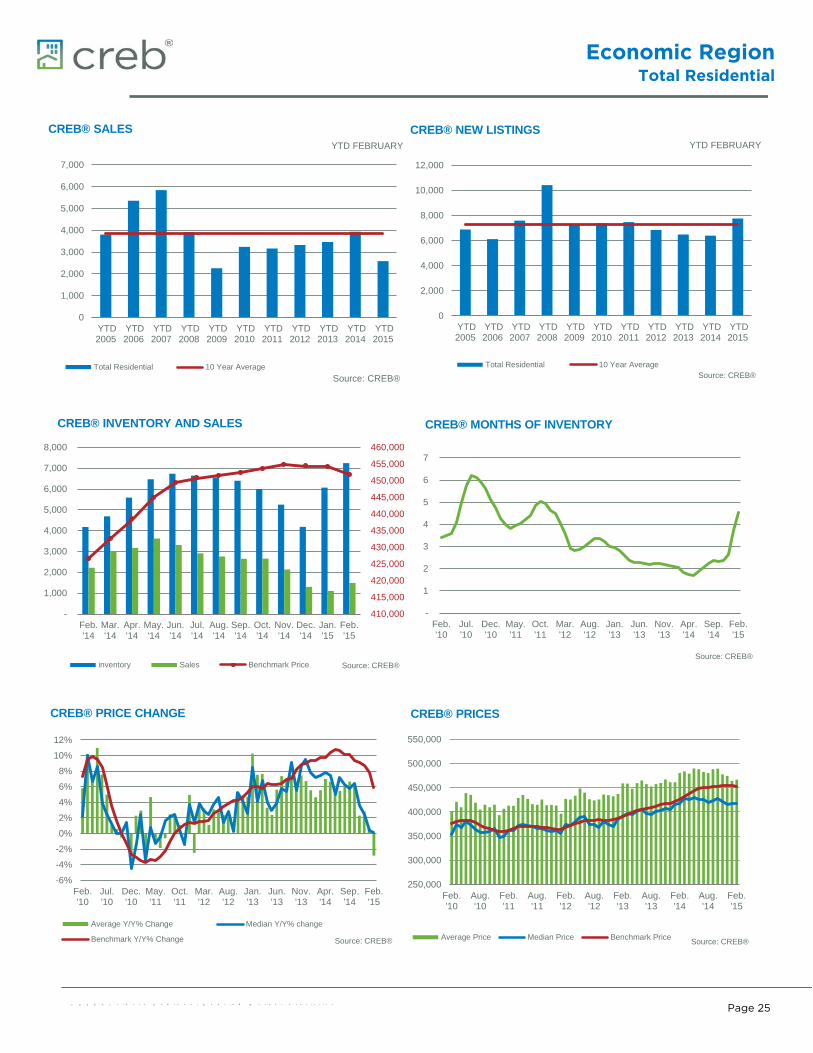
m_CREBSales 1,708 2,223 3,014 3,174 3,624 3,306 2,909 2,757 2,650 2,654 2,138 1,303 m_CREBNew Listings 3,021 3,375 4,134 4,630 5,363 4,767 4,046 3,886 3,982 3,583 2,581 1,680 m_Cm_CInventory 3,571 4,175 4,688 5,588 6,462 6,735 6,640 6,548 6,397 5,999 5,246 4,181 m_CREDays on Market 45 35 31 31 31 33 37 37 39 41 40 46 m_CREBenchmark Price 421,500 426,500 432,700 438,500 445,000 449,300 450,800 451,600 452,500 453,600 454,900 454,400 m_CREMedian Price 415,000 417,900 427,450 426,000 430,000 425,000 425,000 420,000 423,950 428,000 422,000 415,000 m_CREAverage Price 461,526 480,487 483,934 479,281 489,839 488,158 482,588 480,258 488,054 489,636 477,789 474,746 m_CREIndex 196 198 201 204 207 209 209 210 210 211 211 211
2015 01/01/15 02/01/15 03/01/15 04/01/15 05/01/15 06/01/15 07/01/15 08/01/15 09/01/15 10/01/15 11/01/15 12/01/15m_CREBSales 1,100 1,487 m_CREBNew Listings 4,054 3,699 m_Cm_CInventory 6,068 7,236 m_CREDays on Market 47 38 m_CREBenchmark Price 454,200 451,900 m_CREMedian Price 416,750 418,400 m_CREAverage Price 464,274 466,829 m_CREIndex 211 210
Feb-14 Feb-15 YTD2014 YTD2015CREB® 02/01/14 02/01/15 02/01/14 02/01/15
m_Cytd_ >$100,000 1 1 2 2 m_Cytd_ $100,000 - $199,999 53 51 109 78 m_Cytd_ $200,000 - $299,999 350 239 632 430 m_Cytd_ $300,000 -$ 349,999 284 142 493 277 m_Cytd_ $350,000 - $399,999 325 228 573 355 m_Cytd_ $400,000 - $449,999 268 207 485 365 m_Cytd_ $450,000 - $499,999 219 169 403 288 m_Cytd_ $500,000 - $549,999 170 121 316 201 m_Cytd_ $550,000 - $599,999 113 81 195 152 m_Cytd_ $600,000 - $649,999 95 47 152 89 m_Cytd_ $650,000 - $699,999 79 40 131 79 m_Cytd_ $700,000 - $799,999 92 63 153 104 m_Cytd_ $800,000 - $899,999 57 42 99 65 m_Cytd_ $900,000 - $999,999 32 13 50 23 m_Cytd_ $1,000,000 - $1,249,999 40 20 64 41 m_Cytd_ $1,250,000 - $1,499,999 16 10 29 20 m_Cytd_ $1,500,000 - $1,749,999 12 4 17 6 m_Cytd_ $1,750,000 - $1,999,999 8 3 13 3 m_Cytd_ $2,000,000 - $2,499,999 4 4 8 5 m_Cytd_ $2,500,000 - $2,999,999 2 - 4 - m_Cytd_ $3,000,000 - $3,499,999 1 1 1 3 m_Cytd_ $3,500,000 - $3,999,999 2 1 2 1 m_Cytd_ $4,000,000 + - - - -
2,223 1,487 3,931 2,587
0%
5%
10%
15%
20%
25%
30%
35%
<$200,000 $200,000 -$299,999
$300,000 -$399,999
$400,000 -$499,999
$500,000 -$599,999
$600,000 -$699,999
$700,000 -999,999
$1,000,000+
YTD FEBRUARY CREB® SALES BY PRICE RANGE
YTD 2012 YTD 2013 YTD 2014 YTD 2015 Source: CREB®
Economic RegionTotal Residential
C R E B ® C a l g a r y R e g i o n a l H o u s i n g M a r k e t S t a t i s t i c s
Page 25
0
1,000
2,000
3,000
4,000
5,000
6,000
7,000
YTD2005
YTD2006
YTD2007
YTD2008
YTD2009
YTD2010
YTD2011
YTD2012
YTD2013
YTD2014
YTD2015
YTD FEBRUARY
CREB® SALES
Total Residential 10 Year AverageSource: CREB®
0
2,000
4,000
6,000
8,000
10,000
12,000
YTD2005
YTD2006
YTD2007
YTD2008
YTD2009
YTD2010
YTD2011
YTD2012
YTD2013
YTD2014
YTD2015
YTD FEBRUARY CREB® NEW LISTINGS
Total Residential 10 Year AverageSource: CREB®
410,000
415,000
420,000
425,000
430,000
435,000
440,000
445,000
450,000
455,000
460,000
-
1,000
2,000
3,000
4,000
5,000
6,000
7,000
8,000
Feb.'14
Mar.'14
Apr.'14
May.'14
Jun.'14
Jul.'14
Aug.'14
Sep.'14
Oct.'14
Nov.'14
Dec.'14
Jan.'15
Feb.'15
CREB® INVENTORY AND SALES
inventory Sales Benchmark Price Source: CREB®
-
1
2
3
4
5
6
7
Feb.'10
Jul.'10
Dec.'10
May.'11
Oct.'11
Mar.'12
Aug.'12
Jan.'13
Jun.'13
Nov.'13
Apr.'14
Sep.'14
Feb.'15
CREB® MONTHS OF INVENTORY
Source: CREB®
-6%
-4%
-2%
0%
2%
4%
6%
8%
10%
12%
Feb.'10
Jul.'10
Dec.'10
May.'11
Oct.'11
Mar.'12
Aug.'12
Jan.'13
Jun.'13
Nov.'13
Apr.'14
Sep.'14
Feb.'15
CREB® PRICE CHANGE
Average Y/Y% Change Median Y/Y% change
Benchmark Y/Y% Change Source: CREB®
250,000
300,000
350,000
400,000
450,000
500,000
550,000
Feb.'10
Aug.'10
Feb.'11
Aug.'11
Feb.'12
Aug.'12
Feb.'13
Aug.'13
Feb.'14
Aug.'14
Feb.'15
CREB® PRICES
Average Price Median Price Benchmark Price Source: CREB®
Caglary CMATotal Residential
C R E B ® C a l g a r y R e g i o n a l H o u s i n g M a r k e t S t a t i s t i c s
Page 26
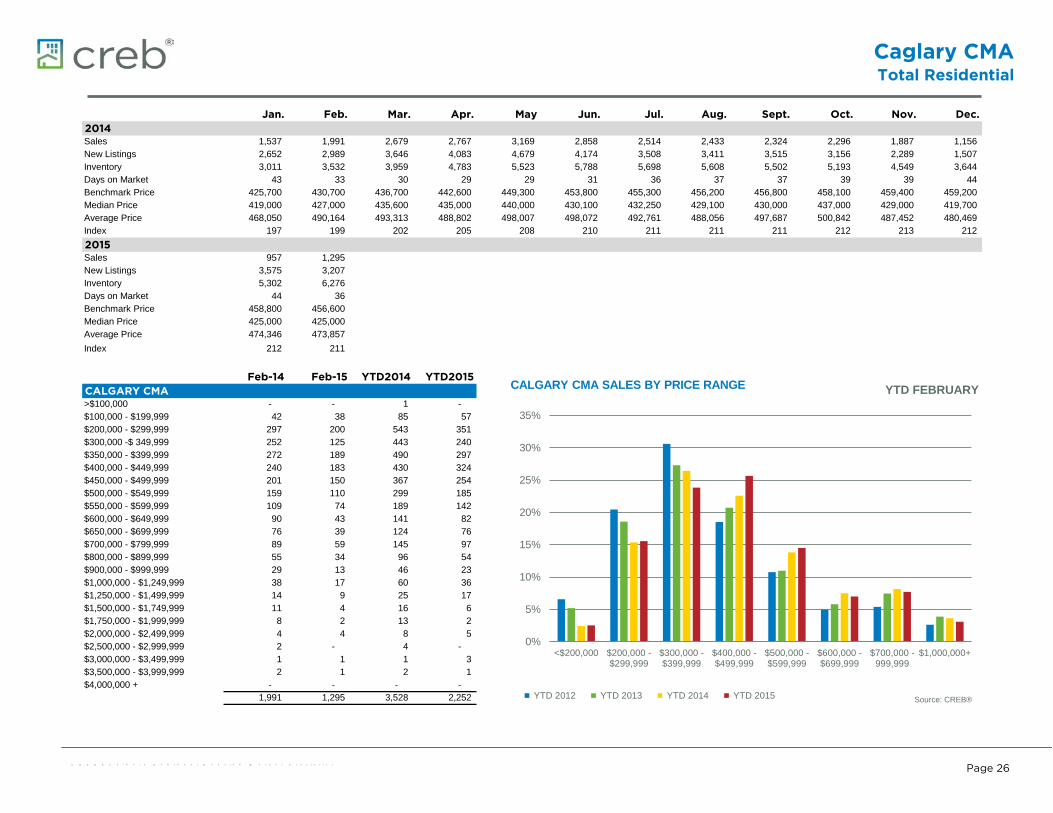
Jan. Feb. Mar. Apr. May Jun. Jul. Aug. Sept. Oct. Nov. Dec.2014 01/01/14 02/01/14 03/01/14 04/01/14 05/01/14 06/01/14 07/01/14 08/01/14 09/01/14 10/01/14 11/01/14 12/01/14
m_Cma_Sales 1,537 1,991 2,679 2,767 3,169 2,858 2,514 2,433 2,324 2,296 1,887 1,156 m_Cma_New Listings 2,652 2,989 3,646 4,083 4,679 4,174 3,508 3,411 3,515 3,156 2,289 1,507 m_Cm_CInventory 3,011 3,532 3,959 4,783 5,523 5,788 5,698 5,608 5,502 5,193 4,549 3,644 m_CmaDays on Market 43 33 30 29 29 31 36 37 37 39 39 44 m_CmaBenchmark Price 425,700 430,700 436,700 442,600 449,300 453,800 455,300 456,200 456,800 458,100 459,400 459,200 m_CmaMedian Price 419,000 427,000 435,600 435,000 440,000 430,100 432,250 429,100 430,000 437,000 429,000 419,700 m_CmaAverage Price 468,050 490,164 493,313 488,802 498,007 498,072 492,761 488,056 497,687 500,842 487,452 480,469 m_CmaIndex 197 199 202 205 208 210 211 211 211 212 213 212
2015 01/01/15 02/01/15 03/01/15 04/01/15 05/01/15 06/01/15 07/01/15 08/01/15 09/01/15 10/01/15 11/01/15 12/01/15m_Cma_Sales 957 1,295 m_Cma_New Listings 3,575 3,207 m_Cm_CInventory 5,302 6,276 m_CmaDays on Market 44 36 m_CmaBenchmark Price 458,800 456,600 m_CmaMedian Price 425,000 425,000 m_CmaAverage Price 474,346 473,857 m_CmaIndex 212 211
Feb-14 Feb-15 YTD2014 YTD2015CALGARY CMA 02/01/14 02/01/15 02/01/14 02/01/15
m_Cytd_ >$100,000 - - 1 - m_Cytd_ $100,000 - $199,999 42 38 85 57 m_Cytd_ $200,000 - $299,999 297 200 543 351 m_Cytd_ $300,000 -$ 349,999 252 125 443 240 m_Cytd_ $350,000 - $399,999 272 189 490 297 m_Cytd_ $400,000 - $449,999 240 183 430 324 m_Cytd_ $450,000 - $499,999 201 150 367 254 m_Cytd_ $500,000 - $549,999 159 110 299 185 m_Cytd_ $550,000 - $599,999 109 74 189 142 m_Cytd_ $600,000 - $649,999 90 43 141 82 m_Cytd_ $650,000 - $699,999 76 39 124 76 m_Cytd_ $700,000 - $799,999 89 59 145 97 m_Cytd_ $800,000 - $899,999 55 34 96 54 m_Cytd_ $900,000 - $999,999 29 13 46 23 m_Cytd_ $1,000,000 - $1,249,999 38 17 60 36 m_Cytd_ $1,250,000 - $1,499,999 14 9 25 17 m_Cytd_ $1,500,000 - $1,749,999 11 4 16 6 m_Cytd_ $1,750,000 - $1,999,999 8 2 13 2 m_Cytd_ $2,000,000 - $2,499,999 4 4 8 5 m_Cytd_ $2,500,000 - $2,999,999 2 - 4 - m_Cytd_ $3,000,000 - $3,499,999 1 1 1 3 m_Cytd_ $3,500,000 - $3,999,999 2 1 2 1 m_Cytd_ $4,000,000 + - - - -
1,991 1,295 3,528 2,252
0%
5%
10%
15%
20%
25%
30%
35%
<$200,000 $200,000 -$299,999
$300,000 -$399,999
$400,000 -$499,999
$500,000 -$599,999
$600,000 -$699,999
$700,000 -999,999
$1,000,000+
YTD FEBRUARY CALGARY CMA SALES BY PRICE RANGE
YTD 2012 YTD 2013 YTD 2014 YTD 2015 Source: CREB®
Calgary CMATotal Residential
C R E B ® C a l g a r y R e g i o n a l H o u s i n g M a r k e t S t a t i s t i c s
Page 27
0
1,000
2,000
3,000
4,000
5,000
6,000
YTD2005
YTD2006
YTD2007
YTD2008
YTD2009
YTD2010
YTD2011
YTD2012
YTD2013
YTD2014
YTD2015
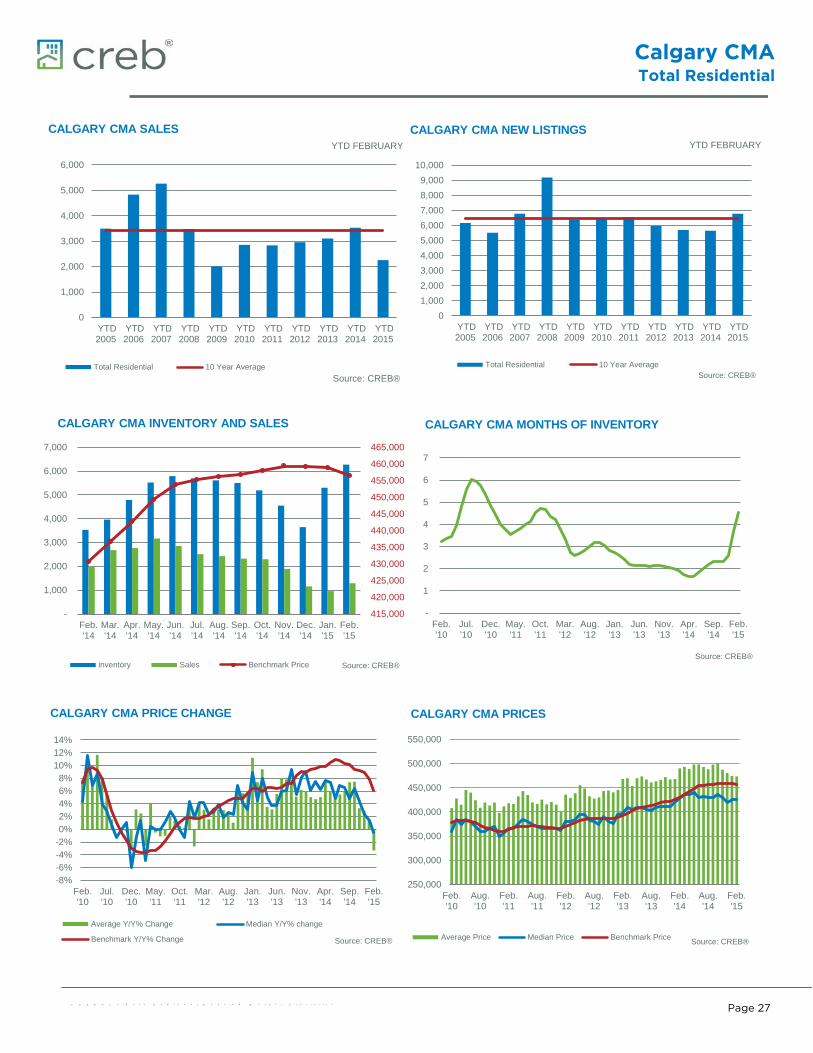
YTD FEBRUARY
CALGARY CMA SALES
Total Residential 10 Year AverageSource: CREB®
01,0002,0003,0004,0005,0006,0007,0008,0009,000
10,000
YTD2005
YTD2006
YTD2007
YTD2008
YTD2009
YTD2010
YTD2011
YTD2012
YTD2013
YTD2014
YTD2015
YTD FEBRUARY CALGARY CMA NEW LISTINGS
Total Residential 10 Year AverageSource: CREB®
415,000
420,000
425,000
430,000
435,000
440,000
445,000
450,000
455,000
460,000
465,000
-
1,000
2,000
3,000
4,000
5,000
6,000
7,000
Feb.'14
Mar.'14
Apr.'14
May.'14
Jun.'14
Jul.'14
Aug.'14
Sep.'14
Oct.'14
Nov.'14
Dec.'14
Jan.'15
Feb.'15
CALGARY CMA INVENTORY AND SALES
inventory Sales Benchmark Price Source: CREB®
-
1
2
3
4
5
6
7
Feb.'10
Jul.'10
Dec.'10
May.'11
Oct.'11
Mar.'12
Aug.'12
Jan.'13
Jun.'13
Nov.'13
Apr.'14
Sep.'14
Feb.'15
CALGARY CMA MONTHS OF INVENTORY
Source: CREB®
-8%-6%-4%-2%0%2%4%6%8%
10%12%14%
Feb.'10
Jul.'10
Dec.'10
May.'11
Oct.'11
Mar.'12
Aug.'12
Jan.'13
Jun.'13
Nov.'13
Apr.'14
Sep.'14
Feb.'15
CALGARY CMA PRICE CHANGE
Average Y/Y% Change Median Y/Y% change
Benchmark Y/Y% Change Source: CREB®
250,000
300,000
350,000
400,000
450,000
500,000
550,000
Feb.'10
Aug.'10
Feb.'11
Aug.'11
Feb.'12
Aug.'12
Feb.'13
Aug.'13
Feb.'14
Aug.'14
Feb.'15
CALGARY CMA PRICES
Average Price Median Price Benchmark Price Source: CREB®
C R E B ® C a l g a r y R e g i o n a l H o u s i n g M a r k e t S t a t i s t i c s
Page 28
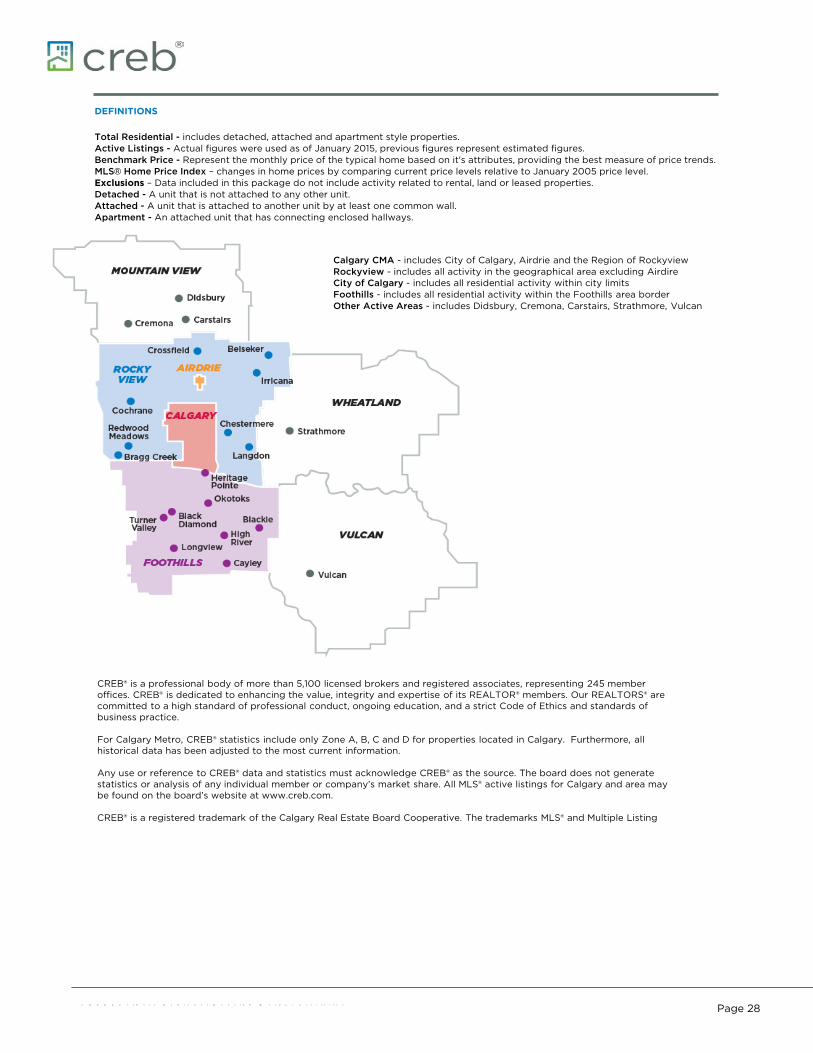
DEFINITIONS
Total Residential - includes detached, attached and apartment style properties.Active Listings - Actual figures were used as of January 2015, previous figures represent estimated figures.Benchmark Price - Represent the monthly price of the typical home based on it's attributes, providing the best measure of price trends.MLS® Home Price Index – changes in home prices by comparing current price levels relative to January 2005 price level. Exclusions – Data included in this package do not include activity related to rental, land or leased properties.Detached - A unit that is not attached to any other unit.Attached - A unit that is attached to another unit by at least one common wall.Apartment - An attached unit that has connecting enclosed hallways.
ABOUT CREB®
CREB® is a professional body of more than 5,100 licensed brokers and registered associates, representing 245 member offices. CREB® is dedicated to enhancing the value, integrity and expertise of its REALTOR® members. Our REALTORS® are committed to a high standard of professional conduct, ongoing education, and a strict Code of Ethics and standards of business practice. For Calgary Metro, CREB® statistics include only Zone A, B, C and D for properties located in Calgary. Furthermore, all historical data has been adjusted to the most current information. Any use or reference to CREB® data and statistics must acknowledge CREB® as the source. The board does not generate statistics or analysis of any individual member or company’s market share. All MLS® active listings for Calgary and area may be found on the board’s website at www.creb.com. CREB® is a registered trademark of the Calgary Real Estate Board Cooperative. The trademarks MLS® and Multiple Listing
Calgary CMA - includes City of Calgary, Airdrie and the Region of Rockyview Rockyview - includes all activity in the geographical area excluding Airdire City of Calgary - includes all residential activity within city limits Foothills - includes all residential activity within the Foothills area border Other Active Areas - includes Didsbury, Cremona, Carstairs, Strathmore, Vulcan