Feb. 2013 Fiscal Year Q1 (March – May 2012) Corporate ... · Feb. 2013 Fiscal Year Q1 (March –...
27
Feb. 2013 Fiscal Year Q1 (March – May 2012) Corporate Presentation July 19, 2012 Ichigo Group Holdings Co., Ltd. (2337) © 2012 Ichigo Group Holdings Co., Ltd. All rights reserved. www.ichigo-holdings.co.jp/english
Transcript of Feb. 2013 Fiscal Year Q1 (March – May 2012) Corporate ... · Feb. 2013 Fiscal Year Q1 (March –...

Feb. 2013 Fiscal Year Q1 (March – May 2012) Corporate Presentation
July 19, 2012
p
Ichigo Group Holdings Co., Ltd. (2337)g p g ( )
© 2012 Ichigo Group Holdings Co., Ltd. All rights reserved. www.ichigo-holdings.co.jp/english

© 2012 Ichigo Group Holdings Co., Ltd. All rights reserved.

Creating peace of mind through honest and committed managementand committed management.
© 2012 Ichigo Group Holdings Co., Ltd. All rights reserved.

Accelerating Significant Growth- Ichigo Growth Strategy- Feb. 2013 Q1 Consolidated Financial Results- Feb. 2013 Q1 Assets Under Management (AUM)
O i St t l P fit bilit- Ongoing Structural Profitability- Sound Financial Base- New Business DevelopmentsNew Business Developments- New Group Structure- Ichigo’s Hiromi Miyake Selected for 2012 London Olympics
© 2012 Ichigo Group Holdings Co., Ltd. All rights reserved. 4

Accelerating Significant Growth
© 2012 Ichigo Group Holdings Co., Ltd. All rights reserved. 5

Ichigo Growth Strategy
Having Achieved Structural Profitability, Entering Accelerated Growth Stage
Target: Tokyo Stock Exchange
First Section
Building Structural Profitability Accelerated Growth Stage
Stable Financial Base・Optimizing balance sheet
Compressing and strengthening・Optimizing interest-bearing debt
Significant Expansion of Structural Profitability・Growth in private equity RE fund AUM
- Launch new private equity RE funds- Expand investor base
Rescue AM
Growth InvestmentsReduction and term extension
Increase Structural Profitability・Increase real estate fee income・M&A of J-REIT AM companies・Value enhancement of assets
- Rescue AM・Organic growth of J-REIT・Acquisition and warehousing for J-REIT・Small-sized asset and ground lease products・Value enhancement of retail assets・Strengthening of BM business
Investments +
Increased Shareholder
100% Coverage
Ratio
・M&A of stable/profitable companies・SG&A cost-cutting
ShareholderDistributions
Structural Profitability
© 2012 Ichigo Group Holdings Co., Ltd. All rights reserved. 6
Feb 11 Feb 12 Feb 13* Beginning of each fiscal year.

Feb. 2013 Q1 Consolidated Financial Results
Driven by Stable Profitability
(Million yen)
Feb 13 Q1 Actual vs Feb 13 Full-Year ForecastRevenues 13.9%, Net Profit 26.4%
Feb. 2013 Q1 Financial Results(Million yen)
Feb 13Q1
FY 13Forecast
vs.Forecast
Revenues 2,362 17,000 13.9%
Revenues17,000
Operating Profit 335 1,500 22.3%
Recurring Profit 307 1,200 25.6%
Net Profit1,000
Revenues
g 307 1,200 25.6%
Net Profit 264 1,000 26.4%
Forecast Feb 13 Full-Year
(12 mos)
Actual Feb 13 Q1
(3 mos)
Net Profit264
2,362
Dividend per Share (Yen) - 200 -
© 2012 Ichigo Group Holdings Co., Ltd. All rights reserved. 7
( )( )

Feb. 2013 Q1 Assets Under Management (AUM)
Slight Decrease in Total AUM, but Higher Profitability- AUM decreased due to asset dispositions - However, AM fees from private equity RE funds increased by ¥14MM p.a. , p q y y p
[¥6MM decrease and ¥20MM increase]
(Billion yen)(Billion yen)PE RE FundAsset Sales
15.2
REIT A t S l 1 3
New PE RE Mandates
11.1
Others 0.3
379.6
REIT Asset Sales 1.3
374 5379.6 374.5
© 2012 Ichigo Group Holdings Co., Ltd. All rights reserved. 8
Feb 12 May 12

Ongoing Structural Profitability
Q1 Fixed Revenues at 122% of Fixed Costs
Fixed Revenues (“locked-in” revenues, excludes transaction fees, capital gains, etc.)
Coverage: 121.5%
Fixed Revenues ( locked in revenues, excludes transaction fees, capital gains, etc.)
Fixed Costs (SG&A + Interest Expense)
(Million yen)
Dividends259
BM Fees 109
Interest 71
Target further expansion of fixed revenues and >120%
Interest and Other 18
Rental Income2541,017
coverage ratio for this FY
AM Fees376
SG&A766
837
Feb 13 Q1(3 mos)
376
© 2012 Ichigo Group Holdings Co., Ltd. All rights reserved. 9
* Pro Forma base (definition on p. 15)

Sound Financial Base
Shareholder Equity Ratio 68.9%
Balance Sheet
(Billi )
Shareholder Equity Ratio 66.1%
Liabilities11.8
A t
Liabilities13.6
Assets
Assets+2.0
・ Assets & Liabilities Increased with New Warehousing Fund for Ichigo
(Billion yen)
Net Assets26.1
Assets38.0 Net Assets
26.5
Assets40.0 REIT
・ Healthy Shareholder Equity Ratio
68 9% 66 1%Feb 12
Total Borrowings 11.1+1 8
May 1268.9% → 66.1%
Interest-Bearing Debt
Short-Term Debt1.9
Total Borrowings 9.3 Short-Term Debt2.2
+1.8
+0.3・ Debt Increased with New
Borrowings for Warehousing Fund
(Billion yen)
Long-Term Debt7.4
+1.5 Long-Term Debt8.9
・ Healthy Long/Short-Term Debt Ratio
79.3% → 79.8%
© 2012 Ichigo Group Holdings Co., Ltd. All rights reserved. 10
* Pro Forma base (definition on p. 15)Feb 12 May 12

New Business Developments
P t B t U C lti d Ad i (I hi E t t C Ltd )• Property Best-Use Consulting and Advisory (Ichigo Estate Co., Ltd.)- Brought in a Major Supermarket on Behalf of a Tokyo Property Owner
- Generating long-term stable rental income for owner- Ichigo Estate works for owner via a long-term service agreement
- Diversifying Revenue Stream via Consulting and Advisory Business in Addition to Existing Small-Sized Real Estate and Ground Lease Businessesg
• Standardize and Improve Quality of Service to Increase Tenant Satisfaction- Hands-On Approach to Deepen Understanding of Tenant needs
- Building direct relationships with tenants to improve satisfaction - Establish Ichigo Quality Standard to improve quality of service
- New Partnerships with Property Managers Who Meet Ichigo Quality Standard- Detailed evaluations and selection process of partner PMs- New PM partnerships start from September 2012- Ichigo PM Strategy Group set up last year to drive this processg gy p p y p- Will also reduce PM costs
© 2012 Ichigo Group Holdings Co., Ltd. All rights reserved. 11

New Group Structure
• On July 1, 2012, Reorganization Completed to Strengthen Ichigo’s Capabilities as a Full-Service Real Estate Asset Manager- Formed New Asset Management Company to Manage J-REIT and Private Equity RE Funds
C t t A t M t R t A l t G th- Concentrate Asset Management Resources to Accelerate Growth
Assets Under Management : c. 380 billion yen
Holding Company
Full-Service Real Estate Asset Manager
Ichigo Group Holdings Co., Ltd.Holding Company (Group Strategy, M&A)
AM for J-REIT and private equity RE funds
A i i S ll Si d A
Ichigo Real Estate Investment Advisors Co., Ltd.Formed via merger of Ichigo REIT (8975) and private equity RE fund asset managers
Formed ia merger of old Ichigo Estate andActive in Small-Sized Assets & Ground Leases
Property Management
100%subsidiaries
Ichigo Estate Co., Ltd.
Ichigo Marché Co., Ltd.
Formed via merger of old Ichigo Estate and Ichigo Solutions, a financial services subsidiary
Operates Matsudo Nanbu Wholesale Market in Chiba
Property Management
Building Maintenance
Miyako City Co., Ltd.
Takara Building Maintenance Co., Ltd.
Operates Miyako City, large-scale shoppingmall in Miyazaki Prefecture, Kyushu
• On July 2, 2012, Established Ichigo Global Capital Co., Ltd.
Building Maintenance and Security Services
Nichibei Building Services Co., Ltd.Nichibei Security Services Co., Ltd.
© 2012 Ichigo Group Holdings Co., Ltd. All rights reserved.
- Launch Venture Capital Fund for Asian Investors - Support Cross-Border M&A
12

Ichigo’s Hiromi Miyake Selected for 2012 London Olympics
We are committed to fulfilling our Corporate Social Responsibilities with respect to all stakeholders, society, and the earth that we share. As part of our support for excellence in all social activities, including athletics, Ichigo sponsors a weightlifting g g p g gteam.
Ichigo employee Hiromi Miyake will represent Japan at the London Olympics
Profile of Hiromi Miyake
represent Japan at the London Olympics.
London Olympics Press ConferenceProfile of Hiromi MiyakeJoined Ichigo in April 2008Results of Major Tournaments- 2004 Athens Olympics, 48kg-Class 9th Place- 2008 Beijing Olympics, 48kg-Class 6th Place- 2010 Japan Weightlifting Championships,
53kg-Class 1st Place- 2011 Japan Weightlifting Championships,
53kg-Class 1st Place- 2011 World Weightlifting Championships, g g p p ,
53kg-Class 6th Place
Hiromi MiyakePlease visit Facebook & Twitter
[Facebook] www.facebook.com/#!/ichigo.weightlifting
© 2012 Ichigo Group Holdings Co., Ltd. All rights reserved.
Hiromi Miyake
13
[Twitter] https://twitter.com/#!/Ichigo_Group

Appendix: Pro Forma Financial Data
© 2012 Ichigo Group Holdings Co., Ltd. All rights reserved. 14

Pro Forma Disclosure to Improve Transparency
• Under Japanese accounting rules, SPCs in which Ichigo Group HoldingsUnder Japanese accounting rules, SPCs in which Ichigo Group Holdings (“IGH”) is a greater than 50% investor or SPCs for which IGH is the asset manager and no single equity investor holds more than 50% of the total investment must be consolidated onto IGH’s balance sheet.
• Our statutory consolidated and parent financial statements thus include client-related assets and liabilities and P&L which do not belong to IGH. In order to more accurately reflect the true economic exposures borne by our shareholders, we disclose Pro Forma financials which are intended to better reflect IGH’s actual corporate financial position.
© 2012 Ichigo Group Holdings Co., Ltd. All rights reserved. 15

Balance Sheet (Pro Forma)
(Million yen)
F b 12 Ch (Q Q)F b 13 Q1Feb 12 Change (QoQ)
Total Assets 37,980 40,038 2,058Cash and Cash Equivalents 5,713 5,730 17
Feb 13 Q1
Investment (Real Estate) 8,151 8,447 296Investment (Domestic companies) 600 551 -49Investment (Overseas companies) 4,598 4,573 -25Real Estate Held for Sale 3,785 5,890 2,105Fixed Assets 10,109 10,073 -36Intangible Assets 2,105 2,075 -30Other 2 919 2 699 220Other 2,919 2,699 -220
Liabilities 11,831 13,557 1,726Interest-Bearing Debt 9,351 11,189 1,838Other 2 480 2 368 112Other 2,480 2,368 -112
Net Assets 26,149 26,481 332
© 2012 Ichigo Group Holdings Co., Ltd. All rights reserved. 16

P&L (Pro Forma)
(Million yen)Breakdown
Feb 13 Q1
Revenues 1,736Real Estate Management Fees 467
Feb 12 Feb 13 Q1
Revenues 7,927 1,736
Cost of Revenues 4 101 663 g 467Advisory Fees 6Rental Income 468Real Estate Sales / Dividends 259Securities Sales / Dividends 15
Cost of Revenues 4,101 663
Gross Profit 3,826 1,073
SG&A 2,871 766Securities Sales / Dividends 15Building Maintenance Fees 517Other 4
Gross Profit 1,073
Operating Profit 954 306
Non-Operating Gain (Loss), net -70 -28
Recurring Profit 884 278Real Estate Management Fees 430Advisory Fees 6Rental Income 254Real Estate Sales / Dividends 259
Extraordinary Gain (Loss), net 997 0
Pre-tax Profit 1,881 279
Tax 159 16Securities Sales / Dividends 15Building Maintenance Fees 109Other 0
159 16
Minority Interests -48 -2
Net Profit 1,770 264
© 2012 Ichigo Group Holdings Co., Ltd. All rights reserved. 17

Balance Sheet NAV
Significant Unrealized Gains on Balance Sheet Assets
- Real Estate (Million yen)
Acquisition Value Book Value(As of May 12)
Appraisal Value(As of Feb 12) Unrealized Gain
Directly Owned on B/S 17,392 12,889 15,275 +2,384
Investment in IGH Funds 16,406 8,448 14,121 +5,674
Total 33,798 21,337 29,396 +8,058
- Private Equity(Million yen)
33,798 21,337 29,396 8,058
(Million yen)Book Value
(As of May 12)Market Value(As of Jun 12) Unrealized Gain
Domestic Securities 323 483 +160
Overseas Securities 960 982 +21
IPO (Overseas) Jun 13 49 368 +61
Total 1,332 1,833 +242
© 2012 Ichigo Group Holdings Co., Ltd. All rights reserved. 18

Appendix: Consolidated Financial Data
© 2012 Ichigo Group Holdings Co., Ltd. All rights reserved. 19
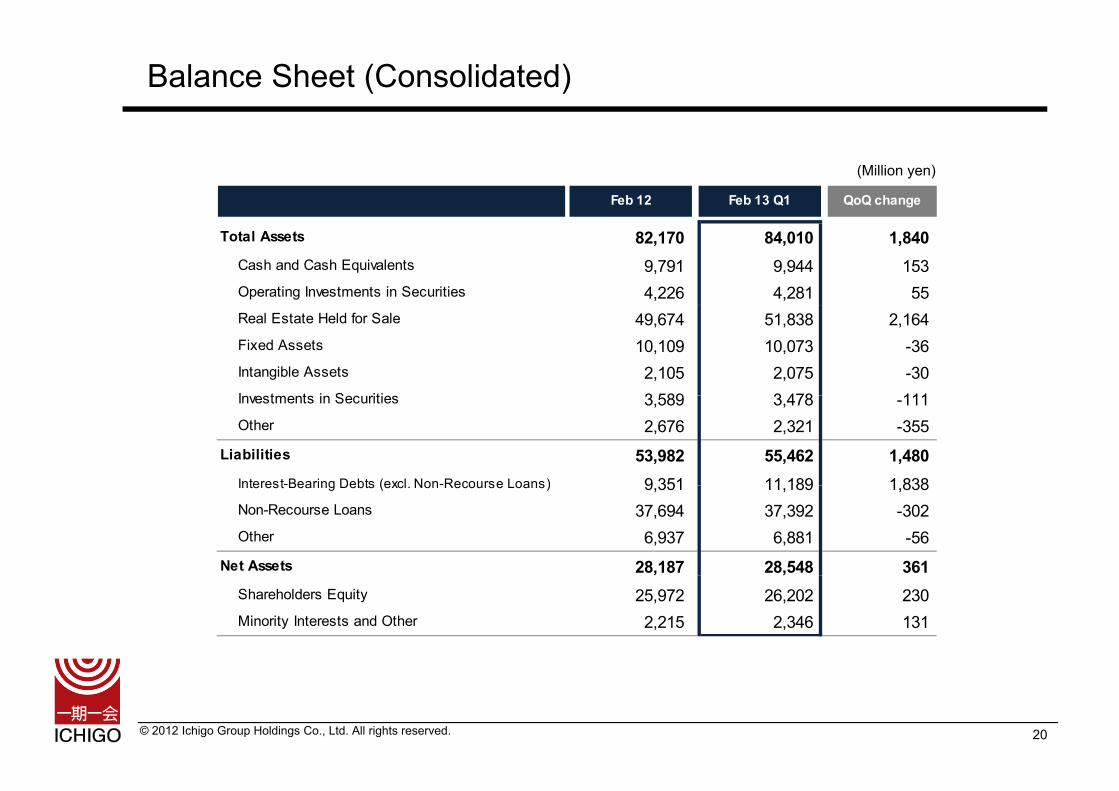
Balance Sheet (Consolidated)
(Million yen)
Feb 12 Feb 13 Q1 QoQ change
Total Assets 82,170 84,010 1,840Cash and Cash Equivalents 9,791 9,944 153Operating Investments in Securities 4,226 4,281 55Real Estate Held for Sale 49,674 51,838 2,164Fixed Assets 10,109 10,073 -36Intangible Assets 2,105 2,075 -30I t t i S iti 3 589 3 478 111Investments in Securities 3,589 3,478 -111Other 2,676 2,321 -355
Liabilities 53,982 55,462 1,480Interest-Bearing Debts (excl Non-Recourse Loans) 9 351 11 189 1 838Interest Bearing Debts (excl. Non Recourse Loans) 9,351 11,189 1,838Non-Recourse Loans 37,694 37,392 -302Other 6,937 6,881 -56
Net Assets 28,187 28,548 361, ,Shareholders Equity 25,972 26,202 230Minority Interests and Other 2,215 2,346 131
© 2012 Ichigo Group Holdings Co., Ltd. All rights reserved. 20

Breakdown of Assets (Consolidated)(Milli )(Million yen)
AmountOutside
Investors'Interests
TheCompany's
InterestsAmount
OutsideInvestors'Interests
TheCompany's
Interests
QoQ Changein the
Company'sInterests
Feb 13 Q1Feb 12
Cash and Cash Equivalents 9,791 - - 9,944 - - -
Operating Investments in Securities 4,226 0 4,226 4,281 0 4,281 55
Domestic Real Estate 2,254 0 2,254 2,273 0 2,273 19
Listed Domestic Companies 0 0 0 0 0 0 0
Unlisted Domestic Companies 42 0 42 37 0 37 -5Unlisted Domestic Companies 42 0 42 37 0 37 5
Listed Overseas Companies 1,019 0 1,019 1,061 0 1,061 42
Unlisted Overseas Companies 911 0 911 910 0 910 -1
-288 - -288 -286 - -286 2Reference: Allow ance for Bad Debts forOperating Investments in Securities
3,938 - 3,938 3,995 - 3,995 57
Real Estate Held for Sale 49,674 40,066 9,608 51,838 40,058 11,780 2,172
Investments in Securities 3,589 0 3,589 3,478 0 3,478 -111
Operating Investments in Securitiesless Allowance for Bad Debts forOperating Investments in Securities
Domestic Companies 529 0 529 514 0 514 -15
Overseas Companies 2,955 0 2,955 2,889 0 2,889 -66
Others 105 0 105 75 0 75 -30
-75 - -75 -75 - -75 0Reference: Allow ance for Bad Debts forInvestments in Securities
3,515 - 3,515 3,404 - 3,404 -111
10,109 - - 10,073 - - -
Intangible Assets 2,105 - - 2,075 - - -
Fixed Assets
Investments in Securities lessAllowance for Bad Debts forInvestments in Securities
© 2012 Ichigo Group Holdings Co., Ltd. All rights reserved. 21
Other Assets 3,038 - - 2,681 - - -
Total Assets 82,170 - 17,061 84,010 - 19,179 2,118

P&L (Consolidated)
Breakdown (Million yen)
Feb 12 Feb 13 Q1 Full-YearForecast
vs.Forecast F b 13 Q1Forecast Forecast
Revenues 18,952 2,362 17,000 13.9%
Cost of Revenues 15,030 1,260 - -
Feb 13 Q1
Revenues 2,362Real Estate Management Fees 394Advisory Fees 6Gross Profit 3,921 1,102 - -
SG&A 2,871 766 - -
Operating Profit 1,050 335 1,500 22.3%
Advisory Fees 6Rental Income 1,421Real Estate Sales / Dividends 18Securities Sales / Dividends 15
Non-Operating Gain (Loss), net -70 -28 - -
Recurring Profit 979 307 1,200 25.6%
Extraordinary Gain (Loss), net 997 0 - -
Building Maintenance Fees 506Other 2
Gross Profit 1,102Real Estate Management Fees 356y ( ) 997 0
Pre-tax Profit 1,976 308 - -
Tax 159 16 - -
Mi it I t t 47 26
Advisory Fees 6Rental Income 628Real Estate Sales / Dividends 18Securities Sales / Dividends 15
Minority Interests 47 26 - -
Net Profit 1,770 264 1,000 26.4%Building Maintenance Fees 98Other -19
© 2012 Ichigo Group Holdings Co., Ltd. All rights reserved. 22

Appendix: Real Estate Data
© 2012 Ichigo Group Holdings Co., Ltd. All rights reserved. 23

Assets Under Management (AUM)
Net AUM Decreased by ¥ 5 Billion – Decrease of ¥16.4 Billion from Disposition of Assets and Increase of ¥11.4 Billion from Launching New Funds and New Rescue AM Mandate
(As of May 2012)
600
Development530.1
496 0
REIT28%
(Billion yen)
62.0
400
500 OperatingREIT
379.6 374.5
330 6
496.0
426.5
335 9
385.3
Operating72%
123.4
257.0 335.0
320.7
56.0113.8 106.1 104.8
200
300
330.6 335.9
Breakdown of Equity Investors
Domestic FinancialInstitution
4% Domestic Operating Company
12%Domestic Insurance
Company1%
IGH30%
100.0151.2
211.1161.0
105.932.7
66.4
312.1
263.2 265.2 269.6
100
200
78.8
166.4
Overseas Pension Fund
30%
Overseas Financial
Overseas Fund17%
46.1100.0
23.8 8.3 8.30
© 2012 Ichigo Group Holdings Co., Ltd. All rights reserved.
Overseas Financial Institution
7%
24

Real Estate Portfolio
• Track Record Mainly in Office and Also Across a Wide Variety of Other Asset Types• Strong in Mid-Sized Assets in Tokyo, Which are Highly Liquid and Have Stable Cashflows
(As of May 2012)AUM by Type # of Properties by Type
Other10
Residential16%
Other 2%
Land with GroundLease
1%
(As of May 2012)
(Unit: # of buildings)(Unit: # of buildings)
AUM by Type # of Properties by Type
AUM by Location
Fukuoka5% Sendai
Other5%
Office77
RetailResidential
Land with Ground Lease
56Off ice59%
Mixed13%
16%
Retail Tokyo
Tokyo62%
Osaka
Kanto6%
Nagoya5%
5% Sendai2%
Retail16
Mixed17
44Retail
9%Tokyo100
Sendai 3
KantoAUM by Size # of Properties by Size
Osaka15%
0~1 bn yen10%
10 bn yen~20%
10 bn yen~11
5~10 bn yen
Osaka17
Fukuoka
Nagoya7
Land with
Ground Leases
&Others
56
15(Unit: # of buildings)
1~5 bn yen30%
5~10 bn yen40%
0~1 bn yen111
1~5 bn yen39
59 10 Others12
© 2012 Ichigo Group Holdings Co., Ltd. All rights reserved.
39
25

Real Estate Cap Rates
• Conservative assessment of cap rates, generally more conservative than market• Continually mark assets to market• Unrealized gains in both client and IGH assets
Real Estate Investments held by Funds (SPCs)(As of May 2012)
(Million yen)Book Value Cap rate (at Acquisition) Cap Rate (current) Appraisal ValueNOIBook Value Cap rate (at Acquisition) Cap Rate (current) Appraisal Value
(af ter write-down) NOI / Acquisition Value NOI / Book Value af ter write-down as of February 2012
Tokyo 150,494 134,139 6,768 5.3% 6.0% 135,396 +1,257
Outside Tokyo 83,431 64,214 4,200 5.4% 7.0% 73,459 +9,245
Total 233 925 198 353 10 968 5 3% 6 4% 208 855 +10 503
Unrealized GainLocation Acquisition Value NOI(current)
Real Estate Investments directly held by IGH
Total 233,925 198,353 10,968 5.3% 6.4% 208,855 +10,503
Book Value Cap rate (at Acquisition) Cap Rate (current) Appraisal Value(af ter write-down) NOI / Acquisition Value NOI / Book Value af ter write-down as of February 2012
Tokyo 7,647 6,754 467 6.6% 7.1% 7,961 +1,207
Unrealized GainLocation Acquisition Value NOI(current)
(Million yen)
*Excludes one development asset (c. ¥700M) which is not currently generating NOI
Outside Tokyo 7,462 5,428 587 6.2% 9.7% 6,607 +1,179
Total 15,109 12,182 1,054 6.4% 8.4% 14,568 +2,386
© 2012 Ichigo Group Holdings Co., Ltd. All rights reserved. 26

These materials were prepared to explain the Company’s businesses and are not for the purpose ofsoliciting investment in marketable securities issued by the Company. The Company does notguarantee the accuracy of the figures, information, estimates or other statements included herein, andg y g , , ,accepts no responsibility for damages or losses arising through the use of the figures, information,estimates or other statements contained herein.
These materials are based upon information available as of the publication date, and may containp p , yforward-looking statements pertaining to the Company’s expectations, targets, plans and strategies.Such forward-looking statements are not facts, but are the result of management’s judgment based oninformation currently available. Actual operating results or developments concerning the Companymay differ substantially from those indicated by forward-looking statements. The information enclosedy y y gis also subject to revision without prior notice.
Contact:Ichigo Group Holdings Co., Ltd.Investor Relations
TEL: +81-3-3502-4818 FAX:+81-3-3502-4801E-mail: [email protected]/englishIchigo Group Holdings is Japan’s first zero carbon listed real estate company.
© 2012 Ichigo Group Holdings Co., Ltd. All rights reserved.
g p g p p yWe are taking responsibility for the carbon emissions we create, such as via this presentation material, by taking measures to create offsets to our carbon emissions and working with organizations to invest in low-carbon technologies.
27