FEATURES CONSTRUCTION FOR STARFRUIT QUALITY …
33
FEATURES CONSTRUCTION FOR STARFRUIT QUALITY INSPECTION MUSA BIN MOHD MOKJI A thesis submitted in fulfilment of the requirements for the award of the degree of Doctor of Philosophy (Electrical Engineering) Faculty of Electrical Engineering Universiti Teknologi Malaysia JANUARY 2009
Transcript of FEATURES CONSTRUCTION FOR STARFRUIT QUALITY …

FEATURES CONSTRUCTION FOR STARFRUIT QUALITY INSPECTION
MUSA BIN MOHD MOKJI
A thesis submitted in fulfilment of the
requirements for the award of the degree of
Doctor of Philosophy (Electrical Engineering)
Faculty of Electrical Engineering
Universiti Teknologi Malaysia
JANUARY 2009

iii
To my lovely wife

iv
ACKNOWLEDGEMENT
Praise is to Allah who has given me the strength, both physically and
mentally throughout the completion of this thesis.
I would like to take this opportunity to thank my supervisor, Associate
Professor Dr. Syed Abd Rahman Syed Abu Bakar that has assisted and helped me
from the beginning of this research work until this thesis was completely written.
The thank goes also to Usman Ullah Sheikh and Rudi Heriansyah as my research
colleagues for their involvement in this research work. To all CVVIP members,
thanks for their support in each of my presentation session throughout the research
period.
Lastly, I would like to acknowledge, with many thanks, my friends and
anyone that involved and contributed directly or indirectly to the successfulness of
this thesis.

v
ABSTRACT
Up to present, the starfruit quality inspection process is performed manually.
Manual inspection will cause inconsistency in quality due to human subjective
nature, slow processing and labor intensive. Hence, this thesis presents automation
process development for the starfruit quality inspection in terms of techniques and
algorithms design based on image processing. Basically, there are three main
processes of the starfruit quality inspection discussed in this thesis, which are the
maturity index classification, skin defect estimation and shape defect estimation.
Throughout these processes, new features constructed based on colors and shape are
proposed. In maturity index classification, a two-color feature, M , is proposed to
differentiate six maturity indices of the starfruit. With the two-color feature, one third
of computational data is reduced compared to the typical 3-color features. For skin
defect estimation process, a new gray level co-occurrence matrix (GLCM) statistical
feature is introduced. This feature has the ability to segment skin defect areas on non-
homogenous in illumination and color of the starfruit image. As the GLCM
consumes high computation, this thesis proposed a new algorithm based on Haar
wavelet that reduces computational burden. Lastly, a shape-based feature is
constructed for the shape defect estimation process where a modification of
Melkmen convex hull algorithm is designed in order to construct the feature.
Experimental results prove that these features are able to convey the three main
processes of the starfruit quality inspection process where high accuracies were
achieved; 93.33% for the maturity index classification feature, 82% for the skin
defect estimation feature and 96% for the shape defect estimation feature.

vi
ABSTRAK
Sehingga ke hari ini, proses pemeriksaan kualiti belimbing masih dilakukan
secara manual. Pemeriksaan secara manual akan menyebabkan kualiti belimbing
tidak konsisten kerana sifat semulajadi manusia yang subjektif, proses yang lambat
dan keupayaan manusia yang berbeza. Oleh kerana itu, tesis ini memperkenalkan
proses pemeriksaan kualiti belimbing secara automatik daripada sudut rekaan teknik
dan algoritma berasaskan pemprosesan imej. Secara asasnya, terdapat tiga proses
utama pemeriksaan kualiti belimbing yang dibincangkan dalam tesis ini iaitu
pengkelasan indeks kematangan, penganggaran kerosakan kulit dan penganggaran
kerosakan bentuk. Daripada proses-proses ini, beberapa ciri telah diperkenalkan.
Dalam proses pengkelasan indeks kematangan, ciri dua-warna telah dicadangkan.
Ciri ini berjaya mengurangkan data pengiraan berbanding ciri tiga-warna yg biasa.
Untuk proses penganggaran kerosakan kulit, ciri statistik „gray level co-occurrence
matrix (GLCM)‟ baru diperkenalkan. Ciri ini berupaya mengesan kawasan kerosakan
kulit pada permukaan belimbing yang kompleks di mana pencahayaan dan warnanya
tidak sekata. Oleh kerana GLCM mempunyai beban pengiraaan yang tinggi, tesis ini
juga mencadangkan kaedah pengiraaan GLCM yang baru berasaskan Haar Wavelet
untuk mengurangkan beban pengiraaan tersebut. Akhir sekali, ciri berasaskan bentuk
telah dihasilkan untuk proses pengaggaran kerosakan bentuk di mana ubahsuai
terhadap algoritma „convex hull‟ Melkmen telah direka untuk menghasilkan ciri
tersebut. Hasil eksperimentasi telah membuktikan bahawa ciri-ciri ini berupaya
untuk melaksanakan ketiga-tiga proses utama pemeriksaan kualiti belimbing tersebut
di mana nilai ketepatan yang tinggi telah diperolehi; 93.33% untuk ciri pada proses
pengkelasan indeks kematangan, 82% untuk ciri pada proses penganggaran
kerosakan kulit dan 96% untuk ciri pada proses penganggaran kerosakan bentuk.

vii
TABLE OF CONTENTS
CHAPTER TITLE PAGE
DECLARATION ii
DEDICATION iii
ACKNOWLEDGMENT iv
ABSTRACT v
ABSTRAK vi
TABLE OF CONTENTS vii
LIST OF TABLES xi
LIST OF FIGURES xiii
LIST OF SYMBOLS xviii
LIST OF APPENDICES xx
1 INTRODUCTION 1
1.1 Project Background 1
1.2 Problem Statement 2
1.3 Objectives 3
1.4 Scopes 3
1.5 Research Methodology 5
1.6 Related Previous Work 7
1.6.1 2-Colour System 8
1.6.2 2-Shape Representation 9
1.7 Research Contribution 11
1.7.1 Maturity Classification 12
1.7.2 Shape Defect Estimation 12
1.7.3 Skin Defect Estimation 13

viii
CHAPTER TITLE PAGE
1.8 Thesis Organization 14
2 STARFRUIT MATURITY CLASSIFICATION 15
2.1 Introduction 15
2.2 Color System 16
2.2.1 Electromagnetic Spectrum 16
2.2.2 3-Color System 18
2.3 Proposed Color System 23
2.3.1 Color Summation and Difference 24
2.3.2 AM Color System 31
2.3.3 Class Discriminant Measure 34
2.4 The Maturity Index Classification 39
2.5 Summary of the Chapter 45
3 SKIN DEFECT ESTIMATION PROCESS 46
3.1 Introduction 46
3.2 Related Theory and Background of the Defect
Estimation Process
47
3.2.1 Segmentation 48
3.2.2 GLCM 50
3.2.3 Edge Information in GLCM 52
3.2.3.1 Edge Magnitude 52
3.2.3.2 GLCM Quadrants 54
3.2.4 GLCM Computational Cost 57
3.2.5 Haar Wavelet Transform 58
3.3 Proposed GLCM Computation 60
3.3.1 The New GLCM Computation 61
3.3.2 Pixel Entries in GLCM Computation 67
3.3.3 GLCM Texture Features Computation 68
3.3.4 Classification Performance of the Proposed
GLCM Computation
71

ix
CHAPTER TITLE PAGE
3.3.4.1 Classification based on GLCM Structure 73
3.3.4.2 Classification based on the reduced
elements in GLCLL Structure
75
3.4 The Skin Defect Estimation Process 76
3.4.1 Image Enhancement 76
3.4.2 Defects Segmentation 87
3.4.2.1 Formulation 87
3.4.2.2 Computation Area 89
3.4.2.3 Edge Flexibility 92
3.4.2.4 Segmentation Window 95
3.4.3 Post-Processing 101
3.4.4 Defective Index Computation 103
3.5 Summary of the Chapter 107
4 SHAPE DEFECT ESTIMATION PROCESS 108
4.1 Introduction 108
4.2 Geometry Of Planar Curve 109
4.3 Convex Hull 111
4.3.1 Nonlinear-time Convex Hull 112
4.3.2 Linear-time Convex Hull 115
4.4 Modification to the Melkmen Convex Hull 120
4.4.1 Concave Elimination Technique 121
4.4.2 Extreme Points 127
4.5 Shape Defect Estimation 134
4.5 Summary of the Chapter 140
5 RESULTS AND DISCUSSIONS 141
5.1 Introduction 141
5.2 Experimental Setup 142
5.3 Maturity Index Classification 146
5.3.1 Proposed Classifier 147

x
CHAPTER TITLE PAGE
5.3.2 Bayes Classifier and Fuzzy Logic Classifier 152
5.4 Skin Defect Estimation 157
5.4.1 Image Enhancement 158
5.4.2 Defect Segmentation 161
5.4.3 Post-Processing 168
5.5 Shape Defect Estimation 170
5.6 Summary of the Chapter 174
6 CONCLUSIONS AND FUTURE DEVELOPMENTS 175
6.1 Conclusions 175
6.1.1 Maturity Index Classification 175
6.1.2 Skin Defect Estimation Process 176
6.1.3 Shape Defect Estimation Process 178
6.2 Recommendation for Future Developments 179
REFERENCES 181
Appendix A – D
193 – 204

xi
LIST OF TABLES
TABLE NO. TITLE PAGE
1.1 Maturity Index 4
2.1 Class separable measure for various types of color features 37
2.2 Area percentage of starfruit in Figure 2.18 44
3.1 GLCM Orientation constant 50
3.2 Filter replacement 63
3.3 )','(0, yxh
and )','(, yxh
d representation for the Haar
wavelet
65
3.4 Proposed GLCM performance 74
3.5 GLCM performance for filtered input image 75
3.6 Classification accuracy based on reduced GLCLL elements 76
4.1 Convex hull construction for sorted input point of Figure
4.5(a)
113
4.2 Melkmen algorithm process for example in Figure 4.10 119
4.3 Convex hull results of the first sample set 125
4.4 Convex hull results of the second sample set 126
4.5 Extreme points and its preferred coordinate 130
4.6 Extreme points pattern 131
4.7 Convex hull computational cost 134
5.1 Maturity Index 144
TABLE NO. TITLE PAGE
5.2 Training results for the proposed classifier 147
5.3 Classification accuracy based on proposed classifier 148

xii
5.4 Classification distribution based on input feature M 149
5.5 Classification distribution based on input feature RGH 149
5.6 Classification distribution based on input feature H 149
5.7 Classification results based on Bayes Classifier 154
5.8 Classification results based on Fuzzy Logic Classifier 155
5.9 Image Enhancement Performance 159
5.10 Performance based on window size for enhanced grayscale
image
162
5.11 Performance based on window size for original grayscale
image
165
5.12 Performance based on various techniques of defect
segmentation
165
5.13 Performance related to the post-processing 168
5.14 Performance of the shape defect estimation process. 170

xiii
LIST OF FIGURES
FIGURE NO. TITLE PAGE
1.1 Flow process of the research 6
2.1 Starfruit maturity classification process 15
2.2 Electromagnetic Spectrum 17
2.3 Human cones spectral response function 19
2.4 CIE XYZ spectral response function 19
2.5 CIE XYZ chromaticity diagram 20
2.6 Additive and subtractive color system 21
2.7 HSV and HSL Color system 22
2.8 Color density plot of starfruit image 23
2.9 Blue color on Starfruit image 24
2.10 RG color system 25
2.11 Luminance on RG color system 27
2.12 Hue circle 28
2.13 Hue on RG color system 29
2.14 Saturation on RG color system 31
2.15 AM color system 32
FIGURE NO. TITLE PAGE
2.16 Normal distribution of the maturity classes 38
2.17 Proposed classification model 39

xiv
2.18 Starfruit with maturity index 4 40
2.19 Cumulative distribution of hue for class iC and 1iC 42
2.20 Various shape of the class iC and 1iC hue cumulative
distribution
42
2.21 New position of di and diH where di is lies between
diHi, and diHi ,1 for respective plots in Figure 2.20
43
2.22 Maturity index classification rules 44
3.1 Skin surface defects estimation process 46
3.2 GLCM 51
3.3 Edge magnitude 53
3.4 GLCM quadrants 55
3.5 Haar wavelet transform 59
3.6 Values of the GLCLL element 70
3.7 Percentage cumulative plot of Figure 3.6 71
3.8 Image partition 72
3.9 Starfruit skin defects 77
3.10 Applied color map 78
3.11 Index 2 Starfruit with bruises 79
3.12 Hue images 80
3.13 Index 5 Starfruit with bruises and black spot 81
3.14 Combination of hue and luminance image 82
FIGURE NO. TITLE PAGE
3.15 Saturation related images 83
3.16 Saturation image vs )(' iS image 85

xv
3.17 Enhanced Grayscale image 85
3.18 Examples on the proposed grayscale image 86
3.19 Thresholding computation area 88
3.20 Basic shapes and their GLCM mapping 90
3.21 Thresholding results for image In Figure 5(a) to 5(c) 92
3.22 Skin defect segmentation 94
3.23 Skin defects segmentation comparison 96
3.24 Image histogram and threshold value 97
3.25 Defect segmentation with several window sizes 98
3.26 Defect segmentation with bigger window sizes 99
3.27 Segmentation windows positioning 100
3.28 Defects segmentation results for Figure 3.25(a) 101
3.29 False-segmented defect 102
3.30 Color region of the definite defect 102
3.31 Second post-processing 103
3.32 Various PDI pattern 106
3.33 Defect estimation accuracy based on several values of 106
4.1 Starfruit shape defect estimation process 108
4.2 Chain-code 109
4.3 Triangle formed by three curve points 110
4.4 Curve points direction 111
FIGURE NO. TITLE PAGE
4.5 Graham scan 113
4.6 Divide and Conquer convex hull 114

xvi
4.7 Quick hull convex hull 114
4.8 Bentley-Faust-Preparata convex hull 116
4.9 Position of C and D in the Melkmen algorithm 118
4.10 Melkmen convex hull 119
4.11 Set of points 121
4.12 Concave and convex in closed curve 121
4.13 SOCH 123
4.14 Shapes for the first test set 125
4.15 Starfruit samples for the second test 126
4.16 Incorrect convex hull produced by the proposed technique 127
4.17 Sorting process 128
4.18 Points movement in convex hull 129
4.19 SOCH with extreme points 133
4.20 Concave area computation 136
4.21 Stem concave 136
4.22 Concave area plot 137
4.23 Starfruits with stem concave 138
4.24 Stem concave elimination 139
5.1 5 different side of a starfruit 142
5.2 Skin defect categories 145
5.3 Shape defect examples 145
FIGURE NO. TITLE PAGE
5.4 Starfruit indices 151
5.5 Misclassified samples 151

xvii
5.6 Classification accuracy with M as input feature 156
5.7 Classification accuracy with RGH as input feature 156
5.8 Classification accuracy with H as input feature 157
5.9 Test point in skin defect estimation process 158
5.10 Example 1 of grayscale image comparison 160
5.11 Example 2 of grayscale image comparison 161
5.12 Defect estimation accuracy over various values of d and p
163
5.13 Defect estimation accuracy over various values of d and
p based on the original grayscale image
164
5.14 Segmentation of low skin defect starfruit 166
5.15 Segmentation of high skin defect starfruit 167
5.16 Post-processing 169
5.17 Stem shape error 171
5.18 Shape defect identification example 1 173
5.19 Shape defect identification example 2 173

xviii
LIST OF SYMBOLS
A - Color summation
B - Blue
),(, nmC d - GLCM
),(, nmC h
d - Haar based GLCM
CA - Concave area
CON - Contrast
)(iD - Segmented pixel
DB - Davies-Bouldin‟s Index
DBA - Davies-Bouldin‟s Index for adjacent classes
DI - Defective index for starfruit skin defect
d - Relative distance between GLCM pixel pair
Ed - Euclidian distance
iHE ,, - Maturity class error
G - Green
GLCM - Gray level co-occurrence matrix
GLCLL - Gray level co-occurrence linked list
FDR - Fisher‟s Discriminant Ratio
H - Hue
RGH - 2-color hue
diH - Desired hue boundary between maturity index i and
i+1
MH - Average H value of a starfruit
PCAH - H altered by PCA transfer function
RG
MH - Average RGH value of a starfruit
RG
PCAH - RGH altered by PCA transfer function
),(, yxH d - Differencing operation to GLCM pixel pair
)(ih - Stem concave elimination filter
L - Lightness

xix
RGL - 2-color lightness
),(, yxL d - Averaging operation to GLCM pixel pair
M - Color difference
MM - Average M value of a starfruit
PCAM - M altered by PCA transfer function
PDI - Pixel Defective Index
p - Edge magnitude
R - Red
S - Saturation
RGS - 2-color saturation
'S - Modified saturation for grayscale enhancement
T - Threshold value
V - Value
RGV - 2-color value
di - Desired area percentage for maturity index i
diH - Area percentage at hue less than or equal to diH
),(0, yx - First pixel value of the GLCM pixel pair
)','(, yxh
d - First pixel value of the Haar based GLCM pixel pair
),(, yxd - Second pixel value of the GLCM pixel pair
)','(, yxh
d - Second pixel value of the Haar based GLCM pixel pair
H - Modified hue for grayscale enhancement
- Pixel entry
- Curvature
- Rate of change of weight assigned to )(iD
- GLCM orientation
- Directional function

xx
LIST OF APPENDICES
APPENDIX TITLE PAGE
A Publications 193
B Starfruit Samples based on Maturity Index 195
C Skin Defect Samples 201
D Shape Defect Samples 203
CHAPTER 1
INTRODUCTION
1.1 Project Background
Malaysia has been the largest exporter of starfruits in the world since 1989
[1]. The biggest starfruit farm has been setup in Selangor since 2002 [2]. It becomes
a serious production because the fruit is not only popular among Malaysians but also
to other communities around the world. Over the years, significant export growth has
been recorded. Malaysia‟s export figures for 2000 and 2001 were 8,745 metric ton
and 9,182 metric ton respectively. This is more than 60% increase from Malaysia‟s
export in 1991, which was 2,723 metric ton [3]. Some of the major starfruit importers
include Netherlands, Germany, Singapore and Hong Kong. These four major
importer countries contributed 82.28% to Malaysia‟s starfruit export in 2003 [3]. As
an export commodity, the production of good quality starfruit is vital because most
of the importer countries are quality conscious customers. Thus, an effort towards the
best quality production of the starfruit should be discovered.
Quality of the starfruit is defined by its physical appearance and taste.
Malaysia is acknowledged to have the best taste of starfruit amongst the importer
countries compared to other exporter countries [4]. However, the attractiveness of the
physical appearance of the starfruit is as important as its good taste. To ensure only
good quality starfruit with good physical appearance enter the market, FAMA
(Federal Agricultural Marketing Authority) created a quality label called Malaysia‟s
Best. Under this label, every step from harvesting to packaging of the fruit is
described to ensure quality.

2
However, up to present, the quality inspection process of the starfruit is
performed manually. Manual inspection causes inconsistency in quality due to
human subjective nature, slow processing and labor intensity. The quality inspection
also needs experience workers to avoid misclassification. Generally, starfruit quality
inspection process involves removal of damaged starfruit and sorting the starfruit
into six maturity indices. Removing damage starfruit requires workers to identify
starfruit surface defect where they are guided by 10 types of defect. Then, only the
top quality starfruit will be categorized into 6 indices based on its ripeness.
This shows that manual inspection is a tedious and complicated process.
Automation of the process will be able to solve this problem where it will improve
the quality consistency and save pack house labor. One way to accomplish this is by
applying machine vision technology. Currently, there are few other countries that
have been applying automation for fruit grading to apples and oranges [5][6][7][8].
However, each fruit has different criteria that make automation for fruit quality
inspection using generalized machine is impossible. Hence, a specific machine for
the starfruit quality inspection needs to be designed. Designing automation solution
for starfruit is more difficult compare to other fruits due the star shape of the fruit
while other fruits like apple and orange or kiwi has a flat surface.
1.2 Problem Statement
Based on the manual inspection issue in the previous sub-topic, this work is
conducted to design the quality inspection algorithm for the starfruit so that later it
can be used for the automation process. In developing the quality inspection
algorithm, new features will be constructed to carry out three processes of the
starfruit quality inspection. Those processes are maturity classification, skin defect
estimation and shape defect estimation. Two types of feature, based on color and
shape will be constructed. For the color feature, a less complicated and less
computationally burden feature will be constructed. This issue is raised because
common color features adopt high amount of data. Normally as much as three
dimensional of data. Thus, basically this research will construct a new color feature
3
with less dimensional of data so that the quality inspection algorithm will not suffer
high computational burden. For the shape feature, it will also be constructed based on
similar argument on the computational burden.
Apart from the features construction, this research will also develop a classifier for
each of the starfruit quality inspection processes. Apparently, the input to these
classifiers will be the features proposed in this work. In developing the classifiers,
few existing classifiers will be tested. The best classifier will be chosen and few
modifications will be made to suit the application of the starfruit quality inspection
process.
1.3 Objectives
The principle objective of this research is to automate the starfruit quality
inspection process. However, the automation process covers a wide range of work,
which can be generally categorized into software design and hardware design. In this
thesis, the research focused on the development of starfruit quality inspection
algorithm implemented in software. Hence, the main objective of this research is to
design algorithms for starfruit maturity index classification process and starfruit
defect estimation process. Along with this objective, an analysis of color components
for the starfruit image and construction of new features will be carried out.
1.4 Scopes
As this research is aiming on designing the algorithms for the maturity index
classification and starfruit defect estimation, hence an offline system is considered.
By applying the offline system, input images to the system (starfruit image) are pre-
captured using digital color camera at indoor environment and store them in a
computer hard drive. There are 600 samples used for this work.
4
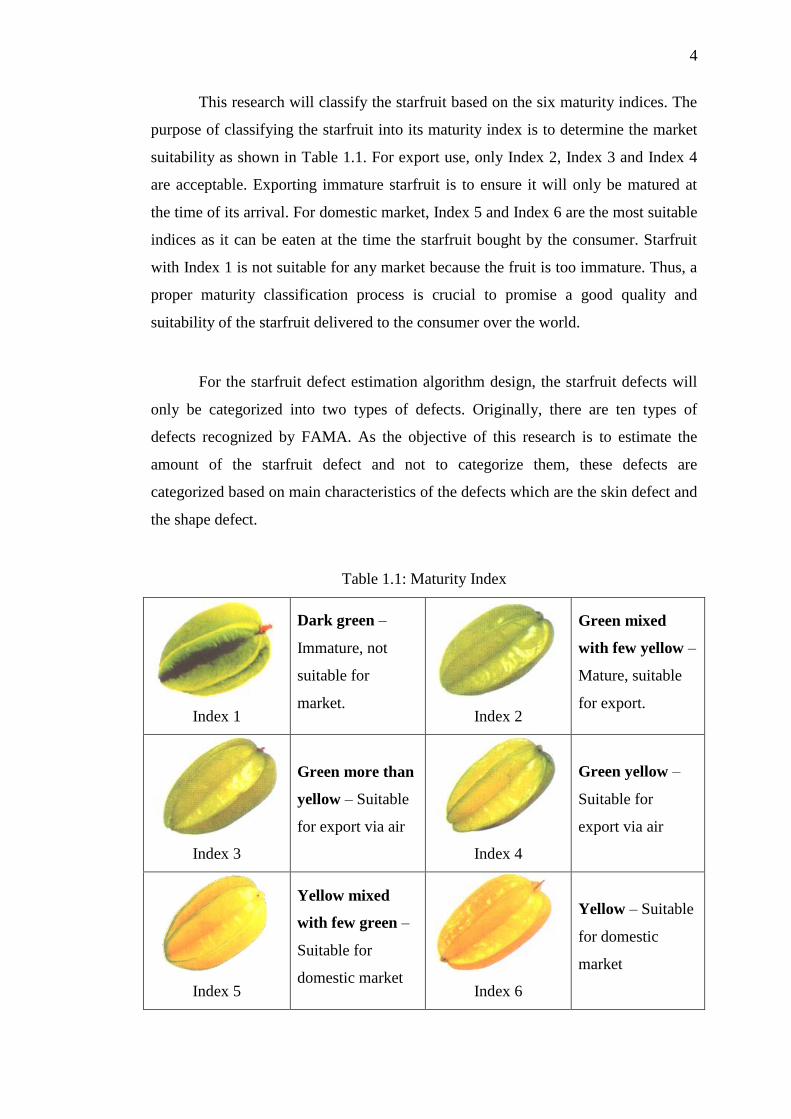
This research will classify the starfruit based on the six maturity indices. The
purpose of classifying the starfruit into its maturity index is to determine the market
suitability as shown in Table 1.1. For export use, only Index 2, Index 3 and Index 4
are acceptable. Exporting immature starfruit is to ensure it will only be matured at
the time of its arrival. For domestic market, Index 5 and Index 6 are the most suitable
indices as it can be eaten at the time the starfruit bought by the consumer. Starfruit
with Index 1 is not suitable for any market because the fruit is too immature. Thus, a
proper maturity classification process is crucial to promise a good quality and
suitability of the starfruit delivered to the consumer over the world.
For the starfruit defect estimation algorithm design, the starfruit defects will
only be categorized into two types of defects. Originally, there are ten types of
defects recognized by FAMA. As the objective of this research is to estimate the
amount of the starfruit defect and not to categorize them, these defects are
categorized based on main characteristics of the defects which are the skin defect and
the shape defect.
Table 1.1: Maturity Index
Index 1
Dark green –
Immature, not
suitable for
market.
Index 2
Green mixed
with few yellow –
Mature, suitable
for export.
Index 3
Green more than
yellow – Suitable
for export via air
Index 4
Green yellow –
Suitable for
export via air
Index 5
Yellow mixed
with few green –
Suitable for
domestic market
Index 6
Yellow – Suitable
for domestic
market

5
1.5 Research Methodology
The work undertaken in this research involves three main processes. The first
process is the maturity classification based on the six maturity indices as discussed in
the previous sub-topic. The other two processes are related to the defects estimation
process, which are the shape defect estimation and the skin defect estimation. Figure
1.1 illustrates the flow process of the research design.
Briefly, the maturity classification process starts with 2-color hue
computation. Originally, hue is computed based on 3-color system of RGB (red,
green, blue). However this research will only be using red and green color
components to reduce the computational burden. Apparently, this will cause loss of
information. Thus, an analysis to the suitability and acceptability of the new 2-color
hue will be conducted. Based on the computed 2-color hue, the input starfruit image
is classified into one of the six maturity indices by applying few rule functions.
Technique on obtaining the rules function will be develop and compared with few
existing techniques to evaluate the performance of the proposed technique.
For shape defect estimation process, boundaries of the starfruit will be used to
construct features. Curve extraction is applied to get these boundaries. Dissimilarity
is then estimated by constructing convex hull from the extracted boundaries. In this
research, existing convex hull algorithm will be tested. Then, modification to the
existing algorithm will be made to optimize its computational complexity. However,
the modification will ensure that it will not alter the output of the convex hull. At the
last stage, estimation of the defect based on the convex hull will be compared to the
other existing shape representation techniques for the performance evaluation.
For the third process, estimation of the skin surface defect is based on gray
level co-occurrence matrix (GLCM) computation where the defective area will be
segmented out. Prior to the defects area segmentation, input of the 3-color image is
transformed into one-color image to produce better representation of the defects
image. As it is a one-color image, visual appearance of the transformed image will be
similar to grayscale image. Then, the defect estimation process will be made based

6
on the segmented area of the transformed image. In this process, new defect
estimation function will be developed. To test the performance of the skin defect
estimation process, each process represented in boxes of the Skin Defect Estimation
column in Figure 1.1 will be tested and compared to other techniques.
Figure 1.1: Flow process of the research
Input
Image
Maturity Classification
Shape Defect Estimation
2D Hue
Computation
Classification
Process
Curve
Extraction
Convex Hull
Construction
Defect
Estimation
Background Subtraction &
Smoothing
Graded
Image
Skin Defect Estimation
Image
Enhancement
Segmentation based on Co-
occurrence matrix
Defect
Estimation
Post-
Processing

7
1.6 Related Previous Work
In fruit processing research that applies image processing, most of the
published research concentrates on apples and orange. M. Recce and J. Taylor have
proposed a method to grade oranges based on shape and color [9]. The works apply
statistic features on each of red, green and blue color of the image in order to detect
defects. Then, neural network is applied to examine the shape of the orange whether
it is in a good shape or not. In 2003, D. Unay and B. Gosselin works on detecting
defects on apples where they also used the RGB color system [5]. Here, features
from apple images were extracted based on structural analysis (surface analysis).
Three coefficients calculated from co-occurrence matrix were used as their features
to locate defects area. These two works used RGB color system as their local features
because it is directly related with the images. This is acceptable since the skin color
of healthy fruit is almost homogeneous. It will be in different situations when it
comes to starfruit where its healthy skin consists more than one discerns color.
Another popular research on fruit is in automated picking robot. An example
of such research is presented by S. Limsiroratanal and Y. Ikeda [10]. Their main
research objective is to differentiate between fruit and leaves on the harvesting plant.
This can be done with the fact that matured fruits and leaves have different colors
and shapes. This work computed red, green and blue ratio on each of the image pixel
to detect the fruit. Major disadvantage of this technique is, only mature fruits are
recognized while immature fruits are difficult to recognize due to its color, which is
almost similar to leaves. Finally, there is a paper presenting work on starfruit quality
inspection [11]. In this paper, starfruit is classified into its maturity index based on
HSL color space. Two classification techniques were tested in order to classify the
starfruit. They are Discriminant Analysis (DA) and Neural Network (NN). The work
achieved their highest accuracy when applying the NN technique with 6 hidden
layers.
As most of the existing works applied the 3-color system to achieve their
objectives, this research will applied a proposed color system based on 2 colors. The
idea is to reduce the computational burden.

8
1.6.1 2-Color System
Years before full color camera of a 3-color system is invented, a two-color
camera was used as an advance camera compared to the grayscale camera [12]. It
was used by Technicolor Film for filmmaking. The camera only has two color filters
where one of it was used to filter the red color and the other was to filter the green
and blue color component simultaneously. Then, red was projected to red negative
film while green and blue that were filtered by a single filter were projected on green
negative film. Using additive mixture process, the red and green negative films were
combined to produce a color image. As the system used red and green negative film,
its range of color is called RG color system. Thus, blue is said to be out of gamut.
The system could not generate white color and many colors were distorted. In the RG
color system, magenta, which contains a blue component, becomes orange while
shades of blue appear muddy brown or black. Any color containing a blue color
cannot be replicated accurately in the RG color space. A few years later, Technicolor
introduced a 3-color system, which is now the RGB color system and the 2-color
system is no longer in used.
From RG color system, RG-Chromaticity color system [13] is introduced to
represents all possible color in the RG color system by ignoring the luminance
parameter. It is not widely used, as it is less capable in representing color as human
visual system does. Thus, the 2-color system is forgotten and replaced by the 3-color
system, which is the basis for most existing color systems today. A 3-color system is
perfect for human visual system because human eyes are also consist of 3 color
receptors in interpreting the colors. However, in this research work, 2-color system is
studied and applied in order to achieve the research objectives. The motivation of
applying the 2-color system although it represents color inaccurately is because the
consumption of data can be reduced significantly and simplification of its
computation complexity is possible. Unlikely the previous RG color system, which is
formed based on the two color filters, this research introduced a 2-color system based
on the RGB color system. Thus, a normal camera with 3 color filters will be used and
no special camera equipped with 2 color filters is needed.

9
In this work, the proposed 2-color system will be applied on the maturity
classification process and the skin defect estimation process. For the shape defect
estimation process, instead of the color feature, different type of feature will be used.
Apparently, it will be based on shape.
1.6.2 Shape Representation
Shapes play a fundamental role in understanding objects in terms of their
behavior and characteristics, such as their identity and functionality [14]. Thus,
representing shapes by mathematical model is an emerging major research area as it
has impact in diverse applications ranging from image analysis and pattern
recognition to computer graphics and computer animation. Basically, shape
representation technique can be categorized into region-based technique, which
extract information from the whole region of the object and contour-based technique,
which is based on the boundaries of the object [12].
In the region-based technique, simple shapes can be represented by their
geometric features such as rectangularity, elongatedness, direction and compactness
as well as their statistical measures. However, for complex shapes, the object must be
represented by a planar graph where each point on the graph will represent a sub-
region of simple shapes [15]. Geometric representation works only for simple objects
as it gives only global information. Complex objects on the other hand rely more on
local attributes and thus need more complex techniques. Another technique is the
moment invariant technique, which gives reliable results and less complicated. This
technique is based on statistical features of the object. In 1962, Hu [16] introduced
seven rotation, translation and scale invariant moment characteristics. Hu‟s moment
invariant is proven to be very useful in many applications [17][18]. Thus, these
characteristics are also discussed in many publications [19][20]. Although moment
invariant has good characteristic describing object‟s shape, its description is based on
the global information. For the starfruit shape defect estimation, the global
information extracted using the moment invariant is not sufficient as the requirement
for the local information is crucial. This is because the shape defects consume only a

10
certain portion of the starfruit where local features are the best to describe the
defects.
One way for the extraction of local information from an object can be
obtained by applying region decomposition technique where the original object is
divided into smaller and simpler sub-regions. The object‟s shape can then be
described by accumulating properties from the set of all these sub-regions. The
decomposition approach is based on the idea that the shape of an object is
hierarchically constructed from primitive shapes, which are the simplest elements
that form a complete shape. Triangle, square, circle and convex shapes are examples
of the primitive shapes. Normally the decomposed image is represented in tree
structure as applied by J.M. Reinhardt and W.E. Higgins [21]. Another method of
shape decomposition is based on convex hull computation [22][23]. Convex hull is
the smallest convex region that consists of all curve points. To achieve an efficient
computation of the convex hull, many linear-time convex hull detection algorithms
have been introduced, however more than half of them were later discovered to be
incorrect [24][25]. The first linear-time algorithm proved to be correct was presented
by McCallum and Avis [26].
Another technique of extracting the local information the contour-based
technique. In this technique, the shape information is extracted along the boundary of
the object where both local and global information exist. The simplest contour-based
technique is chain code method (also known as Freeman‟s code). Basically, it
describes the shape by a sequence of unit-size line segments with a given set of
orientation [27]. One problem with the chain code method is that it is very sensitive
to noise, scale and rotation. Thus, a smoothed version of the chain code is needed
[28]. Although chain code representation is simple, it does not contain enough
information for the starfruit defect estimation.
Apart from the chain code, representations based on geometric features such
as boundary length, curvature, signature and chord distribution can give extra
information [27]. Boundary length describes global measure and can be simply
derived from the chain code representation. The second feature, curvature, is a local

11
measure of the object that represents boundary as the rate of slopes change. From the
curvature, another two features can be derived; critical points (also called corner
points), which is a local measure and bending energy, which is a global measure. The
following section will demonstrate how curvature can be relates to the convex hull
algorithm. The other two features, signature and chord distribution are also local
measures. Signature is defined as a sequence of normal contour distance between
two curve points and chord distribution is the length of line joining any two curve
points. The disadvantage of signature is in its complex computation while chord
distribution is in its difficulty in determining the best reference points in its
computation.
There are several other methods and approaches that can be used to describe
the shape based on its contour. While they may have good description, they generally
have complicated computations [29]. As an example, the B-spline representation
applied polynomial in its computations. Another example is Hough transform, which
identifies locations and orientations of certain types of line shapes in an image, is
very computationally expensive as each of the curve points need to be transform into
a planar curve [30].
In the work reported in this thesis, the Melkmen convex hull technique has been
preferred due to its simplicity to represent the starfruit shape. However, some
modifications will be made to simplify the original Melkmen convex hull technique.
By implementing this technique, local information of the starfruit will be obtained by
decomposing the convex hull shape of the starfruit. From this local information,
defect estimation will be computed to determine whether the starfruit under
investigation suffer shape defect or not.
1.7 Research Contribution
In the process of achieving the objectives, several contributions have been
identified. These are explained in the context of the three main processes of the
starfruit quality inspection.

12
1.7.1 Maturity Classification
There are two contributions in the maturity classification process. First is in
the redesign of the hue computation based on 2-color system of RG (red, green).
Originally, hue is computed based on 3-color system of RGB (red, green, blue).
Thus, a less complicated and less computational burden is achieved. The 2-color hue
computation has now become a linear function where as the original hue
computation involves nonlinear function. The linearization issue will be discussed
extensively in Chapter 2.
The second contribution is the successfulness of applying the 2-color hue as
an input feature for the starfruit maturity classification process. Although the
classification process is only using 2-color, the results is very promising. With the 2-
color hue, the classification process turns out to be simple where a few simple rules
are adopted.
1.7.2 Shape Defect Estimation
The first contribution in the shape defect estimation is in relation to shape
construction where a modified version of convex hull algorithm is proposed. Convex
hull is the smallest polygon of a shape that positions the entire points of the input
shape within the polygon [28]. This research modified Melkmen convex hull
algorithm so that the computational burden is reduced. In this modified algorithm,
several information from the starfruit boundaries extraction process, which was not
considered in the original Melkmen algorithm are applied.
The second contribution in the shape defect estimation process is the design
of the shape estimation algorithm based on the proposed convex hull. The shape
estimation algorithm assumes the convex hull as the perfect shape of the starfruit and
compares it with the input shape of the starfruit to measure dissimilarity. Basically
this algorithm is based on the existing shape decomposition technique but adapt to
the proposed convex hull. For abnormal shape starfruit, the constructed convex hull

13
and the original input shape of the starfruit will have a significant dissimilarity while
a normal shape starfruit will have almost similar convex hull with its original input
shape.
For the third contribution, a technique on identifying and eliminating starfruit
stem concave from the starfruit shape is proposed. Without this process, the stem
concave will be identified as shape defect, which will cause a faulty shape defect
computation. Basically, identifying and eliminating the stem concave is done by
identifying specific shape defect pattern on the boundary of the starfruit shape where
few rules are implemented.
1.7.3 Skin Defect Estimation
The first contribution in the skin defect estimation is, a new GLCM statistical
feature has been developed. This new feature is used as a threshold value for
segmenting the defective area. Based on this new feature, the segmentation process
will have the flexibility over the edge definition. Thus, it can handle images with
fuzzy boundaries between the image‟s object and background. This is very helpful
for the defects segmentation because most of the defects come with fuzzy
boundaries.
The second contribution is in the design of the skin defects estimation
algorithm itself. Although the main part of the defects estimation is the defects
segmentation, other factors such as the position of the defects and the condition of
the defects are also considered in the design, which make the design unique.
The third contribution is in improving GLCM computation so that the
computation is fast. This is achieved by using the Haar wavelet transform. Haar
wavelet transform is applied because its wavelet bands are strongly correlated with
the orientation elements in the GLCM computation. Furthermore, the total pixel
entries for Haar wavelet transform is always minimum which will reduce the GLCM
computation burden.

14
Lastly, the fourth contribution is on constructing a special grayscale image as
an input to the skin surface defects segmentation process. The proposed grayscale
image is needed because defects in the standard grayscale image are mostly
ambiguous. Thus, the special grayscale image is designed so that the defects will
have better visibility during the segmentation process. To maintain the consistency of
using the new 2-color system of RG in this research, the special grayscale image is
also designed with the 2-color system. The design is based on HSI (hue, saturation,
intensity) color system where the three color features (hue, saturation, intensity) will
be mixed together in a unique way to produce a new grayscale image constructed
based on the new 2-color system.
1.8 Thesis Organization
This thesis consists of six chapters. The thesis starts with an introduction in
Chapter 1 where background of the research, problem statement, objectives, scopes,
related previous works, research methodology and contribution of the research are
discussed. The next three chapters extensively discuss methods applied in this
research. Chapter 2 discusses the method for starfruit maturity classification process,
Chapter 3 discusses the method for shape defect estimation process and Chapter 4
discusses the method for the skin defect estimation process. In each of these chapters,
theory and background of related issue are presented before the discussion on the
proposed method is presented. This is to ensure originality of this research work and
as well as a guide in designing the proposed methods. The experimental results of the
proposed methods are then presented in Chapter 5. In this chapter, the performance
of the proposed method is measured and compared with those of previous related
works. Finally, Chapter 6 concludes this thesis and presents several suggestions for
future development work in order to improve and extend this research so that a
complete system of an automated starfruit inspection process can be realized.