
Feature extraction from micro-tomography analysis of solid ...
13
8 TH EUROPEAN CONFERENCE FOR AERONAUTICS AND AEROSPACE SCIENCES (EUCASS) DOI: ADD DOINUMBER HERE Feature extraction from micro-tomography analysis of solid propellants Filippo Maggi * and Marco Bratti † Politecnico di Milano Dept. Aerospace Science and Technology, 34, Via La Masa, Milano, Italy Abstract The study of the microstructure in composite solid rocket propellants is mostly focused on the properties and placement of oxidizer and metal particles. Both combustion and mechanical properties are influenced by their size, shape, orientation, and surface-binder interaction. The investigation methods span from numerical simulation of casting, directional burning rate analysis, modeling of microstructure, and micro- tomography. This last investigation technique has always been considered an interesting non-destructive inspection method, though qualitative. High-quality imaging of solid propellant inner structure is not sim- ple. Particles are close-packed each other, with small binder strips in between. Materials are characterized by different absorption capabilities, making artifacts and edge detection complex. In this respect, the paper presents some new developments at SPLab-POLIMI to inspect micro-tomography and extract information from a heterogeneous composite material. A discussion about image unsharpness will be reported with supporting data. 1. Introduction Heterogeneity is a multi-scale problem, strongly influenced by the observation viewpoint. If we observe a wall of bricks from a large distance, the surface will appear uniform, the color homogeneous and we will not observe directional properties. When the observer gets closer to the wall, bricks will become evident. Whitish strips of cement will appear between the red color of the bricks, following preferential directions. The brick becomes the unit element of the wall, displaced in a precise geometrical order. The category of heterogeneous matter comprises a very wide number of common materials. Concrete, pressed powder pellets, asphalt, and solid propellants represent only few examples of intrinsically heterogeneous materials that manifest macroscopically homogeneous properties. Composite solid propellant global characteristics are determined by their microstructure which, in turn, depends on the details of its composition. They are a mechanical mixture of solid ingredients in the shape of micrometric powders and an elastomeric matrix which gives mechanical consistency. The mixing action confers random-kind displacement of particles however a sort of order can be identified. Coarse oxidizer (in the range 200 μm to 400 μm) , fine oxidizer (about 10 μm to 20 μm), aluminum powder (typically, 15 μm to 30 μm), and a minor fraction of additives are arranged in pocket-kind structures where fuel-lean regions are surrounded by coarse oxidizer. The reader can find in the literature the classical Cohen’s geometric vision and more recent pseudo-random approach by Maggi et al. 1, 2 A typical example of micro-scale influencing the macro-scale is represented by the overall packing factor of multimodal powders. 3 Even in presence of monomodal particles, variation of spatial organization causes a difference in volume of the global assembly and, thus, of the density. The same considerations can be done on propellants. The change in the oxidizer coarse-to-fine ration produces different global density. As an example these microstructure properties can alter the burning rate as an increment is observed for higher fraction of fine component. When we move from the scientific side to real implementation, the things become even more complex. The presence of voids, related to imperfection of the manufacture causes further decrease of the propellant density and the generation of a discontinuity in the medium, with consequent safety issues related to heat transfer and mechanical properties. * fi[email protected], Associate Professor, Space Propulsion Laboratory, corresponding author † [email protected], M.Sc. Student, Space Propulsion Laboratory Copyright © 2019 by F. Maggi and M. Bratti. Published by the EUCASS association with permission. DOI: 10.13009/EUCASS2019-706
Transcript of Feature extraction from micro-tomography analysis of solid ...

8TH EUROPEAN CONFERENCE FOR AERONAUTICS AND AEROSPACE SCIENCES (EUCASS)
DOI: ADD DOINUMBER HERE
Feature extraction frommicro-tomography analysis of solid propellants
Filippo Maggi * and Marco Bratti †
Politecnico di MilanoDept. Aerospace Science and Technology, 34, Via La Masa, Milano, Italy
AbstractThe study of the microstructure in composite solid rocket propellants is mostly focused on the propertiesand placement of oxidizer and metal particles. Both combustion and mechanical properties are influencedby their size, shape, orientation, and surface-binder interaction. The investigation methods span fromnumerical simulation of casting, directional burning rate analysis, modeling of microstructure, and micro-tomography. This last investigation technique has always been considered an interesting non-destructiveinspection method, though qualitative. High-quality imaging of solid propellant inner structure is not sim-ple. Particles are close-packed each other, with small binder strips in between. Materials are characterizedby different absorption capabilities, making artifacts and edge detection complex. In this respect, the paperpresents some new developments at SPLab-POLIMI to inspect micro-tomography and extract informationfrom a heterogeneous composite material. A discussion about image unsharpness will be reported withsupporting data.
1. Introduction
Heterogeneity is a multi-scale problem, strongly influenced by the observation viewpoint. If we observe a wall of bricksfrom a large distance, the surface will appear uniform, the color homogeneous and we will not observe directionalproperties. When the observer gets closer to the wall, bricks will become evident. Whitish strips of cement will appearbetween the red color of the bricks, following preferential directions. The brick becomes the unit element of the wall,displaced in a precise geometrical order. The category of heterogeneous matter comprises a very wide number ofcommon materials. Concrete, pressed powder pellets, asphalt, and solid propellants represent only few examples ofintrinsically heterogeneous materials that manifest macroscopically homogeneous properties.
Composite solid propellant global characteristics are determined by their microstructure which, in turn, dependson the details of its composition. They are a mechanical mixture of solid ingredients in the shape of micrometricpowders and an elastomeric matrix which gives mechanical consistency. The mixing action confers random-kinddisplacement of particles however a sort of order can be identified. Coarse oxidizer (in the range 200 µm to 400 µm) ,fine oxidizer (about 10 µm to 20 µm), aluminum powder (typically, 15 µm to 30 µm), and a minor fraction of additivesare arranged in pocket-kind structures where fuel-lean regions are surrounded by coarse oxidizer. The reader can findin the literature the classical Cohen’s geometric vision and more recent pseudo-random approach by Maggi et al.1, 2
A typical example of micro-scale influencing the macro-scale is represented by the overall packing factor ofmultimodal powders.3 Even in presence of monomodal particles, variation of spatial organization causes a differencein volume of the global assembly and, thus, of the density. The same considerations can be done on propellants. Thechange in the oxidizer coarse-to-fine ration produces different global density. As an example these microstructureproperties can alter the burning rate as an increment is observed for higher fraction of fine component. When we movefrom the scientific side to real implementation, the things become even more complex. The presence of voids, related toimperfection of the manufacture causes further decrease of the propellant density and the generation of a discontinuityin the medium, with consequent safety issues related to heat transfer and mechanical properties.
*[email protected], Associate Professor, Space Propulsion Laboratory, corresponding author†[email protected], M.Sc. Student, Space Propulsion Laboratory
Copyright© 2019 by F. Maggi and M. Bratti. Published by the EUCASS association with permission.
DOI: 10.13009/EUCASS2019-706

FEATURE EXTRACTION FROM MICRO-TOMOGRAPHY ANALYSIS OF SOLID PROPELLANTS
2. Microstructure in propellants and tomography
Even minimal details of the microstructure can cast their effect over the behavior of a propellant. For example, theproduction process of some types of BATES (ballistic test and evaluation system) motors have been found to influencethe shape of the pressure trace. Numerical casting simulations demonstrated that the stress induced by the insertionof the mandrel for manufacturing the central perforation could be correlated to a local anomaly of the pressure trace.5
Very likely, this localized stress has determined a minimal, though significant, alteration of the microstructure. Thesame problem was investigated experimentally confirming local burning rate variation across the web thickness.6 Alsoshape and orientation of particles can be important. A numerical study by the CSAR group of the UIUC has shown thatthe orientation of non-spherical oxidizer may lead to change in burning rate.7 In this paper, spherical particles havebeen virtually stretched to ellipses numerically obtaining different burning rates when the deformation was modified incombustion simulations.
X-ray computed tomography allows the inspection of material bulks. The technique is based on a set of X-rayback projections which reveal the radiographic absorption capability of a sample along a precise line of sight.8 Thistechnique can use five different geometric configurations. A common one is called "cone-beam" and is based on apoint-wise X-ray source, a detector, and a sample placed in between. The source emits a conic beam and impingesupon the sensor after passing through the sample. There are two possible modes to operate this kind of instrument: inone case the sample is lodged on a rotating table while the instrumentation is fixed, in another case the sample is fixedwhile detector and source rotate accordingly. Finally, an algorithm merges the information of a complete 360 ∠ rotationand produces a three-dimensional absorption map.
The use of tomography in solid propellants was used to inspect qualitatively the propellant microstructure byGallier9 and by Collins and co-authors.10 More recently, Maggi and Garg inspected also the degradation of singleingredients after thermal cycles (namely, cracks inside single particles of ammonium nitrate).11 An example of two-dimensional cut of an AP-based propellant micro-tomography is reported in Figure 1. The image shows clearly thepresence of different ingredients, given their contrasting X-ray absorption capability. Aluminum powders appear asbright spots, being a metal with relatively high density with respect to the other components. The oxidizer has anintermediate gray scale. The coarse particles are well defined in the reported image. The binder is the most difficultpart to detect. It may contain a dispersion of fine oxidizer having size in the order of the scan resolution. Moreover,carbon-based plastics feature low absorption capability.
Figure 1: Micro-tomographic view of a metalized solid propellant
3. Considerations on image quality
Images obtained directly from the tomography are rarely a perfect representation of the object microstructure, sincethey are usually affected by various factors such as optical transfer function, scatter, noise, unsharpness, artifacts, . . . 12
Image analysis and processing generally refers to a series of digital manipulations improving their quality and aiming
2
DOI: 10.13009/EUCASS2019-706

FEATURE EXTRACTION FROM MICRO-TOMOGRAPHY ANALYSIS OF SOLID PROPELLANTS
at extracting representative information (e.g. numerical data) from them. A good discussion on the topic was publishedby Schlüter et al.13 CT image analysis and processing usually consists in the following steps, even though some ofthem may be skipped for some purposes:
• Correction of defects: filters for quality increment, algorithms acting on scattering, artifacts, and noise are usedfor the reduction and mitigation of the imperfections present in the tomographic images.14, 15
• Enhancement of important details: emphasis of the main features of interest and removal or suppression of otherinformation that do not represent the main interest of the analysis. Hence, what remains results to be moreaccessible for human interpretation and more isolated for eventual successive measurements. The application offilters for contrast enhancement and image sharpening are the basis of this step.16
• Binary representation: with thresholding and segmentation the gray-scale images are converted into binary ones(black/white representation) and are divided into multiple parts. These actions are performed in order to separatethe aspects to be analyzed (usually composed by the white pixels) from the background (usually composed bythe black pixels). A large number of techniques of image thresholding and segmentation are available in theliterature.17
• Object recognition: process for identifying specific objects in digital images. It relies on matching, learning orpattern algorithms which use appearance-based or feature-based techniques.18
• Quantitative analyses: this step is strictly dependent on the final goal of the object tomographic inspection.
The use of quantitative tomographic characterization of a composite propellant microstructure is not straightfor-ward as a standard qualitative view. If the intention resides in the characterization of particles we should remember that,according to Barrett, particles are characterized completely by size, shape, and surface finishing.19 This is valid whenuniform material is expected. A more detailed characterization should consider the internal composition (e.g. defectsor multiple materials) and, when the particle is embedded in a heterogeneous material, also the orientation. Accuracyof size and shape is a matter of both software and hardware reasons and its quantification is addressed by the Germandirective VDI/VDE 2630.20 Some of the hardware reasons can be found in detector, X-ray source, movement accu-racy, sample stability, scanning conditions. Radiography correction, reconstruction algorithm, surface identification,thresholding are some of the software reasons. It should be underlined that said directive is pushing the machine to itsbest performance as it works with simplified geometries, ideal material compositions, as well as smooth and regularsurfaces. Because of the high number of particles, varying size, type of materials, proximity, and random mixing, thereal accuracy of the entire scanning process is the real bottleneck and can hardly reach the nominal features of themachine.
4. Reference tomography
In this paper a propellant tomography (internal identification no. SPL-CT-064) was considered for reference. The 3Dreconstruction is reported in Fig. 2. The sample is a stack of two non-aluminized solid propellant charges loadedwith ammonium nitrate oxidizer of 6 mm diameter and 8 mm height. The propellant was produced with non-optimalprocedure. It was mixed by hand without vacuum cycle. The composition was made by HTPB binder, non-stabilizedammonium nitrate produced by Yara (volume mean diameter 386 µm), and phase-stabilized ammonium nitrate (volumemean particle size 204 µm) prilled with the addition of potassium nitrate (stabilizer) by ICT Fraunhofer Institute,Karlsruhe, Germany.
The tomography was performed using a X-25 X-ray micro-tomographic machine by NSI. The X-ray source wasoperated at 60 kV and 25 µA, granting a magnification factor of 6.22 and a voxel resolution of 11.0(96) µm. It shouldbe considered that the apparatus is capable of a nominal certified resolution of 2 µm.21 The reconstruction of the imagewas performed using a proprietary software supplied with the machine introducing fine-tuning corrections for rotationalaxis identification and beam hardening. A set of 8 bit gray-scale output images have been obtained from slicing thetomography along one of the machine axes.
5. Qualitative feature extraction
The access to the bulk microstructure with qualitative inspection supplies initial information about the sample. Figure3 shows one slice of the reference tomography after reconstruction and extraction from the 3D data set. The resolutionand the sensitivity of the analysis is enough to identify some important features for quality assessment and productionprocess analysis. The slice is showing that all particles have rounded shapes. Fragmentation of crystals due to mixing
3
DOI: 10.13009/EUCASS2019-706

FEATURE EXTRACTION FROM MICRO-TOMOGRAPHY ANALYSIS OF SOLID PROPELLANTS
Figure 2: Three-dimensional representation of tomography SPL-CT-064.
Figure 3: Qualitative observation of a tomographic 2D slice
4
DOI: 10.13009/EUCASS2019-706

FEATURE EXTRACTION FROM MICRO-TOMOGRAPHY ANALYSIS OF SOLID PROPELLANTS
is not evident. Apparently there are groups of particles with bean-kind smooth aspect and others with spherical shape.Since the production technique of the ingredients is known, it can be inferred that the first ones are mainly non-stabilizedammonium nitrate particles while the latter are the prilled ones.
In the image different levels of porosity are identified by the black color. A macroscopic void is visible in thecenter of the image, highlighted by a yellow square. All around a number of micro-pores are also visible, havingtypical size below the one of the oxidizer. Wetting issues as well as non-uniform mixing are clearly identified by thistomographic setup. Defects of the ingredients can be identified as well. In the red circle the reader can observe anothervoid. In this case, the production of the propellant is not responsible for those. These defects seem to affect onlyrounded particles and may be generated by the presence of voids after prilling. The resolution of this scan enablesalso the identification of non-stabilized ammonium nitrate fragmentation. This is very likely caused by thermal cycleof the ingredient itself and by the accumulation of damage.11 The fracture is only faintly visible under these scanningconditions. Finally, the scan shows the ammonium nitrate particles colored by two different gray scale levels. Mostof the particles are depicted by darker gray with respect to lighter gray of the prilled ones. This fact allows theidentification of the ingredient, crystal by crystal. Very likely, the prilling process and the addition of the stabilizingadditive is modifying the X-ray absorption capacity of the ingredient.
6. Commencing quantitative feature extraction
6.1 Source of information
In a 3D problem, volume and surface area are the two major sources of information for particle characterization.Volume-based and surface-based factors can be used to report about size and shape. A combination of volume andsurface area information can be used as well. Surface-based factors are generally sensitive to small changes of theshape, being capable of capturing small changes. They can be affected by the presence of noise or other inaccuracies,though. Volume-based factors are less sensitive to small changes. They represent a more robust characterization methodin presence of noise, though less effective for detection of small details.22
The correct representation of particles properties requires the proper identification of the edge between contactingparticles or between particle and surrounding medium. Slices obtained from a CT (Computed Tomography) scan aregray scale representations of the absorption map in a defined plane. In this respect, the different gray-scale levelsidentify the variation of the absorption capability from the materials in the bulk. In the reference tomography usedin this paper, the pixel values span from the dark color of the air medium (baseline for minimal-absorption) to thelight-gray color of the phase-stabilized ammonium nitrate. Brighter spots could be observed in presence of metal (mostopaque material), as seen in Fig. 1.
6.2 Unsharpness issue
The contact between two materials featured by different X-ray opacity is identified by the shift of the gray scale valueacross two interfacing voxels. The variation should be point-wise in the case of ideal behavior whereas a real tomogra-phy is characterized by smooth transition. A 2D reconstruction of the issue is reported in Fig. 4. The lack of localizedgray-scale change makes the border reconstruction unsharp, causing an initial uncertainty on the particle surface po-sition. Main sources contributing to the generation of unsharpness phenomenon consist of scanning geometry, systemlimits, and movement imperfections. In the first case, the effect is caused by the interaction between non-infinitesimalsize of the X-ray source and magnification factor, which in turn depends on the reciprocal position of source, sample,and X-ray detector. The second case is a direct consequence of the pixel resolution of the X-ray detector. The thirdcase is generated by issues of the sample fixing and accuracy of the moving mechanism.
Literature papers identify four primitives for edge representation in tomographic reconstructions They are re-ported in Fig. 5. In an ideal case, a step-kind signal would identify the border as two materials featuring different X-rayabsorption properties are in direct contact. In Fig. 6, a particle was targeted (id. case number 001). A probing linewas randomly chosen and the grey-scale values were captured. Uncertainty identification of the edge is clear on thesides of the particle as the gray-scale value does not pass through a sharp border but smooth transition between air andparticle bulk is observed making it similar to a ramp. The transition is quite smooth and takes more than 50 µm longon both sides of a particle having a diameter of about 400 µm. The analysis was extended to other particles in the bulkwith a stochastic approach. The global unsharpness estimation was identified monitoring the convergence of mean andstandard deviations which both converged after 180 measurements to respectively 54.0(56) µm and 3.0(034) µm. Thevalue of the unsharpness is connected to the capacity of correct edge identification and proper estimation of particle
5
DOI: 10.13009/EUCASS2019-706

FEATURE EXTRACTION FROM MICRO-TOMOGRAPHY ANALYSIS OF SOLID PROPELLANTS
Figure 4: Tomographic interface representation
Figure 5: Types of edges in image analysis23
volume. The value of the standard deviation is quite limited and shows that the property is quite uniform across thereconstructed volume.
6
DOI: 10.13009/EUCASS2019-706

FEATURE EXTRACTION FROM MICRO-TOMOGRAPHY ANALYSIS OF SOLID PROPELLANTS
(a) Probing segment in a propellant tomogra-phy
(b) Gray scale profile along the probing segment
Figure 6: Example of edge unsharpness (Case 001).
7
DOI: 10.13009/EUCASS2019-706

FEATURE EXTRACTION FROM MICRO-TOMOGRAPHY ANALYSIS OF SOLID PROPELLANTS
6.3 Noise and sharpness
The bulk of uniform materials should feature constant gray scale level. For example, the beam hardening creates a shiftof the absorption map and virtually uniform material appear with a gradual variation of the gray-scale when movingtowards from the center towards the external surface. This artifact is characterized by smooth alteration of the image,can be easily treated through corrections, and does not interfere too much with the identification of the single particles.The noise introduced by the sensor-source interaction is a short-range disturbance. It is characterized by a variationat pixel level. Within the particle bulk it is represented by a high-frequency spatial noise, overlapped to the generalgray-scale value. Int he next images, said interval is referred to as "oscillation region". The plot for the Case-001particle shows a very modest fluctuation of the bulk value within the borders of the particle. A quantitative analysis ofthe plot is reported in 7. The unsharpness is different at the two edges but the bulk properties are quite uniform, despitesome minor modification.
From the same tomography, a different probing line is plot over two contacting particles (id. Case-025). Thetomography magnification and the gray-scale plot are reported in Fig. 8. From the 2D slice, it appears that a small gapfilled with binder is present in between and the line is traced on purpose across that interface. On the other side, theparticle faces a void. As expected, in the gray-scale plot the two particles are separated by a minimum of the absorptionmap but the value is higher than the one associated to vacuoles. The reason is twofold. On the one side, the binderis not completely transparent to X-rays. On the other side, the contact involves a limited number of voxels, causingpossible noise and resolution effects.
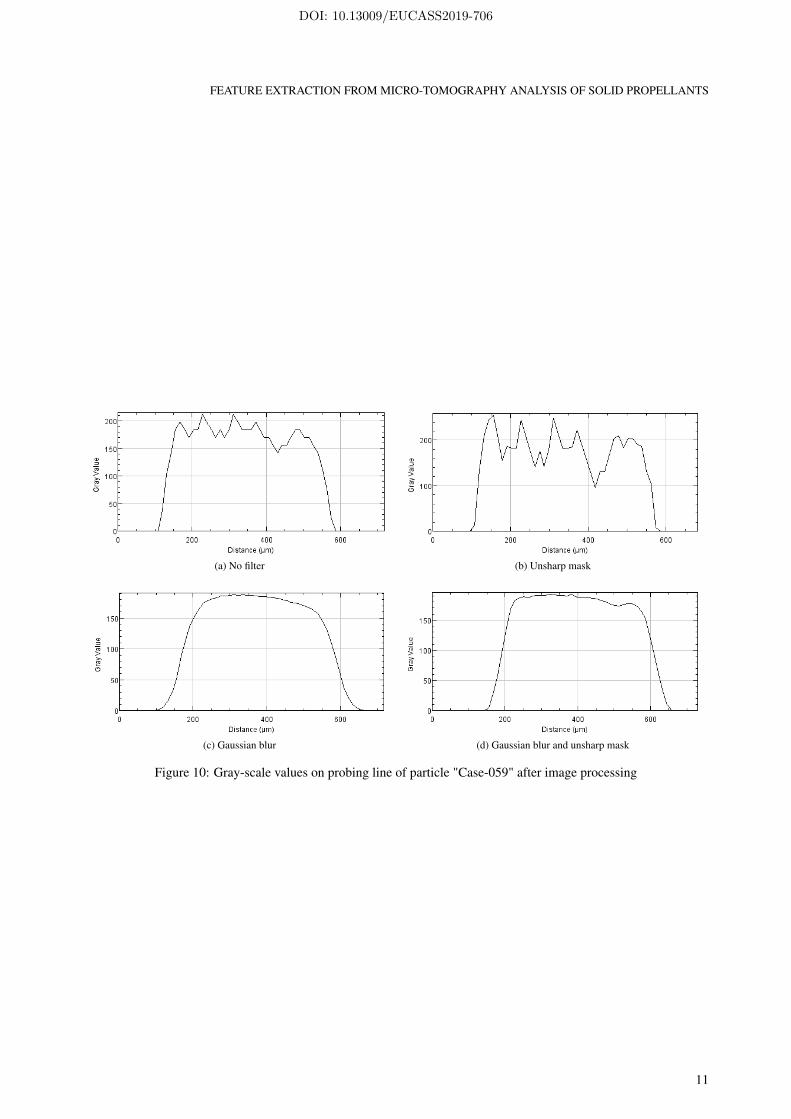
Denoising and sharpness are very often treated together because methods to highlight borders generally can alsoamplify the image noise. The issue is here studied by convolving the region of interest with a combination of Gaussianblur and unsharp mask 3D kernels. One lateral particle of the reference tomography is targeted (particle id. "Case-059"). For simplicity, the probing line is considering only a single item and does not intersect other borders. Figure9 is showing the application of the filters to the slice having the largest particle section area on it. The plot-over-lineprobing is reported in Fig. 10. Main observations can be conducted in the central oscillation region and on the twoparticle borders.
8
DOI: 10.13009/EUCASS2019-706

FEATURE EXTRACTION FROM MICRO-TOMOGRAPHY ANALYSIS OF SOLID PROPELLANTS
Figure 7: Interpretation of Case-001 particle gray-scale profile
(a) Probing line (b) Gray-scale value
Figure 8: Image of particle "Case-025" with yellow probing line
9
DOI: 10.13009/EUCASS2019-706

FEATURE EXTRACTION FROM MICRO-TOMOGRAPHY ANALYSIS OF SOLID PROPELLANTS
(a) No filter (b) Unsharp mask
(c) Gaussian blur (d) Gaussian blur and unsharp mask
Figure 9: Image of particle "Case-059" after image processing
10
DOI: 10.13009/EUCASS2019-706
FEATURE EXTRACTION FROM MICRO-TOMOGRAPHY ANALYSIS OF SOLID PROPELLANTS
(a) No filter (b) Unsharp mask
(c) Gaussian blur (d) Gaussian blur and unsharp mask
Figure 10: Gray-scale values on probing line of particle "Case-059" after image processing
11
DOI: 10.13009/EUCASS2019-706

FEATURE EXTRACTION FROM MICRO-TOMOGRAPHY ANALYSIS OF SOLID PROPELLANTS
The unsharp mask filtering (case b, radius = 2 pixels) makes the border more defined. Qualitative observationof the image shows more contrast with respect to the initial picture. From a quantitative viewpoint, the gray-scaleprobing plot features sharper side values and more noise. For example, the left edge reduces the rising interval fromabout 75 µm to about 50 µm. The measure was picked up from the zero level to the first maximum. In the oscillationregion data fluctuation grows from a maximum of 60 max-min difference of gray-scale units to about 160. The readershould notice that the highest value of the curve is actually higher than 28 (the number of gray levels for the originaltomography) because it results from the unbounded application of a mathematical formula. The minimum located aboutthe coordinate 400 µm is pronounced and may be considered an edge by eventual automated identification procedure.
The Gaussian filter (case c, σ = 2 pixels) produces a blurred image. The contours become confused and thecontrast decreases. The bulk of particles becomes more uniform. As a result in the gray-scale signal the edge of theparticle covers a larger range, quantified in about 125 pixels from zero level to the end of the rise identified by thedouble-tangent method. On the other hand, the oscillation region disappears completely.
The sequential combination of Gaussian blur and unsharp mask (case d) is a method that acts as compromisebetween denoising and feature highlighting. Apparently the image is similar to the one produced by the Gaussian blur.Particle bulk appears uniform and edges seem to be blurry. The difference is clear only after the analysis of the gray-scale plot-over-line data. The left-side border of the particle is identified by a rise of about 75 units of the gray-scalevalue, similar to the origial image. Strong difference is observed in the particle bulk where almost uniform profile isobtained and the max-min shift is about 20 units. In this specific case, this image allows better identification than theoriginal one because maintains similar border unsharpness and removes the variations in the oscillation region, whichmay be interpreted as borders of touching particles.
7. Final remarks
An example of microstructure analysis has been shown in this paper. Whereas qualitative interpretation is easy andstraightforward, difficulties arise when the analysis intends to extract quantitative information from the scanned. Theproper identification of the particles becomes the first and most important step, obtaining reliable information on surfaceand volume. In this respect this paper has addressed only one aspect relevant to data quality and improvement methodsof the data set.
The current algorithms developed at the Space Propulsion Laboratory (SPLab-POLIMI) are still experimentaland in most of the cases are manual. The heterogeneous nature of these materials require statistical approaches forproper characterization, requiring high number of samples. In this respect both the processing effort and the introduc-tion of the human factor are limitations that should be targeted by future improvements of the technique.
Acknowledgments
This work is a joint research effort between the Space Propulsion Laboratory (SPLab-POLIMI) and the AdvancedManufacturing Laboratory (AMALA), both part of Politecnico di Milano.
References
[1] N. S. Cohen. A pocket model for aluminum agglomeration in composite propellants. AIAA Journal, 21(5):720–725, 1983.
[2] F. Maggi, L. T. DeLuca, and A. Bandera. Pocket model for aluminum agglomeration based on propellant mi-crostructure. AIAA Journal, 53(11):3395–3403, 2015.
[3] R. K. McGeary. Mechanical packing of spherical particles. Journal of the American Ceramic Society, 44(10):513–522, 1961.
[4] F. Maggi, S. Stafford, and T. L. Jackson. Nature of packs used in propellant modeling. Physical Review E,77(046107):1–17, 2008.
[5] P. Le Breton and D. Ribéreau. Casting process impact on small-scale solid rocket motor ballistic performance.Journal of Propulsion and Power, 18(6):1211–1217, 2002.
[6] F. Maggi, L. T. De Luca, A. Bandera, V. S. Subith, and A. Annovazzi. Burn-rate measurement on small-scalerocket motors. Defence Science Journal, 56(3):353–367, July 2006. DESIDOC 4100 5223 PUB.
12
DOI: 10.13009/EUCASS2019-706

FEATURE EXTRACTION FROM MICRO-TOMOGRAPHY ANALYSIS OF SOLID PROPELLANTS
[7] X. Wang, J. Buckmaster, and T. L. Jackson. Burning of ammonium perchlorate ellipses and spheroids in fuelbinder. Journal of Propulsion and Power, 22(4):764–768, 2006.
[8] S. R. Stock. X-ray computed tomography. In E. N. Kaufmann, editor, Characterization of Materials, pages1624–1641. John Wiley & Sons, 2012.
[9] S. Gallier. Microstructure of composite propellants using simulated packings and x-ray tomography. Journal ofPropulsion and Power, 24(1):154–157, 2008.
[10] B. Collins, F. Maggi, K. Matous, T. L. Jackson, and J. Buckmaster. Using tomography to characterize heteroge-neous propellants. AIAA paper, 2008-941, 2008.
[11] F. Maggi and P. Garg. Fragmentation of ammonium nitrate particles under thermal cycling. Propellants, Explo-sives, Pyrotechnics, 43:315–319, 2018.
[12] L. W. Goldman. Principles of CT: Radiation dose and image quality. Journal of Nuclear Medicine Technology,35(4):213–225, dec 2007.
[13] S. Schlüter, A. Sheppard, K. Brown, and D. Wildenschild. Image processing of multiphase images obtained viaX-ray microtomography: a review. Water Resources Research, 50(4):3615–3639, 2014.
[14] Ning R., X. Tang, and D. Conover. X-ray scatter correction algorithm for cone beam CT imaging. MedicalPhysics, 31(5):1195–1202, apr 2004.
[15] R.S. Maia, C. Jacob, A.K. Hara, A.C. Silva, W. Pavlicek, and M.J. Ross. An algorithm for noise correction of dual-energy computed tomography material density images. International Journal of Computer Assisted Radiologyand Surgery, 10(1):87–100, may 2014.
[16] M. Al-Frejat and M. HjoujBtoush. A new approach for enhancing the quality of medical computerized tomogra-phy images. International Journal of Advanced Computer Science and Applications, 7(5), 2016.
[17] Bu¨lent Sankur. Survey over image thresholding techniques and quantitative performance evaluation. Journal ofElectronic Imaging, 13(1):146, jan 2004.
[18] T. R. Latharani, M. Z. Kurian, and M. V. Chidananda Murthy. Various object recognition techniques for computervision. Journal of Analysis and Computation, 7(1):39–47, 2011.
[19] P. J. Barrett. The shape of rock particles, a critical review. Sedimentology, 27(3):291–303, 1980.
[20] M. Bartscher, U. Neuschaefer-Rube, J. Illemann, F. Borges de Oliveira, A. Stolfi, and S. Carmignato. Qualificationand testing of CT systems. In S. Carmignato, W. Dewulf, and R. Leach, editors, Industrial X-Ray ComputedTomography, chapter 6, pages 185–228. Springer International Publishing, 2018.
[21] G. Moroni and S. Petrò. A discussion on performance verification of 3D X-ray computed tomography systems.Procedia CIRP, 75:125–130, 2018.
[22] C. Martinez-Ortiz. 2D and 3D Shape Descriptors. PhD thesis, University of Exeter, 2010.
[23] R. Jain, R. Kasturi, and B. G. Schnuck. Machine Vision. McGraw-Hill, 1995.
13
DOI: 10.13009/EUCASS2019-706