Feasibility Study to Substitute the EER with the SEER … shows that an inverter air conditioner...
6
Abstract—The objectives of this project are to find out whether the Seasonal Energy Efficiency Ratio (SEER) is more suitable for Thailand than the EER and to compare the energy saving between a fixed speed and an inverter air conditioners. First, both kinds of air conditioners are tested under the Japan Standard (JIS C 9612:2005) and installed in two virtual houses which are identical for data collection (i.e. electric energy consumption and etc). Air conditioners are operated during 8:00 A.M.-12:00 P.M. and 13:00-17:00 P.M. While the ENERGYPLUS program is used for simulation, both results are verified. Using Chiang Mai weather data, the EnergyPlus program is used to analyze a virtual house with the design cooling load of 3,500 Watt at 35ºC outdoor temperature. The result shows that the air conditioner will start operate at 22ºC outdoor temperature and the electric energy consumption is close to the result from the Bin method, used in JIS C 9612:2005. For simplicity, the authors would recommend to use the Bin method for calculating the SEER. For an inverter air conditioner, the SEER value is 13.96 with the EER of 11.38. For a fixed speed air conditioner, the SEER is 11.84 with the EER of 11.59. This study shows that an inverter air conditioner saves 15.38% more energy consumption than a fixed speed air conditioner for Chiang Mai, Thailand. Index Terms— SEER, Inverter AC, Inverter Saving I. INTRODUCTION urrently, the performance rating of an air conditioner in Thailand is tested according to the TIS 1155-2536 standard [1]. The Energy Efficiency Ratio (EER) at the standard rating conditions is mandatory to be labeled on the name plate of all air conditioners. The EER is point ambient temperature (35 o C) performance rating, but in reality, the ambient temperature varies from hour to hour. Therefore, calculating yearly electric energy consumption from EER is not accurate enough. Alternatively, following many countries such as the United State of American, Japan, and Korea, the Seasonal Energy Efficiency Ratio (SEER) can be used to rate the performance of an air conditioner and Manuscript received June 20, 2012. This work was partly supported by the Department of Alternative Energy Development and Efficiency, Thailand C. Tantakitti is with Chiang Mai University, Chiang Mai 50200, THAILAND (phone: 66-81-8818039; fax: 66-53-251512; e-mail: ctantakitti@ hotmail.co.th). T. Rungpairojcharoen NaruemonTontanasarn, and Suwanun Kaewjino were the undergraduate student in the Department of Mechanical Engineering,, Faculty of Engineering, Chiang Mai University, Chiang Mai 50200, THAILAND. to obtain yearly electric consumption. Nowadays, the variable refrigerant flow (VRF) air conditioner such as an inverter compressor and a digital scroll compressor are widely used in an air conditioner as they consume less energy than a fixed speed compressor. Due to higher cost, in 2011 the VRF air conditioner shares only 6 % of the whole market in Thailand. To rate this type of air conditioner, the AHRI standard 210/240 standard [2] is applied in the United State of American and JIS C9612:2005[3] in Japan. Both standards have different testing conditions; i.e. Refer to [2], 5-points testing conditions (2 points at the maximum speed, 1 point at the middle speed, and 2 points at the lowest speed) are applied, while [3] uses 2-points testing conditions (1 point at rated speed and another at the middle rated cooling speed). After the testing results are obtained, the performance curve of an air conditioner can be created and used to calculate the SEER by the Bin method. Korea, Vietnam, and Republic of China have their own testing standards and use the same testing conditions as Japan. With the aim to improve the standard procedure specifically for Thailand, the Department of Alternative Energy Development and Efficiency (DEDE) has funded this project to study the suitable testing method for rating both VRF and fixed speed air conditioners by using SEER and the potential energy-saving of an inverter air conditioner as compared with a fixed speed one. II. STUDY PROCESS Each type of air conditioner is installed in each identical house. The measurement of energy consumption of an air conditioner is used to verify with the output of EnergyPlus program [4] until they are close together so that it can be concluded that the results from this program are valid. After that, this program is simulated with typical Chiang Mai weather year from TRANSYS program [5]. Yearly cooling load and energy consumption are compared with the output from the Bin method as stated in JIS C9612:2005 [3]. If both results agree with each other within an acceptable range, the Bin method, which is simple and easy to calculate, will be recommended for further calculations. A. Experiment Setup Two identical 2.85 x 2.85 x 2.85 m 3 virtual houses, as shown in Fig. 1, were built on the rooftop of an eight-story building. A 3.565 kW fixed speed and a 3.283 kW inverter air conditioners are tested under JIS C9612:2005 [3] and installed in each house. Feasibility Study to Substitute the EER with the SEER – Case Study Chiang Mai, Thailand Chutchawan Tantakitti , Thutchai Rungpairojcharoen, NaruemonTontanasarn, and Suwanun Kaewjino C Proceedings of the World Congress on Engineering and Computer Science 2012 Vol II WCECS 2012, October 24-26, 2012, San Francisco, USA ISBN: 978-988-19252-4-4 ISSN: 2078-0958 (Print); ISSN: 2078-0966 (Online) WCECS 2012
Transcript of Feasibility Study to Substitute the EER with the SEER … shows that an inverter air conditioner...
Abstract—The objectives of this project are to find out whether
the Seasonal Energy Efficiency Ratio (SEER) is more suitable
for Thailand than the EER and to compare the energy saving
between a fixed speed and an inverter air conditioners. First,
both kinds of air conditioners are tested under the Japan
Standard (JIS C 9612:2005) and installed in two virtual houses
which are identical for data collection (i.e. electric energy
consumption and etc). Air conditioners are operated during
8:00 A.M.-12:00 P.M. and 13:00-17:00 P.M. While the
ENERGYPLUS program is used for simulation, both results
are verified.
Using Chiang Mai weather data, the EnergyPlus program
is used to analyze a virtual house with the design cooling load of
3,500 Watt at 35ºC outdoor temperature. The result shows that
the air conditioner will start operate at 22ºC outdoor
temperature and the electric energy consumption is close to the
result from the Bin method, used in JIS C 9612:2005. For
simplicity, the authors would recommend to use the Bin method
for calculating the SEER. For an inverter air conditioner, the
SEER value is 13.96 with the EER of 11.38. For a fixed speed
air conditioner, the SEER is 11.84 with the EER of 11.59. This
study shows that an inverter air conditioner saves 15.38% more
energy consumption than a fixed speed air conditioner for
Chiang Mai, Thailand.
Index Terms— SEER, Inverter AC, Inverter Saving
I. INTRODUCTION
urrently, the performance rating of an air conditioner in
Thailand is tested according to the TIS 1155-2536
standard [1]. The Energy Efficiency Ratio (EER) at the
standard rating conditions is mandatory to be labeled on the
name plate of all air conditioners. The EER is point
ambient temperature (35oC) performance rating, but in
reality, the ambient temperature varies from hour to hour.
Therefore, calculating yearly electric energy consumption
from EER is not accurate enough. Alternatively, following
many countries such as the United State of American, Japan,
and Korea, the Seasonal Energy Efficiency Ratio (SEER)
can be used to rate the performance of an air conditioner and
Manuscript received June 20, 2012. This work was partly supported
by the Department of Alternative Energy Development and Efficiency,
Thailand
C. Tantakitti is with Chiang Mai University, Chiang Mai 50200,
THAILAND (phone: 66-81-8818039; fax: 66-53-251512; e-mail:
ctantakitti@ hotmail.co.th).
T. Rungpairojcharoen NaruemonTontanasarn, and Suwanun Kaewjino
were the undergraduate student in the Department of Mechanical
Engineering,, Faculty of Engineering, Chiang Mai University, Chiang Mai
50200, THAILAND.
to obtain yearly electric consumption.
Nowadays, the variable refrigerant flow (VRF) air
conditioner such as an inverter compressor and a digital
scroll compressor are widely used in an air conditioner as
they consume less energy than a fixed speed compressor.
Due to higher cost, in 2011 the VRF air conditioner shares
only 6 % of the whole market in Thailand. To rate this type
of air conditioner, the AHRI standard 210/240 standard [2]
is applied in the United State of American and JIS
C9612:2005[3] in Japan. Both standards have different
testing conditions; i.e. Refer to [2], 5-points testing
conditions (2 points at the maximum speed, 1 point at the
middle speed, and 2 points at the lowest speed) are applied,
while [3] uses 2-points testing conditions (1 point at rated
speed and another at the middle rated cooling speed). After
the testing results are obtained, the performance curve of an
air conditioner can be created and used to calculate the
SEER by the Bin method. Korea, Vietnam, and Republic of
China have their own testing standards and use the same
testing conditions as Japan.
With the aim to improve the standard procedure
specifically for Thailand, the Department of Alternative
Energy Development and Efficiency (DEDE) has funded
this project to study the suitable testing method for rating
both VRF and fixed speed air conditioners by using SEER
and the potential energy-saving of an inverter air conditioner
as compared with a fixed speed one.
II. STUDY PROCESS
Each type of air conditioner is installed in each identical
house. The measurement of energy consumption of an air
conditioner is used to verify with the output of EnergyPlus
program [4] until they are close together so that it can be
concluded that the results from this program are valid. After
that, this program is simulated with typical Chiang Mai
weather year from TRANSYS program [5]. Yearly cooling
load and energy consumption are compared with the output
from the Bin method as stated in JIS C9612:2005 [3]. If both
results agree with each other within an acceptable range, the
Bin method, which is simple and easy to calculate, will be
recommended for further calculations.
A. Experiment Setup
Two identical 2.85 x 2.85 x 2.85 m3 virtual houses, as
shown in Fig. 1, were built on the rooftop of an eight-story
building. A 3.565 kW fixed speed and a 3.283 kW inverter
air conditioners are tested under JIS C9612:2005 [3] and
installed in each house.
Feasibility Study to Substitute the EER with the
SEER – Case Study Chiang Mai, Thailand
Chutchawan Tantakitti , Thutchai Rungpairojcharoen, NaruemonTontanasarn, and Suwanun
Kaewjino
C
Proceedings of the World Congress on Engineering and Computer Science 2012 Vol II WCECS 2012, October 24-26, 2012, San Francisco, USA
ISBN: 978-988-19252-4-4 ISSN: 2078-0958 (Print); ISSN: 2078-0966 (Online)
WCECS 2012

Fig. 1. Two virtual houses
The indoor temperature, outdoor temperatures, solar
intensity, wind speed, and electric consumption are recorded
every 5 minutes during 8:00 A.M. – 12.00 P.M. and 13:00 –
17:00 P.M. Four cases of additional internal lighting load
are set due to low outdoor temperature (less than 20oC). The
response of an air conditioner is studied as follows:
Case 1. – No addition internal lighting load from
November 18 – 21, 2010.
Case 2. – Addition internal lighting load of 1,000 W.
from November 22 – 25, 2010.
Case 3. – Addition internal lighting load of 2,000 W.
from November 26 – 29, 2010.
Case 4. – Addition internal lighting load of 3,000 W.
from January 6 – 8, 2011.
The EnergyPlus program [4] is used to simulate the two
virtual houses; the energy consumption of the air
conditioners obtained from the program is verified by
comparing the value with the measured data.
B. Simulation Program Setup
The inputs for the EnergyPlus program [4] are a typical
4 x 4 x 3 m3 room, 3,500 W. cooling load at Thailand’s
Design Day, the cooling performance of each air
conditioner, and a typical hourly Chiang Mai weather for a
year from TRNSYS [5]. Yearly cooling load and electric
consumption of each air conditioner are the outputs.
TABLE I
BIN TEMPERATURE FOR CHIANGMAI
Temp.
(°C)
NO.
OF
hours
Temp.
(°C)
No.
Of
hours
12 3 26 236
13 3 27 277
14 6 28 304
15 16 29 316
16 18 30 316
17 25 31 238
18 31 32 156
19 34 33 127
20 54 34 105
21 56 35 51
22 59 36 29
23 87 37 14
24 132 38 18
25 202 39 7
C. Bin Method
A typical Chiang Mai weather data from 8:00 A.M. –
12:00 P.M. and 13:00 – 17:00 PM. for one year from
TRANSYS program is binned with a bin size of 1oC. The
result is shown in Table I.
III. RESULTS AND DISCUSSION
A. Air conditioners Cooling Performance
Both air conditioners are tested with the Calorimeter Air
Enthalpy room under the JIS C9612:2005 [3], the results of
the cooling load versus the outdoor temperature are shown
in Fig. 2. The EER is 11.59 and 11.38 for a fixed speed and
an inverter air conditioner respectively.
Fig. 2. Cooling capacity curves.
The relationships between the cooling capacity at 29oC
( ) and 35oC ( ) at a rated speed and the middle
cooling speed for an inverter air conditioner are shown in
(1) and (2) respectively. Equation 3 corresponds to a fixed
speed air conditioner.
For an inverter at rated speed,
= 1.037 (1)
For an inverter at the middle cooling speed,
) = 1.031 (2)
For a fixed speed,
) = 1.046 (3)
In Japan, Korea, Vietnam, and Republic of China,
Equation (4) is used for all types of air conditioner.
) = 1.077 (4)
By comparing the cooling performance curves of Thai’s
design (1), (2), and (3) with Japan’s design (4), the air
Proceedings of the World Congress on Engineering and Computer Science 2012 Vol II WCECS 2012, October 24-26, 2012, San Francisco, USA
ISBN: 978-988-19252-4-4 ISSN: 2078-0958 (Print); ISSN: 2078-0966 (Online)
WCECS 2012

conditioner in Thailand produces less cooling than the Japan
air conditioner when the outdoor temperature decreases.
Moreover, the energy consumption (Pc) at two different
outdoor temperature is shown in Fig. 3. The relationships
between energy consumptions can be represented by the (5),
(6), and (7).
Fig. 3. Energy consumption curves.
For an inverter at rated speed,
Pc(29) = 0.888Pc (5)
For an inverter at the middle cooling speed,
Pc(29) = 0.877Pc (6)
For a fixed speed,
Pc(29) = 0.909Pc (7)
For Japan, Korea, Vietnam and Republic of China,
Equation (8) is applied for all types of the air conditioners.
Pc(29) = 0.914Pc (8)
By comparing the energy consumption curves of Thai’s
design (5), (6), and (7) with Japan’s design (8); the air
conditioner in Thailand consumes less energy than the Japan
air conditioner when the outdoor temperature decreases.
Similarly, Figure 4 compares the EER of the air
conditioners at two different outdoor temperatures.
Fig. 4. Energy consumption curves.
B. Energy consumption of the air conditioners.
The energy consumption of each air conditioner and
different internal light loads, as stated in Section II.B, are
averaged with the same time interval. The results are plotted
in Fig. 5, 6, 7, and 8.
Fig. 5. Energy consumption over time when there is no internal light load.
Fig. 6. Energy consumption over time when 1 kW internal light load is
applied.
Proceedings of the World Congress on Engineering and Computer Science 2012 Vol II WCECS 2012, October 24-26, 2012, San Francisco, USA
ISBN: 978-988-19252-4-4 ISSN: 2078-0958 (Print); ISSN: 2078-0966 (Online)
WCECS 2012

Fig. 7. Energy consumption over time when 2 kW internal light load is
applied.
Fig. 8. Energy consumption over time when 3 kW internal light load is
applied.
From Fig. 5-8, it can be concluded that if the cooling load
is less than the minimum speed of the inverter type, both
types are in the ON-OFF mode; therefore, both consume
almost the same amount of energy. When the cooling load is
between minimum speed and rated speed, the inverter type
shows some energy saving as shown in Fig. 5-7. When the
cooling load is greater than the rated cooling, the inverter
type consumes more energy than the fixed speed air
conditioner because this inverter type can increase the speed
more than the rated speed as shown in Figure 8, from 13:00
to 17:00 P.M. Table II shows the saving percentage for each
internal lighting loading conditions.
TABLE II
SAVING PERCENTAGE FOR EACH INTERNAL LIGHTING LOADING
CONDITION
Internal lighting
load
Energy consumption Saving
(W-hr)
(W) Inverter Fix speed (%)
0 1204 1435 16.12%
1000 2086 3363 37.98%
2000 4274 4967 13.95%
3000 6316 6243 -1.17%
C. Results from EnergyPlus Program
When all details in Section II.B are input into the
EnergyPlus program [4], the energy consumption output is
compared with the measurements from the air conditioners
as shown in Table III. It is found that large discrepancy
between the program output and the measurements from the
air conditioner occurs when the cooling load is less than the
middle cooling rated (1750 W) for the inverter type. This is
because, for the inverter one, the actual minimum speed is
far less than the middle cooling speed; keeping the inverter
type in the operating state. Contradictory, in the program,
the inverter acts as a fixed speed air conditioner (ON-OFF
mode), therefore, the energy consumption from the program
will be higher than the real measurement. If the cooling load
is above the middle cooling, both results are similar at 2000
and 3000 W internal lighting load.
TABLE III
COMPARISONS OF ENERGY CONSUMPTION OBTAINED FROM
ENERGYPLUS PROGRAM AND REAL MEASUREMENTS
Date
Energy consumption
(W-hr)
Fixed Speed Inverter
Program Measurement Program Measurement
1000 W
3162.291 3264.217 2751.316 2010.278 on
11/25/2011
Error (%) -3.123
36.862
2000 W
5086.608 4959.835 4404.89 4240.155 on
11/26/2011
Error (%) 2.556
3.885
3000 W
6550.359 6227.829 6478.514 6300.143 on
11/26/2011
Error (%) 5.179 2.831
To reduce the error, the inverter air conditioner should be
tested at minimum and maximum speeds at the AHRI
standard 210/240 [2]. These results can then be used as the
inputs into the TRNSYS program [5].
D. Results from the EnergyPlus Program and Bin
Method
The details of house, performance of both air conditioners
under JIS C9612:2005 and typical Chiang Mai weather data
are put into the EnergyPlus program [4] and simulated
during 8:00 A.M. – 12:00 P.M. and 13:00 – 17:00 P.M.,
excluding weekends. The results are discussed separately as
follow,
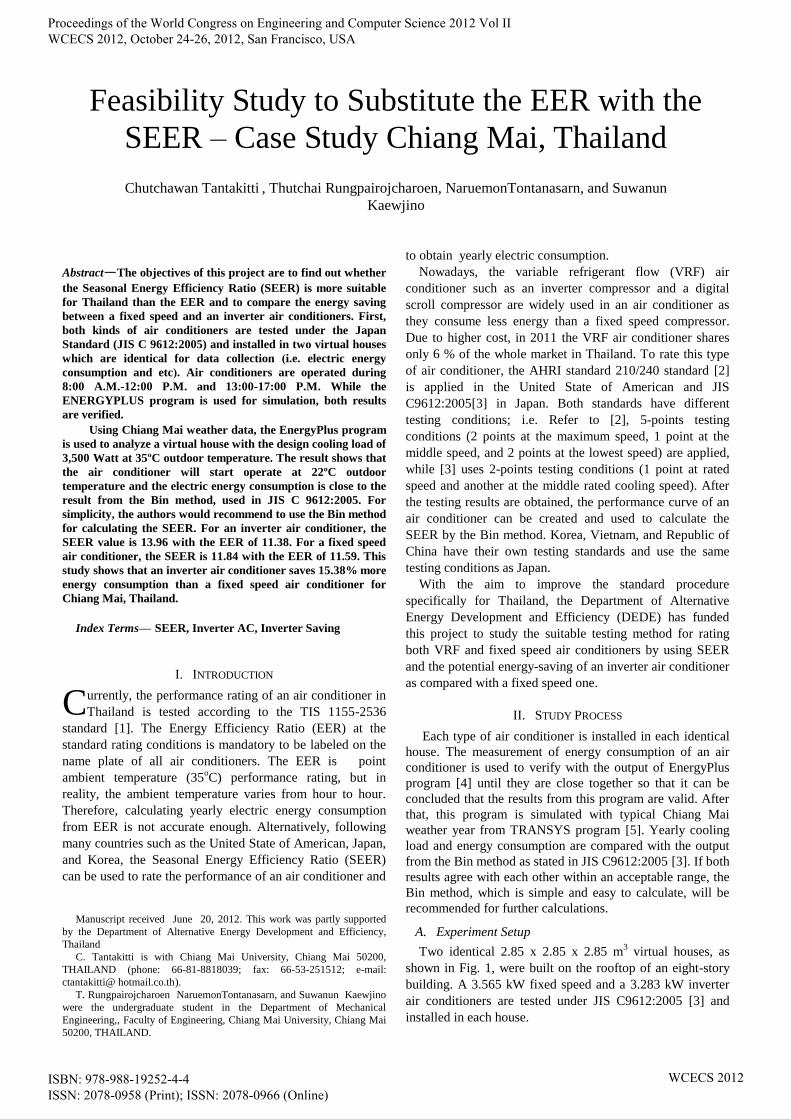
Building cooling load
According to the program, it is found that this house has
no cooling load at 21oC outdoor temperature which is
different from [3] which uses 23oC. Fig. 9 shows the
building load curve.
Bin method calculation
Using the binned weather data and the building load as
shown in Fig. 9, the performance of a fixed speed and an
inverter air conditioner are calculated. The results are
compared in Table IV.
Proceedings of the World Congress on Engineering and Computer Science 2012 Vol II WCECS 2012, October 24-26, 2012, San Francisco, USA
ISBN: 978-988-19252-4-4 ISSN: 2078-0958 (Print); ISSN: 2078-0966 (Online)
WCECS 2012
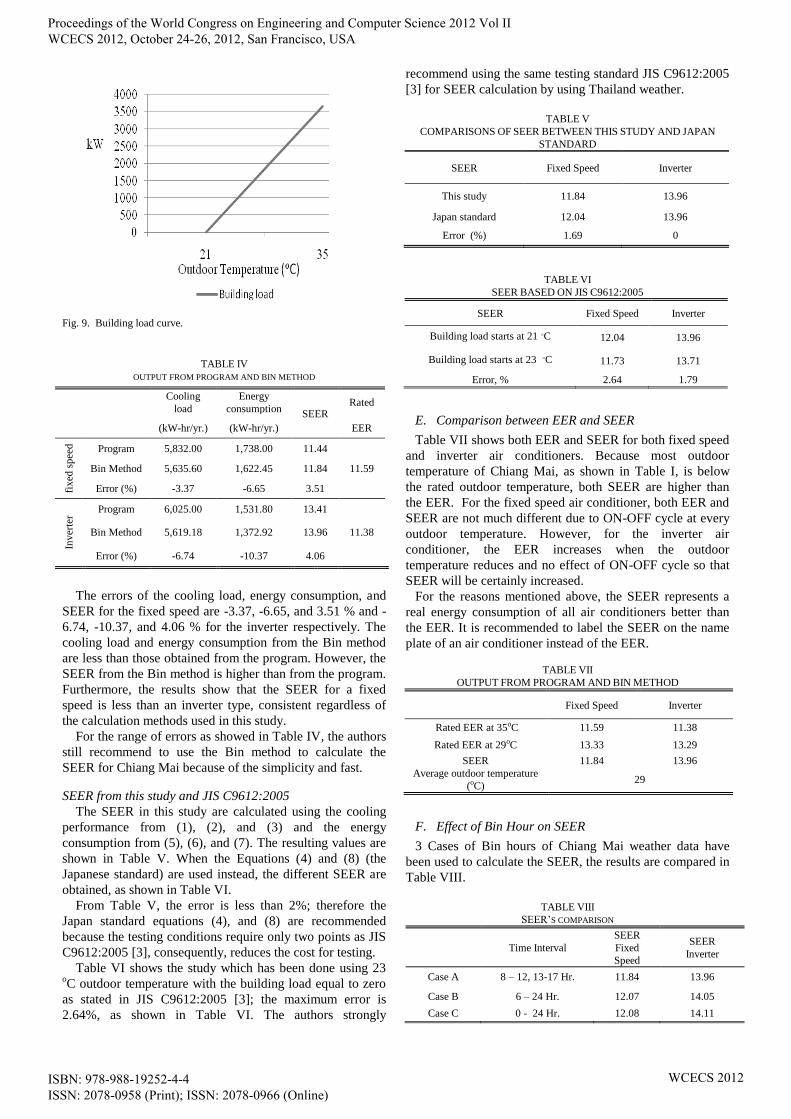
Fig. 9. Building load curve.
TABLE IV
OUTPUT FROM PROGRAM AND BIN METHOD
The errors of the cooling load, energy consumption, and
SEER for the fixed speed are -3.37, -6.65, and 3.51 % and -
6.74, -10.37, and 4.06 % for the inverter respectively. The
cooling load and energy consumption from the Bin method
are less than those obtained from the program. However, the
SEER from the Bin method is higher than from the program.
Furthermore, the results show that the SEER for a fixed
speed is less than an inverter type, consistent regardless of
the calculation methods used in this study.
For the range of errors as showed in Table IV, the authors
still recommend to use the Bin method to calculate the
SEER for Chiang Mai because of the simplicity and fast.
SEER from this study and JIS C9612:2005
The SEER in this study are calculated using the cooling
performance from (1), (2), and (3) and the energy
consumption from (5), (6), and (7). The resulting values are
shown in Table V. When the Equations (4) and (8) (the
Japanese standard) are used instead, the different SEER are
obtained, as shown in Table VI.
From Table V, the error is less than 2%; therefore the
Japan standard equations (4), and (8) are recommended
because the testing conditions require only two points as JIS
C9612:2005 [3], consequently, reduces the cost for testing.
Table VI shows the study which has been done using 23
oC outdoor temperature with the building load equal to zero
as stated in JIS C9612:2005 [3]; the maximum error is
2.64%, as shown in Table VI. The authors strongly
recommend using the same testing standard JIS C9612:2005
[3] for SEER calculation by using Thailand weather.
TABLE V
COMPARISONS OF SEER BETWEEN THIS STUDY AND JAPAN
STANDARD
SEER Fixed Speed Inverter
This study 11.84 13.96
Japan standard 12.04 13.96
Error (%) 1.69 0
TABLE VI
SEER BASED ON JIS C9612:2005
SEER Fixed Speed Inverter
Building load starts at 21 ๐C 12.04 13.96
Building load starts at 23 ๐C 11.73 13.71
Error, % 2.64 1.79
E. Comparison between EER and SEER
Table VII shows both EER and SEER for both fixed speed
and inverter air conditioners. Because most outdoor
temperature of Chiang Mai, as shown in Table I, is below
the rated outdoor temperature, both SEER are higher than
the EER. For the fixed speed air conditioner, both EER and
SEER are not much different due to ON-OFF cycle at every
outdoor temperature. However, for the inverter air
conditioner, the EER increases when the outdoor
temperature reduces and no effect of ON-OFF cycle so that
SEER will be certainly increased. For the reasons mentioned above, the SEER represents a
real energy consumption of all air conditioners better than
the EER. It is recommended to label the SEER on the name
plate of an air conditioner instead of the EER.
TABLE VII
OUTPUT FROM PROGRAM AND BIN METHOD
Fixed Speed Inverter
Rated EER at 35oC 11.59 11.38
Rated EER at 29oC 13.33 13.29
SEER 11.84 13.96
Average outdoor temperature
(oC) 29
F. Effect of Bin Hour on SEER
3 Cases of Bin hours of Chiang Mai weather data have
been used to calculate the SEER, the results are compared in
Table VIII.
TABLE VIII
SEER’S COMPARISON
Time Interval
SEER
Fixed
Speed
SEER
Inverter
Case A 8 – 12, 13-17 Hr. 11.84 13.96
Case B 6 – 24 Hr. 12.07 14.05
Case C 0 - 24 Hr. 12.08 14.11
Cooling
load
Energy
consumption SEER
Rated
(kW-hr/yr.) (kW-hr/yr.) EER
fix
ed s
pee
d
Program 5,832.00 1,738.00 11.44
Bin Method 5,635.60 1,622.45 11.84 11.59
Error (%) -3.37 -6.65 3.51
Inv
erte
r
Program 6,025.00 1,531.80 13.41
Bin Method 5,619.18 1,372.92 13.96 11.38
Error (%) -6.74 -10.37 4.06
Proceedings of the World Congress on Engineering and Computer Science 2012 Vol II WCECS 2012, October 24-26, 2012, San Francisco, USA
ISBN: 978-988-19252-4-4 ISSN: 2078-0958 (Print); ISSN: 2078-0966 (Online)
WCECS 2012

It is found that for Case A, average outdoor temperature is
the highest, so the SEER is the lowest. For a Case B,
average temperature is between Case A and C so the SEER
is in between. For all cases, the SEERs are not much
different. So, the Bin hours from Case B method which is
reasonable represented average day temperature should be
used to calculate yearly Bin hours for Thailand.
If looking at the energy consumption from Table IX, the
energy consumption will be increased as the Bin hour is
increased. To account for both outdoor temperature and Bin
hour, the author is recommended to use Case B to represent
the method to calculate the SEER for Chiang Mai. So for
Chiang Mai, the inverter air conditioner can save at least
15.38 % of energy consumption as compared with a fixed
speed air conditioner.
TABLE IX
ENERGY CONSUMPTION FOR 3 CASES
Time Interval
Energy Consumption
(kW-hr) Saving
(%) Fixed
Speed
Inverter
Case A 8 – 12, 13-17
Hr. 1,622.45 1,372.92 15.38
Case B 6 – 24 Hr. 2,623.40 2,096.65 20.07
Case C 0 - 24 Hr. 2,718.31 2,162.70 20.44
IV. CONCLUSION
From this study, both EER and SEER increase when the
outdoor temperature decreases. The inverter air conditioner
achieves more than 15.38% energy saving than the fixed
speed one. The authors strongly recommend that the SEER,
which depends on seasonal weather data, should be used to
label on all types of air conditioners in Thailand instead of
the EER which is limited only to one fixed point weather
data. Moreover, all types of air conditioners in Thailand
should follow the testing standard JIS C9612:2005 and use a
typical weather from 6 to 24 Hr. throughout a year in
Thailand to calculate the SEER by the Bin method.
ACKNOWLEDGMENT
This paper is a part of senior project which is supported
by The Energy Conservation Fund and Faculty of
Engineering, Chiang Mai University, Chiang Mai 50200
Thailand. The authors would like to thank all parties
involved in the project.
REFERENCES
[1] Split Type, Air-cool Room Air conditioning Industrial Standard,
TIS1155-2536.
[2] Standard for Performance Rating of Unitary Air conditioning & Air-
Source Heat Pump Equipment, AHRI standard 210/240, 2008.
[3] Room Air Conditions, JIS C9612:2005.
[4] EnergyPlus Energy Simulation Program Version 7.1.0, Energy
Efficiency &Renewable Energy, Department of Energy, USA
[5] TRNSYS, Transient Simulation Program Version 17, 22 N Carroll
St, Suite 370, Madison, WI 53703, USA.
Proceedings of the World Congress on Engineering and Computer Science 2012 Vol II WCECS 2012, October 24-26, 2012, San Francisco, USA
ISBN: 978-988-19252-4-4 ISSN: 2078-0958 (Print); ISSN: 2078-0966 (Online)
WCECS 2012