Feasibility Study project for GCF/CTCN (FY2016) CTCN ... · 1 List of abbreviations AGC ASAHI GLASS...
117
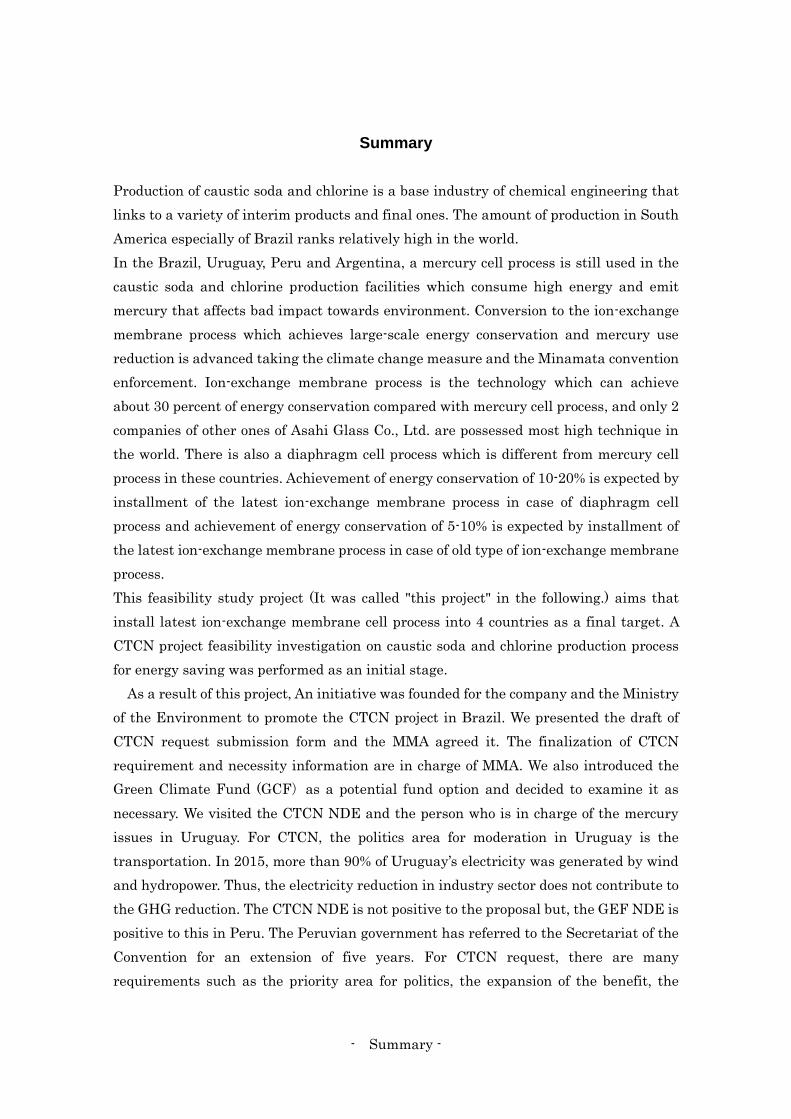
Feasibility Study project for GCF/CTCN (FY2016) CTCN project feasibility study for the introduction of energy saving technology in South American caustic soda • chlorine manufacturing process Report Disclosure version March, 2017 ASAHI GLASS CO., LTD.
Transcript of Feasibility Study project for GCF/CTCN (FY2016) CTCN ... · 1 List of abbreviations AGC ASAHI GLASS...

Feasibility Study project for GCF/CTCN (FY2016)
CTCN project feasibility study for the introduction of
energy saving technology in South American caustic soda •
chlorine manufacturing process
Report
Disclosure version
March, 2017
ASAHI GLASS CO., LTD.
- Summary -
Summary
Production of caustic soda and chlorine is a base industry of chemical engineering that
links to a variety of interim products and final ones. The amount of production in South
America especially of Brazil ranks relatively high in the world.
In the Brazil, Uruguay, Peru and Argentina, a mercury cell process is still used in the
caustic soda and chlorine production facilities which consume high energy and emit
mercury that affects bad impact towards environment. Conversion to the ion-exchange
membrane process which achieves large-scale energy conservation and mercury use
reduction is advanced taking the climate change measure and the Minamata convention
enforcement. Ion-exchange membrane process is the technology which can achieve
about 30 percent of energy conservation compared with mercury cell process, and only 2
companies of other ones of Asahi Glass Co., Ltd. are possessed most high technique in
the world. There is also a diaphragm cell process which is different from mercury cell
process in these countries. Achievement of energy conservation of 10-20% is expected by
installment of the latest ion-exchange membrane process in case of diaphragm cell
process and achievement of energy conservation of 5-10% is expected by installment of
the latest ion-exchange membrane process in case of old type of ion-exchange membrane
process.
This feasibility study project (It was called "this project" in the following.) aims that
install latest ion-exchange membrane cell process into 4 countries as a final target. A
CTCN project feasibility investigation on caustic soda and chlorine production process
for energy saving was performed as an initial stage.
As a result of this project, An initiative was founded for the company and the Ministry
of the Environment to promote the CTCN project in Brazil. We presented the draft of
CTCN request submission form and the MMA agreed it. The finalization of CTCN
requirement and necessity information are in charge of MMA. We also introduced the
Green Climate Fund (GCF)as a potential fund option and decided to examine it as
necessary. We visited the CTCN NDE and the person who is in charge of the mercury
issues in Uruguay. For CTCN, the politics area for moderation in Uruguay is the
transportation. In 2015, more than 90% of Uruguay’s electricity was generated by wind
and hydropower. Thus, the electricity reduction in industry sector does not contribute to
the GHG reduction. The CTCN NDE is not positive to the proposal but, the GEF NDE is
positive to this in Peru. The Peruvian government has referred to the Secretariat of the
Convention for an extension of five years. For CTCN request, there are many
requirements such as the priority area for politics, the expansion of the benefit, the

- Summary -
participation of related and the GHG reduction effect in Argentine.
Furthermore, Ion-exchange membrane technology and CTCN was presented in
CloroSur technical seminar X at Buenos Aires during 16th to 18th November, 2016.
Simple energy conservation diagnosis by a data collection with Chlor- Alkali producers
and energy conservation effect expectation and expectation of mercury usage reduction
etc. were carried out. It was also clarified the issue of utilization of CTCN through this
project.

- Index -
Index
Chapter 1 General Information of Each Country ............................................................... 1
1.1 Brazil ............................................................................................................................ 1
1.1.1 Economic Overview .............................................................................................. 1
1.1.2 Energy saving policies, carbon management by industry ................................. 1
1.1.3 Policies related to mercury management ........................................................... 2
1.2 Uruguay ....................................................................................................................... 3
1.2.1 Economic Overview .............................................................................................. 3
1.2.2 Energy saving policies, carbon management by industry ................................. 3
1.2.3 Policies related to mercury management ........................................................... 4
1.3 Peru .............................................................................................................................. 4
1.3.1 Economic overview ............................................................................................... 4
1.3.2 Energy saving policies, carbon management in industry.................................. 5
1.3.3 Policies related to mercury management ........................................................... 5
1.4 Argentina ..................................................................................................................... 6
1.4.1 Economic Overview .............................................................................................. 6
1.4.2 Energy saving policies, carbon management in industry.................................. 6
1.4.3 Policies related to mercury management ........................................................... 7
Chapter 2 Consensus building with stakes holders ........................................................... 8
2.1 Field survey ............................................................................................................. 8
2.2 Government organization chart and explanation of other parties ....................... 8
2.3 Consensus building with stakes holders in each country .................................... 10
2.3.1 Consensus building with stakes holders in Brazil ...................................... 10
2.3.2 Consensus building with stakes holders in Uruguay ................................... 11
2.3.3 Consensus building with stakes holders in Peru ......................................... 12
2.3.4 Consensus building with stakes holders in Argentina ................................ 14
2.4 Summary .................................................................................................................... 15
Chapter 3 Information exchange with caustic soda/chlorine factories ........................... 16
3.1 Situation of global mercury cell plants ............................................................... 16
3.2 Field survey ........................................................................................................... 17
3.3 Information exchange with caustic soda/chlorine factories in each country .... 18
3.3.1 Information exchange with caustic soda/chlorine factories in Brazil ............. 18
3.3.2 Information exchange with caustic soda/chlorine factories in Uruguay ........ 20
3.3.3 Information exchange with caustic soda/chlorine factories in Peru ............... 22
3.3.4 Information exchange with caustic soda/chlorine factories in Argentina ...... 24

- Index -
3.4 Summary .................................................................................................................... 25
Chapter 4 Simple energy conservation diagnosis by a data collection and energy
conservation effect expectation .......................................................................................... 27
4.1 Electric power unit consumption of caustic soda and chlorine production ........... 27
4.2 Simple energy conservation check by data collection in Brazil ............................. 31
4.3 Simple energy conservation check by data collection in Uruguay ........................ 32
4.4 Simple energy conservation check by data collection in Peru ............................... 33
4.5 Simple energy conservation check by data collection in Argentina ...................... 34
4.6 Summary .................................................................................................................... 34
Chapter 5 Expectation of mercury usage reduction etc. .................................................. 38
Chapter 6 Presentation in Workshop ................................................................................ 55
Chapter 7 Creating draft of CTCN application form ....................................................... 74
7.1 Outline of CTCN application .................................................................................... 74
7.2 Preparing a CTCN Application Form for Brazil ..................................................... 74
7.3 Information gathering on CTCN technical support project at COP 22 ................. 78
7.4 Future support towards CTCN application, etc. ..................................................... 78
Chapter 8 Compilation of the report ................................................................................. 80
8.1 Future Prospects and Schedule ................................................................................ 80
8.2 Challenges to access CTCN as identified through this study ................................ 80
8.3 financing support ...................................................................................................... 81
Appendix .............................................................................................................................. 84
A. List of bibliographic survey source ............................................................................ 85
B. Presentation for stakeholders .................................................................................... 88
C. CTCN Request Submission Draft .............................................................................. 98

1
List of abbreviations
AGC ASAHI GLASS CO., LTD.
BNDES The Brazilian Development Bank
BRICs Brazil, Russia, India, China etc.
CDM Clean Development Mechanism
CEO Chief Executive Officer
CONAMA Conselho Nacional do Meio Ambiente
COP Conference of Parties
CTC Climate Technology Centre
CTCN Climate Technology Centre and Network
EBRD European Bank for Reconstruction and Development
EFCM Emission Factor of Combined Margin
FS Feasibility Study
GCF Green Climate Fund
GDP Gross Domestic Product
GEF Global Environment Facility
GHG Greenhouse gas
IDB Inter-American Development Bank
IGES Institute for Global Environmental Strategies
INDC Intended Nationally Determined Contributions
JBIC Japan Bank for International Cooperation
JCM Joint Crediting Mechanism
JETRO Japan External Trade Organization
MCTI Ministério da Ciência, Tecnologia, Inovações e Comunicações
MINCYT MINISTRY OF SCIENCE, TECHNOLOGY AND PRODUCTIVE
NOVATION
MMA Ministério do Meio Ambiente
MRV Measurement, Reporting and Verification
MVOTMA Ministerio de Vivienda, Ordenamiento Territorial y Medio Ambiente
NAMA Nationally Appropriate Mitigation Actions
NDE National Designated Entity
OECC Overseas Environmental Cooperation Center , Japan
OSPAR
Convention
Convention for the Protection of the Marine Environment of the
North-East Atlantic

2
UNEP United Nations Environment Programme
UNIDO United Nations lndustrial Development Organization
WCC World Chlorine Council

1
Chapter 1 General Information of Each Country
1.1 Brazil
1.1.1 Economic Overview
The population of Brazil is about 207,840,000, and GDP is 1,774,700,000,000 dollars.
GDP per one person is 8,528 dollars (the World Bank and 2015). The main industries
are manufacturing, mining, agriculture (sugar, orange, coffee, soybeans, etc.). It also
has abundant natural resources, in particular the world's largest iron ore exporter.
Main products such as iron ore and soybean boast the world's largest export products,
especially iron ore. In Brazil there is the world's largest Carajas mine (eastern part of
the Amazon River). The reserves of the Carajas mine are said to be comparable to the
demand for iron ore for the next 500 years. Looking at the breakdown of Brazilian
exports, the major products such as iron ore counts only about 30%, and industrial
products dominates the most. In particular, the aircraft industry, which requires
advanced industrial technology, boasts the most competitive technology in the world.
The economy is getting out of a serious and long-term recession. By effective fiscal
adjustment, monetary policy will be further relaxed and support investment recovery.
1.1.2 Energy saving policies, carbon management by industry
Today, the need for alternative energy is rising, facing soaring crude oil prices and
global warming. Brazil is focusing on the ethanol industry, which is drawing attention
as an alternative energy source. In order to cope with the oil shock in 1973, Brazil has
been implementing a pro-alcohol policy since 1975, and it is promoting substituting
ethanol produced from domestic abundant sugar cane into gasoline. Brazil is promoting
the diffusion of ethanol fuel under the national policy against the backdrop of
competitive superiority with high-tech technology, and is now one of the world's leading
energy-advanced countries to produce ethanol. Two-thirds of new cars already sold in
Brazil have become flexible fuel vehicles compatible with ethanol fuel. Bioethanol is
environmentally friendly and its price is cheap, about half of that of gasoline.
Brazil overwhelmingly leads the BRIC’s (Brazil, Russia, India and China etc.) for
renewable energy. In Brazil, hydroelectric power is supporting about 40% of energy
consumption, and more than 80% of Brazilian electricity consumption is already
procured by hydroelectric power generation. Ethanol is also an important energy
source.
Brazil's Intended Nationally Determined Contribution (INDC) has announced that it
will reduce greenhouse gas emissions by 37% by 2025 compared to 2005. Also, it is
stated that the greenhouse gas emissions will be reduced by 43% by the year 2030
2
compared with the 2005 level.
Brazil has proposed to make the proportion of renewable energy in their energy mix of
up to 45% by 2030. Also, by 2030, Brazil aim to raise the share of renewable energy
(other than hydropower = biomass sunlight, wind power) for power generation up to
23%.
1.1.3 Policies related to mercury management
The Minamata Convention on mercury was signed in October 2013 in Kumamoto
Prefecture and will enter into force on the 90th day after 50 countries have ratified it.
Since 38 countries have ratified as of February 28, 2017, it is expected that parties will
soon exceed to 50 countries, the Secretariat of the Convention, the United Nations
Environment Program (UNEP), said on September 24, 2017 that the first meeting of the
Conference of the Parties (COP 1) in Geneva will be held from September 24th to 29th ,
2017.
Brazil is currently deliberating domestic bills at the National Assembly Committee as a
domestic procedure for ratification (February 28, 2017). According to the Ministry of the
Environment of Brazil, it is planned to participate in the COP 1 as a contracting party,
and it is expected that domestic procedures will be completed by then.
In addition to the treaty related law, domestic laws and regulations and ministerial
ordinances are being developed. The main laws are listed below.
· Federal law 9.976
This is a federal law regulating the production of caustic soda and chlorine using
electrolytic cells. It prohibits installation and expansion of electrolytic cell using
domestic mercury method or asbestos diaphragm method. For those who do not comply
with this law, warnings, fines, temporary or permanent suspension of industrial activity
may be considered.
· Regulation 2.436
It is an ordinance prohibiting the establishment or expansion of electrolytic cells using
RI or asbestos diaphragm method in Rio de Janeiro. Regarding technology conversion,
the three years from 2005 to 2008 were set as deadlines. As a result of a hearing
conducted by the state of Rio de Janeiro in November 2006, the ordinance was revised in
order to broaden the scope of application not only to the "chlorine alkali industry" but

3
also to all industrial processes using sodium chloride electrolysis. The amendment has
not been approved yet.
· National Environment Council Resolution 430 (CONAMA Resolution 430)
It is a resolution that revised a part of Resolution No. 357 which CONAMA entered into
in 2005. Establish conditions and standards for sewage and industrial wastewater from
wastewater treatment facilities. Maximum allowable mercury is 0.01 mg Hg / 1. Piracy
is imposed on illegal persons under the law No. 9605 (1998).
· Bill No. 1,031 - Draft Law No. 1.031 (Sao Paulo, 2011)
Prohibit the use of mercury and asbestos diaphragm technology in all industrial
processes, including salt electrolysis. It was approved on February 19, 2014.
1.2 Uruguay
1.2.1 Economic Overview
Uruguay has an area of 176,000 m2 (about half of Japan) and the population is 3.34
million (2015, World Bank). Agriculture and fisheries, manufacturing industry
(especially product processing), service industry are the main industries. Per capita
GDP is $15,720 (2015, World Bank). Major export items are meat, grain, timber and
dairy products and major import items are electrical equipment, mineral resources,
machinery, automobiles etc. (International Trade Center, 2015).
Uruguay's economy also recorded negative growth until 2002, due to the economic crisis
of Brazil and Argentina in the first half of the 2000s. But making use of the lessons
learnt, Uruguay is avoiding excessive dependence on Mercosur, diversifying foreign
economic relations and actively attracting investment. From 2011 to 2014, the economic
growth rate has been changing from 3.2% to 5.2%. (Source of this section: Uruguay basic
data such as Ministry of Foreign Affairs)
1.2.2 Energy saving policies, carbon management by industry
As Uruguay developed an attractive policy to provide accessible funding to secure
investment in renewable energy, Uruguay's domestic and foreign investment in the
energy sector increased nearly 70 times between 2010 and 2014, Uruguay's total clean
energy investment amounted to approximately 1.2 billion dollars in 2014 and ranks
among the top five countries that make the largest investment in renewable energy and
fuel per GDP.
The transport sector is still dependent on oil (which accounts for 45% of the total energy

4
mix). However, the industry centered on agricultural processing is mainly supported by
the biomass cogeneration factory.
By the end of 2015, renewable energy reduced power costs in Uruguay by 44%. The
wind power plant in the country can produce about 65 to 70 cents per kWh, which is half
of the gas generation cost. In 2015, there were 11,050 people in the renewable energy
sector (excluding 6,550 employments in the utility sector). This employment level is 1.5
times that of employment at refineries and employment of natural gas (7,460
employees). In conclusion, the renewable, abundant and diverse energy mix enhances
energy security, reduces energy costs, revitalizes the national industry, creates
employment from clean energy and relieves dependence on oil.
In the past five years Uruguay's energy investment (including not only renewable
energy but also liquid gas) reached $7 billion, reaching 15% of annual GDP. It is five
times the average of South America.
1.2.3 Policies related to mercury management
Uruguay ratified the Minamata Convention on mercury on September 24, 2014. It is the
first ratifying country in South America, becoming the sixth party in the world.
Uruguay's chlorine alkali operator Efice S.A. is cooperating with the Uruguay
Environment Bureau’s pilot study on mercury waste management technology.
1.3 Peru
1.3.1 Economic overview
Peru's industry is primarily primary industry (agriculture, fish, mining). Mining
produces gold, silver, copper, zinc and others. The manufacturing industry also has a
large share of major products.
In 2009 after the Lehman shock, Peru maintained positive growth, with the economic
growth rate of 2002-11 averaging 6.4%, the highest level in South America. This had a
major impact on foreign direct investment in the mining sector. The mining export
amount which accounted for 65% of the total mining export value in December 2013 was
$2.251 billion. The manufacturing industry achieved an annual growth rate of 10%
between 2008 and 2012.
The energy consumption of industrial sector in 2014 is 159,000 TJ which is equivalent
to 26% of total consumption. Together with the steel sub-sector, 29% of them were
consumed.

5
1.3.2 Energy saving policies, carbon management in industry
Peru's electrification rate at the national level is 83.55% (6,394,049 households).
Nonetheless, this is one of the lowest rural electrification rates in South America, as
38.32% (979,476 households) of the rural population (about 4 million people) can’t
access electricity. Electricity is generated by thermal power generation and hydropower
(44%) using gas or petroleum (56%), and the share of renewable energy sources other
than hydropower is negligible. In spite of the fact that the installed capacity is evenly
divided between the hydropower generation and the conventional thermal energy,
62.9% of the total Peru generation amount is generally from the hydroelectric power
plant.
Presently, Peru has one energy efficiency program with seven concrete measures for the
commercial and industrial sectors. In Peru there is a support program for the
development of the capacity of companies in the service and production departments,
but there are no measures to promote the energy management system yet.
Examples of concrete measures adopted in the industrial sector and service sector
include replacement of boilers, substitution of inefficient engines, promotion of
cogeneration system, substitution of incandescent lamps and fluorescent lamps. By
implementing these measures, Peru aims to reduce CO2 emissions by 10-15% by 2025.
1.3.3 Policies related to mercury management
On January 21, 2016 the Peruvian government became the 21st party to ratify the
Minamata Convention by depositing the instrument of ratification. The Ministry of the
Environment (MINAM) issued a Decree (No. 010-2016-MINAM) that approved the
multi-sector action plan for the implementation of the Minamata Convention on
Mercury. This plan establishes a roadmap to properly manage, reduce or eliminate the
use of mercury in the main sectors of Peru.
Several policies concerning the Minamata Convention are as follows.
· Atmospheric environmental standards related to mercury (Ministry of Resource
Conservation 041-2014-MINAM)
· Small scale construction and sanitation management strategy on mining right
extraction (highest decree 029-2014-PCM)
· Regulations for formulating the small-scale manual extraction process (Law No. 1105)
· Management of illegal transactions of scientific materials and equipment for illegal
mines (Legislative No. 1107)

6
· Management of distribution, transportation, and sales of scientific substances that can
be used at illegal mines (highest order 073-2014-EF)
Regarding the goal of the chlorine alkali business operator's abolition of mercury 2025,
the Peruvian government has referred to the Secretariat of the Convention for an
extension of five years. For business operators, it is supposed to be able to continue
using the Mercury Law line up to the year 2030.
1.4 Argentina
1.4.1 Economic Overview
Argentina, which GDP exceeds 550 million dollars, is one of South America's largest
economic zones, with the economy growing dramatically over the past decade.
Argentina is investing heavily in health, 7% of its GDP and to education which accounts
for 6% of its GDP.
1.4.2 Energy saving policies, carbon management in industry
The country still relies on about two-thirds of electricity for fossil fuels. Although the
country has a large reserve of shale gas and petroleum, it has failed to attract
investment due to the deteriorating economy, such as a slump in oil prices and soaring
drilling costs.
Ente Nacional Regulador de la Electricidad (ENRE) has developed a new fee structure
that utilities apply to companies and homes.
Energy price increases (in some cases 500%) are putting pressure on optimizing the use
of energy.
Argentina has enormous natural resources in energy and agriculture. Argentina has
fertile land within 2.8 million square kilometers and the potential of renewable energy
is high.
The government is trying to promote energy conservation by raising energy prices,
abolishing subsidies for energy consumption, promoting renewable energy sources,
optimizing grids through the framework of electricity transmission fees, and so on.
The Ministry of Energy and Mining (MINEM) was established in December 2015. In
August 2016, MINEM issued a resolution of 164-E / 2016 on the establishment of the
energy policy advisory committee. Through this committee, the new administration
elected in December 2015 will reform the energy policy as part of helping to cover
one-fifth of Argentina's electricity from renewable energy sources by 2025, hoping to
attract $ 20 billion. Argentina also plans to issue policies and action plans on energy
7
efficiency and energy conservation.
1.4.3 Policies related to mercury management
Articles 14 and 240 of Argentina's new commercial and civil law enacted in August 2015
will promote the rights of individuals and organizations for the protection of clean
environment and resources.
Institutionally, the Ministry of Environment and Sustainable Development is in charge
of environmental policy. There is no special law on mercury at present, but the
Environment Law (No. 25.675) considers certain aspects of the Minamata Convention.
For example, Law No. 25.612 reflects the environmental impact and management of
industrial waste. Law No. 26.184 shows acceptable mercury levels of batteries. There is
also Act No. 26.473 which prohibits the importation of incandescent bulbs. In parallel,
since Argentina is part of the Mercosur (the common market in the south), Law No.
24.449 fully complies with the regulations concerning the transportation of harmful
goods. Finally, there are regulations concerning occupational injuries and health
problems of workers who use mercury for certain parts.
At the international level, Argentina is a party to the Basel Convention on the
movement of cross-border movement of hazardous waste and its disposal, and is also a
party to the Rotterdam Convention on International Trade in Hazardous Chemicals and
Pesticides.
Regarding the Minamata Convention, Argentina signed in 2013. Argentina may ratify
closely as lawmakers accepted the bill in connection with the ratification of the
parliament in September 2016.

8
Chapter 2 Consensus building with stakes holders
2.1 Field survey
Table 2.1.1 shows the first field survey schedule.
Table 2.1.1First field survey schedule
Date Time Counter
country
Other party
11/16
(Wed)
PM Argentina CTCN NDE(telephone conference)
11/18
(Fri)
AM Uruguay Ministério de Vivienda Ordenamiento Territorial y
Medio Ambiente (MVOTMA)
11/21
(Mon)
AM Peru Ministerio del Ambiente
11/22
(Tue)
AM Brazil Ministério do Meio Ambiente (MMA), Abiclor
PM Brazil Ministry of Science, Technology, Innovation &
Communication
Table 2.1.2 shows the second field survey schedule.
Table 2.1.2 Second field survey schedule
Date Time Counter
country
Other party
2/13
(Mon)
PM Peru Ministerio del Ambiente
2/15
(Wed)
AM Brazil Ministério do Meio Ambiente (MMA), Abiclor
PM Brazil Ministry of Science, Technology, Innovation &
Communication, Ministry of Environment, Abclor
PM Uruguay Ministerio de Vivienda Ordenamiento Territorial y
Medio Ambiente (MVOTMA)
2.2 Government organization chart and explanation of other parties
Brazil
The ministries of Brazil treat with environmental issues (includes mercury) are
summarized in Figure 2.2.1. The associations are also included in the figure.

9
This time, we have visited the Ministério do Meio Ambiente (MMA)) that is in charge
of the mercury waste issue and the Ministério da Ciencia, Tecnologia e Inovacao(MCTI))
that is in charge of CTCN NDE. Both ministries showed interest and MMA asked for
the draft of CTCN request submission form. Then it is enough opportunity of
co-operation with Brazilian government.
MMA
・Ms. Leticia Reis de Carvalho (Director)
・Ms. Mirian de Oliveira (Coordinator of Enviromental Emergencies)
・Mr. Diego Henrique Costa Pereira (Enviromental Analyst)
MCTI
・Mr. Bruno Nunes, MSc. (General Coordinator)
・Dr. Fábio Larotonda (General Coordinator)
・Dr. Márcia Gonçalves (Senior Analyst of Science and Technology)
・Ms. Nanahira de Rabelo e Sant’Anna, MSc. (Science and Technology Analyst)
Figure 2-1 The ministries of Brazil treat with environmental issues (includes mercury).
The associations are also included in the figure.
Ref.:CloroSur IX Technical Seminar (Sao Paulo, Nov 13th in 2014, Dr. Otavio Luiz Gusso Maioli)
(1)
(2)
(3)

10
(1)Ministry of the Environment, (2)Ministry of Science, Technology and Innovation, (3)
Abiclor (Brazil chlor-Alkali and Derivatives Industry Association)
2.3 Consensus building with stakes holders in each country
2.3.1 Consensus building with stakes holders in Brazil
(First field survey)
MMA
We had showed the medium- to long-term suggestion about mercury method
conversion before the first field survey. At the first field survey, we got the information
about it. It was found that MMA was collaborative about our suggestion.
Abiclor (Brazil chlor-Alkali and Derivatives Industry Association) also attended the
meeting and confirmed that the suggestion matched the needs of the companies that
were under press to the process conversion. We also got the information that the CTCN
technical support such as the detailed design and the improvement of the accuracy for
cost estimate and timing matched the needs.
MCTI
It is confirmed that CTCN technical assistant request by public sector is welcomed
during meeting with CTCN NDE.
We visited the CTCN NDE and confirmed that the CTCN technical support was
welcomed by private companies. We also got the following information.
・ There are no competitive items in Brazil when Brazil government will submit the
CTCN request submission form.
・ Before submitting the request, the CTCN NDE make a reference to the
ministries related to this item. There is a possibility that they ask for the
modification or/and addition of the description. The amount of GHC emission
reduction is important for the CTCN NDE
・ The deadline for the CTCN request submission and the schedule of review are not
decided. They accept the submission as-needed.
・ MCTI, MMA and Abiclor agreed the GEF suggestion that is considered the fund
source of process conversion from mercury method.
・ Abiclor has been carrying out the preliminary calculation about the process
conversion from mercury method and mercury wastes. They will share the result
with MMA, AGC and OECC as a base of GEF suggestion.

11
(Second field survey)
MMA
We presented the draft of CTCN request submission form and the MMA agreed it.
We introduced the Green Climate Fund (GCF)as a potential fund option and decided
to examine it as necessary.
MCTI
We presented the draft of CTCN request submission form to CTCN NDE.
MMA agreed that they would be the proposer of the CTCN request.
Some General Coordination are set for CTCN NDE, in this case, the General
Coordination of Global Climate Change will be in charge of this item.
Japan side may need the follow about this item because the Global Climate Change did
not attend the meeting.
2.3.2 Consensus building with stakes holders in Uruguay
(First field survey)
MVOTMA
We visited the CTCN NDE and the person who is in charge of the mercury issues.
・ There are few factories in Uruguay that are the massive GHG emission sources.
・ In Uruguay, the areas that are treated the CTCN technical support as priority
are the renewable energy (adaptation), coastal defense (moderation) and so on.
・ The CTCN technical support for industry areas is possible but many companies
are need. There are only one company for caustic soda/chlorine industry in
Uruguay.
・ It is necessary to match the conversion plan of Efice.
(Second field survey)
MVOTMA
We visited the CTCN NDE and the person who is in charge of the mercury issues.
・ In 2015, more than 90% of Uruguay’s electricity was generated by wind and
hydropower. Thus, the electricity reduction in industry sector does not contribute
to the GHG reduction. For CTCN, the politics area for moderation in Uruguay is
the transportation. As is the same case in GCF.
The issue in the Efice’s conversion plan from mercury method is the storage and
treatment of the mercury wastes. It is required the support about it.

12
National Designated Entity (NDE) of the Uruguay Eastern Republic is located in the
Department of Climate Change, Ministry of Housing, Space Planning, and
Environment (MVOTMA) Environment Bureau. Currently, Deputy Minister Jorge
Rucks plays the role of NDE, but its role is being transferred to Secretary Ignacio
Lorenzo of National Climate Change Response System.
Projects on mercury and hazardous chemicals are generally required to discuss with
Judith Torres, Director of Production Chain, Waste and Materials Management
Department.
The CTCN technical support proposal needs to be consulted with all stakeholders
including representatives of the private sector and submitted directly to the NDE.
Figure 2-2 Organization chart of Ministry of Housing, Spatial Planning and
Environment (MVOTMA)
2.3.3 Consensus building with stakes holders in Peru
(First field survey)
Ministerio del Ambiente
We visited the CTCN NDE and the person who is in charge of the mercury issues.
・ Before the visit, we had proposed the middle- to long-term program (from CTCN
13
technical support to GEF support). They are favorably disposed toward our
proposal.
・ Three groups* meeting is desirable for confirming the target and schedule of the
conversion plan.
*Quimpac (the only company in Peru manufacturing the caustic soda/chlorine),
Ministerio del Ambiente、Japan team (AGC and OECC)
(Second field survey)
Ministerio del Ambiente
We visited the person who is in charge of the mercury issues.
・ The CTCN NDE is not positive to the proposal but, the GEF NDE is positive to
this.
・ There is no progress concerning the shutdown of Quimpac’s mercury method
plant,
The NDE of the Republic of the Republic of Peru is located in the Department of
Climate Change, Desertification and Water Resources under the jurisdiction of the
Ministry of the Environment (MINAM). Ms. Claudia Figallo de Ghersi General
Coordinator in the Climate Change, Desertification and Water Resources Department is
currently serving Peruvian NDE.
Projects on mercury and hazardous chemicals generally need to be discussed with Ms.
Vilma Morales Quillama Chemicals and Environmental Risk Coordinator of the
Environment and Quality Department.
14
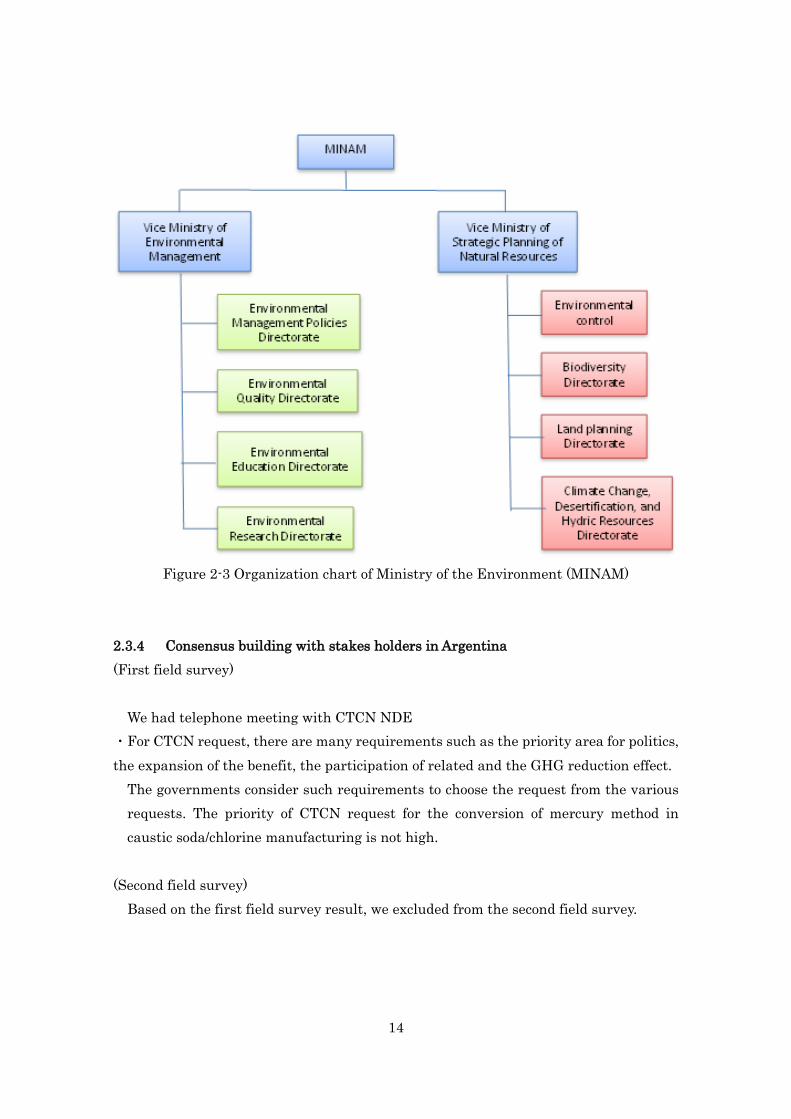
Figure 2-3 Organization chart of Ministry of the Environment (MINAM)
2.3.4 Consensus building with stakes holders in Argentina
(First field survey)
We had telephone meeting with CTCN NDE
・For CTCN request, there are many requirements such as the priority area for politics,
the expansion of the benefit, the participation of related and the GHG reduction effect.
The governments consider such requirements to choose the request from the various
requests. The priority of CTCN request for the conversion of mercury method in
caustic soda/chlorine manufacturing is not high.
(Second field survey)
Based on the first field survey result, we excluded from the second field survey.
15
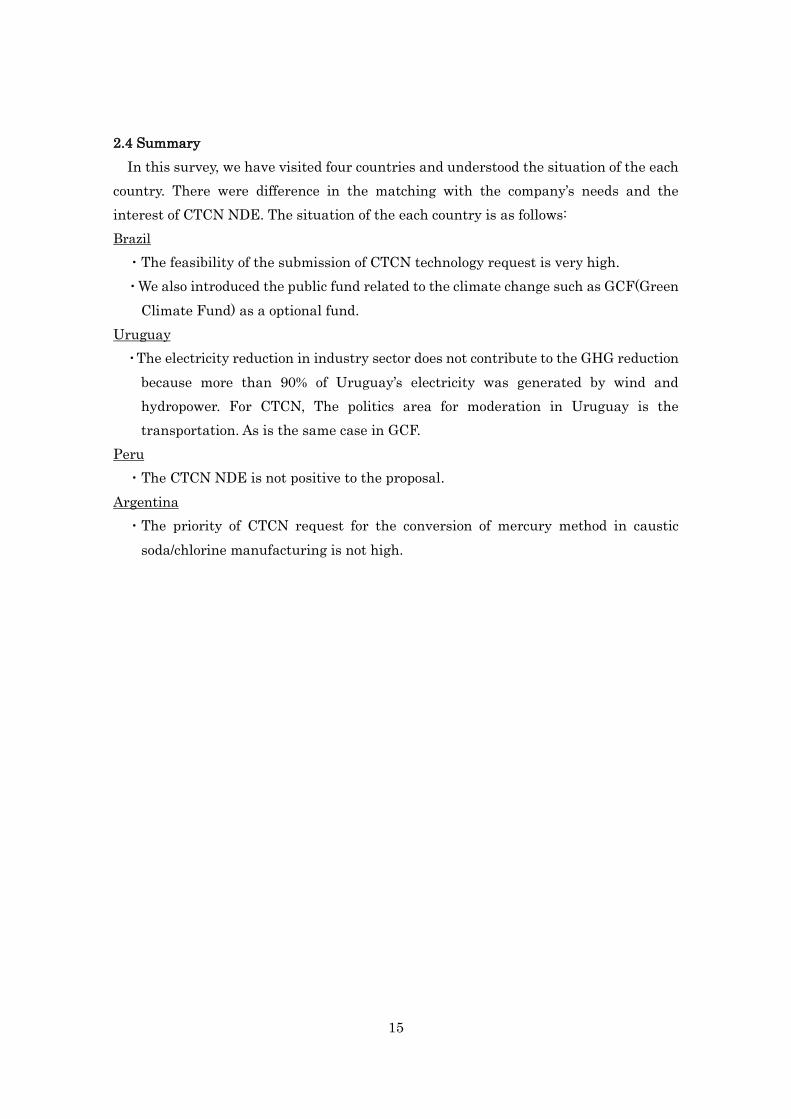
2.4 Summary
In this survey, we have visited four countries and understood the situation of the each
country. There were difference in the matching with the company’s needs and the
interest of CTCN NDE. The situation of the each country is as follows:
Brazil
・The feasibility of the submission of CTCN technology request is very high.
・We also introduced the public fund related to the climate change such as GCF(Green
Climate Fund) as a optional fund.
Uruguay
・The electricity reduction in industry sector does not contribute to the GHG reduction
because more than 90% of Uruguay’s electricity was generated by wind and
hydropower. For CTCN, The politics area for moderation in Uruguay is the
transportation. As is the same case in GCF.
Peru
・The CTCN NDE is not positive to the proposal.
Argentina
・The priority of CTCN request for the conversion of mercury method in caustic
soda/chlorine manufacturing is not high.

16
Chapter 3 Information exchange with caustic soda/chlorine factories
3.1 Situation of global mercury cell plants
According to the data compiled by the United Nations Environment Programme
(UNEP) in 2010, some 100 facilities in 43 nations that manufacture caustic soda
chlorine apply mercury method and its percentage is reported to be about 29%.
Figure 3.1 shows the chlorine manufacturing capacity by the mercury method, while
Table 3.1 shows the number and production capacity of plants using the mercury
method by country. According to Table 3.1, the numbers of the mercury method plants
in Brazil, Uruguay, Peru and Argentina are 4, 1, 2 and 2* respectively.
(* It is reported in Global inventory of UNEP Global Inventories of Chlor Alkali Facilities that the
number in Argentina is 5)
source:
http://web.unep.org/chemicalsandwaste/global-mercury-partnership/mercury-reduction-chlor-alkali-se
ctor/reports-and-publications
Figure 3-1 Mercury cell chlorine capacity
Source.: http://www.zoinet.org/web/sites/default/files/publications/Mercury-Poster-Chlor-Alkali.pdf

17
Table 3-1 The number and production capacity of plants using the mercury method by
country
Source.: http://www.zoinet.org/web/sites/default/files/publications/Mercury-Poster-Chlor-Alkali.pdf
3.2 Field survey
Table 3-2 shows the first field survey schedule.
Table 3-2 First field survey schedule
Date Time Place/Other party
11/16(Wed) PM CloroSur technical seminar (reception)
18
Date Time Place/Other party
11/17(Thu) AM CloroSur technical seminar(presentation of AGC)
PM Braskem S.A. (at CloroSur technical seminar)
PM Efice(at CloroSur technical seminar)
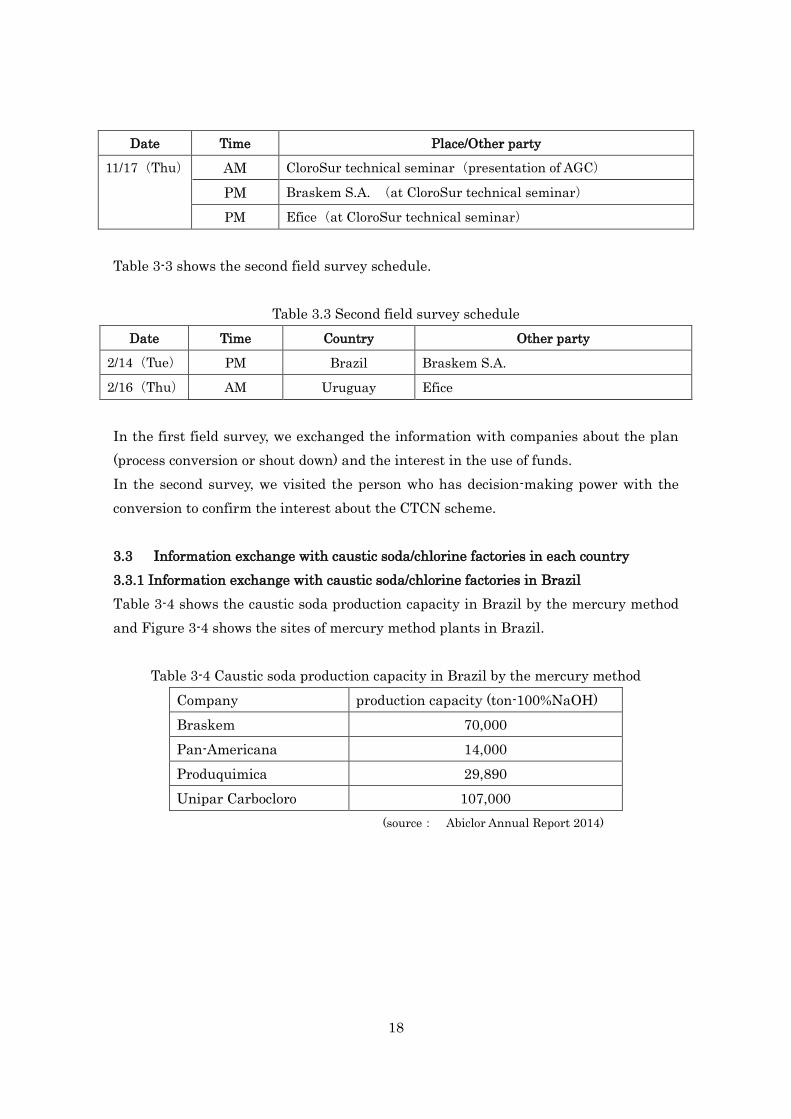
Table 3-3 shows the second field survey schedule.
Table 3.3 Second field survey schedule
Date Time Country Other party
2/14(Tue) PM Brazil Braskem S.A.
2/16(Thu) AM Uruguay Efice
In the first field survey, we exchanged the information with companies about the plan
(process conversion or shout down) and the interest in the use of funds.
In the second survey, we visited the person who has decision-making power with the
conversion to confirm the interest about the CTCN scheme.
3.3 Information exchange with caustic soda/chlorine factories in each country
3.3.1 Information exchange with caustic soda/chlorine factories in Brazil
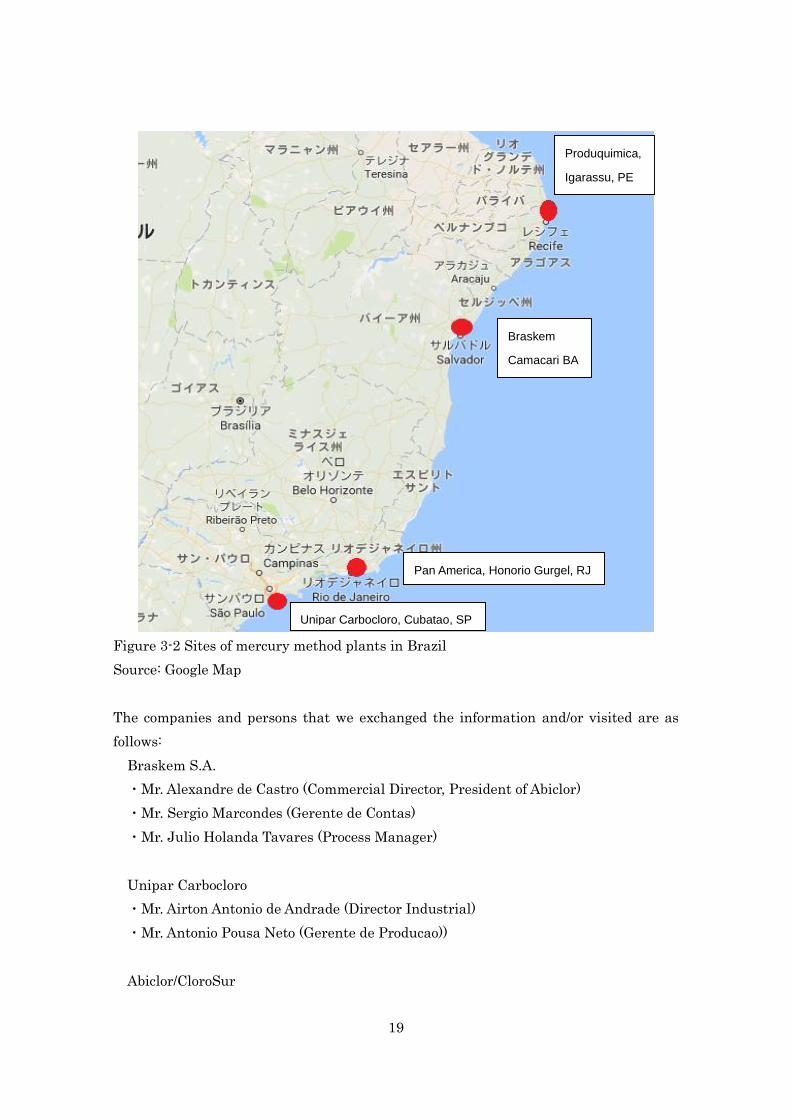
Table 3-4 shows the caustic soda production capacity in Brazil by the mercury method
and Figure 3-4 shows the sites of mercury method plants in Brazil.
Table 3-4 Caustic soda production capacity in Brazil by the mercury method
Company production capacity (ton-100%NaOH)
Braskem 70,000
Pan-Americana 14,000
Produquimica 29,890
Unipar Carbocloro 107,000
(source: Abiclor Annual Report 2014)
19
Figure 3-2 Sites of mercury method plants in Brazil
Source: Google Map
The companies and persons that we exchanged the information and/or visited are as
follows:
Braskem S.A.
・Mr. Alexandre de Castro (Commercial Director, President of Abiclor)
・Mr. Sergio Marcondes (Gerente de Contas)
・Mr. Julio Holanda Tavares (Process Manager)
Unipar Carbocloro
・Mr. Airton Antonio de Andrade (Director Industrial)
・Mr. Antonio Pousa Neto (Gerente de Producao))
Abiclor/CloroSur
Unipar Carbocloro, Cubatao, SP
Pan America, Honorio Gurgel, RJ
Braskem
Camacari BA
Produquimica,
Igarassu, PE

20
・Mr.Martim Afonso Penna (Executive Director)
(First field survey)
Braskem S.A.
At the CloroSur technical seminar, we confirmed that they would conduct the detailed
technical design and cost estimate for the process conversion from 2017 to 2018.
They showed much interest in the CTCN technical support.
(Second field survey)
Braskem S.A.
We explained the middle- to long- term plan for introducing the technology and the
contents of CTCN technical support to Mr. Alexandre de Castro (Commercial Director,
President of Abiclor)
We obtained the agreement under the follwingconditions:
・ Conclude the NDA (non-disclosure agreement) with 4 targeted companies
respectively.
・The cooperation for CTCN technical survey does not commit the conversion.
3.3.2 Information exchange with caustic soda/chlorine factories in Uruguay
Table 3-5 shows the caustic soda production capacity in Uruguay by the mercury
method and Figure 3-5 shows the sites of mercury method plants in Uruguay.
Table 3-5 Caustic soda production capacity in Uruguay by the mercury method
Company production capacity (ton-100%NaOH)
Efice 17,000
source.: http://www.efice.com.uy/es/buena-quimica/
21
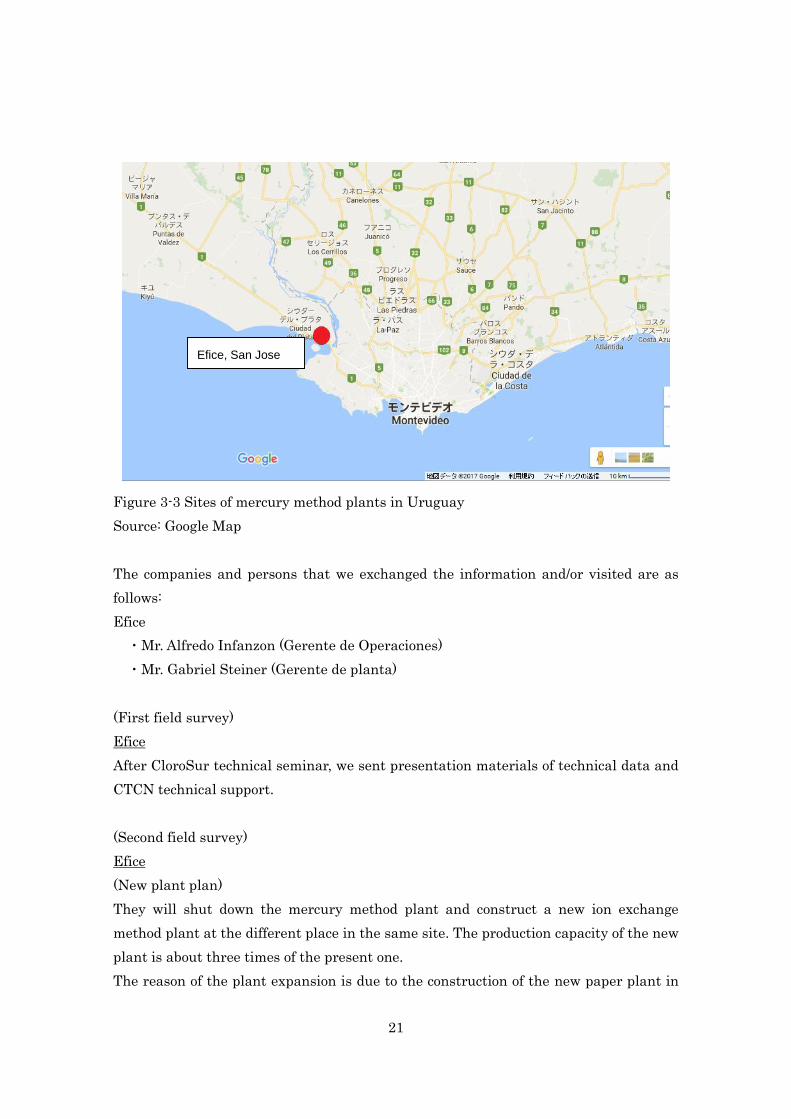
Figure 3-3 Sites of mercury method plants in Uruguay
Source: Google Map
The companies and persons that we exchanged the information and/or visited are as
follows:
Efice
・Mr. Alfredo Infanzon (Gerente de Operaciones)
・Mr. Gabriel Steiner (Gerente de planta)
(First field survey)
Efice
After CloroSur technical seminar, we sent presentation materials of technical data and
CTCN technical support.
(Second field survey)
Efice
(New plant plan)
They will shut down the mercury method plant and construct a new ion exchange
method plant at the different place in the same site. The production capacity of the new
plant is about three times of the present one.
The reason of the plant expansion is due to the construction of the new paper plant in
Efice, San Jose

22
2015 in Uruguay and the construction plan of the new paper plant in 2017. It means
that there will be three relatively large paper plants in in Uruguay.
Now, Uruguay depends on the caustic soda for import from the United States. But, this
is expected to shift the caustic soda from import to source in the country.
The forest industry is one of the principal industries in Uruguay. It is predicted that the
paper will be the first export production in the country by the construction of third
paper plant,
They plan to construct from 2020 to 2021 and to operate 2 cycles (100% production
capacity during the night time and 25% production capacity during the day time). This
is because the electricity price is cheap during the night time.
They want to know the method how to operation in 2 cycles.
They have delegated the funds plan to KPMG and CPA. Now they are raising the
finance for the construction of new plant and the treatment of mercury waste
(Treatment of mercury waste)
It is a costly problem. They are looking for the technology to do the pretreatment of
mercury waste to clear the discharge standard (5 ppm) in Uruguay.
They also undertake the pretreatment of the medical wastes (such as mercury
thermometer and mercury blood-pressure gauge) before carrying them to the disposal
field.
The disposal field in Uruguay that accept the mercury wastes was set up in 2016.
3.3.3 Information exchange with caustic soda/chlorine factories in Peru
Table 3-6 shows the caustic soda production capacity in Peru by the mercury method
and Figure 3-6 shows the sites of mercury method plants in Peru.
Table 3-6 Caustic soda production capacity in Peru by the mercury method
Company (site) production capacity (ton-100%Cl2)
Quimpac (Callao) 76,000
Quimpac (Paramonga)
source:UNEP Global Inventories of Chlor Alkali Facilities, Global inventory
http://web.unep.org/chemicalsandwaste/global-mercury-partnership/mercury-reduction-chlor-alkali-se
ctor/reports-and-publications

23
Figure 3-4 Sites of mercury method plants in Peru
Source: Google Map
The company and person that we exchanged the information (just by e-mail) are as
follows:
Quimpac
・Mr. Mario Fishman (board member, sun of present CEO)
(First field survey)
Quimpac
We tried to adjust the schedule, but we couldn’t.
(Second field survey)
Quimpac
We had plan to visit, but, it was canceled by Quimpac in the last time.
(Ref)
According to MINAM, the only company in Peru using the mercury process in the
production of caustic soda in Peru is Quimpac, which uses the process in two of its
plants. The Ministry has already sent the company a questionnaire about its use of the
mercury process. It is in close contact with Quimpac and has a good understanding of
the conditions at the company. Furthermore, representatives from three ministries (the
QUIMPAC S.A.
Paramonga
QUIMPAC S.A.
Callao

24
Ministry of the Environment, the Ministry of Health, and the Ministry of Production)
visited Quimpac in 2010 and have confirmed the company's intention to replace the
mercury process.
(source: FY2014 report, Feasibility studies with the aim of developing a joint crediting
mechanism, Energy-saving project for the manufacturing process of caustic soda &
chlorine through brine electrolysis in Mexico and other Latin American countries, study
for project exploration and planning)
3.3.4 Information exchange with caustic soda/chlorine factories in Argentina
Table 3-7 shows the caustic soda production capacity in Argentina by the mercury
method and Figure 3-7 shows the sites of mercury method plants in Argentina.
Table 3-7 Caustic soda production capacity in Argentina by the mercury method
Company Site production capacity
(ton-100%Cl2)
Solvay Indupa SAIC Bahia Blanca
122,000
Atanor SA Rio Tercero
Keghart Chacras de Coria
Ledesma Pueblo Ledesma
Quimica del Norte/Transclor SA Pilar
source:UNEP Global Inventories of Chlor Alkali Facilities, Global inventory
http://web.unep.org/chemicalsandwaste/global-mercury-partnership/mercury-reduction-chlor-alkali-se
ctor/reports-and-publications

25
Figure 3-5 Sites of mercury method plants in Argentina
Source: Google Map
(First field survey)
We could not contact the companies at the CloroSur technical seminar.
(Second field survey)
None
3.4 Summary
Brazil
・We formed the basis between the companies and the MMA to voluntarily promote
the project.
Uruguay
・It has been revealed that the procurement of public funds for the climate exchange is
limited. It is necessary to consider the technology conversion and finance for equipment
investment by private company base.
Keghart,
Chacras de Coria
Atanor SA,
Rio Tercero
Ledesma,
Pueblo
Ledesm
a
Transclor,
Pilar
Pueblo
Ledesm
a
Solvay Indupa SAIC,
Bahia Blanca

26
Peru
・The conversion plan of the company is not revealed. It is necessary to follow up the
plan.
Argentina
・It is necessary to continuously survey the conversion plan of the company and to
promote to encourage the broad use of the advanced Japanese technology.

27
Chapter 4 Simple energy conservation diagnosis by a data collection and
energy conservation effect expectation
4.1 Electric power unit consumption of caustic soda and chlorine production
Simple energy conservation diagnosis and energy conservation effects of caustic soda
and chloric production by a data collection in Brazil, Peru, Uruguay and Argentine are
performed by Chapter 4.
Caustic soda and chloric production process needs a lot of electric energy for
electrolyzing by electrolyzing salt solution. Electricity will be a principal raw material,
not a utility for caustic soda and chloric production industry. It is said that about 60% to
70% of the production cost is electricity in general. Therefore energy conservation in an
electrolyzing process will be very important for caustic soda and chlorine production.
The following 3 processes are used for caustic soda and chlorine production at present in
the world.
・The mercury cell process
・The diaphragm cell process
・The membrane cell process
The outline of production processes are follows:
The mercury cell process
Figure 4-1 The mercury cell process for caustic soda and chlorine production

28
(http://www.eurochlor.org/media/7815/mercury_300dpi2.pdf)
In the mercury cell process, sodium forms an amalgam (a 'mixture' of two metals) with
the mercury at the cathode. The amalgam reacts with the water in a separate reactor
called a decomposer where hydrogen gas and caustic soda solution at 50% are produced.
As the brine is usually re-circulated, solid salt is required to maintain the saturation of
the salt water. The brine is first de-chlorinated and then purified by a
precipitation-filtration process. The products are extremely pure. The chlorine, along
with a little oxygen, generally can be used without further purification.
Of the three processes, the mercury process uses the most electricity, but no steam is
required to concentrate the caustic solution. The use of mercury demands measures to
prevent environmental contamination. Also, mercury must be removed from the
hydrogen gas and caustic soda solution.
Mercury losses have been considerably reduced over the years. Increasingly, chlorine
producers are moving towards membrane technology, which has much less impact on
the environment.
(http://www.eurochlor.org/the-chlorine-universe/how-is-chlorine-produced/the-mercury-
cell-process.aspx)
The diaphragm cell process
Figure4-2 The diaphragm cell process for caustic soda and chlorine production

29
(http://www.eurochlor.org/media/7818/diaphragm_300dpi2.pdf)
In the diaphragm cell process the anode area is separated from the cathode area by a
permeable diaphragm. The brine is introduced into the anode compartment and flows
through the diaphragm into the cathode compartment.
Diluted caustic brine leaves the cell. On various sites, evaporation of caustic is not
needed because of a site-specific process integration, technology and management of the
energy balance. The caustic soda can also be concentrated to 50% and the salt removed.
This is often by using an evaporative process with about three tonnes of steam per tonne
of caustic soda.
The salt separated from the caustic brine can be used to saturate diluted brine. The
chlorine contains oxygen and must often be purified by liquefaction and evaporation.
(http://www.eurochlor.org/the-chlorine-universe/how-is-chlorine-produced/the-diaphrag
m-cell-process.aspx)
The membrane cell process
Figure 4-3 The membrane cell process for caustic soda and chlorine production
(http://www.eurochlor.org/media/7812/membrane_300dpi2.pdf)
The two electric connection points of each chlorine production cell, the anode and the
cathode, are separated by an ion-exchange membrane. Only sodium ions and a little
water pass through the membrane.
The brine is de-chlorinated and re-circulated. Solid salt is usually needed to re-saturate
the brine. After purification by precipitation-filtration, the brine is further purified with

30
an ion exchanger.
The caustic solution leaves the cell with about 30% concentration and, at a later stage in
the process, is usually concentrated to 50%. The chlorine gas contains some oxygen and
must often be purified by liquefaction and evaporation.
The consumption of electric energy is the lowest of the three processes and the amount
of steam needed for concentration of the caustic is relatively small (less than one tonne
per tonne of caustic soda).
(http://www.eurochlor.org/the-chlorine-universe/how-is-chlorine-produced/the-membran
e-cell-process.aspx)
(http://www.eurochlor.org/the-chlorine-universe/how-is-chlorine-produced/the-membran
e-cell-process.aspx)
Electrical unit consumption of these processes in general are as follows:
Table 4-1Electrical unit consumption of for caustic soda and chlorine production (1
tonne as NaOH 100%)
Electrical unit consumption
(kWh/ tonne as 100% NaOH)1
The mercury cell process 3,300
The diaphragm cell process 2,750
The membrane cell process 2,100
※ Electrical unit consumption maybe changed by other conditions. The concentration
of caustic soda production is 50%.
1 「Soda technical handbook」JAPAN SODA INDUSTRY ASSOCIATION (2009)
This table is converted per 1 ton of chlorine, it'll be as follows.
Table 4-2 Electrical unit consumption of for caustic soda and chlorine production (1
tonne as chlorine)
Electrical unit consumption
(kWh/ tonne as chlorine)
The mercury cell process 3,718
The diaphragm cell process 3,099
The membrane cell process 2,366

31
4.2 Simple energy conservation check by data collection in Brazil
An annual report of “Abichlor”, Brazilian chlorine industry association, is offered to
data of the caustic soda and chlorine production facilities in Brazil. According to this,
there were four mercury cell method caustic soda and chlorine facilities. There were
three diaphragm cell method caustic soda and chlorine facilities and there were five
membrane cell method caustic soda and chlorine facilities in Brazil as of 2013.
Table 4-3 List of production sites for caustic soda and chlorine in Brazil
(Abiclor Annual report 2014 p13)

32
Table 4-4 Energy conservation effect by process conversion of the mercury cell process
for caustic and chlorine production in Brazil
Production capacity
(tonne as chlorine/ year)
221,300
Electrical unit consumption in the
mercury cell process (MWh/ tonne as
chlorine)
3.718
Electrical unit consumption in the
membrane cell process
(MWh/ tonne as chlorine)
2.366
Electrical unit consumption by process
conversion
(MWh/ tonne as chlorine)
1.352
Energy conservation effect (MWh/ year) 299,198
Table 4-5 Energy conservation effect by process conversion of the diaphragm cell process
for caustic and chlorine production in Brazil
Production capacity
(tonne as chlorine/ year)
972,310
Electrical unit consumption in the
diaphragm cell process (MWh/ tonne as
chlorine)
3.099
Electrical unit consumption in the
membrane cell process
(MWh/ tonne as chlorine)
2.366
Electrical unit consumption by process
conversion
(MWh/ tonne as chlorine)
0.733
Energy conservation effect (MWh/ year) 712,703
When converting all plants of mercury cell facilities and diaphragm cell ones in Brazil,
it'll be reduced 1,012GWh/ year of electric power.
4.3 Simple energy conservation check by data collection in Uruguay
One facility of the mercury cell Chlor-Alkali method is located in Uruguay. Capacity is

33
14,000 as chlorine per year by investigation of UNEP in 2012. Energy conservation
effect by converting to the membrane cell method is as follows:
Table 4-6 Energy conservation effect by process conversion of the mercury cell process
for caustic and chlorine production in Uruguay
Production capacity
(tonne as chlorine/ year)
14,000
Electrical unit consumption in the
mercury cell process (MWh/ tonne as
chlorine)
3.718
Electrical unit consumption in the
membrane cell process
(MWh/ tonne as chlorine)
2.366
Electrical unit consumption by process
conversion
(MWh/ tonne as chlorine)
1.352
Energy conservation effect (MWh/ year) 18,928
4.4 Simple energy conservation check by data collection in Peru
One facility of the mercury cell Chlor-Alkali method is located in Peru. Capacity is
120,000 as chlorine per year by investigation of UNEP in 2012. Energy conservation
effect by converting to the membrane cell method is as follows:
Table 4-7 Energy conservation effect by process conversion of the mercury cell process
for caustic and chlorine production in Peru
Production capacity
(tonne as chlorine/ year)
120,000
Electrical unit consumption in the
mercury cell process (MWh/ tonne as
chlorine)
3.718
Electrical unit consumption in the
membrane cell process
(MWh/ tonne as chlorine)
2.366
Electrical unit consumption by process
conversion
1.352

34
(MWh/ tonne as chlorine)
Energy conservation effect (MWh/ year) 162,240
4.5 Simple energy conservation check by data collection in Argentina
One facility of the mercury cell Chlor-Alkali method is located in Argentine. Capacity
is 14,000 as chlorine per year by investigation of UNEP in 2012. Energy conservation
effect by converting to the membrane cell method is as follows:
Table 4-8 Energy conservation effect by process conversion of the mercury cell process
for caustic and chlorine production in Argentina
Production capacity
(tonne as chlorine/ year)
120,000
Electrical unit consumption in the
mercury cell process (MWh/ tonne as
chlorine)
3.718
Electrical unit consumption in the
membrane cell process
(MWh/ tonne as chlorine)
2.366
Electrical unit consumption by process
conversion
(MWh/ tonne as chlorine)
1.352
Energy conservation effect (MWh/ year) 162,240
4.6 Summary
The simple energy conservation diagnosis and energy conservation effects when
converting all mercury and diaphragm cell methods are converted to the membrane cell
method in Brazil, Peru, Uruguay and Argentina were performed by the above. When
old-fashioned ion exchange membrane cell process also converted the latest ion
exchange membrane cell process actually, about several % of energy conservation effect
could be expected, but we assumed that it was non-applicable this time.
Table 4-9 Energy conservation expectation in Brazil, Peru, Uruguay and Argentina
The mercury
cell (MWh)
The
diaphragm
cell (MWh)
Total
(MWh)

35
Brazil 299,198 712,703 1,011,901
Peru 162,240 ― 162,240
Uruguay 18,928 ― 18,928
Argentina 162,249 ― 162,249
Total 642,615 712,703 1,355,318
It is calculated about CO2 reduction effect by the energy conservation effect using the
respective national electrical unit consumption. The electrical unit consumption used
the average/combined margin emission factor (EFCM) from a CDM project data base of
IGES.
Table 4-10 Average combined margin emission factor (electrical unit consumption) in
Brazil, Peru, Uruguay and Argentina (t-CO2/MWh)
(https://pub.iges.or.jp/pub_file/20170113igesersheetgridefjpxlsx/download)
Table 4-11 Expectation of CO2 emission reduction by process conversion of caustic soda
and chlorine in Brazil, Peru, Uruguay and Argentina
Energy
reduction(MWh)
Electrical unit
consumption
(t-CO2/MWh)
CO2 reduction
(tonne/ year)
Brazil 1,011,901 0.294 297,499
Peru 162,249 0.600 97,344
Uruguay 18,929 0.574 10,865
Argentina 642,615 0.518 84,045
Total 1,388,318 - 489,753
データ
地域 ホスト国
データの個数 /CDM-EB-Ref
平均 / コンバインド・マージン 排出
係数(EFCM)
コンバインド・マージン 排
出係数(CM)/最大値
コンバインド・マージン 排
出係数(CM)/最小値
オペレーティング・マージン排出係数(OM)/平均
オペレーティング・マージン排出係数(OM)/最大
値
オペレーティング・マージン排出係数(OM)/最小
値
ビルド・マージン排出係
数 (BM)/平均
ビルド・マージン排出係
数 (BM)/最大値
ビルド・マージン排出係数 (BM)最
小値
中南米 アルゼンチン 35 0.518 0.692 0.417 0.598 0.863 0.484 0.407 0.508 0.335ウルグアイ 23 0.574 0.914 0.259 0.585 0.779 0.338 0.499 0.736 0.174エクアドル 27 0.583 0.719 0.363 0.736 0.875 0.626 0.435 0.607 0.221エルサルバドル 7 0.682 0.717 0.569 0.716 0.734 0.690 0.662 0.728 0.522ガイアナ 1 0.948 0.948 0.948 0.948 0.948 0.948キューバ 2 0.874 0.906 0.841 0.871 0.933 0.808 0.877 0.878 0.875グアテマラ 15 0.611 0.805 0.483 0.777 0.874 0.668 0.467 0.735 0.346コスタリカ 13 0.274 0.388 0.060 0.341 0.568 0.030 0.139 0.250 0.026コロンビア 30 0.328 0.444 0.103 0.440 0.576 0.140 0.220 0.358 0.029ジャマイカ 2 0.783 0.834 0.732 0.833 0.893 0.772 0.695 0.776 0.613チリ 84 0.614 0.888 0.386 0.722 0.876 0.442 0.478 0.987 0.201ドミニカ共和国 14 0.654 0.750 0.478 0.727 0.865 0.492 0.492 0.683 0.419ニカラグア 10 0.679 0.754 0.572 0.738 0.857 0.660 0.585 0.690 0.429パナマ 21 0.591 0.771 0.406 0.735 0.900 0.220 0.460 0.720 0.279バハマ 1 0.723 0.723 0.723 0.749 0.749 0.749 0.697 0.697 0.697ブラジル 244 0.294 1.021 0.075 0.430 0.947 0.079 0.136 1.048 0.031ベリーズ 1 0.152 0.152 0.152 0.304 0.304 0.304 0.000 0.000 0.000ペルー 51 0.600 0.756 0.224 0.704 0.858 0.178 0.485 0.653 0.232ボリビア 2 0.575 0.610 0.540 0.685 0.730 0.640 0.475 0.600 0.349ホンジュラス 27 0.661 0.752 0.498 0.676 0.770 0.590 0.655 0.910 0.460メキシコ 116 0.528 0.652 0.400 0.648 0.739 0.467 0.378 0.519 0.268

36
Therefore about 500,000 tonne/year of CO2 reduction can be expected when converting
all mercury and diaphragm cell methods are converted to the membrane cell method in
Brazil, Peru, Uruguay and Argentina.
Evaluation of conversion project
Evaluation of conversion project is important for local companies to be appealed the
merit of the membrane cell process installment. The membrane cell process is better
than for environment and labor’s health other process due to no usage of hazardous
chemicals such as mercury, but in this chapter the payback period is calculated as a
economical merit. For simplification, the price of products and purchase of raw
materials are same between the mercury cell process and the membrane cell process.
There is a report that maintenance cost is lower than the mercury cell process, but the
payback period is calculated as a simple project of electrical energy conservation.
It is said that the conversion cost is 500 to 700 $/ tonne as chlorine. (UNEP Global
Mercury Partnership Chlor-Alkali Area June 2012)。
The payback period of conversion project is calculated under the condition that the
capacity of the facility is 100,000 ton/ year as chlorine capacity. JETRO shows the data
of each country’s electrical price for industry. The lowest electrical piece is selected for
the calculation due to robust if there are few options.
Table 4-12 Electrical prices for industry in each country
Country (City) Electrical price for industry ($/kWh)
Brazil (Sao Paulo) 0.1075*1
Peru (Lima) 0.06*2
Uruguay (Montevideo) 0.15
Argentina (Buenos Aires) 0.046
(https://www.jetro.go.jp/world/search/cost_result?countryId%5B%5D=4700&countryId%
5B%5D=4800&countryId%5B%5D=5900&countryId%5B%5D=6300&countryId%5B%5
D=11800より)
*1 It is different in the electric power unit price depending on the tight situations of the
supply of electric power, but the cheapest price was chosen.
*2 It is different in the electric power unit price depending on time, but the cheapest
price was chosen.
37
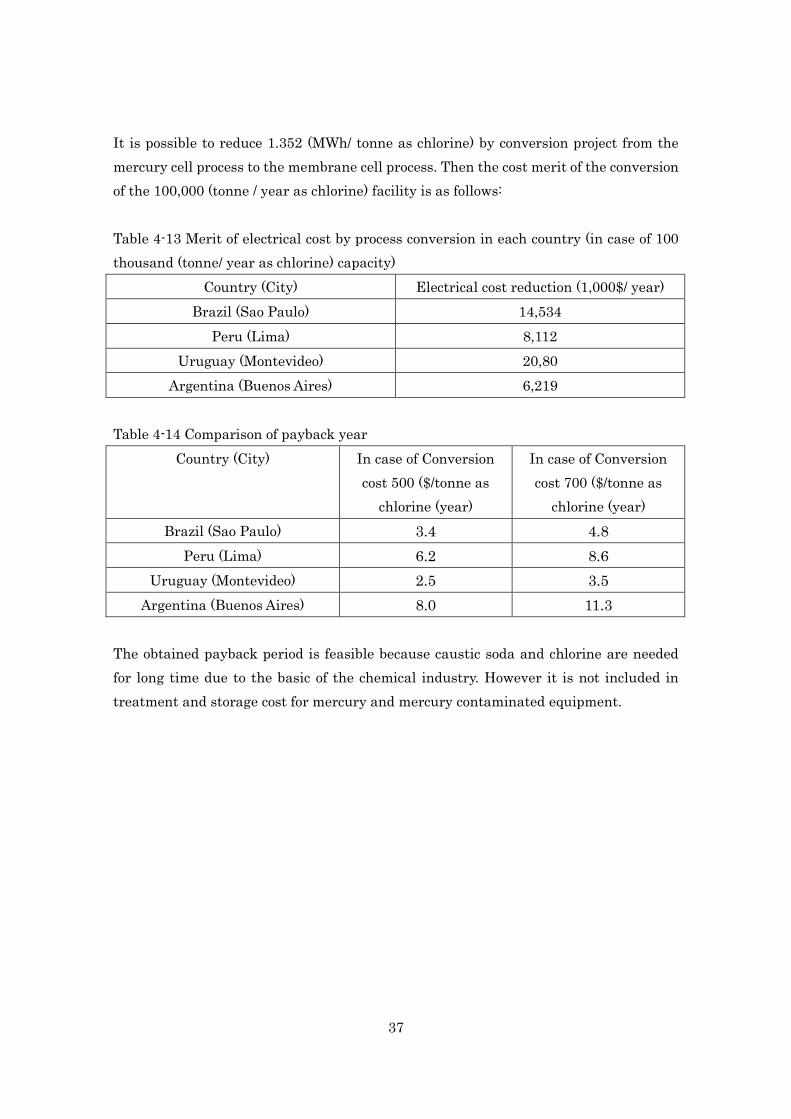
It is possible to reduce 1.352 (MWh/ tonne as chlorine) by conversion project from the
mercury cell process to the membrane cell process. Then the cost merit of the conversion
of the 100,000 (tonne / year as chlorine) facility is as follows:
Table 4-13 Merit of electrical cost by process conversion in each country (in case of 100
thousand (tonne/ year as chlorine) capacity)
Country (City) Electrical cost reduction (1,000$/ year)
Brazil (Sao Paulo) 14,534
Peru (Lima) 8,112
Uruguay (Montevideo) 20,80
Argentina (Buenos Aires) 6,219
Table 4-14 Comparison of payback year
Country (City) In case of Conversion
cost 500 ($/tonne as
chlorine (year)
In case of Conversion
cost 700 ($/tonne as
chlorine (year)
Brazil (Sao Paulo) 3.4 4.8
Peru (Lima) 6.2 8.6
Uruguay (Montevideo) 2.5 3.5
Argentina (Buenos Aires) 8.0 11.3
The obtained payback period is feasible because caustic soda and chlorine are needed
for long time due to the basic of the chemical industry. However it is not included in
treatment and storage cost for mercury and mercury contaminated equipment.
38
Chapter 5 Expectation of mercury usage reduction etc.
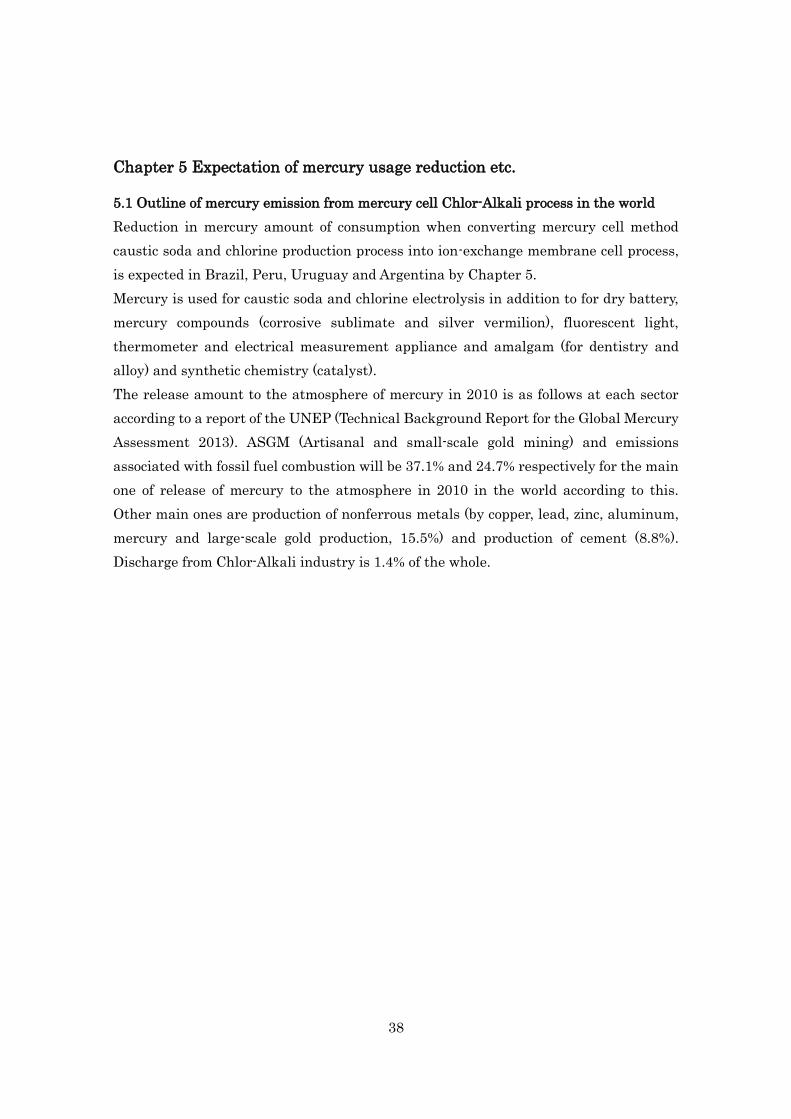
5.1 Outline of mercury emission from mercury cell Chlor-Alkali process in the world
Reduction in mercury amount of consumption when converting mercury cell method
caustic soda and chlorine production process into ion-exchange membrane cell process,
is expected in Brazil, Peru, Uruguay and Argentina by Chapter 5.
Mercury is used for caustic soda and chlorine electrolysis in addition to for dry battery,
mercury compounds (corrosive sublimate and silver vermilion), fluorescent light,
thermometer and electrical measurement appliance and amalgam (for dentistry and
alloy) and synthetic chemistry (catalyst).
The release amount to the atmosphere of mercury in 2010 is as follows at each sector
according to a report of the UNEP (Technical Background Report for the Global Mercury
Assessment 2013). ASGM (Artisanal and small-scale gold mining) and emissions
associated with fossil fuel combustion will be 37.1% and 24.7% respectively for the main
one of release of mercury to the atmosphere in 2010 in the world according to this.
Other main ones are production of nonferrous metals (by copper, lead, zinc, aluminum,
mercury and large-scale gold production, 15.5%) and production of cement (8.8%).
Discharge from Chlor-Alkali industry is 1.4% of the whole.

39
Figure 5-1 Proportions of global anthropogenic mercury emissions to air in 2010 from
different sectors.
(http://www.unep.org/PDF/PressReleases/GlobalMercuryAssessment2013.pdf P19)

40
Table 5-1 Global anthropogenic mercury emissions to air from different sectors in 2010.
IMPORTANT: These numbers cannot be compared directly with those presented in the
2008 assessment; see Section 2.4.
Sector 2010 emission (range), ta %
Artisanal and small-scale gold mining 727 (410 - 1040) 37.1
Coal combustion – power plants 316 (204 - 452) 16.1
Coal combustion – industry 102 (64.7 - 146) 5.2
Coal combustion – other 56.0 (35.4 - 80.0) 2.9
Oil combustion – power plants 3.7 (1.7 - 6.1) 0.2
Oil combustion – industry 3.0 ( 1.4 - 5.0) 0.2
Oil combustion – other 2.6 (1.2 - 4.2) 0.1
Natural gas combustion – power 0.3 (0.1 - 0.5) 0.0
plant
Natural gas combustion – industry 0.1 ( 0.0 - 0.2) 0.0
Natural gas combustion – other 0.2 ( 0.1 - 0.3) 0.0
Pig iron production (primary) 45.5 (20.5 - 241) 2.3
Non-ferrous metal production
(Al, Cu, Pb, Zn)(primary) 194 (82.0 - 660) 9.9
Large-scale gold production 97.3 (0.7 - 247) 5.0
Mercury production 11.7 (6.9 - 17.8) 0.6
Cement production 173 (65.5 - 646) 8.8
Chlor-alkali industry (Hg cell) 28.4 (10.2 - 54.7) 1.4
Oil refining 16.0 ( 7.3 - 26.4) 0.8
Waste from consumer products 89.4 (22.2 - 308) 4.6
(landfill)
Waste from consumer products 6.2 (1.5 - 219) 0.3
(controlled incineration)
Cremation 3.6 (0.9 - 11.9) 0.2
Contaminated sites 82.5 (70.0 - 95.0) 4.2
a Values rounded to three significant figures.
(http://www.unep.org/PDF/PressReleases/GlobalMercuryAssessment2013.pdf P20)

41
The Convention for the Protection of the Marine Environment of the North-East
Atlantic (the, "OSPAR Convention") is offered to information on European mercury way
caustic soda and discharge from chloric manufacturing process, and the initiative of a
UNEP and World Chlorine Council are offered to something from other countries.
The number of the facilities and production of mercury cell process for caustic soda and
chlorine decrease according to this information, but approximately several tens of
facilities which discharge mercury to the atmospheres etc. are being still used at all over
the world. But an indefinite part is still left in the income and expenditure of the
mercury for mass balance in formal information and mercury discharge from mercury
cell process.
Figure 5-2 Number of plants and capacity of mercury electrolysis units in
USA/Canada/Mexico, Europe, Russia, India and Brazil/Argentina/Uruguay
(World Chlorine Council)
42
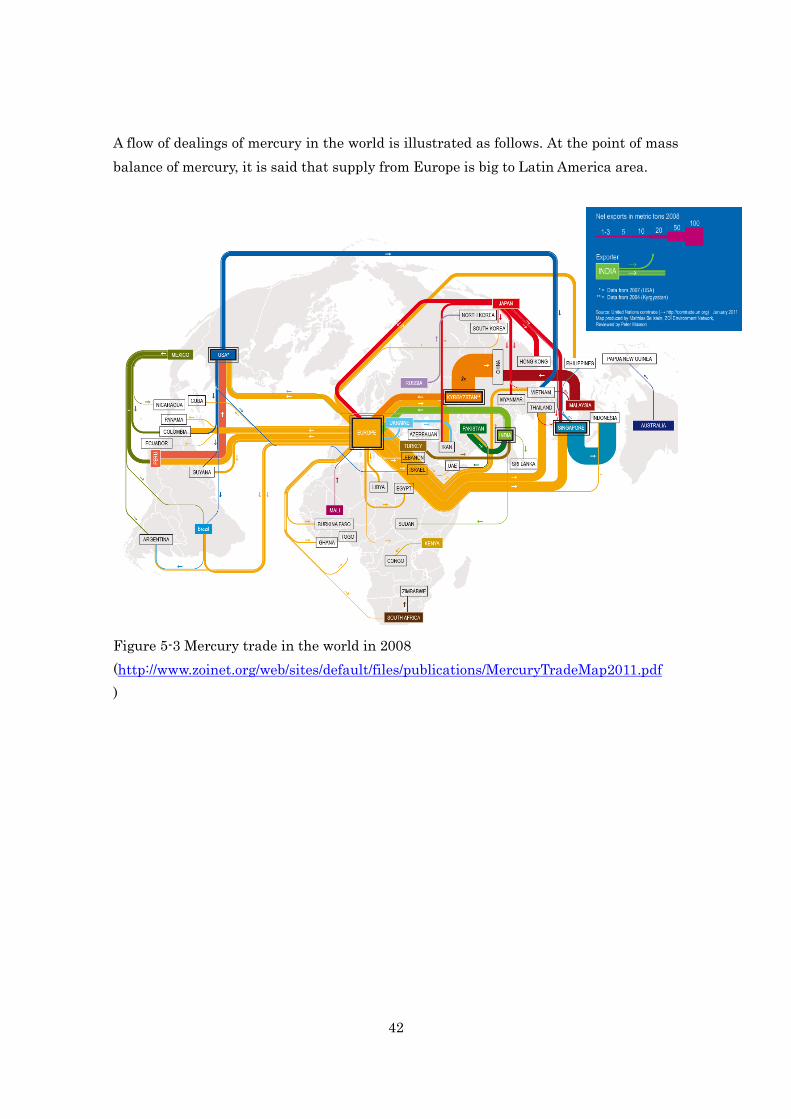
A flow of dealings of mercury in the world is illustrated as follows. At the point of mass
balance of mercury, it is said that supply from Europe is big to Latin America area.
Figure 5-3 Mercury trade in the world in 2008
(http://www.zoinet.org/web/sites/default/files/publications/MercuryTradeMap2011.pdf
)

43
5.2 Reduction expectation of mercury usage etc. in Brazil
The productive capacity of mercury cell process of Chlor-Alkali in Brazil is 217,000 tons
by material in 2010 of a UNEP
(http://www.unep.org/chemicalsandwaste/Mercury/GlobalMercuryPartnership/Chloralk
aliSector/Reports/tabid/4495/language/en-US/Default.aspx), and it is the biggest
productive capacity in Latin America. This accounts for 50.6% of the plant capacity of
Brazil, Argentina, Peru and Uruguay except for Colombia (22,000 ton as chlorine).
(Unit: 1,000tonne as chlorine)
Figure 5-4 Production capacity of mercury cell process for caustic soda and chlorine in
middle and South America (Brazil)
(http://www.unep.org/chemicalsandwaste/Mercury/GlobalMercuryPartnership/Chloralk
aliSector/Reports/tabid/4495/language/en-US/Default.aspx)
The next information is obtained by information on a global inventory in mercury cell
process facilities of the global mercury partnership of a UNEP. The number of facilities
was also 4 in 2012 and in 2010 according to this. The number is not changed. The
capacity is 217,000 tons as chlorine. On the other hand, the capacity is 223,000 tons as
chlorine in 2010 in figure 5-4 by the following data. It is different between two data
source, but there is no significant differences.
Table 5-2 Inventory information of mercury cell Chlor-Alkali facilities in Brazil

44
(https://wedocs.unep.org/bitstream/handle/20.500.11822/13858/Hg-cell_chlor-alkali_faci
lity_global_inventory_table_final.xls?sequence=1&isAllowed=y)
Mercury of 3,520kg is emitted to the air, water, soil and solid waste in 2012, and it's
expected that these discharge will be reduced by conversion from mercury cell process to
other process.
Figure 5-5 Proportion of mercury emission of mercury cell Chlor-Alkali facilities in
Brazil
As emission from mercury cell process of caustic soda and chlorine production, solid
waste is 54% of the whole emission and emission to air is 46%. It was reports that there
were 325 tonne of mercury in mercury cell process Chlor-Alkali facilities in 2012.
The comparison of emission factor of mercury from mercury cell Chlor-Alkali facilities
in Brazil and the world average are as follows:
Capacity2010
Capacity2012
Purchases/Sales
Consump-tion/Use
Hg on siteat
facilities
Emissionsto Air
Emissionsto Water
Emissionsto Soil
SolidWaste
1000 t Cl2 1000 t Cl2 kg Hg kg Hg t Hg kg Hg kg Hg kg Hg kg Hg
Brazil 223 226 4 4 12,505 22,947 325 1,622 7 0 1,891
2012 WCCReport,Updated 2013
General notes:
- Blank cells indicate that data was not available or not reported. - Negative numbers in the purchases/sales column indicate sales; positive numbers indicate purchases.
- For countries where data was not available from the UNEP survey or WCC, the 2010 Inventory data is reproduced here. It was assumed that 2012 chlorinecapacity and number of facilities was the same as 2010. These assumed 2012 figures are italized in the table.
Global Inventory of Mercury-Cell Chlor-Alkali Facilities
UNEP Global Mercury Partnership Chlor-Alkali Area
No. ofFacilities
2010
No. ofFacilities
2012 Source
Emissions to Air46.1%
Emissions to Water0.2%
Solid Waste53.7%
Brazil

45
Table 5-3 Emission factor of mercury from mercury cell Chlor-Alkali facilities in Brazil
Emission factor of mercury from mercury cell Chlor-Alkali facilities in Brazil is almost
half compared with emission factor of the world as a whole. But emission factor of air is
six times. If this is decreased, the mercury emission to the environment will be reduced.
5.3 Reduction expectation of mercury usage etc. in Uruguay
The productive capacity of mercury cell process of Chlor-Alkali in Uruguay is 14,000
tons by material in 2010 of a UNEP
(http://www.unep.org/chemicalsandwaste/Mercury/GlobalMercuryPartnership/Chloralk
aliSector/Reports/tabid/4495/language/en-US/Default.aspx). This accounts for 3.3% of
the plant capacity of Brazil, Argentina, Peru and Uruguay except for Colombia (22,000
ton as chlorine).
(Unit: 1,000tonne as chlorine)
Figure 5-6 Production capacity of mercury cell process for caustic soda and chlorine in
middle and South America (Uruguay)
(http://www.unep.org/chemicalsandwaste/Mercury/GlobalMercuryPartnership/Chloralk
kg Hg/t-CL2Emissions toAir
Emissions toWater
Emissions toSoil
Solid Waste SUM
Brazil A 7.177 0.031 0.000 8.367 15.575Global AVE B 1.178 0.339 0.101 32.395 34.013A/B 609.4% 9.1% 0.0% 25.8% 45.8%

46
aliSector/Reports/tabid/4495/language/en-US/Default.aspx)
The next information is obtained by information on a global inventory in mercury cell
process facilities of the global mercury partnership of a UNEP. The number of facilities
was also 1 in 2010 and in 2012 according to this. The number is not changed.
Table 5-4 Inventory information of a mercury cell Chlor-Alkali facility in Uruguay
(https://wedocs.unep.org/bitstream/handle/20.500.11822/13858/Hg-cell_chlor-alkali_faci
lity_global_inventory_table_final.xls?sequence=1&isAllowed=y)
Mercury of 737kg is emitted to the air and solid waste in 2012, and it's expected that
these discharge will be reduced by conversion from mercury cell process to other process.
However it was reports that there were 24 tonne of mercury in mercury cell process
Chlor-Alkali facilities and this will become an issue to storage due to conversion of
mercury cell process.
Capacity2010
Capacity2012
Purchases/Sales
Consump-tion/Use
Hg on siteat
facilities
Emissionsto Air
Emissionsto Water
Emissionsto Soil
SolidWaste
1000 t Cl2 1000 t Cl2 kg Hg kg Hg t Hg kg Hg kg Hg kg Hg kg Hg
Uruguay 14 14 1 1 5175 1850 24 24 0 0 713
2012 UNEPSurvey, 2012WCC
General notes:
- Blank cells indicate that data was not available or not reported. - Negative numbers in the purchases/sales column indicate sales; positive numbers indicate purchases.
Global Inventory of Mercury-Cell Chlor-Alkali Facilities
UNEP Global Mercury Partnership Chlor-Alkali Area
- For countries where data was not available from the UNEP survey or WCC, the 2010 Inventory data is reproduced here. It was assumed that 2012 chlorinecapacity and number of facilities was the same as 2010. These assumed 2012 figures are italized in the table.
Source
No. ofFacilities
2010
No. ofFacilities
2012

47
Figure 5-7 Proportion of mercury emission of a mercury cell Chlor-Alkali facility in
Uruguay
As emission from mercury cell process of caustic soda and chlorine production, solid
waste is 54% of the whole emission and emission to air is 46%. It was reports that there
were 325 tonne of mercury in mercury cell process Chlor-Alkali facilities in 2012.
It was reported that there are 24 tons of mercury in mercury cell Chlor-Alkali facility in
Uruguay as of 2012. Emissions from process operation are 97% through waste solid and
3% through air.
The comparison of emission factor of mercury from mercury cell Chlor-Alkali facilities
in Uruguay and the world average are as follows:
Table 5-5 Emission factor of mercury from a mercury cell Chlor-Alkali facility in
Uruguay
Emissions to
Air
3.3%
Solid Waste
96.7%
Uruguay
kg Hg/t-CL2Emissions toAir
Emissions toWater
Emissions toSoil
Solid Waste SUM
Uruguay A 1.743 0.003 0.000 50.929 52.674Global AVE B 1.178 0.339 0.101 32.395 34.013A/B 148.0% 0.8% 0.0% 157.2% 154.9%
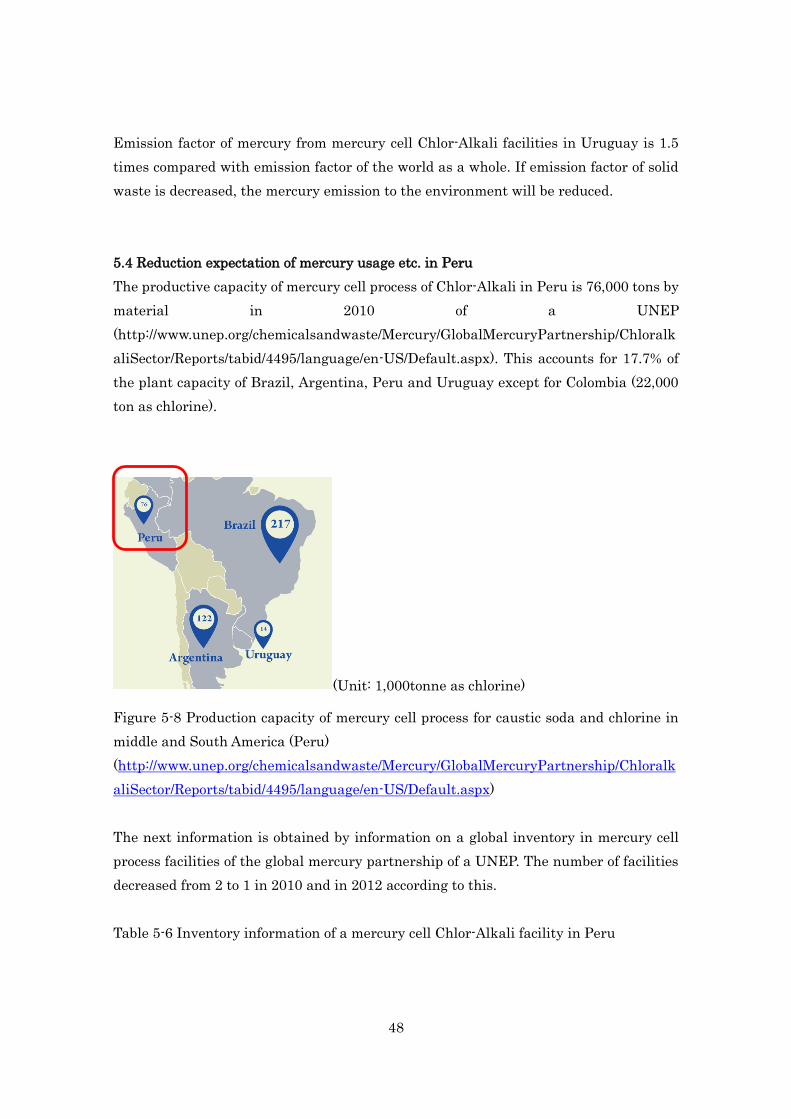
48
Emission factor of mercury from mercury cell Chlor-Alkali facilities in Uruguay is 1.5
times compared with emission factor of the world as a whole. If emission factor of solid
waste is decreased, the mercury emission to the environment will be reduced.
5.4 Reduction expectation of mercury usage etc. in Peru
The productive capacity of mercury cell process of Chlor-Alkali in Peru is 76,000 tons by
material in 2010 of a UNEP
(http://www.unep.org/chemicalsandwaste/Mercury/GlobalMercuryPartnership/Chloralk
aliSector/Reports/tabid/4495/language/en-US/Default.aspx). This accounts for 17.7% of
the plant capacity of Brazil, Argentina, Peru and Uruguay except for Colombia (22,000
ton as chlorine).
(Unit: 1,000tonne as chlorine)
Figure 5-8 Production capacity of mercury cell process for caustic soda and chlorine in
middle and South America (Peru)
(http://www.unep.org/chemicalsandwaste/Mercury/GlobalMercuryPartnership/Chloralk
aliSector/Reports/tabid/4495/language/en-US/Default.aspx)
The next information is obtained by information on a global inventory in mercury cell
process facilities of the global mercury partnership of a UNEP. The number of facilities
decreased from 2 to 1 in 2010 and in 2012 according to this.
Table 5-6 Inventory information of a mercury cell Chlor-Alkali facility in Peru

49
(https://wedocs.unep.org/bitstream/handle/20.500.11822/13858/Hg-cell_chlor-alkali_faci
lity_global_inventory_table_final.xls?sequence=1&isAllowed=y)
The data of mercury emission to air, water, soil and solid waste are not obtained.
However it was reported that the production capacity was 120,000 as chlorine in 2012.
Each emission factor is estimated by the weighted average of emission factor among
Argentina, Brazil and Uruguay.
Table 5-7 Weighted average of emission factor of mercury among three counties
(Argentina, Brazil and Uruguay)
Kg-Hg/
t-CL2
Capacity
2012
1,000t/Cl2
Emissions
to Air
Emissions
to Water
Emissions
to Soil
Solid
Waste
Argentina 120 1.75 0.05 0.02 6.71
Brazil 226 7.18 0.03 0.00 8.37
Uruguay 14 1.74 0.00 0.00 50.93
Weighted
average
― 5.16 0.04 0.01 9.47
Mercury emissions to air, water, soil and solid waste are estimated by the emission
factor that are obtained above calculation and the production capacity of 120,000 tonne
s as chlorine in Peru.
Capacity2010
Capacity2012
Purchases/Sales
Consump-tion/Use
Hg on siteat
facilities
Emissionsto Air
Emissionsto Water
Emissionsto Soil
SolidWaste
1000 t Cl2 1000 t Cl2 kg Hg kg Hg t Hg kg Hg kg Hg kg Hg kg Hg
Peru 76 120 2 12012 WCCReport
General notes:
- Blank cells indicate that data was not available or not reported. - Negative numbers in the purchases/sales column indicate sales; positive numbers indicate purchases.
Global Inventory of Mercury-Cell Chlor-Alkali Facilities
UNEP Global Mercury Partnership Chlor-Alkali Area
- For countries where data was not available from the UNEP survey or WCC, the 2010 Inventory data is reproduced here. It was assumed that 2012 chlorinecapacity and number of facilities was the same as 2010. These assumed 2012 figures are italized in the table.
Source
No. ofFacilities
2010
No. ofFacilities
2012

50
Table 5-8 Estimated estimation factor of mercury in Peru (2012)
Almost of mercury (65%) will be emitted to solid waste and the rest will be emitted to
the air (35%).
Figure 5-9 Proportion of mercury emission of a mercury cell Chlor-Alkali facility in Peru
(Estimation)
There is no date published regarding storage of mercury in Peru.
5.5 Reduction expectation of mercury usage etc. in Argentina
he productive capacity of mercury cell process of Chlor-Alkali in Argentina is 122,000
tons by material in 2010 of a UNEP
(http://www.unep.org/chemicalsandwaste/Mercury/GlobalMercuryPartnership/Chloralk
aliSector/Reports/tabid/4495/language/en-US/Default.aspx), and it is the second biggest
productive capacity in Latin America. This accounts for 28.4% of the plant capacity of
Brazil, Argentina, Peru and Uruguay except for Colombia (22,000 ton as chlorine).
kg HgEmissions
to AirEmissionsto Water
Emissionsto Soil
SolidWaste
SUM
619 4 1 1,136 1,760
Emissions to
Air
35.2% Emissions to
Water
0.2%
Emissions to
Soil
0.0%
Solid Waste
64.6%
Peru

51
(Unit: 1,000tonne as chlorine)
Figure 5-10 Production capacity of mercury cell process for caustic soda and chlorine in
middle and South America (Argentine)
(http://www.unep.org/chemicalsandwaste/Mercury/GlobalMercuryPartnership/Chloralk
aliSector/Reports/tabid/4495/language/en-US/Default.aspx)
The next information is obtained by information on a global inventory in mercury cell
process facilities of the global mercury partnership of a UNEP. The number of facilities
decreased from 5 to 2 in 2010 and in 2012 according to this.
Table 5-9 Inventory information of mercury cell Chlor-Alkali facilities in Argentina
(https://wedocs.unep.org/bitstream/handle/20.500.11822/13858/Hg-cell_chlor-alkali_faci
lity_global_inventory_table_final.xls?sequence=1&isAllowed=y)
Mercury of 1,023kg is emitted to the air, water, soil and solid waste in 2012, and it's
expected that these discharge will be reduced by conversion from mercury cell process to
other process. However it was reports that there were 74 tonne of mercury in mercury
cell process Chlor-Alkali facilities and this will become an issue to storage due to
conversion of mercury cell process.
Capacity2010
Capacity2012
Purchases/Sales
Consump-tion/Use
Hg on siteat
facilities
Emissionsto Air
Emissionsto Water
Emissionsto Soil
SolidWaste
1000 t Cl2 1000 t Cl2 kg Hg kg Hg t Hg kg Hg kg Hg kg Hg kg Hg
Argentina 122 120 5 2 1045 74 210 6 2 (a) 8052012 UNEPSurvey
General notes:
- Blank cells indicate that data was not available or not reported. - Negative numbers in the purchases/sales column indicate sales; positive numbers indicate purchases.
Notes on individual data points:(a): Data only reported for one plant
Global Inventory of Mercury-Cell Chlor-Alkali Facilities
UNEP Global Mercury Partnership Chlor-Alkali Area
- For countries where data was not available from the UNEP survey or WCC, the 2010 Inventory data is reproduced here. It was assumed that 2012 chlorinecapacity and number of facilities was the same as 2010. These assumed 2012 figures are italized in the table.
Source
No. ofFacilities
2010
No. ofFacilities
2012

52
Figure 5-11 Proportion of mercury emission of mercury cell Chlor-Alkali facilities in
Argentine
It was reports that there were 74 tonne of mercury in mercury cell process Chlor-Alkali
facilities in 2012. As emission from mercury cell process of caustic soda and chlorine
production, solid waste is 79% of the whole emission and emission to air and water is
21% and 1% respectively.
The comparison of emission factor of mercury from mercury cell Chlor-Alkali facilities
in Argentina and the world average are as follows:
Table 5-10 Emission factor of mercury from mercury cell Chlor-Alkali facilities in
Argentine
Emission factor of mercury from mercury cell Chlor-Alkali facilities in Argentina is one
forth compared with emission factor of the world as a whole. However the emission
factor of air is 1.5 times, if emission factor of air is decreased, the mercury emission to
Emissions to
Air
20.5%Emissions to
Water
0.6%
Emissions to
Soil
0.2%
Solid Waste
78.7%
Argentina
kg Hg/t-CL2Emissions toAir
Emissions toWater
Emissions toSoil
Solid Waste SUM
Argentina A 1.750 0.050 0.017 6.708 8.525Global AVE B 1.178 0.339 0.101 32.395 34.013A/B 148.6% 14.7% 16.5% 20.7% 25.1%
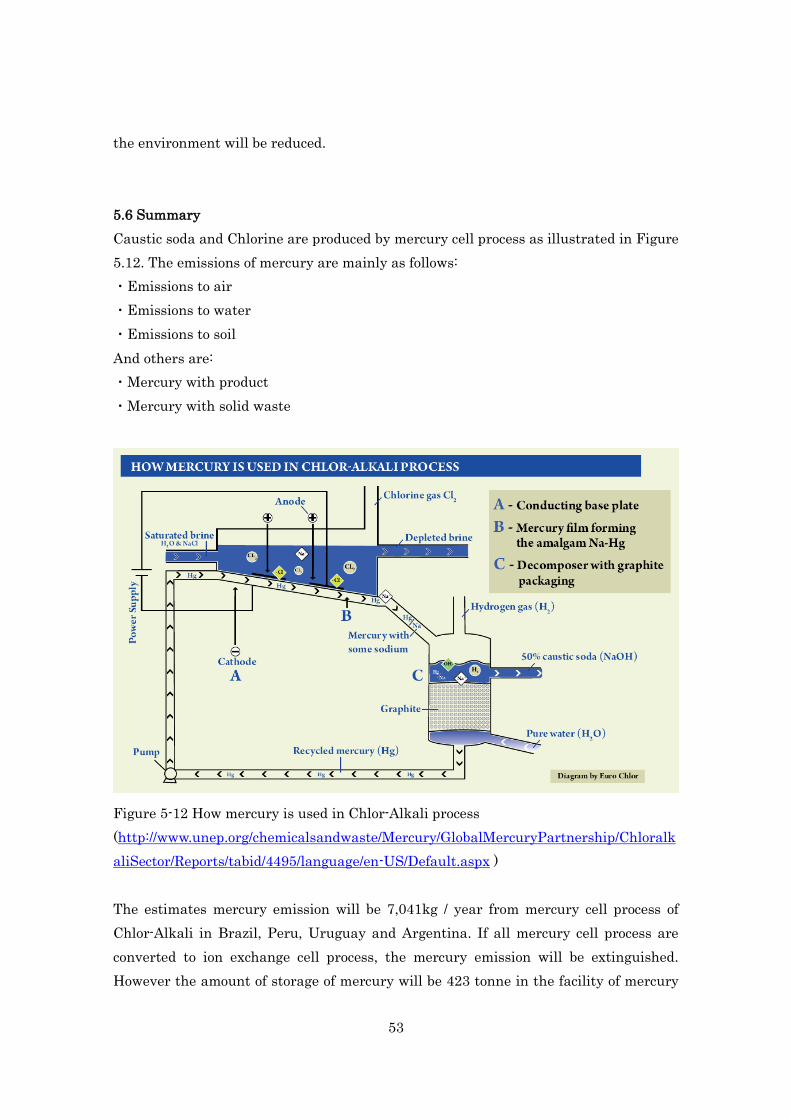
53
the environment will be reduced.
5.6 Summary
Caustic soda and Chlorine are produced by mercury cell process as illustrated in Figure
5.12. The emissions of mercury are mainly as follows:
・Emissions to air
・Emissions to water
・Emissions to soil
And others are:
・Mercury with product
・Mercury with solid waste
Figure 5-12 How mercury is used in Chlor-Alkali process
(http://www.unep.org/chemicalsandwaste/Mercury/GlobalMercuryPartnership/Chloralk
aliSector/Reports/tabid/4495/language/en-US/Default.aspx )
The estimates mercury emission will be 7,041kg / year from mercury cell process of
Chlor-Alkali in Brazil, Peru, Uruguay and Argentina. If all mercury cell process are
converted to ion exchange cell process, the mercury emission will be extinguished.
However the amount of storage of mercury will be 423 tonne in the facility of mercury

54
cell process (the amount is not published in Peru), the treatment of storage mercury and
contaminated equipment by conversion will become a big issue.

55
Chapter 6 Presentation in Workshop
Ion-exchange membrane technology and CTCN was presented in CloroSur technical
seminar X at Buenos Aires during 16th to 18th November, 2016. The material of
presentation is as follows. The number of attendees is between 70 and 80 mainly
Industries.
Figure 6-1 Presentation at CloroSur technical seminar X
Overview of CloroSur technical seminar X
・Date 16-18 November, 2016
・Time 10:30-10:55 including Q&A
・Attendees Chlor-Alkali Industries in South America etc.
・Venue Hotel Hilton Madero (Buenos Aires)

56
Figure 6-2 Presentation at CloroSur technical seminar X No1
Figure 6-3 Presentation at CloroSur technical seminar X No2

57
Figure 6-4 Presentation at CloroSur technical seminar X No3
Figure 6-5 Presentation at CloroSur technical seminar X No4
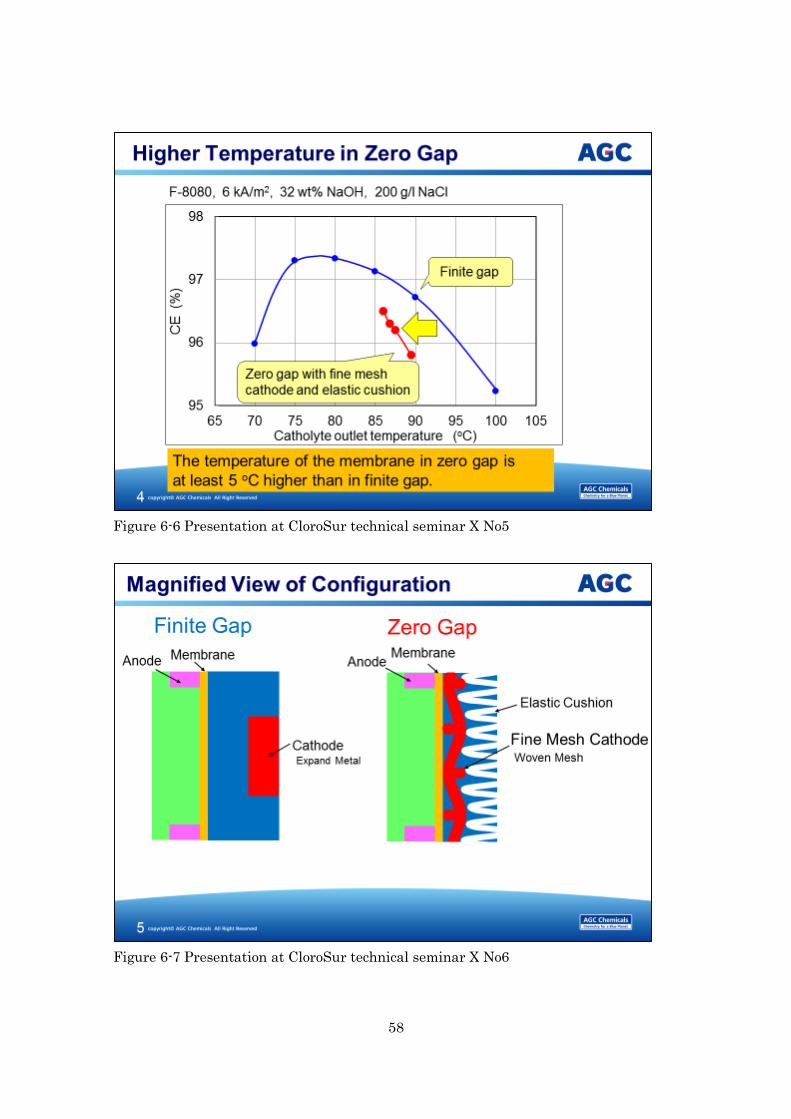
58
Figure 6-6 Presentation at CloroSur technical seminar X No5
Figure 6-7 Presentation at CloroSur technical seminar X No6

59
Figure 6-8 Presentation at CloroSur technical seminar X No7
Figure 6-9 Presentation at CloroSur technical seminar X No8

60
Figure 6-9 Presentation at CloroSur technical seminar X No8
Figure 6-10 Presentation at CloroSur technical seminar X No9

61
Figure 6-11 Presentation at CloroSur technical seminar X No10
Figure 6-12 Presentation at CloroSur technical seminar X No11

62
Figure 6-13 Presentation at CloroSur technical seminar X No12
Figure 6-14 Presentation at CloroSur technical seminar X No13

63
Figure 6-15 Presentation at CloroSur technical seminar X No14
Figure 6-16 Presentation at CloroSur technical seminar X No15

64
Figure 6-17 Presentation at CloroSur technical seminar X No16
Figure 6-18 Presentation at CloroSur technical seminar X No17

65
Figure 6-19 Presentation at CloroSur technical seminar X No18
Figure 6-20 Presentation at CloroSur technical seminar X No19

66
Figure 6-21 Presentation at CloroSur technical seminar X No20
Figure 6-22 Presentation at CloroSur technical seminar X No21
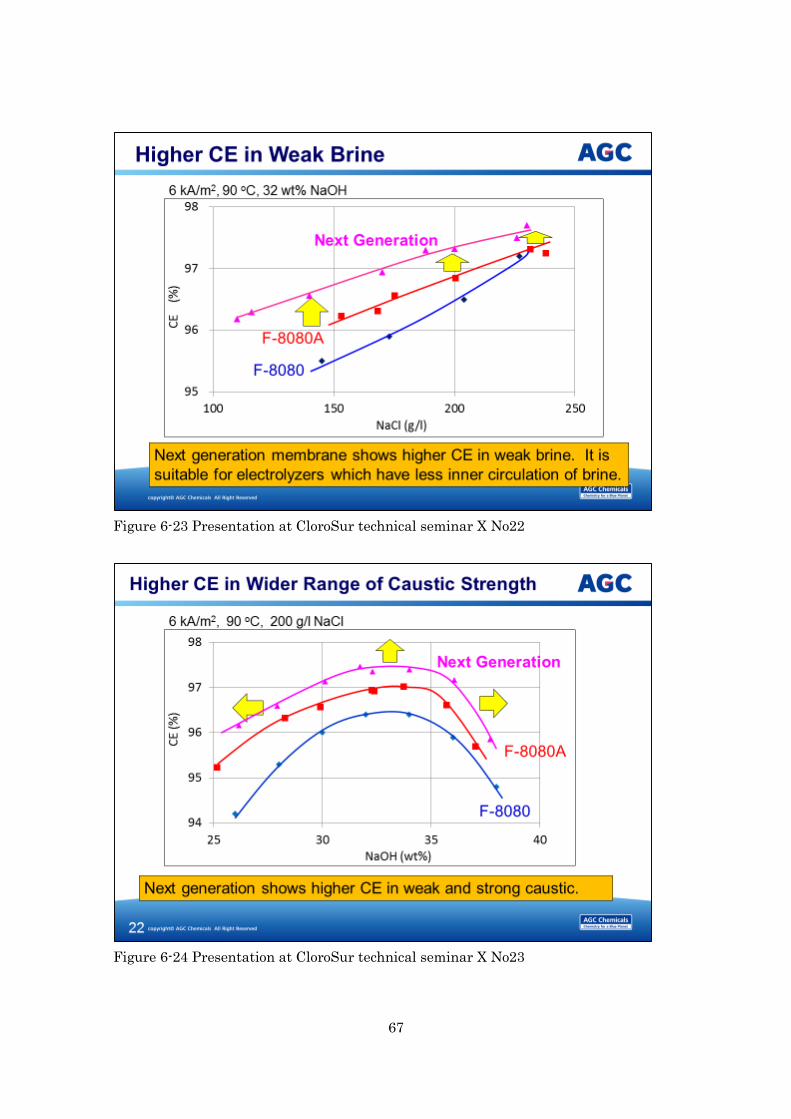
67
Figure 6-23 Presentation at CloroSur technical seminar X No22
Figure 6-24 Presentation at CloroSur technical seminar X No23

68
Figure 6-25 Presentation at CloroSur technical seminar X No24
Figure 6-25 Presentation at CloroSur technical seminar X No25

69
Figure 6-27 Presentation at CloroSur technical seminar X No26
Figure 6-28 Presentation at CloroSur technical seminar X No27

70
Figure 6-29 Presentation at CloroSur technical seminar X No28
Figure 6-30 Presentation at CloroSur technical seminar X No29

71
Figure 6-31 Presentation at CloroSur technical seminar X No30
Figure 6-32 Presentation at CloroSur technical seminar X No31

72
Figure 6-33 Presentation at CloroSur technical seminar X No32
Figure 6-34 Presentation at CloroSur technical seminar X No.33

73
Figure 6-35 Presentation at CloroSur technical seminar X No34
Figure 6-36 Presentation at CloroSur technical seminar X No35
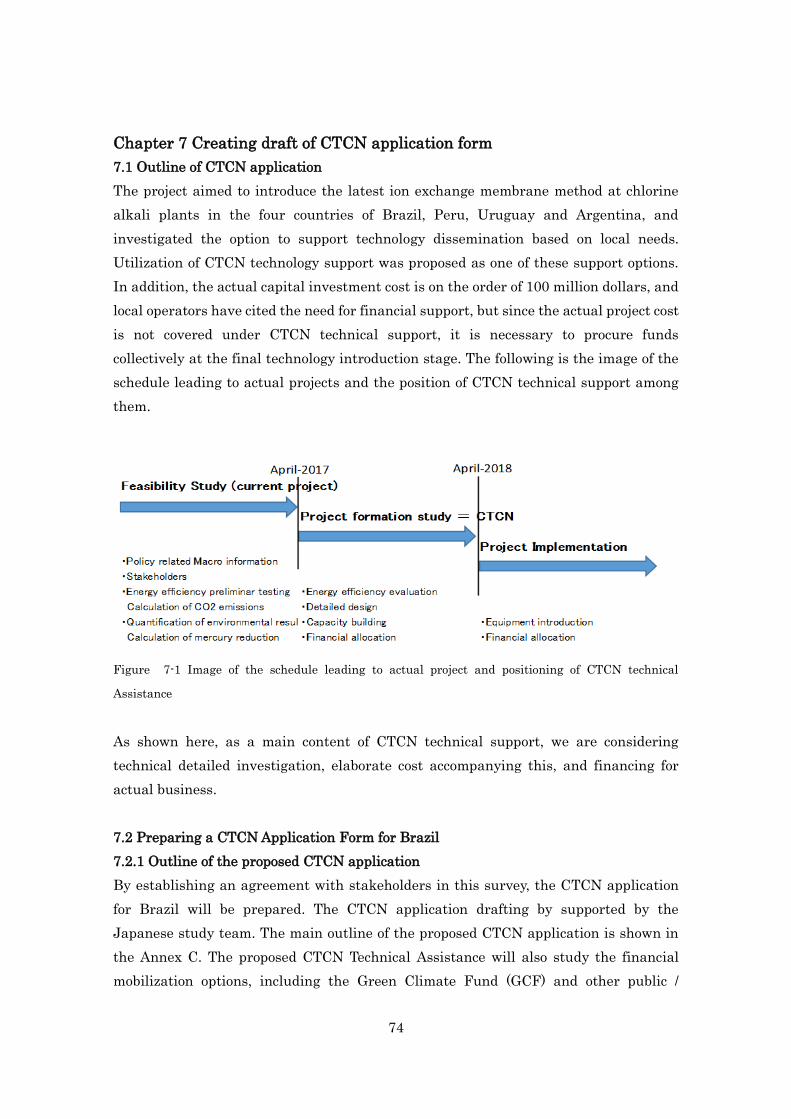
74
Chapter 7 Creating draft of CTCN application form
7.1 Outline of CTCN application
The project aimed to introduce the latest ion exchange membrane method at chlorine
alkali plants in the four countries of Brazil, Peru, Uruguay and Argentina, and
investigated the option to support technology dissemination based on local needs.
Utilization of CTCN technology support was proposed as one of these support options.
In addition, the actual capital investment cost is on the order of 100 million dollars, and
local operators have cited the need for financial support, but since the actual project cost
is not covered under CTCN technical support, it is necessary to procure funds
collectively at the final technology introduction stage. The following is the image of the
schedule leading to actual projects and the position of CTCN technical support among
them.
Figure 7-1 Image of the schedule leading to actual project and positioning of CTCN technical
Assistance
As shown here, as a main content of CTCN technical support, we are considering
technical detailed investigation, elaborate cost accompanying this, and financing for
actual business.
7.2 Preparing a CTCN Application Form for Brazil
7.2.1 Outline of the proposed CTCN application
By establishing an agreement with stakeholders in this survey, the CTCN application
for Brazil will be prepared. The CTCN application drafting by supported by the
Japanese study team. The main outline of the proposed CTCN application is shown in
the Annex C. The proposed CTCN Technical Assistance will also study the financial
mobilization options, including the Green Climate Fund (GCF) and other public /
75
private funds.
7.2.2 Submission process for submission of a draft CTCN application within Brazilian
government
Submission of CTCN technical assistance form is country-led and must be conducted by
the NDE. In the case of Brazil, private sector stakeholders began to exchange
information on technical and financial needs to prepare project proposals.
In this project, discussions between industry representatives (Braskem) and ABICLOR
(Associação Brasileira da Indústria de Álcalis, Cloro e Derivados) were held. The results
of analysis of the needs were conveyed to the Ministry of the Environment and the
conclusion that the ownership of the project should be in the Ministry of the
Environment came to a conclusion. The Ministry of Environment, which became the
owner of the project, is responsible for submitting CTCN technical support proposal to
Brazilian NDE of Brazilian Ministry of Science and Technology Innovation (MCTI).
MCTI accepts proposals throughout the year, and if the proposal is accepted, it will
organize a panel of experts to evaluate the content focused on emissions reduction.
Other considerations include the balance between adaptation and mitigation projects
and national priorities. When the evaluation is completed and the project is approved,
NDE officially applies the project for CTCN technical support.
Application for CTCN technical support is currently being prepared by MMA with the
cooperation of other stakeholders. The process is summarized in the following figure.
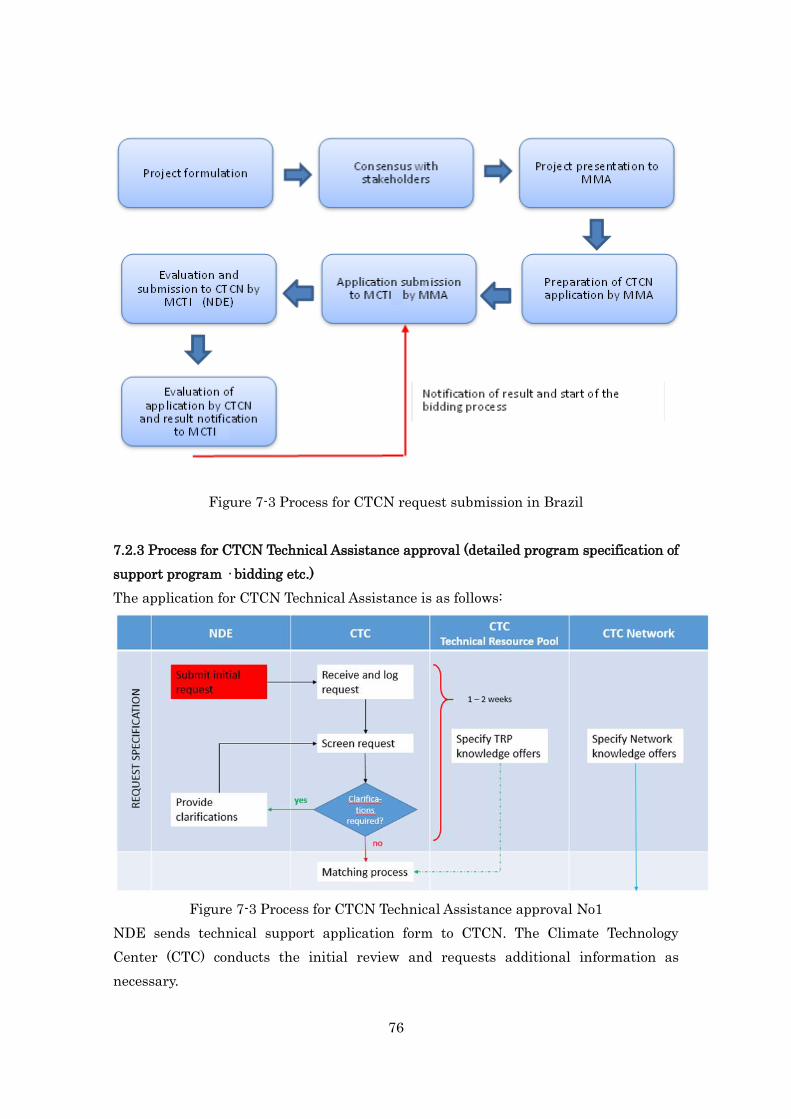
76
Figure 7-3 Process for CTCN request submission in Brazil
7.2.3 Process for CTCN Technical Assistance approval (detailed program specification of
support program · bidding etc.)
The application for CTCN Technical Assistance is as follows:
Figure 7-3 Process for CTCN Technical Assistance approval No1
NDE sends technical support application form to CTCN. The Climate Technology
Center (CTC) conducts the initial review and requests additional information as
necessary.

77
Figure 7-4 Process for CTCN Technical Assistance approval No2
After that, the CTC creates a Request Expert Team (RET) and sends it to the
consortium's technical resource pool, the expert judges the feasibility of the project and
decides the amount to contribute to the project.
Figure 7-5 Process for CTCN Technical Assistance approval No3
Finally, the project is classified as either a quick response (50,000 USD or less) or a
response project (250,000 USD or less). Through this step, CTC calls for an open bidding
process in which the proposal is evaluated competitively. An organization that won the
project can undertake a project.
78
7.3 Information gathering on CTCN technical support project at COP 22
Information on CTCN technical support project was compiled at COP 22 of UNFCCC
held in Morocco (Marrakech) in December 2016. Specifically, the team participated in
CTCN side events and exchanged views on individual projects with officials of the
CTCN secretariat, and confirmed the consistency of this project and the CTCN support
project.
7.4 Future support towards CTCN application, etc.
The first plan of the aforementioned CTCN application was provided to the Brazilian
Ministry of Environment in the second field survey. At this time, the team has
confirmed how to proceed with the CTCN application in the future as follows.
· The Ministry of the Environment and Abiclor will discuss and examine the missing
information, information to be added, etc. in the first draft of the CTCN application
form and increase the completeness of the proposed CTCN application proposal.
·The Ministry of Environment will coordinate with the Ministry of Science, Technology,
Innovation, and Communications (NDE). For the first proposed CTCN application form,
the team will also request opinions from NDE and make the corresponding corrections.
· Submission of the final draft of the CTCN application form to the NDE is targeted at
the end of March 2017. At the finalization stage, coordination with the Japanese
research team will be conducted.
The main support contents from Japan in the above process are as follows.
· Finalization of the CTCN application form: In order to complete the first draft of the
CTCN application form, the team will contact the Ministry of Environment and Abiclor
to confirm progress and drafting as necessary.
·Adjustments: Indirect support such as providing information on the latest trends at
CTCN to the Ministry of the Environment for Brazilian inter-ministerial coordination,
including NDC of CTCN. In particular, as the latest trend in CTCN, we will provide
information on the decision-making process up to CTCN budget allocation and
decision-making decision and speed up adjustment within ministries and agencies.
· Deliberation at CTCN: Once the CTCN application is submitted from Brazilian NDE
to CTCN, follow-up of this case will be held at the international negotiation site. The
team will also contact the NDE of CTCN in Japan to carefully advance deliberations on
this case.
· CTCN project tender process: After CTCN approves this proposal, A tender process for

79
project implementation is scheduled to be conducted by UNIDO. The team will prepare
the application in the future and continue to obtain funds for the project
implementation as well.

80
Chapter 8 Compilation of the report
For this project, the feasibility of the CTCN project was researched in Brazil, Uruguay,
Peru and Argentina. Future prospects, schedule, tasks to utilize CTCN found through
research is shown below.
8.1 Future Prospects and Schedule
[Brazil]
An initiative was founded for the company and the Ministry of the Environment to
promote the project.
In the future, we will follow up at the Brazilian side and the Japanese side with the aim
of realizing the CTCN technical assistance project.
In parallel, we will continue to support various public and private financing related to
climate change.
[Uruguay]
Procurement of public funds for climate change countermeasures proved to be limited.
We will continue to consider technology transfer and capital investment fund
procurement on a private basis, based on the cooperative relationship between the
business operator and the Environment Directorate.
[Peru]
For the time being, we found that the capacity of the relevant authorities, including the
Ministry of the Environment, is limited.
In the future, first of all, we will investigate the technical needs of business operators
and work towards the dissemination of advanced technologies in Japan.
[Argentina]
Continue to investigate business needs and government policies, etc. and continue to
act towards the dissemination of advanced technologies in Japan.
8.2 Challenges to access CTCN as identified through this study
Matching between prioritized governmental policy areas and specific low carbon
technology (There are some cases which this doesn’t match).
Government policy formulation and implementation capacity (Lack of personnel in
departments and experience of international financing).

81
Latin American countries have different backgrounds and situations even though in the
same region. It is necessary to build an individual matching approach.
Since CTCN's FS is extremely small compared to the cost required for actual business,
it is important to follow the path.
CTCN is sovereign and some company pay careful attention towards involving with
governments etc.
8.3 financing support
This project which introduces Ion exchange membrane method, contributes to energy
saving from its feature of electricity reduction and mercury countermeasure from its
feature of dehydrating mercury technology.
<Funds related to energy conservation>
· It is expected that funds will be obtained from private financial institutions and
venture capital as a general loan project because investment recovery is expected from
the reduction of electricity cost. As an example, domestic banks such as BNDES and
green finance such as MGM Innova should be considered.
· Utilization of low interest rate system and tax preferential treatment etc. for capital
investment for introducing advanced low carbon technology could be considered. A
two-step loan from the World Bank, the American Development Bank, etc. could also be
considered.
· Use of various international support systems to support the dissemination of global
warming countermeasure technology to developing countries. As an example, funds
such as GEF, GCF should be considered.
<Fund for promoting dehydrating mercury>
· The GEF is preparing funds for supporting projects in developing countries in the
fields of chemical substances and waste management. The financial mechanism of the
Minamata Convention on mercury is also offered through the GEF. This is a grant aid
for capacity-building and survey other than actual implementation of project.
JBIC is a fund procurement option other than the above two, with the aim of supporting
Japanese companies’ oversea activities. It is possible to finance at an interest rate lower
than the local general interest rate. The core technologies of ion exchange membrane
and electrolytic cell which are used in this project are made in Japan by Japanese
companies. This matches the scope of JBIC financing.

82
In this survey, the procurement strategies of these funding options were presented to
local stakeholders in accordance with the medium / long term schedule concerning the
introduction of ion exchange membrane technology. As in the example of the figure
below, the period until the goal of the complete elimination of mercury law in 2025 is
defined as the agreement formation stage (Preparation in the figure), technical detailed
investigation · conversion planning stage (Feasibility Study in the figure), construction
stage (Technology Deployment in the figure), and examined the funds option according
to the activities of each stage.
Figure 8-1 Example of funding options procurement strategy

83
For Brazil, the following example is considered as a specific financing option.
Figure 8-2 Example of funding options procurement strategy (Brazil)
JBIC should be followed up concretely among the aforementioned funding options. In
addition, local contents such as electricity distribution that is not within the range
covered by JBIC is handled by domestic banks, although in Brazil, from the results of
the experience of BNDES providing co-finance to a similar project, JBIC loan is an
option we would like to continue considering.
Regarding the acquisition of international funds as well, follow up will follow tracing
the flow of contributions from Japan to secure funds. This fiscal year, we specifically
worked on acquiring CTCN support, but it is desired that Japan would also act
concretely to acquire funding from the GEF as well. By doing so, it is expected that
Japan's advanced low-carbon technology will spread overseas and contribute to
mitigating climate change.
(End of Report)

84
Appendix
A. List of bibliographic survey source
B. Presentation for stakeholders
C. CTCN request submission draft

85
A. List of bibliographic survey source
Brazil
[Brazil – Energy Saving Policy]
Brazil Energy efficiency report
(https://library.e.abb.com/public/c6d0b52cc84505a2c1257be80052c5a7/Brazil.pdf).
BRIC’s up energy efficiency: energy and climate policies in Brazil, Russia, India and
China
(https://library.e.abb.com/public/c6d0b52cc84505a2c1257be80052c5a7/Brazil.pdf).
Public policies for energy efficiency in Brazil
(http://www.esaf.fazenda.gov.br/cooperacao_tecnica/acoes-de-cooperacoes/i-dialogo-fin
ancas/pl_seminario).
Chapter 3: Outlook of Brazil and its development trend(ブラジルの概況と開発動向)
(http://www.mofa.go.jp/mofaj/gaiko/oda/shiryo/hyouka/kunibetu/gai/brazil/pdfs/kn09
_03_01.pdf#search='%E5%9B%BD%E5%AE%B6%E6%B0%97%E5%80%99%E5%A4
%89%E5%8B%95%E8%A8%88%E7%94%BB%EF%BC%88PNMC%EF%BC%89%E3
%83%96%E3%83%A9%E3%82%B8%E3%83%AB').
Trade and Environment Review 2009/2010
(http://www.inee.org.br/down_loads/eficiencia/Artigo_INEE_UNCTAD.pdf).
[Brazil – Activities by Industries]
Goldman Sachs
(http://www2.goldmansachs.com/japan/gsitm/column/emerging/brics_sp/brazil.html).
[Brazil - Economic Situation Surrounding Industries]
Japanese Embassy in Brazil (http://www.br.emb-japan.go.jp/files/000191859.pdf).
OECD (http://www.oecd.org/eco/outlook/brazil-economic-forecast-summary.htm).
[Brazil - Policy Related to the Minamata Convention]
Caustic Soda Market in Brazil: 2016-2020 Review
(http://www.researchandmarkets.com/research/2zbvts/caustic_soda).

86
DRAFT SUBMISSION BY BRAZIL, Information on mercury emissions and releases
(http://www.unep.org/chemicalsandwaste/Portals/9/Mercury/Documents/INC5/Submi
ssions/Brazil.pdf).
Abiclor (http://Abiclor.com.br/relatorio2014/en-soda-caustica.html).
Peru
[Peru – Energy Saving Policy]
Peru – Energy policy, laws and regulations handbook, volume 1, strategic information
and basic laws
Corporacion Andina de Fomento (CAF). 2016. Estado de la eficiencia energética en
Perú: identificación de oportunidades. Pg.7.
Energypedia (https://energypedia.info/wiki/Peru_Energy_Situation).
[Peru – Activities by Industries]
Overview of major industries in Peru (JETRO)
(https://www.jetro.go.jp/world/cs_america/pe/others/pdf/minerals.pdf).
Corporacion Andina de Fomento (CAF). 2016. Estado de la eficiencia energética en
Perú: identificación de oportunidades. Pg.18.
[Peru - Economic Situation Surrounding Industries]
JBIC
(https://www.jbic.go.jp/wp-content/uploads/reference_ja/2013/12/16071/201401_joi_
mori.pdf).
[Peru - Policy Related to the Minamata Convention]
Argentina
[Argentina – Energy Saving Policy]
IEA (http://www.iea.org/policiesandmeasures/pams/argentina/).
[Argentina – Activities by Industries]
The World Bank (http://www.worldbank.org/en/country/argentina/overview).

87
[Argentina - Economic Situation Surrounding Industries]
The World Bank (http://www.worldbank.org/en/country/argentina/overview).
[Argentina - Policy Related to the Minamata Convention]
UNIDO
(https://www.unido.org/fileadmin/user_media_upgrade/What_we_do/Topics/Resource-
efficient__low-carbon_production/201312_mercury_final_web.pdf).
Uruguay
[Uruguay – Energy Saving Policy]
Renewable Energy Policy Brief Uruguay
(http://www.irena.org/DocumentDownloads/Publications/IRENA_RE_Latin_America_
Policies_2015_Country_Uruguay.pdf).
Uruguay 2015 (https://eneken.ieej.or.jp/data/6237.pdf).
INDC
(http://www4.unfccc.int/submissions/INDC/Published%20Documents/Uruguay/1/IND
C%20Uruguay%20(English-unofficial%20translation).pdf).
Ministerio de Industria, Energia y Mineria de Uruguay (MIEM), Direccion Nacional
de Energia (DNE).
Ministry of Industry, Energy and Mining (MIEM) (2015). Plan Nacional de Eficiencia
Energetica (2015-2024).
(http://www.dne.gub.uy/web/energia/-/miem-publico-material-de-difusion-del-plan-na
cional-de-eficiencia-energetica).

88
B. Presentation for stakeholders
(1)Example for related ministries and agencies

89

90

91

92

93

94
(2)Example for Chlor-Alkali Industries

95

96

97

98
C. CTCN Request Submission Draft
Please fill in the form in the grey spaces, by following the instructions in italic.
Requesting country: Brazil
Request title: Feasibility Study (FS) of Energy-Efficient Caustic Soda Production
Process
Contact information:
{Please fill in the table below with the requested information. The request proponent is the
organization that the request originates from, if different from the National Designated Entity
(NDE).}
National Designated Entity Request Applicant
Contact person: Mr. Márcio Rojas da Cruz (To be
confirmed)
Ms Leticia Reis de Carvalho
Position: Coordinator for Global Climate
Change
Director, Department of
Environmental Quality
Organization: Ministry of Science, Technology and
Innovation
Ministry of the Environment,
Secretariat of Climate Change and
Environmental Quality
Phone: +55 61 2033 7923 +55 61 2028 2070
Fax:
Email: [email protected],
Postal address: Esplanada dos Ministérios, Bloco E.
Brasília - DF, Brazil. 70067-900
SEPN 505 – Bloco B – Sala T-20 –
Terreo 70730-542 – Brasilia-DF
CTCN Technical Assistance
Request Submission Form

99
Technology Needs Assessment (TNA):
{Select one of the three boxes below:}
The requesting country has conducted a TNA in .... (please insert date of TNA completion)
The requesting country is currently conducting a TNA
The requesting country has never conducted a TNA
{If the requesting country has completed a TNA, please indicate what climate technology
priority this request directly relates to. Please indicate reference in TNA/TAP/Project Ideas.}
CTCN Request Incubator Programme:
{Please indicate if this request was developed with support from the Request Incubator
Programme:}
Yes
No
Geographical focus:
{Select below the most relevant geographical level for this request:}
Community-based
Sub-national
National
Multi-country
{If the request is related to the sub-national or multi-country level, please indicate here the
areas concerned (provinces, states, countries, regions, etc.)}
Theme:
{Select below the most relevant theme(s) for this request:}
Adaptation to climate change
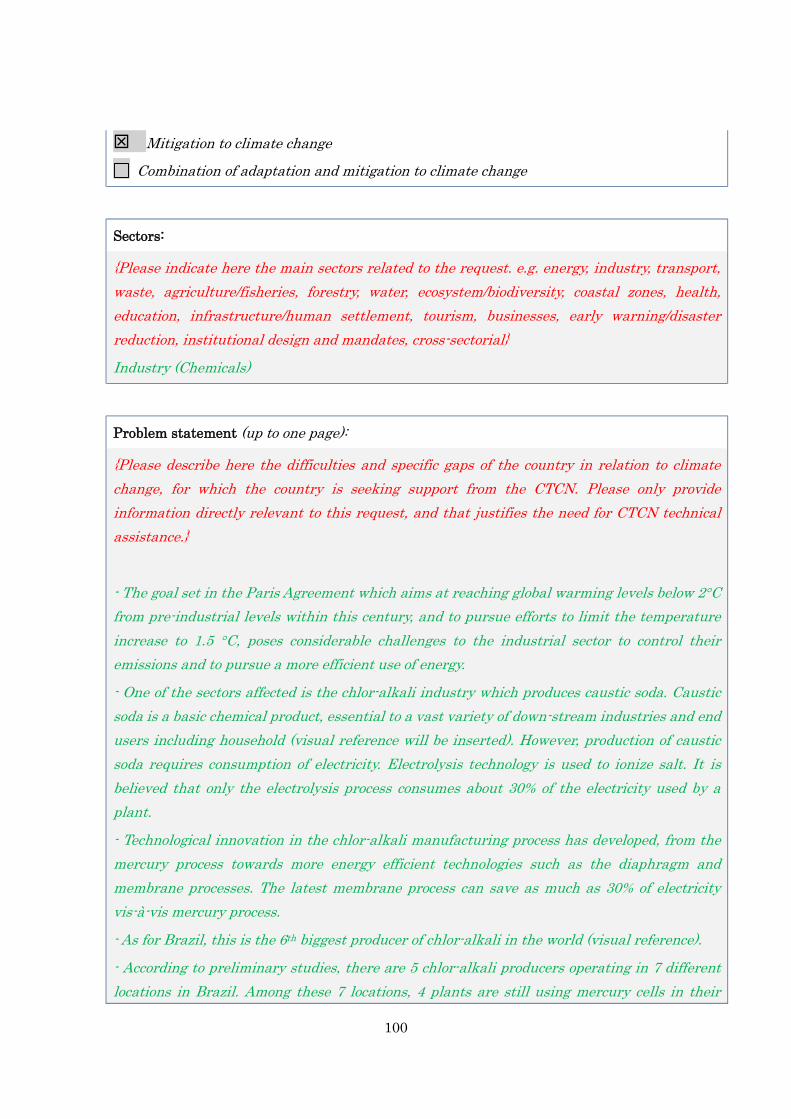
100
Mitigation to climate change
Combination of adaptation and mitigation to climate change
Sectors:
{Please indicate here the main sectors related to the request. e.g. energy, industry, transport,
waste, agriculture/fisheries, forestry, water, ecosystem/biodiversity, coastal zones, health,
education, infrastructure/human settlement, tourism, businesses, early warning/disaster
reduction, institutional design and mandates, cross-sectorial}
Industry (Chemicals)
Problem statement (up to one page):
{Please describe here the difficulties and specific gaps of the country in relation to climate
change, for which the country is seeking support from the CTCN. Please only provide
information directly relevant to this request, and that justifies the need for CTCN technical
assistance.}
- The goal set in the Paris Agreement which aims at reaching global warming levels below 2C
from pre-industrial levels within this century, and to pursue efforts to limit the temperature
increase to 1.5 C, poses considerable challenges to the industrial sector to control their
emissions and to pursue a more efficient use of energy.
- One of the sectors affected is the chlor-alkali industry which produces caustic soda. Caustic
soda is a basic chemical product, essential to a vast variety of down-stream industries and end
users including household (visual reference will be inserted). However, production of caustic
soda requires consumption of electricity. Electrolysis technology is used to ionize salt. It is
believed that only the electrolysis process consumes about 30% of the electricity used by a
plant.
- Technological innovation in the chlor-alkali manufacturing process has developed, from the
mercury process towards more energy efficient technologies such as the diaphragm and
membrane processes. The latest membrane process can save as much as 30% of electricity
vis-à-vis mercury process.
- As for Brazil, this is the 6th biggest producer of chlor-alkali in the world (visual reference).
- According to preliminary studies, there are 5 chlor-alkali producers operating in 7 different
locations in Brazil. Among these 7 locations, 4 plants are still using mercury cells in their

101
production processes; Unipar Carbocloro located in Sao Paulo, one of the biggest chlor-alkali
producers in Brazil, followed by Braskem S.A. located in Bahia, Produquimica located in
Pernambuco, and Katrium Industrias Quimicas S.A. (previously Pan-Americana) located in
Rio de Janeiro.
- Although conversion to membrane process can benefit from a considerable reduction in
energy consumption, it has proven to be considerably costly (in the range of hundred million
dollars). Hence, channeling financial support is needed to conduct the conversion work.
- The exact financial needs vary depending on in-depth engineering designs. In order to
identify the most appropriate technical design for each chlor-alkali plant, an international
expert team will be indispensable.
- In addition, all these actions need to be coordinated with the stakeholders, especially the
climate and environmental authorities, in order to properly align with national strategies and
environmental goals. To this end, it is desirable that a climate mitigation action such as
introducing energy efficient membrane technologies will be quantitatively accounted through
MRV schemes. This is another area where an international technical expert will play an
important role to fulfill the task.
- Furthermore, chlor-alkali industries are facing the challenge of the mercury phase-out target
by year 2025, as declared in the Minamata Convention on Mercury. It is believed that
international technical assistance will help industries to achieve the assumed international
responsibilities.
- As described above, a feasibility study is planned with the CTCN Technical Assistance for: 1)
In-depth analyses of technology conversion, which includes: a) In-depth engineering designing
to install membrane cell processes and b) detailed cost estimations for these works; and 2)
alignment with national climate change strategies, including MRV development and
coordination with the concerned authorities.
Past and ongoing efforts (up to half a page):
{Please describe here past and on-going processes, projects and initiatives implemented in the
country to tackle the difficulties and gaps explained above. Explain why CTCN technical
assistance is needed to complement these efforts, and how the assistance can link or build on
this previous work.}

102
<Past and on-going processes, projects and initiatives>
1) Promoting energy efficiency for the industry sector
a) Brazilian government
(to be filled by OECC with ref. the Third communication to the UNFCCC)
b) Industries/associations (to be filled by Abiclor?)
(- Conversion works already in progress by individual industries’ initiatives, technical
guidance published by Abiclor with assistance from World Chlorine Council, etc.)
c) Collaboration between the private sector and the government to raise the issue’s profile
within the national priorities
- The chlo-alkali industries, industry associations, and Brazilian government have succeeded
in raising the conversion process as one of the most important national environmental
priorities. They have advocated the importance of conversion to membrane technologies, by
jointly organizing workshops with government agencies, consulting with foreign assistance
programs, and presenting the issue at the international fora.
Assistance requested (up to one page):
{Please describe here the scope and nature of the technical assistance requested from the
CTCN and how this could help address the problem stated above and add value vis-à-vis the
past and on-going efforts. Please note that the CTCN facilitates technical assistance and is not
a project financing mechanism.}
Nature of the CTCN technical assistance: Feasibility Study
The CTCN technical assistance will support a feasibility study (FS) for the Brazlian
chlor-alkali industries to convert from the energy consuming process to a highly efficient
membrane process. This FS will consist of two parts, as follows:
1) In-depth analyses of technology conversion:
a) In-depth engineering designing: Technical experts will survey the chlor-alkali plants and

103
conduct an energy efficiency evaluation of the current technology processes being used for
the caustic soda production. This evaluation will include energy audits to determine
current energy consumption, as well as the detailed engineering designs to fit each of the
plant. (There will be a technical assessment for waste mercury management, which will be
carried out in parallel to the present FS.)
b) Detailed cost estimation: The FS will estimate the costs associated with technology
conversion for each plant. The costs will include import expenses of membrane electrolysis
cells and their installation works, along with their auxiliary equipment which needs to be
replaced, e.g. brine purification and caustic compressors, etc. These results will be
translated into estimation of energy and costs savings for the company.
2) Alignment with national strategies for climate change mitigation actions and sustainable
development
- This project to install membrane cells will contribute Brazil to achieve global climate change
goals under the United Nations Framework Convention to Climate change (UNFCCC) in
terms of emissions reduction. In order to make sure that the chlor-alkali industry’s initiatives
are reflected in national strategies, an appropriate climate change mitigation accounting will
be necessary. In this regard, the precise engineering designs and the energy saving data
resulting from the present FS will be integrated in Brazil’s climate change mitigation actions
and MRV.
- In addition, this project will contribute the Brazil’s efforts towards fulfillment of the
Minamata Convention on Mercury, in terms of phasing out of mercury from industrial uses.
Expected benefits (up to half a page):
{Please outline here the medium and long-term impacts that will result from the CTCN
technical assistance, including how the assistance will contribute to mitigate and/or adapt to
climate change.}
<Medium-term impacts>
Given the huge amount of investment required for the industries to complete the technology
conversion, the results of the FS i.e. the detailed technical engineering and precise cost
analyses, will help the industries access to various funds.

104
<Long-term impacts>
In the successful scenario of fund raising and installation of membrane processes, the expected
long-term benefits will be:
i) Approx. 30% reduction of energy use and CO2 emmissions.
ii) 15% reduction of labour costs for O&M (operation and Maintenance), ibid.
iii) Mercury phase out, and resultant environmental & social benefit within and beyond Brazil
From the climate change mitigation perspective, approximately 75,000 tCO2/year of CO2
reduction (estimates) is expected from installing the membrane processes in 4 sites, if not
more from converting other plants from less efficient processes (e.g. diagphram) into more
efficent membrane processes.
The project is expected to assist achieving Brazil’s Intended National Determined
Contributions (INDC), where the goals to reduce GHG emissions by 37% below 2005 levels in
2025, are expected to come from the industrial sector, through promotion of new standards of
clean technology and enhancement of energy efficiency measures and low carbon
infrastructure.
Also in terms of long-term impacts, the conversion experience in Brazil could be replicated to
other Latin American countries, e.g. Peru and Uruguay, where the mercury processes are sitll
used in the chlor-alkali industry.
Post-technical assistance plans (up to half a page):
{Please describe here how the results of the CTCN technical assistance will be concretely used
by the applicant and national stakeholders, to pursue their efforts of resolving the problems
stated above after the completion of the CTCN intervention (list specific follow-up actions that
will be undertaken).}
After completion of the present FS, channeling funds required for the proposed technology
introduction will be conducted. The conversion works will take place as outlined below:
i) Expected Period: Approx. 36 months

105
ii) Scope:
- Installation of membrane cells at 4 sites*
- Training etc. for plant operators and managers
- Technical assistance regarding excess-mercury management (decommissioning,
contaminated site, etc.)
- Others as necessary.
Note (*): Candidate 4 sites (caustic soda manufacturing plants) are shown below.
( ): Values in parentheses indicates annual production volume of caustic
soda.
iii) Financing plan (to be developed during the FS) :
- Private financial sources (private banks, shareholders, etc.)
- Public finance (multi-/bilateral sovereign loans, Brazilian financial programs, UN
assistance etc.)
Key stakeholders:
{Please list in the table below the main stakeholders who will be involved in the
implementation of the requested CTCN technical assistance, and what their role will be in
supporting the assistance (for example, government agencies and ministries, academic
institutions and universities, private sector, community organizations, civil society, etc.).
Please indicate what organization(s) will be the main/lead counterpart(s) of CTCN experts at
(33kton/y)
(80kton/y)
(3kton/y)
(120kton)

106
national level, in addition to the NDE.}
Stakeholder Role to support the implementation of the
assistance
Ministério da Ciência, Tecnologia,
Inovação e Ccomunicação (TBC)
National Designated Entity (NDE) to the CTCN:
Application of the project and general coordination
with the CTCN
Ministério do Meio Ambiente (MMA)
(TBC)
Project owner and implementing entity (TBC):
Institutional strengthening; coordination with
national government agencies involved, as well as
with the CTCN; support the chlor-alkali industries
to implement its plans in line with national
priorities and policies
Abiclor (Brazilian chlor-alkali industry
association)
Co-owner and co-implementing entity (TBC):
Technical coordination between the Brazilian
chlor-alkali manufacturers and the expert team,
technical advisory to national strategy
development such as NAMA / MRV strategy/ GHG
inventory / etc.
Brazilian Chlor-alkali manufacturers Recipient (TBC): Receive on-site survey, in-depth
engineering designs/cost estimates, financial
planning, national strategy planning such as
NAMA, MRV, etc.
Asahi Glass Co., Ltd. (AGC) Commissioned FS technical expert (TBC):
Technical advisory to the Brazilian manufacturers
related to converting the mercury process
(in-depth engineering and cost estimation), GHG
emission estimates, mercury reduction forecast,
etc.
Overseas Environmental Cooperation
Center, Japan (the OECC)
Commissioned FS technical expert (TBC):
Technical advisory to the Brazilian stakeholders
(state agencies and industries) related to national
strategy development such as NAMA / MRV
strategy/ GHG inventory / etc.

107
Engeneering/Procurement/Construction
(EPC)
Commissioned engineer (TBC): On-site survey,
in-depth engineering designs and cost estimation
Financial sector (Banks, etc.) Commissioned entity (TBC): Financial planning
for conversion for the chlor-alkali manufacturers
Alignment with national priorities (up to half a page):
{Please demonstrate here that the technical assistance requested is consistent with
documented national priorities (examples of relevant national priorities include: national
development plans, poverty reduction plans, technology needs assessments (TNAs), LEDS,
NAMAs, TAPs, NAPs, sectorial strategies and plans, etc.). For each document mentioned,
please indicate where the priorities specifically relevant to this request can be found (chapter,
page number, etc.).}
(TBC) national development plans, poverty reduction plans, technology needs assessments
(TNAs), LEDS, NAMAs, TAPs, NAPs, sectorial strategies and plans, etc. (TBC)(to be filled by
MMA?)
Development of the request (up to half a page):
{Please explain here how the request was developed at the national level and the process used
by the NDE to approve the request before submitting it (who initiated the process, who were
the stakeholders involved and what were their roles, and describe any consultations or other
meetings that took place to develop and select this request, etc.)}
<2016 March (TBC)>
- Brazilian chlor-alkali industry association requested financial support in order to convert
the manufacturing process into more energy efficient membrane process from mercury
process.
<2016 April (TBC)>
- Brazilian government wrote a request letter to the Japanese Embassy requesting for
financial support for Brazilian chlor-alkali industry for converting the mercury process

108
<2016 August >
- A team of Japanese experts proposed to the Brazilian government (Ministry of the
Environment (MMA)), a project to be financed by CTCN.
<2016 November >
- Brazilian Ministry of the Environment and the chlor-alkali industry organized a
consultation meeting with the Japanese experts and the Ministry of Science, Technology,
Innovation and Communication (MCTI)
<2017 February >
- Japanese experts will visit the Braskem facilities and discuss participation in the project.
- Japanese experts will hold meetings with the Brazilian government to discuss
application process to the CTCN and other funds.
(To be filled by MMA? Abiclor?)
Expected timeframe:
{Please propose here a duration period for the assistance requested.}
Feasibility Study Period: Approx. 12 months, expecting to start in 2017
<Main activities of the FS>
- On-site survey & technical designing and cost estimation.
- Financial feasibility assessment by potential inventors.
- GHG reduction forecasts, MRV development, Assistance to develop NAMA & reflection in
the Brazilian INDC.
- Environmental & Social Impact Assessment / stakeholder consultations
- Others
Background documents:
{Please list here relevant documents that will help the CTCN understand the context of the

109
request and national priorities. For each document, provide weblinks if available, to attach to
the submission form while submitting the request. Please note that all documents
listed/provided should be mentioned in this request in the relevant question(s), and that their
linkages with the request should be clearly indicated.}
- Documents concerning national priorities, national development plans, poverty reduction
plans, technology needs assessments (TNAs), LEDS, NAMAs, TAPs, NAPs, sectorial strategies
and plans, etc.) etc,
(To be filled by MMA?)
Monitoring and impact of the assistance:
{Read carefully and tick the boxes below.}
By signing this request, I affirm that processes are in place in the country to monitor and
evaluate the assistance provided by the CTCN. I understand that these processes will be
explicitly identified in the Response Plan in collaboration with the CTC, and that they will be
used in the country to monitor the implementation of the CTCN assistance.
I understand that, after the completion of the requested assistance, I shall support CTCN
efforts to measure the success and effects of the support provided, including its short, medium
and long-term impacts in the country.
Signature:
NDE name:
Date:
Signature:
THE COMPLETED FORM SHALL BE SENT TO THE [email protected]

110
Need help? The CTCN team is available to answer questions and guide you through the
process of submitting a request. The CTCN team welcomes suggestions to improve this form.
>>> Contact the CTCN team at [email protected]