Feasibility Study: Pownal Tannery Superfund Site, Pownal ... · FEASIBILITY STUDY Pownal Tannery...
37
EPA CONTRACT NO. 68-W6-0042 EPA WORK ASSIGNMENT NO. 122-RICO-01N9 EPA Project Officer: Diana King EPA Remedial Project Manager: Leslie McVickar FEASIBILITY STUDY Pownal Tannery Superfund Site Pownal, Vermont July 2002 Prepared By: Metcalf & Eddy, Inc. 30 Harvard Mill Square Wakefield, MA 01880 Team Subcontractor TRC Environmental Corporation Boott Mills South Foot of John Street Lowell, MA 01852
Transcript of Feasibility Study: Pownal Tannery Superfund Site, Pownal ... · FEASIBILITY STUDY Pownal Tannery...
EPA CONTRACT NO. 68-W6-0042 EPA WORK ASSIGNMENT NO. 122-RICO-01N9
EPA Project Officer: Diana King
EPA Remedial Project Manager: Leslie McVickar
FEASIBILITY STUDY
Pownal Tannery Superfund Site
Pownal, Vermont
July 2002
Prepared By:
Metcalf & Eddy, Inc. 30 Harvard Mill Square Wakefield, MA 01880
Team Subcontractor
TRC Environmental Corporation Boott Mills South
Foot of John Street Lowell, MA 01852
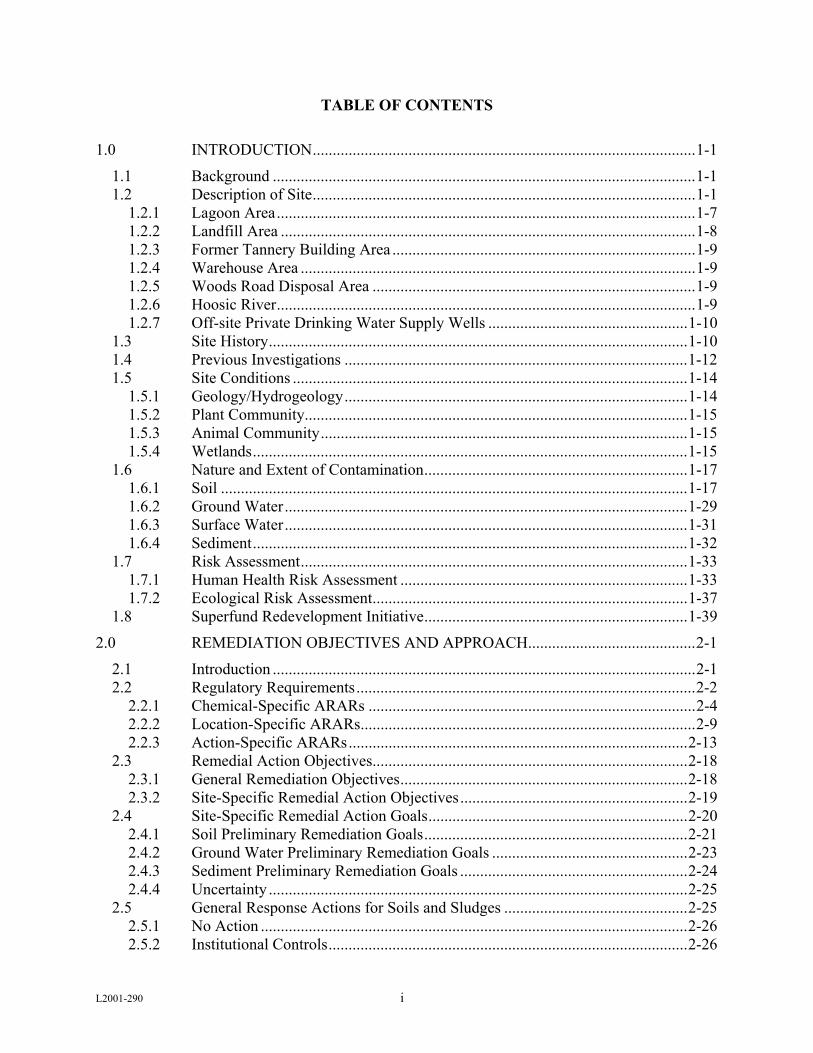
TABLE OF CONTENTS
1.0 INTRODUCTION................................................................................................1-1
1.1 Background ..........................................................................................................1-1 1.2 Description of Site................................................................................................1-1
1.2.1 Lagoon Area.........................................................................................................1-7 1.2.2 Landfill Area ........................................................................................................1-8 1.2.3 Former Tannery Building Area ............................................................................1-9 1.2.4 Warehouse Area ...................................................................................................1-9 1.2.5 Woods Road Disposal Area .................................................................................1-9 1.2.6 Hoosic River.........................................................................................................1-9 1.2.7 Off-site Private Drinking Water Supply Wells ..................................................1-10
1.3 Site History.........................................................................................................1-10 1.4 Previous Investigations ......................................................................................1-12 1.5 Site Conditions ...................................................................................................1-14
1.5.1 Geology/Hydrogeology......................................................................................1-14 1.5.2 Plant Community................................................................................................1-15 1.5.3 Animal Community............................................................................................1-15 1.5.4 Wetlands.............................................................................................................1-15
1.6 Nature and Extent of Contamination..................................................................1-17 1.6.1 Soil .....................................................................................................................1-17 1.6.2 Ground Water.....................................................................................................1-29 1.6.3 Surface Water.....................................................................................................1-31 1.6.4 Sediment.............................................................................................................1-32
1.7 Risk Assessment.................................................................................................1-33 1.7.1 Human Health Risk Assessment ........................................................................1-33 1.7.2 Ecological Risk Assessment...............................................................................1-37
1.8 Superfund Redevelopment Initiative..................................................................1-39
2.0 REMEDIATION OBJECTIVES AND APPROACH..........................................2-1
2.1 Introduction ..........................................................................................................2-1 2.2 Regulatory Requirements.....................................................................................2-2
2.2.1 Chemical-Specific ARARs ..................................................................................2-4 2.2.2 Location-Specific ARARs....................................................................................2-9 2.2.3 Action-Specific ARARs.....................................................................................2-13
2.3 Remedial Action Objectives...............................................................................2-18 2.3.1 General Remediation Objectives........................................................................2-18 2.3.2 Site-Specific Remedial Action Objectives.........................................................2-19
2.4 Site-Specific Remedial Action Goals.................................................................2-20 2.4.1 Soil Preliminary Remediation Goals..................................................................2-21 2.4.2 Ground Water Preliminary Remediation Goals .................................................2-23 2.4.3 Sediment Preliminary Remediation Goals .........................................................2-24 2.4.4 Uncertainty .........................................................................................................2-25
2.5 General Response Actions for Soils and Sludges ..............................................2-25 2.5.1 No Action ...........................................................................................................2-26 2.5.2 Institutional Controls..........................................................................................2-26
L2001-290 i

2.5.3 Containment .......................................................................................................2-26 2.5.4 Removal Actions ................................................................................................2-26 2.5.5 Disposal..............................................................................................................2-26 2.5.6 In-Situ Treatment ...............................................................................................2-27 2.5.7 Ex-Situ Treatment ..............................................................................................2-27
2.6 General Response Actions for Ground Water....................................................2-27 2.7 Volume of Media Requiring Remediation .........................................................2-28
3.0 IDENTIFICATION AND SCREENING OF REMEDIAL TECHNOLOGIES..3-1
3.1 Introduction ..........................................................................................................3-1 3.2 Initial Identification and Screening of Technologies ...........................................3-1
3.2.1 Soils and Sludge ...................................................................................................3-1 3.3 Process Option Evaluation ...................................................................................3-9
4.0 DEVELOPMENT AND SCREENING OF REMEDIAL ALTERNATIVES ....4-1
4.1 Review of Remedial Action Objectives ...............................................................4-1 4.2 Development of Remedial Action Alternatives ...................................................4-1 4.3 Initial Assembly of Remedial Action Alternatives ..............................................4-1 4.4 Description of Remedial Action Alternatives ......................................................4-4
4.4.1 RAA-1 – No Action .............................................................................................4-4 4.4.2 RAA-2 – Limited Action......................................................................................4-4 4.4.3 RAA-3 – Capping in Place, and Institutional Controls........................................4-4 4.4.4 RAA-4 – Excavation, Screening, Consolidation, Capping, and Institutional
Controls ................................................................................................................4-4 4.4.5 RAA-5 – Excavation, Disposal in an Off-Site Landfill, and Institutional
Controls ................................................................................................................4-9 4.4.6 RAA-6 – Excavation, Solidification/Stabilization, Consolidation, and
Institutional Controls............................................................................................4-9 4.4.7 RAA-7 – Excavation, Solidification/Stabilization, Consolidation, Soil Cover
and Institutional Controls .....................................................................................4-9 4.4.8 RAA-8 – Excavation, Screening, Ex-Situ Chemical Oxidation...........................4-9 4.4.9 RAA-9 – In-Situ Chemical Oxidation................................................................4-10 4.4.10 RAA-10 – In-Situ Solidification/Stabilization and Land Use Restrictions........4-10
4.5 Screening of Remedial Action Alternatives.......................................................4-10 4.5.1 RAA-1 – No Action ...........................................................................................4-11 4.5.2 RAA-2 – Limited Action....................................................................................4-11 4.5.3 RAA-3 – Capping in Place, Institutional Controls.............................................4-11 4.5.4 RAA-4 – Excavation, Consolidation, Capping, and Institutional Controls .......4-12 4.5.5 RAA-5 – Excavation, Disposal in an Off-Site Landfill, and Institutional
Controls ..............................................................................................................4-12 4.5.6 RAA-6 – Excavation, Solidification/Stabilization, Consolidation, and
Institutional Controls..........................................................................................4-13 4.5.7 RAA-7 – Excavation, Solidification/Stabilization, Consolidation, Soil Cover
and Institutional Controls ...................................................................................4-13 4.5.8 RAA-8 – Excavation, Screening, Ex-Situ Chemical Oxidation.........................4-13 4.5.9 RAA-9 – In-Situ Chemical Oxidation................................................................4-14 4.5.10 RAA-10 – In-Situ Solidification/Stabilization...................................................4-14
L2001-290 ii

4.6 Summary of Remedial Action Alternatives Retained for Detailed Evaluation .4-15
5.0 DETAILED ANALYSIS OF ALTERNATIVES ................................................5-1
5.1 Introduction ..........................................................................................................5-1 5.2 Evaluation Criteria ...............................................................................................5-1 5.3 Cost Estimation ....................................................................................................5-9 5.4 Detailed Evaluation Results ...............................................................................5-10
5.4.1 Alternative RAA-1: No Action ..........................................................................5-11 5.4.2 Alternative RAA-2: Limited Action ..................................................................5-20 5.4.3 Alternative RAA-3: Capping in Place and Institutional Controls......................5-33 5.4.4 Alternative RAA-4: Excavation, Consolidation, Capping and Institutional
Controls ..............................................................................................................5-54 5.4.5 Alternative RAA-5: Excavation, Consolidation, Solid Waste Landfill Disposal
with Institutional Controls..................................................................................5-68 5.4.6 Alternative RAA-7: Excavation, Consolidation, Capping and Institutional
Controls ..............................................................................................................5-83 5.5 Comparative Analysis of Remedial Alternatives .............................................5-101
5.5.1 Approach to the Comparative Analysis ...........................................................5-106 5.5.2 Comparative Analysis of Remedial Alternatives .............................................5-106
LIST OF FIGURES Figure 1.6-1 Pentachlorophenol Concentrations in Lagoon Soils ..........................................1-19 Figure 1.6-3 Arsenic Concentrations in Lagoon Soils............................................................1-23 Figure 1.6-4 Dioxin Concentrations in Lagoon Soils .............................................................1-25 Figure 2.7-1 Areas Requiring Remediation ............................................................................2-29 Figure 2.7-1 Areas Requiring Remediation ............................................................................2-29 Figure 3.2-1 Evaluation of Remedial Technologies for Soils and Sludges ..............................3-3 Figure 3.3-1 Evaluation of Process Options for Soils and Sludges ........................................3-11 Figure 4.4-1 Alternative RAA-3: Capping in Place, and Land Use Restrictions .....................4-5 Figure 4.4-2 Alternative RAA-4: Excavation, Screening, Consolidation, Capping, and Land
Use Restrictions....................................................................................................4-7
LIST OF TABLES Table 1.6-1: Background Soil Concentrations........................................................................1-18 Table 1.7-1: Summary of Ecological Risks, Pownal Tannery Study Area.............................1-38 Table 2.4-1: Human Health Preliminary Remediation Goals for Soil....................................2-21 Table 2.4-2: Human Health Preliminary Remediation Goals for Ground Water ...................2-23 Table 2.4-3: Human Health Preliminary Remediation Goals for Sediment ...........................2-24 Table 2.5-1: General Response Actions .................................................................................2-25 Table 2.7-1: Estimated Volume of Contaminated Soil Requiring Remedial Action..............2-28 Table 3.3-1: Representative Process Option Summary ............................................................3-9 Table 4.3-1: Range of Alternatives...........................................................................................4-2 Table 4.3-2: Summary of Remedial Action Alternative Components......................................4-3
L2001-290 iii
Table 5.1-1: Alternatives Evaluation Summary .......................................................................5-2 Table 5.4-1: Remedial Alternative Cost Estimates.................................................................5-11 Table 5.4-2: ARAR and TBC Summary for RAA-1, No Action ...........................................5-12 Table 5.4-3: ARAR and TBC Summary for RAA-2, Limited Action....................................5-24 Table 5.4-4: RAA-2 Cost Estimate.........................................................................................5-34 Table 5.4-5: ARAR and TBC Summary for RAA-3, Capping in Place.................................5-40 Table 5.4-6: RAA-3 Cost Estimate.........................................................................................5-51 Table 5.4-7: ARAR and TBC Summary for RAA-4, Consolidation and Capping ................5-59 Table 5.4-8: RAA-4 Cost Estimate.........................................................................................5-69 Table 5.4-9: ARAR and TBC Summary for RAA-5, Excavation and Off-Site Disposal ......5-75 Table 5.4-10: RAA-5 Cost Estimate.........................................................................................5-84 Table 5.4-11: ARAR and TBC Summary for RAA-7, Stabilization and Capping...................5-92 Table 5.4-12: RAA-7 Cost Estimate.......................................................................................5-102
APPENDICES Appendix A ARARs Appendix B Soil Volume Calculations Appendix C Cost Estimates for Remedial Action Alternatives Appendix D Treatability Study Report Appendix E Memoranda Regarding Wetlands Appendix F Cultural Resources Survey Report Appendix G Pownal Tannery Reuse Assessment Appendix H Hoosic River Modeling Report Appendix I FS Addendum Appendix J Summary of Risk Assessment Results
L2001-290 iv
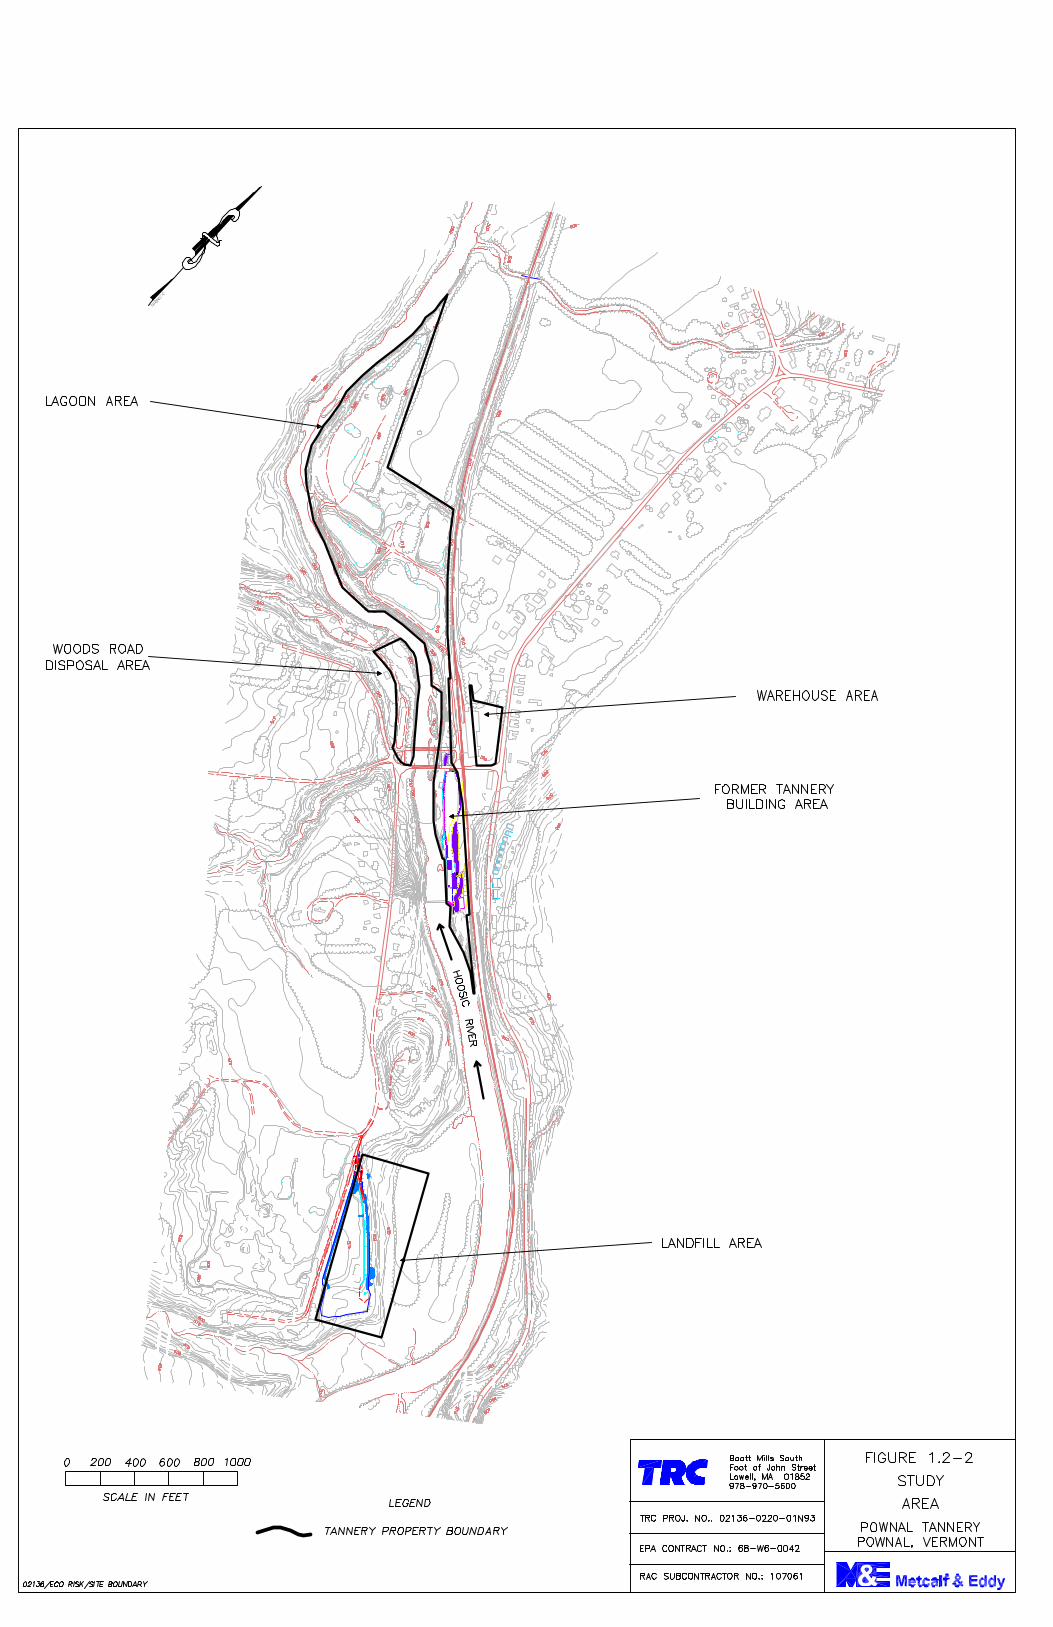
1.0 INTRODUCTION Metcalf & Eddy of Wakefield, Massachusetts (M&E) received Work Assignment (WA) No. 045-RICO-01N9 under the United States Environmental Protection Agency (EPA) Response Action Contract No. 68-W6-0042 (RAC) to complete a Remedial Investigation/Feasibility Study (RI/FS) at the Pownal Tannery Superfund (Site) in North Pownal, Vermont. M&E assigned the primary responsibility for completing most of the RI/FS to TRC Environmental Corporation of Lowell, Massachusetts (TRC). This Feasibility Study Report was prepared in accordance with the National Contingency Plan and EPA RI/FS Guidance. 1.1 Background The Pownal Tannery Superfund Site (the “site”) is located in the village of North Pownal, Bennington County, Vermont along the Hoosic River. The Site is comprised of the former facilities associated with the Pownal Tanning Company. The Pownal Tanning Company operated on the Site from 1936 through 1988 when it declared bankruptcy. Based on the operating practices of the tannery and the propensity for such sites to be the source of uncontrolled contaminant releases to the environment, the Vermont Agency of Natural Resources, Department of Environmental Conservation conducted site inspections and audits while the facility was operational, then commissioned environmental studies of the property after the tannery operations ceased. Based on these inspections, audits and studies, plus subsequent studies conducted by the EPA the State and the Federal Government determined that contaminant releases had occurred and that the site warranted inclusion on the National Priorities List. Subsequent to listing on the National Priorities List, EPA conducted cleanup activities at the site and a Remedial Investigation. The Town of North Pownal also received a Superfund Redevelopment Initiative grant from EPA to examine potential reuse options for the site after remediation. The Town’s desired future use of the site as presented in the re-use assessment report (recreational and sewage treatment plant) was considered in laying out the remedial alternatives described in Section 4.0 of this report. 1.2 Description of Site Figure 1.2-1 shows the location of the Pownal Tannery site in the Village of North Pownal, Bennington County, Vermont, approximately 20 miles southwest of the City of Bennington, Vermont at 42° 47’ 49.8” north latitude and 73° 15’ 56.7” west longitude. Figure 1.2-2 presents a map showing the site property boundaries that encompass the five areas of concern. 1. Lagoon Area 2. Landfill Area 3. Former Tannery Building Area
L2001-290 1-1

L2001-290 1-2

LANDFILL AREA
LAGOON AREA
WAREHOUSE AREA
BASE MAP IS A PORTION OF THE FOLLOWING 7.5’ USGS TOPOGRAPHIC QUADRANGLES:POWNAL, VT, 1954; NORTH POWNAL, VT-NY, 1954, PHOTOREVISED 1980
N
0123
6/PO
WN
AL/
ECO
RIS
K/S
ITE
LOC
ATI
ON
QUADRANGLE LOCATION
Boott Mills South Foot of John Street Lowell, MA 01852 978-970-5600
RAC SUBCONTRACTOR NO.: 107061
SITE LOCATION MAP
EPA CONTRACT NO.: 68-W6-0042
Figure 1.2-1
VT
Metcalf & Eddy
TRC PROJ. NO.: 02136-0220-01N91REMEDIAL INVESTIGATION/FEASIBILITY STUDYPOWNAL TANNERYPOWNAL, VERMONT
&approximate scale in feet
0 1000 2000 3000
WOODS ROAD DISPOSAL AREA
FORMER TANNERY BUILDING AREA

L2001-290 1-4

L2001-290 1-6

4. Warehouse Area 5. Woods Road Disposal Area Two additional off-site areas were included in the Remedial Investigation. 1. Hoosic River 2. Off-site Private Drinking Water Wells A summary of each area studied in the Remedial Investigation is presented in the following sections. 1.2.1 Lagoon Area The Lagoon Area is the only contaminant source area that is specifically addressed in this Feasibility Study. The Lagoon Area consists of four open depressions that represent remnants of the five original tannery lagoons. The area is undeveloped and overgrown with vegetation. Portions of the lagoons have ponded water. A gravel road leads into the site with three locked gates and fences around lagoons 1, 2, and 3. There are earthen berms surrounding each lagoon. One of the Lagoons (Lagoon 3) is filled in and covered with gravel, forming a broad unpaved flat area in the central portion of the lagoons. There are five lagoons on the site. Each lagoon is described below. Lagoon 1: Lagoon 1 occupies 3.3 acres in the southern end of the Lagoon Area. Approximately half of the site (1.7 acres) is wetland. There is up to eight feet of sludge (approximately 27,400 cubic yards) in Lagoon 1 that is underlain by gravel, and overlain by about one foot of soil and one foot of clay. Pursuant to a Consent Order with the VT DEC, Lagoon 1 was closed in place in 1983. The closure consisted of removal of the surface water and the construction of a cap consisting of a layer of lime (reportedly for odor control) and 12 to 18 inches of clay. The surface of Lagoon 1 has subsequently subsided, forming a depression on the top of the cover. Lagoon 2: Lagoon 2 is adjacent to the northern boundary of Lagoon 1, and occupies 1.6 acres. While the tannery was operational, an undocumented amount of sludge was removed from Lagoon 2 and disposed in the landfill. No sludge was observed in Lagoon 2 during the Remedial Investigation. This lagoon is currently uncapped and contains ponded water with approximately 1 acre of wetlands. Lagoon 3: Lagoon 3 is comprised of two sub-lagoons, referred to as 3A and 3B (total acreage 1.1 acres). In 1993, Lagoon 3 was capped in place with lime and 12 to 18 inches of clay. Containers of fuel oil, sawdust, rags, lignosulfonate filler, finishing materials (including solvents), burned wood and chromium III crystals were discovered in Lagoon 3 in 1987 and were removed by the Pownal Tanning Company. Lagoon 3A contains up to 8 feet of sandy black sludge, covered with 2 feet of soil and one foot of gravel or lime. Lagoon 3B contains up to 8 feet of clayey sludge mixed with gravel and sand (approximately 11,400 cubic yards of sludge). A layer of gravel and soil is now present over most of this Lagoon, resulting in a flat upper surface with no wetlands.
L2001-290 1-7

Lagoon 4: Lagoon 4 is the largest lagoon (9.4 acres), located at the northern end of the Lagoon Area, bordering the Hoosic River. A portion of Lagoon 4 is covered with a foot of clay and lime. No sludge was noted in Lagoon 4, but a layer of soil/fill is present up to 12 feet thick, underlain by gravel. There are approximately 6 acres of wetlands in Lagoon 4. Lagoon 5: Lagoon 5 occupies 2 acres south of Lagoon 4, west of Lagoon 1, and is bounded to the east and south by the Hoosic River. A 6 to 8 foot deep pond covers much of Lagoon 5 and approximately 1.2 acres are wetlands. A discharge culvert exists at Lagoon 5, which may be opened to allow water to discharge to the Hoosic River. Lagoon 5 contains approximately 6,600 cubic yards of sludge. 1.2.2 Landfill Area The landfill was constructed onsite to dispose of dewatered pressed sludge from the lagoons. The landfill occupies approximately 54,100 square feet and consists of four cells, three of which are filled and were capped by EPA in 2001. The landfill is approximately 400 feet long and varies from 80 to 200 feet wide. The landfill was constructed so that the liner beneath the sludge landfill was at least 10 feet above the water table. The landfill liner consists of a 36-mil Hypalon liner overlain by 12 inches of sand. Above this layer, 4-inch diameter perforated PVC leachate collection pipes were placed within an 18-inch layer of crushed stone, and covered with 6 inches of gravel. Sludge was placed above the liner in a layer that is between 6 and 13 feet thick. There is a leachate collection system which was upgraded by EPA at the same time that the landfill was capped. It is believed that the leachate system beneath the landfill previously leaked since leachate was observed discharging to the surface in seeps downhill of the landfill. Surface water runoff from the landfill combines with ground water seeps at the base of the slope below the landfill and flows through wetlands located adjacent to the Hoosic River. In 2001, EPA closed the former sludge landfill as part of a Non-Time Critical Removal Action (NTCRA) at the site. A RCRA Subtitle C cover was placed on the landfill, the leachate tank was repaired and upgraded with alarms and the area was fenced. The landfill now has three passive gas vents with no emission controls. Consequently, per EPA direction, this Feasibility Study Report does not address the landfill since EPA believes that the only recognized source of contamination in this area (the landfill) was fully addressed and no further remedial work is needed to address contaminant sources at the landfill.
L2001-290 1-8

1.2.3 Former Tannery Building Area The former tannery building occupied approximately 170,000 square feet. The original northern and central portion of the building was primarily of brick construction with a partially earthen floor. The building was four stories tall including the basement. Prior to the beginning of the Remedial Investigation, the Tannery Building was decontaminated and demolished by the United States Army Corps of Engineers for EPA as part of the NTCRA. In addition, a large volume of soil was excavated from inside the building footprint, all known underground piping was removed, and several underground manways were filled and closed. Portions of the original building foundations remain underground in some places, and the entire site was regraded and finished with grass, crushed rock and stone. Per EPA direction, this Feasibility Study Report does not address the former tannery building area since the EPA believes that as a result of the USACE actions taken on this portion of the site, all potential contaminant source areas were addressed. 1.2.4 Warehouse Area This area includes an active warehouse building that was formerly used for storing hides. EPA closed and decontaminated several manholes, pits and drains in the warehouse that were filled with soil, sludge, and wood chips at this area during the NTCRA. EPA also removed a small number of overpacked drums and an accumulation of potentially asbestos containing materials. 1.2.5 Woods Road Disposal Area The Woods Road Disposal Area was not originally recognized as a separate disposal area during the planning stages of the Remedial Investigation. However, during site reconnaissance, evidence of tannery waste was identified in the western Hoosic River bank, north of the bridge and the original investigative program was expanded to include a test pit investigation. After TRC excavated the test pits in this area and received the laboratory results, the USACE and EPA decided to remove the waste materials from the site as part of the NTCRA. Most of the samples collected by TRC in this area represent samples from material that is no longer present at the site. As a result, at the direction of EPA, human health and ecological exposures were not evaluated for this area and EPA considers that the former contaminant source has been addressed. 1.2.6 Hoosic River The Hoosic River represents a Class B Water as defined by the Vermont Water Resources Board (1997). Class B waters have an objective of providing water quality that consistently exhibits good aesthetic value and to provide high quality habitat for aquatic biota, fish and wildlife. Uses of Class B waters include public water supply (with filtration and disinfection); irrigation and other agricultural uses; swimming and recreation. The Hoosic River is also classified as a Cold Water Fish Habitat (i.e., suitable for coldwater fish such as trout).
L2001-290 1-9
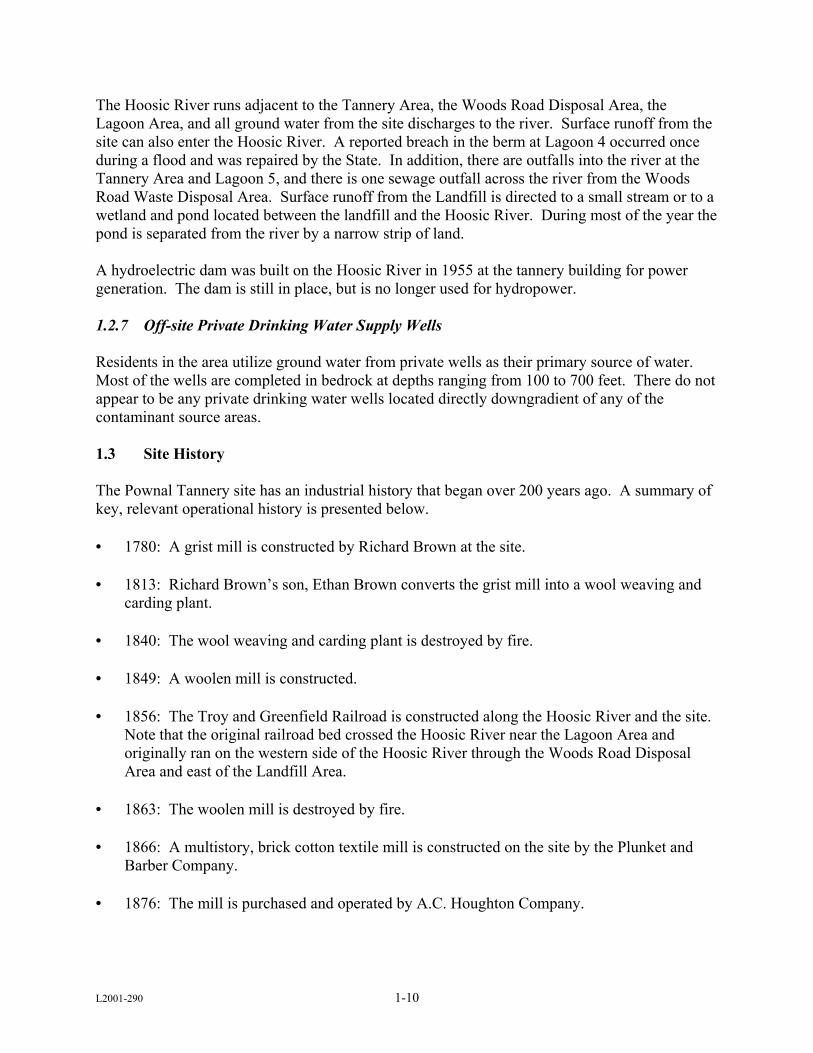
The Hoosic River runs adjacent to the Tannery Area, the Woods Road Disposal Area, the Lagoon Area, and all ground water from the site discharges to the river. Surface runoff from the site can also enter the Hoosic River. A reported breach in the berm at Lagoon 4 occurred once during a flood and was repaired by the State. In addition, there are outfalls into the river at the Tannery Area and Lagoon 5, and there is one sewage outfall across the river from the Woods Road Waste Disposal Area. Surface runoff from the Landfill is directed to a small stream or to a wetland and pond located between the landfill and the Hoosic River. During most of the year the pond is separated from the river by a narrow strip of land. A hydroelectric dam was built on the Hoosic River in 1955 at the tannery building for power generation. The dam is still in place, but is no longer used for hydropower. 1.2.7 Off-site Private Drinking Water Supply Wells Residents in the area utilize ground water from private wells as their primary source of water. Most of the wells are completed in bedrock at depths ranging from 100 to 700 feet. There do not appear to be any private drinking water wells located directly downgradient of any of the contaminant source areas. 1.3 Site History The Pownal Tannery site has an industrial history that began over 200 years ago. A summary of key, relevant operational history is presented below. • 1780: A grist mill is constructed by Richard Brown at the site. • 1813: Richard Brown’s son, Ethan Brown converts the grist mill into a wool weaving and
carding plant. • 1840: The wool weaving and carding plant is destroyed by fire. • 1849: A woolen mill is constructed. • 1856: The Troy and Greenfield Railroad is constructed along the Hoosic River and the site.
Note that the original railroad bed crossed the Hoosic River near the Lagoon Area and originally ran on the western side of the Hoosic River through the Woods Road Disposal Area and east of the Landfill Area.
• 1863: The woolen mill is destroyed by fire. • 1866: A multistory, brick cotton textile mill is constructed on the site by the Plunket and
Barber Company. • 1876: The mill is purchased and operated by A.C. Houghton Company.
L2001-290 1-10

• 1915: A train freight station (located on the western bank of the Hoosic River) is demolished by a train wreck.
• 1920 (approximate): A second set of railroad tracks is constructed along the eastern side of
the Hoosic River, and the tracks on the western side are abandoned. • 1931: The cotton mill ceases operation. • 1936: The mill is refurbished by the Pownal Tanning Company and opens as a cow and
sheep hide tanning operation. The operation consists of hide cleaning (beaming) using a variety of chemicals (pesticides, solvents), hydrochemical stabilization of the purified leather (tanning) using trivalent chromium, dyeing and lubrication of the tanned leather, followed by pasting and finishing of the leather into a variety of textures and thicknesses for commercial sale.
• 1939: A steel truss bridge is erected across the Hoosic River north of the former tannery
building. • 1940: The mill building is expanded. • 1955: A hydroelectric dam is constructed across the Hoosic River to power the adjacent
former tannery building and associated hydroelectric machinery is installed at the site. • 1962: A lagoon system (two unlined lagoons) and a screen house are constructed to
precipitate solids out of the waste water prior to discharge to the Hoosic River. One of the byproducts of the hydrochemical stabilization was a stream of waste water containing high concentrations of metals that was pumped several hundred feet to the north into these lagoons constructed next to the Hoosic River. Waste water was collected in the lagoons and screened to collect solids, and then the water was pumped into the Hoosic River.
• 1965: Further expansion of the mill complex occurs. • 1971: Three lagoons are added to system. The five lagoons occupy 22 acres. • 1978: A clarifier building is constructed to clarify wastewater and dewater sludge. An
estimated 250,000 to 300,000 gallons per day of wastewater are discharged to the lagoons and solids from the clarifier were disposed of in Lagoons 1 and 2.
• 1980: Lagoons 1, 3A, 3B, and a portion of Lagoon 4 are backfilled with settled sludge. • 1983: Lagoon 1 is covered with a 1 foot layer of silt. • 1988: The tannery closes and files for Chapter 11 bankruptcy.
L2001-290 1-11

1.4 Previous Investigations Numerous environmental investigations and interim remedial actions have been conducted at the Site since the 1960’s. A summary of the work conducted and findings from previous investigations is presented below. • 1980-1988: A limited ground water monitoring well network (16 wells) was installed
around the lagoons and landfill, and samples were periodically collected and analyzed by the Pownal Tannery. During this period miscellaneous sampling and analysis of residential wells was performed, lagoon sludge testing was conducted (EP Toxicity) and a preliminary magnetometer survey was completed.
• 8/20/86: VTDEC issues order for the Pownal Tannery to conduct a limited hydrogeological
assessment. Also during this period miscellaneous sampling and analysis of residential wells and lagoon sludge was conducted (including EP Toxicity testing), and a preliminary magnetometer survey was conducted and documented in a subsurface hazardous waste investigation report prepared by the tannery.
• 11/18/88: Four residential wells (Lubeck, Casey, Powell, and Tudor residences) and two
lagoon area wells (L-7 and L-8) are tested by Aquatec, Incorporated for the presence of dioxin and VOCs. No dioxins are detected, and two volatile organic compounds (VOCs) (chloroform, chlorobenzene) are detected in the Casey, Tudor and Powell wells at low concentrations (< 2 ppb).
• 1/11/93: TRC completes a Site Inspection Prioritization (SIP) at the Site for EPA.
Compressed gas cylinders, drums of chemical wastes, tanks and vessels of process wastes, friable asbestos, and sludges in the facility wastewater treatment system were found at the Site.
• 3/15/93: An Action Memorandum is signed to initiate a Time Critical Removal Action
(TCRA), which commenced on April 12, 1993. The TCRA consisted of removal of hazardous substances from the site including compressed gas cylinders, asbestos-containing materials, tank contents, three 1-gallon cans of tetrahydrofuran, suspected dioxin-containing wastes, and one drum containing pentachlorophenol. In addition, all tanks were cleaned and wastes sent offsite, covers were welded onto five open topped in-ground tanks located in the lagoon area, sludge in floor drains and smoke stack debris were sampled, all buildings were sealed to prevent public access and potential exposure, waste piles were sampled and all hazardous contents were disposed off-site and a breach in Lagoon 4 was repaired.
• 5/93 and 9/93: Ground water testing in the Lagoon Area indicates low concentrations (<30
ppb) of chromium and low concentrations of VOCs, including acetone (410 ppb), chlorobenzene (<22 ppb) and 1,2-dichlorobenzene (<10 ppb).
L2001-290 1-12

• 10/95: Laboratory testing of soil samples from borings advanced to examine subsurface conditions for placement of a temporary bridge across the Hoosic River indicate elevated levels of polyaromatic hydrocarbon (total maximum concentration of all polyaromatic hydrocarbons = 57,400 ppb) and methyl naphthalenes (total maximum concentration 6,600 ppb).
• 2/97: Metcalf & Eddy submits a report on an Ecological Investigation that included the
review of off-site mapping to identify the presence of wetlands, flood plains and other natural features of the Site, as well as an on-site ecological survey, which provided a limited assessment of the plant and animal species inhabiting the Site. Also, during the summer of 1995, M&E conducts a limited investigation of the clarifier building, landfill, and lagoons, collecting soil, river sediments, leachate, ground water and surface water samples (i.e., in the Hoosic River and lagoons).
• 3/97: Roy F. Weston conducts an additional investigation for the EPA to further characterize
the tannery building and screen house building. This investigation included sampling and analysis of wood, concrete, soil sludge, debris, and standing water within the buildings.
• 3/97: Metcalf & Eddy conducts a Superfund Accelerated Cleanup Model (SACM) field
investigation at the Site for EPA. This investigation included sampling and analysis of wood, concrete, soil sludge, debris, and standing water within the buildings.
• 7/97: Weston conducts an investigation for EPA to further characterize the nature and extent
of contamination within the tannery buildings. • 6/98: The Agency for Toxic Substances and Disease Registry conducts a Health
Consultation for EPA. • 11/98: EPA completes Engineering Evaluation/Cost Analysis (EE/CA) to assess various
options for controlling and containing the source of contamination at the Site. • 3/22/99: Action Memorandum for a NTCRA is signed. The Scope of Work includes
decontamination and partial demolition of the former tannery buildings, excavation of soils and sludges above specified cleanup levels within the tannery building footprint, and construction of a RCRA Subtitle C cover at the on-site landfill. This work was completed in 2002.
• 6/00: The Agency for Toxic Substances and Disease Registry conducts a Health
Consultation for EPA. • 6/01: Remedial Investigation is completed by EPA. The findings of the Remedial
Investigation are summarized in the remainder of this section.
L2001-290 1-13

1.5 Site Conditions 1.5.1 Geology/Hydrogeology The former Pownal Tannery site is situated on the Hoosic River, an upper tributary of the Hudson River, between the Green and Taconic Mountain Sections of the New England Province. The site, located on the narrow lowlands of the Vermont Valley physiographic zone, has twice been covered by glacial lakes of the Pleistocene epoch. At the maximum depths of Lakes Bascom and Shaftsbury, the valley was covered to more than 1,000 feet above mean sea level. The topography of the region reflects the structure and lithology of the underlying bedrock. The major landform features within the Hoosic Valley are low-gradient fluvial terraces associated with Pleistocene glaciation and modern floodplain sediment developed on an eroded valley fill of glacial lake sediment. Ground water flow in the area is predominantly influenced by the Hoosic River. Generally, overburden ground water flows toward and discharges to the Hoosic River. Based on observations during the installation of monitoring wells and the advancement of borings at the site, the following four principal stratigraphic units were identified. • Fill: An upper layer of miscellaneous fill is present on the surface across much of the site. • Sand and Gravel: A sand and gravel layer was observed beneath the entire site, at depths up
to approximately 24 feet. This stratigraphic unit generally consists of medium dense to very dense, light to dark brown, fine to coarse sand and gravel.
• Gray Clay: This layer is present beneath the entire site except where bedrock is exposed at
the surface, and in areas where the bedrock is very shallow (<10 feet). Two areas where the Gray Clay may be thin or absent include limited areas in the former building area and the west side of the Hoosic River across from Lagoon 4. The Gray Clay unit is thickest near the landfill, reaching thicknesses of over 120 feet.
This layer is relatively homogeneous and generally consists of medium-stiff, light gray, highly cohesive clay, with an occasional presence of very thin (<1/8-inch) lenses of fine silty sand. The upper surface of this layer varies in depths below grade from 17 to 79 feet, and extends to depths ranging from 57 to 151 feet.
• Bedrock: The bedrock encountered at the site is a fissile, gray green to silver and/or purple phyllite with interbeds of white to green quartzite. The upper 20 to 40 feet of the bedrock is highly weathered and rock cores could not be retrieved from this interval.
L2001-290 1-14

1.5.2 Plant Community The project area falls within the Hemlock-White Pine Northern Hardwoods Region of the Eastern North American Deciduous Forest that stretches from Minnesota to the Atlantic Coast. The region is covered with a mixed community of deciduous and coniferous forest. Floral species include hemlock, white pine, sugar maple, beech and yellow birch. 1.5.3 Animal Community Faunal species include eastern cotton-tailed rabbit, white tailed deer, moose, black bear, eastern gray squirrels, woodchuck, and various songbirds. Anadromous fish species, such as salmon and herring are not found in the Hoosic River due to impassable falls at the mouth of the river. 1.5.4 Wetlands Seven wetland areas were identified on the Pownal Tannery site. • • • • • • •
Lagoon 1 Wetland (Palustrine Emergent) Lagoon 2 Wetland (Palustrine Emergent/Palustrine Scrub-Shrub) Lagoon 4 Wetland (Palustrine Emergent/Palustrine Scrub Shrub) Lagoon 5 Wetland (Palustrine Emergent/Open Water) Former Landfill Wetland (destroyed during the NTCRA) Hoosic River Fringe Wetlands (Palustrine Forested/Scrub-Shrub/Emergent) Hoosic River Floodplain Wetlands (Palustrine Emergent/Forested/Open Water)
Note that the Former Landfill Wetland Area was destroyed during construction of the landfill cap. However, an assessment of this wetland area was performed by Metcalf & Eddy (1997), and TRC utilized the information in that report to locate and classify this former wetland area. In accordance with the Vermont Wetland Rules as adopted under Title 10 V.S.A. Chapter 37, section 905 (7-9), all wetlands in the state of Vermont are designated as either Class One, Class Two, or Class Three wetlands. Those wetlands designated as Class One or Class Two have been deemed to be so significant that they merit protection. A description of each class and its relationship to the Pownal Tannery wetlands is presented below. Note that the State of Vermont made a determination that these man-made lagoons are not significant wetlands and that these wetlands have no significant functions and values. Consequently, the State concluded that if any of these wetlands were to be destroyed as a consequence of remedial actions at the site, replication would not be needed (Appendix E). Class One: Class One wetlands are those wetlands that, “…in and of themselves, based on an evaluation of the functions in Section 5, are exceptional or irreplaceable in their contribution to Vermont’s natural heritage and are therefore so significant that they merit the highest level of protection under these rules.” No wetlands have yet been designated as Class One wetlands within the State of Vermont, and therefore none of the Pownal Tannery wetlands are considered Class One wetlands.
L2001-290 1-15

Class Two: Class Two wetlands are those wetlands that “…other than Class One wetlands, which based on an evaluation of the functions in Section 5, are found to be so significant, either taken alone or in conjunction with other wetlands, that they merit protection under these rules”. Furthermore, Class Two wetlands include those wetlands depicted on the National Wetlands Inventory (NWI) Maps for the State of Vermont and all wetlands that are contiguous to these wetlands. It should be noted that the State has some latitude with regards to the classification level of certain NWI wetlands (i.e., some Class Two wetlands might be reclassified as Class Three wetlands). Each Class Two wetland is presumed, until determined otherwise, to serve all of the wetland functions as specified in Section 5 of the Vermont Wetland Rules. The wetland functions in Section 5 include the following. 5.1 Water Storage for Flood Water and Storm Runoff 5.2 Surface and Ground Water Protection 5.3 Fisheries Habitat 5.4 Wildlife and Migratory Bird Habitat 5.5 Hydrophytic Vegetation Habitat 5.6 Threatened and Endangered Species Habitat 5.7 Education and Research in Natural Sciences 5.8 Recreational Value and Economic Benefits 5.9 Open Space and Aesthetics 5.10 Erosion Control through Binding and Stabilizing the Soil On the Pownal Tannery Site, all of the delineated lagoon wetlands and the large Hoosic River Floodplain Wetland located downhill (east) of the Landfill are considered Class Two wetlands since they appear on the NWI map. TRC observed the following wetland functions at the Pownal Tannery Lagoon Wetlands. • Water Storage for Flood Water and Storm Runoff • Wildlife and Migratory Bird Habitat TRC observed the following functions at the Hoosic River Floodplain wetland. • Water Storage for Flood Water and Storm Runoff • Fisheries Habitat • Wildlife and Migratory Bird Habitat • Recreational Value and Economic Benefits • Open Space and Aesthetics Class Three: Class Three wetlands are those wetlands that are not designated as Class One or Class Two and include the following NWI categories. • Riverine Lower Perennial Open Water (R2OW)
L2001-290 1-16

• Riverine Lower Perennial Beach/Bar (R2BB) • Riverine Upper Perennial Open Water (R3OW) • Riverine Upper Perennial Beach/Bar (R3BB) • Lacustrine Limnetic Open Water (L1OW) • Lacustrine Littoral Open Water (L2OW) • Lacustrine Littoral Beach/Bar (L2BB) The Former Landfill Wetland Area and the Hoosic River Fringe Wetlands are the only Class Three wetlands on the site. 1.6 Nature and Extent of Contamination The following sections describe the nature and extent of contaminants in the areas investigated during the Remedial Investigation. 1.6.1 Soil Background: Table 1.6-1 shows an analysis of background inorganic concentrations for the area surrounding the site. Twelve surface soil samples were obtained outside of the site contaminant release areas. The inorganic analysis results from these samples were then used to develop a 95% upper confidence limit projection of background concentration for compounds exhibiting a log-normal frequency distribution. For compounds that were not distributed log-normally, non-parametric methods were used to calculate the background concentration. Lagoon Area: Figures 1.6-1, 1.6-2, 1.6-3, and 1.6-4 show the extent of contamination for pentachlorophenol, mercury, arsenic, and dioxin, four contaminants that drive risk in the lagoon area. These maps are based on samples analyzed as part of the Remedial Investigation and represent samples collected at multiple depths. Due to the non-heterogenous nature of the sludge, it is possible that the contaminants in Lagoons 1, 3 and 5 could be more extensive within the bounds of the Lagoons. Lagoon 1: Lagoon 1 contains the thickest accumulation of sludge, but the sludge is generally buried beneath a thin layer of cover material and so the surficial soil samples do not generally contain elevated concentrations of site contaminants.
• Several VOCs were observed in Lagoon 1 surface soils, but the highest concentrations were detected in the sludge. Total VOC concentrations in the surface (0-0.5 feet) samples were less than 15 ppm, but total VOC concentrations in the sludge were generally observed to range from 50-200 ppm and in one sample the total VOC concentrations exceed 1 per cent (SBL1-11, 9-10 feet deep).
• Several SVOCs (PAHs and phenols) were detected in Lagoon 1, with the highest
concentrations present in the sludge buried below 1-2 feet of cover material. The total SVOC concentrations in the upper layer of cover material were less than 1 ppm but the total SVOC concentration in the buried sludge exceeded 600 ppm and several samples contain total SVOCs over 100 ppm.
L2001-290 1-17


L2001-290 1-26

• Elevated metals concentrations were detected in the buried sludge including chromium at concentrations typically ranging from 10,000-70,000 ppm and lead from 1,000 to 2,000 ppm. The typical concentrations observed in the surface soils for chromium and lead are less than less than 2,000 ppm and 200 ppm, respectively. Arsenic was detected as high as 20 ppm and mercury is present at two locations, above 50 ppm.
• Only one PCB compound was detected in one surface soil sample in Lagoon 1 (18 ppb,
SBL1-01), but there are four Aroclors present in the subsurface soils at concentrations ranging up to 400 ppb.
• Pesticides are present in both surface and subsurface soils in Lagoon 1, but the
concentrations detected in the sludge are approximately one order of magnitude higher than the concentrations detected in the surface soils.
• None of the samples tested for TCLP exceeded the RCRA Hazardous Waste threshold.
Lagoon 2: Lagoon 2 contains no significant quantity of sludge, so there is no significant contrast in chemical concentrations versus depth. In general, fewer site contaminants are present in Lagoon 2, and the chemical concentrations are generally lowest in Lagoon 2 soils. A summary of the laboratory test results is presented below.
• Only two VOCs (carbon disulfide, methyl acetate) were observed at concentrations above the detection limits in soil samples from Lagoon 2.
• Only one SVOC compound not associated with laboratory contamination
(diethylphthalate) was observed above the detection limits in Lagoon 2 soils.
• The inorganic constituents are present at concentrations that are closer to background soil conditions. Representative maximum concentrations for some metals detected include arsenic at 5.2 ppm, cadmium at 11.4 ppm, chromium at 2,690 ppm, lead at 192 ppm, nickel at 19.7 ppm and cyanide at 2.5 ppm.
• One sample contained three pesticides (alpha-BHC, beta-BHC, and delta-BHC), all at
concentrations less than 10 ppb.
• One PCB homologue was detected, decachlorobiphenyl, at concentrations less than 20 ppb.
• All dioxin Toxicity Equivalence Quotients (TEQs) were less than 1 ppb.
• None of the samples tested for TCLP exceeded the RCRA Hazardous Waste threshold.
Lagoon 3: Lagoon 3 is the smallest of the lagoons. Samples were collected from seven borings. In previous investigations, Lagoon 3 was divided into two sub-lagoons, 3A and 3B, though there are no present day landmarks or other features that distinguish the two sub-lagoons. The lagoon
L2001-290 1-27

is now covered with gravel fill and is largely unvegetated. A summary of the laboratory test results is presented below.
• Eight VOCs (carbon disulfide, 2-butanone, toluene, ethylbenzene, xylenes, isopropylbenzene, 1,2 dichlorobenzene, and 1,4 dichlorobenzene) were detected in Lagoon 3, all at low concentrations (below 75 ppb).
• Four SVOCs (phenol, 4-methylphenol, naphthalene, 2-methylnaphthalene) were detected
at three locations within the sludge, all at concentrations below 10 ppm.
• Metals are present in the greatest concentration within the sludge layer. Cadmium was not detected in surface soils, or in the underlying gravel layer, but is present in the sludge at concentrations up to 42 ppm. Chromium and lead are present at concentrations up to two orders of magnitude greater (chromium up to 18,000 ppm, lead up to 565 ppm) than in surface soils or the underlying soil. Arsenic is present at concentrations ranging as high as 11 ppm and mercury is present at concentrations less than 13 ppm.
• Two pesticides were detected at very low concentrations (less than 25 ppb) in two sludge
samples.
• One PCB homologue (decachlorobiphenyl) is present in most of the samples, but at low concentrations (below 25 ppb).
• All dioxin TEQs were less than 1 ppb.
• None of the samples tested for TCLP exceeded the RCRA Hazardous Waste threshold.
Lagoon 4: Lagoon 4 is the largest lagoon. Sludge was only observed in the southeastern portion of Lagoon 4 adjacent to Lagoon 3. Samples were collected from 29 borings. A summary of the laboratory test results is presented below.
• Five VOCs are present in the soils of Lagoon 4 (acetone, carbon disulfide, methylene chloride, 2-butanone, toluene), but the maximum total VOC concentration is less than 200 ppb.
• Eleven SVOCs are present in Lagoon 4 (naphthalene, 4-methylnaphthalene,
phenanthrene, fluoranthene, pyrene, benzo(a)anthracene, chrysene, bis(2-ethylhexyl)phthalate, benzo(b)fluoranthene, benzo(k)fluoranthene, benzo(a)pyrene) at eight locations. The highest SVOC concentrations were observed in the surface sample from boring SBL4-15.
• The highest metals concentrations in Lagoon 4 are present in the surficial soils. Lead,
chromium and cadmium are present at higher concentrations (one to two orders of magnitude greater) in the surface soils than in the subsurface soils.
• Low concentrations of pesticides were detected in five samples.
L2001-290 1-28

• Low concentrations of PCBs were detected in one sample.
• None of the samples tested for TCLP exceeded the RCRA Hazardous Waste threshold.
Lagoon 5: Lagoon 5 is mostly underwater throughout the entire year. A summary of the contaminants found in Lagoon 5 is presented below.
• Three VOCs are present at concentrations above the detection limit: carbon disulfide (up to 1,400 ppb), methyl acetate (one detection at 60 ppb), 1,2-dichlorobenzene (one detection at 11 ppb).
• Two SVOCs were detected in Lagoon 5: pentachlorophenol (6,300 ppb at one location) and bis(2-ethylhexyl)phthalate (less than 800 ppb).
• Several metals are present in Lagoon 5, including arsenic (up to 2.1 ppm), chromium (up to 16,100 ppm), lead (up to 624 ppm) and mercury (up to 4.1 ppm).
• None of the samples tested for TCLP exceeded the RCRA Hazardous Waste threshold.
1.6.2 Ground Water Landfill: Four rounds of ground water samples were obtained from five ground water monitoring wells in the Landfill Area. A summary of significant findings is presented below.
• Methylene chloride was detected at concentrations exceeding the Federal Maximum Contaminant Level (MCL) during the August 2000 sampling round in two wells located at the downgradient perimeter of the landfill (MW-101U and MW-B-7). Methylene chloride was also detected in rinseate blanks from this sampling period and appears to be related to field contamination, not to site conditions.
• Four other VOCs were detected (acetone, methyl tert-butyl ether, toluene and
tetrachloroethylene) at concentrations below their respective MCL.
• No SVOCs, pesticides, hexavalent chromium, PCBs or dioxins were observed at concentrations above the detection limit or the MCL.
• Several metals were detected in ground water, all at concentrations below their respective
MCLs. There does not appear to be a VOC ground water plume in the Landfill Area. The minor VOC occurrence may be from the landfill, but since contamination was not detected consistently, it is unlikely that the landfill (which is now capped) is an ongoing source of VOC contamination.
L2001-290 1-29
Former Tannery Area: Four rounds of ground water sampling were conducted at all of the wells except MW-113U installed after the second sampling round. The results are summarized below.
• Seven VOCs were detected, but only methylene chloride was detected on one occasion at
a concentration above the MCL in one well (MW-110U). The methylene chloride may be attributed to a rinseate blank problem observed in many samples from the August 2000 sampling event. No methylene chloride was detected in the other sampling rounds.
• No SVOCs were observed above detection limits.
• There were only two metals detected at concentrations exceeding their respective MCL.
Thallium was detected in MW-111U during the September 2000 sampling round at a concentration of 1.3 ppb (versus the MCL of 1 ppb) and arsenic was detected in MW-113R at a concentration of 58.4 ppb (versus the MCL of 50 ppb).
• Dioxins were detected at low concentrations in the October 2000 sampling round of well
MW-113R. Lagoon Area: Thirteen overburden and one bedrock ground water monitoring wells were sampled in this area. Five rounds of sampling were performed. A summary of the findings is presented below.
• Nine VOCs were detected (acetone, methylene chloride, MTBE, carbon tetrachloride, toluene, tetrachloroethylene, chlorobenzene, 1,2-dichlorobenzene, 1,4-dichlorobenzene) in Lagoon Area ground water samples, generally at low concentrations. Methylene chloride was only detected in the August 2000 sampling round, and appears to be a field contaminant, since it was also detected in the rinseate blank, it was detected in numerous ground water samples from other areas at the site, and it was detected from this sampling event only.
• Tetrachloroethylene was detected above the MCL in well MW-114U.
• Three SVOCs were detected in Lagoon Area ground water (diethylphthalate, atrazine,
bis(2-ethylhexyl)phthalate). These compounds were only detected during one sampling event (August 2000), and each compound was detected only once. Each of these compounds was detected in separate wells. Only atrazine was detected at a concentration (7 ppb) above the MCL (3 ppb) in well MW-L-11. Note that the turbidity of this ground water sample was also elevated, so it is possible that the atrazine is not dissolved in the ground water, but is present in particulate form. No SVOCs were detected in this well during the other sampling events.
• All metals/cyanide present except thallium, were detected at concentrations below their
respective MCL. Thallium was detected at a concentration of 7 ppb (versus MCL of 1 ppb) in well MW-109U during only one sampling event (May 2000).
L2001-290 1-30

• No PCBs were detected in any Lagoon Area ground water samples.
• Low concentrations of dioxin compounds were detected only in two Lagoon Areas wells. One dioxin (1,2,3,4,6,7,8-HpCDF) was detected in MW-109U (May 2000 sampling event) and four dioxins were detected in MW-114U (September 2000 sampling event).
1.6.3 Surface Water Landfill Area: At the Landfill Area, four surface water samples were collected from seeps discharging ground water on the downhill side of the landfill (SW-011, SW-012, SW-013, SW-021), two surface water samples were collected from streams located topographically below the landfill (SW-008, SW-009), and one surface water sample (SW-020) was collected from the pond at the base of the slope of the landfill.
• No VOCs, SVOCs or pesticide/PCBs were detected in surface water at the Landfill Area. The significant findings are presented below.
• The highest metals concentrations were detected in the landfill seeps and in the pond
below the wetland. The metals that were observed at elevated concentrations included aluminum, calcium, iron, magnesium and sodium. The more toxic metals (arsenic, cadmium, chromium, lead, mercury, nickel) are not present at elevated concentrations.
• Low concentrations of metals were detected in the landfill streams. • All dioxin TEQs are well below 1 ppb.
Former Tannery Area: One surface water sample was collected from one of the outfall pipes installed during the NTCRA. No elevated contaminant concentrations were detected in the outfall discharge. Lagoon Area: Surface water samples were collected from ponded water in Lagoons 1, 2, 4 (there are three ponds in Lagoon 4), and 5. Surface water from the Lagoon Area was also collected from the adjacent reach of the Hoosic River at four locations. A summary of the laboratory results is presented below.
• Low concentrations (<5 ppb) of acetone were detected in all four lagoons that were sampled. Low concentrations of two other VOCs (2-butanone, toluene) were detected in Lagoon 1.
• Aluminum and barium are present in unfiltered surface water samples at concentrations
that exceed the National Water Quality Criteria-Chronic levels in the Hoosic River samples.
• Aluminum, barium and magnesium are present in unfiltered surface water samples from
the Lagoon ponds at concentrations that exceed the National Water Quality Criteria-Chronic levels.
L2001-290 1-31

• Low concentrations (<20 pg/l) of dioxins are present in lagoon ponded water and in one
Hoosic River sample.
• None of the filtered samples contained metals or cyanide at concentrations above their respective National Water Quality Criteria-Chronic levels.
1.6.4 Sediment Landfill: A summary of findings is presented below.
• Elevated concentrations of three VOCs (acetone, 2-butanone and toluene), seven SVOCs (pyrene, benzo(a)anthracene, chrysene, benzo(k)fluoranthene, benzo(a)pyrene, dibenzo(a,h,)anthracene, benzaldehyde, 4-methylphenol), six metals (arsenic, cadmium, chromium, copper, lead, nickel, silver, zinc), cyanide, one pesticide (4,4’-DDD), and PCBs are present in the sediments located in the pond below the landfill.
• Sediment samples from the landfills streams contained two PAHs (pyrene,
benzo(g,h,i)perylene) and Copper at slightly elevated concentrations.
• Elevated concentrations of seven metals (arsenic, cadmium, copper, lead, nickel, silver, zinc), cyanide, one pesticide (4,4’-DDE), PCB are present in the wetland sediments.
• Elevated chromium, copper and nickel concentrations were observed in sediment samples
associated with the landfill seeps.
• Dioxins were detected in every sample, but all of the toxicity equivalence factors (TEQ) are below 1 ppb.
Former Tannery Building Area: A summary of findings is presented below.
• No VOCs were observed above detection limits. • All dioxin TEQs are well below 1 ppb.
• Several SVOCs were observed at elevated concentrations (above the Ontario Ministry of
the Environment Lowest Effect Level) including, phenanthrene, anthracene, fluoranthene, pyrene, benzo(a)anthracene, chrysene, benzo(k)fluoranthene, benzo(a)pyrene, indeno(1,2,3-cd)pyrene, and dibenzo(a,h,)anthracene.
Lagoon Area: A summary of findings is presented below.
• Three VOCs were detected in one sediment sample from Lagoon 4 (acetone, carbon disulfide, 2-butanone). The concentration of acetone in the sample (130 ppb) exceeded the Ontario Ministry of the Environment Lowest Effect Level value of 8.7 ppb.
L2001-290 1-32

• Acetone was detected in three Hoosic River sediment samples from the Lagoon Area. The acetone concentration in sample SD-030 (10 ppb), located near the sewage outfall, exceeds the Ontario Ministry of the Environment Lowest Effect Level value of 8.7 ppb.
• Six SVOCs (phenanthrene, anthracene, fluoranthene, pyrene, benzo(a)anthracene,
chrysene) are present in Hoosic River sediment samples. Five of these compounds (phenanthrene, fluoranthene, pyrene, benzo(a)anthracene, chrysene) are present at concentrations that exceed their respective Ontario Ministry of the Environment Lowest Effect Level values.
• No pesticides were observed above their respective detection limits in any of the
sediment samples.
• PCBs were detected in four Hoosic River sediment samples from the Lagoon Area, ranging in concentrations of 86 to 270 ppb.
• Dioxins were detected in the two Lagoon pond sediment samples (TEQ ranging from 106
to 127 ppt) and in the Lagoon Area Hoosic River sediment samples (TEQ less than 3 ppt).
1.7 Risk Assessment Summaries of the human health and ecological risks are presented in the following sections by media and area. 1.7.1 Human Health Risk Assessment This section provides a summary of the baseline human health risk assessment as presented in the Remedial Investigation Final Report (M&E, 2001). The baseline human health risk assessment provides estimates of risk, under both current use and hypothetical future use scenarios, to both the central tendency (CT) and the reasonably maximum exposed (RME) receptor. Tables provided in Appendix J summarizes the assumptions and significant results of the human health risk assessment. Soil/sludge analytical results were evaluated for the five lagoons and the Warehouse Area. Surface water analytical results were also evaluated for the lagoons. Surface water and sediment analytical results were evaluated for the Hoosic River and associated wetlands. Ground water analytical results from two aquifers (overburden and bedrock) were evaluated in ten off-site private wells and 24 on-site monitoring wells. For soil/sludge, surface water and sediment, the 95% upper confidence limit (UCL) concentration was used as the exposure point concentration (EPC) unless it exceeded the maximum detected value, in which case, the maximum detected value was used as the EPC. For ground water, the arithmetic mean concentration for each contaminant of potential concern (COPC) in each well or all on-site wells combined was used in calculating the CT exposure, and the maximum concentration for each COPC in each well was used to calculate the RME
L2001-290 1-33

exposure, rather than using the 95% UCL. If the arithmetic mean concentration exceeded the maximum detected concentration, the maximum detected concentration was used for the CT exposure. To evaluate current exposures, adolescent (i.e., 7 to 16 years old) trespassers and young child/adult off-site residents were considered as receptor populations. Exposures of trespassers to surface soil/sludge through incidental ingestion of and dermal contact with COPCs were evaluated. Since the lagoon surface waters are shallow, trespassers were assumed to wade, rather than swim. Therefore, only dermal contact with lagoon surface water was evaluated. Exposures of adolescent trespassers to river sediment and surface water were also evaluated. Pathways associated with river surface water and sediment exposures that were evaluated include incidental ingestion of and dermal contact with sediment and surface water. The ingestion of surface water was assessed since, even though swimming is unlikely because of rapidly flowing waters, accidental submersion is possible resulting in incidental surface water ingestion. Since private drinking water wells exist in the vicinity of the site, exposures to COPCs in off-site private wells were assessed under current land-use conditions. Routes of exposure associated with residential ground water use may include ingestion of drinking water, inhalation of chemicals that have volatilized from ground water during use (e.g., while showering), and dermal contact with ground water during use (e.g., while bathing). Drinking water ingestion exposures of residents were quantitatively evaluated. Potential exposures from other pathways, such as inhalation or dermal contact during bathing, were not quantitatively evaluated. To evaluate future exposures, young child/adult park visitors, commercial workers and utility workers were considered as receptor populations. Exposures of park visitors, commercial workers and utility workers to soil/sludge through incidental ingestion of and dermal contact with COPCs were evaluated. Dermal contact with lagoon surface water was evaluated for the park visitor and utility worker scenarios only. In addition, for the utility worker, exposures to volatile COPCs in air during trenching activities were quantitatively evaluated. Exposures of park visitors to river sediment and surface water were also evaluated. Pathways associated with river surface water and sediment exposures that were evaluated include incidental ingestion of and dermal contact with sediment and surface water. Under a future land-use scenario, it was also assumed that area residents would use ground water from the site for domestic use. As for the current scenario, only drinking water ingestion exposures of future residents were quantitatively evaluated. The following items summarize the pathways evaluated for each exposure scenario.
• Off-site child/adult resident scenario, current Ingestion pathway: ground water from private wells
• On-site adolescent trespasser scenario, current
Ingestion pathways: surface soil/sludge Dermal contact pathways: surface soil/sludge, surface water
L2001-290 1-34

• Hoosic River adolescent recreational user scenario, current Ingestion pathways: surface water, sediment Dermal contact pathways: surface water, sediment
• On-site adult and young child park visitor scenario, future
Ingestion pathways: soil/sludge Dermal contact pathways: soil/sludge, surface water
• Hoosic River adult and young child park user scenario, future
Ingestion pathways: surface water, sediment Dermal contact pathways: surface water, sediment
• On-site commercial worker scenario, future
Ingestion pathways: soil/sludge Dermal contact pathways: soil/sludge
• On-site utility worker scenario, future
Ingestion pathways: soil/sludge Dermal contact pathways: soil/sludge, surface water Inhalation pathways: volatiles from soil/sludge and ground water
• On-site child/adult resident scenario, future
Ingestion pathway: soil, ground water Dermal pathway: soil
The risk assessment used the default CT exposure parameters to evaluate average exposures and high-end exposure parameters to calculate RME estimates. Since no toxicity values are available for lead, lead toxicity was assessed using an interim approach recommended for use with non-residential adult exposures (U.S. EPA, 1996) for the future commercial worker scenario. This method relates soil lead intake to blood lead concentrations in women of childbearing age; this group is assumed to be the most sensitive to lead exposure, among adults. The method does not provide a quantitative estimate of risk; instead it predicts a central estimate of blood lead concentrations in women of child-bearing age that have exposures to soil lead at site concentrations. Risks associated with lead are described by comparing the central estimate of blood lead concentration in women of childbearing age to a goal blood lead concentration associated with a fetal blood lead concentration of 10 µg/dL. For the model, it was assumed that a typical blood lead concentration in women of child-bearing age in the absence of site exposures was 1.7 µg/dL, which is a low end default assumption. The biokinetic slope factor for lead was assumed to be 0.4 µg/dL per µg/day. A representative intake rate of soil was assumed to be 0.05 g/day based on occupational, indoor exposures to dust from outdoor soil (50 mg/day). The absolute gastrointestinal absorption fraction for ingested lead in soil and soil-derived dust was assumed to be 0.12. The exposure frequency was assumed to be 219 days per year. Using these assumptions, the goal for the central estimate of blood lead concentration in adults was calculated as 4.2 µg/dL for the Site. Predicted blood concentrations were compared to this value based on site soil/sludge concentrations.
L2001-290 1-35

For the young child park visitor, lead toxicity was assessed using EPA’s Integrated Exposure Uptake Biokinetic Model (IEUBK) for Lead in Children (U.S. EPA, 1994). This method relates soil lead intake to blood lead concentrations in young children (i.e., ages 1-6 years); this group is assumed to be the most sensitive to lead exposure, among children. The method does not provide a quantitative estimate of risk; instead it predicts a percent of children with a blood lead concentration above a goal blood lead concentration of 10 µg/dL. The percent of children with a blood lead level exceeding the goal was set at no more than 5%. The exposure frequency was assumed to be 112 days per year. The exposure time was conservatively assumed to be 4 hours per day. Using these assumptions, a soil lead level was calculated which did not exceed the goal of no more than 5% of children with blood lead levels above 10 µg/dL. Carcinogenic and noncarcinogenic risks were estimated using both the CT and RME exposure assumptions. The significance of the risk estimates are relative to guidelines set forth in EPA policy (i.e., an incremental lifetime cancer risk [ILCR] above the target risk range of 10-6 to 10-4 and a hazard index [HI] above 1). Risk estimates, as presented in the RI for the RME case, are presented below by area. When risks were estimated for a young child and adult receptor (i.e., residents and park visitors), the young child noncarcinogenic risks (hazard indices) have been presented as the most conservative, while carcinogenic risks presented represent the sum of the young child and adult risks (i.e., a total receptor risk). Lagoon Areas: In the five lagoon areas, potential exposures to soil/sludge, surface water and air were evaluated. Health risks from air and surface water are expected to be below or within the EPA risk range of 10-6 to 10-4 for cancer risk and below a hazard index of 1 for noncancer risk. Health risks from potential future ingestion and dermal contact with soil/sludge at Lagoons 1, 3 and 5 exceed EPA risk guidelines. Soil/sludge contaminants contributing to risks above EPA risk guidelines, under central tendency and RME scenarios were: Lagoon 1 (benzo(a)anthracene, benzo(a)pyrene, pentachlorophenol, dioxins and arsenic); Lagoon 3 (dioxins and arsenic); and Lagoon 5 (benzo(a)pyrene, N-nitroso-di-n-propylamine, dioxins and arsenic). Future childhood exposures to lead in soil may result in excess blood lead levels in park visitors at Lagoon 1. Warehouse Area: In this area, potential exposures to soil were evaluated. Health risks from surface soil are expected to be below or within the EPA risk range of 10-6 to 10-4 for cancer risk and below a hazard index of 1 for noncancer risk. Hoosic River and Associated Wetlands: In this area, potential exposures to surface water and sediment were evaluated. Health risks from surface water are expected to be below or within the EPA risk range of 10-6 to 10-4 for cancer risk and below a hazard index of 1 for noncancer risk. Health risks from future ingestion and dermal contact with sediment exceed EPA risk guidelines. Sediment contaminants contributing to risks above EPA risk guidelines, under central tendency and RME scenarios were PCBs, dioxins and arsenic. Off-Site Private Wells: Current exposures via ground water ingestion were evaluated. Health risks from current ingestion of ground water exceed EPA risk guidelines for four of the ten private wells evaluated. Ground water constituents contributing to risks above EPA risk
L2001-290 1-36

guidelines, under an RME scenario were: RW-003 (arsenic); RW-006 (thallium); RW-008 (arsenic and manganese); RW-010 (manganese). On-Site Monitoring Wells: Potential future exposures via ground water ingestion were evaluated. Health risks from future ingestion of ground water exceed EPA risk guidelines for 13 of the 24 monitoring wells evaluated (MW-104U; MW-106U; MW-107R; MW-107U; MW-109U; MW-110R; MW-110U; MW-111U; MW-113R; MW-114U; MW-B-7; MW-L-3; and MW-L-10). Ground water constituents contributing to risks above EPA risk guidelines under an RME scenario were manganese, dioxin, arsenic, carbon tetrachloride, heptachlor epoxide, thallium, methylene chloride, 1,4-dichlorobenzene, tetrachloroethene and pentachlorophenol. 1.7.2 Ecological Risk Assessment The ecological risk assessment for the site was designed to identify COCs for the area’s ecological communities and to estimate potential risk to organisms using the area. Study Area habitats include palustrine and riverine wetlands as well as uplands associated with the Hoosic River and adjacent floodplain. Exposure doses were determined for receptors noted or expected to utilize the aquatic, wetland, and terrestrial habitats present within the Study Area. Risks to fish, amphibian larvae, and aquatic invertebrates (both benthic and water column communities) were evaluated by concurrently measured surface water and/or sediment concentrations in the aquatic habitats with applicable toxicity reference values. Comparisons were made from samples collected from the Hoosic River, lagoons, landfill ponds, seeps, and Halifax Hollow (landfill stream). Risks to wildlife receptors including belted kingfisher, mink, Canada goose, muskrat, spotted sandpiper, little brown bat, mallard, raccoon, meadow vole, American woodcock, short-tailed shrew, American robin, and deer mouse were estimated by bioaccumulation modeling and chronic NOAEL and LOAEL toxicity reference values. Wildlife receptors were evaluated with five communities: Hoosic River, lagoons (both aquatic and upland habitats), landfill pond, and landfill wet meadow/seepage areas. A summary of potential risks associated with COCs detected within the Pownal Tannery Study Area is provided in Table 1.7-1. Potential risks for aquatic invertebrates, fish and amphibian larvae are based on surface water or sediment concentrations exceeding their respective chronic or acute TRVs. Potential risks to wildlife receptors are based on estimated exposure doses that exceed their respective LOAEL TRV. Fish and aquatic invertebrates may potentially be impacted by detected concentrations of iron and manganese within the landfill pond and seeps (invertebrates only). Risks to these receptors are not expected to be elevated above background levels within the Hoosic River, lagoons, and Halifax Hollow communities. Amphibian larvae are note expected to be at an acute risk from COCs present within important amphibian breeding areas (landfill pond and lagoons). Benthic invertebrates may potentially be at risk from detected concentrations of COCs within sediments of the Hoosic River, lagoons, and landfill pond. Primary COCs with sediment include PAHs, pesticides, and several metals including chromium, lead, cadmium, and mercury.
L2001-290 1-37

Table 1.7-1: Summary of Ecological Risks, Pownal Tannery Study Area
Hoosic River Lagoons
Landfill Pond
Halifax Hollow
Landfill Seeps/Meadow
Fish/Invertebrates ◊ ◊ ♦♦ ◊ ♦♦ Amphibian Larvae NE - - NE - Benthic Invertebrates ♦♦ ♦♦ ♦♦ ◊ NE Wildlife
Belted Kingfisher ◊◊ NE ◊ NE NE
Mink ◊◊ NE - NE NE Canada Goose - - - NE NE Muskrat ◊ ♦♦ ◊ NE NE Spotted Sandpiper ◊◊ ♦♦ ♦♦ NE NE
Little Brown Bat ♦♦ ♦♦ ♦♦ NE NE
Mallard - - - NE NE Raccoon ◊ ♦♦ ◊ NE NE Meadow Vole NE ◊ NE NE ◊ American Woodcock NE ♦♦ NE NE ◊
Short-tailed Shrew NE ♦♦ NE NE ◊
American Robin NE ♦♦ NE NE NE
Deer Mouse NE ♦♦ NE NE NE Contaminants of Concern PAHs,
Lead, Mercury
Dioxins, Cadmium, Chromium,
Lead, Mercury
Chromium, Dioxins,
Silver None Iron, Manganese
◊ Mean or maximum risk exceeds threshold but below background/reference risk ◊◊ Mean or maximum risk exceeds threshold and background/reference risk but not a concern due to foraging
habits or contamination unrelated to site ♦♦ Mean or maximum risk exceeds threshold and background/reference NE Not evaluated - Risks not anticipated. Note: Risk for wildlife receptors considered exceeding threshold if estimated exposure dose exceeds LOAEL TRV threshold
L2001-290 1-38

Wildlife receptors potentially at risk (above background risk levels) within the Hoosic River community include the little brown bat from elevated concentrations of high molecular weight PAHs within the sediments. Sediments and surface soils associated with the lagoons provide elevated risk above background risk levels to a variety of wildlife receptors including aquatic mammalian herbivores (musk rat), insectivorous birds (spotted sandpiper and American woodcock), and mammals (little brown bat and short-tailed shrew), as well as omnivorous birds (American robin) and mammals (raccoon and deer mouse). Primary risk drivers within the lagoon sediment and surface soils are dioxin/furans, chromium, cadmium, and lead. Insectivorous birds (spotted sandpiper) and mammals (little brown bat) may potentially be at risk from concentrations of dioxins, chromium, or Silver detected within the sediments of the landfill pond. No wildlife receptors were within the sediments of the landfill pond. No wildlife receptors were identified at risk above background levels from COCs detected in sediment associated with the wet meadow/seep community present downgradient of the landfill. 1.8 Superfund Redevelopment Initiative EPA provided the Town of Pownal with a grant to conduct a re-use assessment of the Pownal Tannery Superfund Site to determine options for developing the site after remediation is completed. The re-use assessment results were presented in a report dated February 2001, prepared by Forcier Aldrich & Associates (Provided in Appendix G). The re-use study included inventory of local resident desires for site re-use and incorporated the planning desires of the Town government. The report identified re-use alternatives for the Lagoon Area as well as the Former Tannery Building Area and the Warehouse Area. Two alternatives were developed for the Lagoon Area. Both alternatives included using the site for a variety of recreational purposes – skating rink, soccer field, hiking trails, fishing access, a kayak/canoe launch area, equipment storage shed, parking area, water, solar, and electrical utilities. Both alternatives also included a new publicly owned treatment works to be constructed in the area of Lagoon 2. In addition, one of the re-use Alternatives included a softball field and additional Lawn Areas. None of the proposed uses include any type of residential, commercial, or industrial development, other than the publicly-owned treatment works. TRC considered the Town’s desires in developing the conceptual layouts of remedial alternatives in Section 4, and considered the Town’s plans in assessing implementability and effectiveness, in the detailed analysis in Section 5.
L2001-290 1-39