Feasibility Study of a Laser Ramjet Single-Stage-To … 2003-0497 FEASIBLILITY STUDY OF A LASER...
9
AIAA 2003-0497 FEASIBLILITY STUDY OF A LASER RAMJET SINGLE-STAGE-TO-ORBIT VEHICLE Hiroshi KATSURAYAMA ∗ , Yasuro HIROOKA † , Kimiya KOMURASAKI ‡ , and Yoshihiro ARAKAWA § ABSTRACT Momentum coupling coefficients, C m , of a laser ramjet vehicle are calculated by CFD and an engine cycle analysis. The flight trajectory of the laser ramjet vehicle is calculated by the engine cycle analysis. The CFD with the explosion source model can reproduce the experimental data of C m . Using this CFD model, C m in a supersonic flight are computed. The results show C m and the fraction of laser energy, that is converted to blast wave energy, decreases with the flight altitude due to chemically frozen flow loss. C m by the engine cycle analysis is underestamted in comparsion with CFD. Since the engine cycle analysis is assumed to be steady state process, the peak pressure in the Humphery cycle is lower than CFD. Accordingly, the Humphrey cycle efficiency of the engine cycle analysis is degraded. This low efficiency of the cycle causes the small C m of the engine cycle analysis. NOMENCLATURE A = cross section of a vehicle A L = cross section of laser beam C.A.R. = capture area ratio C d = drag coefficient C m = momentum coupling coefficient C p = specific heat at constant pressure e = total energy per unit volume E L = total laser energy E B = the pressure and kinetic energy converted from the laser energy (Blast wave energy) F = thrust g = acceleration of gravity H = flight altitude of the vehicle h = enthalpy h t+r = sum of translational and rotational enthalpy j = mass diffusion flux f = f number of optics M = Mach number m v = vehicle mass ˙ m = mass flow rate P L = laser power p = static pressure q = heat flux R = gas constant V 0 = explosion source volume S = maximum cross section of the vehicle T = static temperature t = time U = vehicle speed ∗ Graduate student, Department of Aeronautics and Astro- nautics, Student Member AIAA † Graduate student, Department of Aeronautics and Astro- nautics ‡ Associate Professor, Department of Advanced Energy, Member AIAA § Professor, Department of Aeronautics and Astronautics, Member AIAA Copyright c 2003 by the American Institute of Aeronautics and Astronautics, Inc. All rights reserved. u, v = axial, radial velocity component z, r, θ = cylindrical coordinates γ = specific heat ratio ∆h f = chemical potential energy = structure coefficient η d = diffuser efficiency η B = blast wave efficiency to the blast wave energy π d = total pressure ratio ρ = density τ = viscous stress tensor subscripts i = inlet s = species t = stagnation condition ∞ = freestream property INTRODUCTION There is a strong demand to frequently deliver payloads to a space station at a low cost. A pulse laser ramjet vehicle will be able to satisfy this de- mand: Since energy is provided from a laser base on the ground to the vehicle and the atmospheric air can be used as a propellant, the payload ratio is improved drastically. In addition, once a laser base is constructed, the cost is only electricity charges. The pulse laser ramjet vehicle as shown in Fig.1 will be able to achieve SSTO by switching its flight mode. Firstly, when the vehicle is launched from the ground, the inlet is closed to prevent the blast wave from going upstream beyond the inlet. Air is taken and exhausted from the rear side of the vehicle. This flight mode can be called a pulsejet mode. Secondly, when the vehicle is enough accel- erated that the inflow air becomes free from ther- mal choking by laser heating, the inlet is open and the flight mode is switched to a ramjet mode. Fi- nally, when the vehicle can not breath the enough air at high altitude, the flight mode is switched to a rocket mode. 1 American Institiute of Aeronautics and Astronautics 41st Aerospace Sciences Meeting and Exhibit 6-9 January 2003, Reno, Nevada AIAA 2003-497 Copyright © 2003 by the American Institute of Aeronautics and Astronautics, Inc. All rights reserved.
Transcript of Feasibility Study of a Laser Ramjet Single-Stage-To … 2003-0497 FEASIBLILITY STUDY OF A LASER...

AIAA 2003-0497
FEASIBLILITY STUDY OF A LASER RAMJETSINGLE-STAGE-TO-ORBIT VEHICLE
Hiroshi KATSURAYAMA∗, Yasuro HIROOKA†, Kimiya KOMURASAKI‡, and Yoshihiro ARAKAWA§
ABSTRACTMomentum coupling coefficients, Cm, of a laser ramjet vehicle are calculated by CFD and an enginecycle analysis. The flight trajectory of the laser ramjet vehicle is calculated by the engine cycle analysis.The CFD with the explosion source model can reproduce the experimental data of Cm. Using this CFDmodel, Cm in a supersonic flight are computed. The results show Cm and the fraction of laser energy,that is converted to blast wave energy, decreases with the flight altitude due to chemically frozen flowloss. Cm by the engine cycle analysis is underestamted in comparsion with CFD. Since the engine cycleanalysis is assumed to be steady state process, the peak pressure in the Humphery cycle is lower thanCFD. Accordingly, the Humphrey cycle efficiency of the engine cycle analysis is degraded. This lowefficiency of the cycle causes the small Cm of the engine cycle analysis.
NOMENCLATURE
A = cross section of a vehicleAL = cross section of laser beamC.A.R.= capture area ratioCd = drag coefficientCm = momentum coupling coefficientCp = specific heat at constant pressuree = total energy per unit volumeEL = total laser energyEB = the pressure and kinetic energy
converted from the laser energy(Blast wave energy)
F = thrustg = acceleration of gravityH = flight altitude of the vehicleh = enthalpyht+r = sum of translational and rotational enthalpyj = mass diffusion fluxf = f number of opticsM = Mach numbermv = vehicle massm = mass flow ratePL = laser powerp = static pressureq = heat fluxR = gas constantV0 = explosion source volumeS = maximum cross section of the vehicleT = static temperaturet = timeU = vehicle speed
∗Graduate student, Department of Aeronautics and Astro-nautics, Student Member AIAA†Graduate student, Department of Aeronautics and Astro-nautics‡Associate Professor, Department of Advanced Energy,Member AIAA§Professor, Department of Aeronautics and Astronautics,Member AIAACopyright c©2003 by the American Institute of Aeronauticsand Astronautics, Inc. All rights reserved.
u, v = axial, radial velocity componentz, r, θ = cylindrical coordinatesγ = specific heat ratio∆hf = chemical potential energyε = structure coefficientηd = diffuser efficiencyηB = blast wave efficiency
to the blast wave energyπd = total pressure ratioρ = densityτ = viscous stress tensorsubscriptsi = inlets = speciest = stagnation condition∞ = freestream property
INTRODUCTION
There is a strong demand to frequently deliverpayloads to a space station at a low cost. A pulselaser ramjet vehicle will be able to satisfy this de-mand: Since energy is provided from a laser baseon the ground to the vehicle and the atmosphericair can be used as a propellant, the payload ratio isimproved drastically. In addition, once a laser baseis constructed, the cost is only electricity charges.
The pulse laser ramjet vehicle as shown in Fig.1will be able to achieve SSTO by switching its flightmode. Firstly, when the vehicle is launched fromthe ground, the inlet is closed to prevent the blastwave from going upstream beyond the inlet. Airis taken and exhausted from the rear side of thevehicle. This flight mode can be called a pulsejetmode. Secondly, when the vehicle is enough accel-erated that the inflow air becomes free from ther-mal choking by laser heating, the inlet is open andthe flight mode is switched to a ramjet mode. Fi-nally, when the vehicle can not breath the enoughair at high altitude, the flight mode is switched toa rocket mode.
1American Institiute of Aeronautics and Astronautics
41st Aerospace Sciences Meeting and Exhibit6-9 January 2003, Reno, Nevada
AIAA 2003-497
Copyright © 2003 by the American Institute of Aeronautics and Astronautics, Inc. All rights reserved.

PulseLaser
Blast wave
Laser plasma
Thrust
InletInflow
Fig.1 Pulse laser ramjet vehicle.
Air-breakdown occurs by focusing a transmit-ted pulse laser beam by the nozzle wall. The frontof produced plasma absorbs the following part oflaser pulse and expands in the form of Laser Sup-ported Detonation wave (LSD).1) This expansioninduces a blast wave. The blast wave imparts thethrust to the nozzle wall.
Myrabo et al. proposed a pulse laser vehicle,named “Lightcraft,” and conducted flight testswith a scaled model.2) Their latest model, withadditional solid ablative propellants, recorded thelaunch altitude of 121-meters.3) Wang et al.4)
computed the flow field in the Lightcraft restingon the ground.
The objective of this paper is to analytically ex-amine the feasibility of the laser ramjet SSTO ve-hicle. The launch trajectory is calculated by anengine cycle Analysis. Since there is not adequateinvestigation about the supersonic flight so far,and an experiment is difficult under the supersonicflight, the momentum coupling coefficient is com-puted by CFD. Finally, Cm deduced by the enginecycle analysis is compared with Cm by CFD.
MOMENTUM COUPLING ANDBLAST WAVE EFFICIENCY
In the laser propulsion, the momentum couplingcoefficient Cm is an performance indicator. Cm isthe ratio of cumulative impulse to one pulse laserenergy and defined as,
Cm =
∫ t
0Fdt
EL. (1)
The absorbed laser energy is converted into theblast wave energy EB, chemical potential energyand radiation energy. Since only energy, EB, isconverted to the thrust, Cm would be function ofEB/EL. We introduce the blast wave efficiency ηB
defined by
ηB =EB
EL. (2)
shock wave
0 1 2 4Ram compression
Isentropic expansion
Diffuser Isentropic expansion
Isometric heating
3
Fig.2 Ramjet engine cycle analyses.
Volume
0 4
Ram
compression
Isentropic expansion
Isometric heating
Pre
ssur
e
1
2
3
Fig.3 Humphrey cycle(with additional isentropic expansion 1 → 2).
The flight trajectory is calculated using this ηB
in a engine cycle analysis. In order to validate thisanalysis, the thrust is also computed by CFD.
ENGINE CYCLE ANALYSIS
Analysis Method
Pulsejet mode In a pulsejet mode, thrust isestimated using the experimental data of Cm. Cm
is assumed constant.
F = CmPL (3)
Ramjet mode In a ramjet mode, thrust iscalculated by an engine cycle analysis assumingHumphrey cycle5) as indicated in Figs.2 and 3.
The area ratio is listed in Table 1. A0 is definedas,
C.A.R. =
∫∫Sinlet
ρv · ds∫∫S∞ ρv · ds
, (4)
A0 = C.A.R.× S. (5)
From Point 0 to Point 1, air is ram-compressed.The total pressure ratio and total temperature arethe followings,
πd =pt1
pt0=
(1 + (1 − ηd)
γ − 12
M0
)− γγ−1
,(6)
Tt1 = Tt0. (7)
2American Institiute of Aeronautics and Astronautics
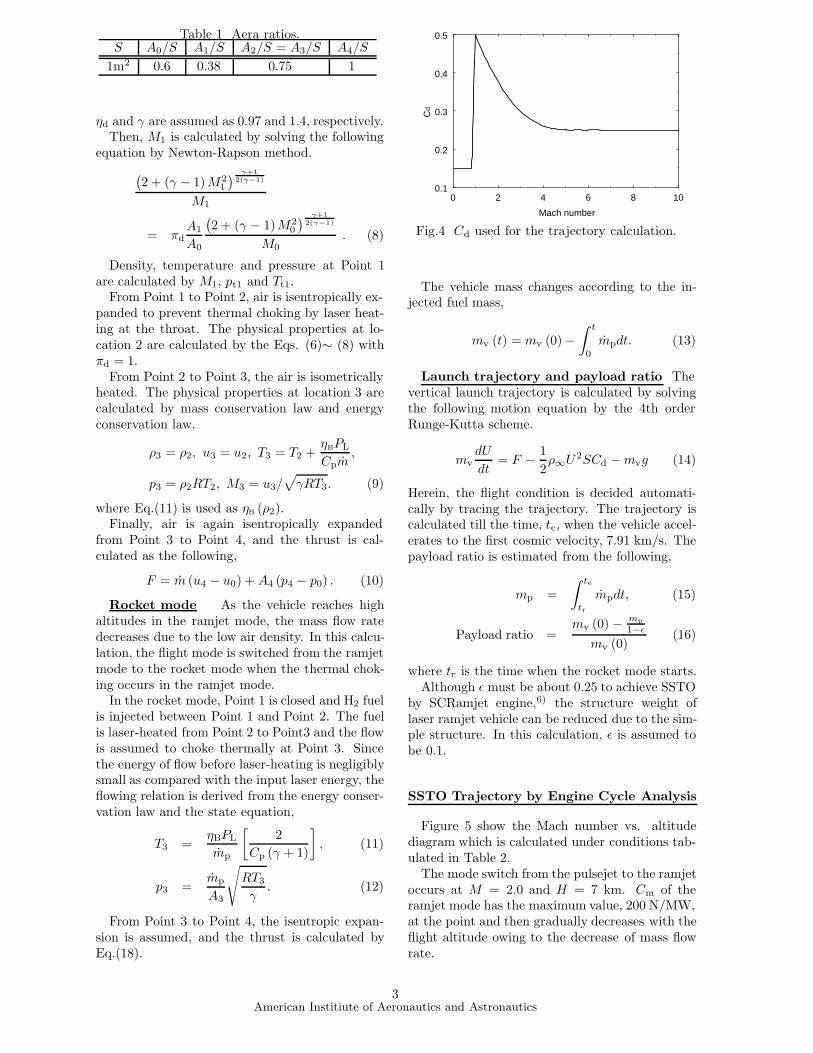
Table 1 Aera ratios.S A0/S A1/S A2/S = A3/S A4/S
1m2 0.6 0.38 0.75 1
ηd and γ are assumed as 0.97 and 1.4, respectively.Then, M1 is calculated by solving the following
equation by Newton-Rapson method.(2 + (γ − 1)M2
1
) γ+12(γ−1)
M1
= πdA1
A0
(2 + (γ − 1)M2
0
) γ+12(γ−1)
M0. (8)
Density, temperature and pressure at Point 1are calculated by M1, pt1 and Tt1.
From Point 1 to Point 2, air is isentropically ex-panded to prevent thermal choking by laser heat-ing at the throat. The physical properties at lo-cation 2 are calculated by the Eqs. (6)∼ (8) withπd = 1.
From Point 2 to Point 3, the air is isometricallyheated. The physical properties at location 3 arecalculated by mass conservation law and energyconservation law.
ρ3 = ρ2, u3 = u2, T3 = T2 +ηBPL
Cpm,
p3 = ρ2RT2, M3 = u3/√γRT3. (9)
where Eq.(11) is used as ηB (ρ2).Finally, air is again isentropically expanded
from Point 3 to Point 4, and the thrust is cal-culated as the following,
F = m (u4 − u0) + A4 (p4 − p0) . (10)
Rocket mode As the vehicle reaches highaltitudes in the ramjet mode, the mass flow ratedecreases due to the low air density. In this calcu-lation, the flight mode is switched from the ramjetmode to the rocket mode when the thermal chok-ing occurs in the ramjet mode.
In the rocket mode, Point 1 is closed and H2 fuelis injected between Point 1 and Point 2. The fuelis laser-heated from Point 2 to Point3 and the flowis assumed to choke thermally at Point 3. Sincethe energy of flow before laser-heating is negligiblysmall as compared with the input laser energy, theflowing relation is derived from the energy conser-vation law and the state equation,
T3 =ηBPL
mp
[2
Cp (γ + 1)
], (11)
p3 =mp
A3
√RT3
γ. (12)
From Point 3 to Point 4, the isentropic expan-sion is assumed, and the thrust is calculated byEq.(18).
0.1
0.2
0.3
0.4
0.5
0 2 4 6 8 10
Mach number
Cd
Fig.4 Cd used for the trajectory calculation.
The vehicle mass changes according to the in-jected fuel mass,
mv (t) = mv (0) −∫ t
0
mpdt. (13)
Launch trajectory and payload ratio Thevertical launch trajectory is calculated by solvingthe following motion equation by the 4th orderRunge-Kutta scheme.
mvdU
dt= F − 1
2ρ∞U2SCd −mvg (14)
Herein, the flight condition is decided automati-cally by tracing the trajectory. The trajectory iscalculated till the time, te, when the vehicle accel-erates to the first cosmic velocity, 7.91 km/s. Thepayload ratio is estimated from the following,
mp =∫ te
tr
mpdt, (15)
Payload ratio =mv (0) − mp
1−ε
mv (0)(16)
where tr is the time when the rocket mode starts.Although ε must be about 0.25 to achieve SSTO
by SCRamjet engine,6) the structure weight oflaser ramjet vehicle can be reduced due to the sim-ple structure. In this calculation, ε is assumed tobe 0.1.
SSTO Trajectory by Engine Cycle Analysis
Figure 5 show the Mach number vs. altitudediagram which is calculated under conditions tab-ulated in Table 2.
The mode switch from the pulsejet to the ramjetoccurs at M = 2.0 and H = 7 km. Cm of theramjet mode has the maximum value, 200 N/MW,at the point and then gradually decreases with theflight altitude owing to the decrease of mass flowrate.
3American Institiute of Aeronautics and Astronautics

0
20
40
60
80
100
120
140
160
180
200
0 2 4 6 8 10 12 14 16 18 200
20
40
60
80
100
120
140
160
180
200
H, k
m
Flight Mach number
Cm
, N
/MW
H
Cm
Pulsejet
Ramjet Rocket
Cm
Cm
Fig.5 H, Cm Vs. M diagram.
0
1000
2000
3000
4000
5000
6000
7000
8000
0 50 100 150 200 250 300Puls
ejet
Ramjet
Rocke
t
PL=50
0MW
PL=30
0MW
PL=113MW
U, m
/s
Time, s
P.R.=0.67 P.R.=0.55 P.R.=0.30
Fig.6 Flight velocity Vs. time diagram.
The mode switch from the ramjet to the rocketoccurs at M = 8.7 and H = 36 km where Cm ofthe ramjet is 49 N/NW. In the rocket mode, Cm
is almost constant value, 30 N/MW.Figure 6 shows payload ratios for PL =
113, 300 and 500MW, where the parameters ex-cept PL is the same as Table 2.
Table 2 Calculation conditions in engine cycleanalysis.mv (t = 0) 100 kg
PL 500 MWηB 40 %
C(pulsejet)m 100 N/MWmp 1 kg/sηd 0.97ε 0.1
CFD ANALYSIS
Governing Equations
Axisymmetric Navier-Stokes equationsare solved. Chemical reactions are treatedas finite rate reactions. The following11 species of air plasma are considered:N2, O2, NO, N, O, N+
2 , O+2 , NO+, N+, O+
and e−. The effects of thermal non-equilibriumand radiative energy transfer are not considered.Then, the governing equations are given by
∂U∂t
+∂F∂z
+1r
∂rG∂r
=∂Fv
∂z+
1r
∂rGv
∂r+
Hr
+ S.
(17)
U =
ρρuρveρ1...ρ11
,F =
ρuρu2 + pρuv(e + p)uρ1u...ρ11u
,G =
ρvρuvρv2 + p(e+ p) vρ1v...ρ11v
,
Fv =
0τzzτzruτzz+vτzr +qzj1z...j11z
,Gv=
0τzrτrruτzr +vτrr +qrj1r...j11r
,
H =
00p− τθθ00...0
,S =
0000ω1...ω11
. (18)
E and the equation of state are defined as
E =∑11
ρshs (T ) − p+ρ
(u2 + v2
)2
, (19)
p =∑11
ρsRsT. (20)
hs and the transport properties are taken fromRef. (7) In the air chemical reaction model, theforward rates of Ref. (8) are used. The backwardrates are calculated by the principle of detailedbalance. The chemical equilibrium constants arealso taken from Ref. (8).
Numerical Scheme
Inviscid flux is estimated with the AUSM-DVscheme9) and space accuracy is extended to 3rd-order by the MUSCL approach with Edwards’spressure limiter.10) Viscous flux is estimated witha standard central difference. Time integration isperformed with the LU-SGS11) scheme which isextended to 3rd-order time accuracy by Matsuno’sinner iteration method.12) The calculation is per-formed with the CFL number of 2 ∼ 20.
4American Institiute of Aeronautics and Astronautics
0
2
4
6
8
10
12
0 5 10 15 20
r, c
m
z, cm
(a) Type A : 30◦ slope cowl (inlet is closed.)
0
2
4
6
8
10
12
0 5 10 15 20
r, c
m
z, cm
(b) Type B : non-slope cowl (inlet is open.)
0
10
20
30
40
50
60
70
-60 -40 -20 0 20 40 60 80
r, c
m
z, cm
(c) Overall mesh (72,000 cells)
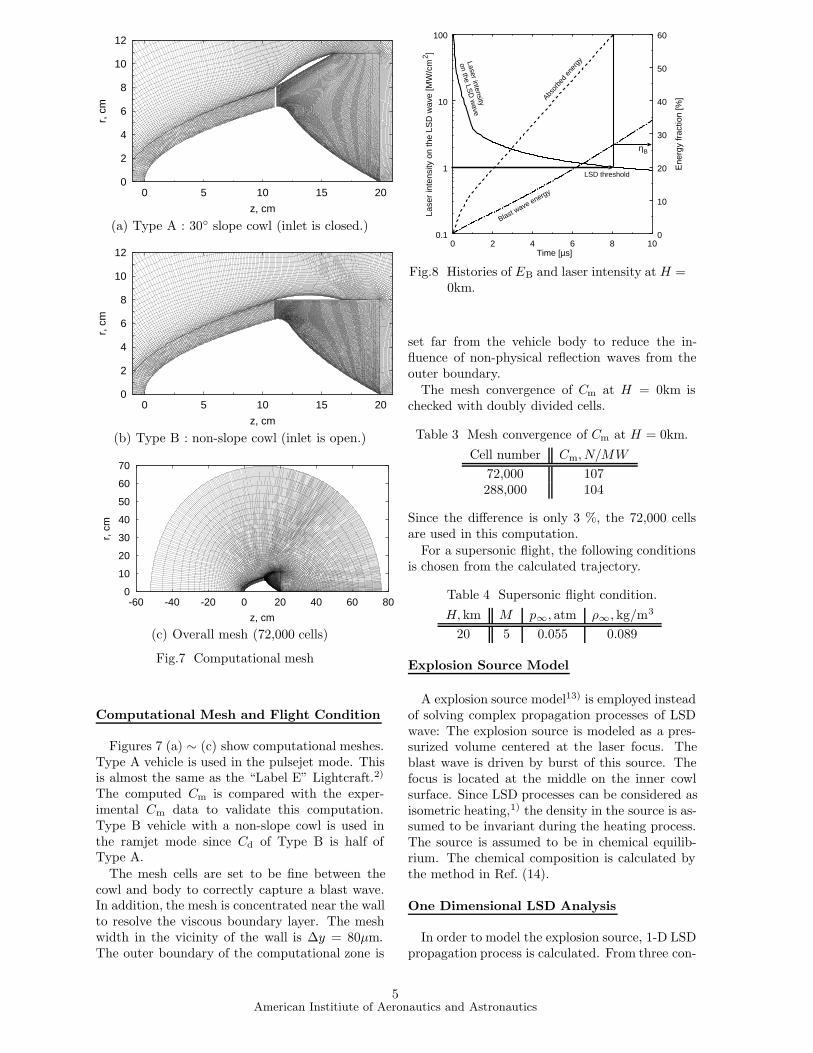
Fig.7 Computational mesh
Computational Mesh and Flight Condition
Figures 7 (a) ∼ (c) show computational meshes.Type A vehicle is used in the pulsejet mode. Thisis almost the same as the “Label E” Lightcraft.2)
The computed Cm is compared with the exper-imental Cm data to validate this computation.Type B vehicle with a non-slope cowl is used inthe ramjet mode since Cd of Type B is half ofType A.
The mesh cells are set to be fine between thecowl and body to correctly capture a blast wave.In addition, the mesh is concentrated near the wallto resolve the viscous boundary layer. The meshwidth in the vicinity of the wall is ∆y = 80µm.The outer boundary of the computational zone is
0.1
1
10
100
0 2 4 6 8 100
10
20
30
40
50
60
Lase
r in
tens
ity o
n th
e LS
D w
ave
[MW
/cm
]2
Time [µs]
Laser intensity
on the LSD
wave
Absor
bed
ener
gy
Blast wave energy
Ene
rgy
frac
tion
[%]
LSD threshold
ηB
Fig.8 Histories of EB and laser intensity at H =0km.
set far from the vehicle body to reduce the in-fluence of non-physical reflection waves from theouter boundary.
The mesh convergence of Cm at H = 0km ischecked with doubly divided cells.
Table 3 Mesh convergence of Cm at H = 0km.Cell number Cm, N/MW
72,000 107288,000 104
Since the difference is only 3 %, the 72,000 cellsare used in this computation.
For a supersonic flight, the following conditionsis chosen from the calculated trajectory.
Table 4 Supersonic flight condition.H, km M p∞, atm ρ∞, kg/m3
20 5 0.055 0.089
Explosion Source Model
A explosion source model13) is employed insteadof solving complex propagation processes of LSDwave: The explosion source is modeled as a pres-surized volume centered at the laser focus. Theblast wave is driven by burst of this source. Thefocus is located at the middle on the inner cowlsurface. Since LSD processes can be considered asisometric heating,1) the density in the source is as-sumed to be invariant during the heating process.The source is assumed to be in chemical equilib-rium. The chemical composition is calculated bythe method in Ref. (14).
One Dimensional LSD Analysis
In order to model the explosion source, 1-D LSDpropagation process is calculated. From three con-
5American Institiute of Aeronautics and Astronautics

servation equations and C-J condition, the the fol-lowing relations are derived.15)
p2 =p1 + ρ1D
2CJ
γ2 + 1, (21)
ρ2 =(γ2 + 1) ρ1D
2CJ
γ2 (p1 + ρ1D2CJ)
, (22)
T2 = p2/R2/ρ2, (23)
v2 = c2 =√γ2p2
ρ2, (24)
v1 = DCJ, (25)
h2 = h1 +12
(DCJ − v2
2
)+PL/AL
ρ1DCJ, (26)
where the subscripts 1 and 2 denote the states infront of and behind the LSD wave, respectively.The velocities refer the coordinate relative to theLSD wave. Since the laser beam is focused cylin-drically as shown in Fig.7,
AL = 2π (rf − rd) tan−1 (f) .
Here, rf and rd are the radius of the focus andthe detonation wave front, respectively. f is 3.6.2)
The history of PL is taken from the Ref. (16).The Eqs. (3) ∼ (8) are iteratively solved with
chemical equilibrium calculation. Then, the loca-tion of LSD is calculated by
drddt
= DCJ. (27)
In an atmospheric pressure, CO2 laser inten-sity below 1MW can not sustain LSD wave.17)
In the present computation, the laser absorptionis assumed to finish when laser intensity on theLSD wave decays to this threshold. EB is de-fined as the sum of kinetic energy at t = tl whenPL/AL = 1 MW/cm2,
EB=∫ tl
0
[ht+r
2 −ht+r1 +
12(DCJ − v2)2
]ρ1DCJALdt.
(28)Figure 8 shows the history of the laser intensity,
and absorbed laser energy and blast wave energy.When laser intensity on the LSD wave decays toLSD threshold, 60 % of laser energy is absorbedby plasma and 26 % of laser energy is converted toblast wave energy. Table 5 shows the source vol-ume decided by this ηB. The blast wave is drivenat t0 = 0 µs by burst of this source volume.
Table 5 Explosion source.H, km EL, J ηB (t0), % V, cm3
0 400 26.0 17.4300 18.8 44.4
20 400 17.2 51.3500 16.1 55.6
where the absorption fraction of laser energy isassumed to be constant, 60 %, because the LSDthreshold is unknown in reduced atmospheric den-sity.
-1000
0
1000
2000
3000
4000
5000
6000
7000
8000
0 200 400 600 800 1000 1200 1400
Thr
ust,
N
Time, µs
Fig.9 Thrust history
-1000
-500
0
500
1000
1500
2000
2500
3000
0 50 100 150 200
total
inle
t
cowl
body
Thr
ust [
N]
Time [µs]
Fig.10 Each thrust received by body, cowl andclosed inlet
Computed Results at H = 0 km
A blast wave is driven at H = 0km by the explo-sion source in Table 5. The history of axial thrustis shown in Fig.9. After the positive thrust main-tains till 125 µs, the negative thrust continues till900 µs. After 1500 µs, the thrust almost is equalto zero.
Figure 10 shows the thrust received by the body,cowl and closed inlet till 200 µs. After the explo-sion source bursts at t0, the shock wave expandssuddenly and decays. Therefore, the thrust re-ceived by the cowl decreases fast.
The thrust received by the closed inlet and theafterbody decreases slower than that of the cowl.
Figures 11 (a) ∼ (c) shows the propagation pro-cesses of the shock wave. The shock wave starts tosweep on the afterbody at t1 = 45µs. The shockwave propagates beyond the middle of the after-
6American Institiute of Aeronautics and Astronautics
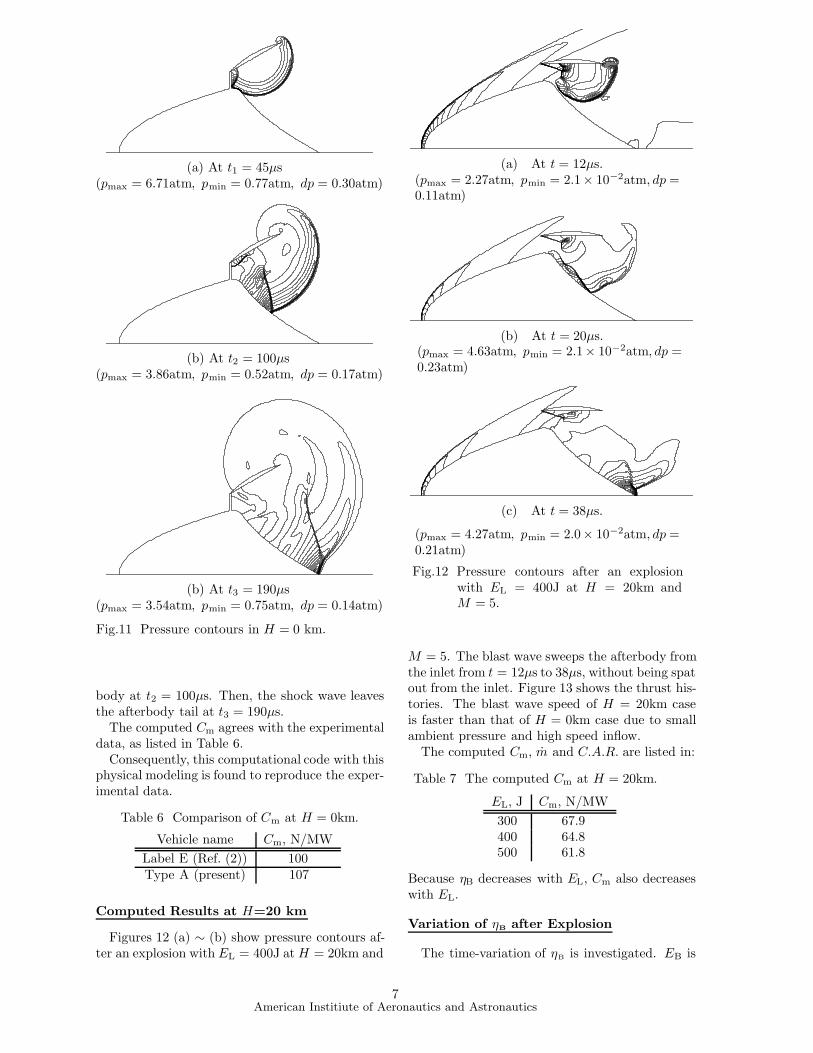
(a) At t1 = 45µs(pmax = 6.71atm, pmin = 0.77atm, dp = 0.30atm)
(b) At t2 = 100µs(pmax = 3.86atm, pmin = 0.52atm, dp = 0.17atm)
(b) At t3 = 190µs(pmax = 3.54atm, pmin = 0.75atm, dp = 0.14atm)
Fig.11 Pressure contours in H = 0 km.
body at t2 = 100µs. Then, the shock wave leavesthe afterbody tail at t3 = 190µs.
The computed Cm agrees with the experimentaldata, as listed in Table 6.
Consequently, this computational code with thisphysical modeling is found to reproduce the exper-imental data.
Table 6 Comparison of Cm at H = 0km.
Vehicle name Cm, N/MWLabel E (Ref. (2)) 100Type A (present) 107
Computed Results at H=20 km
Figures 12 (a) ∼ (b) show pressure contours af-ter an explosion with EL = 400J at H = 20km and
(a) At t = 12µs.(pmax = 2.27atm, pmin = 2.1× 10⁻²atm, dp =0.11atm)
(b) At t = 20µs.(pmax = 4.63atm, pmin = 2.1× 10⁻²atm, dp =0.23atm)
(c) At t = 38µs.
(pmax = 4.27atm, pmin = 2.0× 10⁻²atm, dp =0.21atm)
Fig.12 Pressure contours after an explosionwith EL = 400J at H = 20km andM = 5.
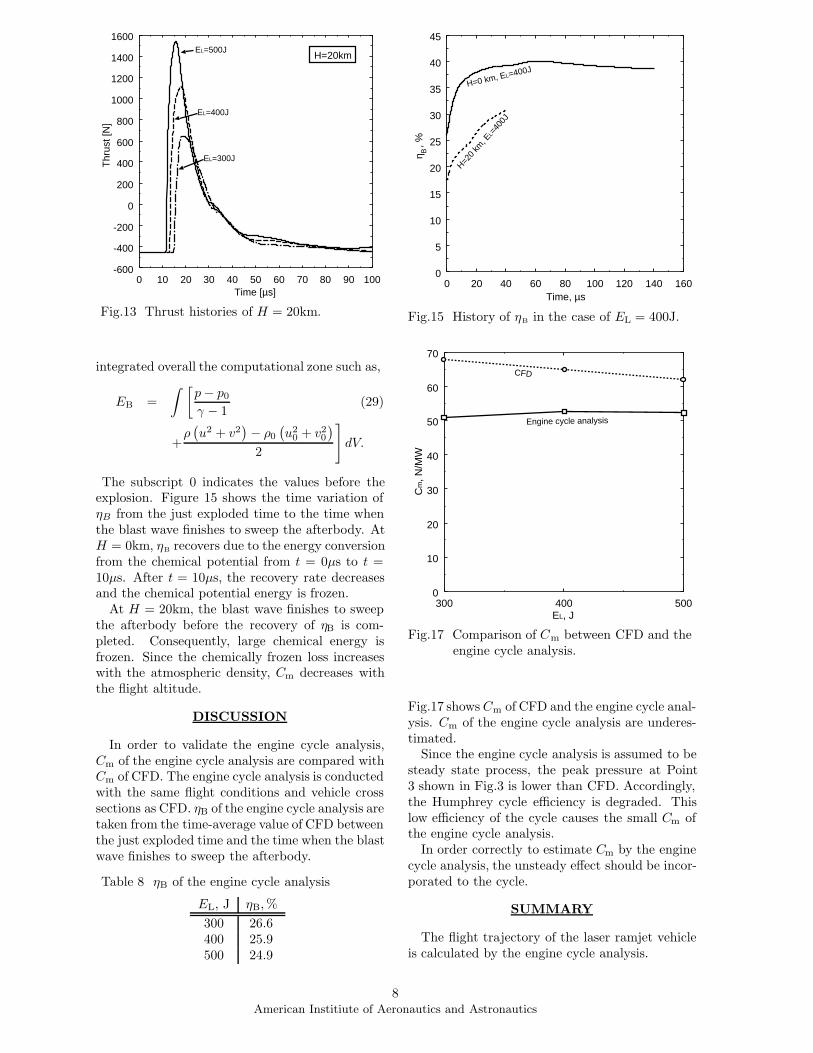
M = 5. The blast wave sweeps the afterbody fromthe inlet from t = 12µs to 38µs, without being spatout from the inlet. Figure 13 shows the thrust his-tories. The blast wave speed of H = 20km caseis faster than that of H = 0km case due to smallambient pressure and high speed inflow.
The computed Cm, m and C.A.R. are listed in:
Table 7 The computed Cm at H = 20km.
EL, J Cm, N/MW300 67.9400 64.8500 61.8
Because ηB decreases with EL, Cm also decreaseswith EL.
Variation of ηB after Explosion
The time-variation of ηB is investigated. EB is
7American Institiute of Aeronautics and Astronautics
-600
-400
-200
0
200
400
600
800
1000
1200
1400
1600
0 10 20 30 40 50 60 70 80 90 100
Thr
ust [
N]
Time [µs]
H=20kmEL=500J
EL=400J
EL=300J
Fig.13 Thrust histories of H = 20km.
integrated overall the computational zone such as,
EB =∫ [
p− p0
γ − 1(29)
+ρ
(u2 + v2
) − ρ0
(u2
0 + v20
)2
]dV.
The subscript 0 indicates the values before theexplosion. Figure 15 shows the time variation ofηB from the just exploded time to the time whenthe blast wave finishes to sweep the afterbody. AtH = 0km, ηB recovers due to the energy conversionfrom the chemical potential from t = 0µs to t =10µs. After t = 10µs, the recovery rate decreasesand the chemical potential energy is frozen.
At H = 20km, the blast wave finishes to sweepthe afterbody before the recovery of ηB is com-pleted. Consequently, large chemical energy isfrozen. Since the chemically frozen loss increaseswith the atmospheric density, Cm decreases withthe flight altitude.
DISCUSSION
In order to validate the engine cycle analysis,Cm of the engine cycle analysis are compared withCm of CFD. The engine cycle analysis is conductedwith the same flight conditions and vehicle crosssections as CFD. ηB of the engine cycle analysis aretaken from the time-average value of CFD betweenthe just exploded time and the time when the blastwave finishes to sweep the afterbody.
Table 8 ηB of the engine cycle analysis
EL, J ηB,%300 26.6400 25.9500 24.9
0
5
10
15
20
25
30
35
40
45
0 20 40 60 80 100 120 140 160
H=20
km, E
L=40
0J
H=0 km, EL=400J
Time, µs
η ,
%B
Fig.15 History of ηB in the case of EL = 400J.
0
10
20
30
40
50
60
70
300 400 500EL, J
Cm
, N/M
W
CFD
Engine cycle analysis
Fig.17 Comparison of Cm between CFD and theengine cycle analysis.
Fig.17 shows Cm of CFD and the engine cycle anal-ysis. Cm of the engine cycle analysis are underes-timated.
Since the engine cycle analysis is assumed to besteady state process, the peak pressure at Point3 shown in Fig.3 is lower than CFD. Accordingly,the Humphrey cycle efficiency is degraded. Thislow efficiency of the cycle causes the small Cm ofthe engine cycle analysis.
In order correctly to estimate Cm by the enginecycle analysis, the unsteady effect should be incor-porated to the cycle.
SUMMARY
The flight trajectory of the laser ramjet vehicleis calculated by the engine cycle analysis.
8American Institiute of Aeronautics and Astronautics

The CFD with the explosion source model canreproduce the experimental data of Cm. Using thisCFD model, Cm in the supersonic flight is com-puted. The results show Cm and ηB decrease withthe flight altitude due to chemically frozen flowloss.Cm by the engine cycle analysis is underesti-
mated in comparison with CFD. Since the enginecycle analysis is assumed to be steady state pro-cess, the peak pressure in the Humphrey cycle islower than CFD. Accordingly, the Humphrey cycleefficiency of the engine cycle analysis is degraded.This low efficiency of the cycle causes the smallCm of the engine cycle analysis.
REFERENCES
1) Raizer, Y.P.: Laser-Induced Discharge Phe-nomena, Consultants Bureau, New York andLondon, 1977, Ch.6.
2) Myrabo, L.N., Messitt, D.G., and Mead,F.B.Jr.: Ground and Flight Tests of a LaserPropelled Vehicle, AIAA Paper 98-1001, 1998.
3) Myrabo, L.N.: World Record Flights of Beam-Riding Rocket Lightcraft: Demonstration of“Disruptive” Propulsion Technology FlightTests of a Laser Propelled Vehicle, AIAA Pa-per 01-3798, 2001.
4) Wang, T.S., Mead, F.B.Jr., Larson, C.W.:Advanced Performance Modeling of Exper-imental Laser Lightcrafts, AIAA Paper 01-3664, 2001.
5) Bussing, T.R.A., and Pappas, G.: An Intro-duction to Pulse Detonation Engines, AIAAPaper 94-0263, 1994.
6) Shiramizu, M., Techincal Memorandum ofNational Aerospace Laboratory of JapanNo.598, 1989.
7) Gupta, R.N., Yos, J.M., Thompson R.A.and Lee, K.P.: A Review of Reaction Ratesand Thermodynamic and Transport Proper-ties for an 11-Species Air Model for Chemicaland Thermal Nonequilibrium Calculations to30,000 K, NASA RP 1232, 1990.
8) Park, C.: Review of Chemical-Kinetic Prob-lems of Future Flight NASA Missions, I: EarthEntries, Calculations to 30,000 K, J. Thermo-phys. Heat Transfer, 7 (1993), pp.385-398.
9) Wada, Y., and Liou, M.S. : A Flux SplittingScheme with High-Resolution and Robustnessfor Discontinuities, NASA TM-106452, 1994.
10) Edwards, J.R. : A Low-Diffusion Flux-Splitting Scheme for Navier-Stokes Calcula-tions, Computers & Fluids, 26 (1997), pp.635-659.
11) Jameson A., and Yoon, S. Lower-Upper Im-plicit Schemes with Multiple Grids for theEuler Equations, AIAA Journal,25 (1987),pp.929-935.
12) Matsuno, K. : Actual Numerical Accuracyof an Iterative Scheme for Solving Evolu-tion Equations with Application to Boundary-Layer Flow, Trans. Japan Soc. Aero. Space.Sci., 38 (1996), pp.311-322.
13) Ritzel, D.V., and Matthews, K.: An ad-justable explosion-source model for CFD blastcalculations, Proc. of 21st International Sym-posium on Shock Waves, pp.97-102,1997.
14) Botton, B., Abeele, D.V., Carbonaro, M.,and Degrez G.: Thermodynamic and Trans-port Properties for Inductive Plasma Model-ing, J. Thermophys. Heat Transfer, 13 (1999),pp.343-350.
15) Landau, L.D. and Lifshitz, E.M.: Fluid Me-chanics, 2nd ed., Butterworth-Heinemann,Oxford, 1987, Ch.14.
16) Messitt, D.G., Myrabo, L.N. and Mead,F.B.Jr.: Laser Initiated Blast Wave forLaunch Vehicle Propulsion, AIAA 2000-3848,2000.
17) Pirri, A.N., Root, R.G., and Wu, P.K.:Plasma Energy Transfer to Metal SurfacesIrradiated by Pulsed Lasers, AIAA J., 16(1978), pp.1296-1304.
9American Institiute of Aeronautics and Astronautics