
Feasibility study for the preparation of Blue Carbon ...
180
Feasibility study for the preparation of Blue Carbon offsetting projects in Andalucia, Spain
Transcript of Feasibility study for the preparation of Blue Carbon ...

Feasibility study for the preparation of Blue Carbon offsetting projects in Andalucia, Spain

The designation of geographical entities in this publication, and the presentation of the material, do not imply the expression of any opinion whatsoever on the part of IUCN or other participating organisations concerning the legal status of any country, territory or area, or of its authorities, or concerning the delimitation of its frontiers or boundaries.
The views expressed in this publication do not necessarily reflect those of IUCN or other participating organisations.
This publication has been made possible thanks to the generosity of Europe’s LIFE Programme through the LIFE BLUE NATURA ANDALUSIA project (LIFE 14/CCM/ES/000957) and the co-financiers to IUCN, the Cepsa Foundation and the MAVA Foundation.
Published by: IUCN, Malaga, Gland, Switzerland.
All rights reserved:2021 © IUCN, International Union for Conservation of Nature
Reproduction of this publication for educational or other non-commercial purposes is authorised without prior written permission from the copyright holder provided the source is fully acknowledged.
Reproduction of this publication for resale or other commercial purposes is prohibited without prior written permission of the copyright holder.
Citation:IUCN (2021). Feasibility study the preparation of Blue Carbon offsetting projects in in Andalucía, Spain. Otero, M (Ed). Pages 180.
Publishing and coordination:Maria del Mar Otero, IUCN Centre for Mediterranean Cooperation
Translated by: Mc Lehm Language Services
Layout by:Carmen Moreno
Front cover photograph: Seadam. Dreamstime.com
Available from: IUCN, International Union for Conservation of Nature. IUCN Centre for Mediterranean Cooperation. C/ Marie Curie 22 29590 Campanillas, Malaga, Spain
www.iucn.org/resources/publications
http://www.iucn.org/mediterranean
http://life-bluenatura.eu/
About the IUCN and the Centre for Mediterranean Cooperation:IUCN, the International Union for Conservation of Nature, is a membership union composed of sovereign states, governmental agencies and civil society organisations. It harnesses the experience, resources and reach of its more than 1,300 Member organisations and the input of more than 15,000 experts. IUCN is the global authority on the status of the natural world and natural resources and the measures needed to safeguard them.
The IUCN Centre for Mediterranean Cooperation opened in 2001 with the support of the Spanish Ministry of the Environment, the Government of Andalusia and the Spanish Agency for International Development Cooperation (AECID).
Over its nearly 20 years of existence, the Centre’s mission has been to influence, encourage and assist Mediterranean societies in conservation and sustainable use of natural resources, as well as sustainable development of the Mediterranean region.
Project Partners: Cofinance:

Feasibility study for the preparation of Blue Carbon offsetting projects in Andalucia, Spain

CONTENTS
ACKNOWLEDGEMENTS 6PRESENTATION 7APPLICABILITY OF THE METHODOLOGY 12
FEASIBILITY STUDY ON CABO DE GATASEAGRASS MEADOWS 14
INTRODUCTION 16
1. APPLICABILITY OF METHODOLOGY AND FEASIBILITY 18 1.1. Applicability of VM0033 Methodology 18 1.2. Project Boundaries 20 1.3. Determination of the Baseline and Additionality 23 1.4. Selection of the Baseline 23 1.5. Description of the Baseline 26 1.6. Estimation of Baseline GHG emissions and reductions 282. PROJECT SCENARIO 37 2.1. Description of the with project scenario 37 2.2. Estimation of with project scenario GHG emissions and reductions 40 2.3. Results of calculation of reduced emissions during the project lifetime 40
3. ACOST ANALYSIS 42 3.1. Methodology 42 3.2. Implementation costs 42 3.3. Cost results 46
4. RISK ANALYSIS AND ADDITIONALITY 48 4.1. Additionality 48 4.2. Risk analysis and buffer determination 48 4.3. Uncertainties and additional considerations 49
5. CONCLUSIONS AND RECOMMENDATIONS 50
6. BIBLIOGRAPHY 52

FEASIBILITY STUDY IN ODIEL AND CADIZ SALT MARSHES 54
INTRODUCTION 56
1. CAUSES OF WETLAND DEGRADATION 60 1.1. Applicability of methodology and feasibility 64 1.2. Project Boundaries 68 1.3. Determination of the baseline 75
2. PROJECT SCENARIOS 82 2.1. Identification of reference conditions 82 2.2. Assessment of wetland conditions 84 2.3. Vegetation 90 2.4. Estimation of the rate of sea level rise
from historical series detected by tide gauges 92 2.5. Analysis of sediments 94 2.6. Current determination of the different classes
of salt marshes in the intervention areas 96 2.7. Determination of the potential distribution of the
different classes of salt marshes in the intervention areas 96
3. PROJECT SCENARIO 98
4. QUANTIFICATION OF EMISSIONS REDUCTION 107 4.1. Estimation of emissions in the baseline scenario 107 4.2. Estimation of emissions after hydrological reconnection 112 4.3. Emissions reduction resulting from project interventions 117
5. ANALYSIS OF THE ECONOMIC COST OF THE INTERVENTIONS 121 5.1. Project costs 122 5.2. Monitoring costs 123 5.3. Validation/verification costs 123 5.4. Costs of registration 126
6. ANALYSIS OF UNCERTAINTY 129
7. FINANCIAL EVALUATION 129 7.1. Additionality and risk analysis 132 7.2. Complementary interventions 137
8. CONCLUSIONS AND RECOMMENDATIONS 140
REFERENCES 144
ANNEX 1. VCSconditions 146ANNEX 2.Riskfactors 148ANNEX 3. Analysisofnaturalregenerationinthestudyareas 152ANNEX 4. Determinationoftheabandonedstateofprojectareas 153ANNEX 5.Estimationofthesealevelincreaserateobservedbyareas 154ANNEX 6.IncoherencedetectionintheavailableMDT 156ANNEX 7.Interventionmeasures 157ANNEX 8.Estimationofemissionsintheareasofaction:
baselineandpostscenarioafterrestorationactions 163ANNEX 9.Financialindicators 168

FEASIBILITY STUDY FOR PREPARATION OF CARBON OFFSETTING PROJECTS
6 6
This publication would not have been possible without the expert knowledge generously provided by the members of the LIFE BLUE NATURA ANDALUSIA project Platform Advisory Group. We would particularly like to thank the following colleagues for their useful comments and the input of their knowledge to this work: Marta Hernandez de la Cruz (Spanish Climate Change Office, Ministry), Laurent Sainctavit (Ecodes), Malake Muñoz (Factor CO2/IHOBE), Jordi Sánchez (Submon), Alba Zamora and Lucia Santolaria (CEPSA) and Marga Capella (Bosques Sostenibles). We also gratefully acknowledge the project partners, the support and efforts from project coordination provided by the project director, Rosa Mendoza Castellón, of the Regional Government of Andalusia’s Ministry for Spatial Planning and the Environment, the technical coordinator, M. Soledad Vivas, as well as Elena Diaz Almela and Miguel Angel Mateo of the CSIC-CEAB, the General Secretariat for Environment and Climate Change team (Rafael Barba, Ana Belén Pinilla) and the AMAYA team (Susana Álvarez, Agustín Barrajón, Diego Moreno) and HyT (David León and Patricio Peñalver). We are also grateful for the invaluable support and contributions from the directors and the technical team of the Natural Parks of Cadiz Bay (Antonio Gomez Ferrer, Rafael Martín), Odiel Salt Marshes (Enrique Martínez Montes and Laura Refojo) and Cabo de Gata (Lucía Tejero), as well as Agustín Barrajón who helped us with his knowledge to define the intervention areas and to improve the work during its progress.
We would also like to thank those who joined the meetings to contribute their knowledge in discussion of this work during the course of these four years, among them Rafael Porras, Ainhize Butron, Mari Luz Gómez and Maria Garcia.
The work has been produced throughout with contributions from various consultants: Andrea Cortes, Remi Gautier, Gimenez Consultants, Jesus David Sanchez and David López of Mares Sostenibles and the Lavola team. We offer our profound appreciation to everyone for joining this pioneering and at times extremely difficult work. A final acknowledgement to the financiers of this work, Europe’s Life Programme through the LIFE BLUE NATURA ANDALUSIA project (LIFE 14/CCM/ES/000957) and the co-financiers to IUCN, the Cepsa Foundation and the MAVA Foundation.
ACKNOWLEDGEMENTS

7 FEASIBILITY STUDY
ON CABO DE GATA SEAGRASS MEADOWS
Coastal ecosystems composed of mangroves, salt marshes and seagrass meadows, such as the Posidonia oceanica beds in the Mediterranean, are important carbon pools. They sequester carbon in its organic form and store it for thousands of years. This capacity of coastal ecosystems to sequester and store large amounts of carbon is what has come to be called Blue Carbon (Laffoley, 2009). They also provide other important environmental services, such as coastal protection against rising sea levels and the increased intensity of storms, as well as supporting biodiversity and provision for fisheries, among others. These environmental services increase overall coastal resilience against climate change and sustain coastal livelihoods. However, despite the importance of ecosystem services, these habitats are disappearing at an alarming rate.
Conservation and restoration of these blue carbon sink habitats can contribute to local and global mitigation of and adaptation to climate change. Measures such as protecting habitat to prevent new emissions, habitat restoration and revegetation and interventions in sea or on land, such as reducing nutrient pollution, help to keep carbon stored, maintain CO2 absorption and control greenhouse gas emissions. To aid in this effort, new mechanisms and forms of financing are sought, such as carbon markets, to assist in conserving and restoring these important coastal ecosystems (Emmett-Mattox and Crooks, 2014).
Studies to date appear to show that both tidal marshes and seagrass meadows, especially of Posidonia oceanica, have outstanding storage capacity, retaining carbon stocks accumulated over thousands of years. So, protection, improved management and restoration of these ecosystems would prevent the loss of several Tg of carbon per year, which would result in a reduction in overall CO2 emissions estimated for 2050, according to the Intergovernmental Panel on Climate Change (IPCC) and the IPCC Special Report on the Ocean and Cryosphere in a Changing Climate1.
Both salt marshes and seagrass meadows are threatened continually due to coastal expansion and spread to allow creation of crops and housing developments and development of industrial and communication infrastructures. Illegal trawling practices, increased turbidity due to eutrophication
PRESENTATION
1 https://www.ipcc.ch/srocc/
Seagrass meadows of Posidonia oceanica Tidal saltmarshes©RUDMERZWERVER/DREAMSTIME
©SEADAM/DREAMSTIME

FEASIBILITY STUDY FOR PREPARATION OF CARBON OFFSETTING PROJECTS
8 8
and high sediment loads and pollution from spills degrade water quality and impact the meadows. Salt marshes are also severely affected by drainage to reclaim land from the sea, by the construction of marinas and residential complexes or roads and by dredging.
The sum of these interventions sometimes causes degradation or destruction of these habitats, resulting in the gradual release of the accumulated CO2 back into the atmosphere. There is, therefore, a need to implement projects to restore, improve and maintain the blue carbon pools that help mitigate greenhouse gas (GHG) emissions, while protecting the services and resources they provide. Carbon markets could contribute to achieving these conservation objectives by enabling specific sustainable management activities to be funded by voluntary mechanisms.
Voluntary markets, based on commitments by private companies and entities seeking to offset the environmental impacts their production activity generates, could contribute to achieving conservation objectives in this way. Among the mechanisms and tools for regulating and verifying interventions in these markets is the Verified Carbon Standard (VCS), an international standard for GHG emissions reduction and offsetting projects and programmes. This standard sets the applicable requirements and methodologies for developing, validating, monitoring and verifying these types of actions. It is the most advanced standard in coastal carbon and has recently developed requirements and methodologies for crediting of wetland and seagrass restoration projects.
Figure 1: Overview of interactions between compliance and volunteer carbon markets including previous under the Kyoto Protocol (KP) and new ones under development with the Paris Agreement (PA). Adapted from NewClimate Institute; Lambert Schneider.
INTERNATIONAL OR BILATERAL STANDARDS
InternationalEmissionTrading
KP:JointImplementation,CleanDevelopmentMechanism
PA:CooperativeApproaches,SustainableDevelopmentMechanism(Article6)
CarbonOffsettingandReductionSchemeforInternationalAviation(CORSIA)
EXAMPLES OF GOVERNMENTAL STANDARDS
SpanishVoluntaryCarbonOffsettingScheme(Spain)
AndalusianEmissionsOffsetSystem(Spain)
BritishColumbiaOffsetProgram(Canada)
Labelbas-carbone(France)
PeatlandCarbonCode,WoodlandCarbonCode(UK)
COMPLIANCEMARKET
Tofulfillacomplianceobligation
Eg.Paristarget,EUETS,California
cap-and-trade
VOLUNTARY MARKET
Tomakeavoluntarycontribution
NON-GOVERNMENTAL INTERNATIONAL STANDARDS

9 FEASIBILITY STUDY
ON CABO DE GATA SEAGRASS MEADOWS
To date, however, their use in conserving or restoring these ecosystems in Europe has not been assessed.
National carbon offsetting initiatives have been implemented in several European countries in recent years. This increasing interest has arisen from organisations’ desire to offset their emissions with local projects, rather than projects in developing countries with which they have more limited links. For this reason, new initiatives are being generated in some regions to promote the development of voluntary carbon standards and markets as part of their strategy for mitigating climate change.
In Andalusia, the recently passed Climate Change Act marks a new regulation aimed at so-called “diffuse emissions” and new mandatory and voluntary instruments, noteworthy among which is the Andalusia Emissions Offsetting System (SACE - Sistema Andaluz de Compensación de Emissions). This is a voluntary framework in which companies take on commitments to audit, reduce and offset their emissions, providing for the creation of a catalogue of offsetting projects. This catalogue is intended to include those projects that meet the requirements laid down and are available to the affiliated companies, which will be able to acquire the Removal Units generated and certified for this purpose.
The offsetting anticipated in the SACE is to be through projects for afforestation, reforestation and conservation of forests, coastal ecosystems, marine meadows and wetlands, as well as those for conserving or increasing soil organic matter content in forestry or agriculture. This mechanism creates the option of offsetting CO2 emissions by implementing such projects, including blue carbon projects for the first time.
The IUCN Centre for Mediterranean Cooperation, as the beneficiary partner of the LIFE Blue Natura (LIFE14CCM/ES/000957) project, drew up a series of actions for preparation and future implementation of carbon projects to conserve and generate Blue Carbon within the project framework. Among those is this present work, the aim of which is to evaluate the feasibility of potential projects that would become part of the SACE or voluntary markets, according to the VCS standard, in coastal wetlands and Posidonia oceanica seagrass meadows.
Figure 2: Carbon offsetting allows to balance out climate impacts (e.g. from business) after reduction efforts and compensate for the emissions produce by reducing CO2 (and other GHG) elsewhere.
Offseting through a credited
standardGrasping emission amount
Making reduction efforts
Emissions which are difficult to reduce
Reduction and absorption amount at different places
+CO2 other GHGs
Emitter A Project compensation(Site B)
–CO2 other GHGs
Support (Funds., etc.)
Credit

FEASIBILITY STUDY FOR PREPARATION OF CARBON OFFSETTING PROJECTS
10 10
Case studies in seagrass meadows and salt marshes are used to conduct a comparative analysis with various types of interventions and scenarios (various well-preserved or degraded habitats, mixed meadows and estuary marshes) for the carbon credits that could be generated through offsetting projects traded on the voluntary carbon market. The results of these experiences and case studies will aid in development of the new standard for meadows and coastal wetlands (action C4) and implementation of the first projects that would become part of the SACE catalogue (action C7).
The study focuses on analysing various planned interventions in coastal marshes and Posidonia oceanica meadows in Andalusia. The spectrum of blue carbon activities can include conservation (preventing release of GHGs to atmosphere) and restoration/creation (establishing absorption of CO2 from the atmosphere and/or reducing CH4 emissions). This means that a blue carbon project can protect the ecosystem against degradation (e.g. caused by the removal of vegetation or the loss and/or oxidation of carbon from wetland soil) or it can sequester carbon by creating carbon sinks in the form of growing vegetation (e.g. by restoring salt marshes or seagrass vegetation), improving carbon storage in soils and sediments (e.g. by inducing production of litter and creating the necessary hydrological conditions), or re-establishing salinity conditions to reduce CH4 emissions (IUCN, 2021).
The selection of intervention areas and measures for this feasibility study, carried out with an Expert Advisory Group, were proposed to evaluate different types of projects that would include and could appraise the principles and criteria defined beforehand for the two coastal ecosystems:
In coastal salt marshes:• Recovery of small-scale salt ponds.• Restoration of tidal flow.• Earth moving or lowering.• Earth lowering and inclusion of vegetation.
Figure 3: Graphical representation of the types of activities, outputs expected from blue carbon projects and enabling factors. TheprojectcangeneratenetnegativeemissionsbyavoidingthereleaseofCO2bydecreasingtheoxidationofsoilorganiccarbon(“avoidedlosses”or“stop-loss”);or/andbyincreasingtheuptakeofCO2byincreasingcarbonsequestrationinsoilsandplantsthroughenhanceprotection,restorationorcreation.
BLUE CARBON
TECHNICAL FEASIBILITY
OTHER ENABLING
FACTORS
FINANCIAL FEASIBILITY
STAKEHOLDER PARTICIPATION
EMITSEQUESTER
PROTECT
RESTORE (AVOID)
RESTORE OR CREATION
STORE

11 FEASIBILITY STUDY
ON CABO DE GATA SEAGRASS MEADOWS
In Posidonia oceanica seagrass meadows: • Restoration of meadows degraded by mechanical action.• Revegetation in degraded areas.
With this, several intervention areas were selected: One area in the Cabo de Gata-Nijar Natural Park, three areas in Cadiz Bay, included within the protected area of the same name, except for the so-called “Las Aletas”, and three areas in the Odiel Salt Marshes, all belonging to the space declared a Natural Site, with a total area of 443.59 hectares distributed as shown. All the areas are public land, the management of which depends on various authorities according to the distribution of competences in force in each case.
©LIFEBLUENATURA
Platform Advisory Group and Partners of the Project, 2018.

FEASIBILITY STUDY FOR PREPARATION OF CARBON OFFSETTING PROJECTS
12 12
The Verified Carbon Standard (VCS) methodologies applicable to restoration projects are VM0033 “Methodology for Tidal Wetland and Seagrass Restoration”, Version 1.0 and, in addition, VM0024 “Methodology for Coastal Wetland Creation”, Version 1.0, both of which are included in the Wetlands Restoration and Conservation (WRC) category. These methodologies are part of the eligible AFOLU (Agriculture, Forestry and Other Land Use) project categories. Some additional considerations of the VCS AFOLU Requirements Guide, version 3.4, were therefore also taken into account in preparing this document.
The following methodological tools mentioned in the selected methodology were also used as references:
• AR-TOOL14 “Estimation of carbon stocks and change in carbon stocks of trees and shrubs in A/R CDM project activities” (Version 04.2),
• CDM Tool “Combined tool to identify the baseline scenario and demonstrate additionality in A/R CDM project activities” (Version 01),
• VCS module VMD0019 Methods to Project Future Conditions,
• CDM tool Estimation of GHG emissions related to fossil fuel combustion in A/R CDM project activities,
• VCS module VMD0016 Methods for stratification of the project area,
• CDM tool for testing significance of GHG emissions in A/R CDM project activities.
The document replicates the structure of a Project Description Document (PDD), this being the reference document for validation/verification processes under the VCS standard, regardless of whether the interventions are finally brought to fruition in one or more projects. This aspect will be defined for each of the reference scenarios.
The elements to be considered in the feasibility study follow those described in the recent Manual for Blue Carbon (IUCN, 2021) and the main requirements for the voluntary international carbon market (VCS).
To assess the feasibility of these projects, special attention is also paid to description of the baseline, risk analysis and additionality, as well as eligibility under potential carbon market and VCS scenarios.
APPLICABILITY OF THE METHODOLOGY

13 FEASIBILITY STUDY
ON CABO DE GATA SEAGRASS MEADOWS
Additionality Determiningwhethertheproposedprojectqualifiesforcrediting.
Methodology MethodforquantifyingemissionsreductionsandremovalsusingVerifiedCarbonStandardsmethodologyandtheircomparisonwithotherinternationalquantificationsapplicabletoseagrassmeadows,ifany.
Risk mitigationProposingactionstomitigatehighriskfactors.
Crediting volume Quantifyingthecreditissuingrangeindifferentscenarios(economicandenvironmental).
Development costEstimatingdesignanddevelopmentcosts,includingriskmitigationactions.
Risk factorsIdentifyingcurrentrisksofcreditandcredittrading.
Income flowCalculatingtherangeofincomeforproposedprojectsfromlong-termcredittrading.
The following sections describe the application of the methodology to case studies on seagrass meadows and coastal wetlands.

FEASIBILITY STUDY FOR PREPARATION OF CARBON OFFSETTING PROJECTS
14 14
FEASIBILITY STUDY ON CABO DE GATA SEAGRASS MEADOWS

15 FEASIBILITY STUDY
ON CABO DE GATA SEAGRASS MEADOWS
©PATRIKFORSBERG/DREAMSTIME

FEASIBILITY STUDY FOR PREPARATION OF CARBON OFFSETTING PROJECTS
16 16
INTRODUCTION
Meadows of Posidonia oceanica, an endemic species unique to the Mediterranean, are an important and complex marine ecosystem, and the populations of the species off the coast of Andalusia represent its most westerly limit of distribution. Its distribution in the region is estimated to be around 6,700 hectares in willow waters up to 30-40 m deep.
The coast of Andalusia has, since 1950, continually confronted urban, tourist, agricultural and industrial development until recently, with the consequences of the Covid-19 pandemic. Despite the importance of seagrass meadows on sea beds in Andalusia, the distribution and condition of Posidonia oceanica have been devastated as a result of factors such as attrition from trawling, coastal activities and coastal development (Arroyo et al., 2015). Destruction and fragmentation of these natural habitats can generate substantial ecological effects by significantly altering their biodiversity and the maintenance of their integrity, as well as their capacity to store and sequester greenhouse gases.
The Maritime-Terrestrial Natural Park of Cabo de Gata-Níjar is a protected natural area located in the province of Almería, Andalusia. It was created in 1987 to conserve its natural ecosystems and values landscaping, attending to educational, cultural, scientific, recreational and socio-economic interests. It is one of the Spanish natural coastal areas with a greater number of protection figures, both of a natural and cultural nature. The fauna and flora of the park include a large group of species especially interesting due to being endemic or of restricted geographic distribution, threatened with extinction, essential for the normal development of ecosystems or constitute a considerable economic resource. The catalogue of plant species consists of more of 1000 terrestrial species and up to 250 marine species, among which are some of the utmost ecological importance such as Posidonia oceanica.
Intervention area in Agua Amarga with pleasure boats.©M.OTERO/UICN

17 FEASIBILITY STUDY
ON CABO DE GATA SEAGRASS MEADOWS
One of the factors causing degradation of meadows along the coastline of the Cabo de Gata-Nijar Natural Park is free anchorage (Arroyo et al., 2015), which uses anchoring systems that damage seagrass meadows. The study area is at Agua Amarga, a village in the Natural Park where the most extensive field of free buoys for anchoring boats has been identified (Lampreave and Barrajón, 2016). This is for small recreational craft, especially during the summer season. The buoys with concrete dead weight anchors and chains drift with sea movements, generating degradation and GHG emissions that increase over time.
Considering that some of these meadows, such as those in the willows of Agua Amarga, can store up to 4,530.6 tCO2e (Mateo et al., 2019), establishing actions aimed at restoring and protecting these carbon-rich ecosystems and other ecosystem services is imperative. The proposed restoration actions to be taken in this area are:
Removalofdeadweightanchors
Installationandmaintenanceofeco-friendlymoorings(maintenanceandmonitoringofeco-friendlymooringgear,awareness-raisingprogrammes)
ReplantingofPosidoniawithcuttingsandseeds
For preparation of the feasibility study, the information available for the area includes information on carbon stocks and sequestration in its first metre of sediment in meadows at three medium depths, as well as stocks and sequestration in meadows in other areas under differing conservation status and pressure conditions (degradation due to mechanical action, impact due to pollutants, recolonisation, etc.). There is also information on average sediment accretion rate and thematic mapping of the meadows.

FEASIBILITY STUDY FOR PREPARATION OF CARBON OFFSETTING PROJECTS
18 18
FEASIBILITY REQUISITOS OBSERVATIONS
Condition 1 Meets VCS requirements
To restore meadow habitats, elimination of interfering agents such as dead weight anchors, dragging chains and associated buoys is planned. These, in themselves, are still increasing degradation and preventing natural ecosystem recovery. Those dead weight anchors that are already integrated into the P. oceanica meadow will be left there, but will not be used.
Eco-friendly moorings will also be installed to prevent the installation of new free anchorages. These have a spiral or screw system for securing them to the bed that generates minimal impact as they are installed in clearings in the meadow. The intermediate float prevents dragging of the chains and movement of the concrete block due to powerful drags, so preventing mechanical loss of plants and the associated GHG emissions. A system of monitoring and education of the users who generate the degradation was also planned.
Condition 2 Meets VCS requirements
The causes of P. oceanica habitat degradation and the corresponding activities to counteract them are related to terms d, e and f, thus a, b and c do not apply.
Meadows degraded by free anchorages are more susceptible to invasive species (Tecnoambiente, 2017). Thus, eliminating the threat of habitat loss prevents arrival of new invasive species. It also prevents sediment release from the dead plant mat and therefore increased water turbidity.
Although efforts will initially focus on restoration activities by removing agents that interfere with the habitat (as described in condition 1), the project includes replanting of Posidonia oceanica using cuttings and/or seeds.
The installation of eco-friendly moorings is the product of thorough management studies and plans for the affected areas. Their installation is also safer and more practical than free anchorage, leading users to prefer them when they are available. Activities for monitoring, and especially those to educate boat users, also help to avoid losses due to further degradation.
Condition 3 Meets VCS requirements
The project activities are designed to make the restoration and conservation of the Posidonia oceanica meadows compatible with nautical and fishing activities, which are a major tourist attraction and of great economic value to the region. Replacing the free anchorages with the eco-friendly system at Agua Amarga and Carboneras ensures continuity of land use and of the level of services offered before the project began. The project may even be implied to help the continuity of these services by conserving habitat, landscape value and the aesthetics of the place.
Condition 4 N/A There are no trees in the project area.
Condition 5 N/A Prescribed biomass burning activities will not be carried out during this project’s activities.
Condition 6 N/A No reductions of this type will be claimed for this project’s activities.
Verified Carbon Standard (VCS2) methodology VM0033 for Tidal Wetland and Seagrass Restoration, Version 1.0, part of the Wetlands Restoration and Conservation (WRC3) category of Sectoral Scope 14 relating to Agriculture, Forestry and Other Land Uses (AFOLU4).
This methodology is applicable under a number of conditions with which, according to the information, the project can be concluded to comply (Table 1, Annex 1).
1. APPLICABILITY OF METHODOLOGY AND FEASIBILITY
2 Verified Carbon Standard 3 Wetlands Conservation and Restoration 4 Agriculture, Forestry and Other Land Uses
Table 1. Results of the feasibility study according to the VM0033 methodology.In addition, the project needs to follow the methodological requirements of AFOLU projects that apply. In this case, the reference category is “Wetland Conservation and Restoration (WCR)”.
1.1. Applicability of VM0033 Methodology

19 FEASIBILITY STUDY
ON CABO DE GATA SEAGRASS MEADOWS
FEASIBILITY REQUISITOS OBSERVATIONS
Condition 7 N/A No fires have been reported in the project area (it is an underwater area).
Condition 8 Meets VCS requirements
The project area is wet at all times. Posidonia oceanica is an underwater plant that lives at depths of between 1 and 40 metres on the coast of Almeria. This feature ensures that revegetation activities will be fulfilling this condition.
Condition 9 N/A Project activities do not qualify as IFM or REDD, because the project area does not have woody or forest vegetation.
Condition 10 N/A There are no forestry activities in the project area, because there are no trees.
Condition 11 Meets VCS requirements
The project activities are carried out in an underwater area, therefore no water table levels are affected.
Condition 12 Meets VCS requirements
No project activities were planned related to this point, therefore there is no increase in GHG outside the project area.
Condition 13 Meets VCS requirements The project activities at Agua Amarga do not include any type of burning.
Condition 14 Meets VCS requirements
No application of this type of fertiliser is planned for the project replanting activities. A replanting method will be used to ensure that the use of nitrogen fertilisers is excluded.
AFOLU WCR, Condition 1
Meets VCS requirements
The project activities will be carried out in full compliance with the national legislation in force. Within the Master Plan for Use and Management (PRUG – Plan Rector de Uso y Gestión) for the Cabo de Gata-Nijar Park (nautical activities section, point 3), anchoring in areas that shelter seagrass communities or in places where there are fixed anchor points is prohibited. Likewise, the Natural Resources Management Plan (PORN – Plan de Ordenación de los Recursos Naturales) for the park raises the need to harmonise conservation activities with tourist and economic activities in the area, although the lack of instruments to apply the rules (monitoring personnel and permanent anchorages) is also stressed.
AFOLU WCR, Condition 2
Meets VCS requirements
The nautical activities that have degraded the meadows have been taking place for approximately 15 years, as can be seen in the satellite photographs of the area with simple historical browsing using Google Earth. Also, the latest Natural Resources Management Plan (section 2.3.2.6), published on 5 February 2008, described how traditional and sport fishing activities were taking place in the park area since before its publication. Agua Amarga is one of the main anchorage and beaching areas for traditional and especially sport fishing activities. Although the installation of or anchoring with free buoys has been illegal since 1994, growth in demand for nautical activities, in addition to the lack of a system of anchorage in keeping with conservation interests, has led to users with boats arriving and improvising free anchorages (Concejeria de Medio Ambiente de Andalucía, 2008).
AFOLU WCR, Condition 3
Meets VCS requirements
The project area is underwater and there is no evidence of drainage of any type in the project area.
AFOLU WCR, Condition 4
Meets VCS requirements
The Agua Amarga project area is considered to be public, marine-terrestrial domain. Article 132.2 of the Spanish Constitution stipulates that the law determines what property is in public state domain, with the sea-terrestrial zone, beaches, territorial sea and the natural resources of the economic zone and of the continental shelf being so in any case. Article 149.1.23 also establishes the exclusive competence of the State for basic legislation on environmental protection, without prejudice to the powers of the autonomous regions to establish additional rules for protection.
The project area is administered by the Regional Government of Andalusia and is governed by the Natural Resources Management Plan and the Master Plan for Use and Management for the Cabo de Gata-Nijar Natural Park. This condition guarantees that the project proponent has the capacity to perform the conservation and restoration activities over the long term.
AFOLU WCR, Condition 5
Meets VCS requirements
Seagrass meadows are included within the RAMSAR Convention definition of wetlands5. The RAMSAR classification includes seagrass meadows within the category of Marine and Coastal Wetlands, more specifically within point B, entitled Marine subtidal aquatic beds.
5 Wetlands are defined as: “areas of marsh, fen, peatland or water, whether natural or artificial, permanent or temporary, with water that is static or flowing, fresh, brackish or salt, including areas of marine water the depth of which at low tide does not exceed six metres”. Furthermore, “they may incorporate riparian and coastal zones adjacent to the wetlands, and islands or bodies of marine water deeper than six metres at low tide lying within the wetlands”.

FEASIBILITY STUDY FOR PREPARATION OF CARBON OFFSETTING PROJECTS
20 20
CARBON POOL INCLUDED JUSTIFICATION/EXPLANATION
Baseline
Aboveground tree biomass No There is no aboveground tree biomass in the project area.
Aboveground non-tree biomass Yes Growth of Posidonia oceanica is slow, however this carbon
pool is included.
Belowground biomass Yes
This pool accounts for only 0.3% of the organic carbon (Fourqurean et al., 2019) and is therefore not a significant portion of carbon, however, it will be quantified together with the aboveground non-tree biomass.
Litter NoLitter is conservatively excluded due to the rapid decomposition of Posidonia oceanica leaves and their movement by tidal currents. (Fourqurean et al., 2019).
Dead wood No There is no tree biomass in the project area, so it is excluded conservatively.
Soil YesSoil is the most important carbon reservoir in seagrass meadow habitat (Fourqurean et al., 2019), especially in Posidonia oceanica meadows.
Wood products No There is no aboveground tree biomass in the project area.
Project
Aboveground tree biomass No The project scenario will not generate aboveground biomass, therefore it is excluded.
Aboveground non-tree biomass Yes
Project activities seek to avoid biomass loss (non-tree) by mechanical degradation and to remove carbon from the atmosphere by replanting, therefore a small variation is expected in this pool compared to the baseline.
Belowground biomass Yes
This pool accounts for only 0.3% of the organic carbon (Fourqurean et al., 2019) and is therefore not a significant portion of carbon, however, it will be quantified together with the aboveground non-tree biomass.
Litter NoLitter is conservatively excluded, as Posidonia oceanica leaves decompose very quickly and they are moved by tidal currents. (Fourqurean et al., 2019).
Dead wood No There is no tree biomass in the project area and the project activities will not alter this pool, so it is excluded.
Soil Yes Included, project activities are expected to prevent GHG loss from this pool in relation to the baseline.
The carbon pools included in and excluded from the project scope, as well as the sources of greenhouse gas (GHG) emissions considered for calculation of emissions/removals both in the baseline and in the project are presented in Table 2 and Table 3 respectively.
1.2. Project Boundaries
Scope of the Project
Table 2. Definition of the project boundary and identification of sources, pools and deposits of GHGs relevant to the project and the reference scenarios.

21 FEASIBILITY STUDY
ON CABO DE GATA SEAGRASS MEADOWS
EMISSION SOURCE GAS INCLUDED JUSTIFICATION/EXPLANATION
Baseline
Production of CH4 by microbes CH4 No
In general, activities involving the rewetting of areas by drained freshwater systems are more likely to generate increases in methane. (Fourqurean et al., 2019). Therefore, this gas is not included, as no such activities are to be carried out in the Agua Amarga project.
Nitrification/Denitrification N2O No
N2O emissions are generally negligible, unless the ecosystem is exposed to a source of nitrates, such as fertiliser runoff (Fourqurean et al., 2019), which is not the case for the Agua Amarga project. Seagrass meadow restoration projects do not require accounting for N2O emissions (Restore Americas Estuaries y Silvestrum, 2015).
Burning of biomass and organic soil
CO2 NoBurning of biomass and organic soil is not a common practice within the scope of the project, as it is an underwater area.
CH4 No
N2O No
Burning of fossil fuels
CO2 NoBurning of fossil fuels is not a common practice within the scope of the project. CH4 No
N2O No
Project
Production of CH4 by microbes CH4 No
In general, activities involving the rewetting of areas by drained freshwater systems are more likely to generate increases in methane. (Fourqurean et al., 2019). Therefore, this gas is not included as no such activities are to be carried out in the Agua Amarga project.
Production of CH4 is directly related to salinity (Poffenbarger, Needelman y Megonigal, 2011). A value of zero can be assumed for CH4 emissions for systems with salinity levels of over 18 ppt. Therefore, as the project area is a marine area, the salinity level is above 30 ppt, and a value of zero will be assumed for CH4.
Nitrification/Denitrification N2O No
N2O emissions are generally negligible, unless the ecosystem is exposed to a source of nitrates, such as fertiliser runoff (Fourqurean et al., 2019). Agua Amarga is not exposed to this type of pollutant, therefore it is excluded.
Seagrass meadow restoration projects do not require accounting for N2O emissions(Restore Americas Estuaries y Silvestrum, 2015). Furthermore, the replanting activities specifically avoid the use of fertilisers that could affect this pool.
Burning of biomass and organic soil
CO2 NoBurning of biomass and organic soil is not anticipated during project activities.CH4 No
N2O No
Burning of fossil fuels
CO2 No Fossil fuel use during transport and machinery for project activities can be considered as de minimis. Removal of dead weight anchors and installation of eco-friendly moorings are activities that are carried out only once at the beginning of the project. Maintenance is performed in two or three days with minimal fuel use.
CH4 No
N2O No
Table 3. Sources of Emission.

FEASIBILITY STUDY FOR PREPARATION OF CARBON OFFSETTING PROJECTS
22 22
For the carbon estimates for the Agua Amarga project, two gases considered in the soil sink methodology have been excluded: nitrous oxide (N2O) and methane (CH4). Emissions from these sources are strongly related to salinity levels and are considered negligible. This is particularly the case for methane, which can be excluded if the salinity level is over 18 ppt. The salinity for the project area is approximately 37 ppt. Nitrous oxide is more dependent on nitrogen fertiliser sources and as, according to the park managers, the project area does not use (and will not use) these fertilisers, this gas has also been excluded from the calculations.
Exclusion of Nitrous Oxide and Methane
The project time limit matches the period for which the project is eligible for claiming emissions reductions due to restoration. This period is set through the “Soil organic carbon Depletion Time” (SDT), which is calculated as:
Project Time Limit
Where :
tSDT-BSL,i = SDT in the baseline scenario in stratum i (in years elapsed since the project start date).
C,i,t0 = Average organic carbon stock in mineral soil in stratum i at the project start date (tCO2/ha)
RateCloss-BSL,i = Ratio of carbon emissions due to oxidation in the baseline scenario for stratum i (tCO2/ha·year)
i = 1, 2, 3 …MBSL strata defined for the baseline scenario
tSDT-BSL,i = C,i,t0 / RateCloss-BSL,i
©M.OTERO/IUCN
23 FEASIBILITY STUDY
ON CABO DE GATA SEAGRASS MEADOWS
©ANDREAMUSCATELLO/DREAMSTIME
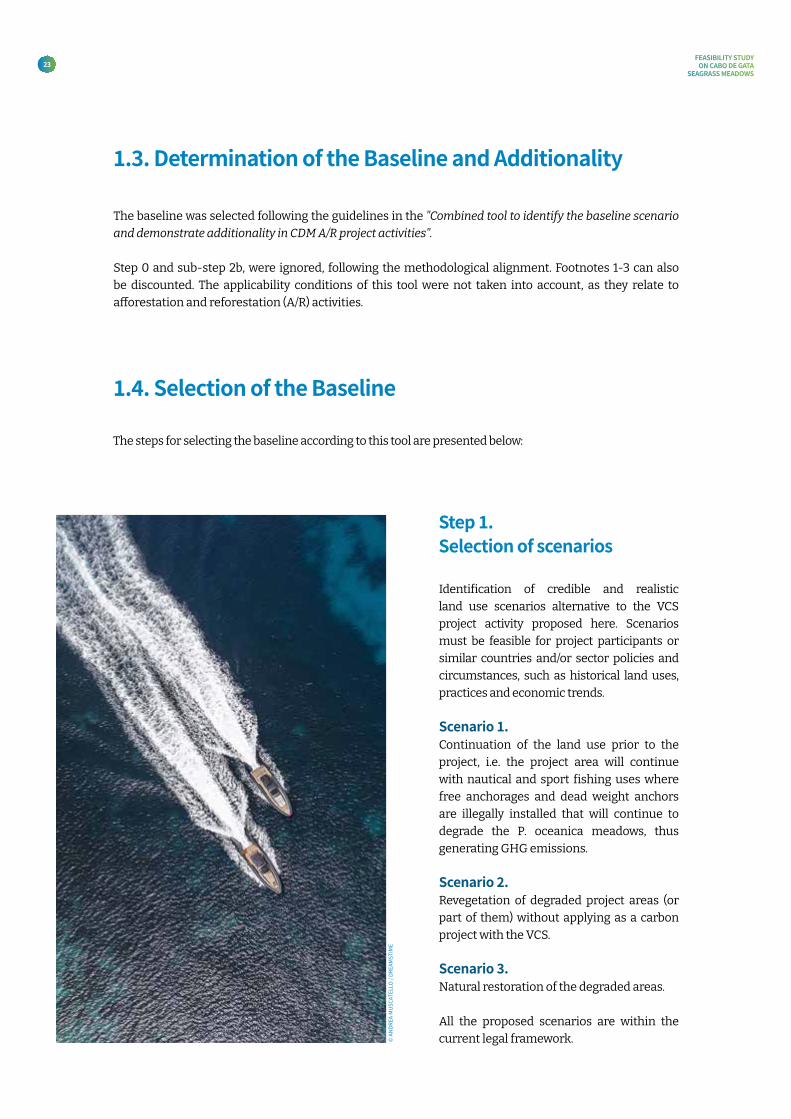
The baseline was selected following the guidelines in the "Combined tool to identify the baseline scenario and demonstrate additionality in CDM A/R project activities".
Step 0 and sub-step 2b, were ignored, following the methodological alignment. Footnotes 1-3 can also be discounted. The applicability conditions of this tool were not taken into account, as they relate to afforestation and reforestation (A/R) activities.
Identification of credible and realistic land use scenarios alternative to the VCS project activity proposed here. Scenarios must be feasible for project participants or similar countries and/or sector policies and circumstances, such as historical land uses, practices and economic trends.
Scenario 1. Continuation of the land use prior to the project, i.e. the project area will continue with nautical and sport fishing uses where free anchorages and dead weight anchors are illegally installed that will continue to degrade the P. oceanica meadows, thus generating GHG emissions.
Scenario 2. Revegetation of degraded project areas (or part of them) without applying as a carbon project with the VCS.
Scenario 3. Natural restoration of the degraded areas.
All the proposed scenarios are within the current legal framework.
The steps for selecting the baseline according to this tool are presented below:
1.4. Selection of the Baseline
1.3. Determination of the Baseline and Additionality
Step 1. Selection of scenarios

FEASIBILITY STUDY FOR PREPARATION OF CARBON OFFSETTING PROJECTS
24 24
This step serves to identify realistic and credible barriers for the alternative scenarios to the proposed VCS project. They must not be specific to project participants, but rather must apply to the proposed project activity. These may be investment (except for insufficient financial returns), technological, institutional or other barriers, as can be seen in the brief description included below. Table 4 summarises the results of this analysis.
Step 2. Barrier analysis
ALTERNATIVE SCENARIOS
SCENARIO 1 Continuation of the land use prior to the project
SCENARIO 2 Revegetation of degraded areas without VCS project
SCENARIO 3 Natural regeneration
Investment
Institutional
Technological
Local traditions
Common practices
Ecological conditions
Social conditions
Land ownership
Table 4. Barriers identified at Agua Amarg
Scenario 1 barrier analysis: Continuation of the land use prior to the project (Statu Quo)
Reconciling economic development and the sustainability of natural resources remains a challenge, as can be seen at Agua Amarga, where the local economy relies heavily on fishing, tourism and nautical activities, which have been increasing over around 15 years. The pressure from and poor practices of some of these activities have generated the degradation dynamics in the Posidonia oceanica meadows in the area.
Posidonia oceanica is highly protected by national laws and regulations and various national and international agreements. Thus, the park Master Plan for Use and Management prohibits free anchorage, specifically over seagrasses (point 4.2.8 on public use, environmental education and tourist activities). However, there are limitations in applying the legislation to prevent free anchorages. This is because there is no regional or national budget for performing the necessary management, which requires monitoring, surveillance and alternatives such as eco-friendly moorings. These management activities have high costs, both initially and for long-term maintenance. This problem of free anchorages affects numerous areas, not just Agua Amarga, and is well documented. Many marine protected area (MPA) management agencies or local authorities lack the resources to enforce their anchoring regulations (Milazzo et al., 2004).
That is why implementation of the necessary activities to conserve the seagrasses at Agua Amarga would not be possible without alternative funding, such as from the carbon market. That is, there is currently no barrier to prevent the current scenario, where the degradation dynamics increase the loss of Posidonia oceanica meadows every year.

25 FEASIBILITY STUDY
ON CABO DE GATA SEAGRASS MEADOWS
Scenario 2 barrier analysis: Revegetation of degraded areas without VCS project
New efforts have been made in recent years to replant Posidonia oceanica meadows, with some promising results, but without long-term guarantees (beyond 5 years)6. Indications of the costs of revegetation are known (especially high as it is a marine environment) and some methods have been published. The survival percentage from such efforts and cost is very low (around 90% with cuttings)6. One example of the costs is found in the recent study carried out by the Spanish electricity transmission system operator, Red Eléctrica Espyearla (REE), showing that in the case of planting 10,000 m2/campaign, the total cost would be €158,720.00 for revegetation using fragments or cuttings and €104,576.00 for revegetation using Posidonia oceanica seeds. These costs include materials, human resources, technical resources and associated logistics (REE, 2018). Posidonia oceanica plants grow slowly, with the rhizomes growing only 1-6 cm year-1 (Marba et al., 1996). This makes other investment possibilities more difficult, as well as requiring the aid of professional staff to guide implementation of the actions.
The current idea, from the public sphere, is also to encourage companies to be more responsible and to participate in environmental protection together with local authorities. Institutional barriers include :
a) lack of budget and the generation of constraints that can complicate administration of the area;
b) the need to coordinate the various authorities involved and the possible restrictions resulting from them; and
c) the lack of knowledge of these types of projects as neither the culture nor precedent exists.
It is often not obvious to boat users (e.g. recreational fishermen or tourists) that plant communities vulnerable to the use of anchors or dead weight anchors are there, as is the case at Agua Amarga. So, even if the area were revegetated, the risk would be that the damage to the Posidonia oceanica meadows would continue to increase.
The habitat is occupied and degraded by a field of dead weight anchors and free anchorages, generating ever increasing degradation. This would prevent revegetation, as there would be a risk of the effort going to waste due to new dead weight anchors or dropping of anchors that could stir up the replanted areas. That is why several implementation actions are anticipated in the with project scenario to prevent additional damage and then consider revegetation.
6 2017-21: Restauración de pradera de Posidonia oceanica. Bosque Marino de Red Eléctrica
©M.OTERO/IUCN

FEASIBILITY STUDY FOR PREPARATION OF CARBON OFFSETTING PROJECTS
26 26
Scenario 3 barrier analysis: Natural regeneration
Although Posidonia oceanica areas are highly protected by various regulations and laws, there is a need to expand or create some to prevent free anchorages. Unless this problem is solved, it is unlikely that a natural regeneration process could proceed successfully.
The current dynamics would impede a natural regeneration process, because the dropping of new dead weight anchors would continue or the buoy chains would be dragged. Although Posidonia oceanica is a species that even manages to colonise concrete dead weight anchors, as has been observed at some sites, pressure on the meadow habitat needs to be relieved for any natural regeneration process to be successful.
This leads to the conclusion that the baseline is scenario 1, where activities will continue as they have up to now, with nautical activity users installing free anchorages indiscriminately, which will continue to generate degradation of the Posidonia oceanica meadow.
As mentioned above, at Agua Amarga the local economy is largely based on fishing, tourism and nautical activities. The number of free anchorages used by small vessels (4-9 m in length) has been increasing over around the last 15 years. These always tend to be located in the same area along the beach at Agua Amarga, as can be seen in the following images.
1.5. Description of the Baseline
Images 1A from 2004 and 1B from 2018 show the vessels (white spots inside the red line) that anchor and generate the degradation of the seagrass meadows at Agua Amarga. Note that they always tend to anchor in the same areas, toward the right-hand side. (Source of satellite images: Google Earth; Source of the anchorage area: Life Blue Natura Team, 2019).

27 FEASIBILITY STUDY
ON CABO DE GATA SEAGRASS MEADOWS
These nautical activities are those that have generated the degradation dynamics of the Posidonia oceanica meadows at the location. Although the park Master Plan for Use and Management prohibits free anchorage on Posidonia oceanica meadows (point 4.2.8 on public use, environmental education and tourist activities), the problem has continued until now and the damage to the meadows increases.
Thus, at Agua Amarga, the baseline scenario evolves in such a way that the degraded areas of Posidonia oceanica increase to the detriment of the healthy areas (due to the installation of free anchorages), so the model depends on the change in the areas of each stratum. A more comprehensive and detailed explanation of how the baseline degradation is generated and expanded can be read under point 1.6.2.
Posidonia oceanica meadow degraded (area in lighter colours) by free anchorage with concrete dead weight anchor and drag chain. Image taken in April 2016 at Agua Amarga, Cabo de Gata-Nijar Natural Park, Almeria. (Source: Lampreave and Barrajón, 2016).
©AGUSTÍNBARRAJÓNDOMENECH/AGENCIADEMEDIOAMBIENTEYAGUADEANDALUCÍA

FEASIBILITY STUDY FOR PREPARATION OF CARBON OFFSETTING PROJECTS
28 28
1.6. Estimation of Baseline GHG emissions and reductions
Quantification of GHG emission reductions and removals in the baseline
GHG emissions in the reference scenario (baseline, GHGBSL) are attributed to changes in carbon stocks in biomass carbon deposits, soil processes or a combination of these. Moreover, where relevant, emissions from fossil fuel use can be quantified. The emissions in the reference scenario are estimated as:
1.6.1. Methodology
Where:
GHGBSL = Net CO2e emissions in the baseline scenario up to year t; tCO2e
GHGBSL-biomass = Net CO2e emissions from biomass carbon pools in the baseline scenario up to year t; tCO2e (*)
GHGBSL-soil = Net CO2e emissions from the soil organic carbon pool in the baseline scenario up to year t;
tCO2e (**)
GHGBSL-fuel = Net CO2e emissions from fossil fuel use in the baseline scenario up to year t; tCO2e
GHGBSL = GHGBSL-biomass + GHGBSL-soil + GHGBSL-fuel
(*): Refers to the change in carbon pool stored in the living biomass of plant between time (t) and some time in the past (for example t= 2020 and 2010) (**): Refers to the change in carbon pool stored in the soil between time (t) and some time in the past. If the change is negative this is referred to as sequestration.

29 FEASIBILITY STUDY
ON CABO DE GATA SEAGRASS MEADOWS
Net carbon stock changes in biomass carbon pool in the baseline scenario
The net change in carbon stocks in biomass carbon deposits in the reference scenario is estimated as follows:
Where:
∆CBSL-biomass, i, t = Net changes in carbon stored in the biomass pool, reference scenario in stratum i,
year t; tC yr-1
∆CBSL-tree/shrub,i,t = Net changes in carbon stored in the trees and shrubs, in the reference scenario in
stratum i, year t; t; tC yr-1. *This variable is equal to zero for this calculation, because
there are no trees or shrubs in the project area.
∆CBSL-herb,i,t = Net change in carbon stocks in the grass carbon pools in the reference scenario in
stratum i en el year t; tC year-1
i = 1, 2, 3 … MBSL Stratum en el escenario de la línea base
t = 1, 2, 3 … t* years trascurridos desde la fecha de inicio del proyecto
∆CBSL-biomass, i, t = ∆CBSL-tree/shrub,i,t + ∆CBSL-herb,i,t
Core extraction in a seagrass meadow in Andalusia. CSIC-Life Blue Natura.

FEASIBILITY STUDY FOR PREPARATION OF CARBON OFFSETTING PROJECTS
30 30
Net carbon stock changes in the herbaceous vegetation biomass pool
The net carbon stock change in herbaceous vegetation (the only plant type relevant to this project) in the reference scenario is estimated using a carbon stock change approach as follows:
The methodology used proposes several ways of calculating emissions from biomass. A proxy was used for the estimates for this project, consisting of the difference between the carbon stock at time t and the stock at t-1 (carbon stock change). The default factor suggested by the methodology of 3 t C/ha was used for the above- and belowground biomass content data.
The CO2 emissions from biomass were obtained by multiplying the area of each stratum by this factor. According to the methodology, only in year 1 can the first estimate of CO2 emitted from biomass be taken in both the baseline and project scenarios. Although the contribution to the carbon model of biomass is minimal, it was counted in this study, but omitting this pool is suggested in the future for the large-scale project in Andalusia.
The methodology suggests using techniques from field biology to make coverage observations. However, from the information available for this study, it was only possible to surmise the coverage status of each stratum in the project area by performing a visual inspection of the underwater photographs contained in Lampreave and Barrajón’s 2016 buoy field report. Then, in line with the observations for this estimate, it was assumed that healthy Posidonia oceanica strata had 100% coverage and the degraded strata had no coverage.
Where:
∆CBSL-biomass, i, t = Net changes in carbon stored in the biomass pool, reference scenario in stratum i,
year t; t C yr-1
CBSL-herb,i,t = Carbon stocks in herbaceous vegetation in the reference scenario in stratum i,
year t; t
i = 1, 2, 3 … MBSL stratum in the baseline scenario
t = 1, 2, 3 … t* years elapsed since the project start date
T = Time elapsed between two successive estimates (T = t2 - t1)
∆CBSL-biomass, i, t = (CBSL-herb,i,t - CBSL-herb,i..(t-T)) / T

31 FEASIBILITY STUDY
ON CABO DE GATA SEAGRASS MEADOWS
Net GHG emissions from soil in the baseline scenario
Where:
GHGBSL-soil,i,t = GHG emissions from the soil organic carbon pool in the reference scenario in
stratum i in year t; tCO2e
GHGBSL-soil-CO2,i,t = CO2 emissions from the soil organic carbon in the reference scenario in
stratum i in year t; tCO2e ha-1 yr-1
Deductionalloch = Deduction from CO2 emissions from the soil organic carbon pool to account for the percentage of the carbon stock that is derived from allochthonous soil
organic carbon; tCO2e ha-1 yr-1
GHGBSL-soil-CH4,i,t = CH4 emissions from the soil organic carbon pool in the reference scenario in
stratum i in year t; tCO2e ha-1 yr-1
GHGBSL-soil-NO2,i,t = N2O emissions from the soil organic carbon pool in the reference scenario in
stratum i in year t; tCO2e ha-1 yr-1
A i, t = Area of stratum i in year t; ha
t>t PDT-BSL,i: = Peat depletion time in the reference scenario in stratum i in years elapsed since the project start date; yr *this condition does not apply because there is no
peat in the project area.
t>t SDT-BSL,i: = Organic carbon depletion time in the reference scenario in stratum i in years
elapsed since the project start date; yr
i = 1,2,3 … MBSL stratum in the baseline scenario.
t = 1,2,3 … t* years elapsed since the project start date
For organic soils: t > tPDT-BSL,i:
GHGBSL-soil,i,t = 0For mineral soils where: t> tSDT-BSL,i:
GHGBSL-soil,i,t = 0
GHGBSL-soil,i,t = Ai,t × (GHGBSL-soil-CO2,i,t - Deductionalloch + GHGBSL-soil-CH4,i,t + GHGBSL-soil-N2O,i,t)
Baseline emissions are estimated as follows:

FEASIBILITY STUDY FOR PREPARATION OF CARBON OFFSETTING PROJECTS
32 32
The baseline data used for these soil CO2 emissions calculations are the product of observations made for the study entitled “Carbon stocks and fluxes associated to Andalusian Seagrass Meadows, deliverable C1: Results Report Life Blue Natura (LIFE14CCM/ES/00957)”, (Mateo et al. 2019).
Soil carbon content data were collected using 1-m-long cores at three different depths (4.8 m, 10.8 m and 18 m), all in healthy areas of Posidonia oceanica in the Agua Amarga area. This study measured not only the carbon content at each depth, but also CO2 fluxes over the past 100 years using lead (210Pb) and radiocarbon (14C) dating techniques.
These data were used as CO2 emission factors applied to the corresponding stratum each year to obtain the mass of CO2 emitted per year and per stratum in question. Thus this soil calculation differs slightly from the method used to estimate biomass (which uses the method of stock differences from one year to another with the default factor given by the methodology). Data can be obtained for the soil pool from time zero (t0), unlike biomass where a CO2 result can only be obtained from year 1.
Estimation of the size of the degraded areas
This datum is an estimate made by the Cabo de Gata-Nijar park buoy field study team (Lampreave y Barrajón, 2016). According to these observations on site, the average damage from each free anchorage, produced by the chain alone (excluding the area affected by the dead weight anchor itself) is highly variable, but would be between approximately 12 and 20 m2 . The average value used for this damage in this study was 16 m2 plus 1 m2 for the area occupied by the dead weight anchor, giving a total of 17 m2 of degraded area per recorded anchor point.
1.6.2. CO2 data used for calculation of GHG emissions in the baseline scenario
Accumulation of dead weight anchors in Posidonia oceanica meadow area.©AGUSTÍNBARRAJÓNDOMENECH/AGENCIADEMEDIOAMBIENTEYAGUADEANDALUCÍA

33 FEASIBILITY STUDY
ON CABO DE GATA SEAGRASS MEADOWS
The variability occurs because users drop dead weight anchors according to their needs. The users employ any kind of dead weight anchor, which can be made with varying dimensions, although in this area they are small and related to the size of the vessels (generally small). There is obviously no durability standard for the dead weight anchors, the chains or the shackles. When the chain breaks, they simply drop a new dead weight anchor instead of looking for or reusing the dead weight anchor that was already on the bottom.
It also happens that several dead weight anchors are dropped at the same anchorage point to prevent possible movements of the vessels, and for these only the damage caused by the area of the dead weight anchor would need to be quantified. However, no precise data exists on how many are dead weight anchors alone, as new points have been installed since the last buoy field study in 2016. These numbers vary continually, especially in the summer season.
Number of free anchorages or points where meadow area loss has been generated
There is no current programme to conduct a quantitative, methodical evaluation of free anchorages or dead weight anchors abandoned in the project area by managers. During the 2016 buoy field study, 136 mooring points were identified along Agua Amarga beach, most in the willow depth area (113) and a few at intermediate depth (18). There are also numerous “abandoned” dead weight anchors, with no buoy on the surface. Only a few of these dead weight anchors have mid-water floats to facilitate their location. Once the buoy on the surface has been lost, rather than looking for the dead weight anchor for reuse, a new dead weight anchor is dropped onto the bed with a new buoy, so the number of dead weight anchors is higher than the number of buoys, which significantly impacts the meadow.
To locate the depth limits, bathymetry data from Andalusia’s Environmental Information Network (Rediam) was used. For the degraded areas (the determining factor for emissions from this and almost any model), it was used geographical data on free anchorages located on site during the buoy field study by Lampreave and Barrajón in 2016. QGIS 3.4.6 Madeira software was used to process the geographical data. Next, using these data, it was count the number of points with damage in each stratum and then multiplied by the approximate size of the degraded area (17 m2). The healthy areas are the result of measuring the project area in hectares in each stratum and discounting the degraded areas, similarly for each stratum. The areas with P. oceanica come from the map of seagrasses in the bay of Agua Amarga, as generated by the Life Blue Natura mapping team.
Year Nº of anchorages
2011 85
2012 100
2013 90
2014 105
2015 102
2016 90
2017 101
2018 105
Average 97
The data in this table indicate:
• That the damage would not expand over time out of the already well-identified area where the boats are always located (see images 1A and 1B, and map 1 of the anchorage field).
• Although the number of anchorages is relatively stable (around 100), the damage or degradation increases each time a new dead weight anchor is dropped onto healthy meadow and the increase appears to be at least to the limit observed on map 1, below which is the area where the boats always anchor, which would constitute the project area boundary in this case.
Table 5. Number of anchorages observed over time with non-exhaustive monitoring. Source: Data provided by public agents in the area.

FEASIBILITY STUDY FOR PREPARATION OF CARBON OFFSETTING PROJECTS
34 34
Map 3. Map of mixed or monospecific seagrass meadows (Posidonia oceanica and Cymodocea nodosa) at Agua Amarga. Source:Andalusia’sEnvironmentalInformationNetwork(Rediam)andResultsfromactionA2.LifeBlueNatura.
Map 2. Project site in Agua Amarga. BathymetrydatapublishedinAndalusia’sEnvironmentalInformationNetwork(Rediam)wereusedtolocatethedepthlimits.Thehealthyareasaretheresultofmeasuringtheprojectareainhectaresineachstratumanddiscountingthedegradedareas,similarlyforeachstratum.
Profundidades(1m)Profundidades5mFondeoslibresEstratosomeroconP.OceanicaEstratointermedioconP.OceanicaHealthyshallowcoreHealthyintermidiatecore
AguaAmarga,Almeria.
5m

35 FEASIBILITY STUDY
ON CABO DE GATA SEAGRASS MEADOWS
The strata were defined taking the ground coverage into account, in this case areas covered by healthy and degraded Posidonia oceanica meadows. As the carbon content in seagrass areas can vary greatly with dept (Fourqurean et al., 2019), this variable was also considered in the definition of the strata.
The depth limits for the Agua Amarga seagrass (suggested by the experts in the study of carbon fluxes in Andalusia) were defined as follows:
• The shallowest area, which has the highest CO2 concentration (4530,6 tCO2e/ha), is between 1 and 6.9 m. This area is also the most affected by free anchorages (113 points recorded).
• The intermediate depth area, which has a much lower CO2 stock than the willow area (336.4 tCO2e/ha) is located at depths between 7 and 15 m. Although this strip has a lower carbon content than the willows, it is included in the calculations because it is also affected by free anchorages (18 points recorded), i.e. it has degradation dynamics and can generate credits, although to a lesser extent as there are less degradation points.
• The deeper areas (> 15 m) were excluded from the analysis completely, as no anchorage points were observed, therefore there would be no loss of degraded areas and subsequent generation of emissions or carbon credits.
Estimation of plant erosion
From the observations by marine biologists in the area, only an indication was obtained, e.g. degraded areas are known to have “dead plant mat” and erosion is still very small, but no precise value is available for how much plant mat could have been eroded by the dragging chain, because no measurements were made as such, i.e. no core samples were taken in the degraded areas at Agua Amarga. However, this measurement is key to determining the amount of the reduced GHG emissions, as it is in the Posidonia plant mat that the largest accumulation of carbon is stored.
Therefore, for this feasibility study, an emissions value was derived using CO2 data for healthy areas and indications from the scientists of the Carbon Stocks And Fluxes Associated to Andalusian Seagrass meadows, study, where the use of a linear model of remaining Posidonia oceanica stocks over the years is suggested (Table 6). According to this model, around 11% of dead plant mat is lost over 10 years and 24% over 20 years (Mateo et al., 2019) due to mechanical traction.
Thus, in the approximately 15 years of massive use of free anchorages, the linear model indicates that the percentage stock lost in this case would be 17.5%. This value was generated for the degraded strata (2 and 4) where 0.11666 is the annual proportion of CO2 released from the dead plant mat and 4,530.6 is the CO2e stock at 1 m in the willow stratum.
1.6.3. Definition of the baseline strata
t (years) % CO2 stock remaining in
Posidonia oceanicaplant mat
10 89%
20 76%
30 63%
40 50%
50 37%
60 24%
70 11%
Table 6. Linear model of percentage of remaining stocks of Posidonia oceanica over the years.

FEASIBILITY STUDY FOR PREPARATION OF CARBON OFFSETTING PROJECTS
36 36
Without making measurements with cores (as recommended by the methodology) in areas with mechanical erosion, and knowing what is actually emitted per year, there can be no entirely conclusive results on the amount of credits produced by the project. Therefore these credit production results need to be considered to be an approximation, as the linear model of percentage of remaining stocks of Posidonia oceanica is generated for dead plant mats, but without mechanical erosion, and mechanical erosion may generate more credits, but there is no measurement or indication of what it might be.
Area loss rate
The baseline takes the hypothesis that the damage observed has an annual area loss rate identical to the average rate observed over the past 15 years. This datum is an approximation, as no more accurate source was available, i.e. access to high-resolution satellite images to be able to observe evolution. In the case of Agua Amarga, the degradation evolves in the same well-identified area and there is no indication that the damage may spread to the deeper areas or to the lateral areas of the coastline where the meadows are located.
©AGUSTÍNBARRAJÓNDOMENECH/AGENCIADEMEDIOAMBIENTEYAGUADEANDALUCÍA

37 FEASIBILITY STUDY
ON CABO DE GATA SEAGRASS MEADOWS
In the with project scenario, there is no evolution of the degradation of healthy areas as a result of the activities implemented. Furthermore, replanting is considered at time 1 (t1) in degraded areas. Therefore, GHG quantification has been conducted based on this dynamic change, which is what generates the differential in results between the baseline and the project. The following is a brief description of the implementation activities in the with project scenario.
Removal of dead weight anchors
The removal of the dead weight anchors consists of removing the concrete free anchorages that are causing the damage to the meadows. Five working days have been estimated for Agua Amarga to remove the dead weight anchors and/or buoys over the P. oceanica meadows, considering that those dead weight anchors that are completely integrated into the Posidonia oceanica plant mat would be left, but would not be used. This 5-working-day action would be implemented only in the first year (i.e. In t0 of the budget).
Installation of eco-friendly moorings
The eco-friendly mooring consists of two clearly differentiated parts; one secured to the bottom (the anchoring or fixing system) and a second composed of several elements, which runs from the part secured to the bottom to the surface, called the anchoring gear, consisting of shackle, chain and buoys (intermediate and surface). Installation of the part secured to the bottom usually takes place in clearings in the meadow.
2. PROJECT SCENARIO
2.1. Description of the with project scenario
©SUBMON
©SUBMON

FEASIBILITY STUDY FOR PREPARATION OF CARBON OFFSETTING PROJECTS
38 38
The number of eco-friendly moorings will reflect the capacity of the area and the park planning, but it will also ensure that no new free anchorages are added in other areas, so that there is no impact of boats at other sites. The number of eco-friendly moorings estimated for this first phase of work is 50.
This proposal will be implemented progressively over the next few years, considering Natural Park planning and aligning objectives with other programmes. The eco-friendly moorings will be installed in tens, starting in year t0 and continuing until t4, so arriving at the target maximum of 50 moorings installed at Agua Amarga.
When assessing the possibility of displacing the impact to other places in the Park, i.e. generating what is called leakage according to the VCS, the Park administration, together with the regional government of Andalusia, has planned to divert all that cannot moor in the Agua Amarga area or that not prescribed within the Park, to the Port of Carboneras. This is in the process of being arranged as a marina and will have 200 moorings in the next few years. So, the plan is that boats moor at Agua Amarga to spend the day (passing the night will not be allowed, this must be done at Carboneras), with the limit for the moment being 50 boats; the rest of the vessels must anchor at the Port of Carboneras. With this measure, and considering that sufficient moorings will be installed to meet the current demand, the assumption remains that no leakage will be generated.
Maintenance of eco-friendly moorings
Maintenance to the part secured to the bottom is minimal. For the permanent eco-friendly mooring gear, maintenance is carried out every six months, with additional checks in case of severe weather. Performing the maintenance is quick. For example, a field such as Agua Amarga can be checked in two or three days. However, considering that the anchorages are primarily used in the summer, in this case only one maintenance per year was planned.
Replanting using cuttings or seeds
Replanting of Posidonia oceanica using cuttings was planned for all areas presenting degradation in year 1, following existing guidelines (Castejón et al., 2018). Replanting is costly and is not in itself the most relevant activity to be implemented to avoid future GHG emissions with the project, although it could have some relevance at a local level.
©REDELÉCTRICADEESPAÑAYIMEDEA(CSIC-UIB)

39 FEASIBILITY STUDY
ON CABO DE GATA SEAGRASS MEADOWS
Surveillance of the area and education of users
To reduce risks of losses of meadows and GHGs, a monitoring and education system has been planned for the summer months over the first 5 years of the project. In itself, more than monitoring, the personnel performing this work are intended to guide and educate users on the importance of seagrass meadows and their conservation. According to several studies (Diedrich et al. 2013; Milazzo et al., 2004), users who understand the impact on seagrass meadows act with greater respect in the future, by positioning over sand, using intermediate buoys, etc.
Other carbon model scenarios
Other scenario models can be constructed by varying the scale of the damage in the area, the area itself per stratum to recalculate the model and generating iterations or soil emissions according to the information available. We examined some of these scenarios in the final chapter to evaluate the possibility of modifying the results.
©M.OTERO/UICN
Using methodology VM0033, emissions in the project scenario are attributed to carbon stock changes in biomass carbon pools, soil processes, or a combination of these.
Emissions in the project scenario are estimated to be:
2.2. Estimation of with project scenario GHG emissions and reductions
Where:
GHGWPS = Net CO2e emissions in the project scenario up to year t; tCO2e
GHGWPS-biomass = Net CO2e emissions from biomass carbon pools in the project scenario up to year t;
tCO2e
GHGWPS-soil = Net CO2e emissions from the soil organic carbon pool in the project scenario up to year t;
tCO2e
GHGWPS-burn = Net CO2e emissions from prescribed burning in the project scenario up to year t; tCO2e
GHGWPS-fuel = Net CO2e emissions from fossil fuel use in the project scenario up to year t; tCO2e
GHGWPS = GHGWPS-biomass + GHGWPS-soil + GHGWPS-burn + GHGWPS-fuel

FEASIBILITY STUDY FOR PREPARATION OF CARBON OFFSETTING PROJECTS
40 40
Net GHG Emission Reductions and Removals
The total net GHG emission reductions from project activity are calculated as follows:
The following table presents the results of the calculation of reduced emissions including baseline calculation results. According to the model estimates, project implementation would reduce CO2e emissions by 51% with the Agua Amarga blue carbon project.
2.3. Results of calculation of reduced emissions during the project lifetime
Year BSL emissions (tCO2e)
WPS emissions (tCO2e)
Emissions reduction (tCO2e)
2 60.8 35.6 25.2
4 124.3 73.4 50.9
6 190.6 111.2 79.4
8 259.6 149.0 110.6
10 331.4 186.8 144.6
12 405.9 224.6 181.3
14 483.2 262.4 220.8
16 563.2 300.2 263.0
18 646.0 338.0 308.0
20 731.5 375.8 355.7
30 1,200.4 564.8 635.6
40 1,738.0 753.9 984.2
50 2,344.4 942.9 1,401.5
60 3,019.5 1,131.9 1,887.6
70 3,763.3 1,320.9 2,442.4
80 3,979.4 1,509.9 2,469.4
90 4,128.1 1,698.9 2,429.2
100 4,272.8 1,887.9 2,384.8
Table 7. Reduction of estimated emissions over the life of the project. . BSL refers to the baseline, and WPS indicates emissions in the with project scenario.
Where:
NERRWE = Net CO2e emission reductions from the RWE project activity; tCO2e
GHGBSL = Net CO2e emissions in the baseline scenario; tCO2e
GHGWPS = Net CO2e emissions in the project scenario; tCO2e
FRP = Fire Reduction Premium (net CO2e emission reductions from organic soil combustion
due to rewetting and fire management); tCO2e
GHGLK = Net CO2e emissions due to leakage; tCO2e
NERRWE = GHGBSL – GHGWPS + FRP – GHGLK

41 FEASIBILITY STUDY
ON CABO DE GATA SEAGRASS MEADOWS
Figure 4. Emissions reduced over time
In year 73 is the SDT (Soil Depletion Time), which is the time during which the Agua Amarga project would be eligible to claim emissions reductions from restoration and conservation activities. NER or Net Emissions Reduction is obtained by subtracting the results of the emissions from the with project scenario from the baseline emissions.
There is only one quantifiable source of uncertainty in itself within this model and it is what comes from the carbon observations used here, because point measurements and standard deviation were available. In this case, lower net emissions reductions (NERs) were obtained than those adjusted for uncertainty, because carbon sampling data was very sparse and, additionally, the use of several default factors from the methodology was necessary.
VCUs or verified carbon units represent the carbon credits that could be sold once the project has been certified. They are calculated as the difference between the project and baseline GHGs, but in a pooled manner and without counting the risk or buffer. The number of VCUs is generated up to year 73, the year of the SDT, which marks the project time limit. Adjustment for uncertainty in this case is of little use, because there is a much more conservative number of VCUs without it.
Figure 5. Uncertainty of project activities over time
Figure 6. Verified carbon units over time
UNCERTAINTYOFPROJECTACTIVITIESOVERTIME
UncertaintyBounds NER
tCO2e
NER(AdjustedforUncertainty)
1000
500
1000
1500
2000
2500
3000
3500
20 30 40
t (years)
7050 8060 90 100
EMISSIONSREDUCEDOVERTIMEBSL NER WPS
tCO2e
1000
1000
2000
3000
4000
5000
6000
20 30 40
t (years)
7050 8060 90 100
STD
VERIFIEDCARBONUNITSOVERTIMENumberofcredits-riskorbuffer
NumberofVCUs
VCUs
NumberofVCUs(adjustedtouncertainty)
100-10
0
10
20
30
40
50
70
60
20 30 40
t (years)
7050 8060 90 100
EMISSIONSREDUCEDOVERTIME

FEASIBILITY STUDY FOR PREPARATION OF CARBON OFFSETTING PROJECTS
42 42
The costs in the budget were broken down into implementation, carbon quantification and monito-ring, and the blue carbon project cycle.
These are the costs related to the actions or activities to conserve and restore the project area. The costs considered in the interventions include the items described in Table 8.
As no boat equipped with a crane has been found in the area (which would speed up any removal operation), the maximum number of dead weight anchors to be removed per day will be more limited, and they will need to be removed via the beach, through the area used as a ramp to float and haul out boats. Under these conditions, and based on the consultations made7, 30 dead weight anchors, equivalent to 20 buoys or anchorage points, could be removed per day. The cost for waste management varies depending on the weight of the dead weight anchors.
The estimated budget for this removal of dead weight anchors also includes a coordinator’s work time. According to the above, the budget per day for removal of dead weight anchors is approximately €9,000 (removing 20 anchorage points which, according to previous observations, would be equivalent to around 30 dead weight anchors).
The installation price for eco-friendly moorings is €800/each. This value includes professional divers (5), authorised boat, hydraulic machinery, etc. It does not include the anchoring gear (chain, shackles, intermediate
3. COST ANALYSIS
3.1. Methodology
3.2. Implementation costs
No. Activity
1 Removal of dead weight anchors and/or interfering agents
2 Installation of eco-friendly moorings
3 Maintenance of eco-friendly moorings (chains, ropes and shackles)
4 Replacement of chains or ropes and shackles, etc.
5 Demarcation of the project area
6 Surveillance and education during the summer months (*3 people)
7 Small launch (used)
8 Fuel
9 Launch maintenance
10 Replanting of Posidonia using cuttings (2,500 m2 campaign)
11 Replanting of Posidonia using seeds (2,500 m2 campaign)
Table 8. Costs of implementation activities
7 Source: Submon

43 FEASIBILITY STUDY
ON CABO DE GATA SEAGRASS MEADOWS
These costs provide for the effort and materials needed to measure carbon from sampling to production of the PDD. The items considered can be seen in the following table:
3.2.1. Costs for carbon quantification and monitoring
No. Activity
1 Professional in carbon modelling and writing of the complete PDD for VM0033 up to certification (1)
2 Re-evaluation of PDD for monitoring and adjustment of the modelling (1)
Team to measure carbon stocks in soil and biomass
3 Professional divers experienced in collecting these types of samples; dive master or higher (2 divers)
4 Divers to determine the degraded area (4 days of diving, Agustín’s estimate, 2 divers)
5 Lab technicians: sub-sampling to process around 4 m of core per day (requires 2 technicians)
7 Expert advice to review everything and for guidance throughout the process (1)
8 Degraded area determination diver transport
9 Expenses (accommodation plus meals for 2 experienced divers)
10 Expenses (accommodation plus meals for 2 degraded area measurement divers)
11 Transport of samples (from Agua Amarga to the local laboratory and from there to the Hawaii organic carbon laboratory)
12 Transport (core sampling) boat with a suitable inflatable (6 m in length) with master
Soil sampling materials
13 PVC pressure pipe, 1.5-3 m long and 5-7 cm ID, with two facing holes in the upper part
14 Ropes, mallets, insulating tape, etc.
15 Probes (1.5 m for 80 to 100 cm punch) PVC “machined” to make them reusable (with pre-bored holes)
16 Pre-weighed, numbered containers for sub-samples
17 Garmin GPS (1)
18 Crosstour Action video camera, 4K, 20 MP. Waterproof camera submersible up to 40 m, 170° wide angle, Sony anti-vibration sensor plus two 1,350 mAh batteries, charger, accessory kit
19 Powobest 20,000 mAh solar charger, portable wireless power bank, waterproof external battery with 3 foldable solar panels
Laboratory analysis
20 Organic carbon content, all work up to organic C starting from intact dry sediment sub-sample
21 Carbon content in meadow and rhizome
Table 9. Costs of quantifying and monitoring GHGs
buoy and surface buoy) as this varies depending on the depth at which the anchorage is installed. However, in the costs for this study, the approximate price of the anchor train of €400 per unit was used.
Maintenance to the part secured to the bottom is minimal. For the permanent eco-friendly mooring gear, maintenance is carried out every six months, with additional checks in case of severe weather. Performing maintenance for a field such as Agua Amarga can be carried out in two or three days. However, considering that the anchorages themselves are purely used in the summer, in this case only one maintenance per year was budgeted.

FEASIBILITY STUDY FOR PREPARATION OF CARBON OFFSETTING PROJECTS
44 44
These costs include all management, registrations and records to certify the project with the VCS and conduct the credit sale transactions. The items considered can be seen in the following table:
3.2.2. Carbon cycle costs
No. Activity
1 Validation (PDD audit)
2 Adjustment of carbon monitoring and modelling
3 Verification (Audit monitoring reports)
4 Recording (€/tCO2e)
5 Marketing and sale of credits
6 Opening of VCS (VERRA) account and listing (1 payment) plus annual maintenance
7 Certification
Table 10. Blue Carbon project cycle costs.
The following were not taken into account in these costs:
• Costs of project administration, offices for project management, as this will be carried out by the regional administration of the Regional Government of Andalusia and of the Cabo de Gata-Nijar park.
• Costs of initial carbon monitoring, because the samples and data generated in the Carbon stocks and fluxes in Andalucian seagrases study by Mateo et al., 2019 would be used for this part. This study was also used as the basis for determining the number of samples per stratum, considering that, ultimately, the project area would be more extensive and a carbon sampling strategy had already been carried out there, otherwise it would most likely have been necessary to plan for increased, thus more expensive, sampling.
©DREAMSTIME

45 FEASIBILITY STUDY
ON CABO DE GATA SEAGRASS MEADOWS
Two scenarios were proposed for the financial viability study, where the validation/verification monitoring times vary: in Option 1 they are conducted every 5 years and in Option 2 validations/verifications take place every 10 years (the option to validate and verify every 10 years is certainly less expensive). The validations and verifications were planned every 20 years after year 20 for both scenarios. This led to the calculation of financial tools normally used for evaluation of these types of projects, such as IRR and NPV.
3.2.3. Financial viability
Description Value Explanation Source
Sale price of credits in euros in years 0-4 (€) €8.82
Estimated price at time of sale.
Everland Marketing
Sale price after year 5 (€) €30.00 World Bank
Marketing and sale of credits (%) 15.00% Marketing cost Everland Marketing
Discount rate 7.8%
Inflation rate 2% Average inflation over the past 20 years World Inflation Data
Registration in euros (€/tCO2e) €0.05 Cost of registration Markit Registry
Certification in euros (€/tCO2e) and transfer €0.17 Costs of the standard
(VCS/VERRA) https://verra.org/oprfeeschedule/
Taxes on sale of credits (if applicable) (%) 0.00%
Net income tax (if applicable) (%) 35.00%
Table 11. Parameters used in the financial analysis.

FEASIBILITY STUDY FOR PREPARATION OF CARBON OFFSETTING PROJECTS
46 46
30000
35000
40000
45000
50000
25000
20000
15000
10000
5000
0
€
0 1 2 3 4 5 10 20 50 100t(years)
The initial and ongoing costs of the implementation activities. Note that the highest costs are concentrated in years 0-5, with the most expensive being the removal of dead weight anchors at €45,000. Replanting activities are also costly. Maintaining the eco-friendly moorings is rather expensive and needs to be performed every year. At least €10,000 per year needs to be spent on this activity alone. The average annual cost of implementation activities is €11,992.60, without taking replanting into consideration.
Performing validations and verifications every 10 years reduces costs by 22% compared to the optional scenario where verifications and validations take place every 5 years. Income is clearly seen to be very low compared to the costs of implementation and the project cycle, which is to be expected for this project size. It also needs to be considered that monitoring and all the underwater implementation actions are especially expensive. In this study we used a relatively high credit sale price (€30) compared to the current sales price, which ranges from €2 to €6/tCO2, but income still remained extremely low compared to implementation costs even at €100.
3.3. Cost results
Figure 7. Costs of implementing activities for the Agua Amarga blue carbon project.
Figure 8. Total costs of the Agua Amarga blue carbon project
Withdrawalofdeadand/oragentsdisturbing
Installationofecologicalmoorings
Maintenanceofecologicalmoorings
Chainsorropesandshackles
Surveillanceandeducation(summer3people)
Smallboat(used)
ReplantingPosidoniawithcuttings
ReplantingPosidoniawithseeds
120000
100000
80000
60000
40000
20000
0
€
0 1 5 10 15 20 30 40 60 80 100t(years)
Totalcyclecostoftheproject.Scenario10years
Totalcyclecostoftheproject.Scenario5years
Totalcosteco+withdrawalanchorsofmoorings+surveillance
TotalcostReplantingwithcuttings
TotalcostReplantingwithseeds
Income

47 FEASIBILITY STUDY
ON CABO DE GATA SEAGRASS MEADOWS
Verifications and validations are every 20 years from year 20 for both scenario options, which is why the cost curves are superimposed. In the scenario with verifications every 10 years, and considering the implementation of eco-friendly moorings, removal of dead weight anchors, monitoring and the project cycle, the cost in year 0 is €193,665 and in year 1 is €36,128.40 and then from year 2 to the end of the project the average cost/tCO2 is €7,516.90.
The NPV was evaluated here for both validation/verification scenario options (every 5 and 10 years) and also for two implementation scenarios; one where eco-friendly moorings are installed, the dead weight anchors are removed, the area is monitored and the project certification costs are included. In the other scenario, in addition to the above, replanting is carried out using cuttings. All the scenarios have negative NPVs, i.e. they are generating net losses and therefore the project is not profitable under the forecast cost and income configuration. The internal rate of return did not produce any results, because no positive balance sheet figures were obtained due to high project costs and low income.
Figure 9. Costs per tCO2e for the two scenarios (verifications every 5 and 10 years).
Figure 10. Net present value (NPV) at different years of project completion
30000
35000
40000
25000
20000
15000
10000
5000
0
€
0 1 5 10 15 20 30 40 60 80 100t(years)
tCO2eCost(eco+withdrawalmoorings+surveillance)Scenario10years
tCO2eCost(eco+withdrawalmoorings+surveillance)Scenario5years
Income
-550.000
-500.000
-450.000
-600.000
-650.000
€
0 10 20 30 40 50 60 70 80 90 100t(years)
Echomoorings,withdrawalofoldmoorings,vigilanceandcycleofproject.Scenario10years
Echomoorings,withdrawalofoldmoorings,vigilanceandcycleofproject.Scenario5years Replantingbycuttings,ecoanchors,retreatofoldmoorings,vigilanceandcycleoftheproject.Scenario10years Replantingbycuttings,ecoanchors,retreatofoldmoorings,vigilanceandcycleoftheproject.Scenario5years

FEASIBILITY STUDY FOR PREPARATION OF CARBON OFFSETTING PROJECTS
48 48
The project must demonstrate that the sale of carbon credits is necessary to ensure project viability and that project activities would not have occurred without carbon financing.
This analysis was performed at the same time as the selection of the baseline scenario in the preceding point, following the guidelines of the CDM methodological tool “Combined tool to identify the baseline scenario and demonstrate additionality in A/R CDM Project activities”.
Wetland restoration and conservation projects must demonstrate that the permanence of their carbon stocks in the soil will be maintained and must carry out a non-permanence risk assessment. Projects that demonstrate longevity, sustainability and risk mitigation capacity will be eligible to issue shared reserve credits (“buffer” credits). In AFOLU projects, the risk of non-permanence is assessed using the “AFOLU Non-Permanence Risk Tool: VCS Version 3”.
It was not possible to perform this assessment when carrying out this work, because the necessary information was not available. The risk analysis requires identification of each project’s developers and their work team, the sources of finance require definition of project longevity, among others. Understanding the risks considered for this analysis before carrying out full PDD planning is advisable, so as to be able to mitigate the risks in the project design itself.
The following considerations must be taken into account for risk analysis according to the methodology:
• The potential transient and permanent losses in carbon stocks are to be assessed over a period of 100 years and be based on the conditions present and the information available at the time of the risk analysis.
• The non-permanence risk rating is performed taking internal risk, external risk and natural risk factors into account, and then in sub-categories such as project management, financial viability and community engagement. The project is to be evaluated against each of the risk factors in each category and sub-category as set out in Section 2.2 of the tool.
• Each of these is divided into sub-categories, to which a score must be assigned. The total risk rating for each category (internal, external and natural) is to be determined by summing the ratings for each sub-category. While some sub-categories may have negative values, the total rating for any category may not be less than zero.
• Where risk mitigation synergies do not exist, the tables set a minimum rating of zero, even in cases where the calculation would otherwise determine a rating lower than zero. Where a risk factor does not apply to the project, the score is to be zero for that factor.
4. RISK ANALYSIS AND ADDITIONALITY
4.1. Additionality
4.2. Risk analysis and buffer determination

49 FEASIBILITY STUDY
ON CABO DE GATA SEAGRASS MEADOWS
Uncertainties calculated in the carbon model have already been mentioned in the results section. It was only possible to perform uncertainty calculations for CO2 data. However, it should be noted that there was only one carbon observation point per stratum.
There is also uncertainty as to the CO2 emissions from the degraded areas, as the model used to derive this data does not take the loss due to the mechanical action of the chain into account. In itself, the model may be underestimated due to this factor, which is crucial for the generation of emissions.
There is also uncertainty about the size of the degraded areas and their evolution over the past 15 years. The high-resolution images required for these observations could not be accessed.
As a result, the emissions from the model must be considered to be a mere approximation and, obviously, if certification were to be pursued, it would not be possible with the current uncertainties.
4.3. Uncertainties and additional considerations
A full list of internal, external and natural risks is included in Annex 2.
When the project architecture is implemented and all the information is complete, the risk analysis can be carried out as required by the VCS in line with the tools indicated for this purpose.
Overall non-permanence risk rating and buffer determination
Buffer determination is the result of executing the risk analysis of the aforementioned tool. The overall rating is calculated by summing the internal, external and natural risk scores. The minimum score must be 10 and the maximum is 60. Above this value, the project risk is considered to be unacceptably high and the project is not eligible for crediting until the risks are adequately addressed or sufficient mitigation measures are implemented so that the project is not assessed as “failed”. Further, where the sum of the risk ratings for any risk category exceeds the following thresholds, the project fails the entire risk analysis and is not eligible for crediting.
©M.OTERO/UICN

FEASIBILITY STUDY FOR PREPARATION OF CARBON OFFSETTING PROJECTS
50 50
In conclusion, the Agua Amarga project, with its current configuration of factors, is not viable due to its size, low production of credits, high variable and fixed costs, and the low average price of carbon credits. If all factors remain the same (production of credits, rates of degradation and erosion, average credit selling price, costs, etc.), the project cannot be profitable. This is independent of its area, because the total annual variable costs are higher than the total annual profits, in both the 5-year and the 10-year verification scenario.
Although conducting validations and verifications every 10 years enables reduction of variable costs by 22%, this is not sufficient to generate satisfactory return values in the project area. The costs, which are mostly variable, remain too high, and these costs would grow as the project area is expanded.
It would be necessary to produce approximately 2,324 VCUs at €8.82 or 683 VCUs at €30 per year to cover the average annual costs of the Agua Amarga project. This is considering only implementation and project cycle costs with validations and verifications every 10 years, without replanting.
To achieve profitability with the factors used in this study (the same rate of degradation of the area, plant mat erosion, implementation costs, project size) at Agua Amarga, a much higher credit selling price would be needed (approximately €900/credit for the scenario with verifications every 10 years without replanting). This price range has not been handled in the voluntary carbon market so far, therefore the project would not be competitive in the market.
The VCS methodologies, such as the one used to carry out this study, are to some extent designed for large projects, because the initial expenses for validation, verification and certification alone can cost approx. €50,000, which limits the possibility of finding profitability in a very small project. VM0033 methodology allows the project area to have discontinuous areas and if this problem is can be extended to other areas (justified present or future), it is possible that some profitability could be generated. However, the project would need to be re-evaluated at the appropriate scale to establish any conclusions.
Although there is a large carbon stock in the soil (especially in the willow area), the dynamic loss of CO2e from the plant mat appears to be slow and only a very small area of Agua Amarga suffers a verifiable threat of degradation. Free anchorages always occur in a small well-identified area of the willow- and intermediate-depth area and there are no indications that the degraded area could extend outside the limits already determined.
In order to locate the project areas in the other zones in Andalusia with seagrass meadows capable of generating “profitability” in carbon offsetting terms (under the same factors as used in this estimate), areas would need to be found where the degradation rate is much higher, both on the surface and at depth or in terms of erosion of the plant mat, willow waters with greater accumulation of stocks and where the threat spreads over larger areas (this must be verifiable). However, if the same implementation and project cycle costs are maintained, it would be difficult to achieve profitability in very small projects. The use of other tools could also help in the task of observing impacts.
Voluntary markets and their standards continue to evolve, and the new standard created in Andalusia will be able to incorporate some of the observations made in this study and evaluate some measures alternative to these initial applications. Although sequestration and the emissions prevented by these actions in Posidonia oceanica meadows are of relatively small volume due to this type of threat, preserving and restoring the role of these ecosystems as carbon sinks is, in fact, crucial in the fight against greenhouse gas emissions.
5. CONCLUSIONS AND RECOMMENDATIONS

51 FEASIBILITY STUDY
ON CABO DE GATA SEAGRASS MEADOWS
The central objective of this area of work is to take advantage of synergies between conservation of the meadows and conserving biodiversity, and between emissions mitigation and adaptation to the effects of climate change. They can provide opportunities to finance conservation actions that help preserve blue carbon ecosystems. To limit the increase in temperature to below the limit of 2ºC, and to avoid greater impacts on the marine environment, construction of a less carbon-intensive energy model and promotion of more sustainable industrial activity and mobility both regionally and locally are needed.
©STEBATI17/DREAMSTIME

FEASIBILITY STUDY FOR PREPARATION OF CARBON OFFSETTING PROJECTS
52 52
Arroyo, M. C. et al. (2015). Praderas de angiospermas marinas de Andalucía. Available at: https://www.iucn.org/km/node/26123.
Bayraktarov, E. et al. (2016). The cost and feasibility of marine coastal restoration, Ecological Applications, 26(4), pp. 1055-1074. doi: doi: 10.1890/15-1077.
Campagne, C. S. et al. (2015). The seagrass Posidonia oceanica: Ecosystem services identification and economic evaluation of goods and benefits, Marine Pollution Bulletin, 97(1), pp. 391-400. doi: https://doi.org/10.1016/j.marpolbul.2015.05.061.
Castejón, I. , Alvárez, B., Terrados, J. (2018). Guiía práctica: El plantado de Posidonia. Red Eléctrica, 35 pp.
Consejería de Medio Ambiente de la Junta de Andalucía (2008). Plan de Ordenación de los Recursos Naturales y el Plan Rector de Uso y Gestión del Parque Natural Cabo de Gata-Níjar. Boletin Oficial de la Junta de Andalucía.
Emmett-Mattox, S. y Crooks, S. (2014). Coastal Blue Carbon as an Incentive for Coastal Conservation , Restoration and Management: A Template for Understanding Options What Is Coastal Blue Carbon? Market and Non-Market Incentives The Science and Management of Coastal Blue Carbon, p. 6.
Fourqurean, J. et al. (2019). Carbono Azul. Métodos para evaluar las existencias y los factores de carbono en manglares, marismas y praderas marinos.pdf
Hamrick, K. y Brotto, L. (2017). State of European Markets 2017 Voluntary Carbon.
Lampreave, D. M. y Barrajón, A. (2016). Informe de campo de boyas y su impacto sobre las praderas de Posidonia oceanica en el Parque Natural de Cabo de Gata-Níjar (Almería). Programa de gestión sostenible del medio marino Andaluz.
Marba, N. et al. (1996). Growth and population dynamics of Posidonia oceanica on the Spanish Mediterranean coast: elucidating seagrass decline, Marine Ecology Progress Series, 137, pp. 203-213. Available at: https://www.int-res.com/abstracts/meps/v137/p203-213/.
Mateo, M. et al. (2019). Carbon stocks and fluxes associated to Andalusian seagrass meadows. Deliverable c1 : results report Group of Aquatic Macrophyte Ecology Centre for Advanced Studies of Blanes Spanish Council for Scientific Research, (December).
Milazzo, M. et al. (2004). Boat anchoring on Posidonia oceanica beds in a marine protected area (Italy, western Mediterranean): Effect of anchor types in different anchoring stages, Journal of Experimental Marine Biology and Ecology, 299(1), pp. 51-62. doi: 10.1016/j.jembe.2003.09.003.
Poffenbarger, H. J., Needelman, B. A. y Megonigal, J. P. (2011). Salinity Influence on Methane Emissions from Tidal Marshes, Wetlands, 31 (5), pp. 831-842. doi: 10.1007/s13157-011-0197-0.
REE (2018). Guía Práctica. El plantado de Posidonia oceanica. Técnica desarrollada en el proyecto. Uso de semillas y fragmentos de Posidonia oceanica en la restauración de Areas afectadas por la actividad de Red Eléctrica de España.
Restore Americas Estuaries y Silvestrum (2015). VM0033-Tidal-Wetland-and-Seagrass-Restoration-v1.0-3.pdf, p. 101.
Soukissian, T. et al. (2017). Marine Renewable Energy in the Mediterranean Sea: Status and Perspectives, Energies, 10. doi: 10.3390/en10101512.
6. BIBLIOGRAPHY


FEASIBILITYSTUDYFORPREPARATION OF CARBON OFFSETTING PROJECTS
54 54
FEASIBILITY STUDY IN ODIEL AND CADIZ SALT MARSHES

55 FEASIBILITY STUDY
IN ODIEL AND CADIZ SALT MARSHES
©ALAMY

FEASIBILITYSTUDYFORPREPARATION OF CARBON OFFSETTING PROJECTS
56 56
INTRODUCTION
Coastal wetlands with salt marshes and intertidal plains are important coastal ecosystems that often fringe the interior of estuaries and bays. Various studies over the last decade have provided estimates of carbon storage and sinking capacity in some of these wetlands and have shown their high effectiveness in carbon sequestration and accumulation. Carbon storage in salt marshes in the upper metre alone has been estimated at approximately 250 t C ha-1, an average value that can be 10 times higher than temperate forests and 50 times higher than tropical forests (Pendleton et al., 2012).
However, salt marshes also suffer severe losses due to dredging, landfilling, drainage and construction resulting from various interventions and are also threatened by sea-level rise as a result of “coastal compression”.
The reduced supply of coastal sediments and modification of water hydrodynamics are also frequent drivers of decline in these ecosystems. Their degradation and loss can lead to the release of the carbon stocks that these ecosystems have stored for thousands of years.
This study focuses on examining the feasibility of incorporating Andalusian wetland restoration projects in Cadiz Bay and the Odiel Salt Marshes into the Voluntary Carbon Markets, taking into account the requirements for certification based on the Verified Carbon Standard (VCS) VM0033 methodology and additional recommendations from the VCS AFOLU Requirements guide.
River San Pedro. Cádiz
©GÍMENEZCUENCASL/UICN

57 FEASIBILITY STUDY
IN ODIEL AND CADIZ SALT MARSHES
Cadiz Bay
Cadiz Bay is located at the southern tip of the peninsula, in the centre of the Atlantic coast of the province of Cadiz. It is a place largely constituted by wetland environments, estuaries and tidal marshes that extend through the municipal areas of Cadiz, San Fernando, Puerto Real, Chiclana de la Frontera and the Port of Santa Maria.
The characteristic landscape of the Bay is, in part, the result of the transformations it has undergone throughout history, mainly through the traditional saltern production carried out in the wetlands, created by the dynamic exchange of flows of brackish and fresh waters in the bay’s water networks, with the mouths of the rivers Guadalete and San Pedro being its most important flows.
Declared as Cadiz Bay Natural Park by Law 2/1989, of 18 July, which approved the Inventory of Protected Natural Spaces of Andalusia, an area of 10,522 ha is protected, including the Isla del Trocadero and Sancti Petri Salt Marshes Natural Sites and the Punta del Boquerón Natural Monument.
To ensure conservation of resources, as well as to regulate uses and activities in the territory, zoning and planning instruments, of Natural Resources Management Plan and Master Plan for Use and Management type, were created. These were approved by Decree 99/1994, of 3 May.
This Park is included in the List of Wetlands of International Importance by the Ramsar Convention of 2002, as well as in the Natura 2000 Network: a Special Protection Area for Birds (SPA) since 2003.
©UICN

FEASIBILITYSTUDYFORPREPARATION OF CARBON OFFSETTING PROJECTS
58 58
This Park is included in the List of Wetlands of International Importance by the Ramsar Convention of 2002, as well as in the Natura 2000 Network: a Special Protection Area for Birds (SPA) since 2003.
There are eight habitats of Community Interest in the Park, as declared by the Habitats Directive (Council Directive 92/43/EEC of 21 May), most of which fall within “Coastal and Halophytic Habitats”, with those associated with “salt marshes and salt meadows” predominating, including the priority habitat “Wooded dunes with Pinus pinea and/or Pinus pinaster”.
Over 58 species of non-passerine birds are found there, of which 36 are included in Annex I to Council Directive 79/409/EEC, of 2 April. A variety of migratory birds of international interest have been identified, according to the criteria established by the Ramsar Convention, with the bay being a transit point for species on the Eastern Atlantic flyway, with around 64 migratory bird species being present regularly.
Nine vertebrate species included in Annex II to Council Directive 92/43/EEC, of 21 May, have also been identified.
The succession of ecosystems, ranging from marine to terrestrial, results in the presence of highly specialised species. Two included in Annex II to Council Directive 92/43/EEC, of 21 May, have been identified. The zoning criteria established by the Natural Resources Management Plan differentiate three fundamental areas for protection: Reserve Zone, Special Regulation Zone and Common Regulation Zone. The Reserve Zones are those that merit the highest level of protection due their exceptional environmental values and state of conservation. They cover 4.48%, so these are not very extensive areas of the Park. They include the Isla de Trocadero and Sancti Petri Salt Marsh Natural Sites.
The Special Regulation Zones are characterised as areas of significant environmental, landscape, of conservation interest or due to their need for restoration. This includes Wetland Zones of Significant Ecological Interest, Coastal Zones of Notable Landscape and Natural Value, Wetland Zones of Active Conservation and Tidal Watercourses and Plains.
Finally, the Common Regulation Zones are areas of ecological interest that support intensive use, with slight changes of the landscape or environmental alterations. These include Beach Zones, Transformed Wetlands, Degraded Areas, University Facilities Areas.
Odiel Salt Marshes
The Odiel Salt Marshes are located in the south-eastern stretch of the coast of Huelva, forming an estuary system covering 7,185 hectares distributed across the municipal areas of Huelva, Punta Umbría and Gibraleón.
The estuary is formed by the mouths of the rivers Tinto and Odiel and is noteworthy as one of the most important tidal marshes on the coast of Andalusia, where, despite the industrial uses supported, great biological abundance remains, with the plant and bird communities being outstanding.
They were declared a Site of Natural Interest by Spanish Law 12/1984, of 19 October, and a Biosphere Reserve in April 1983. They have also belonged to the Ramsar Convention since 1989 and are an SPA. A series of factors define the ecological importance of this Site. On the one hand, it is an area with a great accumulation of nutrients, mainly from sediments from the downstream sections of the two rivers that meet there, which serve as food for a large number of species, with the colony of breeding spoonbills and numerous birds that winter there worthy of highlighting.

59 FEASIBILITY STUDY
IN ODIEL AND CADIZ SALT MARSHES
On the other hand, the influence that the Atlantic Ocean tides exert on the salt marshes leads to a variety of tidal marsh ecosystems, at the same time shaping the sedimentary banks, forming islands separated from each other by small bodies of water. Examples of these processes within the Odiel Salt Marshes are the island known as the Isla de Enmedio and the El Burro Salt Marshes, both of which have been declared Nature Reserves due to their conservation and their importance in the nesting of various bird species.
There are 11 habitats of Community interest and 4 priority habitats within this Site, the latter being: “2130. Fixed coastal dunes with herbaceous vegetation (grey dunes)”; “2250. Coastal dunes with Juniperus spp.”; “2270. Wooded dunes with Pinus pinea and/or Pinus pinaster”; “3170. Mediterranean temporary ponds”. Declared by the Habitats Directive (Council Directive 92/43/EEC, of 21 May). The zoning criteria established by the Natural Resources Management Plan define a protection regime and differentiated regulations for the Natural Reserves and the Natural Site.
The Natural Site, with untransformed dune formations and salt marshes, differentiates three Reserve Areas, with specific restrictions on uses and operations. There is also a Common Regulation Area subdivided into two, covering wooded systems, the estuary water network and highly transformed areas. The area of Natural Reserves accounts for 16.60% of the park, made up of the Isla de Enmedio and El Burro Salt Marshes. The remaining 83.41% corresponds to Natural Sites, of which 8.75% are Centres of Great Environmental Value on the Isla de Saltés, La Cascajera, the Isla de La Liebre and the El Manto lagoon. The dune systems are located along the coastal strip and represent 2.73% of the Site, while the untransformed tidal marshes extend over the entire protected area and account for 27.70%.
The Common Regulation Areas are made up of all the spaces not covered by the above descriptions. This amounts to a total of 44.23%, including the Juan Carlos I Dyke road, secondary roadways and salt crystallisation pans.
©UICN

FEASIBILITYSTUDYFORPREPARATION OF CARBON OFFSETTING PROJECTS
60 60
1. CAUSES OF WETLAND DEGRADATION
The historical uses and workings on the coast of Andalusia have generated significant alterations to the wetlands that, in some cases, have led to degradation of the ecosystems and landscapes endemic to the coasts of the province.
The degradation suffered by these areas, as in other regions, can be determined through alterations caused to the hydrological regime, the clogging of basins, decreases in water quality and the loss of biological communities.
Cadiz Bay
The mouth of the river Guadalete in Cadiz Bay generates a system of tidal marshes whose most degraded habitat are the salt ponds; ecosystems where large numbers of birds feed and reproduce. In general, however, the area occupied by the tidal marshes is affected by the following elements that cause alterations in their state of conservation:
• Water pollution: pollution of river courses is caused by municipal discharges from around their basins, as well as the leaching of products deriving from agricultural activities that accelerate eutrophication processes.
• Deforestation of the environment: as a method for creating areas for cultivation, resulting in a loss of soil productivity and increased susceptibility to water erosion.
• Exploitation of aquifers: use of groundwater to supply urban areas and for irrigation of crops creates problems of overexploitation and sea water intrusion.
• Alteration of the water regime: construction of infrastructure and road works involve alterations to and obstruction of the natural water flow, as well as decreasing the area of wetlands.
• Occupation of waterlogged soils for agricultural purposes through land drainage by means of a variety of infrastructures is another alteration that has changed the water regime.
• Alteration of biological communities: caused by a variety of activities such as the introduction of exotic species, the carrying out of activities that are not compatible with conservation of the environment and dumping of wastes, among others.

61 FEASIBILITY STUDY
IN ODIEL AND CADIZ SALT MARSHES
Odiel Salt Marshes
One of the main causes of degradation of the area has been water pollution. Over recent centuries, the mineral wealth around the Odiel and Tinto river basins has generated significant mining activity in their areas. The nature of the minerals, together with the discharge of wastes, has generated a significant accumulation of heavy metals and sulphides in the sediments on the Odiel Salt Marshes, as well as acidification of their waters, generating precipitation of dissolved metals when they come into contact with marine salinity, and they can become incorporated into food chains.
Potentially polluting activity has been decreasing. There is now only one industrial facility on the Isla de Saltés, consisting of a loading bay that, although located outside the limits of the Natural Site, performs certain industrial and stocking activities within the protected area. Added to this is the neighbouring Huelva Chemical Park, which processes chemical products and generates intense maritime traffic of an industrial and recreational nature.
On top of the mining problem is the use of fertilisers and pesticides in agricultural crops, where pollution is caused by soil runoff, intensifying eutrophication processes. There are also other elements that cause degradation of the area, mainly the following:
• Drying out of areas: desiccation of salt marsh flood zones has been used for subsequent crop occupation and intensive livestock farming.
• Dredging of sediments: fishing, together with the need for access to port and industrial areas by boat, are the usual reason for dredging the marshes. The sediments from this, with high concentrations of heavy metals, are collected in sites neighbouring the Juan Carlos I dyke.
• Deforestation: many of the wooded areas in the area were occupied with the purpose of introducing monospecific crops, such as eucalyptus or stone pine, for the intensive production of wood and other non-timber resources. Alien and invasive species are also present.
• Industrial salt ponds: currently only the industrial marshes located on the Isla de Bacuta are maintained. There are also others on the El Burro Salt Marshes that have been abandoned and on the Astur Salt Marshes that have been converted for fish farming purposes.
• Intensive agriculture: soil losses caused by intensive agriculture, deforestation, dredging or deterioration of the waterway margins result in a flow of sediments that can clog the wetland basins. These same wetlands are sometimes dried out for the purpose of occupying their space for agricultural use. This, together with overexploitation of aquifers and the creation of structural barriers, causes alterations in the flow in water networks, while the quality of their waters is reduced by eutrophication, the discharge of pollutants or increasing salinity.
On the other hand, the pressure from tourism with activities that are not entirely compatible with conservation taking place generates problems such as destruction of vegetation, interference with fauna and accumulation of wastes.
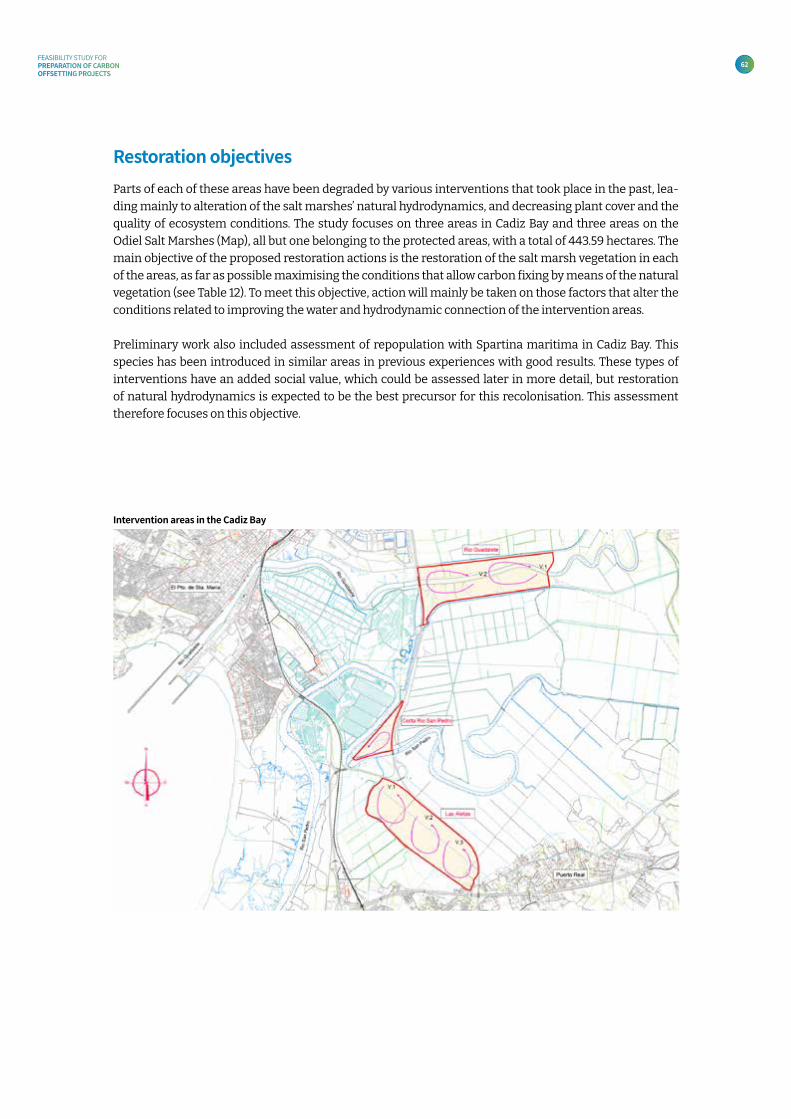
FEASIBILITYSTUDYFORPREPARATION OF CARBON OFFSETTING PROJECTS
62 62
Parts of each of these areas have been degraded by various interventions that took place in the past, lea-ding mainly to alteration of the salt marshes’ natural hydrodynamics, and decreasing plant cover and the quality of ecosystem conditions. The study focuses on three areas in Cadiz Bay and three areas on the Odiel Salt Marshes (Map), all but one belonging to the protected areas, with a total of 443.59 hectares. The main objective of the proposed restoration actions is the restoration of the salt marsh vegetation in each of the areas, as far as possible maximising the conditions that allow carbon fixing by means of the natural vegetation (see Table 12). To meet this objective, action will mainly be taken on those factors that alter the conditions related to improving the water and hydrodynamic connection of the intervention areas.
Preliminary work also included assessment of repopulation with Spartina maritima in Cadiz Bay. This species has been introduced in similar areas in previous experiences with good results. These types of interventions have an added social value, which could be assessed later in more detail, but restoration of natural hydrodynamics is expected to be the best precursor for this recolonisation. This assessment therefore focuses on this objective.
Restoration objectives
Intervention areas in the Cadiz Bay

63 FEASIBILITY STUDY
IN ODIEL AND CADIZ SALT MARSHES
Intervention Areas Area Condition/type of pressure
Cadiz Bay
Z1. North bank of the river Guadalete 154.99 ha. Water regime altered by basins and barriers for aquaculture and saltern purposes
Z2. River San Pedro cut 25.89 ha. Water regime altered by barriers and channels. Old salt ponds
Z3. Las Aletas 209.86 ha. Land profile modified due to change of use for crop development
Odiel Salt Marshes
Z1. Bacuta 38.31 ha. Abandoned industrial salt ponds
Z2. El Burro Salt Marshes 2.8 ha. Loss of water quality due to neighbouring agriculture
Z3. Industrial salt ponds 11.70 ha. Abandoned industrial salt ponds
Table 12. Intervention areas in the Odiel Salt Marshes and Cadiz Bay
Intervention areas in the Odiel Salt Marshes

FEASIBILITYSTUDYFORPREPARATION OF CARBON OFFSETTING PROJECTS
64 64
1.1.1. VM0033 Methodology
FEASIBILITY REQUIREMENTS OBSERVATIONS
CADIZ ODIEL
Condition 1 Meets VCS requirements
The project activities increase the rates of carbon sequestration or net removal of GHGs by restoration of degraded areas. Such activities include the restoration of hydrological conditions through the generation of artificial channels and the removal of obstacles to tidal flow. Such interventions would improve sediment input, depth of the water table level and salinity characteristics.
Condition 2 Meets VCS requirements
In accordance with what is stated under Condition 1, the project activities are designed to restore hydrological conditions through elimination of dykes and the generation of artificial channels, lowering the water table level in impounded wetlands and improving salinity characteristics in the disconnected areas. Additionally, sediment supply will be altered by soil profiling to generate middle marsh conditions due to their high CO2 fixing rate.
Condition 3 Meets VCS requirements
According to the Master Plan for Use and Management (PRUG) for the Cadiz Bay Natural Park, salt ponds represent almost 50% of the total Park area. Although they have various uses, such as traditional salt production or marine crops, 35% of the area occupied by salt ponds is in an abandoned state due to lack of profitability of both traditional and industrial operations, leading to progressive abandonment. Within the protected area, aquaculture is the main economic activity, followed by salt ponds and shellfish.
On the other hand, the Natural Resources Management Plan (PORN) for the Odiel Salt Marshes Natural Site states that the great majority of the uses are those typical of an estuary, there is no agricultural activity and a considerable proportion of the salt marshes have been transformed into saltworks. However, in the specific project intervention area (Bacuta and the El Burro Salt Marshes) there are abandoned salt ponds converted to a pilot aquaculture farm. Demonstrating the abandoned state of the project areas and bearing in mind that current land uses (aquaculture and shellfish) will continue at a similar level of service during project activities and the crediting period, conditions 3.a.i. and 3.c. of the methodology are met. A detailed analysis was performed to determine the abandoned status of the project areas.
In addition, Spanish Law 2/1989 (approving the Inventory of Protected Natural Spaces of Andalusia and establishing additional measures for their protection) and the aforementioned planning instruments (Natural Resources Management Plan and Master Plan for Use and Management), in both the Odiel Salt Marshes and Cadiz Bay, prohibit any activity likely to alter the elements and dynamics of the natural systems of the Reserves and any intervention involving the transformation or degradation of the existing natural salt marsh, fulfilling condition 3.a.iii.
The following is a description of the eight applicability conditions of the VMS Carbon Standard methodology (VM0033), and five additional conditions for which the methodology does not apply (conditions 9-14, see Annex 1). This detailed analysis of the applicability conditions in the study area is summarised in Table 13, separately for the two project areas and taking the available information into account. Green indicates that the applicability condition of the methodology is fully met; yellow indicates that information is required to determine whether the condition is met or can be met in the future; and red indicates the condition is not met. The observations column details the type of additional information required and adds some recommendations.
1.1. Applicability of methodology and feasibility
Table 13. Results of the feasibility study

65 FEASIBILITY STUDY
IN ODIEL AND CADIZ SALT MARSHES
FEASIBILITY REQUIREMENTS OBSERVATIONS
CADIZ ODIEL
Condition 4 Meets VCS requirements
Currently, the live biomass load in both the Odiel Salt Marshes and Cadiz Bay is not very high and does not represent a significant carbon stock. Substrate mobility prevents these areas from having significant plant cover.
On the other hand, agro-livestock uses are of limited significance within the project boundaries, so no significant carbon stock changes are expected due to harvesting or other related activities.
Condition 5 NA No prescribed burning of any biomass is planned during project activities in Cadiz Bay and the Odiel Salt Marshes.
Condition 6 NA The project proponent does not intend to claim GHG emission reductions due to reduced frequency of fires.
Condition 7 NA The project proponent does not intend to claim GHG emission reductions due to reduced frequency of fires.
Condition 8 Meets VCS requirements
Revegetation of the intervention areas is expected to be generated naturally after re-establishment of the water connection and rewetting of the intervention areas.
Condition 9 Meets VCS requirements
Project activities do not qualify as IFM or REDD, because the project intervention area is not on wooded land. The project is focused on wetlands restoration and therefore qualifies as WRC.
Condition 10 Meets VCS requirements
Within the protected area of Cadiz Bay, the use of natural resources is limited to aquaculture, shellfishing and salt production activity. In addition, the Master Plan for Use and Management of the Park assumes, within its criteria for conservation of natural resources, that the absence of forestry uses is maintained (Chapter 3.1, paragraph C).
Forestry uses are carried out in the Odiel Natural Site. The traditional pine resource, wood and honey, is perfectly integrated for conservation purposes, but cultivation of forest species for timber harvesting, such as eucalyptus, results in impoverishment of natural communities. However, in the specific area for the carrying out of activities, no forestry activities are carried out, as the intervention areas are characterised by the absence of vegetation.
Condition 11 NA
Included in the project activities is the elimination of barriers to tidal flooding and the creation of artificial channels in certain areas. The actions in both project areas aim to restore tidal dynamics and improve the hydrological connection of impounded wetlands or waters isolated by artificial barriers.
We believe that determining whether the project activities lower the water table level is unnecessary, because there will be improvements in the hydrological connection.
Condition 12 Meets VCS requirements
The actions planned in the various intervention areas are aimed at improving hydrological connectivity. These actions include various types of interventions, such as improving connectivity of the intervention areas to adjacent areas by removing hydrological barriers; improving hydrological connectivity within areas by building irrigation channels and optimising atmospheric carbon capture.
These isolated alterations to the hydrological regime will expand the areas flooded by the tidal regime by establishing direct connectivity with the rest of the areas that make up the salt marsh and that have direct connection to the sea outlet through the wetland drainage network. The influence of these alterations on the water regime of the adjacent areas is considered negligible.
The need exists to determine whether there is hydrological connectivity of the project area with adjacent areas, which could lead to increases in GHG emissions outside the project area. According to the guideline, there are three ways to demonstrate this. Refer to Annex 1.
Condition 13 Meets VCS requirements
No burning of organic soil is anticipated during project activities in the Odiel Salt Marshes or Cadiz Bay.
Condition 14 Meets VCS requirements
No agricultural activities currently take place in the area delimited for project execution, nor are they anticipated during the crediting period. Therefore, no nitrogen fertilisers are applied or will be applied in the project area. In addition, under Spanish Law 2/1989, “any type of action and/or intervention that may involve a transformation or modification of the environment and would lead to degradation of its ecosystems” is prohibited.

FEASIBILITYSTUDYFORPREPARATION OF CARBON OFFSETTING PROJECTS
66 66
AFOLU REQUIREMENTS
FEASIBILITY REQUIREMENTS OBSERVATIONS
CADIZ ODIEL
Section 3.1.3 Meets VCS requirements
In the PDD preparation phase, submitting a list of applicable laws and regulations, approved by the autonomous regions and the central government.
Section 3.1.6 Meets VCS requirements
Salt marsh transformation activities in both intervention areas have taken place for over 60 years for industrial and urban purposes, not to generate carbon credits.
Section 3.1.7 Meets VCS requirements
There is sufficient evidence of the condition of transformation and degradation of the salt marshes since the 1940s as a result of industrial, urban and agricultural activities.
Section 3.4.2 Meets VCS requirements
In the PDD preparation phase, submitting evidence of land ownership/tenure in the specific project areas.
Section 4.2.16 Meets VCS requirements
Cadiz Bay and the Odiel Salt Marshes belong to the group of tidal marshes, clearly influenced by and dependent on the sea’s cyclic regime. The Agreement of the Council of Ministers of 27 September 2002 included Cadiz Bay in the List of Wetlands of International Importance, in accordance with the “Convention on Wetlands of International Importance especially as Waterfowl Habitat”, done at Ramsar on 2 February 1971. The Odiel Salt Marshes have been declared as a Ramsar site since 1989. Further details on the classification of the two wetlands can be found in the Ramsar Wetlands Information Sheets.
ADDITIONALITY AND RISK ANALYSIS
FEASIBILITY REQUIREMENTS OBSERVATIONS
CADIZ ODIEL
Is the project additional?
Meets VCS requirements
Is the project permanent?
Insufficient information
Insufficient information is available to carry out the risk analysis according to the methodology.
This tool has no internal applicability conditions.
1.1.2. AR-TOOL14 “Estimation of Carbon Stocks and Change in Carbon Stocks of Trees and Shrubs in A/R CDM Project Activities”

67 FEASIBILITY STUDY
IN ODIEL AND CADIZ SALT MARSHES
Although the VM0033 methodology refers to this methodological tool for evaluating baseline scenarios and demonstrating additionality, the applicability conditions were not taken into account because these are related to afforestation and reforestation (A/R) activities.
Applicability conclusions
According to this information, it can be concluded in preliminary manner that the proposed restoration actions are feasible for registration under the VCS standard, both in Cadiz Bay and in the Odiel Salt Marshes.
However, taking the following considerations into account is recommended: analysis of the risk of non-permanence needs to be performed following the guidelines of version 3 of the AFOLU Non-Permanence Risk Tool. The analysis cannot be performed with the current information because there is insufficient information on project management, financial viability, opportunity cost, longevity, land ownership, community engagement, governance and the likelihood of natural hazards occurring in the project area. This analysis can be included in the PDD preparation phase, along with the list of applicable national and local laws and regulations (section 3.1.3 of the AFOLU Requirements), and evidence of land ownership/tenure in specific project areas (Section 3.4.2 of AFOLU Requirements).
1.1.3. CDM TOOL “Combined tool to identify the Baseline Scenario and demonstrate additionality in A/R CDM Project Activities”
Las Aletas. Cádiz
©GÍMENEZCUENCASL/UICN

FEASIBILITYSTUDYFORPREPARATION OF CARBON OFFSETTING PROJECTS
68 68
1.2.1. Scope of the projectThe study focuses on the analysis of various interventions anticipated in three areas in Cadiz Bay, included within the protected area of the same name, except for the so-called “Las Aletas”, and three areas of the Odiel Salt Marshes, all belonging to the area declared a Natural Site, represented in drawings 1, 2, 16 and 17 of the mapping, with a total area of 443.59 hectares (Table 12).
All the areas are public lands, the management of which depends on the corresponding authority according to the distribution of competences in force in each case.
1.2. Project Boundaries
Cadiz Bay. North bank of the river Guadalete

69 FEASIBILITY STUDY
IN ODIEL AND CADIZ SALT MARSHES
Cadiz Bay. River San Pedro cut
Cadiz Bay. Las Aletas

FEASIBILITYSTUDYFORPREPARATION OF CARBON OFFSETTING PROJECTS
70 70
Odiel Salt Marshes. Bacuta
Odiel Salt Marshes. El Burro Salt Marshes

71 FEASIBILITY STUDY
IN ODIEL AND CADIZ SALT MARSHES
1.2.2. StratificationStratification of the project scope for each of the areas has been carried out according to the existing vegetation cover and its state of degradation, in the latter case following the categories established in the study by Almela et al. (2019), “Carbon stocks and fluxes associated to Andalusian salt marshes and estimates of impact in stocks and fluxes by diverse land-use changes”, namely: Odiel wild, Cadiz Bay wild, Odiel dry, Odiel rewetted, Cadiz salt pond, Cadiz wet abandoned salt pond, Cadiz dry abandoned salt pond and Odiel planted, in each case considering their position from the point of view of tidal dynamics, distinguishing low, middle, high or continentalised salt marsh.
Odiel Salt Marshes. Industrial salt ponds

FEASIBILITYSTUDYFORPREPARATION OF CARBON OFFSETTING PROJECTS
72 72
Each of the intervention areas was assigned the value of the carbon stocks corresponding to their most representative stratum according to the information available.
Cadiz Bay• Z1. North and south bank of the river Guadalete: 199.20tCO2/ha (SL-CW)• Z2. River San Pedro cut: 199.20 tCO2/ha (SL-CW)• Z3. Las Aletas: 199.20 tCO2/ha (SL-CW)
Odiel Salt Marshes • Z1. Bacuta: 609.50 tCO2/ha (ODB.Z)• Z2. El Burro Salt Marshes: 216.80 tCO2/ha (ODND-C)• Z3. Industrial salt ponds: 216.80 tCO2/ha (ODND-C)
The oxidation emission rate used in the calculation is that estimated in section 4.1, taking a value of 12.80 tCO2/ha year, equally for all strata.
Cadiz Bay• Z1. North and south bank of the river Guadalete: 15.56 years• Z2. River San Pedro cut: 15.56 years• Z3. Las Aletas: 15.56 years
Odiel Salt Marshes • Z1. Bacuta: 47.62 years• Z2. El Burro Salt Marshes: 16.94 years• Z3. Industrial salt ponds: 16.94 years
1.2.3. Time limitThe project time limit matches the period for which the project is eligible for claiming emissions reduc-tions due to restoration. This period is set through the Soil organic carbon Depletion Time SDT, (page 22).
Under a conservative approach, and taking the availability of data for the scope of the study into account, a depth of 1 m is taken as the reference for determination of the carbon content in the soil. This is con-sistent with what is obtained from the formula proposed in the standard:
Where:
C,i,t0 = Average organic carbon stock in mineral soil in stratum i at the project start date (tCO2/ha)Depth,soil,i,t0 = Soil depth considered for stratum i at the project start date (m)VC = Average carbon content in mineral soil (kgCO2/m3)
C,i,t0 = Depth,soil,i,t0 x VC x 10

73 FEASIBILITY STUDY
IN ODIEL AND CADIZ SALT MARSHES
1.2.4. Carbon poolsThe carbon pools included in and excluded from the project scope, as well as the sources of greenhouse gas (GHG) emissions considered for calculation of emissions/removals both in the baseline and in the project are presented in Table 14 and Table 15 respectively.
CARBON POOL INCLUDED? JUSTIFICATION/EXPLANATION
Baseline
Aboveground tree biomass NoThe characteristic vegetation in both project areas is shrub type and herbaceous, aboveground tree biomass is therefore not included in the study.
Aboveground non-tree biomass Yes This is included, although the increase in this carbon pool in
the baseline is expected to be insignificant.
Belowground biomass No This is considered negligible.
Litter No
It is a conservative option to exclude this reservoir from the calculation, because the project activity will not decrease its accumulation rate. It may additionally be indirectly included in the herbaceous vegetation carbon pool.
Dead wood No In a conservative approach, no increase or decrease in this carbon pool is anticipated in the baseline scenario.
Soil Yes
It is the largest carbon pool in the project area. Although no significant carbon stock changes are anticipated in the baseline scenario, this pool has been considered because project activities are expected to generate an increase in the stocks.
Project
Aboveground tree biomass NoThe characteristic vegetation in both project areas is shrub type and herbaceous, aboveground tree biomass is therefore not included in the study.
Aboveground non-tree biomass Yes
This is included, although the increase in this carbon pool in the with project scenario is expected not to be as significant as soil stocks.
Belowground biomass No Not included. The increase in this carbon stock in the with project scenario is not expected to be as significant as the soil stocks.
Litter No
It is a conservative option to exclude this reservoir from the calculation, because the project activity will not decrease its accumulation rate. It may additionally be indirectly included in the herbaceous vegetation carbon pool.
Dead wood NoIn a conservative approach, no increase or decrease in this carbon pool is anticipated during the project activities and the crediting period.
Soil Yes It is the largest carbon pool in the project area. Project activities are expected to generate an increase in these stocks.
Table 14. GHG removals by sinks in the baseline and the project
In this regard, it should be mentioned that the standard establishes the recommendation to set SDT to zero when the sites have been drained for more than 20 years or erosion is significant. As for the first of these conditions, it is noted that all the areas have a tidal influence, so this criterion would not be fulfilled strictly, as their current state is the result of an alteration in hydrodynamics rather than a water disconnection. With respect to the second, no erosion losses were identified in the selected strata following the reference study.

FEASIBILITYSTUDYFORPREPARATION OF CARBON OFFSETTING PROJECTS
74 74
Table 15. Sources of emissions
EMISSION SOURCE GAS INCLUDED? JUSTIFICATION/EXPLANATION
Baseline
Production of CH4 by microbes CH4 Yes
Emissions are expected to decrease with the project activities. In the absence of more reliable data, reference estimates have been used.
Nitrification/Denitrification N2O Yes
In a conservative approach, N2O emissions can be excluded from the baseline scenario. In this case, they are included in the baseline calculation to estimate a possible change in emissions in the with project scenario. In the absence of more reliable data, reference estimates have been used.
Burning of biomass and organic soil
CO2 NoBurning of biomass and organic soil is not a common practice within the scope of the project.CH4 No
N2O No
Burning of fossil fuels
CO2 NoBurning of fossil fuels is not a common practice within the scope of the project.CH4 No
N2O No
Project
Production of CH4 by microbes CH4 Yes
Emissions are expected to decrease with project activities by increasing soil salinity due to reconnection with tidal dynamics. In the absence of more reliable data, reference estimates have been used.
Nitrification/Denitrification N2O Yes
Emissions are expected to decrease with the project activities as the soil salinity is increased. In the absence of more reliable data, reference estimates have been used.
Burning of biomass and organic soil
CO2 NoBurning of biomass and organic soil is not anticipated during project activities.CH4 No
N2O No
Burning of fossil fuels
CO2 NoFossil fuel use during transport and machinery for earth movement during the project activities can be considered as de minimis.
CH4 No
N2O No
Isla de Bacuta. Huelva
©GÍMENEZCUENCASL/UICN

75 FEASIBILITY STUDY
IN ODIEL AND CADIZ SALT MARSHES
The CDM methodological tool “Combined tool to identify the baseline scenario and demonstrate addi-tionality in A/R CDM Project activities” was used for the purpose indicated. Steps 0 and 2b were disregar-ded, following the guidelines of the VM0033 methodology.
For each of the study areas, three intervention areas have been defined as described in section 2.2. on “Assessment of wetland conditions”.
Step 1. Scenario selection
Cadiz Bay and Odiel Salt Marshes. The first step is to identify alternative scenarios to the proposed project activities.
Scenario 1. Statu Quo: The project area will continue as abandoned salt ponds and degraded salt marsh.
Scenario 2. Natural regeneration of the salt marsh.
Scenario 3. Activities to restore the hydrological connectivity of the salt marsh are carried out without being registered as a VCS project.
Step 2. Barrier analysis
The second step is to identify the investment, institutional, technological, cultural, ecological, social and land-ownership barriers that prevent the occurrence of the three scenarios. Table 16 and Table 17 sum-marise the barriers identified in Cadiz Bay and in the Odiel Salt Marshes respectively:
1.3. Determination of the baseline
SCENARIO 1 SCENARIO 2 SCENARIO 3
Investment
Institutional
Technological
Local traditions
Common practices
Ecological conditions
Social conditions
Land ownership
Table 16. Barriers identified in Cadiz Bay and Odiel Salt Marshes

FEASIBILITYSTUDYFORPREPARATION OF CARBON OFFSETTING PROJECTS
76 76
Scenario 1: Statu Quo
According to the tables above, no barriers to the implementation of this scenario were identified in either Cadiz Bay or the Odiel Salt Marshes. The project areas classify as abandoned salt ponds those bare areas devoid of vegetation where tidal flow has been interrupted and areas with few shrub species. Despite being protected land under Spanish Law 2/1989 and other planning instruments, urbanisation processes and the high dependence of the population on aquaculture and shellfishing activities in the area could represent high anthropic pressure on natural resources. An analysis of the past 17 years in Cadiz Bay is presented in the justification of Scenario 2, showing a stable trend in the vegetation index. It is therefore expected that the current conditions in the project execution areas will be maintained in the future if the project activities are not registered under the VCS standard.
Additionally, according to the VM0033 methodology, the most plausible baseline scenario for salt marsh restoration projects must be identified as degraded areas whose ecological conditions would not improve in the absence of the project.
Scenario 2: Natural regeneration
A figure is shown below corresponding to the analysis for the 2001-2017 period for the normalised difference vegetation index (NDVI) for the “Las Aletas” study area in Cadiz Bay. The NDVI data is derived from data taken by NASA’s MODIS TERRA Earth observation satellite. The data were processed from MODIS standard product MOD13Q1 to which a non-parametric smoothing filter (4253H-Twice) was applied, as shown in Annex 3. Due to the periodic flooding conditions in these areas, NDVI values are strongly influenced by flooded lands (with low values not representative of the salt marsh vegetation cover conditions). For this reason, the annual maximum values were taken, corresponding to the seasonal situation of maximum plant cover associated with each of the reference zones analysed. This enables the noise generated by the non-representative values for plant cover associated with the water logging or flooding conditions of the areas under analysis to be minimised.
The progression of the index values shows a trend that is stable (slope of the line of fit less than ±1%) but not significant (with values of R2 = 0.2 and p > 0.05) during the analysis period related to the plant cover of the area. The index values are very low, with average values of 0.23 and maximum values of less than 0.4, corresponding to areas with very low plant coverage.
The data analysed over a 17-year period indicate poor natural recovery of the study area, showing a possible need for a change in natural dynamics through application of the corresponding restoration and corrective measures.
Figure 11. NDVI, “Las Aletas” in Cadiz Bay, 2000-2017

77 FEASIBILITY STUDY
IN ODIEL AND CADIZ SALT MARSHES
The same analysis is carried out in the area located on the north and south banks of the river Guadalete (Cadiz Bay). The results obtained are shown in the following figure 13:
The progression of the index values shows a trend that is stable, but not significant (with values of R2 = 0.14 and p > 0.05) during the analysis period (slope of the line of fit less than ±1%), related to the plant cover of the area. The index values are very low, with average values of 0.23 and maximum values of less than 0.38, corresponding to areas with very low plant coverage.
The data analysed over a 17-year period indicate poor natural recovery of the study area, showing a possible need for a change in natural dynamics through application of the corresponding restoration and corrective measures.
Next, the results of the analysis for the area located near the San Pedro River cut (Cadiz Bay) are shown. The results obtained appear in the following figure 12:
The progression of the index values shows a trend that is stable during the analysis period (slope of the line of fit less than ±1%), although not significant (with values of R2 = 0.2 and p > 0.05), related to the plant cover of the area. The index values are very low, with average values of 0.23 and maximum values of less than 0.4, corresponding to areas with very low plant coverage.
The data analysed over a 17-year period indicate poor natural recovery of the study area, showing a possible need for a change in natural dynamics through application of the corresponding restoration and corrective measures.
Figure 12. NDVI, “River San Pedro cut” in Cadiz Bay, 2000-2017
Figure 13. NDVI, “North and south banks of the Guadalete” in Cadiz Bay, 2000-2017.

FEASIBILITYSTUDYFORPREPARATION OF CARBON OFFSETTING PROJECTS
78 78
Next, the results of the analysis for the area located on the Isla de Enmedio (Odiel Salt Marshes) are shown. The results obtained appear in the figure 14:
The progression of the index values shows a trend that is stable, but not significant (with values of R2 = 0.05 and p > 0.05) during the analysis period (slope of the line of fit less than ±1%), related to the plant cover of the area. The index values are low, with average values of 0.38 and maximum values of less than 0.57, corresponding to areas with low plant coverage. Due to the spatial resolution of the data used (250 metres),
the pixel contains a mixture of spectra from clear area and area with vegetation.
The data analysed over a 17-year period indicate poor natural reco-very of the study area, showing a possible need for a change in natural dynamics through appli-cation of the corresponding res-toration and corrective measures.
Next, the results of the analysis for the area located on the El Burro Salt Marshes (Odiel Salt Marshes) are shown. The results obtained appear in the following figure 15:
The progression of the index values shows a stable, significant (with values of R2 = 0.6 and p < 0.05) trend during the analysis period (the slope of the line of fit is very low, at around ±1%), related to the plant coverage of the area. The index values are medium, with average values of 0.42 and maximum values of less than 0.6, corresponding to areas with medium plant coverage.
Data analysed over a 17-year period indicate a gradual increase in plant cover in the area. This increase in index values could be related to a progressive change in vegetation type. Therefore, in this case, this observed increase could be due to a change in the type of vegetation associated with the degradation conditions which are the consequence of external factors such as silting due to sedi-ment input from the surrounding waterways during spate periods.
Although natural regeneration of vegetation was seen in the El Burro Salt Marshes during the period analy-sed, the intervention area corresponds to discontinuous zones with an area of low plant cover.
Figure 14. NDVI, “Isla de Enmedio” in the Odiel Salt Marshes, 2000-2017
Figure 15. NDVI, “El Burro Marshes” in the Odiel Salt Marshes, 2000-2017

79 FEASIBILITY STUDY
IN ODIEL AND CADIZ SALT MARSHES
The results of the analysis corresponding to the area of industrial salt ponds (Odiel Salt Marshes) are shown below. The results obtained appear in the following figure 16:
The progression of the index values shows a stable, significant (with values of R2 = 0.35 and p < 0.05) trend during the analysis period (slope of the line of fit less than +1%), with very low values corresponding to areas without vegetation. Some increase in index values is seen from 2010, probably associated with a small increase in plant cover in the area. However, the values become negative during certain periods from 2016, probably associated with a new flooding regime in the area, returning to an average value in 2017.
Therefore, the data analysed over a 17-year period indicate poor natural recovery of the study area, showing a possible need for a change in natural dynamics through application of the corresponding restoration and corrective measures.
Figure 16. NDVI, “Industrial salt ponds” in the Odiel Salt Marshes, 2000-2017

FEASIBILITYSTUDYFORPREPARATION OF CARBON OFFSETTING PROJECTS
80 80
Scenario 3: Activities for revegetation and restoration of the hydrological connectivity of the salt marsh are carried out without being registered as a VCS project.
A detailed analysis of all the barriers identified is presented below:
Investment barriers
The objective of the project in both the Cadiz Bay and the Odiel Salt Marshes is to restore degraded areas in the marshes to maintain a sustainably managed ecosystem to increase carbon absorption rates. However, no direct income is expected from restoration and conservation activities. Timber harvesting or forestry uses have not been considered in the project activities and the benefits are indirect and long-term. There is no credit or financing for these types of activities and they are therefore not considered profitable. Activities to restore the hydrological conditions and revegetation will only be possible due to the benefits provided by the project when registered under the VCS standard.
Institutional barriers
Poor coordination between public institutions to coordinate and promote interventions related to management of the Natural Park/Site.
• Excessive bureaucracy in the operation of the authorities.• Slowness and complexity in processing permits and authorisations in the Natural Park/Site.• Lack of public economic resources.• Absence of supra-municipal initiatives on sustainable development of the Natural Park/Site.• Disparity of criteria between sector authorities.• Deficiencies in management and institutional cooperation for development.
Technological barriers
Technical support is essential for undertaking wetland restoration activities. Local communities in the area are not capable of performing a successful restoration project of this scale without logistical support, knowledge and specialised technical expertise to define actions, critical areas for intervention and type of vegetation, among others. Heavy equipment is also required for removal of dykes and for extraction/cutting, collection and filling of excavation material.
Social conditions
• Absence of territorial identity in relation to the Natural Park/Site.• Limited engagement of the local population in the management of the Natural Park/Site.• A convenient susceptibility to believe that Government has to solve all the problems.• Excessive dependence on aid and subsidies explains the difficulty of promoting entrepreneurial
attitudes among the local population. • Limited access to technical and organisational support.

81 FEASIBILITY STUDY
IN ODIEL AND CADIZ SALT MARSHES
Step 3. Common practice analysis
According to the Report “Recopilación e identificación de acciones de restauración ecológica en humedales espyearles” [Collection and identification of ecological restoration actions in Spanish wetlands], promoted by the Spanish Ministry for Ecological Transition and Demographic Challenge, various national, regional and local Spanish Administrations, as well as various organisations and other stakeholders have, over the last 20 years, launched around 685 wetland restoration and restoration projects, but generally acting independently and rarely drawing on the experience gained in other projects, especially due to limited dissemination of results and methods used in the case of successful projects and the apparent lack of overall planning. The report selected and analysed 78 projects, with the most frequent source of funding being from public administrations (European, national, regional and local, in that order) and the objective of restoration was aimed at the recovery of specific habitats or species and adaptation to climate change.
As mentioned in step 2, wetland restoration activities of similar scale and objectives to those of the project face four main barriers: financial, institutional, technological and social. All the restoration projects in Spain have had different sources of funding and they have not had to overcome the barriers identified in this analysis. Furthermore, no project for restoration of tidal marshes in Spain has been registered under the VCS standard to date. It is therefore concluded that the project activities cannot be considered as the baseline scenario.
Conclusion (baseline scenario): The scenario applicable as the baseline in Cadiz Bay and the Odiel Salt Marshes is the Statu Quo (Scenario 1).
Aerial photo of group of flamingos flying over in the Natural Park of Cadiz Bay.
©LÓPEZ/WILDWONDERSOFEUROPE

FEASIBILITYSTUDYFORPREPARATION OF CARBON OFFSETTING PROJECTS
82 82
2. PROJECT SCENARIOS
2.1. Identification of reference conditions
In spite of the variability of factors that define and characterise each salt marsh, there are certain basic conditions that make them one of the most productive ecosystems known in nature.
Salt marshes are formed thanks to the contribution of sand from the sea, which is transported by the tidal currents and deposited in the form of small islands where materials coming from the rivers, such as limes and clays, accumulate. The success of salt marsh productivity lies in the transfer of energy and nutrients arriving at these sedimentary deposits where, through the courses, channels and creeks, organic matter and nutrients are distributed thanks to the energy provided by the water fluctuations.
These sediments and the biomass act as sinks where bacteria play an important role in releasing nutrients that are usable by primary producers (autotrophic organisms), while the secondary organisms (heterotrophs) feed on the organic matter.
©DREAMSTIME
Cadiz Bay

83 FEASIBILITY STUDY
IN ODIEL AND CADIZ SALT MARSHES
But although the sediments are the basis of the biological abundance, there are many others that determine its variability, as they often develop physiological, metabolic or behavioural adaptations to suit the conditions involved where the sea meets fresh water.
The tidal range (the difference high tide and low tide levels) causes salt marsh processes to be more or less conditioned by the sea, influencing sediment deposition and erosion and salinity, which has a gradient that increases with distance from the sea. This gradient determines the distribution of biological communities.
Water stratification, from the density gradient between fresh water and salt water, also conditions the biological communities, which would develop more on the edges, i.e. in fresh water. Meanwhile, light radiation limits the growth of primary producers, so solar exposure and turbidity influence production, and temperature influences respiration processes.
The substrates in the Odiel Salt Marshes are mainly composed of sands, limes and clays, transported from the main river that gives name to the salt marsh, in addition to those coming from the sea, which transports materials eroding from coastal areas.
In particular, this dynamic was altered after the construction of the dyke for retention of sands, located in the Canal del Padre Santo, at the mouth of the Odiel, to mitigate the massive accumulation of materials coming from the sea, which made it difficult to navigate the estuary, and that caused development of new sandy spits on the Isla de Saltés. Likewise, the growth of the Punta Umbría spit affects the dynamics of the hydrological regime, and its development favoured that of the islands of Enmedio, Saltés and Bacuta, acting as a natural barrier.
Cadiz Bay is divided into two parts. The first, into which the river Guadalete flows, is an open bay, well connected with the open sea and with major energy exchange in which a sandy bottom predominates. On the other hand, the area of the bay further to the south west is more protected, with the predominance of tidal channels and muddy sediments.
In natural salt marshes, altitude acts as a constraint, defining sedimentary characteristics, as it determines the points which the tides are capable of reaching. Middle levels are covered by water for several hours at each high tide, creating beds composed mainly of limes. In the higher regions, reached by sea waters only during spring tides, the soils are predominantly hard, with more compact sands, limes and clays.
Water and sedimentary distribution takes place through a network of channels distributed along the Sancti Petri channel as its main axis, feeding the salt marsh and connecting the waters of the Atlantic and those of the bay.
Although not very representative, the waterlogged hypersaline areas of the grassland at La Algaida and the temporary rainwater pond of La Vega, whose low saline concentration stands out in the context of the Bay, are worthy of note.

FEASIBILITYSTUDYFORPREPARATION OF CARBON OFFSETTING PROJECTS
84 84
2.2. Assessment of wetland conditions
Cadiz Bay
The area currently has areas considered to be of high ecological value, coinciding with the Natural Park Reserve Zones, where vulnerable and critical habitats are located. Their importance lies in the fact that these are important feeding, shelter and breeding areas for birds, marine fauna and large numbers of other biological species. The Natural Sites of the Isla del Trocadero and Sancti Petri Salt Marshes are in a good state of conservation with the presence of priority habitats of community interest.Those zones established as Special Regulation have characteristics with high environmental, geomorphological and landscape values, in addition to being in a good state of conservation or requiring restoration.
The Special Regulation is divided into 4 sub-zones. The Wetland Zones of Significant Ecological Interest, made up of natural salt marshes and active or abandoned traditional salt ponds, in which the environment of Arillo, Camposoto lagoon, the Vicario salt pond, Patrocinio and the traditional salt ponds of the Natural Park environment have been included.
The Coastal Zones of Exceptional Landscape and Natural Value contain formations with a great diversity of habitats, with vulnerable and endangered species. This is the case for the Toruños Peninsula, the last stretch of the river San Pedro, the pine forest of La Algaida and surrounding grasslands, the Punta del Boquerón (Camposoto beach) and associated dune system, as well as the channels and natural salt marshes and salterns from the San Nicolás salt ponds to the end of the cuspate foreland of Sancti Petri, the areas of Camposoto beach not considered C1, the Pinar de las Mogarizas and the Islote de Sancti Petri.
Wetland Zones of Active Conservation are traditional abandoned salt ponds or those operated for marine crops that are not included in the other Zones. These habitats are of interest mainly due to their importance in the nesting, feeding and resting of coastal birds.
The tidal watercourses and plains are environments of great importance means for bird feeding and for spawning and rearing of fish. Included in this classification are the tidal plains of Cadiz Bay, the main watercourses and their margins, the river Guadalete, part of the river San Pedro, the river Sancti Petri, the river Iroel, the river Zurraque, the Madre channel, the Molino Nuevo channel, the Rubian channel, the San Fernando channel, the La Merced channel, the Rosario channel and the Bartivás canal.
The following range of protection corresponds to the Common Regulation Zones, areas of the Park with high stress due to their intensive use that have undergone certain alterations.
This is the case with the Beach Zones, which are under pressure from tourism and local people, causing a decline in the ecosystems on the beaches. Such as at Cachucha, part of Camposoto and Levante beach.
Salt ponds that have undergone great transformations in their morphology and structures for the implementation of marine crops are included within Transformed Wetland Zones.
Finally, the infrastructures, greatly altered zones and facilities with high interest for being the subject of restoration are included within the Degraded Zones, as is the case of the Nuestra Señora de los Dolores salt pond occupied by the Cádiz-San Fernando wastewater treatment station, the Santa Leocadia salt pond and the old tunny fishery, Santibañez eucalyptus areas, the area of contact between the San Rafael de Monte salt pond, San Patricio, San José del Palmar, El Pópulo and the N-IV road neighbouring the

85 FEASIBILITY STUDY
IN ODIEL AND CADIZ SALT MARSHES
Jarana district, including the existing vehicle park and the fishing preserve, degraded areas of the right bank of the river Guadalete, of the Nuestra Señora de la Ó salt pond, spaces adjacent to roads and railway tracks, the car parks and roads of Camposoto beach, and the environment of the Los Gallos housing development.
As regards the particular conditions of the intervention areas:
Intervention area 1 (north bank of the river Guadalete) is included within what is considered Tidal Watercourses and Plains in the Natural Resources Management Plan for the Cadiz Bay Natural Park. This level of protection is due to its environmental value as a priority area for fish spawning and rearing or essential for feeding of coastal birds. It includes the main watercourses that determine the hydrological regulation of the salt marsh, as well as the transport of biomass and nutrients to the system.
The importance of the tidal plains lies in their ability to produce a large number of algae and seagrasses, the habitat of which is threatened by the discharge of hazardous products from agriculture and human activities, the construction of barriers for the creation of basins for aquaculture and saltern purposes, the increase in fishing and shellfish harvesting.The area is currently devoid of vegetation over much of its surface, with the flooding regime from tidal effects altered due to the transformation of the adjacent physical environment.
Figure 17. Intervention areas in Cadiz Bay.
North bank of the river Guadalete Surface: 200 ha
River San Pedro cutSurface: 34,5 ha
Las AletasSurface: 216 ha
©GOOGLEEARTH
©GÍMENEZCUENCASL/UICN

FEASIBILITYSTUDYFORPREPARATION OF CARBON OFFSETTING PROJECTS
86 86
Area 2 (river San Pedro cut) is located in the vicinity of the boundary of the Natural Park. This area has suffered some degree of degradation due to the maintenance of old uses of the salt marsh. The physical environment is currently altered, having structures and bypass channels that modify tidal flow dynamics. It has incipient plant colonisation on some of its areas.
Area 3 (Las Aletas), corresponding to the Las Aletas site, is located outside the Natural Park boundary. This area currently suffers from a very high level of degradation and alteration of the tidal regime, resulting from old land profile modification works with the aim of establishing a change in land use for development of crops.
No forestry activities are carried out in any of the areas selected as subject to intervention
©GÍMENEZCUENCASL/UICN
©GÍMENEZCUENCASL/UICN

87 FEASIBILITY STUDY
IN ODIEL AND CADIZ SALT MARSHES
Odiel Salt Marshes
Within the Odiel Salt Marshes Natural Site are areas with a high level of conservation. The zones established as a Natural Reserve corresponding to the Isla de Enmedio and El Burro Salt Marsh. The Isla de Enmedio is located in the middle of the marsh system, it has a good drainage network, with predominantly lime soils where small topographic changes determine the duration of floods, salinity and, therefore, the composition of the vegetation. The El Burro Salt Marsh, located in the northern zone, is a mature marsh with a consolidated drainage network formed by wide channels separating islands and hypersaline basins. The high density of Spartina densiflora is noteworthy in this area.
Zones determined as Centres of Great Environmental Value are areas declared to be of high environmental value because of their uniqueness and high degree of conservation. They correspond to Isla de Saltés, La Cascajera, the Isla de La Liebre and the Lagoon in the El Manto area. The Isla de Saltés, located at the south of the Site, has been strongly influenced by the construction of the Port containment dyke, the Punta Umbría breakwater and the islands road, experiencing an increase in growth rate due to the alteration produced in sediment dynamics.
There is a wide variety of plant communities belonging to each of the ecosystems this island presents, with communities observable belonging to intertidal plains, salt marshes, dune zones, coastal lagoons and evolved sandy spits in which woodland species are found, as is the case of La Cascajera, where there is a coastal woodland formed by stone pine, Spanish juniper, kermes oak, mock privet, wild olive, etc.
The La Liebre Salt Marsh has been transformed by extensive saltern production, where containment barriers have been created that affect the drainage network and the natural hydroperiod, becoming a lagoon with outcropping of islets that still preserve the original vegetation.
Reserve Area 2: Untransformed salt marshes.
Those areas established as untransformed salt marshes correspond to salt marsh areas that have not undergone great alterations, still preserving their ecological and conservation value, with the sustainable uses that allow for renewal of resources being compatible.
The dune ecosystems maintain a good state of conservation, but they are subject to great pressure and are very fragile due to the urban developments along the coastline. The areas are considered to be compatible with uses that do not compromise the regeneration of resources. These coastal dune systems have seen increased deposition of sands following the construction of the breakwater that altered the sediment dynamics favouring this deposition. This accumulation provokes the proliferation of sandy shoals and intertidal plains that feed the dunes and support species adapted to the specific conditions that the substrate and tide create.
As regards the forest systems present in the Natural Site, there is a wooded area in the Gibraleón Salt Marsh located on land that lost tidal influence due to the construction of barriers for their forestry use, where eucalyptus species have been established. Belonging to the municipality of Gibraleón, to the west of the Natural Site, there is an extensive woodland with autochthonous forest species with which others of an invasive nature associate spontaneously, and areas for plantation of eucalyptus. There is a significant relict mass of juniper at Punta Umbria on the dune systems and running to the town centre. Declared as Natural Junipers Site of Punta Umbría by Law 27/1989, of 18 July, it is one of the few mixed woods of Spanish juniper and common juniper on the entire coast of Andalusia.

FEASIBILITYSTUDYFORPREPARATION OF CARBON OFFSETTING PROJECTS
88 88
As regards the systems of channels, creeks and estuaries, their conservation status is variable. Watercourses have been altered by dredging, filling and clogging of natural hydrological regimes for various reasons, such as agriculture, forest harvesting, saltern uses and construction, among others.
The Natural Site has also been transformed by the creation of infrastructures. The most visible case of infrastructure impact is that of the town of Corrales, located to the north east of the salt marsh. One of the main areas of transformed salt marsh is on the Isla de Bacuta. For its traditional use as salt ponds, a network of walls were created that enclose the water and facilitate drying. However, these have been colonised by numerous species that benefit from this condition, such as the case of wading birds that feed on invertebrates living in the beds.
As regards the particular conditions of the intervention areas:
Intervention area 1 (Isla de Bacuta) is an old salt marsh area that has been used as a fill area for port access dredges. These dumped materials were covered by a layer of soil in which forest species such as stone pine, prickly juniper, wild olive, etc. were planted. As explained above, the accumulation of heavy metals in beds and sediments has posed a significant problem in the Odiel Salt Marshes, which has been expanded due to their entrainment due to erosion drag and subsequent dumping in adjacent areas.
Figure 18. Intervention areas in Odiel Salt Marshes
El Burro Salt MarshSurface: 2,84 ha
Old industrial salt pondsSurface: 11,70 ha
Isla de BacutaSurface: 38,31 ha
©GOOGLEEARTH
©GÍMENEZCUENCASL/UICN

89 FEASIBILITY STUDY
IN ODIEL AND CADIZ SALT MARSHES
Intervention area 2 (El Burro Salt Marsh) is located in the El Burro Salt Marsh and is partially inside the boundary of the Natural Site. This zone is established as untransformed salt marsh Reserve Area 2. The current state of its hydrological regime has been altered by neighbouring agricultural activities, as part of the soil losses block the water circulation channels, contributing a large amount of sediment from the carry over of materials from the surrounding crop areas caused by surface runoff, in addition to contributing to pollution of the area by the presence of toxic products and fertilisers that accelerate eutrophication.
Intervention area 3 (old industrial salt ponds) corresponds to an area that was used historically for industrial salt production. Plant establishment actions have recently been carried out by means of provision of muds and various plant species in the surrounding areas. The area covered by the interventions is an area without plant cover.
No forestry activities are carried out in any of the areas selected as subject to intervention.
©GÍMENEZCUENCASL/UICN
©ERNESTOJIMÉNEZ/DREAMSTIME

FEASIBILITYSTUDYFORPREPARATION OF CARBON OFFSETTING PROJECTS
90 90
2.3. Vegetation
Salt marsh vegetation is strongly conditioned, among other factors, by flooding frequency, salinity and soil structure. This is why vegetation varies together with various environmental conditions in the different sections of the salt marsh, sometimes presenting specialisation that makes it exclusive to that ecosystem.
The low marsh areas of the Cadiz Bay Natural Park are characterised by communities of aquatic vegetation formed by chlorophyte (green), phaeophyte (brown) and rhodophyte (red) algae, in addition to seagrasses such as Cymodocea nodosa, Zostera noltii or Zostera marina and plants adapted to high salt concentrations (Spartina maritima). Chlorophytes such as Caulerpa prolifera and Ulva lactuca appear in the low marsh tidal muds, in addition to other rhodophytes and, to a lesser extent, phaeophytes such as Fucus spiralis.
In the lowest areas of these salt marshes Zostera noltii and Zostera marina meadows are characteristic, as are a large number of other plant species that use them as support (epiphytes), notably Enteromorpha linza, Ulva lactuca and Codium tomentosum.
The rises usually maintain areas with strips without rooted plants, but with microscopic algae acting as primary producers.
©ANDREWMORRISONFROMPIXABAY

91 FEASIBILITY STUDY
IN ODIEL AND CADIZ SALT MARSHES
Changes from middle to high marsh are not dramatic. They are characterised by being farther from the tidal flow and more developed plant communities start to be seen, such as Spartina densiflora, a grass capable of reducing tidal energy and erosion thanks to its rhizome structure. Los Toruños is the best example of these salt marshes, where terrestrial species such as Salicornia ramosissima appear, which help to bind the soil and its elevation, allowing other plants to settle.
In the upper part of the salt marshes, where the topographic level is higher and salt water is rarely present, species such as Sarcocornia perennis and Sarcocornia fruticosa appear. This is the most stable area of the whole salt marsh, characterising the Cadiz Bay Natural Park, with species such as Limoniastrum monopetalum, Arthromnemum macrostachyum, Isula chrithmoides, Suaeda splendens and Limonium ferulaceum.
In marsh areas that have undergone a great deal of transformation for salt extraction, the presence of Arthrocnemum macrostachyum, Salsola vermiculata, Inula crithmoides, Limoniastrum monopetalum and meadows of ruderal species can be highlighted.
Just as the vegetation of the different parts of the salt marsh depends on their tidal regime, the fringes of the channels experience a similar effect on a small scale depending on the topographical gradient.
In the Odiel Natural Site, the mud frequently flooded by the tides, belonging to the low marshes, are usually colonised by seagrasses such as the Zostera noltii and Cymodocea nodosa. Other communities of Salicornia ramosissima and Spartina maritima are of great importance because of their role in stabilising these unstable bottoms.
The lower flooding frequency of the middle marshes leads to other species such as Halimione portulacoides or Sarcocornia perennis, a creeping species that covers the substrates.
The high stretches, with more stable elevated soils, are rarely affected by tides, even so, plant communities have to adapt to saline soils. Shrub species such as Arthromnemum macrostachyum are common, accompanied, among others, by Suaeda vera and Atriplex halimus, in addition to Tamarix canariensis which can reach tree size.
Despite the low frequency of arrival of the sea, hypersaline basins can be found where the scrub described above does not survive, only those highly tolerant species such as Triglochin barrelieri and Cotula coronopifolia.

FEASIBILITYSTUDYFORPREPARATION OF CARBON OFFSETTING PROJECTS
92 92
2.4. Estimation of the rate of sea level rise from historical series detected by tide gauges
As the IPCC reports indicate, human influence on climate has been the dominant cause of global warming since the mid-20th century. This global and regional temperature increase has led to profound changes in natural systems, including phenomena such as increased droughts, floods, some other phenomena associated with extreme climate and sea level rise.
This has serious repercussions globally and regionally on certain territories where their dynamics can be dramatically altered. Ecosystems linked to coastal areas, directly influenced by tidal dynamics, are areas that are directly affected by sea level variations.
Figure 19. Projected Sea Level Rise (SLR) to 2300.The inset shows an assessment of the likely range of the projections for RCP2.6 and RCP8.5 up to 2100 (medium confidence). Projections for longer timescales are highly uncertain, but a range is provided (4.2.3.6; low confidence). Oppenheimer et al. in press. IPCC-SROCC report, 2019.
Observations made since the end of the 20th century using specific sensors on Earth observation satellites have made it possible to take very precise measurements of the altimetric ranges of global ocean surfaces. The results of these observations have shown great variability in rates of increase around the planet. For example, increases of about 30 times the global average, of around 3 mm per year for the 1993 to 2012 period, have been detected in the western Pacific Ocean. On the contrary, rates below the mean global rate of increase have been detected in other parts of the planet.
year
Globalmeansealevel(m)

93 FEASIBILITY STUDY
IN ODIEL AND CADIZ SALT MARSHES
tudies on sea level evolution have been performed in Spain based on reconstructions of observations consisting of data over the last 60 years. The results of these studies show a general rising trend, with values ranging spatially between 1.5 mm/year for the Mediterranean Sea, 2 mm/year in the Cantabrian Sea and 2.5 mm/year around the Canary Islands. However, observed sea level trends at a local level may be affected by different factors with variations over different time scales, such as the movements of the Earth’s crust, glacial isostatic adjustment, local offshore winds or variation in sea water density, among others. For this reason, interpretation of local trends needs to take such effects into account.
In order to determine the annual rate of sea level increase observed in the intervention areas, an analysis of the data observed by the tide gauges used in the study has been carried out. In this regard, Spanish State Ports provides a report “Resumen de parámetros relacionados con el nivel del mar y la marea que afectan a las condiciones de diseño y explotación portuaria” [Summary of parameters related to sea level and tide affecting of port design and operating conditions]. This report analyses the trends in data observed by the tide gauges over different time periods. In the case of the Huelva 5 tide gauge, the series analysed in the report corresponds to the 1997-2013 period, estimating an annual trend of increasing sea level of 0.333 ± 0.099 cm. In the case of the tide gauge used for analysis of the dynamics of Cadiz Bay, corresponding to Bonanza 2, the annual trend observed is estimated at 0.497 ± 0.073 cm over the 1992-2013 analysis period.
However, as the the reports were issued in 2014, these estimates have not taken the data observed by the tide gauges in subsequent years into account in the analysis. Therefore, analysis of the entire historical series available from the two tide gauges has been carried out with the aim of estimating the observed sea level trend.
Annex 5 contains a description of the data and methodology employed to estimate the annual rate of sea-level rise in the two areas. The results obtained are shown below
STUDY AREA TIDE GAUGE ANALYSIS PERIOD
ANNUAL INCREASE RATE (cm) UNCERTAINTY
Cadiz Bay Bonanza 2 1992-2016 0.384 0.119
Odiel Salt Marshes Huelva 5 1996-2016 0.222 0.153
Table 17. Estimate of the annual rate of sea level increase for each zone
The uncertainty of the slope obtained is considered too high in both cases, so the results of the analysis are not considered valid. Therefore, the reference values for each of the areas are those provided by the “Summary of parameters related to sea level and tide affecting of port design and operating conditions” report mentioned above.

FEASIBILITYSTUDYFORPREPARATION OF CARBON OFFSETTING PROJECTS
94 94
2.5. Analysis of sediments
In the study carried out under the Life Blue Natura project, various points of the salt marshes were sampled in their low (influenced by the regular tides), middle (flooded by spring and storm tides) and high (outside of tidal flooding) portions to determine which areas are most productive in retaining carbon.
The quantity of organic matter and soil textures were analysed at different depths, among other parameters, giving a possible positive correlation between the content of limes and clays and the amount of organic matter present in the sediment. The results indicate that the sedimentary profile varies depending on the portion of the salt marsh and the sample depth.
In Odiel, the highest percentages of organic matter were found in the middle marsh (9.1% OM), in the El Manto area. Following this record is the low marsh, where the areas with vegetation (6.8% OM) and without vegetation (5.6% OM) have similar values. It is also worth noting the portion of marshes reconnected with the tidal dynamics, as their percentage (6.8% OM) is very similar to that of the lower portions.
On the other hand, the lowest organic matter values were detected in the revegetated zone of the low marsh (0.8% OM) and in the northern section, specifically in the zones without vegetation corresponding to salt pond areas developed in the 1940s (1.0% OM).
In Cadiz Bay, sampling was performed at Los Toruños, where the highest values were again recorded in the middle marsh (8.6% OM). On the other hand, in the low (5.7% OM) and high marsh the values are very similar to each other, without being far from those of the middle marsh.
The percentages of organic matter were used to establish a relationship between this and the amount of organic carbon once the latter had been measured directly in a series of samples per sediment core, with which the tonnes of CO2 per hectare each marsh is capable of sequestering were estimated.
In Odiel, the data for the greatest amount of organic matter are found in the middle marsh portions; the CO2 stock shows the highest results in the area of the rewetted degraded marsh (609.5 tCO2ha-1) which had been dry and lacking vegetation from at least 1956 (the first date recorded by aerial photography) to 2004. In 2004, one of the walls that prevented water connectivity in the area was accidentally demolished, and since that date the area has been recolonised by vegetation represented by species belonging to the middle marsh. This datum is higher than that obtained for the unaltered middle marsh colonised by Sarcocornia spp. (424.4 tCO2ha-1) located at El Manto. This higher value may be due in part to the compaction of the profile suffered due to its drying out, although it would not explain the difference in full that could be due to the area’s stock before it dried. This value for the middle marsh is higher than that obtained for the high (492.8 tCO2ha-1) and low (450,8 tCO2ha-1) marsh, although similar to that obtained in the unaltered middle marsh located at El Manto (424.4 tCO2ha-1)
The results obtained in Cadiz Bay indicate that the highest carbon stocks occur in the middle marsh (573.2 tCO2ha-1), with values twice as high as those recorded in the high (286.8 tCO2ha-1) and low (232.3 tCO2ha-1) marsh.
After estimating the amount of carbon in each area, the tonnes of CO2 per hectare per year exchanged from atmosphere to sediment in the salt marsh, and vice versa, were studied. The CO2 flux rates analysed in Odiel reveal that the middle marsh is where the greatest sequestration of CO2 occurs, if the area mentioned above where rewetting took place from 2004 is taken into account.

95 FEASIBILITY STUDY
IN ODIEL AND CADIZ SALT MARSHES
Observing the CO2 sequestration rate data in these salt marshes, it is concluded that the middle portion, the “intermediate salt marsh”, is the most productive in terms of absorption. with values that are again significantly higher than the high and low portions.
The carbon stocks and fluxes are within the range described in other salt marshes, with different carbon flux rates from atmosphere to soil, where the middle marsh is highlighted as the most productive portion.
TYPOLOGY SAMPLED VEGETATION SALT MARSH
TYPEPREDOMINANT
SPECIES
Aboveground biomass TOC
Stock 1 m (tCO2ha-1)
TOC Stock 1 m (tCO2ha-1)
TOC Stock 1 m flux
(tCO2ha-1)
Odiel. Highly conti-nentalised salt marsh
without vegetation, degraded (sterile)
Sterile High — 0 216.8 0.59
Odiel. Middle marsh, vegetated and rewetted Fairly vegetated Intermediate Sarcocornia
spp. 4.2 609.5 1.04
Cádiz. Wet abandoned
salt pond
— All — 0 142.8 0
— Creek — 0 60.4 0
— Crystalliser — 0 225.18 0
Dry abandoned salt pond
— All — 0 148.8 —
— Channel — 0 182.1 —
Plantation in Odiel
Revegetated low marsh (living
shoreline)Marine Sarcocornia
spp. 21.2 56.1 6.64
Revegetated low marsh
Marine-intermediate
Spartina maritima — 242.5 3.61
Table 18. CO2 flux data obtained at the various sampling points in Odiel and Cadiz in salt marshes transformed by different soil uses.Source:DELIVERABLEC2.2,september2019
TYPOLOGY SAMPLED VEGETATION SALT MARSH
TYPEPREDOMINANT
SPECIES
Aboveground biomass TOC
Stock 1 m (tCO2ha-1)
TOC Stock 1 m (tCO2ha-1)
TOC Stock
1 m flux (tCO2ha-1)
Odielunaltered
Continentalised high Continentalised Various + Spartina
densiflora 37.2 492.8 0.89
Continentalised high Continentalised A. macrostachyum 21.5 209.1 0.72
Well vegetated Intermediate Various, equality 19.0 264.4 0.66
Well vegetated Intermediate Spartina densiflora 44.8 243.9 —
Fairly vegetated Intermediate Sarcocornia sp. — 177.5 —
Fairly vegetated Marine Sarcocornia sp. 13.1 424.4 4.58
Little or no vegetated Marine — 0 450.8 1.10
Little vegetated Marine Spartina maritima 24.7 217.6 0.38
Subtidal channel Middle — 0 256.6 —
Cadiz Bay unaltered
Well vegetated Marine Various, equality 9.9 286.8 —
Fairly vegetated Marine Sarcocornia spp. 18.8 573.2 1.98
Little or no vegetated Marine — 0 297..5 —
Little vegetated Marine Spartina maritima 6.0 232.3 0.49
Table 19. CO2 flux data obtained at the various Odiel y Cadiz sampling points in untransformed salt marshes. Source:DELIVERABLEC2.2,september2019

FEASIBILITYSTUDYFORPREPARATION OF CARBON OFFSETTING PROJECTS
96 96
2.6. Current determination of the different classes of salt marshes in the intervention areas
The current distribution of the three types of salt marsh, characterised by the plant formations that make them up, were determined through the results of the “Caracterización de la marisma mareal de la CADIZ BAY” [Characterisation of the Cadiz Bay tidal marsh] and “Cartografía temática de marismas del Odiel” [Thematic mapping of the Odiel Salt Marshes] studies that form part of the LIFE14CCM/ES/000957 “Blue Natura Andalusia” project.
This mapping is available in digital format and includes classification for the different typologies of high, middle or low marsh.
2.7. Determination of the potential distribution of the different classes of salt marshes in the intervention areas
As seen previously, tidal marshes can be classified into three classes depending on the type of plant formations that make them up. These are, in general, low marsh, middle marsh and high marsh. Plant species adapted to the specific ecological conditions that differentiate each type of salt marsh are represented in them, where the importance of those belonging to middle marshes has been highlighted due to their high capacity to sequester CO2. The spatial distribution of these classes is related to various factors, with the dynamics of the tidal flow under which they develop being noteworthy.
Figure 20: Classification schemes of five vegetation zones in salt marshes along the vertical gradient in seawater exposure (inundation frequency). IUCN. Diagram symbols courtesy of the Integration and Application Network, University of Maryland Center for Environmental Science.
LOW MARSH
Regular inundation
MIDDLE MARSH
Periodic inundation
HIGH MARSH
Infrequently inundated with salt concentrated
UPLAND MARITIME TRANSITION BANK
No inundation
Mean low water
Mean high water

97 FEASIBILITY STUDY
IN ODIEL AND CADIZ SALT MARSHES
©JUANPEDROCUADARDOTORRES/DREAMSTIME
SALT MARSH TYPE
MINIMUM ALTITUDE VALUE (m)
MAXIMUM ALTITUDE VALUE
(m)
Cadiz Bay
Low marsh -0.659 1.331
Middle marsh 1.331 1.811
High marsh 1.811 No marine influence
Odiel Marshes
Low marsh -0.65 1.56
Middle marsh 1.56 2.05
High marsh 2.05 No marine influence
Table 20. Determination of altimetry levels for each type of marsh.Assumed incoherence detection to the altitude models of the terrain available for each of the action areas in Annex 6.
In order to determine the location and nature of the actions to be proposed in the intervention areas and with the aim of improving the conservation conditions and the development of the salt marsh species and their optimisation for fixing CO2, a series of simulations have been conducted based on the available information to estimate the potential distribution of each type of salt marsh in each of the target areas.
To determine the potential development of the different types of salt marsh, a flood analysis of the different intervention areas will be carried out based on their altitude regime, determined by the available digital models of the terrain. The altitude values used to determine the potential distribution have been taken from those proposed in the “Characterisation of the Cadiz Bay tidal marsh” and “Thematic mapping of the Odiel Salt Marshes” studies that form part of the LIFE14CCM/ES/000957 “Blue Natura Andalusia” project.

FEASIBILITYSTUDYFORPREPARATION OF CARBON OFFSETTING PROJECTS
98 98
3. PROJECT SCENARIO
The main objective of the proposed restoration actions is the restoration of the salt marsh vegetation in each of the areas, as far as possible maximising the conditions that allow carbon fixing by means of the vegetation. To meet this objective, action will mainly be taken on those factors that alter the conditions related to improving the hydrological and hydrodynamic connection of the intervention areas.
The interventions to be performed for restoration of the areas are as follows:
a) Recovery and/or opening of new primary and secondary tidal channels by mechanical excavation with backhoe with collection alongside the machine.
b) Recovery and/or opening of new tertiary tidal channels by manual ditch excavation, including cutting, shovelling and collection at the work site.
c) Transport of surplus materials from dredging of work channels with tipper truck to collection areas.
d) Manual restitution of altered intervention area, due to earth movement and the passing of heavy vehicles, with materials from excavation, including cleaning and collection of existing wastes.
e) Breakage of the outer levee in old salt ponds, corresponding opening of a drainage channel, with a 1:1 slope, both at the outer and inner wall, and a maximum depth of 40 cm. Earth movement is exclusively by manual intervention.
f) Execution of roadway protector pipe made with double dovetailed concrete tube of 0.80 mm internal diameter positioned as per typified work.
g) Elimination of existing unique elements, such as an old irrigation channel in the Las Aletas salt marsh (Cadiz Bay).
©RMAKASANAPHOTO/DREAMSTIME

99 FEASIBILITY STUDY
IN ODIEL AND CADIZ SALT MARSHES
The design of the interventions and the construction procedure for each of the actions was carried out with inspections in the areas and technical assessments that also took into account the transportation of equipment and machinery to the intervention site, setting out of new channels and preparation work, cleaning of existing primary channels and final finishing and general cleaning of the area.
It should be noted that all the materials from execution of the new secondary and tertiary channels will remain at the intervention site, being deposited/scattered on both sides of these by means of the “rotors” method. In the case of the primary channels and the breakage of the outer levee, the earth movement for which is carried out by means of mini-backhoe, the extracted materials would be deposited alongside the work and then reused in the restitution of the areas affected by the passage of the heavy machinery. Furthermore, this material may be used to generate small mounds as “islands” within the salt marsh itself or in flood zones, to promote the diversification of ecological niches that can be occupied by the bird populations typical of the location (dunlin, redshank, black-winged stilt, etc.).
On the other hand, only those materials from demolition of existing, currently unused infrastructures, such as the old irrigation canals of the Las Aletas salt marsh, are to be destined for authorised disposal, being managed depending on their characterisation.
The economic evaluation of the interventions in each action area was carried out with this analysis of intervention measures (see Annex 7 for details).

FEASIBILITYSTUDYFORPREPARATION OF CARBON OFFSETTING PROJECTS
100 100
CADIZ BAY. Intervention in North bank of the river Guadalete.

101 FEASIBILITY STUDY
IN ODIEL AND CADIZ SALT MARSHES
CADIZ BAY. Intervention in river San Pedro cut

FEASIBILITYSTUDYFORPREPARATION OF CARBON OFFSETTING PROJECTS
102 102
CADIZ BAY. Intervention in Las Aletas.

103 FEASIBILITY STUDY
IN ODIEL AND CADIZ SALT MARSHES
ODIEL SALT MARSHES. Intervention in Isla de Bacuta.

FEASIBILITYSTUDYFORPREPARATION OF CARBON OFFSETTING PROJECTS
104 104
ODIEL SALT MARSHES. Intervention in El Burro Marshes.

105 FEASIBILITY STUDY
IN ODIEL AND CADIZ SALT MARSHES
ODIEL SALT MARSHES. Intervention in Old industrial salt ponds.

FEASIBILITYSTUDYFORPREPARATION OF CARBON OFFSETTING PROJECTS
106 106
Table 21. Budget for the actions planned for development of drawings, measurements and supplementary budgets in the feasibility study for the preparation of carbon offsetting projects in the wetlands of Andalusia. Budget in Euros, 2020.
BUDGET SUMMARY
River San Pedro cut 48,493.36
Las Aletas 14,6658.9
River Guadalete 14,0877.4
Isla de Bacuta 50,031.39
Old industrial salt ponds 11,869.79
El Burro Salt Marshes 4,002.09
MATERIAL EXECUTION BUDGET (P.E.M.) 401,932.93
General Expenses (14 %) 56,270.6102
Industrial Profit (6 %) 24,115.9758
ESTIMATED VALUE (V.E.) 482,319.516
VAT (21 %) 10,1287.1
BASE BIDDING BUDGET (P.B.L.) 583,606.616
©IGNASIRUIZ/DREAMSTIME
©IGNASIRUIZ/DREAMSTIME

107 FEASIBILITY STUDY
IN ODIEL AND CADIZ SALT MARSHES
4. QUANTIFICATION OF EMISSIONS REDUCTION
4.1. Estimation of emissions in the baseline scenario
According to the VCS Requirements Guide for AFOLU projects, ex-ante baseline projections are not required beyond a 10-year period. In this case, the selected baseline scenario is the Statu Quo. Figures 11-16, presented in Chapter 1.3, analyse the progression of the NDVI vegetation index in the various intervention areas. The stable trend (estimated increasing trends are less than or equal to 1%) over the past 17 years mean that it is possible to assume that the current conditions in the salt marshes will remain constant over time.
Therefore, this chapter will quantify GHG emissions/removals with data from 2016, assuming that there will be no significant changes in carbon stocks in the future.
Following the overall approach of VM0033 methodology, baseline emissions, net change in carbon stocks in biomass and changes in carbon stocks in herbaceous vegetation are calculated as explained in section 4.2.
Chapter 5 of the AR-14 methodological tool “Estimation of carbon stocks and change in carbon stocks oftrees and shrubs in A/R CDM project activities”, establishes the following conditions under which carbon stock and change in carbon stock may be estimated as zero:
a) The pre-project trees are neither harvested nor removed throughout the crediting period of the project activity
There is no tree vegetation in the Cadiz Bay and Odiel Salt Marshes project area and no harvesting activities are anticipated during the crediting period, because agricultural uses and commercial forestry activities are of limited importance within the project boundaries..
b) The pre-project trees do not suffer mortality because of competition from trees planted in the project, or damage because of implementation of the project activity, at any time during the crediting period of the project activity;
Activities to revegetate with shrub species will not cause negative impacts on existing vegetation.
c) The pre-project trees are not inventoried along with the project trees in monitoring of carbon stocks, but their continued existence is monitored throughout the crediting period of the project activity.
There are inventories of the type of vegetation present in the project areas, both in Cadiz Bay and in the Odiel Salt Marshes (Life Blue Natura Deliverable A1).
Additionally, changes in carbon stocks in trees and shrubs may be accounted as zero for those lands for which one or more of the following indicators apply:
a) Observed reduction in topsoil depth (e.g. as shown by root exposure, presence of pedestals, exposed sub-soil horizons).
b) Presence of gully, sheet or rill erosion; or landslides, or other forms of mass-movement erosion.

FEASIBILITYSTUDYFORPREPARATION OF CARBON OFFSETTING PROJECTS
108 108
c) Presence of plant species locally known to be indicators of infertile land. d) Land comprises of bare sand dunes or other bare lands. e) Land contains contaminated soils, mine spoils or highly alkaline or saline soils.f) Land is subjected to periodic cycles (e.g. slash-and-burn or clearing-regrowing cycles) so that
the biomass oscillates between a minimum and a maximum value in the baseline.
The degradation indicators identified in the project areas through field visits, documentation from the Regional Government of Andalusia and satellite images correspond to points b, d and e. There have been artificial earth movements in the past, there are bare lands where tidal flow has been interrupted, and industrial discharges in areas around the project constitute a source of pollution that also affects the soil.
Therefore, in compliance with the above conditions, changes in carbon stocks in biomass are expected to be zero in the absence of project activities. More detailed information on the causes and conditions of degradation of the wetlands, in both Cadiz Bay and the Odiel Salt Marshes, is presented in Chapter 1.
For changes in carbon stocks in herbaceous vegetation:
Taking the stability of the NDVI over the past 17 years into account, this variable is considered to be zero for the baseline, and it will only be taken into account in calculation of the future scenarios in which an increase in carbon stocks in biomass is expected.
Net GHG emissions in soil (GHGBSL–soil)
Net GHG emissions in the soil in the baseline scenario are calculated following the equation below.
CO2 emissions from soil can be estimated using carbon stocks as a proxy variable, with default values suggested in the methodology or with data collected in the field. In this case, expressiontion GHGBSL–Soil–CO2,i,t –Deductionalloch of the equation is obtained from the data collected in the field and presented in Table 22 as “CO2 fluxes”. The negative value indicates a net flux from the atmosphere to the biosphere, i.e. sequestration of CO2.
Where:
Ai,t = Stratum area i in year t; ha
GHGBSL-Soil-CO2,i,t = CO2 emissions from the soil organic carbon in the reference scenario in stratum i in
year t; tCO2e ha-1 yr-1
Deductionalloch = Deduction from CO2 emissions from the soil organic carbon pool to account for the percentage
of the carbon stock that is derived from allochthonous soil organic carbon; tCO2e ha-1 yr-1
GHGBSL-soil-CH4,i,t = CH4 emissions from the soil organic carbon pool in the reference scenario in stratum i
in year t; tCO2e ha-1 yr-1
GHGBSL-Soil-N2O,i,t = N2O emissions from the soil organic carbon pool in the reference scenario in stratum i
in year t; tCO2e ha-1 yr-1
GHGBSL-Soil,i,t = Ai,t × GHGBSL-Soil-CO2,i,t – Deductionalloch + GHGBSL-soil-CH4,i,t + GHGBSL-Soil-N2O,i,t

109 FEASIBILITY STUDY
IN ODIEL AND CADIZ SALT MARSHES
TYPE OF BOTTOM CODEABOVEGROUND
BIOMASS TOC STOCK (tCO2ha-1)
TOC STOCK 1m (tCO2ha-1)
TOC FLUX AFTER
(tCO2ha-1)
Cadiz Bay
Cadiz salt pond SL 0 142.8 0
Cadiz wet abandoned SL-CW 0 199.2 - 0.92
Cadiz dry abandoned SL-CWP1 0 148.8 0
Odiel Salt Marshes
Odiel dry ODND-C 0 216.8 + 3.2
Odiel rewetted ODB.Z 4.2 609.5 - 1.04
Odiel planted ODL.R 21.2 56.1 - 6.64
Odiel planted OD.R 0 242.5 - 3.61
Table 22. CO2 fluxes by stratum in Cadiz Bay and Odiel Salt Marshes, year 2016
In those areas disconnected from tidal flow, an emission factor corresponding to the average of the following three reference values has been taken:
1. Emission factor proposed for salt marsh and mangrove ecosystems in Table 4.13 of the 2013 Supplement to the 2006 IPCC Guidelines for National Greenhouse Gas Inventories: Wetlands. The value of the factor is 7.9 tC/ha year (28.99 tCO2/ha year).
2. An emission factor of 6.2 tCO2/ha year obtained from the comparison of the organic C contents of sediment cores corresponding to "High continentalized marsh with plant communities of Arthrocnemum macrostachyum y Spartina densiflora" (ODN.D-V) and "Highly continentalized marsh without vegetation, degraded" (ODN.D-C), assuming that the degradation recorded for the latter area dates from 1956 (confirmed by means of aerial photography flight of 1956).
3. An emission factor of 3.2 CO2/ha obtained from a comparison between the values obtained for sediment cores for "Highly continentalized marsh without vegetation, degraded" (ODN.D-C) and "Highly continentalized marsh revegetated between 1985 and 1995" (ODN.D-MID). between 1985 and 1995.
This factor, that takes a value of 12.80 tCO2/ha year, has been applied to all the areas included in intervention areas that are disconnected from the tidal flow to a large extent. These areas have been assimilated to those areas devoid of vegetation and have been determined by mapping for each of the zones by means of the available orthophotographs.
In the Odiel Salt Marshes, in those where a significant degree of plant cover is detected, the values corresponding to ODB.Z (Odiel: "Intermediate marsh, vegetated and re-moistened"), have been taken, except in Area 2 (El Burro Salt Marshes) for which the value corresponding to "High continentalized and vegetated marsh" (ODND-V) has been taken as a reference In Cadiz Bay, for these same areas where significant plant cover is detected, the values for SL-CW (Cádiz abandoned wet Salina) were taken.

FEASIBILITYSTUDYFORPREPARATION OF CARBON OFFSETTING PROJECTS
110 110
CH4 emissions in soil
In the case of the Cadiz Bay intervention areas, the values estimated for the different areas established in Burgos et al, 2017 were taken. These established reference values correspond to average values of 240 μmol/m2d in the Guadalete area and 371.3 μmol/m2d in the rest of the areas.
In the case of the Odiel Salt Marshes, the emissions were disregarded in the scope of areas 1 (Isla de Bacuta) and 3 (Old industrial salt ponds). In area 2 (El Burro Salt Marshes), in the absence of a better estimate, an estimated value calculated as the average of the values for temperate climate established for drained grassland in Table 2.3 of the 2013 Supplement to the 2006 IPCC Guidelines for National Greenhouse Gas Inventories: Wetlands was taken as the reference. The value of the factor is 0.019 tCH4 ha-1 year-1.
©M.OTERO/UICN
Core sampling in the wetland

111 FEASIBILITY STUDY
IN ODIEL AND CADIZ SALT MARSHES
YEARS
Odiel Salt Marshes 0 10 20 30 40 50
AREA 1 Isla de Bacuta
Baseline scenario emissions (cumulative tCO2e) — 3,248.42 6,496.83 9,745.25 12,993.66 15,592.40
Baseline scenario emissions (cumulative tCO2e/ha) — 84.79 169.59 254.38 339.17 407.01
AREA 2 El Burro
Salt Marsh
Baseline scenario emissions (cumulative tCO2e) — 172.07 292.52
Baseline scenario emissions (cumulative tCO2e/ha) — 60.59 103.00
AREA 3 Old
industrial salt ponds
Baseline scenario emissions (cumulative tCO2e) — 1,215.26 2.065.95
Baseline scenario emissions (cumulative tCO2e/ha) — 103.87 176.58
YEARS
Cadiz Bay 0 10 20
AREA 1 North bank
of the Guadalete
Baseline scenario emissions (cumulative tCO2e) — 6.435.06 9.652.60
Baseline scenario emissions (cumulative tCO2e/ha) — 41.52 62.28
AREA 2 River San Pedro cut
Baseline scenario emissions(cumulative tCO2e) — 1.568.85 2.353.27
Baseline scenario emissions(cumulative tCO2e/ha) — 60.60 90.89
AREA 3 Las Aletas
Baseline scenario emissions (cumulative tCO2e) — 25.225.27 37.837.91
Baseline scenario emissions (cumulative tCO2e/ha) — 120.20 180.30
Table 23. Baseline emissions
N2O emissions in soil
The reference values established in previously published studies have been used for calculation of N2O emission rates.
In the case of Cadiz Bay, the values established for each of the scopes in Burgos et al, 2017 were used. These values correspond to an average value of 69 μmol/m2d in the zone of influence of the Guadalete, applied to area 1 (north bank of the Guadalete) and 4.53 μmol/m2d in the rest of the areas with influence of the river San Pedro.
In the case of the Odiel Salt Marshes, the emission values for this gas are disregarded except for area 2 (El Burro Salt Marshes), where there is a record of input of pollutants originating in agricultural activity that contributes sediments to the intervention area. In this case, in the absence of a better estimate, an estimated value calculated as the average of the values for temperate climate established for drained grassland in Table 2.5 of the 2013 Supplement to the 2006 IPCC Guidelines for National Greenhouse Gas Inventories: Wetlands was taken as the reference. The value of the factor is 4.7E-3 t N2O-N ha-1 year-1.
The calculation of emissions in the baseline scenario resulted in the following estimated emissions over time for the baseline scenario by area:

FEASIBILITYSTUDYFORPREPARATION OF CARBON OFFSETTING PROJECTS
112 112
4.2. Estimation of emissions after hydrological reconnection
Following the overall approach of the VM0033 methodology, emissions in the scenario after the interventions are attributed to changes in carbon stocks in biomass, soil, or a combination of the two. Thus, baseline emissions or removals are estimated as follows:
Estimation of emissions resulting from fossil fuel use (GHGWPS-fuel)
Emissions from combustion of fossil fuels, produced by use of the machinery planned for the execution of the restoration work, will be calculated by applying the tool anticipated in VM0033 Methodology for Tidal Wetland and Seagrass Restoration and as set out in Annex 14 of the A/R Methodological Tool: “Estimation of GHG emissions related to fossil fuel combustion in A/R CDM project activities”.
In this case, as there is no possibility of directly measuring emissions during the project implementation phase, the third indirect method envisaged in the tool will be used:
Therefore, the methodology described in the previous section has been used for determination of emissions in the future scenario. In this case, a change in carbon sequestration rates is expected, which is the result of a change in the hydrological connection conditions in the intervention areas.
The interventions planned to restore the tidal regime of the intervention areas and to achieve rewetting of the intervention areas have been designed to result in their full restoration. It is therefore based on the premise that all the parts within the intervention areas, which are currently in a more or less marked situation of hydrological disconnection, will be restored in their entirety. They will thus count as restored areas for calculation of CO2 and other greenhouse gas emissions in the corresponding calculations.
Where:
GHGWPS = Net CO2e emissions in the project scenario up to year t; tCO2e
GHGWPS-biomass = Net CO2e emissions from biomass carbon pools in the project scenario up to year t;
tCO2e
GHGWPS-soil = Net CO2e emissions from the soil organic carbon pool in the project scenario up to year t;
tCO2e
GHGWPS-burn = Net CO2e emissions from prescribed burning in the project scenario up to year t; tCO2e
GHGWPS-fuel = Net CO2e emissions from fossil fuel use in the project scenario up to year t; tCO2e
GHGWPS = GHGWPS-biomass + GHGWPS-soil + GHGWPS-burn + GHGWPS-fuel

113 FEASIBILITY STUDY
IN ODIEL AND CADIZ SALT MARSHES
The project described in section 3, which establishes the restoration operations, mentions the types of machinery to be used in the restoration work (trucks for transporting machinery, micro-excavators and tractors equipped with various implements). However, the project does not specify the performance asso-ciated with the works for each of the types of machinery to be used. For this reason, in the absence of better information, an estimate of the excavation volume of 50 m3/ha will be used. In order to estimate the performance of the machinery during trench cutting operations, those established in the current Tragsa Group rates will be taken. The calculation is therefore to be carried out using the performance data laid down in the Tragsa Group rates for opening channels using a micro-excavator (I03020 Excavación mecánica zanja en Areas de difícil maniobrabilidad con microexcavadora, terreno franco-ligero [Mechanical trench excavation in zones with difficult manoeuvrability by micro-excavator, light-loamy soil]).
As the consumption information for the machinery used (micro-excavators) is calculated in consump-tion per hour and not by distance (estimated consumption of 4 l/h), the calculation formula is to be modified in order to be able to carry out the calculation with the available data, being the following:
Where:
ETCFC = CO2 emissions from fossil fuel combustion in the equipment used during the year (tCO2 /year).MT = Total mass transported by the vehicle during one year (tonnes).TD = Total travel distance (including the return trip) for the vehicle during one year (km).SECkt = Specific energy consumption of vehicle during one year (quantity of fuel/tonne*km).EFCO2 = CO2 emission factor of the fuel type (tCO2 /GJ).NCV = Net calorific value of the fuel (GJ/mass or volume unit).
ETCFC = MT * TD * SECkt * EFCO2 * NCV
Furthermore, in addition to the emissions produced directly by the machinery used in executing the restoration work, the emissions resulting from transporting the machinery by truck to the intervention areas must be taken into account. An emission value of 717 gCO2/km and average travel of 50 km is estimated for each of the intervention areas in this case. This totals a value of 0.036 tCO2/area.
The following table summarises the emissions from fossil fuel consumption by area:
ETCFC = 50 m3/ha * 0,12 h/m3 * 4 l/h * 2,79 kgCO2 = 66,96 kgCO2/ha = 0,067 tCO2/ha
These emissions will occur at isolated times during the life of the projects, in year 0, due to restoration activities.
EMISSIONS RESULTING FROM FOSSIL FUEL USE (tCO2)
CADIZ BAY
AREA 1 North bank of the river Guadalete 10.42
AREA 2 River San Pedro cut 1.77
AREA 3 Las Aletas 14.09
ODIEL SALT MARSHES
AREA 1 Isla de Bacuta 2.60
AREA 2 El Burro Salt Marshes 0.23
AREA 3 Old industrial salt marshes 0.82
Table 24. Emissions resulting from fossil fuel use

FEASIBILITYSTUDYFORPREPARATION OF CARBON OFFSETTING PROJECTS
114 114
Net change in carbon stocks in biomass (GHGWPS-biomass)
GHG emissions and removals in biomass stocks are based on the change in carbon stocks. To estimate the expected changes in biomass stocks, in the absence of more reliable and accurate data, the estimated data for the "intermediate, vegetated and re-wetted marsh" (ODB.Z) station at Llanos de Bacuta will be taken as a reference. This is an example case of a known, well-dated revegetated area after rewetting.
Station ODB.Z was in a degraded condition, with interrupted tidal flow and no vegetation from at least 1956 until 2004. The accidental breakage of a barrier in 2004 allowed hydrological connection of the area again. The new situation of hydrological reconnection allowed vegetation to be established gradually over this area.
Therefore, data are available from the estimate of aboveground biomass currently maintained by this area and there is a record (through the orthophoto of 1998) that the area was devoid of vegetation prior to 2004. This enables us to estimate a linear growth rate for aboveground biomass accumulation of 0.42 tCO2e/ha year. If we take into account that the estimate of aboveground biomass at the ODE.M station amounts to 13.1 tCO2e/ha year, and that due to its characteristics it could constitute a reference for evolution of the "Intermediate, vegetated and re-wetted marsh" (ODB.Z) station, it is estimated that the ODB.Z station, with the observed biomass accumulation rate, will take approximately 30 years to reach the biomass accumulation observed in a relatively unaltered area, and with characteristics similar to the previous.
Thus, in the absence of more reliable, accurate information regarding the accumulation of aboveground biomass in areas disconnected from tidal flow and devoid of vegetation, the following rates will be used in the time line:
TIME SCALE (years) AVERAGE ACCUMULATION RATE (tCO2e /ha year)
0 – 30 0.42
—>30 0
Table 25. Rate of accumulation of aboveground biomass
Net GHG emissions in soil (GHGWPS-soil)
Net GHG emissions in soil were calculated using the methodology explained in section 4.1.

115 FEASIBILITY STUDY
IN ODIEL AND CADIZ SALT MARSHES
CO2 emissions in soil (GHGWPS-SOIL-CO2, i, t) and deduction
Once the proposed corrective actions have been carried out with the fundamental aim of re-establishing the rewetting conditions of the intervention areas, a drastic change in soil CO2 flux is anticipated.
Based on data collected by other studies on degraded salt marshes in which restoration actions of a similar nature were taken, the soil is expected to gradually change from behaving as a net CO2 emitter and to start to fix CO2. The estimated progression of this rate of CO2 fixation in soil was determined by Burden et al, 2019:
Although the estimated rate for the "Intermediate, vegetated and re-wetted marsh" (ODB.Z) station, (1.04 ± 0.19 SD tCO2e /ha year) is lower, it is expected to increase gradually to reach similar values in the intervention areas.
In the absence of more precise, complete information, the data estimated by Burden et al, 2019 will be used for all the intervention areas on those surfaces determined to be disconnected from the tidal flow and that, with the proposed restoration actions, will be expected to recover their hydrological connection.
CH4 emissions in soil
In the case of the Cadiz Bay intervention areas, the values estimated for the different areas established in Burgos et al, 2017 were taken. These values correspond to an average of 240 μmol/m2d in the Guadalete area and 371.3 μmol/m2d in the rest of the areas.
In the case of the Odiel Salt Marshes, the emissions were disregarded in the scope of areas 1 (Isla de Bacuta) and 3 (old industrial salt ponds). In area 2 (El Burro Salt Marshes), in the absence of a better estimate, an estimated value of 371.3 μmol/m2d, derived from Burgos et al, 2017, has been taken as a reference.
N2O emissions in soil
The reference values established in previously published studies have been used for calculation of N2O emission rates.
In the case of Cadiz Bay, the values established for each of the scopes in Burgos et al, 2017 were used. These values correspond to an average of 69 μmol/m2d in the zone of influence of the Guadalete, applied to area 1 (north bank of the Guadalete) and 4.53 μmol/m2d in the rest of the areas with influence of the river San Pedro.
TIME SCALE (years)
AVERAGE ACCUMULATION RATE (tCO2e /ha year)
TOTAL NEW C STOCK (tCO2 /ha)
0 – 20 3.82 78.91
20 – 50 2.35 149.37
50 – 100 2.39 269.38
Table 26. Average rate of accumulation of CO2 and new C stock. Source:Burdenetal.,2019

FEASIBILITYSTUDYFORPREPARATION OF CARBON OFFSETTING PROJECTS
116 116
In the case of the Odiel Salt Marshes, the emission values for this gas are disregarded except for area 2 (El Burro Salt Marshes), where there is a record of input of pollutants originating in agricultural activity that contributes sediments to the intervention area. In this case, in the absence of more reliable data, the estimated value established by Burgos et al, 2017 has been taken for the Guadalete river area, corresponding to a value of 69 μmol/m2d.
The estimated emissions over time for the baseline scenario by area are as follows:
YEARS
Odiel Salt Marshes 0 10 20 30 40 48 50
AREA 1 Isla de Bacuta
Project scenario emissions
(cumulative tCO2e)2.60 -1,465.04 -2,935.28 -3,835.57 -4,735.85 -5,456.08 -5,636.14
Project scenario emissions
(cumulative tCO2e/ha)0.07 -38.17 -76.62 -100.12 -123.62 -142.42 -147.12
YEARS
Odiel Salt Marshes 0 10 17 20
AREA 2 El Burro
Salt Marsh
Project scenario emissions
(cumulative tCO2e a)0.23 -105.98 -180.56 -212.20
Project scenarioemissions
(cumulative tCO2e/ha)0.08 -37.24 -63.58 -74.72
YEARS
Odiel Salt Marshes 0 10 17 20
AREA 3 Old
industrial salt ponds
Project scenario emissions
(cumulative tCO2e)0.82 -450.32 -766.94 -901.46
Project scenario emissions
(cumulative tCO2e/ha)0.07 -38.42 -65.55 -77.05
Table 27. Emissions after interventions in Odiel Salt Marshes (GHGWPS)
©JAVIERSOTOVAZQUEZ.ALAMYSTOCKPHOTO

117 FEASIBILITY STUDY
IN ODIEL AND CADIZ SALT MARSHES
YEARS
Cadiz Bay 0 10 17 20
AREA 2 River
San Pedro cut
Project scenario emissions
(cumulative tCO2e)1.77 -935.07 -1,403.48 -1,871.90
Project scenario emissions
(cumulative tCO2e/ha)0.07 -36.05 -54.21 -72.30
YEARS
Cadiz Bay 0 10 17 20
AREA 3 Las Aletas
Project scenario emissions
(cumulative tCO2e)14.09 -7,549.90 -11,331.89 -15,113.88
Project scenario emissions
(cumulative tCO2e/ha)0.07 -35.91 -54.00 -72.02
YEARS
Cadiz Bay 0 10 17 20
AREA 1 North bank
of the Guadalete
Project scenario emissions
(cumulative tCO2e)10.42 -5,870.93 -8,811.60 -11,752.27
Project scenario emissions
(cumulative tCO2e/ha)0.07 -37.81 -56.85 -75.83
Table 28. Emissions after interventions in Cadiz Bay (GHGWPS)
4.3. Emissions reduction resulting from project interventions
The objective of the activities envisaged in the project(s) is to improve the environmental conditions in the intervention areas, as well as to optimise the conditions for fixing atmospheric CO2 and reducing emissions of other greenhouse gases. The interventions have been designed with the aim of re-establishing the wetting conditions over the entire area for intervention.
The reduction in emissions resulting from the actions proposed in the intervention areas is expected to be brought about by plant regeneration induced by the improvement of hydrological connection conditions and the change in hydroperiod. The design of the restoration interventions is expected to favour rewetting conditions in areas that are currently isolated from tidal influence, allowing them to regenerate naturally.
To perform the projection over time of estimated emissions for each of the intervention areas, soil emissions (CO2, CH4 and N2O) and the rate of aboveground biomass growth have been taken into account, as explained in the previous sections (see Annex 8).
The following shows the evolution of the estimated cumulative emissions over time over a period of years for the baseline scenario, the scenario deriving from execution of the interventions and the corresponding emission reduction by intervention area (Net GHG Emission Reductions and Removals).

FEASIBILITYSTUDYFORPREPARATION OF CARBON OFFSETTING PROJECTS
118 118
Odiel Salt Marshes YEARS
AREA 1 Isla de Bacuta 0 10 20 30 40 48 (SDT) 50
tCO2e cumulative emissions
BASELINE SCENARIO EMISSIONS 0.00 3,248.42 6,496.83 9,745.25 12,993.66 15,592.40 15,592.40
PROJECT SCENARIO EMISSIONS 2.60 -1,465.04 -2,935.28 -3,835.57 -4,735.85 -5,456.08 -5,636.14
EMISSIONS REDUCTION 2.60 -4,713.46 -9,432.12 -13,580.82 -17729.52 -21,048.48 -21,228.54
BASELINESCENARIO PROJECTSCENARIO EMISSIONSREDUCTION
BASELINESCENARIO PROJECTSCENARIO EMISSIONSREDUCTION
Odiel Salt Marshes YEARS
AREA 2 El Burro Salt Marshes 0 10 17 (SDT) 20
tCO2e cumulative emissions
BASELINE SCENARIO EMISSIONS 0.00 172.07 292.52 292.52
PROJECT SCENARIO EMISSIONS 0.23 -105.98 -180.56 -212.20
EMISSIONS REDUCTION 0.23 -278.05 -473.08 -504.71
20.000
15.000
10.000
5.000
-5.000
-10.000
-15.000
0
- 20.000
- 25.000
tCO2e/year
0 5 10 15 20 25 30 35 40 45 48 50
300
400
200
100
0
-200
-300
-400
-100
- 500
- 800
tCO2e/year
8 10 12 14 16 18 200 2 4 6 17
Table 29. Cumulative emissions in area 1: Isla de Bacuta. Odiel Salt Marshes
Table 30. Cumulative emissions in area 2: El Burro Salt Marshes. Odiel Salt Marshes
Figure 21. Cumulative emissions in area 1: Isla de Bacuta. Odiel Salt Marshes
Figure 22. Cumulative emissions in area 2: El Burro Salt Marshes. Odiel Salt Marshes

119 FEASIBILITY STUDY
IN ODIEL AND CADIZ SALT MARSHES
BASELINESCENARIO PROJECTSCENARIO EMISSIONSREDUCTION
BASELINESCENARIO PROJECTSCENARIO EMISSIONSREDUCTION
Odiel Salt Marshes YEARS
AREA 3 Old industrial salt ponds 0 10 17 (SDT) 20
tCO2e cumulative emissions
BASELINE SCENARIO EMISSIONS 0.00 1,215.26 2,065.95 2,065.95
PROJECT SCENARIO EMISSIONS 0.82 -450.32 -766.94 -901.46
EMISSIONS REDUCTION 0,82 -1.665,58 -2.832,89 -2.967,41
CADIZ BAY YEARS
AREA 1 North bank of the river Guadalete 0 10 15 (SDT) 20
tCO2e cumulative emissions
BASELINE SCENARIO EMISSIONS 0.00 6,435.06 9,652.60 9,652.60
PROJECT SCENARIO EMISSIONS 10.42 -5,870.93 -8,811.60 -11,752.27
EMISSIONS REDUCTION 10.42 -12,305.99 -18,464.20 -21,404.87
3.000
2.000
0
-1.000
-2.000
1.000
- 3.000
- 4.000
tCO2e/year
0 2 4 6 8 10 12 14 16 18 2017
Table 31. Cumulative emissions in area 3: Old industrial salt ponds. Odiel Salt Marshes
Table 32. Cumulative emissions in area 1: North bank of the river Guadalete. Cadiz Bay
Figure 23. Cumulative emissions in area 3: Old industrial salt ponds. Odiel Salt Marshes
Figure 24. Cumulative emissions in area 1: North bank of the river Guadalete. Cadiz Bay
15.000
10.000
5.000
-5.000
-10.000
-15.000
0
- 20.000
- 25.000
tCO2e/year
0 6 8 10 12 14 16 18 15 2042

FEASIBILITYSTUDYFORPREPARATION OF CARBON OFFSETTING PROJECTS
120 120
CADIZ BAY YEARS
AREA 2 : River San Pedro cut 0 10 15 (SDT) 20
tCO2e cumulative emissions
BASELINE SCENARIO EMISSIONS 0.00 1,568.85 2,353.27 2,353.27
PROJECT SCENARIO EMISSIONS 1.77 -935.07 -1,403.48 -1,871.90
EMISSIONS REDUCTION 1.77 -2,503.91 -3,756.75 -4,225.7
CADIZ BAY YEARS
AREA 3 : Las Aletas 0 10 15 (SDT) 20
tCO2e cumulative emissions
BASELINE SCENARIO EMISSIONS 0.00 25,225.27 37,837.91 37,837.91
PROJECT SCENARIO EMISSIONS 14.09 -7,549.90 -11,331.89 -15,113.88
EMISSIONS REDUCTION 14.09 -32,775.17 -49,169.80 -52,951.79
Table 29. Cumulative emissions in area 2: River San Pedro cut. Cadiz Bay
Table 30. Cumulative emissions in area 3: Las Aletas. Cadiz Bay
Figure 21. Cumulative emissions in area 2: River San Pedro cut. Cadiz Bay
Figure 22. Cumulative emissions in area 3: Las Aletas. Cadiz Bay
3.000
2.000
0
-1.000
-2.000
1.000
- 3.000
- 5.000
- 4.000
tCO2e/year
0 2 4 6 8 10 12 14 16 18 2015
60.000
40.000
0
-20.000
-40.000
20.000
- 60.000
tCO2e/year
0 2 4 6 8 10 12 14 16 18 2015
BASELINESCENARIO PROJECTSCENARIO EMISSIONSREDUCTION
BASELINESCENARIO PROJECTSCENARIO EMISSIONSREDUCTION

121 FEASIBILITY STUDY
IN ODIEL AND CADIZ SALT MARSHES
5. ANALYSIS OF THE ECONOMIC COST OF THE INTERVENTIONS
An analysis of the relationship between the cost of the interventions and the estimated quantification of the emission reduction for the Odiel Salt Marshes and Cadiz Bay is conducted in this section.
©R.GADOMSKI/DREAMSTIME

FEASIBILITYSTUDYFORPREPARATION OF CARBON OFFSETTING PROJECTS
122 122
5.1. Project costs
The cost of the actions whose budget is shown in the following table:
CADIZ BAY
AREA CODE TYPE OF INTERVENTION
MEASUREMENT AMOUNT (€) TOTAL (€)
AREA 1 North bank of the
river Guadalete1.3
Hydrological reconnection area 1 140,877.40 140,877.40
Overheads (14%) 19,722.84
Industrial profit (6%) 8,452.64
Material Implementation Budget (PEM) 169,052.88
AREA 2 River
San Pedro cut1.1
Hydrological reconnection area 1 48,493.36 48,493.36
Overheads (14%) 6,789.07
Industrial profit (6%) 2,909.60
Material Implementation Budget (PEM) 58,192.03
AREA 3 Las Aletas 1.2
Hydrological reconnection area 1 146,658.90 146,658.90
Overheads (14%) 20,532.25
Industrial profit (6%) 8,799.53
Material Implementation Budget (PEM) 175,990.68
TOTAL Cadiz Bay 403,235.59
ODIEL SALT MARSHES
AREA CODE TYPE OF INTERVENTION
MEASUREMENT AMOUNT (€) TOTAL (€)
AREA 1 Isla
de Bacuta1.3
Hydrological reconnection area 1 50,031.39 50,031.39
Overheads (14%) 7,004.39
Industrial profit (6%) 3,001.88
Material Implementation Budget (PEM) 60,037.67
AREA 2 El Burro
Salt Marshes1.1
Hydrological reconnection area 1 40,02.09 40,02.09
Overheads (14%) 560.29
Industrial profit (6%) 240.13
Material Implementation Budget (PEM) 4802.51
AREA 3 Old industrial
salt ponds1.2
Hydrological reconnection area 1 11,869.79 11,869.79
Overheads (14%) 1,661.77
Industrial profit (6%) 712.19
Material Implementation Budget (PEM) 14,243.75
TOTAL ODIEL SALT MARSHES 79,083.92
Table 31. Cost breakdown for each field of study and area

123 FEASIBILITY STUDY
IN ODIEL AND CADIZ SALT MARSHES
5.2. Monitoring costs
5.3. Validation/verification costs
Once the project has been launched, emissions reduction monitoring and calculation work will begin, to be transferred to the corresponding report. The monitoring periods can be adapted to the sponsors’ needs, with the need to record the implementation status of the various interventions, the values of the monitoring parameters and the scale of the emissions reduction.
To reduce costs in this regard, monitoring will be planned in line with the deadlines established for the emissions reduction verification process, with three different options or schedules presented in the following section.
Conducting monitoring at least once before each verification is proposed, a minimum of one year beforehand, so as to facilitate decision-making on whether or not to undertake the planned verification depending on the results and the market outlook, with the possibility of altering the initial timetable if necessary.
For the above reason, monitoring costs will be applied in the year of each verification, being €15,000 per project.
Validation/verification processes will need to be undertaken for registration of the projects and subsequent issuing of credits under the VCS standard.
Both processes are carried out by independent third parties, which evaluate project compliance with the standard rules and the requirements of the methodologies applied and use the PDD as their reference document.
The PDD may be written individually for each project or area or may be supported by the writing of a Programme of Activities (PoA) which would encompass methodologies and objectives for all the projects, with each of the interventions or areas included in them being considered to be a Component Project Activity (CPA), concentrating the work and reducing the costs associated with this task.
Validation of AFOLU projects will be carried out for a minimum crediting period of 20 years up to a maximum of 100 years, which may in the first case be renewed at most four times. The second of the options has been chosen in this case for cost simulation.
Once the validation process has been completed and the project has been registered, the reductions will be verified, as a prior step for issuing the credits, equivalent in this case to Verified Carbon Units (VCUs). The periods for this verification may be variable.
In terms of costs, writing of the PDD has been estimated at €25,000 for each of the projects if the interventions are addressed separately by area and €30,000 if they are addressed jointly, while the PoA will be €30,000, to which €10,000 per area or CPA would need to be added.

FEASIBILITYSTUDYFORPREPARATION OF CARBON OFFSETTING PROJECTS
124 124
As there is no project registered under this methodology, validation costs of €25,000 and €15,000 for each verification have been considered, with the total cost being €30,000 when the two are carried out simultaneously.
If proceeding according to the PoA, both validations and verifications will cost €18,000 for the combination of CPAs.
Given the different alternatives envisaged in the standard, four options have been elaborated to enable the results to be analysed comparatively and between areas.
It is to be borne in mind that the last verification will coincide with the limit set by the SDT, which sets the maximum time for generation of VCUs. When the option includes areas with a different SDT, the last verification will be set by the longest SDT.
Option A (2 + 5 + 10)
Option A considers the possibility of validating the project at the same time as the first verification in year 2, bringing forward the issuing of the credits generated, and establishing the following verifications in 5 years and thereafter every 10 years.
Option A (2 + 5 + 10) General outline
Year 0 Year 2 Year 7 Year 12 Year 20 Year 30 Year 40 Year 50
Writing of the PDD
Validation/ Verification
1
Verification 2
Verification 3
Verification 4
Verification 5
Verification 6
Verification 7
Option B (5 + 10) General outline
Year 0 Year 5 Year 10 Year 20 Year 30 Year 40 Year 50
Writing of the PDD/
Validation
Verification 1
Verification 2
Verification 3
Verification 4
Verification 5
Verification 6
Option B (5 + 10)
Option B is characterised by validating the project in year 0, carrying out the first two verifications at 5-year intervals and thereafter every 10 years, performing one less verification over the same time period than in the case of option A.
Option C (5 + 10)
Option C describes a different scheme from those above, proposing the writing of one PoA for the Odiel Salt Marshes and another for Cadiz Bay, along with the CPAs corresponding to each of the areas. This simplifies procedures and concentrates certain tasks, reducing the costs of writing the projects and those associated with validation/verification over the credit issuing period. This option sets validation in year 0, 5-yearly verification up to the year 20 and every 10 years thereafter, matching the number of verifications for option A, one more than for option B.

125 FEASIBILITY STUDY
IN ODIEL AND CADIZ SALT MARSHES
Option C (/Validation 5 + 10) General outline
Year 0 Year 5 Year 10 Year 15 Year 20 Year 30 Year 40 Year 50
Writing of PoA and
CPAs/ Validation (1 PoA per
space and 1 CPA per area)
Verification 1
Verification 2
Verification 3
Verification 4
Verification 5
Verification 6
Verification 7
Option D (2 + 5 + 10)
Option D, shares the same time periods and procedures as Option A, incorporating all the areas, regardless of their location, into the PDD, reducing the impact of the costs associated with writing the PDD, validation, verification and monitoring as far as possible.
Determination of the verification periods includes the associated costs, on the one hand, and the so-called “vintage” criterion, on the other, under which the credits issued lose value over time, as “buyers” choose to purchase credits associated with reductions that are close in time to the emissions to be offset, from which it follows that the frequency of the verifications is increased at the beginning.
Option D (2 + 5 + 10) General outline
Year 0 Year 2 Year 7 Year 12 Year 20 Year 30 Year 40 Year 50
Writing of the PDD
Validation/ Verification
1
Verification 2
Verification 3
Verification 4
Verification 5
Verification 6
Verification 7
Isla de Batuca. Huelva©GÍMENEZCUENCASL/UICN

FEASIBILITYSTUDYFORPREPARATION OF CARBON OFFSETTING PROJECTS
126 126
Table 32. Verra registration fees. Original amounts in dollars (exchange rate €0.85/$)
5.4. Costs of registration
The issuance of credits under the VCS standard for subsequent transfer, within what is known as the voluntary market, is subject to registering the projects in Verra’s registration system (https://registry.verra.org/app/search/VCS), as the entity responsible for the programme, which will be governed by its operating rules.
Operations within the registry are subject to a series of fees, where the following apply in the case in question:
The costs for opening and maintaining an account in the registry have not been applied as these are not considered to be matters that directly involve each project and their impact on the profit and loss account is not significant.
To simplify the analysis, the credit issuance/activation time has been matched with their transfer/retiring in the same year as the sourcing verification.
The costs per tonne of CO2 for each of the intervention areas and scenarios are shown below. These costs have been calculated by obtaining the relationship between the accumulated costs for each of the scenarios and the CO2 emissions accumulated in the corresponding year.
The data specific to option C is included separately at the end of each section.
FEE AMOUNT (€) OBSERVATIONS APPLIES
Account opening 255 Once per developer No
Account maintenance 255 Annual No
Project registration 425 €/project Yes
Issuing/activation of credits 0.136 €/VCU Yes
Transfer/cancellation of credits 0.0255 €/VCU Yes

127 FEASIBILITY STUDY
IN ODIEL AND CADIZ SALT MARSHES
years years
years years
years years
0
20
40
60
80
100
120
140
160
2 5 7 10 12 15 20 25 30 40 48
COSTE OPCIÓN A (€/vcu) COSTE OPCIÓN B (€/vcu)
0
20
40
60
80
100
120
2 5 7 10 12 15
COSTE OPCIÓN A (€/vcu) COSTE OPCIÓN B (€/vcu)
0,00
200,00
400,00
600,00
800,00
1.000,00
1.200,00
1.400,00
1.600,00
2 5 7 10 12 15 17
COSTE OPCIÓN A (€/vcu) COSTE OPCIÓN B (€/vcu)
0
50
100
150
200
250
300
2 5 7 10 12 15
COSTE OPCIÓN A (€/vcu) COSTE OPCIÓN B (€/vcu)
0
50
100
150
200
250
300
2 5 7 10 12 15 17
COSTE OPCIÓN A (€/vcu) COSTE OPCIÓN B (€/vcu)
0
5
10
15
20
25
30
35
40
2 5 7 10 12 15
COSTE OPCIÓN A (€/vcu) COSTE OPCIÓN B (€/vcu)
€/vcu €/vcu
€/vcu €/vcu
€/vcu €/vcu
optionA optionB optionA optionB
optionA optionB optionA optionB
optionA optionB optionA optionB
Odiel Salt Marshes : Cadiz Bay:
Cost (€/tCO2) for options A and B in area 1: Isla de Bacuta
Cost (€/tCO2) for options A and B inarea 1: North bank of the river Guadalete
Cost (€/tCO2) for options A and B in area 2: El Burro Salt Marshes
Cost (€/tCO2) for options A and B in area 2: River San Pedro cut
Cost (€/tCO2) for options A and B in area 3: Old industrial salt ponds
Cost (€/tCO2) for options A and B in area 3: Las Aletas
Figure 23. Cost (€/tCO2)

FEASIBILITYSTUDYFORPREPARATION OF CARBON OFFSETTING PROJECTS
128 128
€/vcu
Cost (€/tCO2) for the set of CPAs in Odiel Salt Marshes
0
20
40
60
80
100
120
140
160
2 5 7 10 12 15 20 25 30 40 48years
€/vcu
Cost (€/tCO2) for the set of CPAs in Cadiz Bay
0
10
20
30
40
50
60
2 5 7 10 12 15years
€/vcu
Cost (€/tCO2) for the set of CPAs
0
10
20
30
40
50
60
2 5 7 10 12 15 20 25 30 40 48years
Option C (5 + 10)
Option D (2 + 5 + 10)
Figure 23 (cont.). Cost (€/tCO2)

129 FEASIBILITY STUDY
IN ODIEL AND CADIZ SALT MARSHES
6. ANALYSIS OF UNCERTAINTY
7. FINANCIAL EVALUATION
The VCS standard requires identification of those assumptions, parameters and procedures with a significant level of uncertainty and estimation of this uncertainty with a certain confidence interval using recognised methods, taking those described in Chapter 6 of the document “IPCC Good Practice Guidance and Uncertainty Management in National Greenhouse Gas Inventories”.
The uncertainties to which the results are subject are those associated with the data from the selected bibliography, where sources considered as tiers 1 and 3 are combined. However, because of their specificity and lack of representative nature, their application depends on the opinion of experts, following the indications provided by the Aquatic Macrophyte Ecology Group, belonging to the Blanes Centre for Advanced Studies (Spanish National Scientific Research Council (CSIC)).
The uncertainty therefore lies in the correct selection and application of the data to the scope of the study, beyond estimation errors from the sources consulted. It is therefore proposed to use expert opinion to make judgements about uncertainty in view of the results and following the protocol proposed by the IPCC.
The financial evaluation is carried out based on the updated results of the table of costs prepared for each area and option, in each case calculating the annual cash flows, net present value (NPV), internal rate of return (IRR) and investment payback period, enabling comparison of these last three indices to select those alternatives most economically desirable.
Taking the nature of the investment and the forecast evolution of the price of money into account, a capitalisation rate was used equal to the average for 30-year government bonds over the three years prior to the analysis, i.e. 2017, 2018 and 2019, resulting in a rate of 2.21%.
©M.OTERO/UICN

FEASIBILITYSTUDYFORPREPARATION OF CARBON OFFSETTING PROJECTS
130 130
Table 33. Cost summary (€/tCO2) for the SDT
One fundamental matter for the evaluation is to determine the selling price of the VCUs issued for the year in question which, for analysis purposes, was made to coincide with that of verification, assuming the sale of all the credits. After consulting the successive reports issued by the Forest Trends organisation through its Ecosystem Marketplace initiative, it is noted that there is some stagnation in the volume of transactions and the average selling price of rights, with variations according to project type and the country or region where it is implemented. In 2018, sales in forestry and land-use-related projects produced a figure of $3.2/tCO2e, which is far from the peak of $7.34/tCO2e reached in 2008 across all typologies, but it is in keeping with the prices recorded since 2014. Globally, experts agree that this is a low price that does not encourage project developers, and that it is strongly influenced by the volume and value of credits generated by renewable energy projects. However, in spite of the current economic situation, the prospects are that these prices will increase progressively in successive years as a result of an increase in demand from companies, the upward trend in emission rights in the regulated sector, the limitation of registration, in the case of VCS, to renewable energy projects and the implementation of various initiatives to place value on other added project benefit, related to Sustainable Development Goals, etc.
At a European level, there is greater heterogeneity in the availability of information, with the volume of transactions considerably lower than in the rest of the world. According to a 2015 report issued by the same organisation, the average price for projects located in Europe is €15.5/tCO2e, although this value comes from a sample covering only 5% of the credits sold, with the average value for reforestation/afforestation projects being €14.7€/tCO2e.
The values resulting from reforestation projects implemented in Spain, which encompass the vast majority of sales in the country, are between €25-40/tCO2e, this being a close reference for price setting according to the evaluation, particularly taking the scarcity of credits from this type of intervention into account, so this price can be set conservatively at €20/tCO2e.
OPTION
ODIEL SALT MARSHES
AREA 1 Isla de Bacuta
AREA 2 El Burro
Salt Marshes
AREA 3 Old industrial salt ponds
A 15.41 349.45 61.84
B 14.43 307.17 54.78
C 23.19
OPTION
CADIZ BAY
AREA 1 Bank of the river
Guadalete
AREA 2 River San Pedro
cut
AREA 3 Las Aletas
A 18.00 58.35 7.00
B 16.89 53.00 6.57
C 8.74
D 4.94

131 FEASIBILITY STUDY
IN ODIEL AND CADIZ SALT MARSHES
Table 34. Results of the financial evaluation
Annex8includesthechartsofcashflowevolutionandNPVfortheoptionswiththebestfinancialresults.Thecalculationdetailscandifferiftheconditionsvary,allowingforotherscenariosthanthoseshown.
OPTION VALUE
ODIEL SALT MARSHES
AREA 1 Isla de Bacuta
AREA 2 El Burro
Salt Marshes
AREA 3 Old industrial
salt ponds
A
NPV 135,902 -141,759 -101,729
IRR 15 % — —
PERIOD 48 17 17
B
NPV 153,331 -124,332 -84,301
IRR 16 % — —
PERIOD 48 17 17
C
NPV 43,505
IRR 6 %
PERIOD 48
OPTION VALUE
CADIZ BAY
AREA 1 Bank of the river
Guadalete
AREA 2 River San Pedro
cut
AREA 3 Las Aletas
A
NPV 72,698 -128,759 706,988
IRR 11 % — 67 %
PERIOD 15 15 15
B
NPV 84,482 -110,947 724,685
IRR 12 % — 66 %
PERIOD 15 15 15
C
NPV 901,308
IRR 41 %
PERIOD 15
D
NPV 1,100,709.84
IRR 51 %
PERIOD 48
Under the above assumptions, in view of the costs obtained and summarised in Table 33, the following results are obtained for the reference indicators for the financial evaluation (Table 34).

FEASIBILITYSTUDYFORPREPARATION OF CARBON OFFSETTING PROJECTS
132 132
7.1. Additionality and risk analysis
7.1.1. Additionality
The project must demonstrate that the sale of carbon reductions is necessary to ensure project viability and that project activities would not have occurred without carbon financing. This analysis was performed at the same time as the selection of the baseline scenario in Chapter 1.4, in line with what is set out in the CDM methodological tool “Combined tool to identify the baseline scenario and demonstrate additionality in A/R CDM Project activities”.
In conclusion, the wetlands restoration projects in Cadiz Bay and in the Odiel Salt Marshes are additional, as financial, institutional, technological and social barriers were identified that would impede implementation of the project actions if the project is not registered in the VCS standards.
7.1.2. Risk analysis
WRC projects are to demonstrate that the permanence of their soil carbon and are required to undertake a non-permanence risk assessment. In AFOLU projects, the risk of non-permanence is addressed using the “AFOLU Non-Permanence Risk Tool: VCS Version 3”. Projects that demonstrate longevity, sustainability and risk mitigation capacity will be eligible to issue shared reserve credits (“buffer” credits).
The following is a summary of the methodology for the risk analysis:
Step 1: Risk analysis
The potential transient and permanent losses in carbon stocks are to be assessed over a period of 100 years and be based on the conditions present and the information available at the time of the risk analysis. Rating of non-permanence risk is performed taking internal, external and natural risk factors into account. Each of these is divided into sub-categories, to which a score must be assigned. The total risk rating for each category (internal, external and natural) is to be determined by summing the ratings for each sub-category in the category. While some sub-categories may have negative values, the total rating for any category may not be less than zero. Where risk mitigation synergies do not exist, the tables set a minimum rating of zero, even in cases where the calculation would otherwise determine a rating lower than zero. Where a risk factor does not apply to the project, the score is to be zero for that factor.
Step 2: Overall non-permanence risk rating and buffer determination
The overall rating is calculated by summing the internal, external and natural risk scores. The minimum score must be 10 and the maximum is 60. Above this value, the project risk is considered to be unacceptably high and the project is not eligible for crediting until the risks are adequately addressed or sufficient mitigation measures are implemented so that the project is not assessed as “FAIL”. Further, where the sum of the risk ratings for any risk category exceeds the following thresholds, the project fails the entire risk analysis and is not eligible for crediting.

133 FEASIBILITY STUDY
IN ODIEL AND CADIZ SALT MARSHES
Table 35. Project management
Table 36. Financial viability
PROJECT MANAGEMENT (PM)
a)Species planted (where applicable) associated with more than 25% of the stocks on which GHG credits have previously been issued are not native or proven to be adapted to the same or similar agro-ecological zones in which the project is located.
2
b) Ongoing enforcement to prevent encroachment by outside actors is required to protect more than 50% of stocks on which GHG credits have previously been issued. 2
c)Management team does not include individuals with significant experience in all skills necessary to successfully undertake all project activities (i.e. any area of required experience is not covered by at least one individual with at least 5 years’ experience in the area).
2
d) Management team does not maintain a presence in the country or is located more than a day of travel from the project site, considering all parcels or polygons in the project area. 2
e)
Mitigation: Management team includes individuals with significant experience in AFOLU project design and implementation, carbon accounting and reporting (e.g. individuals who have successfully managed projects through validation, verification and issuance of GHG credits) under the VCS programme or other approved GHG programmes.
-2
f) Mitigation: Adaptive management plan in place. -2
Total Project Management [a+b+c+d+e+f] *Total may not be less than zero
FINANCIAL VIABILITY (FV)
a) Project cash flow break-even point is greater than 10 years from the current risk assessment. 3
b) Project cash flow break-even point is greater than 7 and up to 10 years from the current risk assessment. 2
c) Project cash flow break-even point greater than 4 and up to 7 years from the current risk assessment. 1
d) Project cash flow break-even point is 4 years or less from the current risk assessment. 0
e) Project has secured less than 15% of funding needed to cover the total cash out before the project reaches break even. 3
f) Project has secured 15% to less than 40% of funding needed to cover the total cash out required before the project reaches break even. 2
g) Project has secured 40% to less than 80% of funding needed to cover the total cash out required before the project reaches break even. 1
h) Project has secured 80% or more of funding needed to cover the total cash out before the project reaches break even. 0
i) Mitigation: Project has available as callable financial resources at least 50% of total cash out before project reaches break even. -2
Total Financial Viability [ (a, b, c or d) + (e, f, g or h) + i] *Total may not be less than zero
Internal risksThe risks associated with the sub-categories of project management, financial viability, opportunity cost and project longevity need to be assessed (Tables 35-39).
Internal risks: 35 / External risks: 20 / Natural risks: 35
In the PDD preparation phase, all the information necessary to perform a complete risk analysis must be collected, following the methodology outlined in Step 1 of this chapter.

FEASIBILITYSTUDYFORPREPARATION OF CARBON OFFSETTING PROJECTS
134 134
Table 37. Opportunity cost
Table 38. Project longevity
Table 39. Total Internal Risk
OPPORTUNITY COST (OC)
a)Net present value (NPV) from the most profitable alternative land use activity is expected to be at least 100% more than that associated with project activities; or where baseline activities are subsistence-driven, net positive community impacts are not demonstrated.
8
b) NPV from the most profitable alternative land use activity is expected to be between 50% and up to 100% more than from project activities. 6
c) NPV from the most profitable alternative land use activity is expected to be between 20% and up to 50% more than from project activities. 4
d)NPV from the most profitable alternative land use activity is expected to be between 20% more than and up to 20% less than from project activities; or where baseline activities are subsistence-driven, net positive community impacts are demonstrated.
0
e) NPV from project activities is expected to be between 20% and up to 50% more profitable than the most profitable alternative land use activities. -2
f) NPV from project activities is expected to be at least 50% more profitable than the most profitable alternative land use activities. -4
g) Mitigation: Project proponent is a non-profit organisation. -2
h) Mitigation: Project is protected by legally binding commitment to continue management practices that protect the credited carbon stocks over the length of the project crediting period. -2
i) Mitigation: Project is protected by legally binding commitment (see Section 2.2.4) to continue management practices that protect the credited carbon stocks over at least 100 years. -8
Total Opportunity cost [(a, b, c, d, e o f) + (g, h o i)] *Total may not be less than zero
PROJECT LONGEVITY (PL)
a) Without legal agreement or requirement to continue the management practice. =24 – (Project longevity/5)
b) With legal agreement or requirement to continue the management practice. =30 – (Project longevity/5)
Total Project longevity [(a, b, c o d) + (e, f, g o h) + i] *Total may not be less than zero
TOTAL INTERNAL RISK
Total Internal Risk (PM + FV + OC + PL) *Total may not be less than zero
©GÍMENEZCUENCASL/UICN

135 FEASIBILITY STUDY
IN ODIEL AND CADIZ SALT MARSHES
External risksThe risks associated with the sub-categories of land tenure, access to resources and impacts, community engagement and political risk need to be assessed (Tables 40-43):
Table 40. Land tenure and access to resources/impacts
Table 42. Political Risk
Table 41. Community engagement
LAND TENURE AND ACCESS TO RESOURCES/IMPACTS (LT)
a) Ownership and resource access/use rights are held by same entity(s). 0
b) Ownership and resource access/use rights are held by different entity(s) (e.g. land is government owned and the project proponent holds a lease or concession). 2
c) In more than 5% of the project area, there exist disputes over land tenure or ownership. 10
d) There exist disputes over access/use rights (or overlapping rights). 5
e)WRC projects unable to demonstrate that potential upstream and sea impacts that could undermine issued credits in the next 10 years are irrelevant or expected to be insignificant, or that there is a plan in place for effectively mitigating such impacts.
5
f)Mitigation: Project area is protected by legally binding commitment (e.g. a conservation easement or protected area) to continue management practices that protect carbon stocks over the length of the project crediting period.
-2
g) Mitigation: Where disputes over land tenure, ownership or access/use rights exist, documented evidence is provided that projects have implemented activities to resolve the disputes or clarify overlapping claims. -2
Total Land tenure and access to resources/impacts [(a o b) + c + d + e + f + g] *Total may not be less than zero
POLITICAL RISK (PC)
a) Governance score of less than -0.79 6
b) Governance score of -0.79 to less than -0.32 4
c) Governance score of -0.32 to less than 0.19 2
d) Governance score of 0.19 to less than 0.82 1
e) Governance score of 0.82 or higher 0
f) Mitigation: Country is implementing REDD+ readiness or other activities. -2
Total Political Risk [(a, b, c, d o e) + f] *Total may not be less than zero
COMMUNITY ENGAGEMENT (CE)
a) Less than 50 percent of households living within the project area, who are reliant on the project area, have been consulted. 10
b) Less than 20 percent of households living within 20 km of the project boundary outside the project area, and who are reliant on the project area, have been consulted. 5
c) Mitigation: The project generates net positive impacts on the social and economic well-being of the local communities who derive livelihoods from the project area. -5
Total Community engagement [a+ b + c] *Total may not be less than zero
Table 43. Total External Risk
TOTAL EXTERNAL RISK
Total External Risk (LT + CE + PC) *Total may not be less than zero

FEASIBILITYSTUDYFORPREPARATION OF CARBON OFFSETTING PROJECTS
136 136
Natural risks
All natural hazards that have occurred during the past 100 years must be assessed according to the table 44, taking their likelihood of occurrence and level of significance into account.
Table 44. Natural Risks
NATURAL RISKS
SIGNIFICANCE
LIKELIHOOD
Less than every 10
years
Every 10 to less than 25 years
Every 25 to less
than 50 years
Every 50 to less
than 100 years
Once every 100 years or more, or risk is
not applicable to the project area
CATASTROPHIC (70% or more loss of carbon stocks)
REPRO-BADO 30 20 5 0
DEVASTATING (50% to less than 70% loss of carbon stocks) 30 20 5 2 0
MAJOR (25% to less than 50% loss of carbon stocks) 20 5 2 1 0
MINOR (5% to less than 25% loss of carbon stocks) 5 2 1 1 0
INSIGNIFICANT (less than 5% loss of carbon stocks) or transient (full recovery of lost carbon stocks expected within 10 years of any event)
2 1 1 0 0
NO LOSS 0 0 0 0 0
LS SCORE
MITIGATION (M)
Prevention measures applicable to the risk factor are implemented 0.5
Project proponent has proven history of effectively containing natural risk 0.5
Both of the above 0.25
None of the above 1
Score for each natural risk applicable to the project (Multiplying LS x M)
Fire (F)
Pest and Disease outbreaks (PD)
Extreme weather (W)
Geological risk (G)
Other natural risk (ON)
Total Natural Risks (F + PD + W+ G + ON)

137 FEASIBILITY STUDY
IN ODIEL AND CADIZ SALT MARSHES
In addition to the planned actions, which are essential for achieving the restoration objectives established for each of the areas, this section presents some interventions which, although not in principle necessary for achieving these objectives, can favour the dynamics for re-establishing natural conditions and minimise the risks arising from the initial situation of two of the proposed areas. Moreover, these types of interventions will make various voluntary actions possible, enhancing the involvement and participation of potential interested companies.
These interventions are proposed for two of the proposed areas in each of the scopes for action of the study.
In Cadiz Bay, the anticipated action includes the interventions necessary for the artificial establishment of vegetation typical of the salt marsh. Although, from the interventions referred to in section 3, which aim to restore the water dynamics of the area, natural regeneration of the salt marsh vegetation is expected to occur successfully, account must be taken of the risk assumed of a possible deficit or delay in that natural implantation in part of the area and the added social value of an intervention in this regard with local communities. Numerous variables act on the assessment of this risk, some of which are difficult to measure and even to determine, which is why it is envisaged as a complementary intervention. The spatial scope of this intervention is anticipated to be an area of 7.3 ha.
Establishment of Spartina spp. is proposed in these areas, this being a species that has been established in similar zones in previous experiences. The Spartina spp. needs to be obtained from natural populations, as it does not produce seeds and is not produced in nurseries. In order to minimise the impacts of its extraction on natural populations, and to increase biodiversity in areas to be restored, the extraction of Spartina spp. plants will be dispersed spatially as far as possible. If specimens of Sarcocornia perennis are found in the area proposed for extraction of Spartina spp. fragments of this will be transplanted together with the Spartina spp.
The area planned for the extraction of Spartina spp. is located at the eastern end of the intervention area and is predicted to provide the specimens necessary for the planting action. The method of extraction will be carried out in a dispersed manner, as far as possible, facilitating subsequent regeneration of
7.2. Complementary interventions
©JOSEPIZARRO/DREAMSTIME

FEASIBILITYSTUDYFORPREPARATION OF CARBON OFFSETTING PROJECTS
138 138
the tufts. The extracted tufts will be fragmented into groups of approximately 20 clumps and will be transported to the planting area. Average extraction of approximately 80 groups per square metre of natural population is estimated.
Planting in the planned areas will be carried out at a density of one group per square metre, using staggered planting to maximise fixing of the sediments. Planting must be planned taking the forecast tide levels into account. Work will start a few hours before low tide time, ending when the tide level prevents the intervention. Repopulation of seven sections spread around the areas devoid of selected vegetation is anticipated, occupying a total area of 7.3ha. The number of groups to be planted will be 73,000, requiring an extraction area of 912.5m2. Given that the area for extraction covers 2,968.4m2, extraction of the specimens can be carried out in a scattered manner over the entire patch. The cost of these interventions totals €42,553.48 (plant distribution: €902.54; planting: €38,730.94; in situ extraction: €2,920.00).
In Odiel, extraction of materials accumulated by silt loading of adjacent streams during the spate periods is proposed as a complementary intervention. These materials come from farming areas upstream of the intervention area and they are expected to contain certain concentrations of pollutants from intensive agriculture.
These materials will be extracted from the intervention area and transferred to a collection area, located in the vicinity of the nearest access road, where they will be made available for removal and recovery. The intervention will be carried out by means of a bulldozer for collection and subsequent loading by wheel loader and transport by truck to the final collection point.
The estimated costs for this intervention total €115,929.57.
El Burro Salt Marshes. Huelva
©GÍMENEZCUENCASL/UICN

139 FEASIBILITY STUDY
IN ODIEL AND CADIZ SALT MARSHES
Table 45. Results of the financial evaluation with the anticipated complementary interventions
OPTION VALUE
ODIEL SALT MARSHES
AREA 1 Isla de Bacuta
AREA 2 El Burro
Salt Marshes
AREA 3 Old industrial
salt ponds
A
NPV 135,902 -260,822 -101,729
IRR 15 % - -
PERIOD 48 17 17
B
NPV 153,331 -243,010 -84,301
IRR 16 % — —
PERIOD 48 17 17
C
NPV -69,917
IRR
PERIOD 48
OPTION VALUE
CADIZ BAY
AREA 1 Bank of the Guadalete
AREA 2 River San Pedro
cut
AREA 3 Las Aletas
A
NPV 31,752 -128,759 706,988
IRR 6 % — 67 %
PERIOD 15 15 15
B
NPV 43,796 -110,947 724,685
IRR 7 % — 66 %
PERIOD 15 15 15
CNPV 859,675
IRR 37 %
The Table 45 shows the results of the financial evaluation in case the anticipated complementary interventions are performed:
As can be seen from the financial results from the application of the planned complementary measures, the data relating to net present value (NPV) and internal rate of return (IRR) are altered differently in each of the affected areas and for the different options envisaged.
In the case of Odiel, this change is more pronounced, even eliminating the profitability associated with the project as a whole for the overall scope of action (option C, -2%). This marked drop is due to the high estimated cost of these interventions on the projected income for the overall project. In Cadiz, although there is a marked drop in IRR corresponding to the area to which the proposed intervention would be applied, reducing it by half, the overall calculation in the in the scope of the intervention lowers its profitability by four percentage points, giving an IRR of 37%, meaning a drop of 9.7%.

FEASIBILITYSTUDYFORPREPARATION OF CARBON OFFSETTING PROJECTS
140 140
8. CONCLUSIONS AND RECOMMENDATIONS
According to the information analysed, it can be concluded in preliminary form that the proposed restoration actions are viable for registration in the VCS standard, both in Cadiz Bay and in the Odiel Salt Marshes.
The project began with the selection of the various intervention area for which the feasibility study in question was required. Therefore, to undertake this study, actions were needed to restore the most suitable hydrological connection conditions for each of the areas proposed under the general premise of improving the ecological and environmental conditions of the areas with the main objective of maximising their anticipated atmospheric CO2 capture.
For this purpose, on the one hand, previous information was available concerning the carbon storage capacity in the different types of salt marsh derived from the study carried out previously and, on the other, determination was required of the potential of each of the areas as regards the development of the different types of salt marsh studied.
It is in this part of the study, therefore, that consultation of information concerning previous studies with similar characteristics or other experiences that would support decision-making in the development phase of the project became most necessary. Also, mapping information plays a key role, in a very prominent manner, in project decision-making, being directly involved in determining the initial and potential conditions of each of the study scenarios.
On the other hand, once the methodology defined in the study for determining the potential conditions of each of the areas has been applied, the optimal interventions selected are determined according to
©JUANGARCIA

141 FEASIBILITY STUDY
IN ODIEL AND CADIZ SALT MARSHES
their cost-benefit ratio. To determine the scope of the proposed interventions, information is required in this part of the project regarding the estimated evolution of each of the intervention areas once the interventions have been undertaken. This information is also required for determination of the future emission conditions of each of the areas, influencing their results, which in turn is required by the VCS standard. Due to the methodology applied, the analysis of uncertainty will need to be the subject of additional expert opinion.
The cost of the proposed actions for each of the intervention areas is variable and dependent on the starting conditions for each area. These starting conditions determine the intensity, and thus the cost, of the interventions necessary to achieve a scenario in which the tidal connection of the areas is restored.
This is the reason why selection of the intervention areas has a decisive influence on the cost-benefit ratio, determining their possible economic viability. In this regard, some strategically selected areas can maximise the economic output of the interventions. In other words, by means of a previous study addressing the analysis of the actions required for possible intervention areas, zones can be identified that can have a dramatic impact on emissions reductions through implementation of isolated interventions at low cost.
On the other hand, the costs of the validation/verification processes, as well as those for monitoring, have a substantial impact on the price. These costs are high, and are inflated even further if the limited experience in projects of this type, that would increase executing team workload, is taken into account. In the case of the proposed scenarios, these costs represent approximately 30 to 160% of the amount for the works, a figure that may be revised downwards by extending the intervals between verifications, which would result in delaying the issuance of the credits generated. These costs have a more decisive impact on the final cost of projects in smaller areas, as the fixed costs are higher in a relative sense.
Following these criteria leads to the following conclusions::
• The areas with the greatest emissions reductions are the Isla de Bacuta (Odiel Salt Marshes) and the north bank of the river Guadalete and Las Aletas (Cadiz Bay).
• The most profitable area is Las Aletas (Cadiz Bay).
• The result for the Isla de Bacuta is determined by the SDT, which is in turn determined by the carbon stock data selected based on the identification of an equivalent stratum from the reference studies.
• The results for the smaller areas are excessively burdened by the fixed costs.
• Individually, the results corresponding to the El Burro Salt Marsh (Odiel Salt Marshes) price it out of the market, while investment in the old industrial salt ponds (Odiel Salt Marshes) and the river San Pedro cut (Cadiz Bay) will depend on placing value on other environmental benefits.
• Options A and B do not show significant differences in final profitability. However, option A allows for one more verification and, therefore, the bringing forward of issuance of carbon credits.
• Options C and D are more advantageous from the financial point of view, and allow for offsetting of results from areas of a smaller scale.

FEASIBILITYSTUDYFORPREPARATION OF CARBON OFFSETTING PROJECTS
142 142
• Option C allows for concentration of validation/verification tasks and integration of as many new areas as desired, once the intended interventions have been executed, reducing costs associated with writing documentation, monitoring and auditing.
• Option D reduces fixed costs compared to Option C, however, this is an approach that would prevent further enlargement by including new areas and actions.
• The selection of areas and interventions with higher surface impact is essential to return on investment.
• The most favourable results are competitive within the voluntary market internationally. Nationally, the profitability of the credits generated exceeds that proven for reforestation-based projects, although the market value for “blue carbon” projects may be higher.
• The incorporation of the anticipated complementary interventions, while reducing the risks associated with achieving the proposed restoration objectives, would substantially increase the costs of the actions, significantly reducing the profitability of the projects in each of the planned zones and general intervention areas. This change is most pronounced in Odiel, where the implementation of the anticipated complementary interventions would reduce the internal rate of return (IRR) to negative values for the general scope of action (option C). The decrease is less marked in Cadiz, representing a 9.7% drop in IRR.
The restoration of blue carbon ecosystems in salt marshes, in addition to reconstructing natural carbon sinks, will help reverse their decline and recover the area lost, providing an improvement in the ecological condition of coastal environments (Nelleman et al., 2009). Their restoration using carbon markets and standards such as the VCS appears to be a viable option in certain types and project conditions and can be used by administrations in a strategic manner to buck the current trend, without forgetting that they need to be assisted by parallel actions to minimise the pressures that caused the previous loss. The narrative framework generated primarily needs to reinforce emissions reductions by ensuring that offsetting takes place from an appropriate context of transparency, efficiency and social equity.
The first generation of blue carbon offsetting projects will also look to provide added social value, where communities can participate in restoration programmes or become involved and directly benefit from the results. This can be equally interesting from the point of view of companies that wish to invest in projects near their working environments and offer that support in restoring the coastal environment.

143 FEASIBILITY STUDY
IN ODIEL AND CADIZ SALT MARSHES
©WILDWONDERSOFEUROPE/LÓPEZ

FEASIBILITYSTUDYFORPREPARATION OF CARBON OFFSETTING PROJECTS
144 144
Agencia de Medio Ambiente (AMA). Plan de Ordenación de los Recursos Naturales y Plan Rector de Uso y Gestión del Parque Natural Cadiz Bay. Junta de Andalucía, 1994.
Agencia de Medio Ambiente (AMA). Plan Rector de Uso y Gestión del Paraje Natural de las Odiel Salt Marshes y de la Isla de En medio y La El Burro Salt Marshes. Junta de Andalucía, 1988.
Agriculture, Forestry and Other Land Use (AFOLU) Requirements. VCS Versión 3.6, 21 Junio 2017.
Burden A, Garbutt A, Evans CD. 2019. Effect of restoration on saltmarsh carbon accumulation in Eastern England. Biol. Lett. 15: 20180773. http://dx.doi.org/10.1098/rsbl.2018.0773
CDM AR-TOOL14. Methodological tool: Estimation of carbon stocks and change in carbon stocks of trees and shrubs in A/R CDM project activities. Versión 4.2.
CDM A/R Methodological tool: Combined tool to identify the baseline and demonstrate additionality in A/R CDM project activities. Versión 1. 15 Abril 2011.
Diaz-Almela, E., Piñeiro-Juncal, N., Marco-Mendez, C., Giralt, S.Leiva-Dueñas, C., Mateo, A. 2020. Carbon Stocks And Fluxes Associated To Andalusian Saltmarshes and estimates of impact in stocks and fluxes by diverse land-use changes. Deliverable C2.2 (a C2.1 update). http://life-bluenatura.eu/wp-content/uploads/2020/02/Deliverable_C2.2_LBN_low.pdf.
Ficha Informativa de los Humedales Ramsar. Cadiz Bay. Available at: https://www.juntadeandalucia.es/medioambiente/web/Bloques_Tematicos/Patrimonio_Natural._Uso_Y_Gestion/Espacios_Protegidos/Ramsar/bahiacadiz_ris_45.pdf.
Ficha Informativa de los Humedales Ramsar. Odiel Salt Marshes . Available at: https://www.juntadeandalucia.es/medioambiente/web/Bloques_Tematicos/Patrimonio_Natural._Uso_Y_Gestion/Espacios_Protegidos/Ramsar/odiel_ris_6.pdf.
Garbutt, Angus, and Mineke Wolters. The natural regeneration of salt marsh on formerly reclaimed land. Applied Vegetation Science, vol. 11, no. 3, 2008, p. 335+. Gale OneFile: Health and Medicine, Accessed 25 Sept. 2020.
IPCC 2014, 2013. Supplement to the 2006 IPCC Guidelines for National Greenhouse Gas Inventories: Wetlands. Hiraishi, T., Krug, T., Tanabe, K., Srivastava, N., Baasansuren, J., Fukuda, M. and Troxler, T.G. (eds). Published: IPCC, Switzerland.
IUCN (2021). Manual for the creation of Blue Carbon projects in Europe and the Mediterranean. Otero, M. (Ed)., 144 pages.
Klein, R. Molina, F. Agencia de Medio Ambiente (AMA). Estudio de la gestión integrada de las Odiel Salt Marshes . Capítulo VI: Valoración ambiental de las Areas húmedas. Odiel Salt Marshes . Sevilla, 1991. Available at: http://www.juntadeandalucia.es/medioambiente/consolidado/publicacionesdigitales/40-295_estudio_de_la_gestion_integrada_de_las_marismas_del_odiel/40-295/7_valoracion_ambiental_de_las_Areas_humedas.pdf
Pendleton, L., Donato, D.C., Murray, B.C., Crooks, S., Jenkins, W.A., Sifleet, S., et al., 2012. Estimating global ‘Blue Carbon’ emissions from conversion and degradation of vegetated coastal ecosystems. PLoS One 7 (9), e43542.
Poffenbarger, H.J., Needelman, B.A. & Megonigal, J.P. (2011). Salinity Influence on Methane Emissions from Tidal Marshes. Wetlands, 31, 831-842.
REFERENCES

145 FEASIBILITY STUDY
IN ODIEL AND CADIZ SALT MARSHES
Terra Naturalis, 2011. Recopilación e identificación de acciones de restauración ecológica en humedales espyearles. Promotor: Servicio de Conservación e Inventariación de Humedales. Subdirección General de Medio Natural. Dirección General de Calidad y Evaluación Ambiental y Medio Natural. Ministerio para la Transición Ecológica y el Reto Demográfico.
Unlocking Potential-State Of Voluntary Carbon Markets 2017. May 2017. Forest Trends.
Velleman, Paul F. 1975, Robust Nonlinear Data Smoothers; Theory, Definitions, and Applications, PhD thesis, Princeton University, Dept. of Statistics.
VCS Methodology for Tidal Wetland and Seagrass Restoration. Versión 1. 20 Noviembre 2015.
VCS AFOLU Non-Permanence Risk Tool. Versión 3.3. 19 Octubre 2019.
Oppenheimer, M., B.C. Glavovic , J. Hinkel, R. van de Wal, A.K. Magnan, A. Abd-Elgawad, R. Cai, M. Cifuentes-Jara, R.M. DeConto, T. Ghosh, J. Hay, F. Isla, B. Marzeion, B. Meyssignac, and Z. Sebesvari, 2019: Sea Level Rise and Implications for Low-Lying Islands, Coasts and Communities. In: IPCC Special Report on the Ocean and Cryosphere in a Changing Climate [H.-O. Pörtner, D.C. Roberts, V. Masson-Delmotte, P. Zhai, M. Tignor, E. Poloczanska, K. Mintenbeck, A. Alegría, M. Nicolai, A. Okem, J. Petzold, B. Rama, N.M. Weyer (eds.)]. In press.

FEASIBILITY STUDY FOR PREPARATION OF CARBON OFFSETTING PROJECTS
146 146
ANNEX 1VCS CONDITIONS
Condition 1 Project activities which restore tidal wetlands are eligible.
Condition 2Project activities may include any of the following, or combinations of the following:
a) Creating, restoring and/or managing hydrological conditions (e.g. removing tidal barriers, improving hydrological connectivity, restoring tidal flow to wetlands or lowering water levels on impounded wetlands).
b) Altering sediment supply (e.g. beneficial use of dredge material or diverting river sediments to sediment-starved areas).
c) Changing salinity characteristics (e.g. restoring tidal flow to tidally-restricted areas).
d) Improving water quality (e.g. reducing nutrient loads leading to improved water clarity to expand seagrass meadows, recovering tidal and other hydrologic flushing and exchange or reducing nutrient residence time).
e) Reintroducing native plant communities (e.g. reseeding or replanting).
f) Improving management practice(s) (e.g. removing invasive species, reduced grazing).
Condition 3Prior to the project start date, the project area:
a) Is free of any land use that could be displaced outside the project area, as demonstrated by at least one of the following, where relevant:
— The project area has been abandoned for two or more years prior to the project start date; or
— Use of the project area for commercial purposes (i.e. trade) is not profitable as a result of salinity intrusion, market forces or other factors. In addition, timber harvesting in the
baseline scenario within the project area does not occur; or
— Degradation of additional wetlands for new agricultural sites within the country will not occur or is prohibited by enforced law.
b) Is under a land use that could be displaced outside the project area (e.g. timber harvesting), though in such case emissions from this land use will not be accounted for.
c) Is under a land use that will continue at a similar level of service or production during the project crediting period (e.g. reed or hay harvesting, collection of fuelwood, subsistence harvesting).
Condition 4Live tree vegetation may be present in the project area, and may be subject to carbon stock changes (e.g. due to harvesting) in both the baseline and project scenarios.
Condition 5The prescribed burning of herbaceous and shrub aboveground biomass (cover burns) as a project activity may occur.
Condition 6Where the project proponent intends to claim emission reductions from reduced frequency of peat fires, project activities must include a combination of rewetting and fire management.
Condition 7Where the project proponent intends to claim emission reductions from reduced frequency of peat fires, it must be demonstrated that a threat of frequent on-site fires exists, and the overwhelming cause of ignition of the organic soil is anthropogenic (e.g. drainage of the peat, arson).
Condition 8 In strata with organic soil, afforestation, reforestation, and revegetation (ARR) activities must be combined with rewetting.

147
Condition 9Project activities qualify as IFM or REDD (Reducing Emissions from Deforestation and forest Degradation).
Condition 10Baseline activities include commercial forestry.
Condition 11Project activities lower the water table, unless the project converts permanent flood waters (open water) to tidal wetlands, or improves the hydrological connection to impounded waters (locally flooded areas behind artificial barriers that prevent natural drainage).
Condition 12Hydrological connectivity of the project area with adjacent areas leads to a significant increase in GHG emissions outside the project area.
Condition 13 Project activities include the burning of organic soil.
Condition 14Nitrogen fertilisers (chemical fertiliser or manure) are applied in the project area during the project crediting period.
AFOLU REQUIREMENTS FOR WETLAND CONSERVATION AND RESTORATION Según la metodología VM0033, se deben cumplir también los requerimientos metodológicos de proyectos AFOLU que apliquen para la categoría del proyecto. En este caso, la categoría de referencia es la de “Conservación y Restauración de Humedales (WCR)”, para la cual presentamos los siguientes requerimientos:
Condition 1Implementation of the project activities will not lead to the violation of any applicable law.
Condition 2Activities that convert native ecosystems to generate GHG credits are not eligible under the VCS programme. Evidence will be provided in the project description that project areas were
not cleared of native ecosystems to create GHG credits. Such proof is not required where such clearing or conversion took place at least 10 years prior to the project start date.
Condition 3Activities that drain native ecosystems or degrade hydrological functions to generate GHG credits are not eligible under the VCS programme. Evidence will be provided in the project description that any AFOLU project area was not drained or converted to create GHG credits. Such proof is not required where such draining or conversion took place prior to 1 January 2008.
Condition 4 The project proponent will demonstrate control over the entire project area with documentary evidence conclusively establishing proof of title with respect to one or more rights of use accorded to the project proponent.
Condition 5The project area will meet an internationally accepted definition of wetland, such as from the IPCC, Ramsar Convention on Wetlands, those established by law or national policy or those with broad agreement in the peer-reviewed scientific literature for specific countries or types of wetlands

FEASIBILITY STUDY FOR PREPARATION OF CARBON OFFSETTING PROJECTS
148 148
ANNEX 2RISK FACTORS
Internal risk factors The risks associated with the sub-categories of project management, financial viability, opportunity cost and project longevity must be assessed according to the following parameters.
RISKS RELATED TO PROJECT MANAGEMENT (PM)
a)Species planted (where applicable) associated with more than 25% of the stocks where GHG credits have previously been issued are not native or proven to be adapted to the same or similar agro-ecological zones in which the project is located.
0
b) Ongoing enforcement to prevent encroachment by outside actors is required to protect more than 50% of stocks on which GHG credits have previously been issued. 2
c)Management team does not include individuals with significant experience in all skills necessary to successfully undertake all project activities (i.e. any area of required experience is not covered by at least one individual with at least 5 years’ experience in the area).
2
d) Management team does not maintain a presence in the country or is located more than a day of travel from the project site, considering all parcels or polygons in the project area. 0
e)
Mitigation: Management team includes individuals with significant experience in AFOLU project design and implementation, carbon accounting and reporting (e.g. individuals who have successfully managed projects through validation, verification and issuance of GHG credits) under the VCS programme or other approved GHG programmes.
0
f) Mitigation: Adaptive management plan in place. -2
Total Project Management *Total may not be less than zero 2
RISKS RELATED TO FINANCIAL VIABILITY (FV)
a) Project cash flow break-even point is greater than 10 years from the current risk assessment. 0
b) Project cash flow break-even point is greater than 7 and up to 10 years from the current risk assessment. 2
c) Project cash flow break-even point greater than 4 and up to 7 years from the current risk assessment. 0
d) Project cash flow break-even point is 4 years or less from the current risk assessment. 0
e) Project has secured less than 15% of funding needed to cover the total cash out before the project reaches break even. 3
f) Project has secured 15% to less than 40% of funding needed to cover the total cash out required before the project reaches break even. 0
g) Project has secured 40% to less than 80% of funding needed to cover the total cash out required before the project reaches break even. 0
h) Project has secured 80% or more of funding needed to cover the total cash out before the project reaches break even. 0
i) Mitigation: Project has available as callable financial resources at least 50% of total cash out before project reaches break even. 0
Total Financial Viability [ (a, b, c o d) + (e, f, g o h) + i] *Total may not be less than zero 5
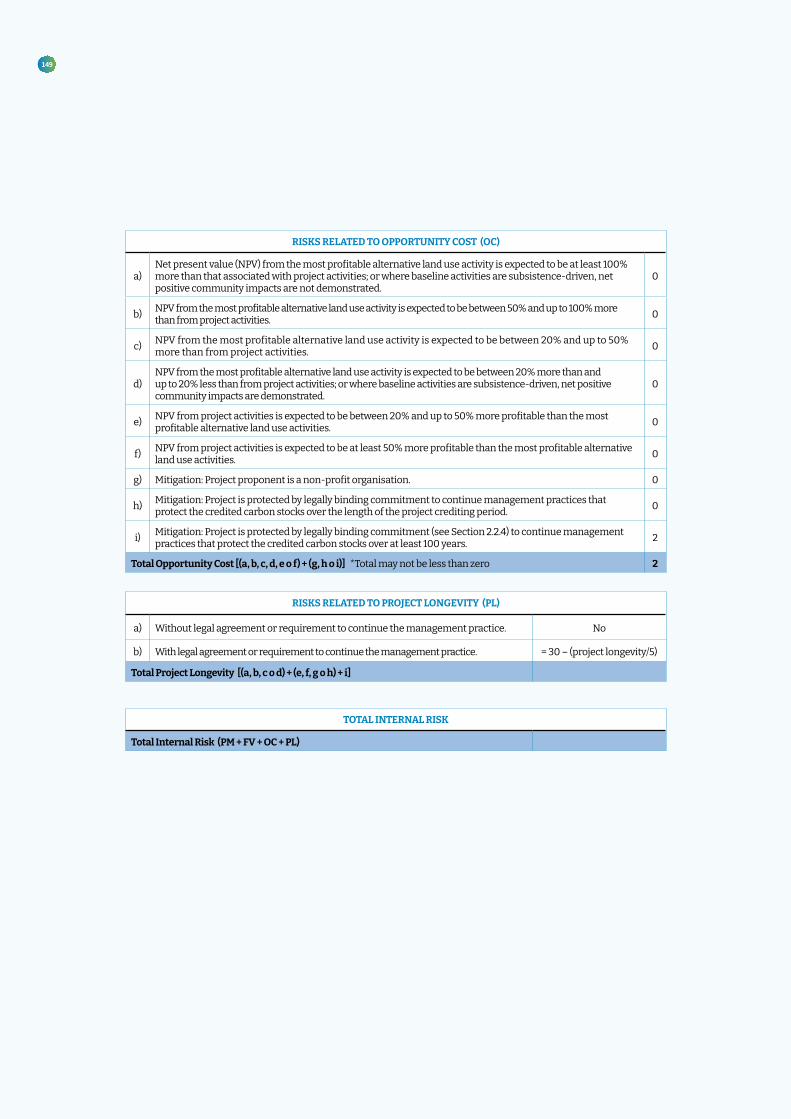
149
RISKS RELATED TO OPPORTUNITY COST (OC)
a)Net present value (NPV) from the most profitable alternative land use activity is expected to be at least 100% more than that associated with project activities; or where baseline activities are subsistence-driven, net positive community impacts are not demonstrated.
0
b) NPV from the most profitable alternative land use activity is expected to be between 50% and up to 100% more than from project activities. 0
c) NPV from the most profitable alternative land use activity is expected to be between 20% and up to 50% more than from project activities. 0
d)NPV from the most profitable alternative land use activity is expected to be between 20% more than and up to 20% less than from project activities; or where baseline activities are subsistence-driven, net positive community impacts are demonstrated.
0
e) NPV from project activities is expected to be between 20% and up to 50% more profitable than the most profitable alternative land use activities. 0
f) NPV from project activities is expected to be at least 50% more profitable than the most profitable alternative land use activities. 0
g) Mitigation: Project proponent is a non-profit organisation. 0
h) Mitigation: Project is protected by legally binding commitment to continue management practices that protect the credited carbon stocks over the length of the project crediting period. 0
i) Mitigation: Project is protected by legally binding commitment (see Section 2.2.4) to continue management practices that protect the credited carbon stocks over at least 100 years. 2
Total Opportunity Cost [(a, b, c, d, e o f) + (g, h o i)] *Total may not be less than zero 2
RISKS RELATED TO PROJECT LONGEVITY (PL)
a) Without legal agreement or requirement to continue the management practice. No
b) With legal agreement or requirement to continue the management practice. = 30 – (project longevity/5)
Total Project Longevity [(a, b, c o d) + (e, f, g o h) + i]
TOTAL INTERNAL RISK
Total Internal Risk (PM + FV + OC + PL)

FEASIBILITY STUDY FOR PREPARATION OF CARBON OFFSETTING PROJECTS
150 150
External risk factors The risks associated with the sub-categories of land tenure, access to resources and impacts, community engagement and political risk need to be assessed.
RISKS RELATED TO LAND TENURE AND ACCESS TO RESOURCES/IMPACTS (LT)
a)Ownership and resource access/use rights are held by same entity(s). 2
Yes, it is the administration of Andalusia. 0
b) Ownership and resource access/use rights are held by different entity(s) (e.g. land is government owned and the project proponent holds a lease or concession. 0
c) In more than 5% of the project area, there exist disputes over land tenure or ownership. 0
d) El equipo de gestión no tiene presencia en el país o está ubicado a más de un día de viaje desde el sitio del proyecto, considerando todas las parcelas o polígonos en el área del proyecto. 0
e)There exist disputes over access/use rights (or overlapping rights) - Yes 0
There exist disputes over access/use rights (or overlapping rights) - No 5
f)Mitigation: Project area is protected by legally binding commitment (e.g. a conservation easement or protected area) to continue management practices that protect carbon stocks over the length of the project crediting period. (The Park people).
-2
g) Mitigation: Where disputes over land tenure, ownership or access/use rights exist, documented evidence is provided that projects have implemented activities to resolve the disputes or clarify overlapping claims. -2
Total Land Tenure [(a o b) + c + d + e + f + g]
POLITICAL RISK (PC)
a) Governance score of less than -0.79 6
b) Governance score of -0.79 to less than -0.32 4
c) Governance score of -0.32 to less than 0.19 2
d) Governance score of 0.19 to less than 0.82 1
e) Governance score of 0.82 or higher 0
f) Mitigation: Country is implementing REDD+ readiness or other activities. 0
Total Political risk [(a, b, c, d o e) + f]
RISKS RELATED TO COMMUNITY ENGAGEMENT (CE)
a)
Less than 50 percent of households living within the project area, who are reliant on the project area, have been consulted. 10
No, a workshop on mooring was given in the park. As it is a feasibility study it is not necessary, but when the need for the project arises, the people in the area will be consulted.
b) Less than 20 percent of households living within 20 km of the project boundary outside the project area, and who are reliant on the project area, have been consulted. 5
c)
Mitigation: The project generates net positive impacts on the social and economic well-being of the local communities who derive livelihoods from the project area. -5
Yes
Total Community Engagement [a+ b + c]
TOTAL EXTERNAL RISK
Total External Risk (LT + CE + PC)

151
Natural risks All natural hazards that have occurred during the past 100 years must be assessed according to the following table, taking their likelihood of occurrence and level of significance into account.
GUIDELINE FOR DETERMINING NATURAL RISKS
SIGNIFICANCE
LIKELIHOOD
Less than or every 10
years
Every 10 to less than 25 years
Every 25 to less
than 50 years
Every 25 to less
than 50 years
Once every 100 years or more, or risk is not
applicable
CATASTROPHIC (70% or more loss of carbon stocks) Fail 30 20 5 0
DEVASTATING (50% to less than 70% loss of carbon stocks) 30 20 5 2 0
MAJOR (25% to less than 50% loss of carbon stocks) 20 5 2 1 0
MINOR (5% to less than 25% loss of carbon stocks) 5 2 1 1 0
INSIGNIFICANT (less than 5% loss of carbon stocks) or transient (full recovery of lost carbon stocks expected within 10 years of any event).
2 1 1 0 0
NO LOSS 0 0 0 0 0
MITIGATION (M)
Prevention measures applicable to the risk factor are implemented.
Project proponent has proven history of effectively containing natural risk.
Both of the above.
None of the above. 1
Total Natural Risks (F + PD + W+ G + ON)
Score for each natural risk applicable to the project (Multiplying LS x M)
Fire (F)
Pest and Disease outbreaks (PD)
Extreme weather (W)
Geological risk (G)
Other natural risk (ON)
Total Natural Risks (F + PD + W+ G + ON)

FEASIBILITY STUDY FOR PREPARATION OF CARBON OFFSETTING PROJECTS
152 152
ANNEX 3ANALYSIS OF NATURAL REGENERATION IN THE STUDY AREASTo determine the evolution of vegetation dynamics observed in the project areas, these need to be monitored over a sufficiently long historical period. Data detected by an earth observation satellite were used for this purpose.
The data used were captured by the National Aeronautics and Space Administration’s (NASA) TERRA Earth observation satellite which is equipped with the Moderate Resolution Imaging Spectroradiometer (MODIS). This instrument captures terrestrial surface data over 36 spectral bands daily, improving our understanding of global dynamics and processes occurring on land and in the oceans and lower atmosphere. MODIS is playing a vital role in the development of interactive, global and validated models of Earth systems. capable of predicting global change with sufficient precision to help policy makers make sound decisions on protection of our environment.
We have daily data from the MODIS-Terra instrument from the surface of the planet from late 2000 until now. This makes it a data series of incalculable scientific value.
The data captured by this sensor cover various ranges of the electromagnetic spectrum from the visible spectrum to the thermal infrared. Some of the spectral bands are especially useful for monitoring vegetation, such as visible and near-infrared channels. Indices, such as the Normalised Difference Vegetation Index (NDVI), which establish significant correlations with biomass content, the degree of plant cover and the vigour of the vegetation, can be obtained from this data.
Global MODIS vegetation indices are designed to provide consistent spatial and temporal comparisons of vegetation conditions. Blue, red, and near-infrared reflectances, centred at 469-nanometres, 645-nanometres, and 858-nanometres, respectively, are used to determine the MODIS daily vegetation indices.
The MODIS Normalised Difference Vegetation Index (NDVI) complements NOAA’s Advanced Very High Resolution Radiometer (AVHRR), providing continuity for time series applications over this rich historical archive. The MODIS NDVI product is computed from atmospherically-corrected bi-directional surface reflectances that have been masked for water, clouds, heavy aerosols and cloud shadows.
Global MOD13Q1 data are provided every 16 days at 250-metre spatial resolution as a gridded level 3 product in the sinusoidal projection. Cloud-free global coverage is achieved by replacing clouds with the historical MODIS time series climatology record. Vegetation indices are used for global monitoring of vegetation conditions and are used in products displaying land cover and land cover changes. These data can be used as input for modelling global biogeochemical and hydrological processes and global and regional climate. These data can also be used for characterising land surface biophysical properties and processes, including primary production and land cover conversion.
The NDVI data obtained from the MOD13Q1 product for the 2000-2017 period for the study area was processed.
To eliminate random noise associated with the data and obtain a consistent time series, the non-parametric smoothing filter 4253H-Twice (Velleman, 1975) was applied.

153
ANNEX 4DETERMINATION OF THE ABANDONED STATE OF PROJECT AREAS
One of the conditions imposed by the VM0033 methodology for its applicability refers to the conditions that the project area has to fulfil with respect to land uses capable of being displaced outside the project area due to its purpose.
In this regard, the criterion required by the methodology refers to the abandonment of the project area for more than two years with respect to land uses.
It must therefore be demonstrated that the project area has not had any specific land use for at least two years, i.e. that it fulfils the condition of abandonment with respect to land uses.
Observations made by earth observation satellites were used to determine whether the project areas meet this condition. These data enabled us to assess the conditions of each of the project areas over different time periods and thus be able to detect if any land use is taking place that could be capable of being displaced from the project area for reasons related to its objectives.
To do this, data observed by the Sentinel 2 Earth observation satellites operating under the Copernicus Earth observation programme, led by the European Commission (EC) in collaboration with the European Space Agency (ESA), were used. False colour images were obtained using these data, representing spectral channels corresponding to near infrared (842 nm), red (665 nm) and green (560 nm).

FEASIBILITY STUDY FOR PREPARATION OF CARBON OFFSETTING PROJECTS
154 154
ANNEX 5ESTIMATION OF THE SEA LEVEL INCREASE RATE OBSERVED BY AREAS
To estimate the sea level rise rate observed from the data from the two tide gauges, an analysis of the following time periods has been carried out:
• Huelva 5: the period 1996 - 2016 has been taken. The data corresponding to later dates have not been used in the analysis because they are data received in real time and there is no passed an exhaustive quality control that involves the elimination of abnormal values, as well as the control of the stability of the references or of the time offsets.
• Bonanza 2: the period 1992 - 2016 has been taken. The data corresponding to later dates have not been used in the analysis because they are data received in real time and there is no passed an exhaustive quality control that involves the elimination of abnormal values, as well as the control of the stability of the references or of the time offsets.
The calculation of the sea level trend has been made from the monthly data observed. To do this, the ave-rage of the hourly observations has been calculated for each of the months that make up the established data series.
The following Figure represents the trend observed for the Huelva 5 tide gauge:
A multi-temporal comparison of the images generated shows possible alterations due to possible land uses on the structure of the terrain and the vegetation in the project areas.
Following it is a demonstrative example.
False color images corresponding to the days 06/06/2016 (top image) and 03/13/2019 (image bottom) for the North Bank Guadalete river Area. In these images, it
can be observed no indications of land uses that could be affected by the object of the project. Between both dates, no significant changes are detected in the plant and terrain structure beyond those changes seasonal
accused by the vegetation itself.

155
Carrying out a linear regression on the data series, it was obtained the following line:
y = 0.019x * 199.535 R2 = 0.034
Annual rate of increase = 0.222 cm/year.Slope uncertainty = 0.153
Carrying out a linear regression on the data series, it was obtained the following line:
y = 0.032x * 167.730 R2 = 0.125
Annual rate of increase = 0.384 cm/year.Slope uncertainty = 0.119.
With this information, it was calculated the monthly average data from the daily data observed correspon-ding to the Huelva 5 and Bonanza 2 tide gauges.
The following Figure represents the trend observed for the Bonanza 2 tide gauge:
Average Monthly Period 1996-2016
Average Monthly Period 1992-2016

FEASIBILITY STUDY FOR PREPARATION OF CARBON OFFSETTING PROJECTS
156 156
ANNEX 6. INCOHERENCE DETECTIONIN THE AVAILABLE MDT
During the analysis phase of the information referring to the available altitude terrain models for each of the action areas, errors have been detected in the spatial distribution of altitudes of the MDTs. The MDTs affected are those corresponding to zone 2 of Cádiz (Marismas de San Carlos and San Jaime). Both in the local DTMs (1 m resolution) and in those from the PNOA (Lidar flight with resolution of 5 meters) a linear jump is detected in which there is a lag between contiguous pixels.
In order to correct this error, an analysis has been carried out on said MDT tiles that allow estimating the average value of the "jump" detected.
To do this, two sets of pixels (made up of 72 pixels) located at both sides of the cut and located both on a surface without significant variation in altitude have been taken. The reference point taken in this case corresponds to a track located at the edge of the analysis area.
The results obtained are the following:
The estimated difference between both parts of the DTM is 0.16 cm.
Once the simulations corresponding to the analysis of the potential distribution of the different marsh types, it was concluded that it did not have a significant influence on the result due to this error. For both, and since it is unknown which of the two groups of pixels represents the altitude values with greater reliability, no action has been proposed to correct the error.
In the area of action corresponding to the El Burro Salt Marshes, inconsistencies have been detected in the MDT from PNOA LIDAR available. During the fieldwork phase, the area in question was observed under spring tidal conditions, detecting flooding by tidal flow over certain areas. However, the altimetric values that appear in the DTM maintained levels higher than the theoretical values set by the tide gauge. The observed difference is greater than 0.5 cm in many cases. For on the other hand, inconsistencies are observed in the MDT due to the correction of the Surface Model (MDS) coming from Lidar detection. In this case, cyear zones with higher altimetric levels are observed to adjacent areas, with differences equivalent to the height of the vegetation. This fact, together with the possible previous error by excess, make the values of the MDT higher than the real ones, generating errors in the estimation of the potential areas for the different types of marsh.
South North Difference
Nº pixels 48.00 48.00 —
Minimum 2.44 2.64 —
Maximum 3.44 3.63 —
Average 3.18 3.35 0.16
Standard Deviation 0.23 0.22 —

157
ANNEX 7. INTERVENTION MEASURES

FEASIBILITY STUDY FOR PREPARATION OF CARBON OFFSETTING PROJECTS
158 158

159

FEASIBILITY STUDY FOR PREPARATION OF CARBON OFFSETTING PROJECTS
160 160

161

FEASIBILITY STUDY FOR PREPARATION OF CARBON OFFSETTING PROJECTS
162 162

163
ANNEX 8ESTIMATION OF EMISSIONS IN THE AREASOF ACTION: BASELINE AND POST SCENARIO AFTER RESTORATION ACTIONS
To carry out the calculations of CO2, CH4 and N2O, it was considered those surfaces within intervention that are significantly disconnected of the tidal regime and those other surfaces that maintain a certain regime of connection with the tidal regime. These surfaces have been determined within each area of action by photo-interpretation, identifying those that were currently devoid of vegetation and in a situation of maximum degradation.
The references taken to estimate the emissions of greenhouse gases from the soil, as well as the accumulation of aerial biomass are detailed in the corresponding section.
In order to calculate the emissions in the scenario after the actions, it was taken the premise the total re-humidification of the areas that currently lack water connection.
The reference parameters used to calculate the emissions in each one of the areas of intervention, are shown in detail.
The following tables show the reference parameters used to estimate the emissions of the base scenario in each of the intervention areas.

FEASIBILITY STUDY FOR PREPARATION OF CARBON OFFSETTING PROJECTS
164 164
CADIZ BAY. AREA 1. NORTH BANK OF THE RIVER GUADALETEbaseline scenario
CADIZ BAY. Area 2. RIVER SAN PEDRO CUTbaseline scenario
CADIZ BAY. Area 3. LAS ALETASbaseline scenario
SOIL BIOMASS
TOTAL EMISSIONSC-CH4-N2OCO2
Fluxes of CO2
CH4 Emissions CH4
N2O Emissions N2O
CO2 (herbaceous vegetation) Net carbon CO2 change
(tCO2/ha*año) (tCO2/año) (tCO2e/ha*año) (tCO2e/año) (tCO2e/ha*año) (tCO2e/año) (tC/ha*año) (tC/año) (tCO2e/año) (tCO2e/ha*año)
12.80 729.60 0.01 0.83 0.01 0.63 0.00 0.00 731.06 12.83
-0.92 -90.06 0.01 1.43 0.01 1.08 0.00 0.00 -87.55 -0.89
0.00 0.00 0.00 0.00 0.00 0.00 0.00 0.00 0.00 0.00
TOTAL: SURFACE WITHOUT VEGETATION + VEGETATED AREA + CONSTRUCTIONS 324.84 11.76
SOIL BIOMASS
TOTAL EMISSIONSC-CH4-N2OCO2
Fluxes of CO2
CH4 Emissions CH4
N2O Emissions N2O
CO2 (herbaceous vegetation) Net carbon CO2 change
(tCO2/ha*año) (tCO2/año) (tCO2e/ha*año) (tCO2e/año) (tCO2e/ha*año) (tCO2e/año) (tC/ha*año) (tC/año) (tCO2e/año) (tCO2e/ha*año)
12.80 163.33 0.22 2.77 0.00 0.01 0.00 0.00 166.11 13.02
-0.92 -12.08 0.22 2.85 0.00 0.01 0.00 0.00 -9.22 -0.70
TOTAL: SURFACE WITHOUT VEGETATION + VEGETATED AREA 156.88 12.32
SOIL BIOMASS
TOTAL EMISSIONSC-CH4-N2OCO2
Fluxes of CO2
CH4 Emissions CH4
N2O Emissions N2O
CO2 (herbaceous vegetation) Net carbon CO2 change
(tCO2/ha*año) (tCO2/año) (tCO2e/ha*año) (tCO2e/año) (tCO2e/ha*año) (tCO2e/año) (tC/ha*año) (tC/año) (tCO2e/año) (tCO2e/ha*año)
12.80 2490.88 0.22 42.23 0.00 0.14 0.00 0.00 2,533.24 13.02
-0.92 -14.04 0.22 3.31 0.00 0.01 0.00 0.00 -10.72 -0.70
TOTAL: SURFACE WITHOUT VEGETATION + VEGETATED AREA 2,522.53 12.32
Code: M. OFF. FLOWStratum: Surface disconnected from flow and devoid of vegetationSURFACE WITHOUT VEGETATION: 57.00 ha
Code: M. ALTERED REGIMEStratum: Surface with different degree of flow alteration and variable vegetation cover (ODB.Z)VEGETATED AREA: 97.89 ha
Code: NO MARSHLANDStratum: Surface not occupied by marshCONSTRUCTIONS: 0.10 ha
Code: M. OFF. FLOWStratum: Surface disconnected from flow and devoid of vegetationSURFACE WITHOUT VEGETATION: 12.76 ha
Code: M. ALTERED REGIME Stratum: Surface with different degree of flow alteration and variable vegetation cover (ODB.Z)VEGETATED AREA: 13.13 ha
Code: M. OFF. FLOWStratum: Surface disconnected from flow and devoid of vegetationSURFACE WITHOUT VEGETATION: 194.60 ha
Code: M. ALTERED REGIME Stratum: Surface with different degree of flow alteration and variable vegetation cover (ODB.Z)VEGETATED AREA: 15.26 ha

165
ODIEL SALT MARSHES . ZONA 1. ISLA DE BACUTAbaseline scenario
ODIEL SALT MARSHES . AREA 2. EL BURRO SALT MARSHESbaseline scenario
ODIEL SALT MARSHES . AREA 3. OLD INDUSTRIAL SALT PONDSbaseline scenario
SOIL BIOMASS
TOTAL EMISSIONSC-CH4-N2OCO2
Fluxes of CO2
CH4 Emissions CH4
N2O Emissions N2O
CO2 (herbaceous vegetation) Net carbon CO2 change
(tCO2/ha*año) (tCO2/año) (tCO2e/ha*año) (tCO2e/año) (tCO2e/ha*año) (tCO2e/año) (tC/ha*año) (tC/año) (tCO2e/año) (tCO2e/ha*año)
12.80 337.28 0.00 0.00 0.00 0.00 0.00 0.00 337.28 12.80
-1.04 -12.44 0.00 0.00 0.00 0.00 0.00 0.00 -12.44 -1.04
TOTAL: SURFACE WITHOUT VEGETATION + VEGETATED AREA 324.84 11.76
SOIL BIOMASS
TOTAL EMISSIONSC-CH4-N2OCO2
Fluxes of CO2
CH4 Emissions CH4
N2O Emissions N2O
CO2 (herbaceous vegetation) Net carbon CO2 change
(tCO2/ha*año) (tCO2/año) (tCO2e/ha*año) (tCO2e/año) (tCO2e/ha*año) (tCO2e/año) (tC/ha*año) (tC/año) (tCO2e/año) (tCO2e/ha*año)
12.80 10.50 1.60 1.31 1.40 1.15 0.00 0.00 12.95 15.80
-0.89 -1.80 1.60 3.22 1.40 2.83 0.00 0.00 4.25 2.11
TOTAL: SURFACE WITHOUT VEGETATION + VEGETATED AREA 17.21 17.90
SOIL BIOMASS
TOTAL EMISSIONSC-CH4-N2OCO2
Fluxes of CO2
CH4 Emissions CH4
N2O Emissions N2O
CO2 (herbaceous vegetation) Net carbon CO2 change
(tCO2/ha*año) (tCO2/año) (tCO2e/ha*año) (tCO2e/año) (tCO2e/ha*año) (tCO2e/año) (tC/ha*año) (tC/año) (tCO2e/año) (tCO2e/ha*año)
12.80 123.65 0.00 0.00 0.00 0.00 0.00 0.00 123.65 12.80
-1.04 -2.12 0.00 0.00 0.00 0.00 0.00 0.00 -2.12 -1.04
TOTAL: SURFACE WITHOUT VEGETATION + VEGETATED AREA 121.53 11.76
Code: M. OFF. FLOWStratum: Superficie desconectada de flujo y desprovista de vegetaciónSURFACE WITHOUT VEGETATION: 26.35 ha
Code: M. ALTERED REGIME Stratum: Surface with different degree of flow alteration and variable vegetation cover (ODB.Z)VEGETATED AREA: 11.96 ha
Code: M. OFF. FLOWStratum: Surface disconnected from flow and devoid of vegetationSURFACE WITHOUT VEGETATION: 0.82 ha
Code: M. ALTERED REGIME Stratum: Surface with different degree of flow alteration and variable vegetation cover (ODB.Z)VEGETATED AREA: 2.02 ha
Code: M. OFF. FLOWStratum: Surface disconnected from flow and devoid of vegetationSURFACE WITHOUT VEGETATION: 9.66 ha
Code: M. ALTERED REGIME Stratum: Surface with different degree of flow alteration and variable vegetation cover (ODB.Z)VEGETATED AREA: 2.04 ha

FEASIBILITY STUDY FOR PREPARATION OF CARBON OFFSETTING PROJECTS
166 166
The following Tables show the reference parameters used to estimate the emissions of theproject scenario in each of the areas of intervention:
CADIZ BAY. Area 1. NORTH BANK OF THE RIVER GUADALETEproject scenario
CADIZ BAY. Area 2. RIVER SAN PEDRO CUTproject scenario
CADIZ BAY. Area 3. LAS ALETASproject scenario
SOIL BIOMASSTOTAL EMISSIONS
C-CH4-N2OCO2 Fluxes of CO2
CH4 Emissions CH4
N2O Emissions N2O
CO2 (herbaceous vegetation)
Net carbon CO2 change
(tCO2/ha*año) (tCO2/año)(tCO2e/
ha*año)(tCO2e/
año)(tCO2e/
ha*año) (tCO2e/
año) (tC/
ha*año) (tC/año) (tCO2e/año) (tCO2e/
ha*año)0-19 Years
29-49 Years
> 50 Years
0-19 Years
29-49 Years
> 50 Years
-3.82 -2.35 -2.39 -217.74 -133.95 -136.23 0.01 0.83 0.01 0.63 -0.42 -23.94 -216.70 -3.80
-3.82 -2.35 -2.39 -373.94 -230.04 -233.96 0.01 1.43 0.01 1.08 -0.42 -41.11 -371.43 -3.79
0.00 0.00 0.00 0.00 0.00 0.00 0.00 0.00 0.00 0.00 0.00 0.00 0.00 0.00
TOTAL: SURFACE WITHOUT VEGETATION + VEGETATED AREA + CONSTRUCTIONS -588.13 -7.60
SOIL BIOMASSTOTAL EMISSIONS
C-CH4-N2OCO2 Fluxes of CO2
CH4 Emissions CH4
N2O Emissions N2O
CO2 (herbaceous vegetation)
Net carbon CO2 change
(tCO2/ha*año) (tCO2/año)(tCO2e/
ha*año)(tCO2e/
año)(tCO2e/
ha*año) (tCO2e/
año) (tC/
ha*año) (tC/año) (tCO2e/año) (tCO2e/
ha*año)0-19 Years
29-49 Years
> 50 Years
0-19 Years
29-49 Years
> 50 Years
-3.82 -2.35 -2.39 -48.74 -29.99 -30.50 0.22 2.77 0.00 0.01 -0.42 -5.36 -46.39 -3.64
-3.82 -2.35 -2.39 -50.16 -30.86 -31.38 0.22 2.85 0.00 0.01 -0.42 -5.51 -47.30 -3.60
TOTAL: SURFACE WITHOUT VEGETATION + VEGETATED AREA -93.68 -7.24
SOIL BIOMASSTOTAL EMISSIONS
C-CH4-N2OCO2 Fluxes of CO2
CH4 Emissions CH4
N2O Emissions N2O
CO2 (herbaceous vegetation)
Net carbon CO2 change
(tCO2/ha*año) (tCO2/año)(tCO2e/
ha*año)(tCO2e/
año)(tCO2e/
ha*año) (tCO2e/
año) (tC/
ha*año) (tC/año) (tCO2e/año) (tCO2e/
ha*año)0-19 Years
29-49 Years
> 50 Years
0-19 Years
29-49 Years
> 50 Years
-3.82 -2.35 -2.39 -743.37 -457.31 -465.09 0.22 42.23 0.00 0.14 -0.42 -81.73 -701.43 -3.60
-3.82 -2.35 -2.39 -58.29 -35.86 -36.47 0.22 3.31 0.00 0.01 -0.42 -6.41 -54.97 -3.60
TOTAL: SURFACE WITHOUT VEGETATION + VEGETATED AREA -756.40 -7.21
Code: M. OFF. FLOWStratum: Surface disconnected from flow and devoid of vegetationSURFACE WITHOUT VEGETATION: 12,76 ha
Code: M. ALTERED REGIMEStratum: Surface with different degree of flow alteration and variable vegetation coverVEGETATED AREA: 13,13 ha
Code: M. OFF. FLOWStratum: Surface disconnected from flow and devoid of vegetationSURFACE WITHOUT VEGETATION: 194.60 ha
Code: M. ALTERED REGIMEStratum: Surface with different degree of flow alteration and variable vegetation coverVEGETATED AREA: 15.26 ha
Code: M. OFF. FLOWStratum: Surface disconnected from flow and devoid of vegetationSURFACE WITHOUT VEGETATION: 57.00 ha
Code: M. ALTERED REGIMEStratum: Surface with different degree of flow alteration and variable vegetation coverVEGETATED AREA:: 97.89 ha
Code: NO MARISMA Stratum: Surface not occupied by marshCONSTRUCTIONS: 0.10 ha

167
ODIEL SALT MARSHES . AREA 1. ISLA DE BACUTAproject scenario
ODIEL SALT MARSHES . AREA 2. EL BURRO SALT MARSHESproject scenario
ODIEL SALT MARSHES . AREA 3. OLD INDUSTRIAL SALT PONDSproject scenario
SOIL BIOMASSTOTAL EMISSIONS
C-CH4-N2OCO2 Fluxes of CO2
CH4 Emissions CH4
N2O Emissions N2O
CO2 (herbaceous vegetation)
Net carbon CO2 change
(tCO2/ha*año) (tCO2/año)(tCO2e/
ha*año)(tCO2e/
año)(tCO2e/
ha*año) (tCO2e/
año) (tC/
ha*año) (tC/año) (tCO2e/año) (tCO2e/
ha*año)0-19 Years
29-49 Years
> 50 Years
0-19 Years
29-49 Years
> 50 Years
-3.82 -2.35 -2.39 -100.66 -61.92 -62.98 0.00 0.00 0.00 0.00 -0.42 -11.07 -101.08 -3.84
-3.82 -2.35 -2.39 -45.69 -28.11 -28.58 0.00 0.00 0.00 0.00 -0.42 -5.02 -45.69 -3.82
TOTAL: SURFACE WITHOUT VEGETATION + VEGETATED AREA -146.76 -7.66
SOIL BIOMASSTOTAL EMISSIONS
C-CH4-N2OCO2 Fluxes of CO2
CH4 Emissions CH4
N2O Emissions N2O
CO2 (herbaceous vegetation)
Net carbon CO2 change
(tCO2/ha*año) (tCO2/año)(tCO2e/
ha*año)(tCO2e/
año)(tCO2e/
ha*año) (tCO2e/
año) (tC/
ha*año) (tC/año) (tCO2e/año) (tCO2e/
ha*año)0-19 Years
29-49 Years
> 50 Years
0-19 Years
29-49 Years
> 50 Years
-3.82 -2.35 -2.39 -3.13 -1.93 -1.96 0.22 0.18 0.01 0.01 -0.42 -0.34 -3.37 -4.10
-3.82 -2.35 -2.39 -7.72 -4.75 -4.83 0.22 0.44 0.01 0.02 -0.42 -0.85 -7.26 -3.59
TOTAL: SURFACE WITHOUT VEGETATION + VEGETATED AREA -10.62 -7.70
SOIL BIOMASSTOTAL EMISSIONS
C-CH4-N2OCO2 Fluxes of CO2
CH4 Emissions CH4
N2O Emissions N2O
CO2 (herbaceous vegetation)
Net carbon CO2 change
(tCO2/ha*año) (tCO2/año)(tCO2e/
ha*año)(tCO2e/
año)(tCO2e/
ha*año) (tCO2e/
año) (tC/
ha*año) (tC/año) (tCO2e/año) (tCO2e/
ha*año)0-19 Years
29-49 Years
> 50 Years
0-19 Years
29-49 Years
> 50 Years
-3.82 -2.35 -2.39 -36.90 -22.70 -23.09 0.00 0.00 0.00 0.00 -0.42 -4.06 -37.32 -3.86
-3.82 -2.35 -2.39 -7.79 -4.79 -4.88 0.00 0.00 0.00 0.00 -0.42 -0.86 -7.79 -3.82
TOTAL: SURFACE WITHOUT VEGETATION + VEGETATED AREA -45.11 -7.68
Code: M. OFF. FLOWStratum: Surface disconnected from flow and devoid of vegetationSURFACE WITHOUT VEGETATION: 26.35 ha
Code: M. ALTERED REGIMEStratum: Surface with different degree of flow alteration and variable vegetation coverVEGETATED AREA: 11.96 ha
Code: M. OFF. FLOWStratum: Surface disconnected from flow and devoid of vegetationSURFACE WITHOUT VEGETATION: 0.82 ha
Code: M. ALTERED REGIMEStratum: Surface with different degree of flow alteration and variable vegetation coverVEGETATED AREA: 2.02 ha
Code: M. OFF. FLOWStratum: Surface disconnected from flow and devoid of vegetationSURFACE WITHOUT VEGETATION: 9.66 ha
Code: M. ALTERED REGIMEStratum: Surface with different degree of flow alteration and variable vegetation coverVEGETATED AREA: 2.04 ha

FEASIBILITY STUDY FOR PREPARATION OF CARBON OFFSETTING PROJECTS
168 168
ANNEX 9. FINANCIAL INDICATORS
Projectcost(Euro)Validation/Verification(Simultaneous)MonitoringEmissionfeeTotal
PDDDevelopmentVerificationRegistrationFee(Euro)TransferRate-Saleofcredits(Euro)
Projectcost(Euro)Validation/Verification(Simultaneous)MonitoringEmissionfeeTotal
PDDDevelopmentVerificationRegistrationFee(Euro)TransferRate-Saleofcredits(Euro)
Projectcost(Euro)Validation/Verification(Simultaneous)MonitoringEmissionfeeTotal
PDDDevelopmentVerificationRegistrationFee(Euro)TransferRate-Saleofcredits(Euro)
CADIZ BAY. Area 1. NORTH BANK OF THE RIVER GUADALETE
CADIZ BAY. Area 2. RIVER SAN PEDRO CUT
CADIZ BAY. Area 3. LAS ALETAS
OPTION A - COSTES
100,000
50,000
200,000
150,000
00 2 5 7 10 12 15
Years
Euros
40,000
20,000
70,000
50,000
30,000
10,000
60,000
00 2 5 7 10 12 15
Years
Euros
100,000
50,000
200,000
150,000
00 2 5 7 10 12 15
Years
Euros

169
OPTION A - VAN
CADIZ BAY. Area 1. NORTH BANK OF THE RIVER GUADALETE
CADIZ BAY. Area 2. RIVER SAN PEDRO CUT
CADIZ BAY. Area 3. LAS ALETAS
100,00050,000
-50,000-100,000-150,000
00 2 5 7 10 12 15
- 200,000- 250,000
Years
Euros
0-20,000
-60,000-80,000
-100,000
-40,000
0 2 5 7 10 12 15
- 120,000- 140,000
Years
Euros
500,000
800,000
400,000
700,000
200,000100,000
0
300,000
600,000
0 2 5 7 10 12 15- 100,000- 200,000
Years
Euros

FEASIBILITY STUDY FOR PREPARATION OF CARBON OFFSETTING PROJECTS
170 170
Projectcost(Euro)Validation/Verification(Simultaneous)MonitoringEmissionfeeTotal
PDDDevelopmentVerificationRegistrationFee(Euro)TransferRate-Saleofcredits(Euro)
Projectcost(Euro)Validation/Verification(Simultaneous)MonitoringEmissionfeeTotal
PDDDevelopmentVerificationRegistrationFee(Euro)TransferRate-Saleofcredits(Euro)
Projectcost(Euro)Validation/Verification(Simultaneous)MonitoringEmissionfeeTotal
PDDDevelopmentVerificationRegistrationFee(Euro)TransferRate-Saleofcredits(Euro)
ODIEL SALT MARSHES. Area 1. ISLA DE BACUTA
ODIEL SALT MARSHES. Area 2. EL BURRO SALT MARSHES
ODIEL SALT MARSHES. Area 3. OLD INDUSTRIAL SALT PONDS
OPTION A - COSTES
40,000
20,000
50,000
30,000
10,000
00 2 5 7 10 12 15 17
Years
Euros
40,000
20,000
50,000
30,000
10,000
00 2 5 7 10 12 15 17
Years
Euros
40,000
20,000
120,000
100,000
80,000
60,000
0
Years
Euros
0 2 5 7 10 12 25 30 40 4815 20

171
OPTION A - VAN
ODIEL SALT MARSHES. Area 1. ISLA DE BACUTA
ODIEL SALT MARSHES. Area 2. EL BURRO SALT MARSHES
ODIEL SALT MARSHES. Area 3. OLD INDUSTRIAL SALT PONDS
200,000150,000
50,0000
-50,000
100,000
- 100,000- 150,000
Years
Euros
0 2 5 7 10 12 25 30 40 4815 20
0-20,000
-60,000-80,000
-100,000
-40,000
0 2 5 7 10 12 15 17
- 120,000- 140,000- 160,000
Years
Euros
0-20,000
-60,000-80,000
-100,000
-40,000
0 2 5 7 10 12 15 17
- 120,000
Years
Euros

FEASIBILITY STUDY FOR PREPARATION OF CARBON OFFSETTING PROJECTS
172 172
Projectcost(Euro)Validation/Verification(Simultaneous)MonitoringEmissionfeeTotal
PDDDevelopmentVerificationRegistrationFee(Euro)TransferRate-Saleofcredits(Euro)
Projectcost(Euro)Validation/Verification(Simultaneous)MonitoringEmissionfeeTotal
PDDDevelopmentVerificationRegistrationFee(Euro)TransferRate-Saleofcredits(Euro)
Projectcost(Euro)Validation/Verification(Simultaneous)MonitoringEmissionfeeTotal
PDDDevelopmentVerificationRegistrationFee(Euro)TransferRate-Saleofcredits(Euro)
OPTION B - COSTES
CADIZ BAY. Area 1. NORTH BANK OF THE RIVER GUADALETE
CADIZ BAY. Area 2. RIVER SAN PEDRO CUT
CADIZ BAY. Area 3. LAS ALETAS
100,000
50,000
200,000
150,000
00 2 5 7 10 12 15
Years
Euros
100,000
50,000
200,000
150,000
00 2 5 7 10 12 15
Years
Euros
40,000
20,000
70,000
50,000
30,000
10,000
60,000
00 2 5 7 10 12 15
Years
Euros

173
OPTION B - VAN
CADIZ BAY. Area 1. NORTH BANK OF THE RIVER GUADALETE
CADIZ BAY. Area 2. RIVER SAN PEDRO CUT
CADIZ BAY. Area 3. LAS ALETAS
500,000
800,000
400,000
700,000
200,000100,000
0
300,000
600,000
0 2 5 7 10 12 15- 100,000- 200,000
Years
Euros
100,00050,000
-50,000-100,000-150,000
00 2 5 7 12 15
- 200,000Years
Euros
10
-95,000
-100,000
-105,000
-90,0000 2 5 7 10 12 15
- 110,000
- 115,000Years
Euros

FEASIBILITY STUDY FOR PREPARATION OF CARBON OFFSETTING PROJECTS
174 174
Projectcost(Euro)Validation/Verification(Simultaneous)MonitoringEmissionfeeTotal
PDDDevelopmentVerificationRegistrationFee(Euro)TransferRate-Saleofcredits(Euro)
Projectcost(Euro)Validation/Verification(Simultaneous)MonitoringEmissionfeeTotal
PDDDevelopmentVerificationRegistrationFee(Euro)TransferRate-Saleofcredits(Euro)
Projectcost(Euro)Validation/Verification(Simultaneous)MonitoringEmissionfeeTotal
PDDDevelopmentVerificationRegistrationFee(Euro)TransferRate-Saleofcredits(Euro)
ODIEL SALT MARSHES. Area 1. ISLA DE BACUTA
ODIEL SALT MARSHES. Area 2. EL BURRO SALT MARSHES
ODIEL SALT MARSHES. Area 3. OLD INDUSTRIAL SALT PONDS
OPTION B - COSTES
40,000
20,000
60,000
50,000
30,000
10,000
00 2 5 7 10 12 15 17
Years
Euros
40,000
20,000
60,000
70,000
50,000
30,000
10,000
00 2 5 7 10 12 15 17
Years
Euros
40,000
20,000
120,000
100,000
80,000
60,000
0
Years
Euros
0 2 5 7 10 12 25 30 40 4815 20

175
OPTION B - VAN
ODIEL SALT MARSHES. Area 1. ISLA DE BACUTA
ODIEL SALT MARSHES. Area 2. EL BURRO SALT MARSHES
ODIEL SALT MARSHES. Area 3. OLD INDUSTRIAL SALT PONDS
200,000150,000
50,0000
-50,000
100,000
- 100,000- 150,000
Years
Euros
0 2 5 7 10 12 25 30 40 4815 20
0-20,000
-60,000-80,000
-100,000
-40,000
0 2 5 7 10 12 15 17
- 120,000- 140,000
Years
Euros
0-10,000
-30,000
-70,000
-40,000
-80,000
-50,000
-90,000
-20,000
0 2 5 7 10 12 15 17
- 60,000
- 100,000Years
Euros

FEASIBILITY STUDY FOR PREPARATION OF CARBON OFFSETTING PROJECTS
176 176
200,000
400,000
100,000
300,000
-100,000-200,000-300,000
0
0 2 5 7 10 12 15
- 400,000- 500,000- 600,000
Years
Euros
Projectcost(Euro)Validation/Verification(Simultaneous)MonitoringEmissionfeeTotal
PoA+CPAdevelopmentVerificationRegistrationFee(Euro)TransferRate-Saleofcredits(Euro)Income
200,000
600,000
400,000
00 2 5 7 10 12 15 20 25 30 40 47.62
Years
Euros
CADIZ BAY. All Areas
CADIZ BAY. All Areas
OPTION C - COSTES
OPTION C - VAN

177
100,00050,000
-50,000-100,000-150,000
0
0 2 5 7 10 12 15 20 25 30 40 47.62
- 200,000- 250,000
Years
Euros
Projectcost(Euro)Validation/Verification(Simultaneous)MonitoringEmissionfeeTotal
PoA+CPAdevelopmentVerificationRegistrationFee(Euro)TransferRate-Saleofcredits(Euro)Income
100,000
200,000
0
-100,000
0 2 5 7 10 12 15 20 25 30 40 47.62Years
Euros
ODIEL SALT MARSHES. All areas
ODIEL SALT MARSHES. All areas
OPTION C - VAN
OPTION C - COSTES

FEASIBILITY STUDY FOR PREPARATION OF CARBON OFFSETTING PROJECTS
178 178
Projectcost(€)Validation/Verification1MonitoringEmissionfee(optionA€)Total
PDDdevelopmentVerification+NRegistrationfee(€)Transferrate-Saleofcredits(optionA€)Income
200,000
600,000
400,000
00 2 5 7 10 12 15 20 25 30 40 48
Years
Euros
200,000
400,000
100,000
300,000
-100,000-200,000-300,000
0
- 400,000- 500,000
600,000
- 600,000
500,000
Years
Euros
0 2 5 7 10 12 15 20 25 30 40 48
CADIZ BAY + ODIEL SALT MARSHES
CADIZ BAY + ODIEL SALT MARSHES
OPTION D - INCOME VS COSTES
OPTION D - VAN

179 FEASIBILITY STUDY
ON CABO DE GATA SEAGRASS MEADOWS

INTERNATIONAL UNION FOR CONSERVATION OF NATURE
IUCN CENTRE FOR MEDITERRANEAN COOPERATIONCalle Marie Curie, 2229590 CampanillasMálaga, SpainTel.: +34 952 028430Fax.: +34 952 028145Email: [email protected]
www.iucn.org/resources/publicationswww.iucn.org/mediterranean
IUCNMed IUCN_Med


