FEASIBILITY STUDY & COST BENEFIT …tel_archives.ofca.gov.hk/en/report-paper-guide/report/...Usman...
193
FEASIBILITY STUDY & COST BENEFIT ANALYSIS OF NUMBER PORTABILITY FOR MOBILE SERVICES IN HONG KONG Final Report for OFTA Prepared by NERA and Smith System Engineering May 1998 London Project Team: NERA Nigel Attenborough Jonathan Sandbach Usman Saadat George Siolis Smith System Engineering Mark Cartwright Simon Dunkley SOFRES FSA National Economic Research Associates Economic Consultants 15 Stratford Place London W1N 9AF Tel: 0171 629 6787 Fax: 0171 493 5937 A Marsh & McLennan Company
Transcript of FEASIBILITY STUDY & COST BENEFIT …tel_archives.ofca.gov.hk/en/report-paper-guide/report/...Usman...

FEASIBILITY STUDY & COST BENEFITANALYSIS OF NUMBER PORTABILITY
FOR MOBILE SERVICESIN HONG KONG
Final Report for OFTA
Prepared by NERA andSmith System
Engineering
May 1998London
Project Team:NERA
Nigel AttenboroughJonathan Sandbach
Usman SaadatGeorge Siolis
Smith System EngineeringMark CartwrightSimon Dunkley
SOFRES FSA
National Economic Research AssociatesEconomic Consultants
15 Stratford PlaceLondon W1N 9AFTel: 0171 629 6787Fax: 0171 493 5937
A Marsh & McLennan Company

TABLE OF CONTENTS
EXECUTIVE SUMMARY i
1. INTRODUCTION 11.1. Terms Of Reference 11.2. Overview of Methodology 11.3. Structure of the Report 5
2. MOBILE SERVICES IN HONG KONG 72.1. Background 72.2. History of Mobile Communications in Hong Kong 72.3. Number Portability for Mobile Services 82.4. Fixed Network Number Portability in Hong Kong 92.5. International Experience with MNP 11
3. TECHNICAL IMPLEMENTATION OPTIONS 143.1. Background 143.2. Option selection criteria 153.3. The Need to Take Account of Effects on Operational Support Systems (OSS) 183.4. On-switch solutions 203.5. Off-switch solutions 283.6. Standardisation 44
4. THE COSTS OF INTRODUCING MNP 454.1. Introduction 454.2. Methodology 454.3. Options 56
5. BENEFITS OF MNP 665.1. Background 665.2. Type 1 Benefits 675.3. Type 2 Benefits 805.4. Type 3 Benefits 815.5. Summary 83
6. IMPLEMENTING MOBILE NUMBER PORTABILITY 856.1. Cost Benefit Analysis 856.2. Determining the Migration Path 866.3. Recommendations 876.4. Managing the Transition Between Solutions 906.5. Other solutions 906.6. Conclusion 91
7. RECOVERING THE COSTS OF MNP 927.1. Introduction 927.2. The Options for MNP in Hong Kong 92

7.3. General Principles for Cost Recovery 937.4. Cost Recovery in the Fixed Network in Hong Kong 947.5. The Views of Operators in Hong Kong 967.6. Cost Recovery for MNP in Hong Kong 977.7. Cost Recovery Under the Interim Call Forwarding Solution 1007.8. Cost Recovery Under the Distributed Database Solution 1047.9. Summary 107
APPENDIX A. THE BASE CASE 108
APPENDIX B. SWITCHING MODEL WITH MNP 122
APPENDIX C. TELECOMMUNICATIONS ENVIRONMENT IN HONG KONG 127
APPENDIX D. SURVEY RESULTS 133
APPENDIX E. CALCULATING THE COSTS OF MNP 144
APPENDIX F. CALCULATING THE BENEFITS OF MNP 151
APPENDIX G. SURVEY OF QUESTIONNAIRE FOR PERSONALSUBSCRIBERS AND SMES 155
APPENDIX H. SURVEY QUESTIONNAIRE FOR LARGE FIRMS 173
REF: Anne Lockyer/15/27-5-98/\\LNT1\USR\GEORGES\MSOFFICE\WINWORD\TELECOMS\HONGKONG PORT\REPORT\FINAL2705.DOC

Executive Summary
i
EXECUTIVE SUMMARY
1) In December 1997, the Office of the Telecommunications Authority (OFTA) in HongKong commissioned National Economic Research Associates (NERA) and SmithSystem Engineering to conduct a feasibility study and a cost benefit analysis ofmobile number portability (MNP). The main issues considered were:
• technical options for MNP in Hong Kong;
• costs of implementing MNP;
• demand for, and estimates of, MNP;
• options to recover the costs of portability.
2) This is the final report to OFTA. The assumptions made in this report to determinethe costs and benefits follow discussions we have had with the industry and othertelecommunications experts. This report also incorporates the comments receivedon the preliminary report which was presented to the industry in Hong Kong inFebruary 1998.
3) The mobile market in Hong Kong is currently very competitive. By the end of 1997,seven mobile operators operated eleven digital networks with over 2 millionsubscribers. The market shows signs of continued growth. We forecast that thepenetration rate will grow to 60 per cent in 2007.
4) OFTA believes that there is scope for future improvements. It considers theavailability of number portability as essential for the further development oftelecommunications in Hong Kong and for the delivery of enhanced benefits toconsumers.
5) We reviewed the technical options for Hong Kong and believe that MNP could beintroduced through call forwarding in 6-12 months. This would only be an interimsolution.
6) In the medium to long term, MNP could be implemented through a distributeddatabase solution with fixed network operators performing the look-up. HKTC(Hong Kong Telephone Company Limited), however, appears to be well placed toperform the look-up for all other operators as the vast majority of calls to and frommobile telephones pass through HKTC and HKTI’s (Hong Kong TelecomInternational Limited) networks. The existing infrastructure from the introductionof number portability in the fixed network would also help to expedite theintroduction of MNP. Over time, other operators could provide the numbertranslation services for themselves or other operators.
7) The costs of implementing mobile number portability vary according to the technical

Executive Summary
ii
option and migration path chosen. Depending on the assumptions made, however,we estimate that the NPV (Net Present Value) of costs of MNP lies between HK $512million and HK $1,044 million over 10 years. These estimates are based oninformation gained from interviews with operators and users in Hong Kong,relevant industry contacts, previous international studies and our knowledge of thetelecommunications industry.
8) A wide range of consumers will benefit from the MNP in Hong Kong. Mobilesubscribers will be able to switch operators and avoid the costs and inconvenienceassociated with a number change. Competition in the industry will be heightened asa barrier to switching is removed further benefiting residential and business users.Callers to mobile phone subscribers will be able to complete calls successfully inthose cases where the subscriber has changed their mobile operator. We havecaptured these benefits in the following categories:
• Type 1 benefits which accrue to subscribers who retain their telephonenumber when switching operator, and include:
- cost savings from not having to change mobile number; and
- cost savings from switching to more efficient operators.
• Type 2 benefits which are the efficiency improvements and any associatedprice reductions which result from increased competition;
• Type 3 benefits which are the savings as a result of there being fewer numberchanges.
9) There are also considerable benefits from the introduction of MNP. In total, the netpresent value of benefits ranges from HK$769 million, under our most pessimisticscenario, to over HK$1,396 million under our most optimistic scenario.
10) Our cost benefit analysis shows that there will be a net benefit to Hong Kong fromthe introduction of MNP. The introduction of an interim call forwarding solution -while involving slightly higher costs than a solution that moves straight to adistributed database - still returns net benefits for our central cases and under all ofour sensitivity tests.
11) In determining how the costs of MNP should be recovered, we have drawn on theprinciples developed by OFTA for fixed network portability. In short, under ourmedium term solution, we recommend that mobile operators pay a charge to fixednetwork operators to provide the look up service. The way the charge is determinedwill depend on the way the market develops. If none of the fixed operators wereprepared to offer a look-up service to all operators, then a fixed operator may needto be encouraged to provide the service. HKTC appears to be best placed to offer the

Executive Summary
iii
service if a competitive market could not develop. If HKTC is the only operatoroffering the look-up service or is requested to provide the service, then this chargewould need to be reviewed by OFTA and should be based on the long run averageincremental cost of the system set-up costs incurred by HKTC to upgrade itsdistributed database. If, however, a competitive market develops in the short term,then OFTA may consider leaving the charge to the market and commercialnegotiation.
12) Our reasoning is discussed in detail in Chapter 7 but can be summarised in theTable below.
Allocating the costs of MNP
Technology
Cost Call forwarding Distributed database
System set-up cost Each operator bears its own costs Fixed operators or HKTC to recoverits costs from all mobile operators
Additionalconveyance costs
Donor network operator to recoverinterconnect charge from recipient
network operator. Each operator tobear its own remaining costs
Fixed operators or HKTC to recoverits costs from all mobile operators
Per subscriber set-upcosts
Donor network operator to recoverfrom recipient network operator
Donor network operator to recoverfrom recipient network operator

Introduction
1
1. INTRODUCTION
This final report has been prepared by National Economic Research Associates (NERA) andSmith System Engineering (Smith) for the Office of the Telecommunications Authority(OFTA) in Hong Kong. This report is concerned with the introduction of mobile numberportability (MNP) for subscribers who move between mobile network operators in HongKong.
1.1. Terms Of Reference
The objectives of this consultancy were:
a) to identify all the possible technical options for the implementation of numberportability on all mobile networks. The technical options should address thetranslation and routing mechanisms of ported mobile number calls amongst mobilenetworks, the four Fixed Telecommunication Network Services (FTNS) operatorsand the Hong Kong Telecom International Limited (HKTI)international network;
b) to assess the costs, short-term and long-term viability and risks of each of thetechnical options identified in paragraph (a) above;
c) to evaluate the direct and indirect benefits to be gained from the introduction ofmobile number portability in Hong Kong;
d) to quantify the benefits identified under (c) as far as possible in order to arrive at thecost-benefit analysis for each technical option;
e) to make recommendations on the cost-recovery framework amongst mobileoperators, FTNS operators and HKTI under each technical option; and
f) to make recommendations on the implementation plan for mobile numberportability in Hong Kong.
1.2. Overview of Methodology
The cost-benefit analysis that we have carried out is described in more detail in Chapter 5and Appendix A. Here we provide an overview of the areas covered as part of the analysis,namely:
• specification of the base case;
• specification of the MNP case;
• identification and estimation of the benefits of MNP;
• estimation of the costs of MNP;
• treatment of costs and benefits from a national perspective;

Introduction
2
• recovery of the costs of MNP.
1.2.1. The base case
In order to estimate the likely costs and benefits of introducing MNP, it was necessary firstto specify a counterfactual case. In other words, to model what would happen in the mobiletelecommunications market in the absence of MNP. This required forecasts to be made ofmarket growth as well as changes in the market shares of the different types of mobilenetworks :Global Systems for Mobile communications (GSM), Personal CommunicationsServices (PCS), Time Division Multiple Access (TDMA) and Code Division Multiple Access(CDMA). These estimates were based on interviews with mobile network operators andconsumer groups in Hong Kong and also drew on available market data.
1.2.2. The MNP cases
If MNP is available, there will be more subscribers switching operators since subscribersrequire a lower level of savings to switch operators if they can retain their number and thusavoid the cost of a number change. Our modelling of the impact of MNP on switchingdecisions was largely informed by a user survey carried out by SOFRES of 1000 users ofmobile phones in Hong Kong. Comparison of the base and MNP cases reveals the numberof additional subscribers switching between operators because of the introduction of MNP.
1.2.3. Estimation of the benefits of MNP
Having established how many subscribers fall into the base case and MNP case scenarios,we used the survey results to estimate the benefits of MNP in general as well as the size ofbenefits available to different subscribers. These benefits were categorised into thefollowing groups:
• Type 1 benefits. These are defined as the benefits which accrue to subscribers whoretain their number when changing operators and included both the:
- switching costs saved by those who would have switched even withoutMNP; and
- the benefits of lower prices, better services etc. for those who move as a resultof MNP.
• Type 2 benefits. These are the efficiency improvements and any associated pricereductions which result from increased competitive pressure. These accrue tomobile subscribers in general.
• Type 3 benefits. These are the other resource savings that arise from fewer numberchanges and include fewer misdialled calls and changes to information stored incustomer equipment.

Introduction
3
1.2.4. Estimation of the costs of MNP
The cost of number portability can be directly or indirectly associated with different partiesaccording to whether work needs to be implemented by an individual operator, or whetherinefficiencies associated with the solution which lead to the cost are borne by the party. Theparties to whom these costs have been associated are:
• HKTC and HKTI: the costs associated with these networks have been groupedtogether and separated from those costs associated with the alternative FixedNetwork Operators (FNOs) because several of the migration options require HKTCand HKTI to carry out changes to their networks independent of the other operators;
• FNOs: fixed network operators other than HKTC and HKTI;
• Mobile operators: the costs associated with mobile operators will vary with factorssuch as number of customers, length of time in market and technology etc., but forthe purpose of this study the operators have been grouped into small and largemobile operators dependent upon whether the operator had more than 100,000subscribers in October 1997.
The costs incurred by customers can be divided into three types:
• Type A customer costs: are those incurred by mobile telephone users who wouldchange network operator, even if MNP were not available. These costs are nottherefore caused by MNP. In fact they are reduced by it (e.g. the need to informfriends is avoided) and these reductions in costs are treated as benefits (see Chapter5);
• Type B customer costs: are those incurred by mobile telephone users who would notchange network operator if MNP were not available. These include the costs of SIMcards, handset changes and other migration costs. These costs have been implicitlybeen netted out (i.e. treated as negative Type 1B benefits) in Chapter 5.
• Other customer costs: are those borne by customers making calls to mobiletelephones such as the extra dialling delay introduced by the MNP solutions.
In the discussion of the technical feasibility of the solutions and migration options, thenumber of realistic solutions to be considered in the medium-term has been reduced to arealistic sub-set of the options available. In the cost modelling work that has been carriedout, these options have been examined in some detail to assess the cost of the solutionsgiven realistic variations in the factors that affect these costs.
The number of implementation options available has been reduced to:
• call forwarding;
• call drop back;

Introduction
4
• distributed database look up in the fixed network only;
The main migration options that have been considered, and for which detailed sensitivityanalysis has been carried out, are:
• option 1: immediate roll-out of off-switch solution with database look-up in HKTC’snetwork;
• option 2: migration through call forwarding functionality to off-switch solution withdatabase look-up in HKTC’s network.
1.2.5. Treatment of costs and benefits from a national perspective
The purpose of the cost-benefit analysis is to establish whether MNP is likely to bebeneficial to Hong Kong as a whole. This raises a number of issues which are brieflydiscussed below:
• the aggregation of costs and benefits that accrue to different consumers andproducers;
• the need to ensure that where something represents a benefit to one agentbut a loss to another the effects are properly netted out;
• the appropriate discount rate.
In order to be able to add together the benefits and the costs that accrue to differentconsumers and producers it is necessary either to assume that monetary values are a truemeasure of economic costs and benefits, and hence ignore any effects on incomedistribution, or to weight monetary costs and benefits according to the parties to whomthey accrue. It is standard practice in cost-benefit analysis to take the first course of action,and this is the line that has been followed in this study.
The cost-benefit analysis should also only look at the net impact on profits. That is, if aPMRS operator loses a subscriber to a competitor, it is necessary to look at the Public MobileRadiotelephone Services' (PMRS) loss minus the competitors gain. In Hong Kong, newoperators appear to be attracting subscribers with average (or below average) calling rates,therefore it might be assumed that price discounts (or better quality and features) reflectcost advantages that stem from greater efficiency, newer technology etc. If so, the PMRSoperators and other operators would earn the same margin on the business that transfersbetween them as a result of MNP and hence the net impact on profits would be zero.
Also if MNP means that a business keeps customers that it would otherwise lose, it isnecessary to deduct the profits that have been made by competitors had MNP not beenavailable.
As the cost-benefit analysis is being undertaken from a national perspective, the discount

Introduction
5
rate used is one typically used for public sector projects, namely 6 per cent in real terms.The chosen rate ought ideally to reflect the rate of social time preference and theopportunity cost of capital (i.e. the marginal return on private sector projects). The tworates may well not be the same, but in practice the rate of 6 per cent is taken to serve bothpurposes.
1.2.6. Who bears the costs of MNP
A final important issue is that the way that the costs of MNP are recovered could affect thelevel of benefits. If all the costs were to be borne by the new entrants (the PCS operators inthis case), they would need to be passed on to mobile users. This would affect the pricedifferential they could offer and, as a result, the level of switching in the mobile market. InChapter 7, we have drawn on the experience in the FTNS network in Hong Kong andelsewhere to recommend a method by which the costs of MNP can be recovered in anequitable and efficient manner.
1.3. Structure of the Report
The rest of this report is structured as follows:
• Chapter 2 provides an overview of the mobile telephony market in Hong Kong;
• Chapter 3 presents the range of technical options for MNP and explain the preferredmethod for its introduction;
• Chapter 4 estimates the costs of introducing MNP in Hong Kong;
• Chapter 5 discusses the survey of mobile phone users in Hong Kong and draw onthose results to quantify the benefits of MNP;
• Chapter 6 presents the findings of the cost benefit analysis and introduces theimplementation path for MNP in Hong Kong;
• Chapter 7 identifies a variety of cost recovery principles and discuss theirapplication to MNP in Hong Kong.
The report also contains eight appendices:
• Appendix A discusses the future of Hong Kong’s mobile telecommunicationsmarket in the absence of MNP and derives Base Case forecasts of mobile subscribergrowth.
• Appendix B develops the subscriber switching model if MNP is introduced.
• Appendix C describes the telecommunications environment in Hong Kongincluding arrangements for interconnection between fixed telecommunicationsnetworks, mobile telecommunications operators and pager operators.

Introduction
6
• Appendix D summarises the results of the survey undertaken to determine theattitudes of consumers in Hong Kong to mobile telephones and switching.
• Appendix E provides a brief guide on how the cost of MNP in this report have beencalculated.
• Appendix F provides a brief note on how the benefits of MNP in this report havebeen calculated.
• Appendices G and H provide the questionnaires on the use survey undertaken aspart of this study.

Mobile Services in Hong Kong
7
2. MOBILE SERVICES IN HONG KONG
2.1. Background
The telecommunications market in Hong Kong is one of the most competitive in the world.At present, there are four fixed network operators licensed to provide local telephonyservices. An agreement has recently been reached between Hong KongTelecommunications Limited and the Government of the Hong Kong SpecialAdministrative Region to introduce competition into the international services market by 1January 1999.1
As at December 1997, there were seven mobile network operators with a combined total ofeleven digital networks. The recent entry of six PCS licensees has heightened competitionand increased the accessibility of mobile telephones. Indeed, by November 1997, almost 2million people subscribed to a mobile telephone and the market is continuing to growrapidly. Already, the penetration rate has reached 31 per cent and we forecast that this willgrow to 50 per cent by the end of 2002 and 60 per cent in 2007.
2.2. History of Mobile Communications in Hong Kong
Mobile services have been available in Hong Kong since 1984. The first mobile networkswere analogue systems which typically used Advanced Mobile Phone System (AMPS),TACS (Total Access Communications System) or ETACS standards. Hong Kong TelecomCSL, Hutchison and Pacific Link each operated an analogue network although all of thesehave been, or are in the process of being, phased out.
The first digital networks were introduced in 1993. The technology used in digital systemsis generally considered superior to that used in analogue networks. In digital systems,audio sounds entering a mouthpiece are digitally coded and then used to modulate a seriesof short impulses that are transmitted between handsets and base stations. The advantagesof digital systems include greater security than analogue systems (they are encrypted andcan block communications from unauthorised handsets) and greater capacity than analoguesystems using comparable bandwidths.
Digital systems can be operated using a number of standards. In Hong Kong, the standardsused are GSM (operated by SmarTone, CSL, and Hutchison), TDMA (a cellular technologydeveloped in the USA and operated by Pacific Link), and CDMA (operated by Hutchison).
In September 1996, OFTA awarded licences to six consortia to operate PCS networks. Thesenetworks are based on the GSM 1800 technology which is similar technology to the GSM
1 External service-based competition (such as International Simple Resale of voice services) will begin on 1 January 1999 andexternal telecommunications facilities-based competition (such as IDD service over cable and satellite facilities owned byservice providers other than HKTI) will begin on 1 January 2000.

Mobile Services in Hong Kong
8
standard but implemented at a higher frequency band. The licences were awarded toHutchison (Everyday), Mandarin Communications (Sunday), New World PCS, P PlusCommunications, Peoples Telephone , and Pacific Link.
2.3. Number Portability for Mobile Services
The entry of the new PCS operators has led to a fall in prices and an increase in the range ofchoices available to mobile phone users. Despite the highly competitive market, the needfor some level of regulation remains. Mobile operators, for example, are required tointerconnect with HKTC, the dominant fixed network operator, in order to complete callsthat do not originate or terminate on the mobile networks. The interconnect charges areregulated by OFTA. Spectrum constraints (which prevent additional entry into the market)also create a need for regulation and differentiate the mobile market from other markets.
OFTA, therefore, sees one of its key tasks as being the promotion of the development of afair and competitive operating environment for the telecommunications industry in HongKong. The availability of number portability is considered by the TelecommunicationsAuthority (TA) as essential for the development of telecommunications in Hong Kong andfor the delivery of enhanced benefits to consumers.
Mobile number portability refers to the ability of users to retain their telephone numberswhen changing operator. MNP can also be defined as giving subscribers the ability to carryout the following functions when changing mobile operators:
• the possibility for circuit-switched calls to be completed to the subscriber's mobileterminal from a fixed telephone within Hong Kong, via the international gateway, orfrom another mobile terminal by dialling the same directory number;
• the ability for the subscriber to continue to use his/her mobile terminal with nochange of functionality; and
• the possibility for supplementary and value-added services to be used in anidentical way to other subscribers of the new network.
In the Consultation Paper on Number Portability for Mobile Services in Hong Kong OFTAstated that:
“With such a fast growing mobile customer base in Hong Kong and thechoice of mobile networks available to customers, the TA believes that therewould be some genuine demands and requirements from customers formobile number portability.”
Mobile operators in Hong Kong, however, have expressed mixed views about theintroduction of MNP. The new PCS entrants were very supportive of MNP:
“The PCS operators unequivocally support the introduction and

Mobile Services in Hong Kong
9
implementation of NP for mobile in Hong Kong. … We believe that thepresence and implementation of mobile NP would, as a direct result of suchsubstantial savings to customers, remove one of the major barriers to fullcompetition in mobile services in Hong Kong given the high percentage ofmobile customers who are reluctant or unwilling to change operators if itwould mean changing their mobile telephone numbers.”
The more established mobile operators in Hong Kong were more sceptical about the needfor MNP. Hutchison Telecommunications, for example, suggested that the introduction ofMNP could generate a negative net benefit and might not be desirable for a number ofreasons including the following:
• the very competitive nature of the mobile market;
• the low cost of subscribers switching numbers given that a large proportion ofmobile subscribers are new; and
• subscribers in Hong Kong do not consider the inability to retain their number as aproblem.
SmarTone also queried the need for MNP in Hong Kong. They stated that:
“Mobile number portability may encourage further competition in countrieswhere there are a few mobile operators. It has been widely recognised thatwith the 11 mobile networks and 8 mobile operators, Hong Kong is one ofthe most competitive places for mobile communication services. Studiesshould therefore be conducted on (i) whether further competition in HongKong resulted from number portability would be desirable and beneficial tothe consumers as well as Hong Kong, (ii) whether number portability inHong Kong would result in “healthy” competition for the benefits of HongKong, and (iii) the much heavier financial impact on the new mobileoperators to implement number portability (and hence degrade theircompetitive position).”
One of the common themes emerging from the operators was that the TA should conductcomprehensive market research and undertake a cost benefit analysis to establish thedemand for and actual benefits of MNP in Hong Kong. As a result, OFTA commissionedNERA and Smith to conduct the feasibility study and cost benefit analysis of mobilenumber portability for mobile services in Hong Kong. As part of this study, NERAcommissioned SOFRES FSA to survey 1,000 users of mobile phones in Hong Kong toexplore their use and switching behaviour with mobile phones.
2.4. Fixed Network Number Portability in Hong Kong
Fixed number portability was implemented in Hong Kong in July 1995. For the first 18months of operation - the time needed to develop the database solution including

Mobile Services in Hong Kong
10
agreement on the method for notifying all parties of ported numbers and installation andtesting of hardware - a call-forwarding solution was used, before migrating to the currentdistributed database implementation, The interim call-forward solution operation allowedprocedural and Operational Support System (OSS) changes to be made in conjunction witha relatively simple switching solution.
Figures 2.1 and 2.2 illustrate the operation of the database look up in HKTC’s network forcalls to subscribers porting into and out of the network respectively. Calls to numbers thathave been ported from HKTC’s local switches are re-routed via the InterconnectionGateway (ICG) using a gateway number retrieved from a database held locally on theswitch. All other calls passing out of HKTC’s network, via the ICGs, cause a database lookup to be performed using Intelligent Network (IN) technology.
The solution is implemented in slightly varying ways in each of the alternative fixednetwork operators’ networks.
Figure 2.1: Fixed number portability by database solution in Hong Kong’s fixednetworks: calls to subscriber porting away from HKTC
annel\chap3pics.ppt
Originatingswitch
ICGAlternative
fixedoperatorNN
POIDN NN
On switchdatabasedip
DN NN

Mobile Services in Hong Kong
11
Figure 2.2: Fixed number portability by database solution in Hong Kong’s fixed network:i) calls to subscribers porting between two other fixed operators ii) calls to subscribers
porting into HKTC’s network
annel\chap3pics.ppt
Originatingswitch
ICGAlternative
fixedoperatorNN
POIDN NN
On switchdatabasedip
DN NN
Recipientswitch
DN NN
NN
À
Á
2.5. International Experience with MNP
Although to date mobile number portability has only been introduced in Singapore, it is onthe agenda to be introduced in other countries. This section summarises the state of playwith MNP in Singapore, the United Kingdom (UK), the Netherlands, New Zealand and theUnited States.
2.5.1. Singapore
Singapore become the first country to introduce mobile number portability when the mobiletelecommunications market was partly liberalised in April 1997. The TelecommunicationsAuthority of Singapore (TAS) adopted a phased approach to the implementation of MNP.Call forwarding is to be used as the interim measure while operators determine theappropriate long term solution. The long term solution will, however, be based on theintelligent network platform which will be implemented when the technology is moremature.
The recovery of costs, at least for the interim solution, involves a charge to portingsubscribers which was agreed by Singapore Telecom and MobileOne. The negotiationswere facilitated by TAS. The decision whether to pass on the costs to end users will be abusiness decision. TAS has, however, agreed that a charge of S$8-10 per month is fair. As aresult of the monthly charge, the number of subscribers who have ported is low (about oneper cent of subscribers).

Mobile Services in Hong Kong
12
2.5.2. United Kingdom
MNP will be introduced in the UK by 1 January 1999. The decision to introduce MNPfollowed modifications to the licences of the four cellular mobile operators in order torequire the Licensees to provide number portability to other mobile operators on areciprocal basis.
The decision to modify the licences followed the findings of an economic evaluation ofnumber portability in the UK mobile telephony market conducted by OVUM. Theconsultancy found that the net gain to the UK economy from the introduction of MNPwould be £98 million (on a net present value basis). It went on to conclude that:
• the UK would be better off if number portability were introduced;
• OFTEL should therefore require mobile operators to introduce number portability;and
• number portability should be introduced as soon as practicable.
Mobile number portability will be introduced using a signalling relay capability. Such asolution was seen as compatible with the evolving GSM environment, includingsupplementary services such as Short Message Services (SMS).
2.5.3. The Netherlands
There are currently two operators offering a GSM service in the Netherlands PTT Telecomand Libertel. At least two more DCS-1800 licences will be issued in 1998.
In 1995, a preliminary study of number portability was commissioned by the Ministry ofTransport, Public Works and Water Management. This study covered technical as well costand profit issues. Following the study, the Ministry decided that mobile number portabilityshould be implemented by 1 January 1999. The Dutch operators intend to provide mobilenumber portability by that date but are developing a proprietary solution to achieve itrather than waiting for the European Telecommunications Standards Institute (ETSI)standard being developed within Europe.
2.5.4. New Zealand
New Zealand has one of the most deregulated telecommunications markets in the world.Decisions on numbering issues (including portability) are made by the TelecommunicationsNumber Advisory Group (TNAG) which has been meeting for over five years. The interimsolution will be based on call forwarding while the long term solution will be IN basedalthough the timing of its introduction is uncertain.

Mobile Services in Hong Kong
13
2.5.5. United States
The First Report and Order on Reconsideration on Local Number Portability establishedthat long-term number portability in the fixed network must be provided by all the LocalExchange Carriers (LECs) in the 100 largest MSAs according to a phased deploymentschedule that began in the fourth quarter of 1997 and ends by 31 December 1998.Thereafter, for smaller cities, LECs must provide number portability within 6 months of aspecific request by another telecommunications carrier.
The First Order also discussed a separate implementation schedule for Commercial MobileRadio Services (CMRS) providers. Cellular, broadband PCS, and covered Public MobileRadio (PMR) carriers must have the capability of querying a number portability database,or make arrangements with other carriers to do these queries by 31 December 1998. Long-term mobile number portability must be implemented by 30 June 1999.
The Federal Communications Commission (FCC) has not selected a particular architecturefor long-term portability.2 Instead, the First Order establishes performance criteria that aLEC’s long-term number portability architecture must meet. In particular, any long-termmethod must:
1. support existing network services, features, and capabilities;
2. efficiently use numbering resources;
3. not require end users to change their telecommunications numbers;
4. not require telecommunications carriers to rely on databases, other networkfacilities, or services provided by other telecommunications carriers in order to routecalls to the proper termination point;
5. not result in unreasonable degradation in service quality or network reliability whenimplemented;
6. not result in any degradation in service quality when customers switch carriers;
7. not result in a carrier having a proprietary interest;
8. be able to accommodate location and service portability in the future; and
9. have no significant adverse impact outside the areas where number portability isdeployed.3
2 The FCC does support the decision of the industry to implement the Location Routing Number (LRN) method, as definedin the T1S1 document, ANSI T1.660 -199x, American National Standards for Telecommunication Signalling System No. 7(SS7) Call Completion to Portable Number.
3 FCC 1997 At http://www.fcc.gov/ccb/Nanc/numbport.html

Technical Implementation Options
14
3. TECHNICAL IMPLEMENTATION OPTIONS
3.1. Background
This chapter discusses the technical options that have been considered as both short-termand long-term solutions for MNP in Hong Kong, and examines their feasibility, time framesfor implementation, impact on supplementary services and operational systems andprocedures.
The market for public mobile telephony in Hong Kong is characterised by a highlycompetitive environment, with seven separate operators maintaining eleven networks. Thetechnologies represented are:
• GSM;
• PCS;
• IS-95 (CDMA);
• IS-136 (D-AMPS);
• TACS.
OFTA wishes to assess the feasibility and cost of implementing MNP in Hong Kong and tocompare this with the potential financial benefits. The latter includes lower costs ofsomething between operators, reduced time and fewer calls to track down subscribers whohave changed operators; and inherent benefits as a result of the lower costs. To this end,OFTA published a consultative paper in July 1997 outlining its plans for MNP, including adescription of technical options that may be suitable, a suggested cost recovery frameworkand its intention to set up an Industry Forum to study technical and implementation issues.
The result of this process showed that widespread support existed for the present feasibilityand cost-benefit analysis study. The final report of this study is due to be published in May1998, following a workshop in February at which an interim report was circulated tointerested parties. In the light of the findings, it is anticipated that OFTA may mandate theimplementation of MNP in Hong Kong within prescribed timescales.
Throughout this document, the following definitions are used:
• donor operator/network: the operator/network that has lost the subscriber;
• recipient operator/network: the operator/network that has gained the subscriber;
• originating network: the network in which a call to a ported subscriber has beeninitiated.
The next section focuses on the selection criteria that have been used to assess the options.

Technical Implementation Options
15
3.2. Option selection criteria
This section discusses the criteria used to assess the implementation options and hencerecommends a particular migration strategy to OFTA. The focus is on the criteria used tocompare each of the technical solutions and on the process by which OFTA can transposethe technical requirements for the solutions into a functional specification.
Two qualifications are in order. Firstly, the responsibility for the ultimate migrationstrategy lies with OFTA, and will be affected by factors which fall beyond the scope of thisstudy. Secondly, the scope of this study placed limits on the degree of technical detail usedto assess the costs of implementing each option and their technical implications.
In considering each of the technical options and each of the migration strategies, theoverriding principles set out below will be taken into account. These are:
• technical feasibility;
• cost;
• migration and timescales;
• Operational Support Systems (OSS) impact;
• fixed mobile convergence;
• cost recovery compatibility; and
• mapping solutions onto requirement criteria.
3.2.1. Technical feasibility
While some of the solutions are not feasible as initial solutions, the possibility of takingthese up at a later stage will be considered. Particular risks associated with technicallyfeasible solutions will be identified, such as threats to implementation timescales or qualityof service.
Some of the solutions that are being considered are necessarily proprietary solutions due tothe ground-breaking nature of MNP in Hong Kong. However, this study will attempt toassess whether such solutions are likely to be developed as standard solutions, therebyproviding future security for their continued production by manufacturers.
The technical solutions described below are examined mainly from the perspective of thefeasibility of these solutions for the delivery of voice calls to ported numbers.Supplementary services, to some subscribers an important aspect of the use of mobileservices, lie strictly outside the scope of MNP. The feasibility of implementing these servicesis considered in the discussion, however, details of how individual services may beimplemented is beyond the scope of the study. Operators considering development of

Technical Implementation Options
16
services that are affected by the porting process must weigh up the commercial advantageof offering the services against this development cost, and advise potential customersaccordingly.
3.2.2. Cost
The set-up and recurrent costs of the most likely short and medium-term solutions andmigration options are considered in the cost modelling section. Options identified as themost desirable are examined in closer detail through variations on a base case model. Inaddition, a less detailed analysis of other, less desirable solutions is modelled.
Due to the current volatility of the mobile market, it is difficult to predict how the HongKong network will develop in the long run. Therefore, the modelling work that has beencarried out illustrates the worst-case, maximum-cost scenario.
3.2.3. Migration and timescales
Options have been assessed according to their suitability as interim solutions whilenetworks are developed towards the longer-term goals of providing network services andfunctionality in Hong Kong.
Estimates have been made - by drawing on international experience in both the fixed andmobile arenas - of the shortest period in which the options could be implemented, given thegood-will and co-operation of all associated parties.
3.2.4. OSS impact
Any special impact that the solutions may have on the Operational Support Systems (OSS)will be considered. A general discussion of the impact of MNP on OSS is provided in a latersection of this chapter.
3.2.5. Fixed mobile convergence
An important long-term goal of most national networks is fixed-mobile convergence.Consequently, each feasible solution has been assessed in the light of such an environment.
3.2.6. Cost recovery compatibility
The solutions have also been judged on the ease by which the cost recovery principles maybe applied. These issues are considered in more detail in the treatment of cost-allocationrecommendations.
3.2.7. Mapping solutions onto requirements criteria
The role of OFTA in the implementation of MNP is to facilitate a solution that is bothfeasible and acceptable to associated parties without limiting the implementation choices

Technical Implementation Options
17
faced by a given operator.
In mandating any form of number portability, a national regulatory authority must initiallydecide the scope of the requirements. Next, it must develop a set of functionalspecifications which define the requirements needed to implement number portability,taking into account the cost recovery criteria. This should include:
• mobile-to-mobile service provider porting only (not fixed-to-mobile);
• digital-to-digital technologies only (not analogue technologies).
The functional specification must define the way in which telephone calls to and fromported numbers are routed between networks, but may also encompass other aspectsassociated with the porting process, such as operational procedures for the interchange ofcustomer information and the rules for the synchronisation of a central database. Theamount of detail required in the functional specification will be influenced strongly byfactors such as the exact regulatory conditions within the network and the status of thenational network. In practice, the solutions that are then implemented by individualoperators may vary significantly depending on factors such as the size of the networks, thelikely number of customers wanting to port in or out of the networks and theinterconnection arrangements between the networks.
Examples of such variations in the way in which number portability may be implemented,while remaining within the boundaries of national requirements criteria, are:
• in the UK, BT (the incumbent) uses a drop-back mechanism to reduce the cost ofcompleting calls to former customers that have ported to other networks. Thenecessity for this procedure is a consequence of BT’s two-tier network, and does notneed to be implemented in its competitors’ networks;
• in Hong Kong, HKTC uses a combination of on-switch database and central lookups at interconnection gateways (ICGs) to implement fixed number portability.Should economic and operational conditions dictate, the use of originating switchcentral database look-up would be equally valid within the current requirementscriteria.
In considering the various options below, assumptions have had to be made concerning theway in which the operators are likely to implement the solutions, and these are documentedaccordingly.
Several of the options involve a database look-up, either locally at a switch, with referenceto a database unique to an operator’s network (a distributed database), or with reference toa central database, accessible - on-line or off-line - to all operators. Each of these optionsmay be implemented in a variety of ways ranging from developing standard switchsoftware, using Signal Transfer Point (STP) technology, to housing of the database at theService Data Point (SDP) of an IN architecture.

Technical Implementation Options
18
This area of technology is under rapid development at present, but for each option, severalimplementation methods are possible, as demonstrated in Hong Kong by the different waysin which a database look-up solution has been implemented by each of the fixed operators.
The final format of a solution implemented by an operator will depend on a variety offactors including the number of switches, performance required and available technology.These options will therefore be referred to simply as ‘database look-up’ methods, and moredetailed implementation architectures will be considered in calculating the costs of themethods in Chapter 4. For further cost modelling, it has been assumed that the currentrules for the fixed solution will be adhered to.
3.3. The Need to Take Account of Effects on Operational Support Systems(OSS)
The elements of an operator’s communications network infrastructure (switches,transmission equipment and cables) are only a part of the facilities that are impacted by amove to number portability. There is a wide range of OSS that are also affected.
The OSS of mobile operators in Hong Kong are modern, highly advanced systems that havebeen implemented on a small number of interconnected platforms. HKTC’s network, andto a lesser extent, the GSM operators’ networks are less advanced than those of the otheroperators, being partially based on older technology, and these systems have tended togrow up in an ad hoc way over the years.
The common thread through the mobile operators’ systems, however, is that they arehighly automated, with the front-office systems in the high street shops linked directly tothe provisioning system at the central management centres, allowing customers to beimmediately enrolled into the network. The aim of MNP will be to ensure that this level ofautomation is maintained, so that for the large volume of porting customers that can beexpected, few additional on-going overheads are accrued.
An operator’s OSS is closely related to the procedures within the operator, and so changesto these systems will have inevitable impacts on the need to adjust, and in some cases,develop new procedures. In order to implement MNP, the following areas need to beaddressed that are associated with the OSS, or related procedures.
3.3.1. Development of new operational procedures
The operators will need to determine the extra information flow that is required foraccepting new subscribers with connections to an existing network. Much can be gainedfrom the experiences of fixed network operators (FNOs) have gained in implementingnumber portability.
Areas such as commercial issues associated with the transfer of a subscriber and theassociated cancelling of an existing contract will need to be addressed, as well as the

Technical Implementation Options
19
procedures for the automation of the transferral of data. It may be appropriate for thesubscribers' details to be contained on a central database, but the security associated withthe access to this database would need to be carefully considered.
3.3.2. Billing procedures
The impact of MNP will probably be greatest on the billing systems of the operators’networks. Once the principles of the cost recovery process have been clarified for on-goingcosts, the detailed implementation issues can be considered. It is likely, however, that forthe off-switch solution, where the FNOs are providing a service for the mobile operators, afee will be charged for each dip, and the mechanisms for measuring and billing this processto the mobile operators needs to be developed.
For the call forwarding solution, minor additional changes will need to be made to alloperators’ billing systems in order to account for the exchange of bills between theoperators described in the cost recovery section of this report.
3.3.3. Administration database
For the off switch solution, the mobile operators will need to be able to influence theadministration database that is currently maintained by the FNOs. The mechanisms for thishave not yet been fully discussed but, at a minimum, the mobile operators will need toinform at least one FNO (probably HKTC) of changes, which could then be posted on theirbehalf. It would seem most sensible for this information exchange to proceed via theinterconnecting X25 network, but the mechanisms of its implementation still to bedetermined.
3.3.4. Automation of the porting process
The automation of the procedures within operators’ networks will need to be reflected bysimilar automation between networks, if the cost of MNP is not to become prohibitive. Inthe UK, a system for the automatic porting and synchronisation of operators’ switching andOSS has been developed and is referred to as a real time router system. Such a systemwould need to be developed in Hong Kong and consequently the operators will need to co-operate to agree procedures and technical standards for the:
• exchange of information;
• testing of the system;
• cut-over procedures;
• setting up of relevant billing facilities
• on-going database integrity testing.

Technical Implementation Options
20
3.4. On-switch solutions
On-switch solutions are those in which information concerning the whereabouts of portedsubscribers is held on the switch in the donor network to which they were originallyconnected. Inevitably the routing of calls to such subscribers is inefficient, and so thesesolutions can only be considered as interim solutions pending more efficient off-switchsolutions.
This section discusses the on-switch solutions that have been considered as part of thisstudy. The basic options identified in the consultation paper published by OFTA aresupplemented by several other options identified by the study team. A description of eachoption is provided, together with an analysis of its suitability using the selection criteriaoutlined in Section 3.2 and a summary of its advantages and disadvantages.
3.4.1. Call forwarding - mobile-network look-up (OFTA option 2)
From the point of view of the switching architecture, call forwarding is the simplest option,requiring minimal modifications to the switching equipment. The option is illustrated inFigure 3.1.
Figure 3.1Call Forwarding Solution
annel\chap3pics.ppt
Originatingswitch
Tandemswitch
HKTCnetwork
Donorswitch
Donormobile network
Recipientswitch
Recipientmobile network
POI
POI
Calls are routed through the fixed and mobile networks in the usual way though, in reality,the majority of calls will pass through HKTC’s network during the proposed time for theutilisation of a call forwarding solution.

Technical Implementation Options
21
Should a subscriber subsequently port to a second recipient operator, the unconditional callforward set on the donor operator’s switch would be adjusted to point to the new recipientoperator’s switch, and the other operator would drop out of the operational handling ofsuch calls.
Solutions based on call-forwarding have been achieved in a variety of ways in fixednetwork solutions in different countries, each solution being a trade-off of developmenteffort required against more efficient use of switch resources. For mobile numberportability it is assumed that call-forwarding would be achieved using a standardunconditional call forward divert, which would tie up an extra port on the switch for theduration of the call, and utilise corresponding processor resources. Should development ofan alternative solution be deemed worthwhile, this would imply that the overall cost of thedevelopment would be less than the savings in reduced resource consumption, whichwould make the assumption used here a worst case.
Several variants of call-forwarding, including the use of second dummy numbers, theaddition of routing prefixes, or the definition of a new numbering space - sometimesreferred to as routing numbers - have been considered in other countries, both for fixed andmobile number portability. It has been assumed that in Hong Kong the formats of theforwarded number would be consistent with the gateway numbers used in the fixed interimsolution, that is either:
• Gateway Number = Network Identifier (3 digits) + Directory Number (8 digits);
or
• Gateway Number = Network Number (9 or 10 digits).
Numbering space in Hong Kong has been reserved for both formats.
3.4.1.1. Technical feasibility
The implementation of a call forwarding solution in Hong Kong would be technicallystraightforward, and a similar solution was used as an interim for the introduction of fixednumber portability. A number of factors should be considered, however.
By allowing calls to be completed to the donor Gateway Mobile Switching Centre (GMSC)and then re-routed to the destination switch, extra resources such as switch processing andswitching capacity, as well as trunk traffic and signalling capability are consumed. As thenumber of calls to ported numbers increases, this increase in capacity demand may haveimplications for the ability of the networks of mobile operators and HKTC to supply thisextra capacity.
The costs associated with the tromboning of calls between the FNOs’ networks and thedonor operator comprise both the inherent cost of handling the extra traffic at the donorGMSC, the cost of utilising interconnection capacity between operators other than HKTC, as

Technical Implementation Options
22
well as the additional interconnection charges that are paid to HKTC. Detailed modelling ofthese extra costs is carried out in Chapter 4.
In order for Calling Line Identification (CLI) to be handled correctly, arrangement must bemade in the recipient operator’s network for all outgoing calls to present the DirectoryNumber (DN) of the subscriber. This can be achieved by means of insertion of the numberstring in the relevant part of the outgoing SS7 messages. The technical details of this willvary between manufacturers’ equipment, but discussions with selected manufacturers hasshown that for modern switches this is easily achievable through administration changes onthe switch. These modifications have been achieved in Singapore. This assures that CLIinformation, important for use by the emergency services, is delivered for all calls.
The CLI information associated with calls to ported subscribers will include both the CLI ofthe originating caller, as well as the DN itself. For applications that rely on the use of thisinformation, such as CLI Presentation (CLIP), minor changes may need to be made toensure that the appropriate field is selected, which will again depend on the particularswitch involved. It will be incumbent on the recipient operators to decide if development ofthis functionality for the duration of the call-forwarding phase can be justified, or whetherthe services associated with CLI are not offered to customers porting in.
Inbound calls from outside Hong Kong, via HKTI’s network to numbers that have beenported could, in principle, cause problems with the operators’ call accounting process. Thisis because the delivery fee that is delivered to the mobile operators by HKTI for callsterminating in their network would be paid to the donor network, and the subsequent callforward leg of the call would appear to the recipient operator as an ordinary call. Therecipient operator would therefore be unaware of the latent revenue to be collected from thedonor operator for the call.
This problem was overcome during the period in which a similar call forwarding interimsolution was in place for fixed number portability by routing such calls along dedicatedinter-operator routes. It is unlikely, however, that the expense of carrying traffic overdedicated equipment on the multitudinous routes between all of the mobile operators couldbe justified, and therefore procedures would need to be agreed and modifications made tothe mobile operators’ billing systems to screen such calls and allow appropriateadjustments to the inter-operator accounts to be made. Such changes would involvescreening Call Data Records (CDRs) that are for calls inbound to ported numbers, andlogging this information for processing by the accounts department of the donor operatorand passing this information onto the relevant recipient operators. Alternatively thisprocess could be carried out manually by analysing billing records for calls to formercustomers. The implementation details of changes to be made to individual billing systemsis beyond the scope of this study, but operators would be able to agree appropriatesolutions in open forum similar to those convened for the resolution of such details duringthe implementation of fixed NP.
The operation of the Short Message Service (SMS) system has not yet been fully specified as

Technical Implementation Options
23
part of the GSM standard and, consequently, many variations on its implementation existthroughout the world. In Hong Kong, the main use for SMS is for network operators tooffer data-delivery value-added services (VAS) to their customers (where useful informationis delivered such as share price information) and very little Mobile Originated (MO) trafficis generated. There is no form of interconnection between different operators SMS systemsand so all messages can be considered as on net and pass through a single Short MessagingSystems Centre (SMSC). Under the call forwarding solution, MO SMS messages to portedsubscribers might not be able to be completed. The VAS would continue to work, however,because messages to mobiles registered on the recipient network could be identified usingthe IMSI address of the ported number, which is unique to the new SIM card issued whenthe subscriber ports. For hardware where this is not possible however, operators mustthemselves decide whether investment in a workaround solution is worthwhile, allowingthe operators, as a recipient party, to offer this service seamlessly to porting customers. TheSMS must be seen as a service offered to mobile users in addition to voice telephony whichcannot be necessarily ported in all scenarios, but recipient operators must make subscribersthat are likely to port aware of any such limitations. Experience can be gleaned from theoperators in Singapore that have implemented this solution on hardware that is used inHong Kong.
Whilst the call forwarding solution is in place, the call forwarding capacity of the mobileoperators’ GMSCs, extra processing capacity and user ports will be reserved for theduration of calls to ported customers. This may require the operators to invest in extracapacity, but once a medium-term solution is in place, this capacity would be released foruse by new customers.
Mobile operators that have direct interconnection between their networks would be able toforward calls to customers ported between their networks via the interconnecting leasedlines, and thereby avoid incurring additional interconnection charges to be paid to HKTC.
3.4.1.2. Timescales and migration
A similar solution has been implemented in Singapore within the last six months, and so,coupled with the experience already gained in Hong Kong in number portability, roll out insimilar timescales should be possible. The timescales are most likely to be determined bythe changes that need to be made to the OSS.
We have assumed that such a solution could be rolled out in 6 to 12 months.
3.4.1.3. OSS impact
As part of the cost recovery principles developed as part of this study, the charges made byHKTC for the extra interconnection costs incurred for the tromboning of calls betweenHKTC’s network and the donor operator are passed on to the recipient network. Thebilling systems of the mobile networks must be modified accordingly and proceduresdefined for the exchange of this billing information, and settling of accounts. This would

Technical Implementation Options
24
involve allocation of individual call records to other operators, but no extra measurementsof call traffic.
In addition, the revenue for calls originating outside the Hong Kong SAR would need to bescreened and passed onto the recipient operator, and the billing systems of the mobileoperators would need to be adapted accordingly.
3.4.1.4. Fixed mobile convergence
This solution is necessarily an interim solution (because with an increasing take-up of theservice, the inefficient use of network resources would become intolerable) and, though inprinciple an extension of a solution used to implement number portability, would not beused in the long-term.
3.4.1.5. Cost recovery compatibility
The solution requires little or no modifications to be made to the systems of FNOs, and soall set-up costs are borne by the mobile operators.
Additional conveyance costs would be particularly acute, were the take-up of portingservices to be high, and would strongly depend on the timing of migration to longer-termoptions and the take up rate of number portability. This is explored more thoroughly inSection 4 of this report, which models the costs of MNP.
3.4.1.6. Summary of advantages
• Easy to implement, requiring few, if any, changes to the mobile switches.
• Able to be quickly rolled out using procedures similar to those already in existence.
• Good compatibility with CDMA/D-AMPS systems, as call forwarding would beimplemented using the call forwarding features of these switches.
• There is no requirement for the fixed operators to make modifications to their look-up databases.
3.4.1.7. Summary of disadvantages
• Some operators claim that problems would be encountered with the handling of CLIinformation used to provide CLIP. It would appear, however, that these fears areunfounded and that, with minor modifications, these problems may be overcome forcalls to and from ported numbers.
• Operators have expressed concern that the solution is likely to overload the callforwarding capacity of their networks, perhaps necessitating the deployment ofextra capacity.

Technical Implementation Options
25
• As the nature of services offered via the mobile networks changes, the number of‘transaction-oriented’ services (e.g. calls set up for a short period of time todownload data) will increase, requiring the call set-up-rate capacity of the solutionto be increased. For the timescales proposed, however, this is not likely to be aproblem during the call forwarding phase of the migration plan.
• SMS messages cannot be forwarded in this way. However, in Hong Kong theoperators’ SMSCs are not interconnected, which limits the usefulness of SMS, and sohence reduces the problem.
• International calls terminating at a mobile telephone that has been ported withinHong Kong will not be able to be traced by the recipient operator’s billing system sothat HKTI can be billed accordingly. Similar problems were encountered during theoperation of the interim fixed solution, and were overcome by trapping the calls androuting them along separate trunks. Technical solutions for this would need to beaddressed at an early stage. In the event of dispute between recipient and donornetworks, it would be possible to reconcile accounts using the archives from theFNOs’ billing systems.
• HKTC has expressed concerns that it may not be able to support the additionalcapacity demanded of its network in the event of heavy take up number portabilityleading to a surge in interconnection service demands. HKTC has stated that it mayrequire up to 18 months to implement such capacity. An estimate of the likelyadditional capacity required during the call-forwarding solution phase is given insection 4.3.6.
• Calls forwarded to a recipient’s switch rely on the integrity of the donor’s networkfor the grade of service offered to its customers. This threat to network integritycould be backed up by service level agreements, but remains an implicit danger for anetwork receiving ported customers.
• Introduces additional dialling delay.
3.4.2. Call drop back
This solution, illustrated in Figure 3.2, was not considered by OFTA in its discussion paper.

Technical Implementation Options
26
Figure 3.2Call drop back
annel\chap3pics.ppt
Originatingswitch
HKTCnetwork
Donorswitch
Donormobile network
Recipientswitch
Recipientmobile network
POI
POI
Key
Signalling path only
This solution is a development of the call forwarding solution identified above, and is mostlikely to be rolled out only when this simpler solution has been running for some period oftime and is stable. The solution reduces the inefficient use of network resources, andtherefore could be considered as a long-term solution.
The initial exchange of signals to set up calls is intercepted by the donor exchange, andsufficient information returned to the originating exchange in order for the call to becompleted to the recipient operator’s network, thereby significantly reducing thetromboning of calls into the donor network.
3.4.2.1. Technical feasibility
A proprietary version of call drop back has been implemented in HKTC’s network as partof its fixed number portability solution in order to improve internal routing of calls withinthe network.
A similar technique is used in the UK fixed networks to reduce tromboning betweentandem and local level switches.
For both solutions, however, drop back is not achieved across a point of interconnectionbetween two networks, as would be required here, and world-wide operators havemisgivings about using such a solution because of its implications for the billing for suchservices. Call drop back functionality is not a standard ITU-T SS7 function.

Technical Implementation Options
27
Development of such functionality would require agreement concerning the commercialand technical issues as well as development effort from the manufacturers of all switchesused in the Hong Kong network.
3.4.2.2. Timescales and migration
Manufacturers do not offer call drop back functionality as a standard feature on switchesand this would need to be developed as a proprietary solution. The time to agree anddevelop a solution between the various manufacturers is likely to be at least twelve months.
Furthermore, roll-out of the functionality at the same time as the implementation of numberportability would be a risky strategy, and so it is likely that the roll-out would be staggeredto be at least six months after the roll-out of the call forwarding solution. It is desirable thatthe call forwarding solution be in place in Hong Kong for as short a period as possible inorder to avoid potentially expensive additional conveyance costs, preferably 6 to 12 monthsat longest, and so the risk and development effort involved with the implementation ofsuch a proprietary solution for drop back would be unlikely to be justified. The magnitudeof these additional conveyance costs is investigated in more detail as part of the costmodelling.
3.4.2.3. OSS impact
There would be no additional impact on the OSS of the operators, except if it were agreedthat the additional signalling and processing overhead associated with the dropping back ofcalls were to be accounted for between operators. The elimination of call tromboning wouldobviate the need for the billing systems of the donor and recipient operators to transfer theadditional interconnection costs.
3.4.2.4. Fixed mobile convergence
If the required development were carried out and implemented on all of the necessaryswitches, this solution could be implemented as a long-term solution. The solution wouldbe, however, not easily compatible with the fixed number portability distributed databaselook-up scheme.
3.4.2.5. Cost recovery compatibility
The development of this solution would require proprietary development work to becarried out which may not be adopted in other countries. Therefore, it is likely significantinvestment by switch manufacturers will be required, both for the fixed switches, and themobile switches. Manufacturers are unlikely to want to invest in a proprietary solution,meaning that development costs would fall to the operators.
Subsequent routing of calls would be more efficient, however, reducing the on-going costsof the solution leading to significantly reduced additional conveyance costs.

Technical Implementation Options
28
The application of the cost recovery principles would be identical to that for the simple callforwarding solution, with the exception that accounting for the additional interconnectioncosts would not be required.
3.4.2.6. Summary of advantages
• There is no requirement for the fixed operators to make modifications to their look-up databases.
• The additional interconnection costs will be reduced relative to a call forwardingsolution and there would no longer need to be accounting for additionalinterconnection charges to HKTC between donor and recipient networks.
• The solution would reduce the load on the HKTC network.
3.4.2.7. Summary of disadvantages
• At first sight this solution appears to be particularly suited to the HK scenario asmost calls are routed outwards from the central star hub of HKTC’s network. Thiswould, however, be a proprietary solution requiring drop back across a point ofinterconnection (POI), and may not be adopted as a standard implementation.
• The solution is strongly dependent on fixed operators, as the switches in thesenetworks would need to implement drop back on all switches.
• It is unlikely that a ‘big-bang’ approach would be sensible, it being best to roll outthe call forwarding solutions first to shake out technical and operational problemsbefore implementing the drop back feature at a later stage.
• The impact on supplementary services is not clear at this stage, though it is possiblethat some of the supplementary services offered have been tailored by operatorswould not work. Subscribers should be made aware of these limitations whenconsidering porting of their subscription.
• CDMA and D-AMPS manufacturers would also have to develop drop backfunctionality for single networks, or else additional tromboning would be incurred.
• Introduces additional dialling delay.
3.5. Off-switch solutions
Off-switch solutions are those in which information concerning the whereabouts of portedsubscribers is held at a location other than the donor network switch to which they wereoriginally connected. Generally, information concerning the new location of the subscriberis exchanged between network operators and held on a database for real-time reference.This ability to route calls to the ported subscriber at an earlier point in the call chain allowsconsiderable savings to be made in the cost of the call.

Technical Implementation Options
29
This section discusses the off-switch solutions that have been considered during the study.The options identified in the consultation paper published by OFTA are supplemented byseveral other options identified by the study team. For each option a description isprovided, together with an analysis of its suitability using the selection criteria outlinedabove and a summary of the advantages and disadvantages.
The possible methods of maintaining a Hong Kong-wide database can be divided into twocategories: central and distributed. A central database is maintained by a single centralorganisation, and referred to by all operators. A distributed database functions with eachoperator maintaining its own copy of the database, which is updated by informationconcerning individual porting actions, and compared with the other databases periodically.This is the current situation for the maintenance of the FNO databases.
The following sections discuss:
• the benefits of each of these arrangements;
• the mobile-network look-up solution;
• the fixed-network look-up solution;
• the all-network look-up solution;
• signal relay-based solutions developed in the UK and Netherlands; and
• the North American solution.
3.5.1. Database options
3.5.1.1. Distributed database
The current database synchronisation arrangements in place for the fixed numberportability solution in Hong Kong are in the form of a distributed database. Each operatormaintains copies of the territory-wide database that is updated via reports of individualporting actions. These reports are distributed via the Administration Database system andcause each of the four operators’ databases to be updated. The databases are then routinelyaudited against one another every month.
A similar arrangement, or extension of the current arrangement, could be used for theimplementation of mobile number portability. If there were a move towards all operatorscarrying out their own database look-ups, however, synchronisation of 11 separatedatabases would be likely to become increasingly resource intensive.
The main advantage of the distributed database is that:
• in Hong Kong, arrangements for a distributed database between at least the fixedoperators are already in place.

Technical Implementation Options
30
The main disadvantage of the distributed database is that:
• synchronisation of a distributed database will become more onerous as the volumeof ported subscribers increases, and the number of connecting operators increases.
3.5.1.2. Central database
The central database would be maintained by a single organisation which might be OFTA,HKTC or another third-party. The responsibility of this body would be technically andoperationally to maintain the database, ensuring that the information held within thedatabase is accurate, and updated where necessary, whilst providing a level of availabilityappropriate to a telecommunications network. In the event of corruption, however, of thedata, the donor network operator would be responsible for data concerning the numberranges allocated to them.
The database would need to be replicated for resilience, though the specification of thedatabase would not need to be as stringent as the real-time reference databases used byindividual operators.
The central database would be installed as an addition to the existing infrastructureassociated with the distributed database, because each operator will need to maintain atleast one local copy of the database for real-time interrogation.
The central database is likely to contain more information than the directory number (DN)to network number (NN) mapping pairs required by the telecommunications networks inreal-time, which would more easily facilitate the maintenance of the database.
Copies of the central database would be down-loaded into the non-real time systems of theindividual operators at regular intervals, or notification of individual porting events couldbe passed to the operators to allow them to maintain synchronisation of their databaseswith the central database between more formal downloads of the whole database. One ormore copies of this database are then likely to be held for real-time interrogation byindividual operators’ switches.
In Hong Kong, the implementation of a central database would be an adjunct to thefunctionality provided by the present system, providing potentially improved and moresecure operational performance. Even so, HKTC would still be required to adapt itsdatabase look up fixed number portability solution to the requirements of MNP.
The central database carries with it the advantage that:
• an accurate central copy of the national database is maintained for reference by allother operators;
while disadvantages include the following:

Technical Implementation Options
31
• the funding for setting up and maintaining a central database must be agreedbetween operators;
• in the absence of a strong technical justification, there is little financial incentive foroperators to invest in such a facility;
• commercial problems concerning the ownership of the equipment and data wouldneed to be resolved;
• if corruption of data occurs, re-synchronising the database to the information heldby the donor networks would be difficult;
• there would be security implications for a database that is accessible from multipleparties.
3.5.2. Mobile-network look up (OFTA option 2)
Option two in OFTA’s consultation paper includes the routing of calls to ported numbersbeing carried out by the mobile operators. In theory, this could be achieved by using acentral database look up technique, though in reality the results would be no better than ifcall forwarding had been used, as the majority of calls – those initiating from HKTC’s orHKTI’s network – would trombone into the donor network operator’s network for theduration of the call.
This solution is unlikely to be seriously considered, as calls to subscribers that have portedaway from a network would still be inefficiently routed into and out of the donor network,causing tromboning of calls, and incurring the same penalties that are encountered by a callforwarding solution. Secondly, as yet relatively few calls are made between mobilenetworks, and there exist few direct interconnection links between mobile networks, and socalls would need to be routed via the fixed network anyway.
3.5.3. External database – fixed-network look up (OFTA option 3)
3.5.3.1. Method
This option requires the fixed operators to perform the necessary number translationfunctions for calls to ported mobile customers as an expansion of their existing duties forthe routing of calls to ported fixed numbers. The option is illustrated in Figure 3.3, whichdemonstrates worst-case routing scenarios.
Furthermore, mobile-to-mobile calls would have to be routed via the fixed network, even ifa direct point of interconnection (POI) exists between the two networks. It is likely in thesecircumstances that calls that would more efficiently be routed through this POI would beintercepted and passed this way, achieving all that is required by OFTA Option 1: all-operator look up.

Technical Implementation Options
32
Figure 3.3Fixed network look up
annel\chap3pics.ppt
Originatingswitch
Fixednetwork
Donorswitch
Donormobile network
POI
POI
Key
Calls originating in RNO
Recipientswitch
Recipientmobile network
Originatingswitch
POI
Originatingswitch
Databasedip
Calls originating from Donor mobile network
Calls originating from fixed network
This option involves expansion of the capacity of HKTC’s database look-up system.Currently 95% of calls pass through HKTC’s network, where the look-up could be carriedout, and so such a solution is likely to be efficient – at least in the short-term. Once moreinterconnection between other networks is established, otherwise it will be more efficient forother fixed operators to carry out the look-up for calls that are not routed via HKTC’snetwork.
3.5.3.2. Technical feasibility
In principle, extension of the FNOs' fixed number portability solution should bestraightforward as it only involves extending the range of numbers that cause a databaseinterrogation to be carried out. The practical and operational impacts of expanding thecapacity of HKTC’s networks is less easy to assess, though in principle developing the extraperformance capability (both size of database and number of dips per second required) ispossible. HKTC have suggested that the current solution may need to be significantlyredesigned, and a study into this possibility would need to be carried out as a matter ofurgency.
Scaling up the other FNOs’ solutions should be more straightforward as they are based oncentral lookup solutions.
3.5.3.3. Timescales and Migration
The timescales for the extension of this functionality is difficult to assess until the exactsolution is known. Taking the worst-case scenario that the solution would need to be

Technical Implementation Options
33
redesigned from scratch, we believe that such a solution could be rolled out in 12-18months, though if the solution were to be a migration from a call forwarding solution, afurther 6 months may have to be added to this estimate to reflect the diversion of resourcesaway from operators’ development, and migration activities that would have to take place.
3.5.3.4. OSS Impact
No additional impacts have been identified on the OSS.
3.5.3.5. Fixed mobile convergence
The solution offers ideal scope for full mobile-fixed convergence allowing mobile numbersin principle to be ported to fixed numbers and vice versa.
3.5.3.6. Cost recovery compatibility
This solution achieves close to optimum routing of calls – at least with the currentinterconnection arrangements - to ported numbers, though this is only actually achievedwhen all originating switches are capable of database look up. For the basis of ourcalculations, we have assumed that this is so, as it is not clear when a full IN solution rollout is likely to be achieved, particularly as international services have not yet beenliberalised.
HKTC would need to fund expansion of its database look-up capacity, and has stated that itbelieves that it has no obligations for the funding of such solutions.
3.5.3.7. Summary of advantages
• This solution is functionally almost identical to the current fixed solution.
• No immediate development work would be required in the mobile switchednetworks.
• Close to optimal call routing achieved.
• The solution provides a good basis for fixed-mobile convergence.
• The solution would be compatible with CDMA/D-AMPS systems as most of themodifications are made exclusively in the fixed networks.
3.5.3.8. Summary of disadvantages
• HKTC have expressed the concern that large-scale upgrading of its central look upequipment would necessitate fundamental redesign and implementation of thisequipment, which it would not be prepared to fund. Pending the resolution of itscurrent grievances with OFTA over cost recovery for the fixed solution, this couldcause a bottleneck.

Technical Implementation Options
34
• The database needs to accept changes from 11 fixed and mobile operators increasingthe danger of errors being introduced. Suitable operational procedures would needto be devised to minimise this risk.
• As the nature of services offered via the mobile networks changes, the number of‘transaction-oriented’ services (calls set up for a short period of time to, for example,download data) will increase, requiring the call set-up-rate capacity of the solutionto be increased. We have made realistic assumptions concerning the increase in thenumbers of calls made in the future, though trends in the expansion of theseservices are difficult to predict. Generally, an increase in the number of calls madewill demand a corresponding increase in the capacity of the look up systems –irrespective of the call hold time - and further expansion of the systems’ capacity.
• This implementation is dependent entirely on the fixed operators, making costrecovery rules complex.
• It introduces additional dialling delay.
• The solution would be potentially a non-standard implementation.
3.5.4. External database – all-operator look up (OFTA option 1)
3.5.4.1. Method
This method is illustrated in Figure 3.4.
Figure 3.4All operators look up
annel\chap3pics.ppt
Originatingswitch
Fixednetwork
Donorswitch
Donormobile network
POI
Key
Calls originating in RNO
Recipientswitch
Recipientmobile
network
Originatingswitch
POI
Originatingswitch
Databasedip
Calls originating from Donor mobile network
Calls originating from fixed network
LocalDatabase
dip
ICG orequivalent

Technical Implementation Options
35
The principle behind the solution is that each party should carry out number translation inits own network where necessary, so that no calls are routed to an inappropriate POI. Inreality, this would be achieved in a variety of ways by individual operators, in the sameway that the fixed number portability solution has been implemented in different ways bythe fixed network operators.
In practice, this solution is one of almost a continuum of solutions from option three (fixednetwork look up only) to a full off-switch look-up solution whereby all originating callscause a database look up at the original exchange. In considering this solution therefore,the study will be considering a particular point in the potential development path of theMNP solution, and it has been assumed that all operators implement the solution in thesame way that HKTC has implemented fixed number portability.
3.5.4.2. Technical feasibility
Implementation of database look up in the mobile networks would necessitate a proprietarysolution, or investment in technology. Several of the operators have already invested insuch technology and it is possible that such a solution could be based on this platform. Theoperators may have reservations about using this platform for such a basic networkfunction, as later development work on the platform could threaten the integrity of thewhole of the operator’s network in which case the operators would need to invest inadditional IN, or similar hardware.
This solution would most likely be implemented by the mobile operators initially using on-switch solutions to perform the on-net look up for mobile-originating calls, which wouldnot be too onerous, as the number of Mobile Switching Centres (MSCs) in each network islow. Such a solution would demand development on these switches, however.
3.5.4.3. Timescales and migration
It would be inappropriate to mandate that all operators implement a database look upsolution as, for the current interconnection situation, few calls would benefit from beingrouted within the mobile network as they need to pass through the fixed network anyway.Instead, such functionality should be adopted by individual operators when the commercialconditions are favourable. It is impossible to estimate when these conditions will beachieved, though in principle it could be achieved under similar time scales to that requiredfor the roll out in the fixed network, i.e. 12-18 months.
3.5.4.4. OSS Impact
No additional impacts of this solution on OSS have been identified.
3.5.4.5. Fixed mobile convergence
The solution offers ideal scope for full mobile-fixed convergence in principle, allowing

Technical Implementation Options
36
mobile numbers in principle to be ported to fixed numbers and vice versa.
3.5.4.6. Cost recovery compatibility
This option requires expansion of the fixed network central look-up routing capacity, anddevelopment of mobile switches leading to implementation of central look-up routingfunctionality. It is unlikely that this would be appropriate as an immediate solution, ratheras a step along the migration path. If this is technically preferable at some stage, however,the cost recovery principles adopted should ensure that its implementation is encouraged.
This is the ultimate solution, allowing all calls to be routed along the optimum path. Thecost of setting up look-up functionality in the mobile network is unlikely to be justifiedinitially, however, though the operators should be encouraged to move towards thissolution when traffic levels and interconnection makes this appropriate.
3.5.4.7. Summary of advantages
• Compatible with fixed solution number portability solution.
• Mobile-to-mobile calls can be routed to the most appropriate POI without having toleave the network for number translation by the fixed network.
• Close to optimum routing is achieved.
• Use of IN technology in the mobile networks is encouraged.
• Provides good basis for fixed-mobile convergence.
• The solution should be fully compatible with most supplementary services, as thecalls are routed in the most efficient way.
3.5.4.8. Summary of disadvantages
• HKTC would need to significantly increase the capacity of its current database look-up apparatus.
• All operators would need to invest in look-up equipment, though few calls wouldbenefit from look up in the mobile operators’ network at present.
• Extra costs for implementing look up in mobile network for minimal benefitcurrently.
• Central database needs to accept changes from 11 fixed and mobile operators.
• Implementation is largely dependent on fixed operators, making cost recovery rulescomplex.
• Fixed network implementation should be straightforward. However,implementation in the mobile network would be less easy, and it is undesirable for

Technical Implementation Options
37
all operators to implement NP by this means at one go.
• The D-AMPS and CDMA systems would face a similar development task to that ofthe GSM operators, though in the worst-case the solution could be implementedusing an IN solution.
• Introduces additional dialling delay.
3.5.5. Signal relay-based solutions
Number portability solutions have been developed independently of one another in the UKand Holland. Examination of the two methods has revealed however, that manyfundamental similarities exist between the two proposed solutions, and the two technicalgroups working on these solutions are collaborating to harmonise the solution.
These solutions were not considered in OFTA’s consultation document.
The set of protocols defined as part of the SS7 signalling stack including protocols forhandling mobile telephony applications is shown in figure 3.5.
Figure 3.5SS7 Signalling Stack.
annel\chap3pics.ppt
ISUP
MAP
TCAP
SCCP
MTP
Completion of circuit-switched calls between fixed telephone nodes is achieved through theused of the Telephony User Part (TUP) of the SS7 signalling stack, which in Hong Kong,and increasingly throughout the world is an implementation of the ISDN subscriber UserPart (ISUP).
The Transaction Capability Application Part (TCAP) based on top of the SignallingConnection Control Part (SCCP) is increasingly being used as the basis for more advancedservices in the PSTN, including packet relay and advanced supplementary services, such asCall Completion on Busy Subscriber (CCBS).
Specialised functions associated with the control and operation of mobile networks are

Technical Implementation Options
38
achieved using services offered by the Mobile Application Part (MAP) layer which islocated above the TCAP. The protocols that are used to control functions such as mobilelocation management, security management and networking functions, as well as SMS, arecontrolled using the various Mobile Application Parts which sit above the TCAP/SCCP.
The requirements for MNP described in Chapter 1 can be translated into technical terms asthe ability for the MNP function in Hong Kong’s network to terminate calls and servicesusing both:
• ISUP signalling;
• TCAP/SCCP signalling.
TCAP/SCCP functionality is used in Hong Kong only to allow the completion of calls to theinternational community, and TCAP/SCCP transit functionality is not offered by HKTC’snetwork.
As the SS7 standard develops, however, applications based on TCAP/SCCP to offerservices such as CCBS within fixed networks and between fixed and mobile networks willbe increasingly used by mobile networks to offer services such as optimal routing: theability of internationally roaming subscribers to call a third country without the need for thecall to be anchored at the subscriber’s home MSC.
The Anglo-Dutch signal relay allows calls for services in the TCAP/SCCP stack to bepassed onto the recipient operator’s network, thereby more fully allowing the functionalityof these TCAP/SCCP-based services, now and in the future.
The way in which MNP is to be implemented in the Dutch and UK networks varies in itsdetail, but the fundamental mechanism is that MAP signalling that was formerly used onlywithin operators’ network is relayed between the networks of different operators. Untilnow the only other example of such interchange of MAP signalling between operators wasthat required to locate subscribers roaming in international networks. In particular, SignalRouting Information requests (SRIs) are relayed onto the Home Location Register (HLR) ofthe recipient network from the donor network, from where the Routing Information (RI)can be returned. This situation is illustrated in Figure 3.6.

Technical Implementation Options
39
Figure 3.6The signal relay function (lower diagram) of
MAP functions (upper diagram)
annel\chap3pics.ppt
HLR
HLR
MSC MSC
MAP
Operator 2Operator 1
ISUP
ISUP
HLR
MAP
Operator 2Operator 1
HLR
SRF
MSC
MSCISUP
MAP
MAP
MAP
MAP
Requests to the MSC or by the MSC for information concerning a subscriber are normallyserviced and contained within the mobile operator’s network. The signal relay mechanismhowever, allows such requests and responses to be relayed onto a third-party networkallowing routing information to be retrieved, or a remote switch to be controlled by TCAPmessages.

Technical Implementation Options
40
3.5.5.1. UK implementation
The proposed UK solution is illustrated in Figure 3.7.
Figure 3.7UK Signal Relay Implementation
Originating Network Donor Network Recipient Network
SRF DROF
Gatewaynode
Gatewaynode
3. Returned enquirysignal 7. Enquiry signal Local
RegisterFunction
2.EnquirySignal
4. Enquiryresult(IRN)
6. Enquirysignal
8. Enquiryresult (MSRN)
5. Call request (IRN)
9. Call request(MSRN)
annel\chap3pics.ppt
1. Call request(MS ISDN)
A call connect request (IAM) is received by the donor operator’s gateway node (theGateway Mobile Switching Centre (GMSC). An enquiry is made via the Subscriber RoutingFunction (SRF)4 of the switch for information on the new location of this subscriber to berelayed back to the switch, where the call is routed onto the recipient operator’s GMSCusing a newly defined Intermediate Routing Number (IRN) format – essentially a prefixbefore the MSISDN number.
Once the call is completed to the recipient operator’s switch, a further routing informationrequest is made, and the Mobile Subscriber Routing Number (MSRN) or similar routingnumber returned.
The multi-step nature of this solution is a result of regulatory requirements on the amountof processing that is required of the donor operator’s network, and problems that wereencountered in resolving accounting problems experienced with earlier solutions.
4 In the UK implementation of the SRF, a Direct Routing Override Function (DROF) has been developed to prevent the callbeing completed from the donor GMSC to the destination GMSC. This forces the call to be routed via the recipient GMSC,allowing existing billing mechanisms to function; otherwise billing information would have to be relayed back to therecipient operator’s billing system from the donor operator and destination GMSCs. The DROF also reduces the workloadon the donor operator’s equipment because the IRN is a simple intermediate routing format indicating the (fixed) locationof the recipient GMSC, and not the roaming location of the called mobile.

Technical Implementation Options
41
This particular implementation would be impractical in Hong Kong, however because itrequires calls to be completed to the donor GMSC, which would cause tromboning of callsas for the call forwarding solution.
The UK signal relay solution is effectively an interim solution on the way to a final centrallook up solution.
3.5.5.2. Dutch implementation
The proposed Dutch solution is illustrated in Figure 3.8.
Figure 3.8Dutch Signal Relay Solution
annel\chap3pics.ppt
Fixedswitch
Mobileswitch
Mobileswitch
Centraldatabase
STP/SRF
ISUP/TCAP
ISUP/TCAP
ISUP/TCAP
This solution will be implemented as part of a joint fixed and mobile number portabilitysolution. Calls to both fixed and mobile numbers will make reference to a database tocomplete calls via a Signal Transfer Point (STP), a device for mediating signallinginformation to remote switches similar to IN technology.
The SRF is contained within the STP device, and data associated with ported numbers arecontained in the database. Signalling messages associated with the ported mobiles – bothTCAP and ISUP – will be forwarded to the address associated with the ported subscriber.
3.5.5.2.1. Technical feasibility
The SRF functionality is essentially a number translation service for both ISUP and TCAPmessages. The solutions considered prior to these solutions handle only ISUP messages,and would not be able to handle TCAP-based services. The use of this layer is not

Technical Implementation Options
42
widespread in Hong Kong at present, however – HKTC does not offer SCCP transitfunctionality – and so in the medium term this is not a significant drawback.
The UK/Dutch solution appears to be the only one which does address these aspects, butthe solutions can only be considered as proprietary until they are adopted more widely, oruntil they become an ETSI or ITU-T standard. The solution is being implemented byEricsson on its hardware.
Discussions with operators and manufacturers suggests that such functionality could beretrofitted to a database look up solution. It appears that the SRF functionality would haveto be supported by the FNOs’ networks for the systems to work efficiently.
3.5.5.2.2. Timescales and migration
The Dutch and UK solutions are due to be in place by January 1999, but after a significantamount of in-house development work. It is difficult to say when manufacturers wouldoffer such functionality in future, but it would seem unlikely to be widely accepted before2000.
3.5.5.2.3. OSS impact
It is difficult to assess what the impact would be of SRF on OSS, as the implementationdetails in Hong Kong are not clear. Difficulties have been experienced in the developmentof the UK solution because an original proposal suggested the relaying of calls to a roamingsubscriber could proceed without passing through the recipient operator's network, causingproblems with the accounting function. This functionality has been suppressed through theuse of the DROF and subsequent second stage routing from the recipient operator’s GMSC.This is only a temporary difficulty, however, because similar problems need to beaddressed to be able to implement some Phase 2+ modifications to the GSM standard suchas optimal routing.
3.5.5.2.4. Fixed mobile convergence
The Dutch solution has shown that such functionality can be implemented as part of a fixedand mobile number portability solution.
3.5.5.2.5. Cost recovery compatibility
The cost recovery principles have needed to be adopted with care in the UK, largely becauseof the way in which the functionality is implemented. It is difficult to say, without moreimplementation details, how the cost recovery principles could be applied in Hong Kong.
3.5.5.2.6. Summary of advantages
• An SRF solution will be compatible with SMS services, and other Phase 2+ features.

Technical Implementation Options
43
3.5.5.2.7. Summary of disadvantages
• The solution is not likely to be available in the UK and Holland until late 1998.
• The solution is not applicable to non-GSM networks without extra developmentwork.
• In the UK-developed solution routing of calls to mobile numbers is controlled fromthe donor operator’s MSC. This reduces the tromboning of calls from donor torecipient MSC. In the Hong Kong scenario, however, calls to subscribers operatingwithin the special administrative region would need to be routed via HKTC’snetwork to the recipient network anyway, and so only calls to international roamingsubscribers would benefit from reduced tromboning.
• It introduces additional dialling delay.
3.5.6. North American solution
3.5.6.1. PCS 1900 solution
In the US, the Government has encouraged operators to implement a combinedmobile/fixed solution. Non-geographic and fixed number portability has beenimplemented, and mobile MNP is to be introduced on a staged-basis from January 1999.
The PCS 1900 operators have decided to route calls using an extension of the fixed numberportability solution using Location Routing Numbers (LRNs), essentially numbers whichidentify the serving switch for calls using a database look up. The database look up may bemade by the terminating or preceding networks.
This solution has been developed to be compatible with the existing fixed numberportability solution that is in place in the US. The use of such LRN is inappropriate forHong Kong in which a format for Network Numbers has already been defined.Furthermore, the solution’s limitations in handling TCAP-based services suggests thatdeviation from the other database solutions outlined above would not be justifiable.
The advantage is:
• it is a type of database look up solution developed for the US, and has similaradvantages to those outlined above for other database look up solutions, though thesolution is developed for use specifically in the US environment.
The disadvantage is:
• the solution may effectively become proprietary if not adopted by otherstandardisation bodies.

Technical Implementation Options
44
3.6. Standardisation
This section summarises the work being carried out in various world standardisation bodiesaimed at the definition of standards for the implementation of mobile number portability.
3.6.1. ETSI
ETSI has an on-going programme of work looking at solution for fixed and mobile numberportability, but is confined to technical issues only. At the end of 1996, a special task forcewas created called the Number Portability Task Force (NPTF). Its job is to co-ordinate thework being carried out in the various technical committees. Groups that feed into thiscommittee are the Network Aspects (NA), Signalling Protocol & Switching (SPS) andSpecial Mobile Group (SMG) committees.
Work on a MNP solution has been developing since early 1997, and the first stage of thethree stage process, definition of a high-level service description, is now complete. Work onthe second and third level standards is due to be completed by mid-1999. For the technicalimplementation of MNP two solutions appear to be being considered, the joint Anglo-Dutch signal relay solution, and the US-sponsored LRN-based solution. A separate workpackage has been defined to ease the convergence of fixed and MNP solutions under thesupervision of the NPTF.
ETSI hopes to be in a position to influence strongly the standards adopted by the ITU-T.
3.6.2. ANSI
In the US, fixed and mobile operators are being encouraged to move rapidly towards fixed-mobile convergence. The LRN IN solution has been adopted as the most appropriate formto achieve this convergence.
For the PCS-1900 system, the T1P1 committee of the Alliance for TelecommunicationsIndustry Solutions (ATIS) is developing the LRN-based solution which will imminently besubmitted to ANSI for acceptance of the US solution.
3.6.3. ITU-T
Work on number portability in general is being developed within SG2 and SG11 looking ataspects such as numbering, routing, network architecture and protocols. Little work hasbeen carried out at ITU level for the definition of MNP standards. A task force has beenestablished to begin initial definition work for MNP, and first met in February 1998.

The Costs of Introducing MNP
45
4. THE COSTS OF INTRODUCING MNP
4.1. Introduction
This chapter discusses the methodology developed to estimate the costs of variousimplementation and migration options, and also to determine the costs of the most likelyscenarios to be used in the Hong Kong environment. In so doing the study team hasdrawn on information gained from interviews with operators and users in Hong Kong,relevant industry contacts, previous international studies and knowledge of thetelecommunications industry to estimate the costs of potential implementation andmigration options. This chapter is structured as follows:
• Section 4.2 describes the methodology used to determine the costs of implementingand migrating between different technical options. This includes assumptions usedin the model, and a description of the cost elements considered.
• Section 4.3 discusses the cost of implementing the two favoured options and alsoexamines variations on the basic configurations to determine the sensitivity of theoverall cost to changes in key parameters.
4.2. Methodology
The underlying principle behind the determination of the cost of implementing mobilenumber portability is that only costs that are incurred as a direct result of the introductionof number portability are considered.
Furthermore in determining the costs, the underlying principle is that only that part of theexpenditure which is genuine resource cost to the Special Administrative Region (SAR)should be included. For example, software, hardware and services delivered from outsideHong Kong should be included, whereas profits5 on software developed for operators by aHong Kong based operation should not be included as these are transfers with the SARrather than genuine resource costs.
The cost model was submitted for scrutiny at a workshop held in Hong Kong to present theintermediate results of the study. Comments from OFTA and the operators have beenreceived and, where appropriate, used to modify the model.
4.2.1. Assumptions and costing principles
The cost of number portability can be directly or indirectly associated with different partiesaccording to whether work needs to be implemented by a particular party, or whether
5 Excess profits means profits above the rate of return required by lenders and shareholders, often referred to as "the cost ofcapital".

The Costs of Introducing MNP
46
inefficiencies associated with the solution which lead to the cost are borne by the party. Theparties to whom these costs have been associated are:
• HKTC and HKTI: the costs associated with these networks have been groupedtogether and separated from those costs associated with the alternative FNOsbecause several of the migration options require HKTC and HKTI to carry outchanges to their networks independent of the other operators;
• FNOs: fixed network operators other than HKTC and HKTI also incur costs undervarious solutions;
• Mobile operators: the costs associated with mobile operators will vary with factorssuch as the number of customers, length of time in market and technology etc., butfor the purpose of this study the operators have been grouped into small and largemobile operators dependent upon whether the operator had more than 100,000subscribers in October 1997. The resulting classification is shown in Table 4.1:
Table 4.1Categorisation of Mobile Operators in Hong Kong
Large operator Small operator
CSL* Hutchison PCS
Hutchison GSM Pacific Link PCS
Hutchison CDMA SUNDAY
SmarTone New World PCS
Pacific Link D-AMPS Peoples Telephone
P Plus Communications
*Note: CSL UNITACS is outside the scope of this study.
As discussed in the benefits section of this study, the costs incurred by customers can bedivided into three types:
• Type A customer costs: are those incurred by mobile telephone users who wouldchange network operator, even if MNP were not available. These costs are nottherefore caused by MNP. In fact they are reduced by it (e.g. the need to informfriends is avoided) and these reductions in costs are treated as benefits (seeChapter 5).
• Type B customer costs: are those incurred by mobile telephone users who would notchange network operator if MNP were not available. These include the costs of SIMcards, handset changes and other migration costs. These costs have been implicitlybeen netted out (i.e. treated as negative Type 1B benefits) in Chapter 5.
• Other customer costs: are those borne by customers making calls to mobiletelephones such as the extra dialling delay introduced by the MNP solutions.

The Costs of Introducing MNP
47
In estimating these costs no attempt has been made to determine how these costs should berecovered. This issue is addressed in detail in section Chapter 7.
The following assumptions have been made in order for the analysis to be in line with thebroad principles of the study:
• only costs for resources used within the Hong Kong SAR, or the price of servicesand materials purchased outside the Hong Kong SAR have been considered. Profitsover and above those deemed reasonable in the calculation of return on capital paidtowards companies’ operating within Hong Kong are excluded from costs (becausesuch profits remain within the SAR), whereas similar profits made by companiesbased outside Hong Kong are included, because this results in a net loss from HongKong as a whole. However, in the absence of detailed knowledge of the likelyimplementation route of each operator, estimates of these splits are necessarilyinaccurate;
• only costs associated with the implementation of MNP have been considered.Where a service or material would already have been incurred, only the marginalcost of providing the service or material for the MNP solution has been included;
• the cost of bespoke development work, for example, to modify the OSS, is difficultto assess without detailed knowledge of individual operators’ systems, andknowing the efficiency with which individual programmers work, but we haveestimated the cost of a man-year to be equivalent to $1.5 million/year. Similarly, incalculating customer costs (indirect costs borne by the subscribers, such as timewasted by waiting for calls to connect), we have assumed that the average salary inHong Kong is $120,000/year;
• where appropriate, reductions that can be made in the cost of implementing MNPdue to resources being shared between networks operated by the same company arenoted in the relevant section;
• estimation of opportunity costs are notoriously unreliable, and have therefore beendisregarded by the analysis;
• the later that costs are incurred, the lower they will ultimately be driven byincreased efficiency in the way activities may be combined with other programsgiven longer lead times, and the reduction in costs of technical equipment over time.This reduction in costs is assumed to be 5% per year for equipment including largecapital items6;
• the average time for a telephone conversation will remain at the current value of 38seconds, and the average number of calls made to each mobile telephone will remain
6 Costs of capital items are referenced to 1998 prices, reducing by 5% year on year ie after 5 years the cost of any item isassumed to be 0.77 of the cost in 1998. This factor is contained in the ‘Hardware cost reduction factor’ element in the ‘set-up’ and ‘On-going’ worksheets of the cost model.

The Costs of Introducing MNP
48
constant at 1888 calls per year, predicting a total airtime usage of 2715 millionminutes in the first half of 1999, scaling with the total number of mobile telephones;
• the number of subscribers that are likely to port over the next ten years is given insection 5.2.1;
• the telecommunications environment and equipment costs are valid as of January1998, when this analysis was carried out.
4.2.2. Cost elements
It is difficult in the present climate to calculate the costs of buying in equipment fromoverseas due to currency fluctuations. Therefore the costs of such items are necessarily bestestimates assuming that the currency will remain reasonably stable, that manufacturerswould adjust prices for them to remain competitive in Hong Kong, or that equipment canbe sourced from within Hong Kong.
4.2.2.1. Set-up costs and one-off costs
4.2.2.1.1. Solution development costs
For the call forwarding solution, a technique has already been implemented in the fixednetwork as an interim solution, and so no significant development would need to be carriedout besides minor verification and validation work. Such a solution has been implementedin Singapore using two mobile networks. Gateway Numbers (GN), in the form of NetworkIdentifiers (NI) in front of the Directory Numbers (DN), or Network Numbers (NN) can beused to forward calls, and these numbers have been allocated by OFTA, and can berecognised by HKTC’s switches. The extent of this validation work has been estimated as0.25 man-year of effort across all of the operators’ networks, or $375,000 ($1.5 million x0.25).
Similarly, to develop an extension to the existing distributed database solution wouldrequire minor alterations to be made to the existing FNO solution to accommodate themobile number ranges, but allow use of the same algorithm. The mobile operators wouldneed to develop their switches to accept numbers in the NN format. We have estimatedthat of the order 0.25 man-years of development time per operator would be appropriate,equating to $2.6 million.
4.2.2.1.2. Switch software upgrades
In order to implement the call-forwarding solution, no upgrade of the current softwareversion would be required. Likewise, the distributed database solution is an extension ofthe capacity of HKTC’s solution only, and therefore no software upgrade for additionalfunctionality at the SSPs would be required. Upgrades to software and SCPs are included insection 4.2.2.1.6.

The Costs of Introducing MNP
49
4.2.2.1.3. OSS development and implementation
Discussions with operators in the UK, Singapore and Hong Kong have identified thatdevelopment work will need to be carried out on the following generic OSS functions inorder for the technical and operational demands of number portability to be implemented:
• customer billing systems;
• customer information system;
• ordering system;
• internal service provisioning system;
• maintenance system;
• network management system.
A good approximation is that the work that needs to be carried out on the OSS is driven bychanges in operational procedures, and therefore the cost of this development work will besimilar for either solution. After discussions with all operators, and from the experience ofoperators that have implemented fixed number portability with similar support systems,we estimate that changes that would need to be made in each mobile network would be oforder 2 man-years of effort per operator, or $21 million.
HKTC would, by contrast, need to make fewer changes to its OSS, mainly associated withinterfaces to the database in the case of an off-switch solution, and for an on-switch solutionwould need to make no modifications as calls are handled in the usual manner. Thisassumes that the mechanisms for passing on the additional interconnection charges arehandled by the mobile operators alone. As an extension of the OSS development workdiscussed above, we estimate that less than 1 man-year of effort, or $1.5 million would berequired for an on-switch solution.
4.2.2.1.4. AD system
The current AD system would need to be extended to allow each mobile operator to informthe fixed operators of ported numbers. The current system typically comprises a smalldatabase and application based on a workstation, linked to the other operators via an X25link. The cost of this equipment is likely to be of order $75,000 per operator, or $525,000,though HKTC is likely to have to carry out extra development work in order toaccommodate the mobile operators, and this work has been assumed to cost $150,000; atotal of $675,000.
In order to cope with the large porting rate of mobile customers, it is anticipated that theAD system will form the basis of the information exchange for automatic provisioningsystem functionality. The operators have based their networks on state-of-the-artequipment which allows new customers to be enrolled with the minimum of manual input,

The Costs of Introducing MNP
50
most operators entering information into front-office systems which automatically configurerelevant switches and OSS.
In order to develop the functionality of these systems, however, we have assumed that $1million would need to be spent by each operator, and $5 million by HKTC; a total of $12million.
4.2.2.1.5. Procedural changes
In order to implement MNP, changes will need to be made to existing procedures, forexample handling of customers wishing to port their numbers at the point of sale, and newprocedures will need to be implemented unique to MNP, such as receiving informationfrom donor networks, staff training, coping with higher volumes of transactions at FNOsand extra contractual overheads associated with closing of existing subscriptions.
The changes to procedures associated with an off-switch solution are likely to be marginallymore onerous than for on-switch solutions because of the extra interface to the AD system,and large operators are likely to have more difficulty in adapting procedures. This isreflected in the costs associated with these changes which are given in the table below andare based on discussions with operators in Europe with similar experience. Thedevelopment of training courses in preparation for the introduction of MNP is also includedin this cost element.
Table 4.2Cost of Procedural Changes
HKTC/I Large operator Small operator On-switch 3 man-years ($ 4.5
million) 3 man-years ($ 4.5
million) 2 man-years ($ 3
million) Off-switch 4 man-years ($ 6
million) 4 man-years ($ 6
million) 3 man-years ($ 4.5
million)
4.2.2.1.6. Off-switch solution
In order to extend HKTC’s off-switch look-up solution, so that it has sufficient capacity tomake a data dip for all calls sent to any connecting mobile network, it would be necessaryfor there to be an expansion of the record holding capacity of the database from the current100,000 records to the expected required capacity of more than excess of 2,000,000 records,and a commensurate increase in processor capacity to handle the extra volumes of calls.
Without a detailed analysis of the configuration of HKTC’s network, and assessment ofoptions for migration to this increased capacity, accurate estimates of the cost to upgradethe facility is extremely difficult. HKTC have stated that it may be necessary to adopt aradically different technical configuration, as the current structure may not necessarily bescaleable.

The Costs of Introducing MNP
51
Furthermore, the migration strategy that HKTC would need to adopt, in order to cater forthe increase in demand due to a larger number of subscribers porting away from operatorsto whom the number has been allocated, is difficult to predict, and the strategy that HKTCmay adopt to deal with this ramped increase is difficult to predict being based on a host offactors.
We believe that the current HKTC solution could be expanded to the limit of its usefulcapacity of in excess of 200,000 record entries, before a major system upgrade is requiredbeyond the year 2000 when:
• the demand for MNP can be better estimated;
• the cost of IN, or similar equipment will have reduced;
• the migration can be better planned.
However, a high take-up rate of number portability could mean that earlier investment inthe expansion of capacity would be needed, and so we have assumed that to upgradeHKTC’s current system would require major investment of up to $150 million from thebeginning of the off-switch solution period in 1998, but staged over several years,expanding capacity when it is demanded. The assumed investment program is:
Investment date Investment (1998 prices) Immediately $75 million + two years $25 million + four years $25 million + six years $25 million
The actual level of this investment, however, would depend on factors such as the technicalarchitecture chosen, developments in IN technology, the actual porting rate of customersand timescales. The growth in the use of ‘transaction-oriented services’, calls requiring set-up and very short hold time, is difficult to assess, but the most significant impact that thiswill have on the telephone infrastructure in Hong Kong is a higher demand in the numberof calls to be set up. In this analysis, however, a pessimistic assessment of the number ofcalls to be set up is made in section 4.2.1, and the authors believe that the increase in suchtransaction-oriented services calls will be more than adequately compensated by this overestimate.
Expanding the HKTC solution in this way would alleviate the current problems that HKTCis experiencing in recouping the cost of a currently under utilised resource.
We have also included an additional cost of $1 million to reflect the marginal increase inindirect costs such as accommodation.

The Costs of Introducing MNP
52
4.2.2.1.7. SMS changes
The method by which the SMS system will be developed in the future is difficult to estimategiven the lack of standards for its operation. Were a form of signal relay functionality to befitted at a later stage, some of this cost could be allocated to MNP. We have assumedtherefore, that after year three an investment equivalent to $0.5 million at 1998 prices wouldneed to be made to each operators’ network to ensure that such a solution is compatiblewith MNP.
The Anglo-Dutch solution discussed in Section 3.5.5, which is being developed to supportMNP for the SMS services, may be able to be retrofitted on top of the off-switch solution.We have assumed, from predictions in the UK, that the cost of implementing suchfunctionality across the mobile networks is $20 million, assuming it is implemented in 2002,though the data concerning this ground-breaking technology means that this may have tobe revisited once it has been rolled out in the UK and Dutch networks, and possibly becomea standard. Implementation of this functionality in the FNOs' networks would haveadvantages for fixed services too, enabling SCCP-based services to operate, and so only themarginal cost of the development, reflecting the benefit to mobile users, need be included.
4.2.2.1.8. Data transfer
In order to implement an off-switch solution, it will be necessary for the data concerningmobile subscribers to be built up and transferred into the FNO database. We have assumedthat this operation will require $1 million to execute according to estimates submitted to usby the operators.
4.2.2.1.9. Migration costs
The cost for migrating from a call forwarding solution to a database look up solution hasbeen assumed to be the same as the costs of implementing the solution immediately, withan appropriate reduction in costs associated with the later implementation discussed above,plus 2 man-years of effort per operator (including HKTC) to manage the transition(including a period of dual-operation) and make any additional modifications to systems.In total this amounts to a net additional cost of $24 million.
For the transition to a call drop back solution, it is unlikely that the technical problems willbe able to be overcome and a solution developed in time for its implementation after 12months. It is interesting however, to estimate the benefits that would accrue were it to bedeveloped, and to this end we have assumed that a nominal 10 man-years of effort wouldneed to be invested as a best-case, say $15 million.

The Costs of Introducing MNP
53
4.2.2.2. Per-subscriber costs
4.2.2.2.1. Switch and OSS administration
The cost associated with per line porting of customers would comprise the effort ofswitching on the unconditional call forward at the donor switch, extra work in mobiletelephone outlets and associated paper work. In line with estimates of the work required inother countries7, and using the cost estimated for the porting of fixed numbers during thefixed number portability interim solution, we believe that the likely costs will be $150 perport.
Once the off-switch solution has been implemented, the addition of a new subscriber to anoperator will have little effect in the way of changes to be made to the network because theinformation can be entered into the relevant system easily and with little more effort thanthat required to register a new customer, and therefore we have assumed that the marginalcost of porting to the donor network operator will be $10.
For the purposes of the cost-benefit analysis, it is necessary to account for the total cost ofmigrating type B customers. We have assumed that the present level of automation can beachieved in the enrolling of customers, and that the main cost would be the entering of thecustomer’s details onto the front-end IT systems. We have assumed that this would require20 minutes, and this, together with other minor system administration is equivalent to $75per entry.
4.2.2.2.2. HLR licenses
The call forwarding solution uses up capacity of the mobile operators’ GMSCs. This isincluded in the on-going costs (see below), but each donated subscriber also causes an extraentry in the donor operator’s HLR, for which a license fee must be paid. Operators in theUK have confirmed that a reasonable price would be $90 per entry. Once the MNP solutionhas migrated to an off-switch solution, these costs will no longer be borne. Expanding theequivalent capacity of the D-AMPS system may be more expensive, and so we haveassumed that the average cost would be $100 per entry.
4.2.2.3. On-going costs
4.2.2.3.1. Additional conveyance: additional interconnection charges
Extra costs associated with the tromboning of calls through the donor network via HKTCwill be charged at 6.7 cents per minute per call leg. However, these calls are not terminatedwithin HKTC’s network, and many will be able to be efficiently routed through ICGs.Therefore the cost to HKTC will be less than the full interconnection, and we have estimated
7 For example the costs quoted by BT and cable operators as to the cost of porting numbers on fixed switches which wouldrequire a similar amount of manual labour to be carried out.

The Costs of Introducing MNP
54
that the efficiency gains would reduce costs to 70%.
New World TC and New World PCS are directly interconnected, as are Hutchison andSmarTone’s networks, where calls will be able to be routed still more efficiently, makingthis a worst-case estimate.
For the call drop back and database look up solutions, these costs will not be incurred.
4.2.2.3.2. Additional conveyance: additional GMSC resource costs
Whilst the call forwarding solution is in place, capacity in the donor network operator’sGMSC will be used up in forwarding calls on to the recipient operator. It is not clear whatfraction of the capital and operating costs of this equipment should be attributed to the useof subscriber ports during the duration of calls, the loss of call forwarding functionality andthe extra processing that is required but as a worst-case the following algorithm has beenused.
We have estimated the extra capacity that the mobile operators would require at theirGMSC to be the number of busy hour ported calls, assumed to be five times the averagenumber of ported calls in progress. The traffic forecast data is based on logged data overthe past 12 months.
The cost of buying, operating and maintaining a GMSC, according to sources in the UK, isassumed to comprise a capital cost of $60 million plus 5% for maintenance and 5% foroperation, which provides capacity for 150,000 subscribers. Writing this cost ($120 million)off over 10 years, is equivalent to an annual cost of $80/year/line.
Once a call drop back or database solution is implemented, these costs are no longeraccrued.
4.2.2.3.3. Extra signalling costs
The extra costs for signalling associated with each of the solutions are not charged by HKTCbut still impact on the analysis. It is difficult to quantify these costs exactly, but after talkingto manufacturers, we have estimated the costs by assuming the extra signalling capacity percall is as shown in the table below, and from this estimating the number of extra signallinglinks that are required.
Table 4.3Extra signalling time per call associated with each solution.
Solution Signalling time (s) Call forwarding 0.3 Call drop back 0.3

The Costs of Introducing MNP
55
For the off-switch solution, it has been assumed that it will be necessary for HKTC to laynew links between the SCP and the 10 SSPs. We have analysed the likely traffic over thislink carrying INAP SS7 messages, and believe that E1, or equivalent capacity links willsuffice. The annual rental cost for these links would be $1,140,000 (10 x $57,000 x 2, the costof renting an E1 link from HKTC) in 1998, and we have used this as a worst-case, on-goingcost.
4.2.2.3.4. IN system & database administration and maintenance
The marginal costs of maintaining and operating the IN system and database solution havebeen estimated, according to estimates from the Hong Kong operators, to be 5% of thecapital cost per year for maintenance, and 3% per year to operate the system.
4.2.2.3.5. MNP associated procedures
Once MNP has been established there will be new procedures necessary for the portingprocess, and some old procedures will need to be developed and subsequently will requiremore effort to complete. From experience of operators implementing number portability inEurope, we have estimated this to be $100,000 per operator plus $200,000 for HKTC. Thisdoes not include the cost of porting individual subscribers, which is included in the ‘Switchand OSS administration’ element described in section 4.2.2.2.1.
4.2.2.4. Customer costs
4.2.2.4.1. Dialling delay
Calls to ported subscribers will experience an additional dialling delay associated with theporting technology. We have assumed that this delay would be 0.3 seconds on average forcalls to ported numbers during a call forward solution, and 0.2 seconds on average to allnumbers during an off-switch solution, though this is a pessimistic estimate based onworst-case technology; in the future, equipment that is likely to be used for such a MNPapplication (where the data is held in on-board memory) the delay will be less than 0.1seconds.
We have assumed that the salary costs of the originators of these calls can be multiplied bythis extra delay imposed to derive the costs associated with MNP.
4.2.2.5. Total costs
In the spreadsheet model, the cumulative real cost of implementing each solution has beencalculated, but a discount allowing for when the investment is made has been calculatedand referred back to the second half of 1998. The assumed discount rate is 6%.

The Costs of Introducing MNP
56
4.3. Options
4.3.1. Introduction
This section considers the costs of various options for the implementation of MNP in HongKong. In the discussion of the technical feasibility of the solutions and migration options,the number of realistic solutions to be considered in the medium-term has been reduced to arealistic sub-set of the options available. In the cost modelling work that has been carriedout, these options have been examined in some detail to assess the cost of the solutionsgiven realistic variations in the factors that affect these costs.
The number of implementation options available has been reduced to:
• call forwarding;
• call drop back;
• distributed database look up in the fixed network only.
The main migration options that have been considered, and for which detailed sensitivityanalysis has been carried out, are:
• option 1: immediate roll-out of the off-switch solution with database look-up inHKTC’s network;
• option 2: migration via call forwarding functionality to an off-switch solution withdatabase look-up in HKTC’s network.
The above options are considered in detail with various assumptions made concerningchurn levels, the time to implement MNP and the time to migrate from the interim to off-switch solution.
Variations on these migration options that have been modelled include migration via calldrop back functionality to an off-switch solution with database look-up in HKTC’s network.
4.3.2. Sensitivity analysis
For the main migration options, sensitivity analysis has been carried out on the followingfactors.
4.3.2.1. Churn predictions
Predictions have been made concerning the likely number of subscribers that will churnbetween Hong Kong’s networks over the period of the study. Two cases have beenconsidered:

The Costs of Introducing MNP
57
• low churn: the most likely number of customers of both type A and type B that arelikely to churn if MNP is in place;
• high churn : the worst-case (largest) number of customers of both type A and type Bthat are likely to churn if MNP is in place.
4.3.2.2. Type A customer porting rate
If MNP is available, it is likely that initially some of the type A customers – those thatwould have churned anyway – would not be aware of the ability to port their numbers.Therefore it has been assumed that the take up of MNP by these customers will build upover time and eventually reach level of 90%. Two distributions for this "ramp" profile havebeen assumed:
• low porting rate: the least likely build up rate of type A customers that would take upMNP ;
• high porting rate: the most likely build up rate of type A customers that would take upMNP.
4.3.2.3. Implementation and migration timescales
In calculating the benefits of MNP, three dates have been assessed as possible forimplementation. These dates are:
• optimistic start date: 1 January 1999;
• realistic start date: 1 July 1999;
• pessimistic start date: 1 January 2000.
The timescales for the implementation and migration of the various options that have beenconsidered are discussed in the technical assessment section. Some of these options are notpossible by the optimistic start date, and various migration period have been considered.Figure 4.1 below shows the implementation and migration options that have beenconsidered.
For the migration from the call forwarding solution to a database solution a delay of 12months has been considered as realistic, though a pessimistic 18 months timescales has alsobeen considered.

The Costs of Introducing MNP
58
Figure 4.1Implementation and migration timescales considered
Task NameStart dates (opt. real. pess.)
Option one - realistic start
Option one - pessimistic start
Option two- optimistic start
Option two- realistic start
Option two- pessimistic start
Option two- realistic start; long migration
Option two- optimistic start; long migration
Option two- with call dropback
Dropback period
Qtr 1 Qtr 2 Qtr 3 Qtr 4 Qtr 1 Qtr 2 Qtr 3 Qtr 4 Qtr 1 Qtr 2 Qtr 3 Qtr 4 Qtr 1 Qtr 2 Qtr 3 Qtr 4 Qtr 1 Qtr 2 Qtr 3 Qtr 4 Qtr 1 Qtr 2 Qtr 31999 2000 2001 2002 2003 2004
4.3.2.4. Call drop back
The implementation of a call drop back solution is probably technically not achievable inHong Kong in the required timescales, but it is interesting to note the impact that thedevelopment of such a solution would have. We have considered therefore, itsimplementation after six months of call forward operation for the worst-case (optimisticstart; long migration) scenario.
4.3.3. Migration option one: direct to distributed database look up
Two migration options have been considered for the direct roll-out of an extension of theFNO solution. Implementation by the realistic date (1 July 1999) and by the pessimistic date(1 January 2000). Table 4.4 below shows the estimated costs of implementing this option fordifferent combinations of churn and Type A customer take up rates for porting.
Table 4.4 below shows the estimated costs of implementing these options for differentcombinations of churn rate and Type A customer porting take up rate over ten years. Thesecosts are expressed in net present value terms using the second half of 1998 as the baseperiod.
Table 4.4NPV of costs for migration option one over ten years
Implementation date Low churn High churn
Low type Aport
High type Aport
Low type Aport
High type Aport
1 July 1999 $ 548 million $ 565 million $ 666 million $ 683 million
1 January 2000 $ 512 million $ 529 million $ 630 million $ 647 million
Figure 4.2 shows the real costs of MNP using migration option one versus time over theten-year time period for a 1 July 1999 start date.

The Costs of Introducing MNP
59
Figure 4.2Real costs profile for MNP for each churn assumption and type A customer take-up rate
(based on Option 1; 1 July 1999 implementation)
0
20
40
60
80
100
120
140
160
180
H2:1998 H1:1999 H2:1999 H1:2000 H2:2000 2001 2002 2003 2004 2005 2006 2007 2008 2009
$ m
illi
on
Low churn; low type A
Low churn; high type A
High churn; low type A
High churn; high type A
Note: H1:2000 = first half of 2000.
Figure 4.3 shows the proportion of costs that can be attributed to the cost elements as a totalof the Net Present Value (NPV) cost with a low churn rate and low type A porting build uprate.
Figure 4.3Proportion of NPV costs attributed to MNP (based on Option 1; 1 July 1999
implementation; low churn assumption; low Type-A customer port assumption)
Set-up
Per-subscriber set-up
On-going
Customer costs

The Costs of Introducing MNP
60
Figure 4.4 shows the real costs of MNP for the same case.
Figure 4.4 Real costs profile for MNP showing contribution of each of cost elements (based on
Option 1; 1 July 1999 implementation; low churn assumption; low Type-A customer portassumption)
0.00
20.00
40.00
60.00
80.00
100.00
120.00
140.00
160.00
H2:1998 H1:1999 H2:1999 H1:2000 H2:2000 2001 2002 2003 2004 2005 2006 2007 2008 2009
$ m
illi
on
Set-up (mn)
Per-subscriber set-up (mn)
On-going (mn)
Customer costs (mn)
Note: H1:2000 = first half of 2000.
4.3.4. Migration option two: call forwarding migrating to distributed database look up
Five migration options have been considered for the roll-out of MNP using a callforwarding technique, with subsequent migration to an extension of the FNO solution.Combinations of implementation by the optimistic date (1 January 1999), realistic date (1July 1999) and by the pessimistic date (1 January 2000), and realistic and long migrationtimes to the look up solution of 12 and 18 months respectively.
Table 4.5 below shows the estimated costs of implementing these options for differentcombinations of churn and Type A customer porting take up over ten years. These costsare expressed in net value terms appropriate to the second half of 1998.

The Costs of Introducing MNP
61
Table 4.5NPV of costs for migration Option two over ten years
Implementation date Low churn High churn
Low type Aport
High type Aport
Low type Aport
High type Aport
1 Jan 1999 12 months $ 620 million $ 695 million $ 803 million $ 878 million
1 July 1999 12 months $ 603 million $ 686 million $ 750 million $ 833 million
1 Jan 2000 12 months $ 613 million $ 711 million $ 789 million $ 887 million
1 Jan 1999 18 months $ 676 million $ 801 million $ 909 million $ 1034 million
1 July 1999 18 months $ 685 million $ 835 million $ 895 million $ 1044 million
Figure 4.5 shows the real costs of MNP using migration option two with time over the ten-year time period for a 1 July 1999 start date.
Figure 4.5Real costs profile for MNP for each churn assumption and type A customer take-up rate
(based on Option 2; 1 July 1999 implementation; 12 months migration)
0
20
40
60
80
100
120
140
160
H2:1998
H1:1999
H2:1999
H1:2000
H2:2000
2001 2002 2003 2004 2005 2006 2007 2008 2009
Low churn; low typeALow churn; high type
High churn; low typeAHigh churn; high typeA
Note: H1:2000 = first half of 2000.

The Costs of Introducing MNP
62
Figure 4.6 shows the different elements of the real costs of MNP for the same case.
Figure 4.6Real costs profile for MNP showing contribution of each of cost elements (based on
Option 2; 1 July 1999 implementation; 12 months migration; high churn assumption; highType A customer port assumption)
0.00
20.00
40.00
60.00
80.00
100.00
120.00
H2:1998 H1:1999 H2:1999 H1:2000 H2:2000 2001 2002 2003 2004 2005 2006 2007 2008 2009
$ m
illi
on
Set-up (mn)
Per-subscriber set-up (mn)
On-going (mn)
Customer costs (mn)
Note: H1:2000 = first half of 2000.
4.3.5. Call drop back
Table 4.6 below shows the estimated costs of implementing these options for differentcombinations of churn and Type A customer porting take up over ten years. These costsare again expressed in net present value terms appropriate to the second half of 1998, andshow in significant savings for each case.
Table 4.6NPV of cost for migration option two with call drop back over ten years
Implementation date Low churn High churn
Low type Aport
High type Aport
Low type Aport
High type Aport
1 Jan 1999 18 months $622 million $707 million $807 million $892 million

The Costs of Introducing MNP
63
4.3.6. Required expansion of HKTC’s network
Roll out of a call forwarding-based solution could be threatened by unavailability of thenecessary extra capacity on HKTC’s network to service the extra capacity demanded,caused by the tromboning of calls through the network. Therefore, an attempt has beenmade to estimate the required extra capacity, and the timescales over which it is required.
The extra capacity has been calculated by predicting the average number of such calls inprogress8 and multiplying by two to reflect the two extra links. The capacity to be sufficientto service demand in the busiest hour, and to reflect the relatively inefficient usage of trunksto each of the 7 operators is assumed to be five times9 the average capacity. The number ofE1 links is arrived at by dividing by 30.
Table 4.7Extra demand on HKTC/HKTI interconnection capacity during call-forwarding phase of
Option 2 strategy for various implementation dates
Options Cumulative number of extra E1 lines
1 Jan 1999 1 July 1999 1 Jan 2000 1 July 2000
1 Jan 1999 12 months 43 108 0 0
1 July 1999 12 months 86 207 0
1 Jan 2000 12 months 129 322
1 Jan 1999 18 months 43 108 186 0
1 July 1999 18 months 86 207 388
Call drop back 63 0 0 0
The cost of this extra capacity has been included in the analysis, but in order to calculate theexpansion capacity required, table 4.7 summarises the required capacity, and over whattimescales, for each of the option two migration strategies.
4.3.7. Discount rate
We have assumed that an appropriate figure for the real discount rate is 6%. However, wehave also looked at the effect of using a value of 8%. Table 4.8 shows the comparison of theNPV of the cost of MNP using this value for a 1 July 1999 implementation date with highchurn rate, and high Type A customer porting take up.
8 A pessimistic estimate of the number of calls to ported numbers has been arrived at by assuming that during this period allsubscribers that port are doing so for the first time, and therefore the total number of customers that have ported is equal tothe number of porting actions. It is then assumed that of all calls to mobile telephones, the fraction that are to portednumbers is same as the fraction of subscribers that have ported.
9 In a large operators’ network, the ratio of peak to average traffic lies between three and five. For the Hong Kongenvironment the worst-case has been taken.

The Costs of Introducing MNP
64
Table 4.8Sensitivity of NPV costs for differing discount rates (based on Option 2; 1 July 1999
implementation; 12 months migration)
Discount rate Cost
6% $833 million
8% $768 million
It can be seen that the results are not very sensitive to the change in discount rate.
4.3.8. Comparison
Figure 4.7 shows a comparison of the cumulative discounted cost profiles for each of themigration strategies discussed above assuming the low churn rate and low Type Acustomer porting take up cases. This gives a guide to the cost profile of each of thesolutions with time. It should be noted that for the options with earlier initialimplementation dates, the profile ends correspondingly earlier in order for a ten-yearcomparison to be carried out for each profile.
All solutions lie within 15% of the median end value – ‘Option 2; 1/7/99; 12 monthsmigration’. The cheapest options are the immediate development of an off-switch solution –Option 1 – but the likely delay in timescales, and corresponding reduction of overallbenefits favours Option two; this is discussed in more detail in the next section.
It is interesting to note in comparing the profiles for ‘Option 2; 1 January 1999; 18 monthsmigration’ and ‘Option 2; 1 July 1999; 18 months migration’, that the 6 months delay inimplementing the initial call forwarding solution equates to over $80 million greaterexpense, despite the off-switch hardware costing correspondingly less. This is attributed tohigher Customer costs, due to the expected rapid rise in the number of subscribers tomobile services over the next few years; and to increased Per-subscriber costs caused bycustomers having longer to become aware of the facility and taking advantage of it duringthis phase.

The Costs of Introducing MNP
65
Figure 4.7 Cumulative discounted cost profiles for each implementation option
0
100
200
300
400
500
600
700
800
H2:1998 H1:1999 H2:1999 H1:2000 H2:2000 2001 2002 2003 2004 2005 2006 2007 2008 2009
$ m
illi
on
Option1: 1/7/99
Option1: 1/1/00
Option2: 1/1/99 12 months migration
Option2: 1/7/99 12 months migration
Option2: 1/1/00 12 months migration
Option2: 1/1/99 18 months migration
Option2: 1/7/99 18 months migration
Call drop back
Note: H1:2000 = first half of 2000.

Benefits of MNP
66
5. BENEFITS OF MNP
5.1. Background
The introduction of MNP can be expected to provide benefits to a wide range of consumersin Hong Kong. In particular, mobile users will be able to enjoy the benefits of competitionwith reduced switching costs. Callers to mobile numbers will also benefit as they willencounter fewer misdialled call. We have attempted to measure these benefits bycategorising them into the following groups:
• Type 1 benefits: are defined as the benefits which accrue to subscribers who retaintheir number when changing operators.
• Type 2 benefits: are the efficiency improvements and any associated price reductionswhich result from increased competitive pressure.
• Type 3 benefits: are the other resource savings that arise from fewer numberchanges and include fewer misdialled calls and changes to information stored incustomer equipment.
When measuring the benefits of MNP, we developed a number of scenarios to provide arange for the size of the benefits:
• the best case: an optimistic scenario where MNP is introduced in 1 January 1999 andchurn increases by 15 per cent;
• the central case: a realistic scenario where MNP is introduced in 1 July 1999 andchurn increases by 10 per cent; and
• the worst case: a pessimistic scenario where MNP is introduced in 1 January 2000and churn only increases by 5 per cent.
We also conducted sensitivity analysis on the number of customers that change operatorsand retain or ‘port’ their number. This is discussed in more detail in Section 5.2.1.
Although some mobile operators in Hong Kong have questioned some of our assumptionsregarding penetration rates, churn rates, and the porting rate, it is worth noting that webelieve that our assumptions if anything, err on the conservative side. Indeed, theestimates used in this chapter were drawn from the survey of mobile users in Hong Kong,interviews with mobile operators and other parties, international experience, and otheravailable data. The user survey was conducted by SOFRES FSA between December 1997and February 1998. They interviewed 450 personal subscribers, 450 small to mediumbusiness users, and 100 large corporate firms across Hong Kong in order to determine theirviews on mobile services, their switching behaviour and their attitude to MNP. The surveycomposition - determined by NERA and agreed by OFTA - is generally consistent with therelative size of each group of those subscribers in the UK (see section 5.2.1).

Benefits of MNP
67
The survey results and questionnaires are presented in the Appendices. Appendix F alsoprovides a brief explanation of how the benefits of MNP have been calculated.
5.2. Type 1 Benefits
There are two categories of Type 1 benefits. Type 1a benefits are the savings that accrue tothose subscribers who would have changed operators regardless of the availability of MNP.The benefits to these customers, once MNP is available, are the saving they make byavoiding the costs associated with switching (such as informing friends or changing theirstationery). The second category of Type 1 benefits - Type 1b - accrue to those subscriberswho only switch because of the availability of MNP. These subscribers benefit from accessto lower prices, improved service etc.
Type 1 benefits can be estimated as follows. Mobile subscribers will switch to alternativeoperators if the call bill saving and any other additional benefits (“the discount”) exceedsthe costs of switching between operators. These include the cost of a new SIM card and anew handset (if that is necessary), the time taken to research the market and register with anew operator, as well as the costs of changing number in the absence of MNP. These costsof switching can be represented by a minimum required (“threshold”) discount in order forthe subscriber to be prepared to move to a new operator.
For the situation pre MNP, the threshold discount is represented by do in Figure 5.1 and thenumber of subscribers switching between the operators concerned is given by So. With theintroduction of MNP, the costs associated with changing to a new operator decline andhence so too does the threshold discount (to d1). As a result, S1 subscribers now migrate tothe new operator.10 The "Type 1" benefits associated with this change are depicted by areasA and B. Area A represents the benefits to those who would have switched anyway (i.e.the reduction in the costs associated with changing number). Area B shows the benefits tothose who switch operators because of MNP. Here the benefits are given by the differencebetween the discounts received and the new, lower threshold discount.11
10 We assume that the ‘discounts’ offered by one operator against another remain the same following the introduction ofMNP.
11 As mentioned above, we have assumed that the discount threshold post MNP reflects residual switching costs. Analternative assumption is that some part of the threshold discount results from bounded rationality (where consumers justdo not respond to savings below a certain level, for cognitive reasons). When modelling the benefits of MNP we relied onthe former, conservative assumption.

Benefits of MNP
68
Figure 5.1Type 1 Benefits of Mobile Number Portability
"Discounts" offeredby alternativesuppliers
Threshold discountpre portability
Threshold discountpost portability
Number of subscribers
%
Customer bill
A B
A = benefits to customers who would switch operators in the absence of number portabilityB = benefits to customers who switch operators as a result of number portability
Subscriberspre numberportability
Subscriberspost number
portability
d o
d 1
So S1
ali\figures
Given estimates of the pre and post MNP threshold discounts, the level of “discount”offered by the new operators and the size distribution of mobile call bills, it is possible toestimate Type 1 benefits. The framework or approach we will use to estimate the twocategories of Type 1 benefits is discussed in the following sections:
5.2.1. Methodology for measuring type 1a benefits
The nature of Type 1 benefits depends on how each subscriber would behave in the absenceof number portability. Type 1a benefits refer to those subscribers who would switchoperator regardless of the availability of MNP. In the absence of MNP, business subscribersin particular would need to inform existing and potential customers of their new number,probably through a mixture of mailshots and advertising. In Hong Kong, however, thismay be a less important consideration as customers may typically be able to contact abusiness through a fixed network number or a pager. Some businesses may also remainwith their existing operator and make use of call forwarding services. Other costsassociated with a change of number include the cost of printing new stationery, repaintingvehicles and changing other references to the old telephone number.

Benefits of MNP
69
In such cases, the benefits of number portability are the costs avoided as a result of nothaving to change number, so would include the costs of changing stationery, notifyingcustomers and so on, and also the cost of call forwarding or other number notificationservices. Although individual business users would include the potential loss of businessin the costs of a number change, this should be excluded from the cost benefit calculation ifthe business is simply transferred to competing suppliers. To the extent that business istransferred to a less efficient supplier, however, there will be a reduction in the well being ofthe economy as a whole. In practice, however, this latter effect will be very difficult tomeasure and, although a benefit, we have ignored it in our modelling.
Some subscribers who switch operator might have done so anyway, but in the absence ofnumber portability they may have retained their existing mobile service so as to continuereceiving calls on their existing service. This is referred to as dual sourcing and the costssaved by the fact that this is no longer necessary should also be included as a Type 1abenefit.
Our approach to determining the Type 1a benefits for those who would have switchedregardless of the availability of MNP can, therefore, be described as a four stage process:
• first, we determine the total number of Small and Medium Enterprises (SME) andpersonal subscribers switching over the next 10 years (without MNP);
• second, we estimate the cost savings enjoyed by those subscribers who would haveswitched anyway but who will avoid a change of number given MNP;
• third, we make assumptions about the number of subscribers that dual source;
• fourth, we adjust the results to eliminate transfers within the economy. Forexample, the costs to business users of changing number might include their loss ofbusiness to competitors.
Stage 1: Forecasting churn rates
The methodology used to forecast the number of mobile subscribers in Hong Kong over thenext 10 years and the associated rate of churn was discussed in greater detail in AppendixA. Our assumptions are based on discussions with mobile operators in Hong Kong and areconsistent with similar estimates made in countries displaying similar market characteristicsto Hong Kong. These churn rates affect the size of Type 1a benefits as they determine howmany subscribers could potentially save switching costs. The churn rates we have used areconsistent with those estimated for other countries with a similar penetration rate to HongKong and take into account the competitive nature of the mobile telephony market in HongKong.12
12 Although some of the churn may be intra operator churn, these subscribers will still benefit from avoiding a numberchange.

Benefits of MNP
70
However, not all subscribers that churn will benefit from the availability of MNP. Onlythose subscribers that port (retain) their existing number benefit by saving on switchingcosts (such as informing friends and customers, or changing their stationery etc. Ourestimates on the penetration rate, churn rate and the porting rate are shown in Table 5.1.
Table 5.1Our Assumptions on Switching Behaviour (per cent)
Per cent of Type 1a switching subscribersthat port
Penetrationrate
Base case churn rate(without MNP)1
Predicted take-up of MNP
Low take-up of MNP
1997 29 40 na na 1998 36 38 na na 1999 42 36 30 15 2000 48 34 50 25 2001 52 32 70 35 2002 55 30 90 45 2003 56 28 90 55 2004 58 26 90 65 2005 59 24 90 65 2006 59 22 90 65 2007 59 20 90 65 2008 60 20 90 65 2009 60 20 90 65
1 The base case churn rate is the market average churn rate. Churn between the differentsystems in Hong Kong will differ and is shown in Appendix A. The introduction of MNP isestimated to increase these churn rates by 5 per cent under the low additional churn scenarioand by 15 per cent under the high additional churn scenario.
Source: NERA estimates
In both the predicted and low porting rates, we expect relatively little porting in the earlyyears of MNP. This is due to a possible lack of awareness. The Consumer Council in HongKong suggested that the lack of consumer awareness was one reason why the fixednetwork has experienced relatively low levels of porting.
We expect the predicted porting rate to rise once MNP is better established. Such anincrease would also be consistent with the recent experience with fixed number portabilityin Hong Kong where the number of porting customers has risen significantly. OFTAsuggest that over 90 per cent of people that churn in the fixed network have retained theirnumber. The remainder may not port for a number of reasons including a desire to changetheir telephone number.
A charge on subscribers that port may also affect the porting rates. The decision as towhether to charge customers directly for MNP is one for each operator to make and it isunclear whether many recipient operators would even charge subscribers for porting.There is currently no direct charge for fixed network portability in Hong Kong, and we

Benefits of MNP
71
would expect a similar situation to arise for MNP.
Measuring the impact of a charge on MNP is problematic because of the uncertainty of sucha charge. As just mentioned, it is unclear how many operators would actually impose sucha charge and what level the charge would be set at. There is also no information about theelasticity of subscribers to such a charge. We have, nevertheless, attempted to incorporatethe impact of such a charge on subscribers by estimating a lower porting rate. In otherwords, although subscribers would still churn, fewer would port their number because ofthe charge they would face. The low porting rate assumption estimates that only two thirds(rather than 90 per cent) of those who churn would retain their number.
Stage 2: Estimating the cost savings
The cost savings used to estimate the switching costs were derived from the user surveycarried out by SOFRES FSA. While some mobile operators have questioned some of thefindings of the survey, we have no reason to doubt the validity of the survey results.Indeed, the size of the survey - 1000 respondents - suggests that results can be treated witha reasonable level of confidence.
The survey suggested that the costs of switching between operators are high. The surveycarried out as part of this study showed that in the absence of MNP, residential andbusiness subscribers taken together incurred an average one-off cost of $254 whenswitching between operators. The costs were higher for business subscribers than forpersonal subscribers. The switching costs are lower than in the preliminary report as theyare now based on a weighted average of mobile subscribers. The share of personal andSMEs mobile subscribers in the market was estimated using data for the UK as well aspublicly available estimates on what that share will be in 10 years time.13
Most (90 per cent) of business users were required to change their number when theyswitched operators. Only those that who moved between the analogue and digitalnetworks of the same operator avoided such a change. On average, business subscribersincurred one-off costs of $143 informing friends or colleagues of the number change. Inaddition, 46 per cent of those business that had to change their number spent an average of$523 to change stationery while 7 per cent also spent an average of $628 on repainting signs,changing brochures etc.14
13 From the cost benefit analysis of MNP for the UK in 1997.
14 Some mobile operators suggested that the loss of profits to printers and painters should be considered against the savingsmade by subscribers in the cost benefit analysis. Only if excess profits are being made should any deduction occur.However it is doubtful whether there are excess profits in this case in Hong Kong. Where excess profits are not beingmade, the costs of stationery etc are a true measure of the resource costs involved (including the required rate of return i.e.the cost of capital). Resource costs reflect the value of the resources concerned in alternative uses and have to be taken intoaccount in any cost benefit analysis.

Benefits of MNP
72
As with business subscribers, a large majority (90 per cent) of personal subscribers who hadswitched mobile operators in Hong Kong in the past reported that they had to change theirnumber. Those subscribers that were required to change number stated that they eachinformed an average of 33 people at an average total cost of $114. Of the personalsubscribers that were required to change their number, eight per cent also incurred ‘othercosts’. These additional costs included changes to cards and stationery.
Stage 3: Estimating the number of dual sourcers
In the absence of MNP, we would expect some subscribers to subscribe to two operatorssimultaneously in order to avoid the switching costs associated with a number change.These subscribers, however, would face increased administration costs from dealing withtwo operators and higher monthly charges (due to their inability to switch to a low costoperator for a complete service). The availability of MNP would, therefore, be expected toeliminate the costs associated with dual sourcing by those who do so to avoid the switchingcosts.
The results of the user survey, however, suggested that few subscribers joined more thanone network because of the absence of MNP. The survey showed that 12 per cent ofrespondents currently (or at some stage) subscribed to multiple operators. The mostpopular reason for dual sourcing was to achieve better coverage. In Hong Kong, there issome evidence that some subscribers are subscribing to one or more new PCS operators butare also retaining their GSM subscription because of the relatively poor coverage of the newentrants. This, however, is expected to change as PCS operators expand their coverage overthe next 18 months.
Some of these subscribers, particularly large business users, might dual source for securityreasons (that is, so they can still make and receive calls if there is a fault on one operator’snetwork), and so would continue with such an arrangement even if number portability wasavailable.
We conclude that few people in Hong Kong currently dual source because of the lack ofMNP. In other words, a majority of the subscribers that currently dual source in HongKong would continue to do so if MNP were available because of geographic coverage andother reasons. Therefore, we have not made any allowance for the avoided costs of thosewho would no longer dual source with MNP in our modelling of benefits. This omissionmeans that our estimate of the benefits errs on the conservative side.
Stage 4: Adjusting the results to capture transfers in the economy
One of the costs faced by businesses when changing a number might be the loss of businessthey incur when customers are unable to contact them. However, these costs should beincluded in our cost benefit analysis only if they represents a genuine loss of business andnot simply a transfer of business between competing suppliers.

Benefits of MNP
73
As discussed in Stage 2, the estimates we used to measure the switching costs were derivedfrom the user survey. The survey asked business to nominate the costs they incurred ininforming customers of the number change, the costs involved in changing stationery andbusiness cards, and any other costs they incurred (such as changing brochures or repaintingvehicles etc.). The survey did not ask businesses to estimate their losses to competitorsarising from a number change.
In our view, the loss of business from a change in the mobile phone number is likely to benegligible. Almost all business will face a trade-off between the costs of informingcustomers of their new number and the likely loss of business following a number change.Given the once-off nature of the costs of informing customers (compared with the possiblypermanent nature of lost business), we would expect a firm facing a potentially large lossof business to invest quite heavily in all possible ways of informing customers. Any firmwhich faces a really serious loss of business, moreover, is unlikely to be among the group ofsubscribers who switch operators in the base case.
The loss of customers to business through a number change is also likely to be smallbecause of the options available to customers. The survey also showed that a significantmajority of SME subscribers used a pager as well as a mobile phone (43 per cent). For thatgroup of SMEs, over 41 per cent of customers used the pager to call the business. In short,if customers could not contact a SME by mobile phone they have many other optionsincluding the fixed network number or a pager. Also, what losses there are will largely bepicked up by competitors.
5.2.2. Estimates of Type 1a benefits
Type 1a benefits are the largest source of benefits following the introduction of MNP inHong Kong. Table 5.2 illustrates those benefits under the three scenarios discussed inSection 3.1. In addition, we have conducted a sensitivity analysis on the number of portingcustomers given the alternative estimates in Table 5.1.
Table 5.2Type 1A Benefits Under All Scenarios
Scenario NPV (1999-2009) HK$Millions (high porting)
NPV (1999-2009) HK$Millions (low porting)
Best case (MNP in 1 January 1999, high churn) 1,124 683 Central case (MNP in 1 July 1999, medium churn) 1,093 667 Worst Case (MNP in 1 January 2000, low churn) 1,062 652
The benefits in the table above range from a net present value of HK$652 million toHK$1,124 million over the 10 year period in question.

Benefits of MNP
74
5.2.3. Methodology for measuring type 1b benefits
Type 1b benefits accrue to those subscribers who switch operators only as a result ofnumber portability. In other words, they would remain with their current operator ifnumber portability was not available. Such subscribers benefit from the improvedcharacteristics of the services offered by their new supplier (usually some combination oflower call and/or monthly access charges and higher service quality).
It is, however, important to note that these represent genuine economic benefits only to theextent that new operators offer lower charges or higher quality because they are moreefficient than existing operators. If instead, lower charges or higher quality result inreduced profit margins then there is a transfer of producer surplus (profit) from the originaloperator which is shared between the subscriber and the new operator. This transfershould not be included as a benefit in the cost benefit analysis.
In other words, the cost-benefit analysis should only take account of the net impact onprofits. That is, if a PMRS operator loses a subscriber to a competitor, it is necessary to lookat the PMRS operator’s loss in profits minus the competitor’s gain. We have assumed theprofit margins on incremental volumes of traffic are the same for both PMRS and PCSoperators.15
Our estimates of the size of Type 1b benefits rely on the number of subscribers that switchoperators because of the availability of number portability and the cost savings they enjoyonce they have made the move. Both of these estimates are drawn from the survey of usersconducted in Hong Kong.
5.2.3.1.1. Number of subscribers switching because of MNP
The availability of MNP in Hong Kong removes a significant barrier to switching. Theperceived problems and costs associated with a number change in the absence of MNP areshown in Table 5.3 which shows the results of the question regarding problems thatsubscribers might encounter if they switched operators. Around 60 per cent of respondentsclaimed that the number change was the largest problem they would face (see Table 5.3).
15 PCS operators may have a lower average level of profits at present but this is assumed to result from a high level of fixedcosts relative to the volume of traffic that they have.

Benefits of MNP
75
Table 5.3Constraints on Switching (per cent)
Problem Personal subscribers SMEs
Number change 59 64 Don’t know 20 21
Poor coverage 13 12 Cost of handset change 11 5 Cost of terminating contracts 6 4 Higher prices 8 3
Loss of services 7 2 None 4 4
1. Subscribers were asked to nominate more than one problem so total will not sum to 100.
A number of the constraints nominated by consumers are, to some extent, unique to theHong Kong market. For example, the cost of terminating a contract in Hong Kong is lessthan in other countries such as the UK, largely because contracts are rarely enforced inHong Kong. The importance placed on coverage as a constraint to switching may also beexpected to decline over time as the coverage of the new PCS operators extends to the MTR,the tunnels and the shopping malls. Most of the new PCS operators expect that theircoverage will reach a level that is comparable to the PMRS operators by the end of 1998.Increased penetration of dual band handsets can also be expected to reduce the need tochange handsets. These factors all suggest that, in the long run, the inconvenienceassociated with a number change will grow in importance relative to other constraints onswitching.
These results were supported by other results from the survey. Clearly, the inability toretain their existing number is a significant influence in the decision of subscribers toswitch. Just under 85 per cent of personal and SME subscribers suggested that the(in)ability to retain their existing number influenced their decision to switch. Table 5.4shows the difference that the availability of MNP would have on the switching decisions ofsubscribers.
Table 5.4Relative Importance of Some Decision Variables Associated with Switching
Constraint Relative Importance (per cent)
Stronginfluence
Slightinfluence
Noinfluence
Don’t know
Handset subsidy 13 42 44 1 Ability to choose own number 13 41 45 1 A 3 second calling delay 8 29 62 1 Availability of short messaging service 8 26 65 1 Ability to retain existing number 49 34 17 0
A large number of respondents also reported that they would be increasingly likely to

Benefits of MNP
76
switch operators if MNP were available. Table 5.5 shows that almost three quarters ofpersonal subscribers would be considerably more likely or slightly more likely to switchoperators if MNP was available.
Table 5.5Likelihood of Switching if MNP was Available (per cent)
Response Personal subscribers SME’s Total
Considerably more likely 24 28 26 Slightly more likely 49 44 46 No difference 23 23 23 Don’t know 4 5 4
We have revised our estimate of the churn to an additional 5-15 percentage points onceMNP is implemented. This estimate of the additional churn following the introduction ofMNP is consistent with the view expressed by many of the mobile operators in Hong Kongduring our visits to them in December 1997 and in response to our Preliminary Report.
5.2.3.1.2. The cost savings enjoyed by those who switch because of MNP
In order to determine the cost savings enjoyed by those who switch because of numberportability we were required to work out the difference between the threshold discountbefore MNP and the new, lower threshold discount required after MNP (see Figure 5.1,Section 5.2). This difference was determined by identifying, through the user survey, whatdiscount was required before and after MNP. Where the phone is provided by a company,the views of users are less relevant because they do not make the decision to switchoperators. Also, there is evidence from the survey that business users did not require achange in the threshold discount with MNP. Indeed, once an allowance is made foroutliers in the user survey, the discount requested before and after MNP was virtuallyunchanged both SMEs and corporate users.

Benefits of MNP
77
Type 1b benefits are very sensitive to the difference in the threshold discount required bymobile phone users with and without MNP. We only considered the discount requested bypersonal subscribers because they were involved in choosing their mobile phone, and moreimportantly, paid their own bills (see Table 5.6). Almost 70 per cent of SME subscribersreplied that they had their mobile phone bills paid by the company. Such a result impliesthat these users will be less sensitive to price discounts than personal subscribers who arelargely (93 per cent) responsible for their own phone bills.
Table 5.6Responsibility for Paying Mobile Phone Bills (per cent)
Who pays? Personal subscribers SMEs
User 93 37 Company 3 68 Family 4 0
CSL did not believe that it was appropriate to quantify the threshold discount cut requiredto give subscribers enough incentive (with or without MNP) to switch. They argued that:
“Since we are not comparing the electricity bills of two electric companies,each telecom product is quite unique in the sense that each band has its owncharacteristics such as footprint (coverage), quality (GOS), VAS, humanfactors (Customer Service, Sales), price (tariff plan), band image. In order toimprove his mobility and enjoy the benefits under a quality network, theuser may switch to a higher price product offered by another mobileoperator. Therefore, the value they ‘gain’ in switching is not purelymeasured by the phone bill.”
New World also argued that it was difficult to quantify the percentage discount required toentice subscribers to switch operators. They suggested that price was not the only reasonwhy people would switch. They would look at the handsets being offered and otherprograms offered by the operators. Corporate customers, for instance, may requireadditional inducements such as new business cards etc. before they switched operators.They did, however, state that if MNP were available, they would need to do even moreaggressive marketing because a barrier to switching would be lowered and competitionwould be even fiercer.
P Plus have estimated that a 50 per cent reduction in telephone bills is required in order forsubscribers to be prepared to switch. Such a reduction is particularly important for a smallbusiness or corporate subscribers because the cost reduction must be large enough tocompensate for the additional hassle caused by switching networks. If number portabilitywere available, a price reduction of 20 per cent would be enough to encourage people toswitch.

Benefits of MNP
78
Sunday suggested that in the absence of MNP, a 20 per cent reduction in mobile telephonebills, other things being equal, would be required for subscribers to switch. They did notthink that the situation would differ if MNP was available.
SmarTone did not give a view on the change in the required discount given MNP.However, they stated that they did not believe that marginal differences in price matteredto consumers. The entry of the new PCS operators and the innovative pricing packages thataccompanied them, have significantly affected SmarTone. For example, between 1993 and1996, SmarTone experienced low levels of churn. Following the introduction of the PCSoperators in 1997, the churn rate has increased to about 3 per cent a month.16 SmarToneattribute this increase to the heightened competition in the mobile telephony market andthe aggressive marketing plans of the new entrants.
Table 5.7 shows the price discount required under different scenarios to encourage personalsubscribers to switch operators. The discount required (both with and without MNP) ishigh but it lies within the range quoted by mobile operators in Hong Kong nor is it out ofline with the discounts currently on offer in Hong Kong.
Table 5.7Mean Monthly Price Reduction Necessary to Encourage Personal Subscribers to Switch
Without MNP With MNP
Dollars 221.25 206.11 Percentage of average bill size1 47 44
1. The average bill size for personal subscribers in the survey was $469.78 per month.
These results can be used to calculate the size of Type 1b benefits. Figure 5.2 shows thethree percentage point reduction in the threshold discount and the additional 5-15 per centannual churn due to MNP. These two figures can be used together with the averagemonthly bill to calculate the Type 1b benefits.17
16 Hong Kong Economic Journal 8 January, 1998 p.6.
17 The Type 1b benefits in a particular year are equal to the number of subscribers who churn because of MNP (Type 1bsubscribers) by the average residential bill size by half the fall in the threshold discount. We only consider half the fall inthe discount required (1.5 per cent in this case) as that is the average discount required to attract the additional customers.In other words, some subscribers stated that the full 3 per cent would be sufficient to change operators with MNP while 0.1per cent was enough for others. On average, therefore, the average discount required would be 1.5 per cent.

Benefits of MNP
79
Figure 5.2: The Size of Type 1b Benefits
1B benefits
5%-15% extra
Discountsoffered
Number ofsubscribers
47%
44%
5.2.4. Results of Type 1b benefits
The type 1b benefits were the second largest source of benefits following the introduction ofMNP in Hong Kong. Table 5.8 shows how these benefits varied with each of the scenarios.
Table 5.8Type 1B Benefits Under Different Scenarios
Scenario NPV (1999-2009)
HK$ Millions
Best case (MNP in 1 January 1999, high churn) 199 Central case (MNP in 1 July 1999, medium churn) 135
Worst Case (MNP in 1 January 2000, low churn) 76
The NPV of the Type 1b benefits from 1999-2009 range between HK $76 million and HK$199 million with the central or realistic case yielding benefits of HK$ 135 million.
Some mobile operators questioned whether Type 1b benefits should be included in the costbenefit analysis at all. One of the arguments raised, for example, was that the relativelysmall discount required to move once MNP was introduced would be outweighed by acharge for MNP if one is charged by the recipient network operator. It is, however, worthnoting that if Type 1b benefits (and Type 2 benefits as a result) are removed from theestimation of the benefits, the net benefits of MNP would increase significantly. This isbecause the costs associated with Type 1b customers would also not be included in thestudy. As the costs associated with Type 1b customers are larger than the benefits, the netbenefits would actually grow.

Benefits of MNP
80
5.3. Type 2 Benefits
Type 2 benefits are the efficiency improvements, and any associated price reductions, whichresult from increased competitive pressure. While it is generally accepted that increasedcompetition leads to lower prices and costs, very few studies have tried to estimate theeffects, not least because it is necessary to screen out the impact of all the other influenceson costs and prices.
The increase in competition may bring a range of benefits to Hong KongTelecommunications’ users and operators. It may lead to improved cost efficiency andencourage a faster rate of innovation, both of which should be included in the cost benefitanalysis. In addition, if efficiency improvements or lower profit margins lead to lowerprices for subscribers, this will generate additional demand for telecommunications andlead to further welfare gains.
It is important to note that when estimating the Type 2 benefits we are interested only in theincrease in competition and hence efficiency and innovation benefits associated with MNPrather than the impact of competition as a whole. The Type 2 benefits that are incrementalto the introduction of MNP are identified by comparing the outputs of the base case and theMNP switching models.
5.3.1. Methodology for measuring Type 2 benefits
Most of the operators and many observers argue that the mobile market in Hong Kong isalready competitive. They point to the large number of operators, wide choice of networks,and relatively high churn rates as evidence of a competitive market. Moreover, the entry ofthe new PCS operators has already reduced prices and increased the number of mobilephone users in Hong Kong.
Our preliminary examination of the Hong Kong mobile market suggests that the marketappears to act competitively. However, we also note that it is also quite concentrated. CSL,Hutchison, and SmarTone, for example, account for 80 per cent of the total number ofsubscribers. This, of course, is due to the limited number of mobile licences in Hong Kongprior to the introduction of PCS and can be expected to change over time.
The economic literature reviewed suggests that in competitive markets that exhibit highlevels of concentration new entry and enhanced competition can lead to increases inefficiency and innovation. A study by Nickell18 in 1996, for example, found that increasedcompetition in industries where concentration was high was associated with higher totalfactor productivity growth. Using data from around 700 UK manufacturing companiesover the period 1972-86, Nickell was able to determine the impact of variables (such asconcentration and rent) on output. From that, he was then able to measure the impact on
18 Nickell, S.J 1996. Competition and Corporate Performance. Journal of Political Economy vol 104, no. 4.

Benefits of MNP
81
the total factor productivity in particular industries. He concluded that there was sufficientevidence to suggest that competition - measured either by an increased number ofcompetitors or by lower levels of rents (profits) - is associated with a higher level of andhigher growth rates in total factor productivity.
A later study by Nickell, Nicolitsas, and Dryden (1996) also tried to explore the role ofproduct market competition and other variables in improving the productivity performancein companies. This research builds on earlier work by a number of authors (such as Caves& Barton, 1990, Caves et al, 1992, and Green & Mayes, 1991) that find that, above a certainthreshold, increases in market concentration are associated with reductions in technicalefficiency. These latter studies use frontier production techniques to compute efficiencyindices which are related to competition variables. Nickell et al used data from 580manufacturing companies in the UK over the period 1982-94. Competition is measuredinversely as ex-post rents (profit less capital costs), normalised on value-added. They foundthat product competition (as well as the other variables they were measuring) wasassociated with some degree of productivity growth.
5.3.2. Estimates of Type 2 benefits
We have drawn on the findings of Nickell (1996) to estimate the relationship between themarket share of individual operators in Hong Kong and the level of productivity. Nickellwas interested in the impact of new entry, greater competition and falls in market share onthe growth and level of total factor productivity. He concluded that a 25 per cent increasein market share leads to a 1 per cent fall in total factor productivity in the long run. In thecase of new entry, Nickell’s finding could be turned around to state that a 25 per centdecrease in market share leads to a 1 per cent increase in total factor productivity in the longrun.
Applying this result to the mobile market in Hong Kong, we obtain a net present value forthese benefits that ranges from HK$13 to 18 million. This is very low relative to the Type 1and Type 3 benefits and in line with our initial observation that the mobile market in HongKong is already competitive.
5.4. Type 3 Benefits
These are the other resource savings that arise from fewer number changes and includefewer misdialled calls and changes to information stored in customer equipment.
5.4.1. Methodology for measuring Type 3 benefits
There are several potential benefits that may occur if number portability reduces thefrequency of number changes. We have identified two kinds of Type 3 benefits. The firstarises because in the absence of MNP, a mobile customer who switches operator will informfriends or customers that they have changed their numbers. In this case, users will need toamend the numbers programmed into any customer premises equipment (such as

Benefits of MNP
82
telephone handsets or fax machines with stored numbers). By reducing the frequency ofnumber changes, therefore, number portability will lead to savings in the time required toreprogramme stored numbers.
The second type of benefit arises when the mobile customer neglects (or is unable) to informtheir friend or customer that they have changed their number. The friends or customerswill then try to call the mobile customer resulting in a misdialled calls. Following amisdialled call, moreover, some subscribers may call a fixed number or a pager number tolocate the new number for the moved subscriber. The introduction of number portabilitywould eliminate many such calls, so the benefits of number portability should include thecosts saved by operators who would carry misdialled calls, the time saved by subscriberswho would otherwise make misdialled calls and the cost of calls to fixed numbers or pagersto locate the subscriber.
The data used to measure the Type 3 benefits come from the user survey. Table 5.9 showsthe percentage of people that changed their mobile number without informing the averagerespondent.
Table 5.9Mobile Phone Number Changes Made by Friend or Colleagues
PersonalSubscribers
SMEs Total
Have been informed of number change 57 41 49 Have not been informed of number change 43 59 51
Table 5.9 shows that about half of the respondents had experience of a friend or businesscontact changing their number without informing them. The survey also suggested that, onaverage, eight people called each respondent regularly. We have assumed that only 20 percent of eight regular callers will not be informed of a number change. That assumption thenallows us to measure the two categories of type 3 benefits discussed above.
Our approach to measuring Type 3 benefits is presented diagrammatically below. Thebenefits to those who are informed of a number change are relatively straight forward tocalculate. The user survey indicated that over 76 per cent of respondents took less than 2minutes to revise their personal or professional records. We used 1.5 minutes as areasonable, conservative approximation in our modelling.
The benefits to those who were not informed of a number change are more difficult todetermine. The user survey suggested that most (93 per cent) of respondents will make upto five enquiries to find the new number. Our approach when measuring these types ofbenefits was to measure both the time taken to locate the new number and the cost theyincur to do so. We assumed that 5 enquiries will be made by the 20 per cent of the callers,10 per cent of which will be done through a mobile phone. Each of these inquiries isassumed, conservatively, to have a duration of only one minute. If the user uses their fixed
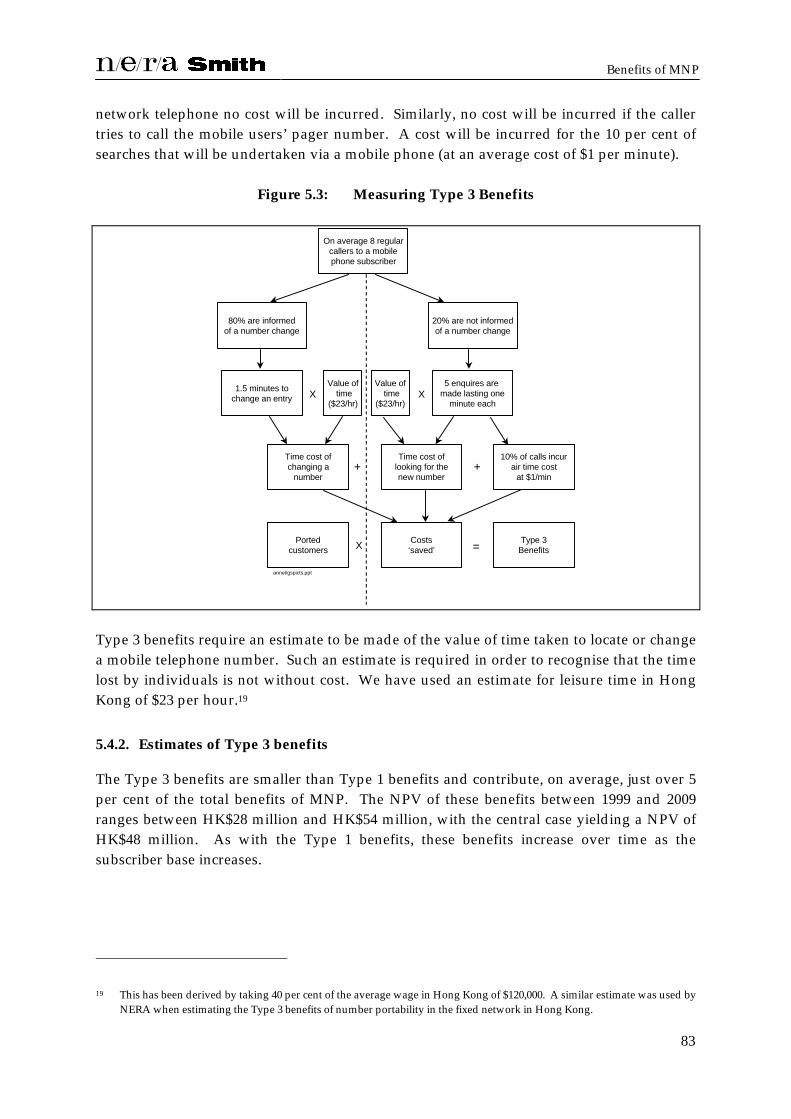
Benefits of MNP
83
network telephone no cost will be incurred. Similarly, no cost will be incurred if the callertries to call the mobile users’ pager number. A cost will be incurred for the 10 per cent ofsearches that will be undertaken via a mobile phone (at an average cost of $1 per minute).
Figure 5.3: Measuring Type 3 Benefits
On average 8 regularcallers to a mobilephone subscriber
80% are informedof a number change
20% are not informedof a number change
5 enquires are made lasting one
minute each
Value of time
($23/hr)
1.5 minutes tochange an entry X X
Time cost ofchanging a
number
Time cost oflooking for thenew number
10% of calls incurair time cost
at $1/min
Costs‘saved’
Portedcustomers X
+ +
annel/gspicts.ppt
Value of time
($23/hr)
Type 3Benefits=
Type 3 benefits require an estimate to be made of the value of time taken to locate or changea mobile telephone number. Such an estimate is required in order to recognise that the timelost by individuals is not without cost. We have used an estimate for leisure time in HongKong of $23 per hour.19
5.4.2. Estimates of Type 3 benefits
The Type 3 benefits are smaller than Type 1 benefits and contribute, on average, just over 5per cent of the total benefits of MNP. The NPV of these benefits between 1999 and 2009ranges between HK$28 million and HK$54 million, with the central case yielding a NPV ofHK$48 million. As with the Type 1 benefits, these benefits increase over time as thesubscriber base increases.
19 This has been derived by taking 40 per cent of the average wage in Hong Kong of $120,000. A similar estimate was used byNERA when estimating the Type 3 benefits of number portability in the fixed network in Hong Kong.

Benefits of MNP
84
5.5. Summary
The benefits of MNP in Hong Kong are significant. In total, the NPV of benefits rangesfrom HK$769 million, under the worst case scenario of a pessimistic implementation date,low churn, and low porting, to over HK$1,396 million in the best case scenario of anoptimistic implementation date, high churn, and high porting (see Table 5.10).
Table 5.10Benefits of MNP Under All Scenarios
Scenario NPV (1999-2009) HK$ Millions
(high churn, high porting)
NPV (1999-2009) HK$ Millions
(low churn, low porting)
Best case (MNP in 1 January 1999) 1,396 814 Central case (MNP in 1 July 1999) 1,294 (medium churn) 795 Worst Case (MNP in 1 January 2000) 1,306 769
The summary results in Table 5.10 were derived using a discount rate of 6 per cent. Weconducted a sensitivity analysis using 8 per cent and found that although the results werearound 10 per cent lower, they did not affect the results of the study (see Table 5.11).
Table 5.11Benefits of MNP Under All Scenarios
Scenario NPV (1999-2009) HK$ Millions
(high churn, high porting)
NPV (1999-2009) HK$ Millions
(low churn, low porting)
Best case (MNP in 1 January 1999) 1,261 730 Central case (MNP in 1 July 1999) 1,166 (medium churn) 712 Worst Case (MNP in 1 January 2000) 1,173 687

Implementing Mobile Number Portability
85
6. IMPLEMENTING MOBILE NUMBER PORTABILITY
Once the cost and benefits of mobile number portability have been estimated, it is possibleto conduct a cost- benefit analysis in order to determine whether MNP in Hong Kongwould yield net benefits to society in general. This section draws together the costs andbenefits under different scenarios, conducts sensitivity analysis on the results to test therobustness of the findings, and finally, makes some recommendations on how MNP couldbe implemented.
6.1. Cost Benefit Analysis
The benefits of introducing mobile number portability (MNP) in Hong Kong clearlyoutweigh costs involved under what we believe to be the most reasonable set ofassumptions. Table 6.1, for instance, shows that the benefits of introducing MNP in July1999 with our predicted porting and 10 per cent additional churn assumptions are overHK$450 million (in net present value terms over 10 years).
Table 6.1Cost Benefit Analysis of MNP Under the Central Case (NPV over 10 years in HK$m)
Scenario Benefits Costs NetBenefits
Central Case defined as: 1,294 833 461 - realistic implementation date of 1 July 1999 - high porting rate - medium additional churn
The costs of MNP will vary depending on the way MNP is introduced. A two partmigration involving the implementation a call forwarding with a subsequent migration to adistributed database solution will involve higher costs than a MNP solution that involves amove straight to a distributed database solution. In Table 6.1 and in the subsequent tables,the costs are shown for the former migration strategy, that is, one where MNP is introducedthrough a call forwarding solution before moving to a distributed database. The costsunder both migration options are shown in Chapter 4.
In order to test the robustness of our results, we conducted a sensitivity analysis. Inparticular, we ran optimistic scenario, where MNP was introduced as early as 1 January1999 with high porting rates and a high additional churn rate, as well as the pessimisticscenario, where MNP was introduced in 1 January 2000 with low porting rates and a lowadditional churn rate. In both cases the results showed a positive net benefit.

Implementing Mobile Number Portability
86
Table 6.2Cost Benefit Analysis of MNP Under Optimistic and Pessimistic Scenarios
(NPV over 10 years in HK$m)
Scenario Benefits Costs NetBenefits
Optimistic Scenario : 1,396 878 518 - implementation date of 1 Jan 1999 - high porting rate - high additional churn Pessimistic Scenario : 769 613 156 - implementation date of 1 Jan 2000 - low porting rate - low additional churn
The size of the net benefit is affected by the assumptions made throughout the study. Twoof the most significant assumptions are the percentage of people who will port (retain) theirnumber when changing operators and the number of Type 1B customers. The assumptionsmade about these two groups were discussed in detail in Chapter 5.
6.2. Determining the Migration Path
The factors that determine the most appropriate migration path for implementing MNP arecomplex, and difficult to predict in a changing environment such as the Hong Kong mobiletelephony market. Predictions of the revenue of individual companies, and otherparameters such as the amount of interconnection between future fixed and mobilenetworks are complicated by developments such as operator mergers, and market, serviceand technological developments.
The migration plan that is adopted, both for long term strategy planning purposes and toavoid short-term operational difficulties should take into account the following additionalfactors.
6.2.1. Non-disruption
The solutions implemented and any intermediate migration steps should provide a stableservice to the users of Hong Kong’s telephony services at all times. Particularly vulnerabletimes are during the initial roll-out of the solution and during phases of migration and,therefore, radically new solutions in a complex network such as that in Hong Kong shouldbe approached with caution.
The system should also be able to handle the capacity of porting requirements - the numberof porting subscribers and the volume of porting traffic - without reaching any inherent

Implementing Mobile Number Portability
87
limits within the system
6.2.2. Roll-back
The migration strategy should allow the system to be rolled back to its previousconfiguration at all times in case operational problems are encountered during roll-out ormigration.
6.2.3. Future proofing
The migration strategy should allow the solution to be developed to satisfy the future needsof Hong Kong’s telephony users, and have no negative impact on pre-existing and plannedservices and facilities. Future migration should also be able to proceed in a cost-effectivemanner. An example of this is the ability for future solutions to be able to handle SCCPmessage translation within the network.
It is good practice, however, to delay the implementation of functionality that is notrequired immediately until a later date, reaping the benefit of reduced costs due to theavailability of more planning time and the reduction in the cost of the solution, as well asallowing standards bodies and manufacturers to have settled on a preferred means ofimplementation.
6.3. Recommendations
Analysis of the solutions available to Hong Kong reveals that, in the short-term, there is noobvious solution that will satisfy the requirements of MNP into the future, and can be rolledout immediately. The expected development of the mobile telephony market, and its effecton the interconnection situation between operators, together with the expected fullliberalisation of telephony services, will radically influence the most appropriate solution.
The cost benefit analysis suggests that the introduction of MNP would provide net benefitsto Hong Kong. In the following section we explore the most appropriate way ofintroducing MNP in the short, medium and long run.
6.3.1. An interim solution
The introduction of an intermediate solution in the form of call forwarding could allow thebenefits of MNP to be enjoyed in Hong Kong as early as 1 January 1999. Although such asolution would be more expensive to roll out, it will allow benefits to flow to thecommunity earlier than would be possible under a medium or long term solution. Also,given that an intermediate call forwarding solution was used when introducing numberportability in the fixed network, the experience gained in that process by the FNOs could bepassed onto the mobile community.
The earliest that MNP could be introduced is 1 January 1999. This would allow OFTA to

Implementing Mobile Number Portability
88
conduct further consultations with the industry and other interested parties and to make adetermination by June 1998. Six months would then be required for mobile and fixedoperators to make the necessary adjustments to their billing systems and other systems tosupport MNP.
Many of the PCS operators in Hong Kong have warned that the potential exists for HKTCto delay the introduction of an interim call forwarding solution. This delay could occur ifHKTC is slow to increase its interconnection capacity to the level required to support callforwarding. The project team accept that such a delay may affect the introduction of MNPand would recommend that OFTA, the mobile operators, and HKTC establish in advance ofthe introduction of MNP how much capacity currently exists in the network and, ifnecessary, agree on a timetable and approach to an expansion of that capacity.
For mobile networks that are already interconnected, during the period of operation with acall forwarding interim solution, calls to numbers ported between such networks can beforwarded along the interconnecting leased line route.
6.3.2. Distributed database solution
In the medium term, a distributed database could be used to implement MNP in HongKong with - initially at least - HKTC performing the look-up. Analysis of the traffic thatpasses through Hong Kong’s network shows that the vast majority of calls to and frommobile telephones pass through HKTC and HKTI’s networks. In the medium-term,therefore, the most appropriate technical solution is for calls to be routed to portedsubscribers by these networks.
Extension of the functionality of the existing fixed number portability solution would berelatively straight forward, at least until the useful capacity of the current solution isreached. In the long-term it may be necessary for HKTC to consider redesigning its currentsolution to accommodate the expected increase in demand on the existing system, but thenature of IN technology is such that the SCPs at the ICGs should be scaleable to a largedegree, to allow HKTC to consider options for expansion.
The existing distributed database functionality would need to be expanded to include themobile telephone numbering range. We would expect that HKTC would be the mainoperator performing the database look ups, and therefore initially would control a de factocentral database, although other fixed network operators could also provide the look-up ifthey were in a position to do so. The mobile number elements of the database would needonly to be synchronised with the data held in the individual mobile operators’ systems.
The threat of problems caused by porting changes being reported by the seven mobileoperators would need to be investigated and assessed, and if necessary steps taken toestablish suitable operational procedures to mitigate this danger. If necessary, theintroduction of a central database should be considered in the long-term.

Implementing Mobile Number Portability
89
Other operators would also be able to perform a look-up if they chose, but we believe thiswould be unlikely in the short run. Given the small number of interconnection linksbetween mobile operators, and between mobile operators and alternative FNOs, mandatinglook-up functionality in these networks would be inappropriate in the short to mediumterm. However, a charge for the number translation service (see Chapter 7) would notdiscourage other mobile and fixed networks from developing their own look-upfunctionality should commercial and technical conditions make this the most appropriateoption.
The handling of mobile traffic to ported numbers that currently flows between mobileoperators and FNOs other than HKTC could be trapped locally and sent via HKTC’snetwork for database look-up and further routing, or the fixed number portability solutionsextended to handle this small volume of traffic. The most appropriate strategy must bedecided by the individual operators concerned, but routing by HKTC would always be afallback option.
The planned liberalisation of international services, which are currently providedexclusively by HKTI, will mean that calls into Hong Kong may be routed via alternativeroutes. If the call forward solution is still in place, this will have no impact on the MNPsolution. If the FNOs are required to offer a database lookup service, however, then thenew operators should be mandated either to perform a database look up as part of theirlicence conditions, or to pass the call through HKTI or HKTC’s network for an agreed fee.
6.3.3. Longer term developments
In the longer term, our recommendations on cost recovery outlined in Chapter 7 shouldlead to a competitive market for the look-up service in a way that does not discourage theimplementation of the most appropriate technical and commercial solutions. OFTA, forexample, may consider unbundling the number translation and routing operation fromHKTC’s interconnection charge, allowing other operators to perform the number translationoperation, whilst still transiting through HKTC’s network. In this case, HKTC would beexpected to route calls in the usual way, according to the allocation of numbering blocks.
An alternative option would be for the number translation operation to be carried out by athird-party, which then controls the routing of the call using HKTC’s network. At first sightthis option seems fraught with technical and commercial difficulties: operators would haveto interface with HKTC’s SSP, causing technical (for example, no IN standards are yetsufficiently fixed) and security concerns, but could be investigated further at a later stage.
Under these circumstances, the number of operators - both fixed and mobile – that performdatabase look ups will grow, and so the need for a centralised reference database wouldbecome more pressing in order to ensure that the databases used by the operators areconsistent. Alternative arrangements could be considered, however, such as maintainingthe current procedures for the operation of the four FNO databases, and allowing mobileoperators access to these databases – perhaps as a service – to maintain these own databases

Implementing Mobile Number Portability
90
in a second-tier of databases. The appropriateness of this, and similar such arrangements,would need to be considered in more detail by the operators.
The development of signal relay functionality that can handle translation of SCCPaddresses to support MNP in association with future services such as optimal routing andCCBS, is underway in Europe for GSM-based solutions. This technology is far from mature,however, and would need to be adapted for the non-GSM systems available in Hong Kong.Discussions with operators in Europe suggest that should these solutions become acceptedas ETSI and ITU-T standards, such functionality could be retrofitted to the current databasesolution when needed. This functionality could also be extended to handle calls andservices to fixed ported numbers.
6.4. Managing the Transition Between Solutions
Migrating between the interim and medium term solution has benefits and risks, bothtechnical and operational. The two-stage approach will inevitably be more costly thandirect implementation of the distributed database (FNO look up) solution, but this will beoff set by the additional benefits associated with the earlier introduction of MNP in HongKong. These additional costs are discussed in more depth in Chapter 4 of this report.
Migration between two solutions must be managed carefully to ensure that service to thesubscribers is not interrupted. However, the staged introduction will have the effect ofspreading much of the risk over two stages, the first switching solution being relativelystraightforward to implement, as well as allowing an intermediate roll-back position shoulddifficulties be encountered with the migration.
Resources necessary for the roll-out of the medium term MNP solution would alsonecessarily be engaged in the development of this interim solution and so, coupled with theeffort necessary to implement and test the solution, the ultimate roll-out of the FNO look-upsolution would be delayed by 6 to 12 months. In other words, the total time to the secondstage migration would be 12 to 24 months. The impact of these scenarios on the overallcosts of the migration scenarios is investigated in Chapter 4 of this report.
Such a delay in the roll-out of the FNO look up solution would have the advantage,however, of allowing standards and technology to have matured further and would allowfurther time for the issues surrounding the possible introduction of a central referencedatabase etc. to be resolved.
6.5. Other solutions
The review of technical options in Chapter 3 found that the implementation of a call dropback solution as an extension of the interim call forwarding solution is unlikely to berealisable. However, as part of the cost modelling exercise, the savings that may beachieved, were the technical and commercial problems to be solved, have been estimated.
Implementing Mobile Number Portability
91
The medium-term strategy outlined above assumes that the distributed database usedcurrently to provide fixed number portability would be extended. Should it be necessary tointroduce a central database to mitigate potential operational problems, then the cost of theintroduction of such a database has been estimated. For the time being, as mobile operatorsdo not need to perform database look ups, it would be relatively easy to maintainsynchronisation of four databases, should the other fixed operators chose to route calls toported mobile subscribers. Nevertheless updates will be posted from 11 operators in total,and the potential problems need to be carefully monitored.
We have assumed that the introduction of a central database would have essentially noimpact on timescales because its introduction would be compatible to the technical systemsalready in place.
It is not possible to judge whether the introduction of such a database would be beneficialfor Hong Kong, and much effort is being expanded in the industry to determine the mostappropriate solutions. The solution will depend on local factors, for example in the US thecentral database has been effectively split into seven parts, whereas in Finland a centraldatabase has been established.
6.6. Conclusion
The distributed database solution appears to be the most appropriate way of introducingmobile number portability in Hong Kong in the medium term (by the middle of 1999). Aninterim call forwarding solution could, however, be introduced earlier in order to bringforward some of the benefits of MNP.
Given the large number of variables that will influence the most appropriate technicalsolution, it is not possible to predict the direction in which MNP would take in Hong Kongin the long-term, but by adhering to the above principles, and monitoring the risksidentified with the solutions, on-going development of the MNP should be able to proceedsafely.

Recovering the Costs of MNP
92
7. RECOVERING THE COSTS OF MNP
7.1. Introduction
One of the important aspects of the introduction of mobile number portability (MNP) inHong Kong will be the determination on cost allocation between operators. In the case offixed network number portability in Hong Kong, the TA has expressed concern over theslow progress in the negotiations between operators on the necessary compensationarrangements. We have drawn on that experience, and also experience in other countries,to arrive at what we believe to be an efficient, equitable and practical set of principlesregarding the recovery of the costs of MNP in Hong Kong.
7.2. The Options for MNP in Hong Kong
At this stage, it is difficult to identify the best solution for mobile number portability inHong Kong. From a economic and technological point of view, the best solution is likely tovary with time and complexity depending on a wide range of factors including marketconditions, the number and condition of fixed and mobile operators, the cost and nature ofinterconnection between operators, the number of consumers porting, and technologicaldevelopments. For these reasons, it may be inappropriate for OFTA to mandate a specificsolution. Instead, we recommend that OFTA mandate a functional specification and a set ofcost recovery principles that will:
• allow the introduction of number portability at the earliest cost-effective andreasonable opportunity; and
• encourage operators to develop the way number portability in their networks in away that is economically and technologically appropriate, and adaptable to themarket situation.
In our view there are two realistic options or migration paths which could be followed inHong Kong. They are:
• the introduction of simple call forwarding as an interim solution in six to twelvemonths time followed by a distributed database solution with the look-upperformed by fixed network operators (or at least by HKTC); or
• the distributed database solution with the look-up performed by fixed networkoperators (or at least by HKTC) introduced in 12-18 months time without an interimsolution.

Recovering the Costs of MNP
93
The attraction of simple call forwarding is that it can be implemented in a short time scalewith minimal technical complexity and low set-up costs.20 Although the additionalconveyance costs are relatively high our modelling has suggested that there are significantnet benefits associated with this option.
It can be seen that in both instances we recommend the introduction of a distributeddatabase solution with the look-up performed by fixed network operators. In Section 7.6.1we provide some options for how the look-up could be introduced in the short term,however, we would expect that HKTC at the very least will be able to offer the look-upservices to other operators. This is appropriate for the mobile market in Hong Kong for anumber of reasons. Firstly, most calls (about 95 per cent) currently pass through HKTC’snetwork so this solution would not require a major re-alignment of traffic patterns.Secondly, given that HKTC already perform the necessary number translation functions forthe fixed networks this solution would only require an expansion of their existing duty toinclude calls to ported mobile numbers. As discussed in Chapter 3, the optimal solution inthe long run would be to have all operators performing the look up. Such an investmentcan, however, by made by each operator when it becomes commercially feasible to do so.
7.3. General Principles for Cost Recovery
In the case of operator number portability in the fixed network, the TA outlined fivecompensation principles which included:
• relevant costs: defined as those costs which are directly incurred as a result of theprovision of Operator Number Portability (ONP);
• cost causality: this principle required that a customer whose decision to port causescosts to be incurred should pay for the costs;
• cost minimisation: this required that all those who have the ability to affect the sizeof the costs should face the incentive to minimise them;
• effective competition: which requires that one operator should not have the abilityto raise its competitors’ costs or to weaken their ability to compete; and
• distribution of benefits: this principle recognises that customers who port theirnumbers are not the only beneficiaries of number portability and hence that otherbeneficiaries might pay for some of the costs.
These principles were derived, in part from the six principles identified in the UK by theDirector General of OFTEL. These were:
20 A call forwarding solution using call drop back has not been recommended given the significant investment required bothfor fixed and mobile switches.

Recovering the Costs of MNP
94
• cost causation
• cost minimisation;
• distribution of benefits;
• effective competition;
• reciprocity and symmetry;
• practicability.
In the fixed telephone network in the UK, these principles lead to the following costrecovery principles being introduced:
• Each operator would be responsible for its own system set-up costs.
• BT could pass on its per line set-up costs to the operators to which its customers porttheir numbers.
• BT should bear the additional costs of conveyance under the call drop-back solution.During the period of tromboning, however, the estimated additional costs comparedwith call drop-back should be shared equally between BT and other operators.
7.4. Cost Recovery in the Fixed Network in Hong Kong
Number portability for the Fixed Telecommunication Network Services (FTNS) has beenavailable since July 1995 when simple call forwarding was used as the interim solution. Atthat time, there was a clear consensus that use of the Intelligent Network (IN) would be thepreferred, sustainable long term solution for both operator and geographical portability.21
Although satisfied with the progress on the technical implementation of number portability,the TA believes that the progress of the negotiation between operators on the compensationarrangements has been too slow.
As a result, the TA issued a Statement in September 1997 in which it outlined aneconomically efficient regulatory framework for the recovery of the cost of operator numberportability. It argued that the cost recovery mechanisms it developed were consistent withthe principles of relevant costs, cost causality, cost minimisation, effective competition, anddistribution of benefits.
The TA identified the following cost components that are incurred in the provision of inter-operator number portability under the long term IN solution in Hong Kong:
21 Geographic portability is the ability for users to retain their telephone number when moving location. Operator portabilityallows them to retain their number when moving operator.

Recovering the Costs of MNP
95
• System set-up costs:
- database costs;
- costs of upgrading software;
• Additional conveyance costs;
- signalling capacity costs; and
• Per line set-up costs
7.4.1. System set-up costs
The system set-up costs included the database costs and the costs of upgrading software.Under the IN approach for FTNS operator portability, the four fixed operators and HKTImust have access to a database to find ported numbers. The industry has chosen to adopt anon-central reference database (non-CRD) solution which involves four, off-line replicateddatabases linked up by inter-operator data links. The costs incurred in modifying switchesso that originating local calls and incoming international calls can obtain information fromthe on-line databases are referred to as the costs of upgrading software.
The TA assessed the system set-up costs against each of the principles deemed relevant tothe Hong Kong market (see Section 4) and concluded that:
“… the TA’s view that each FTNS operator should bear its own relevant set-up costs is consistent with principles of cost causality, cost minimisation,effective competition and distribution of benefits. In a multi-operatorenvironment where the provision of operator number portability constitutesone of the general licence conditions, the system of each operator must becapable of routing calls to the ported numbers efficiently and correctly.”
7.4.2. Additional conveyance costs
The additional conveyance costs under the IN solution are the signalling capacity costs.These are incurred because of the different nature of conventional calls and ported calls.Under the IN approach to FTNS portability, a call dialled to a ported number is directlyrouted from the originating exchange to the new terminating exchange. The differencebetween such a ported call and a conventional call is that the operator of the originatingexchange has to obtain routing information from the database before knowing where toterminate the call.
The TA’s view on the recovery of these costs was that:
“Among the four FTNS operators, only HKTC would incur additionalconveyance costs in routing calls to some of the ported numbers. The

Recovering the Costs of MNP
96
principles of cost causality, cost minimisation, effective competition anddistribution of benefits imply that HKTC should bear the additionalconveyance costs. These are basic conditioning costs in a multi-operatorenvironment. The costs are incurred for serving the access customers ofHKTC.”
7.4.3. Per line set-up costs
Once a customer has ported their fixed network number, both the donor (DNO) andrecipient network operators (RNO) incur a series of one-off costs. These costs include thefollowing:
• the RNO will send a number portability request with a proposed cut-over date andthe signed customer request form to the DNO;
• the DNO will check the system to ensure that the proposed cut-over date can beachieved;
• the RNO will have to complete all installations and testing procedures up to thephysical cut-over point;
• both operators will need to confirm changes to their databases; and
• the DNO will need to confirm to the RNO that the re-route has been successfullyactivated.
The TA’s view on the per line set-up costs under the IN solution for fixed networkportability can be summarised as follows:
“The RNO should compensate the DNO for the per line set-up costs whichare directly attributable to implementing the porting customers’ decision.These inter-operator charges should be based on the LRAIC plus areasonable share of the common costs arising from porting, serviceconnection and disconnection, and the provision of Type II interconnection.The per line set-up costs should be recovered as one-off charges from theRNO, unless the DNO could demonstrate that there would also be recurrentcosts to be induced by the porting customers. The RNO could determine foritself how it would like to recover these costs from the customers”.
7.5. The Views of Operators in Hong Kong
HKT CSL has said that the responsibility for routing the call should rest with theoriginating network as that would ensure that it works out the most efficient way to routethe call. It also added that:
“… cost recovery is a matter between three parties, namely the originating

Recovering the Costs of MNP
97
network, the terminating network and the ported subscriber. According tothe principle of cost causation, the ported number incurs additional costs andtherefore causes the network resources to be used. To make an economicallyrational decision, that ported user needs to be given the correct price signalsabout what the service will actually cost, so that the user can make aninformed cost/benefit decision before subscribing to the number portabilityservice. Otherwise, it would encourage over-use of the limited resources.”
The joint submission for number portability by Mandarin Communications, New WorldPCS, Peoples Telephone Company, and P Plus made the following comments regardingcost recovery:
“The PCS operators submit that any cost recovery principles determined bythe TA should be pro-consumer and pro-competition and as such thecompensation payable by the RNO to the FTNS operator should be as low aspossible as it represents a major barrier for any mobile customers to changeoperators. In any event, the PCS operators take the view that in the eventthat Option 3 is chosen, the compensation for the provision of NP services byFTNS operators should be no more than a one-off per line set-up charge onthe RNO which would cover the relevant administrative cost only in order toprevent the DNO from “selling” customers to the RNO.”
In a further submission to the TA regarding cost recovery principles, New World PCSwarned against leaving the decision on cost allocation to the operators to determine bynegotiation.
“We do not think that the TA should take a “laissez faire policy” regardingcost recovery principles amongst the operators by leaving them to determinethe reasonable relevant cost through commercial agreements. This policy hasproved to be a failure amongst the fixed network operators in theimplementation of NP for fixed lines. In this regard, we believe that the TAshould impose a ceiling price pursuant to Section 36A of theTelecommunications Ordinance which the FTNS operators may charge onthe mobile operators. It is up to the mobile operators to negotiate with anyof the FTNS operators for a lower competitive price for the provision of NPor translation services.”
7.6. Cost Recovery for MNP in Hong Kong
When determining the cost recovery principles for MNP in Hong Kong, it is useful to bearin mind the Hong Kong SAR Government’s main policy objectives for Hong Kong’stelecommunications industry. These are:
• that the widest range of quality telecommunications services should be available tothe community at reasonable cost;

Recovering the Costs of MNP
98
• that telecommunications services should be provided in the most economicallyefficient manner possible; and
• that Hong Kong should serve as the pre-eminent communications hub for the regionnow and into the next century.
Based on previous studies of number portability we will divide the costs of MNP into threecategories - the system set-up costs, the additional conveyance costs, and the per subscriberset-up costs. The precise definition of these cost categories will vary by country and bysystem. TA’s definitions were discussed in Section 7.4. Table 7.1 below defines the costcategories we have used when recommending our solution for MNP cost recovery. Theseclosely follow those used by OFTA.
Table 7.1Cost Terminology for MNP in Hong Kong
Cost category Brief description
System set-up cost Those costs incurred by an operator to establish the capacity toprovide portability in its network and its associated administrativesystems. Under the call forwarding solution, mobile operators will face fewswitch set-up costs but will be required to change their operationalsupport systems. Under the distributed database solution, no immediate developmentwork will be required in mobile switched networks. HKTC will,however, be required to expand its database look-up capacity. Therewill be some incremental on-going costs associated with operationsand maintenance costs of the expanded network.
Additional conveyancecosts
These are the costs associated with any inefficiency in way of routingcalls for MNP compared with the way calls would be routed wereMNP not implemented. Under the call forwarding solution, the costs arise mainly throughthe tromboning of calls between HKTC’s network and that of thedonor operator. These costs comprise both the inherent cost ofhandling the extra traffic at the donor GMSC, the cost of utilisinginterconnection capacity between operators other than HKTC, as wellas the additional interconnection charges that are paid to HKTC. Additional conveyance costs under the distributed database solutionconsist of the additional signalling capacity costs required for calls tomobile numbers. There will also be some incremental on-going costsassociated with operations and maintenance costs of the expandednetwork.
Per subscriber set-up costs These are the administration costs involved in transferring asubscriber from the donor network operator to the recipient donornetwork (see Section 7.4.3 for the types of costs). They are incurredunder both the call forwarding and distributed database solution.

Recovering the Costs of MNP
99
Our recommendations on cost recovery differ depending on the form of the solutionimplemented. For example, the solution we suggest for the recovery of system set-up costsunder the interim call forwarding solution will differ from that we suggest for thedistributed database solution. Our reasoning is discussed in detail in the following sections.
It is also important to note that the principles discussed in section 7.3 do not always offerclear assistance to policy makers. The TA, for instance, when deciding how the costs ofONP should be recovered noted that not all of these principles would be applicable to therecovery of each cost component. They went on to argue that:
“They may conflict with one another in some cases. For example, theimposition of no inter-operator charges, as proposed by the new entrants, isusually consistent with cost minimisation and effective competition.However, the principles of relevant cost and cost causality imply that inter-operator charges are inevitable in a multiple network environment. And yetthe principle of cost causality itself may not be in harmony with thedistribution of benefit principle when there are external benefits.”
In the following sections, we draw on the principles developed by the TA for ONP andexperience in other countries to set out our preliminary views on the way that the costs ofMNP should be recovered in Hong Kong.
7.7. Cost Recovery Under the Interim Call Forwarding Solution
7.7.1. System set-up costs under the interim call forwarding solution
We have assumed that call forwarding for mobile number portability would be achievedusing a standard unconditional call forward divert which would tie up an extra port on theswitch for the duration of the call and utilise corresponding processor requirements. Suchan approach requires minimal modifications to the switching equipment of mobileoperators and does not require the fixed operators to make modifications to their look-updatabases. HKTC will, however, be required to increase their interconnection capacity inorder to support call forwarding. The way that such an increase is managed - and thefuture uses for the capacity - are examples of the issues that will need to be addressed priorto the introduction of the interim call forwarding solution.
The system set-up costs associated with call forwarding are part of the investment that anoperator needs to make to enable it to provide telecommunications services in today’senvironment. Hence the principle of cost causation points to each operator beingresponsible for its own system set-up costs.
The same conclusion is reached by applying the distribution of benefits principle. Thesystem set-up costs mainly fall on mobile operators. The benefits of MNP would alsoaccrue mostly to mobile phone subscribers who would have a constraint to switchingbetween operators removed and would thus be able to benefit from lower prices or low

Recovering the Costs of MNP
100
switching costs. Some benefits (Type 3 benefits) would accrue to fixed network subscribers,but these represent a minority of total benefits. Similarly a small amount of system set-upcosts would fall on fixed operators.
The conclusion that each operator should bear its own set-up costs is also consistent with costminimisation and the development of effective competition. An operator that bears its ownsystem set-up costs has both the incentive and the power to minimise them. At the sametime, by not favouring one operator or another a level playing field is ensured.
7.7.2. Additional conveyance costs under the interim call forwarding solution
Additional conveyance costs can be defined as those which are additional to the costs of anon-ported call from the originating network to the recipient network.
In the UK, OVUM recommended that each operator should bear its own additional trafficcosts caused by the introduction of MNP. As discussed above, this could be seen as aneconomically efficient solution as it places the incentive to minimise the additionalconveyance cost on those that can affect the cost. In the long run, it is also arguably bothequitable and consistent with the distribution of benefits principle because the flows ofsubscribers between the donor and recipient operators could be expected to even out and soto would the additional conveyance costs. However, in the short run, the incumbent mobileoperators would bear most of the costs.
The situation in Hong Kong, however, differs to that in the UK in a number of ways. Thesedifferences include the balance of subscribers in the PMRS and PCS networks as well as thelength of time that a call forwarding solution will be in place.
In Hong Kong in 1997, PMRS subscribers accounted for 90 per cent of all mobile subscriberswhile PCS accounted for about 10 per cent. In the UK, the equivalent figures are 80 per centand 20 per cent. The implication of this is that the flow of subscribers churning networks islikely to be more asymmetric than in the UK. If each operator were to bear their ownadditional conveyance costs, the PMRS operators, at least in the short run, would bear thevast majority of the additional conveyance costs. Also, given the relatively short life of theinterim call forwarding solution in Hong Kong, it is unlikely that the flow of subscribersbetween PMRS and PCS operators will even out during the time that call forwarding is inplace. In contrast, in the UK, the signal relay solution, which involves additionalconveyance costs associated with signalling alone, will be operational for a number of years.
It is also worth noting that in Hong Kong mobile subscribers in Hong Kong pay for bothincoming and outgoing calls. Under the interim call forwarding solution this will lead tothe situation illustrated in Figure 7.1.
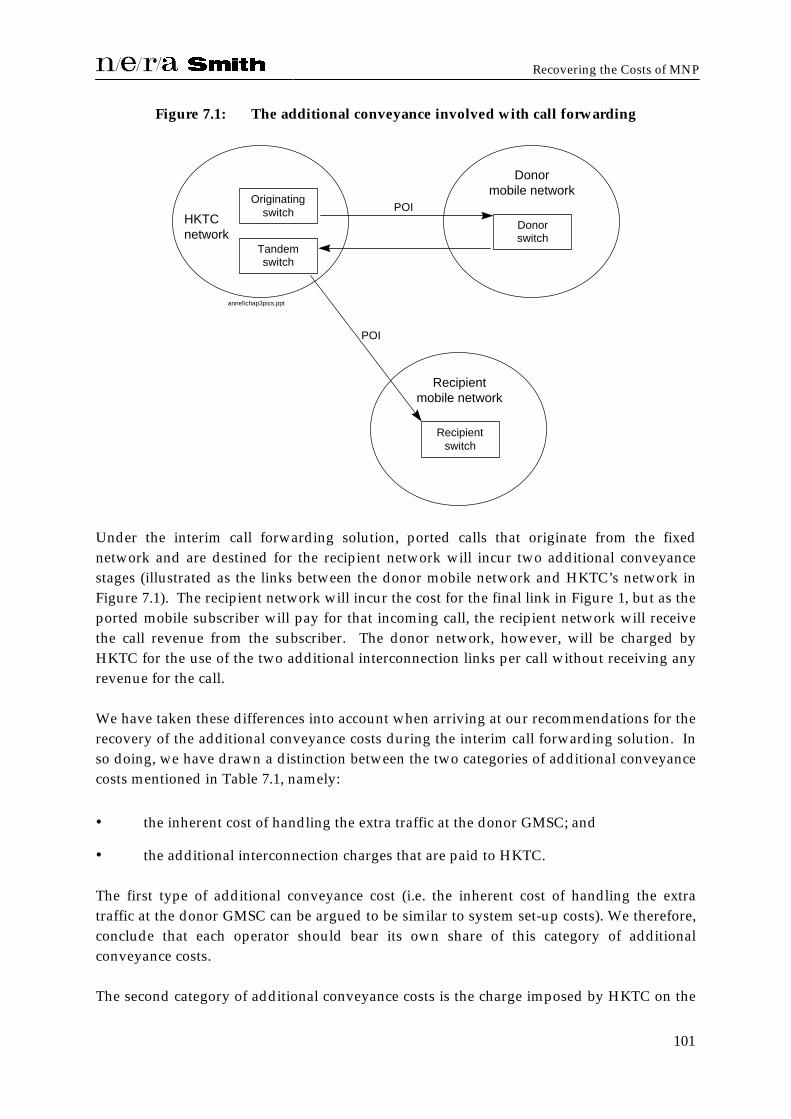
Recovering the Costs of MNP
101
Figure 7.1: The additional conveyance involved with call forwarding
annel\chap3pics.ppt
Originatingswitch
Tandemswitch
HKTCnetwork
Donorswitch
Donormobile network
Recipientswitch
Recipientmobile network
POI
POI
Under the interim call forwarding solution, ported calls that originate from the fixednetwork and are destined for the recipient network will incur two additional conveyancestages (illustrated as the links between the donor mobile network and HKTC’s network inFigure 7.1). The recipient network will incur the cost for the final link in Figure 1, but as theported mobile subscriber will pay for that incoming call, the recipient network will receivethe call revenue from the subscriber. The donor network, however, will be charged byHKTC for the use of the two additional interconnection links per call without receiving anyrevenue for the call.
We have taken these differences into account when arriving at our recommendations for therecovery of the additional conveyance costs during the interim call forwarding solution. Inso doing, we have drawn a distinction between the two categories of additional conveyancecosts mentioned in Table 7.1, namely:
• the inherent cost of handling the extra traffic at the donor GMSC; and
• the additional interconnection charges that are paid to HKTC.
The first type of additional conveyance cost (i.e. the inherent cost of handling the extratraffic at the donor GMSC can be argued to be similar to system set-up costs). We therefore,conclude that each operator should bear its own share of this category of additionalconveyance costs.
The second category of additional conveyance costs is the charge imposed by HKTC on the

Recovering the Costs of MNP
102
donor network for the use of the two additional interconnection links per call. The donornetwork, who loses a customer, is in effect further penalised by the charge for the two links.We believe, therefore, that it is appropriate that the recipient network should reimburse thedonor network for this part of the additional conveyance costs under the interim call forwardingsolution.
Such a recommendation is consistent with the principles of cost causation and distributionof benefits. It is the act of porting that causes the additional cost to be incurred and therecipient network will benefit from the introduction of mobile number portability and willgain a customer and a future revenue stream. Moreover, this revenue will far exceed theadditional conveyance cost incurred by the donor when the call is forwarded to therecipient network.
At the same time we are mindful of the need to create incentives to encourage costminimisation during the interim solution. During the interim call forwarding solution therecipient network will bear costs that it has no ability to control. However, the current capon the per minute interconnection charge set by OFTA, should help to ensure that the costis minimised.
Recipient network operators may argue that the additional conveyance cost will raise theircosts for ported customers by requiring a higher charge to be paid to the originatingoperator compared to the charge for an incoming call to a non-ported customer. This inturn will limit their capacity to compete. Although we have some sympathy with this view,it is difficult to see any alternative that meets the cost recovery principles. The additionalconveyance cost must be borne by either the originating network, the donor network, or therecipient network. As already stated, it seems unfair for the donor network - who has lostits customer - to be further penalised by having to pay for the additional conveyance costsinvolved in completing the call. Also the donor network has not caused the porting to takeplace. Meanwhile, the only argument for suggesting that charge should be borne by theoriginating operator is that it can control them and is therefore in the best position tominimise them. However, given that OFTA currently regulates the per-minute charge, it isunlikely that high charges are being levied on recipient operators.
7.7.3. Per subscriber set-up costs under the interim call forwarding solution
We suggest that per subscriber set-up costs be treated in a similar way to that adopted forfixed network portability. That is, the recipient network compensates the donor networkfor the reasonable relevant costs based on the Long Run Average Incremental Cost (LRAIC)plus a reasonable share of the common costs arising from porting, service connection anddisconnection.
We believe that the recipient network should, if it chooses, be allowed to pass on the persubscriber set-up costs to the porting customer. Whether it will or not will be a commercialdecision to be made by each operator. Such an approach is clearly consistent with the costcausation principle as the subscriber, by porting, causes the cost to be incurred. If the cost is

Recovering the Costs of MNP
103
passed on to the porting customer, then it is taken into account in the porting decision, asituation which is consistent with economic efficiency and cost minimisation.
It is also important to note that a charge by the recipient network operator on a customerfor MNP is not inconsistent with the principle of effective competition. In general, a costbased price - far from being anti-competitive - could often lead to an optimal solution. Inother words, a price on porting charged by the recipient operator may prove a usefulmechanism for discouraging an inefficient level of porting. A charge by the donor networkoperator, on the other hand, may be considered anti-competitive as it could serve to lock ina customer to a particular network.
7.8. Cost Recovery Under the Distributed Database Solution
7.8.1. System set-up costs under the distributed database solution
Under this solution, there would be a distributed database solution with the look-upperformed by the fixed network operators. In our view, HKTC is in the best position toperform this function given the current interconnection arrangements and the look-upfunctions currently performed by HKTC for ONP. In this way, the situation could be seenas analogous to a centralised database solution.
Operators apart from HKTC, particularly fixed operators may also wish to provide a look-up function to other operators. In the short run such a look-up service may be uneconomicgiven the lack of direct interconnection between fixed operators and many of the mobileoperators. We believe, therefore, that until there is direct interconnection between more ofthe networks, HKTC is best placed to offer the look-up service to all networks. Indeed, itscurrent position in the market place means that it should be able to offer the service at themost cost-effective price to most operators.
At the same time, however, other fixed operators may be able to offer look-up services tothemselves or to mobile operators.22 Allowing these operators to provide the look-up tothemselves or to others would be consistent with the principle of effective competitionwhile, in our view, not affecting the ability of HKTC to offer a commercial service to theremainder of the market.
The costs of implementing this solution fall almost exclusively on the fixed network thatoffers the look-up. The types of system set-up costs involved would include an expansionof database look-up capacity. Mobile operators, on the other hand, would not be requiredto undertake any immediate developmental work in their networks.
22 Fixed operators will be able to offer the look-up service to those mobile operators to which they have directinterconnection. They may be able to offer the service to other operators provided that the originating operator changesthe dialling number to a network number that will enable the call to travel, through HKTC’s network, to the other fixedoperator offering the look-up service. This option would involve additional conveyance to a HKTC look-up.

Recovering the Costs of MNP
104
One option for recovering the costs of the distributed database solution would be to set acharge for each database look-up. In this way, the costs of the database could be recoveredover time in line with the volume of traffic through the database. Whether or not a chargewill be incurred will depend on the type of operator. For example, if a call to a mobilephone originated in HKTC’s network, HKTC should bear the cost of a database look-up.Such an outcome is consistent with the distribution of benefits principles insofar as callers inthe fixed network are able to have their calls completed. On the other hand, where a calloriginates in one mobile network and terminates in another, the originating networkoperator would need to pay HKTC (or, in the longer term, whoever they choose) for thedatabase look-up.
The above reasoning is broadly similar to the view that each operator should bear its ownset-up costs. The operators should, in other words, have the ability to route calls to thecorrect destination using a database. This ability is part of the investment required in amulti-operator environment in order to allow operators to route calls to the ported numbersefficiently and correctly. Operators, therefore, should acquire this capacity either byinvesting in the database or by ‘purchasing’ the look-up by other operators.
Under such a solution, the system set-up costs would be shared by fixed and mobileoperators depending on the mix of traffic. Initially at least, as most calls originate inHKTC’s network, it would be expected to bear a majority of the costs.
However, the current charging system for mobile calls in Hong Kong creates the need for adifferent set of cost recovery principles for system set-up for distributed database solution.In Hong Kong, subscribers do not pay for local calls.23 If a customers from the fixednetwork calls a mobile customer, the mobile customer bears the cost. The criticalimplication is that the fixed network does not recover any revenue from its customers whencalls to mobile networks - or indeed any network - are made. The costs are recovered fromthe terminating mobile operator.
Under our proposed distributed database solution, the cost incurred in the fixed networkwhen a fixed network customer calls a mobile subscriber would, therefore, be treated in thesame way as the other costs involved in completing the call. The rationale for this is thatthe fixed network operator receives the revenue from the terminating operator rather thantheir own customer.
Although the charge for the look-up should be treated in the same way as the other costsinvolved in completing a call, there would be benefits from unbundling the numbertranslation and routing operations from HKTC’s interconnection charge. In particular, thismight encourage other operators to perform the number translation service while stilltransiting through HKTC’s network.
23 Although the cost of the calls is, in part, recovered through line rentals.

Recovering the Costs of MNP
105
We would, therefore, recommend that the system set-up costs under the distributeddatabase solution be recovered from mobile operators through a charge for the look-upservice.
The way the charge is determined will depend on the way the market develops. If none ofthe fixed operators were prepared to offer a look-up service to all operators, then a fixedoperator may need to be encouraged to provide the service. HKTC appears to be bestplaced to offer the service if a competitive market could not develop. If HKTC is the onlyoperator offering the look-up service or is requested to provide the service, then this chargewould need to be reviewed by OFTA and should be based on the long run averageincremental cost of the system set-up costs incurred by HKTC to upgrade its distributeddatabase. If, however, a competitive market develops in the short term, then OFTA mayconsider leaving the charge to the market and commercial negotiation.
The parties on whom the charge would be levied would vary depending on the originationof the call. For example:
• if the call originates from the fixed network, the charge would be paid by theterminating mobile operator.
• if the call originates in the mobile network, the charge would be shared by theoriginating and terminating operators (as is currently the case with PNETS charges).
We believe that under either option, a charge on the terminating mobile operator (in thecase of a mobile to mobile call, a charge shared by the originating and terminatingoperators) is also consistent with the principle of effective competition and costminimisation. With regards to effective competition, a charge only on recipient networkoperators would increase the cost of a ported customers. This would in effect treat theported customers differently. It implies that the numbers do belong to the existingoperators and any variation from that policy should incur a cost. A charge on allterminating mobile calls, on the other hand, treats all mobile operators (donor networkoperators and recipient network operators) equally.
The proposed charge could also help to encourage a more efficient outcome. Mobileoperators may, over time, develop a cheaper way of implementing portability (such as theirown look-up) and may avoid the charge imposed by HKTC. In the long run, a competitivemarket for number translation services may develop further reducing the cost and charge ofnumber translation services. In short, a charge on mobile operators will provide anincentive to operators to move towards an IN solution and perhaps direct interconnectionwith other operators when commercially viable. As discussed above, the nature of thecharge would depend on how many operators offered the look-up service. If a competitivemarket for the look-up service looked likely from the beginning of the distributed databasesolution, the charge could be left to the market. If, however, only HKTC were to providethe service, the level of the charge may need to be regulated by OFTA.

Recovering the Costs of MNP
106
The relevant cost principle is also relevant here. Any charge should only recover thosecosts employed for the provision (and maintenance) of a database look-up caused by theintroduction of MNP (that is, the incremental costs), not those costs that have been incurredto enable the current database look-up for ONP.
7.8.2. Additional conveyance costs under the distributed database solution
The additional conveyance costs under the distributed database solution consist of theadditional signalling capacity costs required for calls to mobile numbers. We see these costsas similar in nature to the costs associated with a database dip and with the correct routingof numbers and would therefore treat them in a similar way.
7.8.3. Per subscriber set-up costs under the distributed database solution
These costs would be treated in the same way as in the interim call forward solution. Thatis, the recipient network should compensate the donor network for the reasonable relevantcosts based on the LRAIC plus a reasonable share of the common costs arising fromporting, service connection and disconnection. Again, the recipient network should, if itchooses, be allowed to pass on the per subscriber set-up costs to the porting customer.
7.9. Summary
Table 7.2 shows how the costs of mobile number portability in Hong Kong are to beallocated.
Table 7.2Allocating the costs of MNP
Technology
Cost Call forwarding Distributed database
System set-up cost Each operator bears its own costs Fixed operators or HKTC to recoverits costs from all mobile operators
Additionalconveyance costs
Donor network operator to recoverinterconnect charge from recipientnetwork operator. Each operator tobear its own remaining costs
Fixed operators or HKTC to recoverits costs from all mobile operators
Per subscriber set-upcosts
Donor network operator to recoverfrom recipient network operator
Donor network operator to recoverfrom recipient network operator
Appendix A
107
APPENDIX A. THE BASE CASE
A.1. Introduction
This appendix discusses the future of the Hong Kong’s mobile telecommunications marketin the absence of Mobile Number Portability (MNP) over the next 10 years. There arecurrently four Public Mobile Radiotelephone Service (PMRS) licensees offering oneanalogue and five digital systems (including GSM, CDMA and TDMA). In 1996, sixoperators were licensed to provide Personal Communications Services (PCS). By the end of1997, there were just over two million subscribers, representing a penetration of around 32per cent of the Hong Kong population.24
GSM systems have been operating since 1993 and PCS since 1997. Analogue systems arebeing phased out and subscribers of these systems encouraged to migrate to either GSM orPCS. As a result, this study does not consider the impact of MNP on analogue subscribers.As GSM and PCS are relatively new services, there is limited historic data available25 onsubscriber numbers, prices and the volume and value of services. Consequently, we havehad to make arrangements based on the survey of mobile users, interviews with mobileoperators and other industry participants, and expected developments in mobile markets inother countries.
The derivation of the base case forecasts for mobile subscriber growth and the results arepresented in the next section. The proportion of mobile subscribers switching to othernetworks is estimated in Section A.3. Finally, Section A.4 provides our forecasts forrevenue per subscriber.
A.2. Forecasting Mobile Subscribers
A.2.1. The logistic curve
The logistic curve is often used to forecast the penetration of products which, after a start-up phase, show rapid growth before tapering off. A generalised form of the logisticfunction is used in the following analysis (see Figure A.1);
24 All penetration rates are for the end of the calendar year. Forecasts of future penetration rates take into account populationgrowth, based on information on the projected population to 2016 provided by OFTA.
25 For forecasting purposes.

Appendix A
108
Figure A.1Logistic Curve
c
1 e( )a .b ( )x d
x
where a and d are parameters to be estimated, b shows the speed of take-up of services, andc is the saturation penetration level.
A best fit is obtained by minimising the sum of the squared differences between the actuallevel of penetration and the logistic function value for each year’s data. This has beencarried out using Excel and the associated facility, Solver.
A.2.2. Assumed penetration rates
Assumptions have been made with respect to total mobile phone penetration in Hong Kongas well as market shares of each system (GSM, PCS, CDMA, TDMA). These are discussedseparately below.
A.2.2.1. Overall Market
Table A.1 shows our assumptions on mobile penetration in the Hong Kong market. Theseassumptions are based on discussions with operators in Hong Kong. We expect a mobilepenetration rate of about 50 per cent by 2002 and 60 per cent by 2007 anything, theseforecasts. Thereafter we expect the penetration rate to remain broadly constant. If anythingthese forecasts are conservative.
This assumption is consistent with the rapid growth in mobile phone penetrationexperienced in Scandinavian markets, such as Sweden and Denmark, where currentpenetration levels are above 30 per cent and expected to reach 50 per cent by the year 2000.A report by Salomon Brothers26 predicts a cellular penetration rate of 70 per cent forWestern Europe driven by:
• deregulation of the telecommunications industry;
• issuance of new licenses;
26 Salomon Brothers, Wireless Quarterly, November 1997.

Appendix A
109
• more spectrum availability; and
• converging technologies (fixed/wireless/content).
Table A.1Mobile Penetration (%) - Overall Market
Year Penetration* 1992 0% 1997 32% 2002 50% 2007 60% 2009 60%
Source: NERA estimates
* This excludes analogue subscribers.
Higher levels of mobile penetration are driven by:
• increased market segmentation as operators develop service packages that addressthe needs of a growing number of consumer market segments based on thecombination of communications and security needs of individuals;
• a need for differentiation of services - value added services will be critical formaximising profits and network utilisation in a highly competitive market such asHong Kong;
• a requirement by mobile subscribers for constant contactability and control overtheir communications services. The customer’s choice will be based on networkquality and coverage, handset prices and tariffs, and the level and quality ofcustomer service.
The base case takes into account the fact that technological inhibitors, such as networkcoverage restrictions in buildings and rural areas and the perception that call quality is low,are expected to reduce rapidly over the next few years. We expect these inhibitors tobecome less important in the light of the fact that PCS operators are looking to increase theirnetwork coverage over the next 18 months
The price of calls is also a barrier to the adoption of mobile services. Currently, most of themobile operators subsidise the provision of handsets and, in order to recover the cost of thesubsidy, require higher call charges than would otherwise be the case. With theintroduction of the PCS networks in Hong Kong, the mobile market is expected to becharacterised by declines in average revenue per subscriber resulting from lower serviceprices and less utilisation by incremental users.
The increased use of value added services, such as data, are expected to mitigate some ofthe effects of this trend. However, with competition increasingly cutting the safety net

Appendix A
110
provided by annual subscriber contracts, operators will be forced to reduce subscriberacquisition costs as well as network operating and infrastructure costs, enabling operatorsto offer lower tariffs. Against this background we have assumed on the basis of what theoperators have told us, that the handset subsidy will be phased out soon.
It should be noted that these assumptions also hold for the market with the introduction ofMNP. The Hong Kong mobile market is already competitive and even in the absence ofMNP, competition is expected to lead to lower prices and enhance service quality. MNPwill make it easier to switch to other networks, therefore increasing the number ofsubscribers switching between networks. As a result, we do not assume a different set ofpenetration rates for the overall market in the MNP scenario, but assume a different set ofpenetration rates by type of mobile system in the MNP scenario.
A.2.2.2. Mobile systems
Ideally a customer migration model should be based on forecasts of price differentials,switching costs and inertia, enabling the forecast of base case market shares by type ofsystem. In the absence of sufficient historic information on developments in market share(in terms of number of subscribers), it has not been possible to calibrate such a model usingdata. Our approach is, therefore, led by conservative assumptions described in this section .
The rationale for making separate forecasts for the different mobile systems is that theyhave different cost structures, revenue per subscriber, churn rates, and spectrumallocations.
Overall mobile phone penetration can be sub-divided according to the four main types ofsystem (see Table A.2.). These are based on NERA estimates of the saturation level persystem and, therefore, market shares arising from current spectrum constraints:
• GSM. The GSM band could support about 2.1 million subscribers.27 Currently,GSM systems have nearly 1.3 million subscribers. Based on historic data, whichshows high growth over the last three years, it would be unrealistic to assume in thebase case that penetration of GSM systems will fall. Since it currently has about 65per cent of market share (in terms of number of subscribers) and accounts for 21 percent of total mobile penetration, we expect GSM penetration to continue to grow in agrowing market, although its market share may fall as a result of competition fromPCS operators. Although it is extremely difficult to forecast market shares, especiallyas dual GSM/PCS operators could optimise their networks allowing users to useboth bands, given the current spectrum constraint for the GSM band, we expectGSM penetration to reach 25 per cent by 2002, and increase to nearly 29 per cent by2007 and then remain at that level;
27 Where the capacity of each GSM network is about 700,000 subscribers, based on the full spectrum allocation of 2 x 7.5 MHzfor each of the GSM operators. There are three GSM operators in Hong Kong.

Appendix A
111
• CDMA & TDMA. It is claimed that these systems are more spectrum efficient thanGSM/PCS but our experience suggests that in reality there is no significantdifference. The CDMA and TDMA systems also have spectrum allocations of 2 x 7.5MHz and, therefore, should be able to support around 700,000 subscribers each.CDMA has grown by over 350 per cent during the last year, to achieve a level ofover 240,000 subscribers by the end of 1997, compared with 17 per cent growth forTDMA over the same period. We expect CDMA to outstrip TDMA in terms ofnumber of subscribers over the next ten years. Penetration rates of CDMA andTDMA are expected to be 6.5 per cent and 5.5 per cent, respectively, by 2002, and 7.2per cent and 6.6 per cent, respectively, by 2007;
• PCS. With the current 5 MHz allocation, each PCS can support 300,000 subscribers.A total of 70 MHz is, however, available across the band which could support 4.2million subscribers. With market shares being determined by spectrum constraintsfor the other systems, PCS market shares account for the remainder of the mobilemarket. PCS is expected to have a market share (in terms of number of subscribers)of about 30 per cent by 2007, or 17 per cent of total mobile penetration.
Table A.2Mobile Penetration (%) - By System
Year GSM PCS CDMA TDMA Total
1992 0.0% 0.0% 0.0% 0.0% 0% 1997 20.6% 3.6% 3.7% 4.1% 32.0% 2002 26.9% 13.1% 6.8% 6.0% 52.8% 2007 26.9% 17.2% 6.9% 6.1% 57.1% 2009 26.9% 17.5% 6.9% 6.1% 57.4%
Source: NERA estimates
As discussed earlier, the introduction of MNP will not affect the size of the total mobilemarket but has an impact on how that market is divided up between the different systems.We take this into account when we make assumptions on mobile penetration by system inthe MNP scenario.
It should be noted that OFTA is currently conducting a review of spectrum allocations tomobile operators and considering whether additional spectrum will assigned to GSM,CDMA and TDMA networks. The results are not yet known. It is our understanding thatany additional spectrum allocations are likely to be small and, therefore, will not have asignificant impact on our assumptions.
A.2.3. Results
A.2.3.1. Expected growth of mobile subscribers - overall market
This section shows the results obtained by fitting a logistic curve using the historic data andassumptions on penetration rates (Figure A.2).

Appendix A
112
Fig A.2 - Expected Penetration of Mobile Phones 1997-2007
0%
10%
20%
30%
40%
50%
60%19
92
1993
1994
1995
1996
1997
1998
1999
2000
2001
2002
2003
2004
2005
2006
2007
Source: NERA estimates
Table A.3 shows the likely size of the mobile market in Hong Kong based on the logisticcurve. The best fit shows that, by 2002, there will be around 3.8 million subscribers and thatthis figure will rise to nearly 4.4 million by 2007, and 4.6 by 2009. The results presentedhere do not exactly correspond to the assumptions presented in Table A1.1, as these resultsare the obtained from the best fit using the sum of the squared difference between the actualand the function value for each year’s data. However, the differences are very small.
The results presented here take account of churn in the market. This is investigated furtherin Section A.3, where we estimate inter-mobile churn.

Appendix A
113
Table A.3Expected Mobile Penetration and Subscribers 1997-2007
Year Penetration (%) Subscribers (million)
1997 29% 1.89 1998 36% 2.41 1999 42% 2.86 2000 48% 3.27 2001 52% 3.59 2002 54% 3.84 2003 56% 4.02 2004 58% 4.18 2005 59% 4.28 2006 59% 4.36 2007 59% 4.44 2008 60% 4.50 2009 60% 4.56
Source: NERA estimates
A.2.3.2. Expected growth of mobile subscribers - by system
This section shows the results obtained by fitting the logistic curve to the assumptions onpenetration rates by mobile system (Table A.4).28
Subscriber numbers in 2009 are estimated as follows:
• 2 million for GSM;
• 1.3 million for PCS;
• about 0.5 million each for CDMA and TDMA.
28 The numbers in Tables A1.3 and A1.4 differ slightly due to the process of fitting separate logistic curves for each system.

Appendix A
114
Table A.4Expected Mobile Subscribers - by System
Year GSM PCS CDMA TDMA
Pen (%) Subs(mn)
Pen (%) Subs(mn) Pen (%) Subs(mn) Pen (%) Subs(mn)
1997 21% 1.33 4% 0.23 4% 0.24 4% 0.26
1998 26% 1.70 5% 0.34 5% 0.32 5% 0.34
1999 27% 1.80 7% 0.48 6% 0.39 6% 0.38
2000 27% 1.84 9% 0.63 6% 0.43 6% 0.40
2001 27% 1.87 11% 0.78 7% 0.46 6% 0.41
2002 27% 1.90 13% 0.92 7% 0.48 6% 0.42
2003 27% 1.92 15% 1.03 7% 0.49 6% 0.43
2004 27% 1.95 16% 1.13 7% 0.50 6% 0.43
2005 27% 1.96 16% 1.20 7% 0.51 6% 0.44
2006 27% 1.99 17% 1.24 7% 0.51 6% 0.45
2007 27% 2.00 17% 1.28 7% 0.52 6% 0.45
2008 27% 2.03 17% 1.31 7% 0.52 6% 0.46
2009 27% 2.05 18% 1.34 7% 0.53 6% 0.46
Source: NERA estimates
Figure A.3 shows the expected growth of mobile users over the next ten years by system.
Fig A.3 - Expected Number of Subscribers - by System 1997-2007
-
0.50
1.00
1.50
2.00
2.50
1997
1998
1999
2000
2001
2002
2003
2004
2005
2006
2007
2008
2009
mil
lion
PCS GSM CDMA TDMA
Source: NERA estimates

Appendix A
115
A.3. Switching Forecast
A.3.1. Introduction
This section sets out our assumptions and methodology for estimating the number ofsubscribers switching networks.
Customer retention becomes increasingly important as the number of operators in a givenmarket increases. A high proportion of a mobile operator’s subscriber base turns over or“churns” to a different carrier (or simply quits using mobile services) every year. With thecost of acquiring a customer being around five times the cost of maintaining a customer, theeasiest and least expensive way to achieve and maintain a given customer base is to keepthe ones you already have.
Current churn rates are extremely high in Hong Kong, ranging from 24 per cent p.a. to asmuch as 55 per cent p.a.29 Such rates are the result of fierce price competition since thelaunch of PCS services offering low tariff packages. Current churn rates are higher, onaverage, for the GSM and CDMA and TDMA then for PCS.
A.3.2. Assumptions
In the medium and long-term, churn rates will decrease for GSM, CDMA and TDMA dueto:
• the bundling of other telecom services;
• convergence of retail tariffs between these systems and PCS; and
These effects are taken into account by decreasing the churn rate for GSM, CDMA andTDMA systems. We assume that:
• that there is a 36 per cent churn rate in the market (based on the views of operators),which reduces to 30 per cent to 2002 and 24 per cent by 2007. This is line withexpected changes in churn rates in Europe:
- churn rates for Cellnet and Orange in the UK are 30 per cent 17 per centrespectively.30 These are 5-10 per cent lower than those in Hong Kong;
- current churn rates average around 10-15 per cent in Scandinavia;
29 Source: OFTA
30 Source: Telecom Markets, Financial Times, 13September 1997.

Appendix A
116
- long-term forecasts of churn rates range between 18-20 per cent.31
• 80 per cent of all subscribers who leave one network will join another (inter-operatorchurn). This assumption is conservative since a mobile subscriber is unlikely toleave the market altogether until there is a superior substitute for mobile telephony.
It should be noted these forecast churn rates take into account the introduction of dualmode handsets in the Hong Kong mobile telecommunications market. In the absence ofMNP, should a subscriber with a dual handset decide to switch operators within a system(i.e. GSM-GSM churn), he will not be able to take his old mobile number to the newoperator and, therefore, this may discourage greater switching within a system. The abilityto switch between PCS and GSM, however, is captured in the churn rate. It is likely thatwith the introduction of MNP there will be greater switching by mobile subscribers.
Churn rates for PCS operators are assumed constant at 24 per cent over the same perioddue to:
• the lower churn rates that PCS operators currently experience; and
• their tariff packages relative to other systems are expected to remain cheaper overthe next ten years.
Thus churn rates for PCS will be lower than churn rates for other systems, but thesedifferences will narrow, and finally converge, over time.
It should be noted that the switching model:
• takes into account differences in churn rates between different systems;
• captures those subscribers switching out of one technology into another. The modelis, therefore, dynamic and all subscribers switching within the model are accountedfor;
31 Source: Wireless Quarterly, Salomon Brothers, November 1997.

Appendix A
117
A.3.3. Approach and Results
Inter-operator churn is apportioned to each system, where inter-operator churn ijt is:
churn to another operator it * 1
4...1
1-jt
subs
subs
−
=∑ kt
k
where:
• i is the mobile system
• j is the alternate mobile system
• k is:
- all operators, for churn from PCS and GSM systems;
- all operators other than i, for churn from CDMA and TDMA systems; and
• t is end year of the forecast period.
This approach is also the one used to estimate inter-operator churn in the switching modelwith MNP.
Table A.5 shows the switching forecast for each mobile system.

Appendix A
118
Table A.5Movement of Mobile Subscribers (millions)
1998 1999 2000 2001 2002 2003 2004 2005 2006 2007 2008 2009
PCS
PCS-GSM 0.031 0.043 0.057 0.070 0.083 0.093 0.101 0.107 0.112 0.096 0.098 0.100 PCS-CDMA 0.008 0.011 0.015 0.018 0.021 0.024 0.026 0.028 0.029 0.025 0.025 0.026 PCS-TDMA 0.008 0.011 0.014 0.017 0.020 0.023 0.025 0.026 0.027 0.023 0.024 0.024 PCS-PCS 0.020 0.028 0.037 0.046 0.054 0.061 0.066 0.070 0.073 0.063 0.064 0.065
GSM
GSM-PCS 0.149 0.167 0.153 0.146 0.139 0.131 0.123 0.115 0.107 0.098 0.099 0.100 GSM-CDMA 0.059 0.066 0.061 0.058 0.055 0.052 0.049 0.046 0.042 0.039 0.039 0.040 GSM-TDMA 0.052 0.058 0.053 0.051 0.048 0.045 0.043 0.040 0.037 0.034 0.034 0.035 GSM-GSM 0.229 0.257 0.235 0.224 0.213 0.201 0.190 0.177 0.164 0.151 0.152 0.154
CDMA
CDMA-PCS 0.034 0.039 0.041 0.041 0.040 0.038 0.036 0.034 0.031 0.029 0.029 0.029 CDMA-GSM 0.053 0.060 0.063 0.063 0.061 0.058 0.055 0.052 0.048 0.044 0.45 0.045 CDMA-TDMA 0.012 0.013 0.014 0.014 0.14 0.013 0.013 0.012 0.011 0.011 0.010 0.010
TDMA
TDMA-PCS 0.035 0.037 0.037 0.036 0.035 0.033 0.031 0.029 0.027 0.025 0.025 0.025 TDMA-GSM 0.054 0.057 0.057 0.056 0.053 0.051 0.048 0.045 0.041 0.038 0.038 0.039 TDMA-CDMA 0.014 0.015 0.015 0.014 0.014 0.013 0.012 0.012 0.011 0.010 0.010 0.010 TOTAL 0.757 0.863 0.850 0.854 0.849 0.836 0.818 0.790 0.759 0.684 0.694 0.703
Source: NERA estimates

Appendix A
119
A.4. Forecast Revenue Per Subscriber
Based on discussions with the industry, we expect average revenue per subscriber (for themarket as a whole) to decrease over the next ten years. Increased competition, especiallysince the launch of PCS services, will result in reduced tariff rates and an increasing numberof low volume users. These forecasts of revenues per subscriber are inputs into thecalculation of benefits of MNP. Our survey results indicate that the switching behaviour ofbusiness users (SMEs and corporate) will not be affected by MNP.32 As a result, we focuson revenue per subscriber for personal users.
GSM operators are expected to respond to the challenge of lower tariff packages offered byPCS by offering lower tariffs to their subscribers. They are, however, expected to cushionthe impact of this trend on profits by:
• providing more value added services to increase usage;
• increasing international roaming revenues; and
• introducing new service offerings, such as wireless data communications andbundled paging services.
As a result, GSM operators are likely to experience a decrease in revenue per subscriberover time. However, others systems are expected to remain cheaper than GSM, althoughthe price differential is expected to narrow (Table A.6)
TDMA is expected to experience a decrease in calling rates and, therefore, revenue persubscriber.
In contrast, revenue per subscriber for PCS is expected to increase, albeit slightly, over thesame period. This reflects the fact that:
• current special deals offered by PCS operators will be discontinued this year; and
• calling rates for PCS are expected to increase (based on discussions with theindustry).
Based on current revenue per subscriber for CDMA, it is likely to be system that competeswith PCS on price. Hence, revenue per subscriber for CDMA is also expected to rise, albeitslightly, until 2006 and, subsequently converge to PCS levels by 2007.
32 Results from the user survey reveal that business users require the same discount to switch operators with MNP as they dowithout it.

Appendix A
120
Table A.6Forecast Revenue Per Subscriber - by System (HK$ per month)
System 1999 2000 2001 2002 2003 2004 2005 2006 2007 2008 2009
GSM 550 525 500 500 480 460 440 420 400 400 400 PCS 300 310 320 335 335 335 340 340 350 350 350 CDMA 330 341 352 369 369 369 374 374 350 350 350 TDMA 440 420 400 400 384 368 352 352 352 352 352
Source: NERA estimates

Appendix B
121
APPENDIX B. SWITCHING MODEL WITH MNP
B.1. Introduction
This appendix discusses the development of the Hong Kong mobile telecommunicationsmarket over the next ten years if mobile number portability is introduced. The number ofsubscribers who switch will increase due to MNP because it enables subscribers to retaintheir mobile telephone numbers.
The next section discusses our approach to forecasting subscribers by system. Forswitching, the approach is similar to that used for the Base Case. There are differences insome of our assumptions with MNP and these are discussed in Section B.3. Results of theswitching model, including different scenarios and sensitivity analyses, are presented inSection B.4.
B.2. Forecasting Subscribers by System
As discussed in Appendix A, the introduction of MNP will not affect the size of the totalmobile market but will have an impact on how that market is divided up between thedifferent systems. We take this into account when we make assumptions on mobilepenetration by system in the MNP scenario (Table B.1).
Table B.1Mobile Penetration with MNP (%) - by System
Year GSM PCS CDMA TDMA Total
1992 0.0% 0.0% 0.0% 0.0% 0% 1997 20.6% 3.7% 3.8% 4.1% 32.1% 2002 23.0% 14.0% 7.0% 6.0% 50.0% 2007 24.0% 19.2% 9.0% 7.8% 60.0% 2009 24.0% 19.2% 9.0% 7.8% 60.0%
Source: NERA estimates
With MNP, it is expected that GSM, being the most expensive system and the systemexperiencing higher levels of churn, will have a lower penetration rate than without MNP.
The methodology used to forecast subscribers by type of systems is similar to that used forthe Base Case (see Appendix A). Table A.2 shows the results obtained by fitting the logisticcurve to the assumptions on penetration rates by mobile system. Subscribers numbers by2009 are estimated as follows:
• 1.8 million for GSM;
• 1.5 million for PCS;
• about 0.7 million for CDMA; and

Appendix B
122
• around 0.6 million for TDMA.
Table B.2Expected Mobile Subscribers with MNP - by System (mn)
Year GSM PCS CDMA TDMA
Pen (%) Subs(mn)
Pen (%) Subs(mn) Pen (%) Subs(mn) Pen (%) Subs(mn)
1997 21% 1.33 4% 0.23 3% 0.22 4% 0.24
1998 23% 1.53 5% 0.35 4% 0.28 5% 0.30
1999 23% 1.58 7% 0.49 5% 0.35 5% 0.36
2000 23% 1.61 10% 0.66 6% 0.41 6% 0.41
2001 23% 1.63 12% 0.83 7% 0.47 6% 0.44
2002 23% 1.65 14% 0.98 7% 0.52 7% 0.47
2003 24% 1.67 16% 1.12 8% 0.56 7% 0.49
2004 24% 1.69 17% 1.23 8% 0.59 7% 0.51
2005 24% 1.71 18% 1.31 8% 0.62 7% 0.52
2006 24% 1.73 19% 1.37 9% 0.64 7% 0.53
2007 24% 1.75 19% 1.41 9% 0.65 7% 0.54
2008 24% 1.77 19% 1.45 9% 0.66 7% 0.55
2009 24% 1.79 19% 1.48 9% 0.68 7% 0.56
Source: NERA estimates
Figure B.1 shows the forecast growth of mobile users over the next ten years by system,assuming the introduction of MNP.

Appendix B
123
Fig B.1 - Expected Number of Subscribers with MNP - by System 1997-2007
-
0.50
1.00
1.50
2.00
2.5019
97
1998
1999
2000
2001
2002
2003
2004
2005
2006
2007
2008
mil
lion
s
PCS GSM CDMA TDMA
Source: NERA estimates
B.3. Assumptions
The switching model changes with the introduction of MNP, the main consequence beingan increase in the churn rate.
Churn rates after the introduction of MNP are expected to increase by an extra 5-15 percent. This is a conservative assumption since some operators expect an increase in churn ofabout 10-20 percent.
We carried out sensitivity analyses on the extra churn with MNP: high churn (15 per cent),medium churn (10 per cent) and low churn (5 per cent).
In addition, not all Type A subscribers (those who would switch without MNP) port theirnumbers. It is expected that about 15-30 per cent of subscribers switching systems will portin 1999; 45-90 per cent by 2002; and between 65-90 per cent by 2007.33 Sensitivity analysishas been carried out on the porting rate.
The main reason why not all switches will port is that not all subscribers who switch will beaware of the availability of MNP. As with all new services, there is a learning process forusers and the number of subscribers switching who port will increase over time. Also somesubscribers actually want to change their number.
33 The upper limit on the porting rates is based on information provided by OFTA on existing and predicted porting rates inthe fixed network whereas the lower limit is based on views of an operator.

Appendix B
124
In contrast, it is axiomatic that all personal subscribers, who are price sensitive, switchbecause of the introduction of MNP (Type B) will port their number. We assume, based onthe user survey, that business customers are not price sensitive and, therefore, do not porttheir numbers.
The number of subscribers switching systems given MNP has been estimated for differentstarting dates for MNP. Three possible scenarios are modelled:
• Optimistic - MNP introduced in January 1999;
• Realistic - MNP introduced in July 1999;
• Pessimistic - MNP introduced in January 2000.
B.4. Results
Information derived from the Base Case switching model and the switching model withMNP are used to calculate the numbers of Type A & B mobile subscribers, that are used inthe cost-benefit analysis. The forecast numbers of Type A & B subscribers are shown inTable B.3.
Table B.4 shows the number of Type A subscribers who port their numbers. The rangesshown reflect the results of the sensitivity analyses on the porting rate for Type Asubscribers. Since all Type B personal subscribers will port their numbers, the rangesshown reflect the results of the different scenarios. These results are not affected by theporting rate.

Appendix B
125
Table B.3Subscribers that Churn
1999 2000 2001 2002 2003 2004 2005 2006 2007 2008 2009
Type A (mn) 0.863 0.850 0.854 0.849 0.840 0.818 0.7902 0.759 0.684 0.694 0.703
Type B (mn)1
Pessimistic - 0.175 0.210 0.242 0.267 0.285 0.296 0.303 0.348 0.957 0.363
Realistic 0.141 0.313 0.362 0.401 0.440 0.467 0.484 0.496 0.545 0.556 0.567
Optimistic 0.392 0.452 0.514 0.569 0.613 0.649 0.671 0.688 0.741 0.756 0.768
Source: NERA estimates Note: The additional churn rate assumptions used under the different scenarios are low (5 per cent) for the pessimistic case, medium (10 per cent) for the realistic caseand high (15 per cent) for the optimistic case.
Table B.4Type A and B Porting Subscribers
1999 2000 2001 2002 2003 2004 2005 2006 2007 2008 2009
Type A (mn)1 0.129-0.259 0.213-0.425 0.299-0.598 0.382-0.764 0.418-0.753 0.491-0.736 0.514-0.711 0.494-0.683 0.444-0.615 0.451-0624 0.457-0.633
Type B (mn)2 0-0.253 0.113-0.292 0.136-0.332 0.156-0.368 0.172-0.396 0.184-0.419 0.191-0.433 0.196-0.444 0.225-0.479 0.230-0.488 0.235-0.496
Source: NERA estimates
Notes:
1 The lower and upper bounds for Type A are determined by low and high porting rates, respectively.
2 The Type B subscribers shown in the table are only the personal subscribers that churn as a result of MNP. All Type B subscribers (including SME and corporate)subscribers are shown in Table B.3.

Appendix C
126
APPENDIX C. TELECOMMUNICATIONS ENVIRONMENT INHONG KONG
C.1. Introduction
This section describes the telecommunications environment in Hong Kong includingarrangements for interconnection between fixed telecommunications networks, mobiletelecommunications operators and pager operators. The section also includes a descriptionof the method of implementing Fixed Number Portability (FNP).
C.2. Network Architecture
Following liberalisation of the local-loop market in 1995, three new operators were allowedto offer alternative local-loop access networks to HKTC’s network. These new operatorswere not allowed to offer international services, nor were they allowed to provide leased-line services. HKTC was divided into two entities:
• HKTC (Hong Kong Telephone Company Limited) responsible for the provision oflocal-loop services, leased lines, interconnection services, and having a UniversalService Obligation;
• HKTI (Hong Kong Telecom International Limited), responsible for providinginterconnection to international networks via its International Switching Centres(ISC).
Figure C.1 represents a schematic diagram of the interconnection arrangements in HongKong.

Appendix C
127
Figure C.1Interconnection arrangements in Hong Kong.
Key
Point of interconnection ICG Interconnection gateway
OIAN Originating international access network IICG International interconnection gateway
ISC International switching centre
Partial interconnection
ISC
IICG
annel\chap3pics.ppt
OIAN
Mobilenetwork
Mobilenetwork
Alternativefixed
network
HKTCnetwork
ISC
ICG ICG
ICG
ChinaRest of world
The mobile operators currently transfer most of their traffic via E1 links to the HKTCnetwork, though there is a limited amount of inter-mobile network connection, particularlybetween networks owned by a single operator. Though most operators have consideredfurther interconnection, few concrete plans are in place, with operators quoting lack ofinter-mobile network traffic and contractual difficulties as key blocking factors.
HKTC provides links to the mobile operators’ switching frames and charges interconnectionrates that are determined by OFTA and are currently 6.7 cents per minute. Alternatively,leased lines could be installed between two mobile operators’ networks at an operating costof $11,000 per month. Currently direct interconnection exists between networks owned bythe same operator (e.g. between Hutchison Telecom’s IS-95, GSM, PCS and fixed networks,and between New World PCS and New World Telephone's networks).
The signalling system used throughout the Hong Kong networks is ISUP, although for theinterconnection between the D-AMPS system operated by Pacific Link and HKTI’s network,R1 signalling is used, which does not support CLI transfer functionality. Currently HKTC isnot able to offer SCCP-transit functionality.
In January 1998, the Government came to an agreement with HKT for the early surrender ofHKTI’s exclusive license to provide international services. Service-based competition willbegin in January 1999, followed by liberalisation of infrastructure in January 2000.

Appendix C
128
The mobile marketplace is very volatile at the moment with Pacific Link having beenrecently acquired by CSL, and further market consolidation and shake-out is expected. Itwill be very difficult to predict the structure of the mobile market over the next ten years,which may have significant impact on the roll-out and cost of implementing anddeveloping MNP functionality.
C.3. Fixed number portability in Hong Kong
Fixed number portability was implemented in Hong Kong in July 1995. For the first 18months of operation - the time needed to develop the database solution includingagreement on the method for notifying all parties of ported numbers and installation andtesting of hardware - a call-forwarding solution was used, before migrating to the currentdistributed database implementation, The interim call-forward solution operation allowedprocedural and OSS changes to be made in conjunction with a relatively simple switchingsolution.
Figure C.2 and Figure C.3 illustrate the operation of the database look up in HKTC’snetwork for calls to subscribers porting into and out of the network respectively. Calls tonumbers that have been ported from HKTC’s local switches are re-routed via the ICG usinga gateway number retrieved from a database held locally on the switch. All other callspassing out of HKTC’s network, via the ICGs, cause a database look up to be performedusing IN technology. The solution is implemented in slightly varying ways in each of thealternative fixed network operators’ networks.
DN represent the actual Dialled Number string of the porting subscriber, and NNrepresents the Network Number, a 9-10-digit network address format designed for usewithin Hong Kong’s telecommunications networks.
Figure C.2:Fixed number portability by database solution: calls to subscriber porting
away from HKTC
annel\chap3pics.ppt
Originatingswitch
ICGAlternative
fixedoperatorNN
POIDN NN
On switchdatabasedip
DN NN

Appendix C
129
Figure C.3:Fixed number portability by database solution: i) calls to subscribers porting between
two other fixed operators ii) calls to subscribers porting into HKTC’s network
annel\chap3pics.ppt
Originatingswitch
ICGAlternative
fixedoperatorNN
POIDN NN
On switchdatabasedip
DN NN
Recipientswitch
DN NN
NN
À
Á
The databases of the four fixed network operators are kept updated by means of electronicmessages passed via a dedicated network system linking the operators’ operational supportsystems known as the Administration Database (AD) system, which has been developed asa proprietary system for Hong Kong. Porting customers are cut over at mid-night each day.The four databases are compared once a month to ensure that synchronisation has beenmaintained.
C.4. Network technologies
C.4.1. Introduction
This section describes the technologies used by the mobile operators of Hong Kong, andtheir implications for MNP solutions. For each technology, the history of the technology isgiven and any special features associated with technology are highlighted.
C.4.2. GSM
Global System for Mobile communications (GSM) is a standard for digital cellular telephonydeveloped in Europe by ETSI, as a second generation offering to supersede the plethora ofincompatible analogue networks in use throughout Europe. The standard was agreed in1989, and early systems rolled out in 1990.

Appendix C
130
The system has become extremely popular world-wide, dominating the European market,and having made significant inroads into North and South American, Asian andAustralasian markets. As a result of this popularity, the system has been highly developedto offer many supplementary services culminating in the latest trench of features includedin the phase 2+ features.
The air interface operates in the 800-900MHz band, and utilises a TDMA structure with200kHz channel widths.
Hardware for the system is manufactured by most major telecommunicationsmanufacturers, but the market in Hong Kong is dominated by Ericsson, Nokia and Nortel.
Currently the system offers only voice and circuit switched data bearers, though plans areunder development for the implementation of a packet relay service.
C.4.3. PCS
Personal Communications Services (PCS) is a derivative of the GSM standard operating the1800 and 1900MHz bands, in response to market demand for greater capacity in countriessupporting GSM networks. Such systems are being rapidly rolled out around the world.
Though having a shorter air interface range than the lower frequency GSM system, theswitching systems of the PCS networks are identical to those of GSM networks and willtherefore be considered synonymous for the remainder of the study.
C.4.4. IS-95 (CDMA)
IS-95 is a standard for a second generation digital cellular system, and is the first massmarket cellular system to utilise a Code Division Multiple Access (CDMA) air interface. Thesystem is built by a variety of manufacturers including Motorola and Siemens under licenseto its developers, Qualcomm, and is used in other applications such as wireless local loopproducts.
Several companies involved in the development of CDMA products and services haveformed the CDMA Development Group (CDG), which was officially announced in 1994and now has approximately 100 member companies including network equipmentmanufacturers, subscriber unit manufacturers, cellular and PCS operators and testequipment manufacturers. Motorola is the dominant IS-95 network equipmentmanufacturer. In 1996 CDG membership included 12 network equipment manufacturersand 27 cellular and PCS operators.
IS-95 is a direct competitor to GSM for the world-wide second generation market, and isenjoying success in the US and the Asia-Pacific regions, though its late arrival on the marketmeans that fewer features have been developed for it than have been for GSM and uptakehas been less rapid. Hutchison’s Hong-Kong system was the first to become operational

Appendix C
131
world-wide in 1995.
C.4.5. IS-136 (D-AMPS)
The Advanced Mobile Phone System (AMPS) is an analogue cellular mobile phone system,capable of operating in the 800 MHz band, which has been developed to include a digital airinterface, and is operated in the 800 MHz band in Hong Kong.
The system utilises Time Division Multiple Access (TDMA) and uses 20kHz channels andis now a mature system offering an upgrade route for those networks which alreadycontain IS-54 AMPS. D-AMPS is particularly strong in the range of business communicationservices.
D-AMPS is the only global wireless standard that today can support packet data andcircuit-switched voice traffic in the same network infrastructure, and offering voice and datasimultaneously.
The system is widely used in the USA. In particular use is made of the A, B and Cfrequency bands (low 800MHz, upper 800MHz and 1.9GHz respectively), and is a dual-band/dual-mode 800/1900 MHz standard offer full national and international roaming aswell as feature transparency.
D-AMPS is widely operated in more than 34 countries throughout the globe with 4 millionsubscribers at the end of 1996 in a variety of markets. D-AMPS is therefore a ‘near de-facto’standard like GSM, its major competitor.
C.4.6. TACS
Total Access Communications System (TACS) is a derivative of the US AMPS standard, themajor modifications being the adaptation of the system to the European channel spacing of25 kHz, and the provision of better support for national deployment, rather than themetropolitan deployment which is typical in the USA. TACS is an analogue cellular mobilephone system, operating in the 900 MHz band.
The TACS system was the first mass market cellular system in the UK, and the first serviceslaunched in 1985. As well as the two systems operated by Cellnet and Vodafone in the UK,the system is deployed in a limited number of areas in Europe (namely Ireland, Italy, Malta,Spain) and beyond (e.g. Gabon, Kuwait, Macau, Mauritius, Nigeria, Sri Lanka, Tanzania).With the exception of the networks in Italy and Spain, the numbers of subscribers in each ofthe countries is relatively low (i.e. 150,000 or less).
Only one TACS network remains in operation in Hong Kong, but with its imminentdecommissioning, the technology remains outside the scope of MNP, and therefore will notbe considered further.

Appendix D
132
APPENDIX D. SURVEY RESULTS
This appendix contains a summary of the survey conducted by SOFRES FSA for the studyinto MNP in Hong Kong. SOFRES FSA interviewed 450 personal subscribers, 450 small tomedium business users and 100 large corporate firms across Hong Kong between December1997 and February 1998. The questionnaires used in the survey are included in this Reportas Appendix G and Appendix H.
D.1. Results From Survey of Personal Subscribers and SMEs34
D.1.1. History of mobile users
Table D.1Average Length of Time That Subscribers Have Used a Mobile Phone
Personal Subscribers SMEs Total
Years 1.92 3.24 2.57
Table D.2Network Used by Respondents (per cent)
Personal Subscribers SMEs Total
GSM and CDMA 79 87 82 TDMA1 12 9 10 PCS 9 5 8
1 A very small proportion of these subscribers will also be subscribing to Pacific Link’s PCSnetwork.
Table D.3Percentage of Subscribers who have (or have ever) subscribed to more than one operator
PersonalSubscribers
SMEs Total
Subscribers who have subscribed to multiple operators 11 13 12
34 The total column in Section D.1 records the result of all personal subscribers and SMEs interviewed.

Appendix D
133
Table D.4Reasons for Subscribing to Multiple Networks (per cent)
Personal Subscribers SMEs Total
Geographic Coverage 46 41 43 Services 26 33 30 To have same network as customers 18 16 17
To separate personal and business use 8 7 7
Other 4 7 5
Table D.5Satisfaction With Current Operators
Personal Subscribers SMEs Total
Very dissatisfied 1 0 1 Dissatisfied 10 10 10 Satisfied 83 86 84 Very satisfied 6 4 5
Table D.6Number of Regular Callers to and from Mobile Users
Personal Subscribers SMEs Total
Number of regular callers to mobile subscribers 6 11 8 Number of regular callers from mobilesubscribers
8 14 11
Table D.7Percentage of Mobile Subscribers Using Pagers
Personal Subscribers SMEs Total
Subscribers that also use pagers 24 43 33

Appendix D
134
Table D.8Reasons Why Mobile Subscribers Use Pagers (per cent)
Personal Subscribers SMEs Total
To receive incoming calls 32 40 37 To screen calls 21 21 21 To provide contact point 44 60 54 Because it is cheaper 12 6 8
Provided by the company 4 1 2
Others 6 4 4
Table D.9Use of Advanced Telecommunications Services by Subscribers (per cent using service)
Personal Subscribers SMEs Total
Call forwarding 56 79 67 Short message service 16 21 18 Voice mail 16 25 20

Appendix D
135
D.1.2. Expenditure and billing
Table D.10Average Phone Bills (HK$)
Personal Subscribers SMEs Total
Average monthly bill 470 892 677
Table D.11Average Expenditure on Handset (HK$)
Personal Subscribers SMEs Total
Average 3141 3853 3485
Table D.12Responsibility for Paying Mobile Bills
Personal Subscribers SMEs Total
Subscriber pays own bill 93 37 66 Company pays bills 3 68 35 Family pays bill 4 0 2
D.1.3. Attitude to switching
Table D.13Attitude to Switching (per cent)
Personal Subscribers SMEs Total
Subscribers that would consider switching 43 37 40 Subscribers that would not consider switching 40 47 43 Don’t know 18 16 17

Appendix D
136
Table D.14Perceived Benefits of Switching Operators (per cent)
Personal Subscribers SMEs Total
Lower prices 71 69 70 Better coverage 55 53 54
Better services 19 17 18 Better tariffs 15 11 13 Don’t know 9 13 11
New handset 8 5 7
Roaming - international coverage 5 8 6
Table D.15Perceived Pitfalls Associated with Switching
Personal Subscribers SMEs Total
Number change 59 64 62 Don’t know 20 21 20
Poor coverage 13 12 12 Cost of handset change 11 5 8 Cost of terminating contracts 6 4 5 Higher prices 8 3 6
Loss of services 7 2 5
None 4 4 4
1. Subscribers were asked to nominate more than one problem so total will not sum to 100.
Table D.16Attitude to Switching With MNP (percentage of subscribers)
Personal Subscribers SMEs Total
Considerably more likely 24 28 26 Slightly more likely 49 44 46 It would make no difference 23 23 23

Appendix D
137
Table D.17Importance of Decision Variables Associated with Switching for SMEs
Constraint Relative Importance (percentage of subscribers)
Stronginfluence
Slightinfluence
Noinfluence
Don’t know
Handset subsidy 13 39 48 1 Ability to choose own number 13 43 43 0 A 3 second calling delay 9 30 60 1 Availability of short messaging service 8 23 67 6 Ability to retain existing number 55 30 14 0
Table D.18Switching Costs Associated with Changing Mobile Numbers
PersonalSubscribers
SMEs
Subscribers that changed their mobile number whenchanging operators (per cent)
91 90
Costs of informing people Per cent of subscribers that incurred a cost to
inform friends 98.5 96
Average number of people informed bysubscribers of a change in their mobile number
33 44
Average cost involved in informing friends (HK$) 114 143 Costs of changing stationery etc. Per cent of subscribers that incurred a cost to
change their stationery na 46
Average cost of changing stationery etc. (HK$) na 523 ‘Other costs’ incurred in changing numbers
Per cent of subscribers that incurred ‘other costs’ 10 7
Average size of the other costs (HK$) 472 628

Appendix D
138
Table D.19Action Required When Mobile Subscribers Inform Respondents of a Number Change
PersonalSubscribers
SMEs Total
Percentage of respondents who had to change entries in addressbooks etc. following a number change by a mobile subscriber
75 79 77
Length of time taken to change the entry in address books etc. (%)
- up to 1 minute 46 42 44
- 1-2 minutes 33 31 32
- 2 -5 minutes 11 14 13
- more than 5 minutes 9 11 9
- Don’t know 1 2 2
Table D.20Action Required When Subscribers Do Not Inform Respondents of a Number Change
PersonalSubscribers
SMEs Total
Percentage of respondents that were not informed of anumber change by a friend or business contact
43 59 51
Length of time taken to locate the new number - Up to 15 minutes (%) 47 64 56 - 15 to 30 minutes (%) 12 10 11 - More than 30 minutes (%) 33 19 25 - Don’t know (%) 8 7 8 Number of enquiries made to locate new number
1-5 enquiries (%) 92 93 93
more than 5 (%) 2 3 2
Don’t know (%) 6 4 5
Table D.21Methods Used by Callers To Find a Subscribers New Mobile Number (per cent of
subscribers)
Personal Subscribers SMEs Total
Call their fixed number 48 74 63 Call a friend 45 33 38 Call their pager 12 19 16 Did not find it 10 5 7 Other 4 2 4
1. Subscribers were asked to nominate more than one method so total will not sum to 100.

Appendix D
139
Table D.22Discounts required to Switch Operators With and Without MNP
PersonalSubscribers
SMEs Total
Monthly discount required to move without MNP($HK)
221.25 332.54 270.98
Monthly discount required to move with MNP ($HK) 206.11 359.37 273.84
Table D.23Importance of Decision Variables Associated with Switching for Personal Subscribers
Constraint Relative Importance (percentage of subscribers)
Stronginfluence
Slightinfluence
Noinfluence
Don’t know
Handset subsidy 12 45 41 2 Ability to choose own number 13 48 47 1 A 3 second calling delay 7 28 63 2 Availability of short messaging service 7 29 63 1 Ability to retain existing number 45 38 19 0
D.2. Results From Survey of Corporate Users
D.2.1. General information
Table D.24Use of Mobile Networks by Large Companies
Percent oflarge firms
that usenetwork
Averagelength of time
large firmshave used the
network(years)
Averagenumber of
mobilephones usingthe network
Averagemonthly
revenue onnetwork ($)
Averagemonthly
revenue perphone
CSL (1010) 86 3.84 22 13241 602 Hutchison 63 3.29 19 9355 492 SmarTone 45 2.84 14 7385 528 Pacific Link 31 3.18 9 6064 674 One 2 Free 17 1.27 8 3694 462 Sunday 5 0.88 6 1273 212 New World 5 0.88 3 860 287 People’s Phone 4 1.25 7 1612 230 P Plus 3 0.75 2 633 317 Everyday 2 0.75 6 1950 325

Appendix D
140
Table D.25Mobile Calls Made and Received by Large Firms
Average number of calls
Average number of calls made per mobile each day 12.87 Average number of calls received per mobile each day 11.76
D.2.2. Attitudes to switching operators
Table D.26General Attitudes to Switching
Percentage of large firms
Time in which contacts are reviewed Under 6 months 12 6 months - 1 year 31 Over 1 year 12 Don’t know 45
Percent of large firms who have considered switching operators 13
Table D.27Perceived Benefits of Switching
Percentage of large firms
Lower prices 73 Better quality 24 Better services 25 Better coverage 55 Better customer service 12 International roaming 14 Don’t know 18
1. Subscribers were asked to nominate more than one problem so total will not sum to 100.

Appendix D
141
Table D.28Constraints or Pitfalls Associated with Switching
Percentage of large firms
Number change 84 Cost of handset replacement 8 Cost of terminating contracts 3 Loss of services 7 Loss of coverage 26 Loss of international roaming 3 Higher prices 15
Lower customer service 3
Disruption to company 11
Don’t know 11
1. Subscribers were asked to nominate more than one problem so total will not sum to 100.
Table D.29Discounts required to Switch Operators With and Without MNP
Large firms
(per cent of monthly bill)
Monthly discount required to move without MNP 26.75 Monthly discount required to move with MNP 25.96
Table D.30Use of Advanced Telecommunications Services by Large Firms
Service Percentage of firms that use theservice
Percentage of phones in thosefirms that use the service that
have that facility
Short messaging service 53 30 Voice messaging service 76 33 Call forwarding 92 38 Mobile fax facility 8 5 Data transmission facility 7 5
Table D.31Where Large Firms Publicise their Mobile Phone Numbers
Percent of large firms
On business cards 38 In internal telephone directories 62 In external telephone directories 1 On letterheads and faxes 5 On vehicle livery 6

Appendix D
142
Table D.32Switching Costs Incurred by Large Firms when Switching Operators
Average switching costs incurred
Amount spent on changing stationery items such as businesscards etc. when changing operators (and mobile number)
454
1. The weighted average is $254.
Table D.33Likelihood of Switching With MNP
Likelihood of switching (per cent)
Considerably more likely 7 Slightly more likely 57 It would make no difference 37

Appendix E
143
APPENDIX E. CALCULATING THE COSTS OF MNP
E.1. Introduction
This section briefly describes:
- the structure of the models;
- the purpose of each row within the models;
- the origin of data input into the models.
Each model simulates a ten-year period, the first three years being divided into six-monthbins to provide greater resolution during the roll-out phase; these time periods arerepresented by individual columns.
The flow of information through the model is illustrated in Figure E.1 in the form of ahierarchical tree i.e. data flows from the bottom of the tree upwards; information from thesheet Global is accessed by most other sheets.
Figure E.1: Data flow through model.
annel\chap3pics.ppt
Totalcosts
Set-upcosts
Per-linecosts
Ongoingcosts
Customercosts
Ports Calls
NPV @ 1998
Realcost
t

Appendix E
144
This Appendix describes the elements of each of the sheets in the models which are:
• Global: input parameters used by most other sheets.
• Ports: determines the number of subscribers that port with time.
• Calls: calculates the number of calls and airtime for calls to ported numbers.
• Set-up costs: calculates the one-off set-up and other costs.
• Per-line costs: calculates the costs associated with subscribers porting.
• Customer costs: calculates the costs to subscribers.
• Total costs: calculates the total costs for implementing MNP.
Section E.10 provides a summary of the parameters and data entered into the model, andwhere this data is referred to in the final report.
E.2. Global
In sections E.1 to E.9, a description of each row is given. Rows containing calculation aredenoted with a (C); rows containing input data are denoted with an (I), all of which aresummarised in table E.1 in section E.10.
Input parameters used by most other sheets
Discount rate (I): see summary table in section E.10.
Tromboning efficiency achieved (I): see summary table in section E.10. (Note: not linked inall models)
Additional signaling associated with call forward (I): see summary table in section E.10.
Additional signaling associated with database look up (s) (I): see summary table in sectionE.10.
Average salary (I): see summary table in section E.10.
Average call length (s) (I): see summary table in section E.10.
Interconnect network cost (I): see summary table in section E.10.
Type B porting cost (I): see summary table in section E.10. (Note: not linked in all models)
E1 annual rental (I): see summary table in section E.10.

Appendix E
145
E.3. Calls
Calculates the number of calls and airtime for calls to ported numbers
Airtime Millions minutes (I): Predictions of airtime usage with time, extrapolated fromcurrent patterns.
Calls to mobile telephones (C): Individual calls to all mobile telephones calculated.
Total number of mobile telephones (I): Predictions of mobile telephone ownership with timeextrapolated from current patterns.
Calls to ported numbers (C): calculated for purpose of calculating additional conveyancecosts associated with call forwarding solution.
Average ported calls in progress (C): calculated enabling predictions of additional capacityrequirements to be made, leading to predictions of E1 lines.
Additional lines for call forward solution (C): to accommodate the predicted additionalcapacity demanded by the call forwarding solution.
Additional E1 lines (C): for call forward solution: for above.
E.4. Ports
Determines the number of subscribers that port with time
Type A (I): customers that port in period pasted from main benefit model.
Type B (I): customers that port in period pasted from main benefit model.
Net ported (C): Sum of above, making the pessimistic assumption that all portingsubscribers are doing so for the first time.
Choice: Box allowing a choice of:
• high or low churn assumption;
• high or low type A customer assumption.
E.5. Set-up costs
Solution development (I): see summary table in section E.10
Switch upgrades (I): see summary table in section E.10

Appendix E
146
OSS development (I): see summary table in section E.10
Procedural changes (I): see summary table in section E.10
FNP solution upgrade (I): investment in IN equipment, in instalments, that is assumed toreduce in cost with time according to the Hardware Reduction Factor.
AD system & porting automation (I): see summary table in section E.10
SMS changes & signal relay upgrade (I): see summary table in section E.10 assumed toreduce in cost with time according to the Hardware Reduction Factor.
Migration costs (I): see summary table in section E.10
Hardware cost reduction factor (C): see summary table in section E.10
Total: sum of all of the above factors.
E.6. Per-line costs
Switch and OSS admin (C): cost associated with the porting of each customer.
HLR licenses (C): during the call forward solution only.
Total (C): sum of the above.
E.7. On-going costs
Interconnection (C): additional interconnection associated with the extra usage ofinterconnection links to HKTC’s network during the call forwarding solution phase.
GMSC capacity (C): additional GMSC capacity associated with the extra usage of capacityin the operators’ network during the call forwarding solution phase.
IN operation & maintenance (C): during the off-switch solution phase.
MNP procedures (C): for all solutions.
Signalling (C): extra signalling associated with the call forwarding solution.
Hardware cost reduction factor (C): rolling factor determining the likely cost of equivalenthardware referenced to 1998.
Total (C): sum of above.

Appendix E
147
E.8. Customer cost
Calculates the costs to subscribers
Dialling delays (C): cost of extra delay in dialling for customer.
E.9. Total costs
Calculates the total costs for implementing MNP
Total (C): Components from:
• Set-up costs;
• Per-line costs;
• On-going costs;
• Customer costs.
are summed to give the actual cost of operation for each year.
Cumulative (C): on-going for ten years.
Discount factor (C): rolling factor determining the effective cost of the solution referenced to1998.
Discounted in year values (C): effective cost of the solution referenced to 1998.
Cumulative discounted (C): on-going for ten years.
NPV (C): total cost of the solution referred to 1998 costs.
In some of the model sheets graphs are included that are updated when the model datachanges. However, some graphs are plotted from data that has been pasted for differentsets of parameters (e.g. high and low churn rates) which does not dynamically update withthe model. The data associated with these graphs is annotated accordingly.

Appendix E
148
E.10. Data summary
Table E.1 summarises the value of all data entered into the model, and identifies its locationin the final report.
Table E.1: Summary of data in cost model
Data Value Place in model Place in report
Average salary 120 000 Global 4.2.1
Discount rate 6% Global 4.2.2.5
Additional signallingassociated with callforward
0.2 seconds Global 4.2.2.3.3
Additional signallingassociated with databaselook up
0.2 seconds Global 4.2.2.3.3
Type-B porting cost $75 Global 4.2.2.2.1
Hardware reduction annualfactor
5% Set-up & on-going 4.2.1
Hardware Reduction Factor(HRF)
(1-5%)^year Set-up & On-going 4.2.1
Validation work $375 000 Set-up 4.2.2.1.1
Solution development costs $2.6million Set-up 4.2.2.1.1
Software upgrades - Set-up 4.2.2.1.2
OSS development &implementation
$21million plus$1.5million
Set-up 4.2.2.1.3
AD system $12million plus$675 000
Set-up 4.2.2.1.4
Procedural changes $40.5million Set-up 4.2.2.1.5
Off-switch upgrades Stages:$75million*CHRF$25million*CHRF$25million*CHRF$25million*CHRF
plus $1million
Set-up (FNP solutionupgrades)
4.2.2.1.6
SMS changes $0.5million plus$20million
Set-up 4.2.2.1.7
Data transfer $1million Set-up 4.2.2.1.8

Appendix E
149
Data Value Place in model Place in report
Migration costs $24million Set-up 4.2.2.1.9
Switch & OSSadministration
$150 per port forcall forward
$75 per port for off-switch type B
$10 per port for off-switch type A
Per-line 4.2.2.2.1
HLR licenses $100 per entry Per-line 4.2.2.2.2
Additional interconnectioncharges
6.7c per minute foreach call leg
On-going:interconnection
4.2.2.3.1
Tromboning efficiency 100% Global 4.2.2.3.1
Additional GMSC resourcecosts
$80/year/line On-going: GMSCcapacity
4.2.2.3.2
Extra signalling costs 10E1 lines$1,140,000/year
On-going: SCP-SSPlinks
4.2.2.3.3
Extra signalling costs 0.3s per call of costto interconnect to
HKTC
On-going: Signalling 4.2.2.3.3
IN operation &maintenance
5% + 3% of capitalcost
On-going: 4.2.2.3.4
MNP associatedprocedures
$100 000 peroperator plus
$200 000 for HKT
On-going 4.2.2.3.5
Dialling delay 0.3s during callforwarding 0.2s
during off-switch
Customer 4.2.2.4.1
E1 annual rental 2 x $57 000 Global To go into 4.2.2.3.3
Average call length 38s Global 4.2.1
Interconnect cost 6.7c/minute Global 4.2.2.3.1
Total number of mobiletelephones
2.876million in firsthalf of 1999
profile derived fromNERA figures
thereafter
Calls 5.2.1
Airtime 2715million minutesin first six months1999 and assume
same ratio ofairtime/number ofmobiles thereafter
Calls 4.2.1
Type A ports (customers) From benefit model Ports 5.2.1
Type B ports (customers) From benefit model Ports 5.2.1

Appendix F
150
APPENDIX F. CALCULATING THE BENEFITS OF MNP
The purpose of this Appendix is to clarify the methodology used by NERA to calculate thebenefits of MNP in Hong Kong. It outlines the major assumptions made for each of thecategories of benefits and documents where in the Preliminary Report the information canbe found. A numerical example35 for one year is also provided for illustrative purposes.
It should be noted that the numerical examples are only provided for illustrative purposesand use rounded numbers from the model. As a result, there may not be a perfect fitbetween the example and the results of the model.
F.1. Type 1A benefits
F.1.1. Assumptions
Type 1A benefits are affected by the following variables:
• Penetration rates : which are found in Appendix A.
• Churn rates: derived for each system using the formula in Appendix A. The resultsof the base case churn rates are shown in Table A.5 of Appendix A.
• Porting rates: these are shown in Table 5.1 in Chapter 5. The annual number ofpeople porting their number when churning is shown in Table B.4 in Appendix B.
• Switching costs: the switching costs for each customer segment are:
- $160 for personal subscribers (from Table D.18 of the survey results);
- $422 for SMEs (from Table D.18 of the survey results); and
- $454 for large companies (from Table D.32 of the survey results)
The weighted average of the switching costs is $254 which reflects the share of eachcustomer segment to the market as a whole.
35 The optimistic scenario is chosen with a high rate of additional churn and a high porting rate.

Appendix F
151
F.2. Numerical example of Type 1A benefits
Table F.1 Type 1A benefits in the year 2000
Variable Assumption Result
Penetration rate 48% 3.27m subscribers Churn rate1 26% 0.850 m subscribers Porting rate (high porting rate assumption) 50% 0.425 m subscribers Total number of Type 1A subscribers (a) na 0.425 m subscribers Average switching cost (b) weighted
average $254/subscriber
Total Type 1A benefits (a*b) na $108 million
1. We have also estimated churn rates for movement between systems. In 2000, for example, the churnrate from PMRS to PCS networks will be higher at 34 per cent.
F.3. Type 1B benefits
F.4. Assumptions
Type 1B benefits are affected by the following variables:
• Penetration rates : which are found in Appendix A.
• Additional churn rates: which we have assumed to be 5-15 percentage points higherthan the base case churn rate.
The number of Type 1B subscribers is shown in Table B.4 of Appendix B. It should benoted that we assume that only personal subscribers switch because of MNP (as unlikepersonal subscribers, SMEs and larger companies are, according to the survey results, priceinsensitive.
The discount required for personal subscribers to switch with MNP (44 per cent) is derivedfrom Table D.19 of the survey results. This difference in the discount with and withoutMNP (3 per cent) is halved to show the average difference in the discount required toswitch with MNP, and then applied to the number of Type 1B subscribers to obtain theType 1B benefits.

Appendix F
152
F.5. Numerical example of Type 1B benefits
Table F.2 Type 1B benefits in the year 2000
Variable Assumption Result
Penetration rate 48% 3.27m subscribers Additional churn rate (high assumption) 15% 0.452 m subscribers Number of personal subscribers who churn na 0.292 m subscribers Total number of Type 1B subscribers (a) na 0.292 m subscribers Average monthly revenue per subscriber(b) na Approx $440/month1
Average discount required (d) 1.5% na Total Type 1A benefits (a* d * b *12 months) na $23 million
1. The monthly revenue per subscriber varies by system. This is the estimate for 2000.
F.6. Type 2 benefits
The Type 2 benefits were estimated using the results of a Nickell's study entitledCompetition and Corporate Performance. This study was published in 1996 in theJournal of Political Economy, volume 104, number 4. A copy of this article has beengiven to OFTA.
F.7. Type 3 benefits
F.7.1. Assumptions
The methodology used to calculate Type 3 benefits is illustrated in Figure 5.4 in Chapter 5of the Preliminary Report. In summary, Type 3 benefits are affected by the followingvariables:
• The average number of regular callers to each mobile subscriber: this estimate (8)comes from Table D.6 of the user survey.
• The average time taken to change records once informed of a number change isestimated from Table D.19 of the survey results.
• The number of enquiries made (and time taken) to locate the number if notinformed is estimated from Table D.20 of the survey results.
• The percentage of people who are informed of a number change is anassumption we have made but is informed by Table D.20 of the survey results.

Appendix F
153
• The percentage of calls that incur mobile air time is also an assumption but isinformed by Table D.21 of the survey results.
• The value of time: which is estimated to be HK$23 per hour (leisure time).
F.8. Numerical example of Type 3 benefits
Table F.3 Type 3 benefits in the year 2000
Variable Assumption Result
Penetration rate 48% 3.27m subscribers Total number of portingsubscribers
0.425 m type 1A customers1
0.292m Type 1B customers2
0.717 m subscribers
Leisure value of time $0.38/min na Callers seeking new numbers 8 per subscriber 5.74 million Time value benefits (for thosethat are informed)
1.5 minutes for 80 per cent of allregular callers to subscribers
$2.6 million
Time value benefits (for thosethat are not informed)
5 enquiries at 1 min each for 20per cent of all regular callers to
subscribers
$2.18 million
Call cost Mobile air time incurred in
looking for new number by 10%of those not informed
$0.57 million
Total benefits n.a $5.4 million
1. This figure comes from the porting rate of 20% of the 26% of subscribers that churn in thebase case. That is, 50% of 3.27 = 0.850 million by porting rate of 50% to give 0.425 millionType1A subscribers in 2000.
2. The additional churn rate of 15 percent in 2000 gives around 0.452 million type 1Bcustomers. However, as discussed earlier, we only consider personal subscribers who moveas a result of MNP as Type 1B customers giving the total number of 1B customers in 2000 as0.292 million. All Type 1B customers, by definition, port their numbers (they would nothave switched otherwise).

Appendix G
154
APPENDIX G. SURVEY OF QUESTIONNAIRE FOR PERSONALSUBSCRIBERS AND SMES
MOBILE PHONE USER STUDY
Respondent's name: ______________________ Contact Tel No. _____________
Address:__________________________________________________________
_
Interviewer's name: ______________________ Interviewer's No. _____________
Date of interview: ______________________ Time of interview: _____________
________________________________________________________________________________
PROGRAMMER PLEASE NOTE: FOR ALL MONETARY QUESTIONS ALLOW FOR 4DIGITS, ALL % QUESTIONS 3 DIGITS.
Introduction - Private Sample Good morning/afternoon/evening. My name is ….. from SOFRES FSA. May I speak to ….We are conducting a study amongst mobile phone users in Hong Kong. INTERVIEWER:IF RESPONDENT CANNOT CONTINUE IMMEDIATELY, MAKE APPOINTMENT TOCALL BACK.
Introduction - Business sample Good morning/afternoon/evening. My name is ….. from SOFRES FSA. May I speak to amobile phone user in your company. INTRODUCTION Business sample -with respondent Good morning/afternoon/evening. My name is ….. from SOFRES FSA. We areconducting a study amongst mobile phone users in Hong Kong. Screening Questionnaire ASK ALL QA Do you currently own or use a mobile phone? Yes 1 CONTINUE No 2 CLOSE (REFERRAL)

Appendix G
155
ASK ALL QB What proportion of your mobile calls do you make for… Business purposes ______% (IF OVER 50%, ASK QB1) Private purposes ______% LOGIC CHECK - MUST ADD TO: 100% IF 50% OR MORE BUSINESS USE ASK QB1 How many people are employed by your company? Less than 20 1) 20-49 2) CONTINUE 50-99 3) 100 or above 4) TERMINATE IF 50% OR MORE BUSINESS USE ASK QC May I just check whether you were involved in the choice of your mobile phone. Yes 1 CONTINUE No 2 CLOSE (REFERRAL) INTRODUCTION TO MAIN INTERVIEW The aim of this survey is to understand people's attitudes to mobile phones. We wouldtherefore be very grateful for your time to answer some questions.
IF ASKED: The questions will take about 15 minutes of your time.
CHECK IF OK TO PROCEED. IF NOT MAKE APPOINTMENT
ASK ALL Q1A Which (network) operator do your currently use? READ OUT CODES 1-10 CSL 1 Hutchison 2 One 2 Free 3 Pacific Link 4 People's Phone 5 Sunday 6 SmarTone 7 P Plus 8 New World PCS 9 Hutchison (Everyday) 10 OTHERS (PLEASE SPECIFY) ___________________ None 98) TERMINATE DK 99)
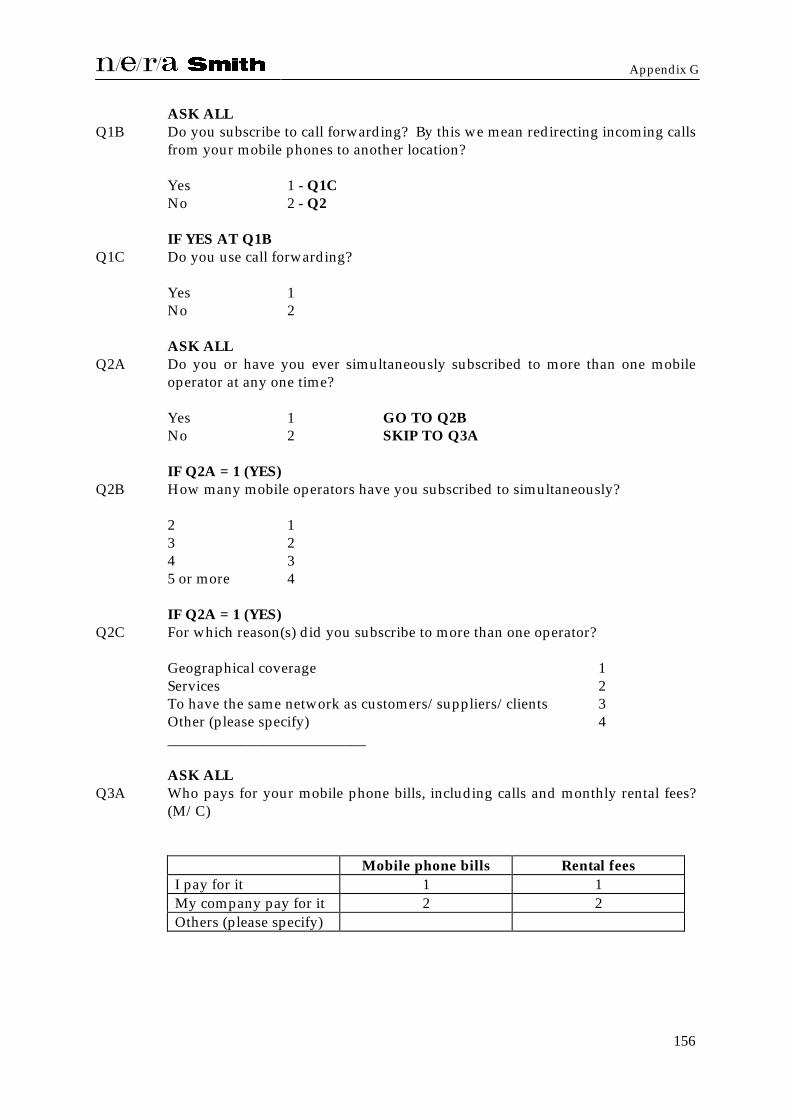
Appendix G
156
ASK ALL Q1B Do you subscribe to call forwarding? By this we mean redirecting incoming calls
from your mobile phones to another location? Yes 1 - Q1C No 2 - Q2 IF YES AT Q1B Q1C Do you use call forwarding? Yes 1 No 2 ASK ALL Q2A Do you or have you ever simultaneously subscribed to more than one mobile
operator at any one time? Yes 1 GO TO Q2B No 2 SKIP TO Q3A IF Q2A = 1 (YES) Q2B How many mobile operators have you subscribed to simultaneously? 2 1 3 2 4 3 5 or more 4 IF Q2A = 1 (YES) Q2C For which reason(s) did you subscribe to more than one operator? Geographical coverage 1 Services 2 To have the same network as customers/suppliers/clients 3 Other (please specify) 4 ___________________________ ASK ALL Q3A Who pays for your mobile phone bills, including calls and monthly rental fees?
(M/C)
Mobile phone bills Rental fees I pay for it 1 1 My company pay for it 2 2 Others (please specify)

Appendix G
157
ASK ALL Q3B Excluding the rental, approximately, how much is your monthly mobile phone
bill for calls? (It refers to total cost, no matter who pays for the phone bill). Q3C How about the monthly rental fees? HK$ ______________________ (for Calls) HK$ ______________________ (for Rental fees) ASK ALL Q3D Approximately, how much did you pay for the handset? IF DK, ENCOURAGE BEST ESTIMATE. IF NECESSARY USE CODE
BANDS TO PROMPT Free of charge (the package covered) 1 Below HK$1,000 2 HK$1,000-1,999 3 HK$2,000-2,999 4 HK$3,000-3,999 5 HK$4,000-4,999 6 HK$5,000-5,999 7 HK$6,000-6,999 8 HK$7,000 or above 9 ASK ALL Q4 Approximately how many people do you call regularly on your mobile? IF DK, ENCOURAGE BEST ESTIMATE. IF NECESSARY USE CODE
BANDS TO PROMPT 1-2 1 3-5 2 6-10 3 11-15 4 16-20 5 21-30 6 31-40 7 41-50 8 More than 50 9 None 98

Appendix G
158
ASK ALL Q5 Approximately, how many calls do you make in an average day? IF DK, ENCOURAGE BEST ESTIMATE. IF NECESSARY USE CODE
BANDS TO PROMPT 1-2 1 3-5 2 6-10 3 11-15 4 16-20 5 More than 20 6 None 98 DK/It varies 99 ASK ALL Q6 Approximately, how many calls do you receive in a day? IF DK, ENCOURAGE BEST ESTIMATE. IF NECESSARY USE CODE
BANDS TO PROMPT 1-2 1 3-5 2 6-10 3 11-15 4 16-20 5 More than 20 6 None 98 DK/It varies 99 ASK ALL Q7. Approximately, how many people call you regularly on your mobile? IF DK, ENCOURAGE BEST ESTIMATE. IF NECESSARY USE CODE
BANDS TO PROMPT 1-2 1 3-5 2 6-10 3 11-15 4 16-20 5 More than 50 6 None 98 DK 99 ASK ALL Q7a Do you use a pager as well as a mobile phone? Yes 1 CONTINUE No 2 GO TO Q7C

Appendix G
159
Q7b IF YES AT Q7a For which specific reasons do you use a pager as well as a mobile phone? (M/C) To receive incoming calls 1 To screen calls 2 To provide contact point 3 Because it is cheaper 4 OTHER (PLEASE SPECIFY) __________________________ IF QB Business Purposes is 1% or more, ASK Q7c. IF 0% for Business
Purposes, GO TO Q7d Q7c Which number do you normally give to your business contacts? ASK ALL Q7d And which number do you normally give to your friends? READ OUT CODES 1-3. MULTI-CODE POSSIBLE Q7c Q7d Fixed telephone number 1 1 Mobile number 2 2 Pager number 3 3 It depends/varies (SPECIFY) _________________________________ HISTORY ASK ALL Q8 How long have you been using a mobile phone? Under 6 months 1 6+months - 1 year 2 1+-2 years 3 2+-3 years 4 3+-4 years 5 4+-5 years 6 More than 5 years 7 DK 99 ASK ALL Q9 And, more specifically, how long have you been with (Q1 OPERATOR)? Under 6 months 1 6+months - 1 year 2 1+-2 years 3 2+-3 years 4 3+-4 years 5 4+-5 years 6 More than 5 years 7 DK 99

Appendix G
160
ASK ALL Q10 Apart from (Q1 OPERATOR), which other networks have you used in the past,
if any? IF 3+, TAKE 3 MOST RECENT CODE UP TO 3 OPERATORS SEPARATELY
Q10A 1st
MENTIONED (S/C)
Q10B 2nd
MENTIONED (S/C)
Q10C 3rd
MENTIONED (S/C)
CSL 1 1 1 Hutchison 2 2 2 One 2 Free 3 3 3 Pacific Link 4 4 4 People's Phone 5 5 5 Sunday 6 6 6 SmarTone 7 7 7 P Plus 8 8 8 New World PCS 9 9 9 Hutchison (Everyday) 10 10 10 Others (Please specify) None/No others 98 98 98 DK 99 99 99
IF NOT 'DK' OR 'NONE', FOR EACH SELECTED AT Q10 ASK Q11 And how long did you use the OPERATOR/NETWORK (mentioned in Q10)?
(VERTICAL SINGLE ANSWER)
Q11A Operator
Q11B Operator
Q11C Operator
Under 6 months 1 1 1 6+ months - 1year 2 2 2 1+-2years 3 3 3 2+-3years 4 4 4 3+-4 years 5 5 5 4+-5 years 6 6 6 More than 5 years 7 7 7 DK 99 99 99
ASK ALL Q12 How satisfied are you with your current Network Operator? Would you say
you are …. S/C Very satisfied 4 Satisfied 3 Dissatisfied 2 Very dissatisfied 1

Appendix G
161
ATTITUDES TO SWITCHING OPERATORS ASK ALL Q13 Would you consider switching to another Operator/Network in the future? Yes 1 - GO TO Q14 No 2) SKIP TO Q15 DK 3) ASK IF 'YES AT Q13 Q14 Which Operator/Network would consider? M/C READ OUT CSL 1 Hutchison 2 One 2 Free 3 Pacific Link 4 People's Phone 5 Sunday 6 SmarTone 7 P Plus 8 New World PCS 9 Hutchison (Everyday) 10 OTHERS (PLEASE SPECIFY) __________________________________ None 98 DK 99 ASK ALL Q15 What do you think could be gained from switching to another operator? (M/C) Lower prices 1 Better services 2 Better tariffs 3 Better coverage 4 New handset 5 Roaming - international coverage 6 OTHER (PLEASE SPECIFY) _______________________ DK 99

Appendix G
162
ASK ALL Q16 What problems/pitfalls could be experienced by switching? (M/C) Number change 1 Cost of handset change 2 Cost of terminating contracts 3 Loss of services 4 Poor coverage 5 Higher prices 6 OTHER (PLEASE SPECIFY) _______________________ DK 99 ASK ALL Q17 Assuming comparable quality, coverage and services, what reduction in your
monthly bill would be necessary to persuade you to switch to another operator? HK$100 or below 1 HK$101-299 2 HK$300-599 3 HK$600-999 4 HK$1,000-1,999 5 HK$2,000-2,999 6 HK$3,000-3,999 7 HK$4,000 or above 8 Not a cost issue - depends on services offered 9 Not a cost issue - depends on geographical coverage 10 Other answer (WRITE IN) _____________________________________ Q18 & Q19 DELETED ASK ALL Q20 Do you currently Short messaging services, by which I mean do you send or
receive short notes or messages over the mobile phone where the messages aredisplayed on the mobile phone itself?
Yes 1 - CONTINUE No 2 - GO TO Q21

Appendix G
163
IF 'YES' AT Q20 Q20a If this service was not available with the other operator, what reduction in your
monthly bill would be necessary to persuade you to switch? HK$100 or below 1 HK$101-299 2 HK$300-599 3 HK$600-999 4 HK$1,000-1,999 5 HK$2,000-2,999 6 HK$3,000-3,999 7 HK$4,000 or above 8 Wouldn't switch at all if no messaging services 9 DK 99 ASK ALL Q21 Do you currently use Voice messaging services, by which I mean a caller to your
mobile phone can leave a message in your voice mailbox and you can accessyour voice mail box from different locations?
YES 1 - CONTINUE No 2 - GO TO Q23 IF 'YES' AT Q21 Q22 If this service was not available with the other operator, what reduction in your
monthly bill would be necessary to persuade you to switch? HK$100 or below 1 HK$101-299 2 HK$300-599 3 HK$600-999 4 HK$1,000-1,999 5 HK$2,000-2,999 6 HK$3,000-3,999 7 HK$4,000 or above 8 Wouldn't switch at all if no messaging services 9 DK 99 IF Q10A = 98 OR 99 GO Q30 IF ANY PREVIOUS OPERATOR USED AT Q10 (Q10A NOT NONE OR DK)
ASK Q23 When you last switched Operator or Network, did you have to change your
mobile phone number? Yes 1 - IF BUSINESS USER, GO TO Q24, OTHERS GO TO 26 No 2 - SKIP TO Q30

Appendix G
164
IF A BUSINESS USER (50% OR MORE BUSINESS USE ATQB) AND ALSO'YES' AT Q23
Q24 As a result, did you have to change any stationery, by which I mean businesscards, letterheads, fax forms, invoices and so on?
Yes 1 - GO TO Q25 No 2 - SKIP TO Q26 IF YES AT Q24 Q25 How much did you spend on changing the stationery? IF DK, ENCOURAGE BEST ESTIMATE. IF NECESSARY, USE CODE
BANDS TO PROMPT. HK$100 or below 1 HK$101-299 2 HK$300-599 3 HK$600-999 4 HK$1,000-1,999 5 HK$2,000-2,999 6 HK$3,000-3,999 7 HK$4,000 or above 8 DK 99 ASK 'YES' AT Q23 Q26 How many people did you have to inform of your new number? IF DK, ENCOURAGE BEST ESTIMATE. IF NECESSARY, USE CODE
BANDS TO PROMPT. None 1 Up to 5 2 6-10 3 11-20 4 21-30 5 31-40 6 41-50 7 51-100 8 101-200 9 201-300 10 301-400 11 401-500 12 More than 500 13 DK 99

Appendix G
165
IF Q26 = 2 - 13 (ANY) Q27 How much did you spend informing the people you know? IF DK, ENCOURAGE BEST ESTIMATE. IF NECESSARY, USE CODE
BANDS TO PROMPT. HK$100 or below 1 HK$101-299 2 HK$300-599 3 HK$600-999 4 HK$1,000-1,999 5 HK$2,000-2,999 6 HK$3,000-3,999 7 HK$4,000 or above 8 DK 99 IF 'YES' AT Q23 Q28 Were there any other costs connected with the number change, such as changing
brochures, advertising materials, repainting signs or vehicles and so on? Yes 1 - Q29 No 2 - Q30 IF 'YES' AT Q28 Q29 And approximately how much were these costs? IF DK, ENCOURAGE BEST ESTIMATE. IF NECESSARY, USE CODE
BANDS TO PROMPT. HK$100 or below 1 HK$101-299 2 HK$300-599 3 HK$600-999 4 HK$1,000-1,999 5 HK$2,000-2,999 6 HK$3,000-3,999 7 HK$4,000 or above 8 DK 99 IF 'NO' AT Q23 & THOSE WHO ANSWER NONE/NO OTHERS OR DK,
ASK: Q30 If you had to change your mobile number when changing operator, would you
have to change any stationery as a result? Yes 1 No 2

Appendix G
166
IF A BUSINESS USER (50% OR MORE BUSINESS USE AT QB) Q31 What proportion of your business contacts call you on your mobile phone? ___________% IF MORE THAN 0% AT Q31 AND IF PAGER AT Q7A Q32 And what proportion of your business contacts call you on your pager? ___________% ASK ALL Q33A If you could keep your existing mobile phone number when switching to a new
Operator or Network, how likely would you be to consider switching, wouldyou be considerably more likely to switch, slightly more likely or would it makeno difference?
(S/C) Considerably more likely 1 Slightly more likely 2 It would make no difference 3 ASK IF Q23 = 1 OR 2 Q33B Which Operator/Network would you choose to use? READ OUT CSL 1 Hutchison 2 One 2 Free 3 Pacific Link 4 People's Phone 5 Sunday 6 SmarTone 7 P Plus 8 New World PCS 9 Hutchison (Everyday) 10 OTHERS (PLEASE SPECIFY) _________________________________ None 98 DK 99

Appendix G
167
ASK ALL Q34 If you could keep your existing mobile number, what reduction in your monthly
bill would be necessary to persuade you to switch to another operator? HK$100 or below 1 HK$101-299 2 HK$300-599 3 HK$600-999 4 HK$1,000-1,999 5 HK$2,000-2,999 6 HK$3,000-3,999 7 HK$4,000 or above 8 Not a cost issue - depends on services offered 9 Depends on geographical coverage 10 Other answer (WRITE IN) _____________________________________ Q35 What influence would each of the following factors have in persuading you to
switch to another operator? READ OUT CODES 1 - 3 Strong
Influence Slight
Influence No
InfluenceAt All
DK
Q35A Handset subsidies or discounts 1 2 3 4 Q35B Ability to choose your own number 1 2 3 4 Q35C A 3-second connection delay 1 2 3 4 Q35D Availability of short messaging service 1 2 3 4 Q35E Ability to retain your existing number 1 2 3 4 ASK ALL Q36 When your friends or business contacts change their mobile number, do you
have to change entries in address books/change auto-diallers (on fixed network,phones), etc.?
Yes 1 No 2

Appendix G
168
IF 'YES' AT Q36 Q37 How long does this take for each changed mobile number? Up to 1 minute 1 1+ - 2 minutes 2 2+ - 5 minutes 3 5+ - 10 minutes 4 10+ - 15 minutes 5 15+ - 30 minutes 6 30+ minutes to 1 hour 7 Up to half a day 8 Up to a day 9 Up to three days 10 Up to a week 11 More than a week 12 ASK ALL Q38 Have you ever found that friends or business contacts have changed their mobile
number without telling you? Yes 1 - CONTINUE Q39 No 2 - SKIP TO CLASSIFICATION IF 'YES' AT Q38 Q39 How did you go about finding out their new number? Did you: (M/C) Call a friend 1 Look up in a directory 2 Call their fixed number 3 Call their pager 4 OTHERS (PLEASE SPECIFY) _______________________________ Didn't find it 97 Can't remember 98 IF 'YES' AT Q38 Q40 Approximately, how long did it take to find one number? Up to 15 minutes 1 15+ - 30 minutes 2 30+ minutes to 1 hour 3 Up to half a day 4 Up to a day 5 Up to three days 6 Up to a week 7 More than a week 8

Appendix G
169
IF 'YES' AT Q38 Q41 How many enquiries did you have to make? 1-5 1 6-10 2 10 or above 3 The last questions are for classification purposes only. QD INTERVIEWER: CODE SEX OF RESPONDENT Male 1 Female 2 ASK ALL QE Which of the following age groups do you fall into? READ OUT 1 - 8 UNDER 18 1 18-25 2 26-35 3 36-45 4 46-55 5 56-65 6 66-75 7 Over 75 8 Refused 97 ASK ALL QF Please tell me what is your education level? No schooling 1 Completed primary 2 Secondary (not graduate) 3 Secondary (completed) 4 Post-secondary 5 University/tertiary or above 6 OTHERS (SPECIFY) _______________________
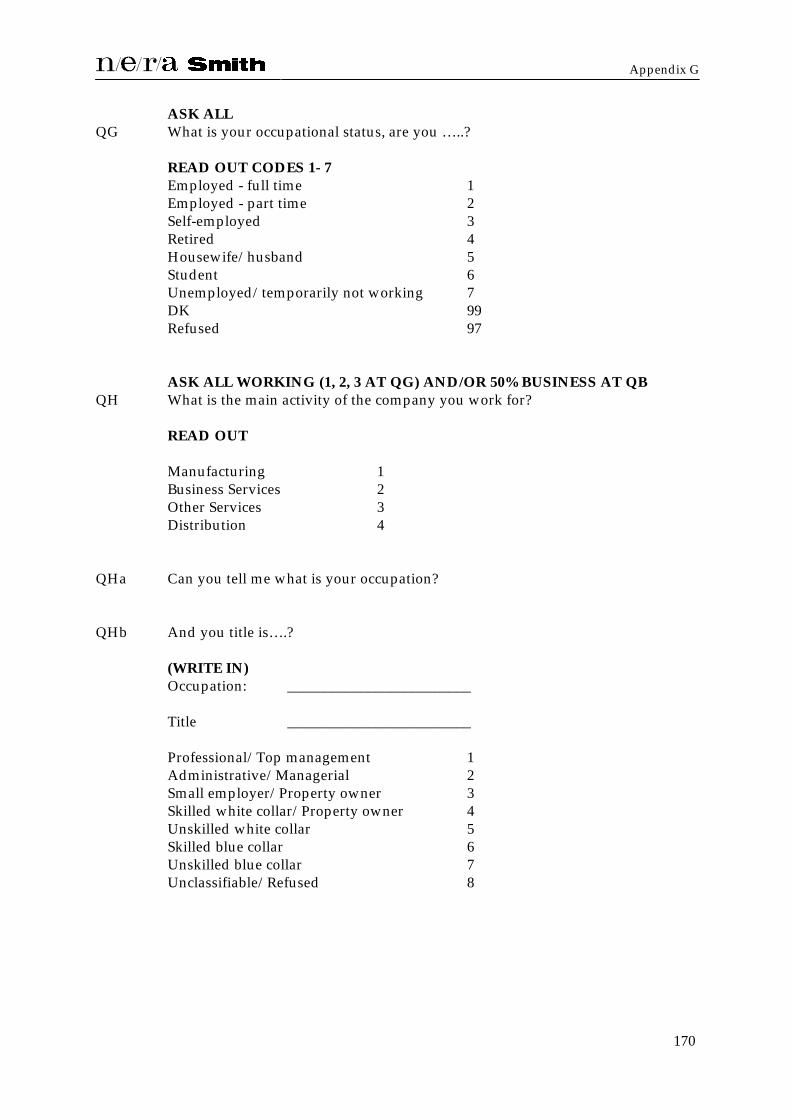
Appendix G
170
ASK ALL QG What is your occupational status, are you …..? READ OUT CODES 1- 7 Employed - full time 1 Employed - part time 2 Self-employed 3 Retired 4 Housewife/husband 5 Student 6 Unemployed/temporarily not working 7 DK 99 Refused 97 ASK ALL WORKING (1, 2, 3 AT QG) AND/OR 50% BUSINESS AT QB QH What is the main activity of the company you work for? READ OUT Manufacturing 1 Business Services 2 Other Services 3 Distribution 4 QHa Can you tell me what is your occupation? QHb And you title is….? (WRITE IN) Occupation: _________________________ Title _________________________ Professional/Top management 1 Administrative/Managerial 2 Small employer/Property owner 3 Skilled white collar/Property owner 4 Unskilled white collar 5 Skilled blue collar 6 Unskilled blue collar 7 Unclassifiable/Refused 8

Appendix G
171
QI Can you tell me your monthly personal income? Below HK$6,000 1 HK$6,000-7,999 2 HK$8,000-9,999 3 HK$10,000-14,999 4 HK$15,000-19,999 5 HK$20,000-29,999 6 HK$30,000-49,999 7 HK$50,000-99,999 8 HK$100,000 or above 9 Refused 97 QJ What about your monthly household income? Below HK$6,000 1 HK$6,000-7,999 2 HK$8,000-9,999 3 HK$10,000-14,999 4 HK$15,000-19,999 5 HK$20,000-29,999 6 HK$30,000-49,999 7 HK$50,000-99,999 8 HK$100,000 or above 9 Refused 97
THANK & CLOSE _________________________________________________________________________________
_
INTERVIEWER'S NAME (PRINT): _______________________
INTERVIEWER'S ID NUMBER: _______________________
I hereby certify that this is an accurate and complete interview, taken in accordancewith my instructions and the ICC/ESOMAR international Code.
SIGNATURE: ___________________________ DATE: __________________________

Appendix H
172
APPENDIX H. SURVEY QUESTIONNAIRE FOR LARGE FIRMS
CORPORATE SURVEY QUESTIONNAIRE
Respondent's name: ______________________ Contact Tel No. _____________
Address: __________________________________________________________
Interviewer's name: ______________________ Interviewer's No. _____________
Date of interview: ______________________ Time of interview: _____________
_________________________________________________________________________________
PROGRAMMER PLEASE NOTE: FOR ALL MONETARY QUESTIONS ALLOW FOR 4DIGITS, ALL % QUESTIONS 3 DIGITS.
INTRODUCTION
Good morning/afternoon/evening. My name is ….. from SOFRES FSA. May I speak tosomeone in your company who is responsible for administering or managing mobile phoneuse in your company.
Good morning/afternoon/evening. My name is ….. from SOFRES FSA. We are carryingout a study for OFTA, the telecommunications regulator, into number portability on mobilenetworks.
SCREENING
S1 How many employees does your company have in this country? …….
Less than 20 1)20-49 2) CONTINUE50-99 3)100 or above 4) TERMINATE
S2 Are you involved in deciding which mobile phone (network) operator
Yes 1 CONTINUENo 2 CLOSE (REFERRAL)
S3 Does your company pay the monthly mobile phone bill for the employees?
Yes 1 CONTINUENo 2 CLOSE (REFERRAL)

Appendix H
173
We are trying to establish whether the benefits of mobile phone portability to the customeroutweigh the costs to the operators, and we are carrying out a survey of corporatecustomers. We would be grateful if your could help us to answer some questions.If ASKED: the interview will take about 15 minutes. (CHECK IF RESPONDENT HAS TIMETO PROCEED. IF NOT MAKE APPOINTMENT AND CALL BACK).
MAIN QUESTIONNAIRE
ASK ALLQ1 How many employees' mobile phone bills are paid by the company?
1-5 16-10 211-15 316-20 421-50 551-100 6More than 100 (PLEASE SPECIFY) _______________________ 7
ASK ALLQ2 How many employees' pager bills are paid by the company?
1-5 16-10 211-15 316-20 421-50 551-100 6More than 100 (PLEASE SPECIFY) _______________________ 7None 98
ASK ALLQ2a Which (network) operator do you currently use?
Q2b (For each network ask) Approximately, how many mobile phones are using (Q2anetwork)?

Appendix H
174
Q2c Approximately, how much is the total monthly mobile bill for (Q2a network)?
READ OUT CODES 1-10 Q2a Q2b(Write innumbers)
Q2c(Write innumbers)
CSL (1010) 1Hutchison 2One 2 Free 3Pacific Link 4People's Phone 5Sunday 6SmarTone 7P Plus 8New World PCS 9Hutchison (Everyday) 10OTHERS (PLEASE SPECIFY)None 98DK 99
ASK ALLQ3 Approximately, how many calls are made on average per mobile phone each
day?
1-2 13-5 26-10 311-15 416-20 5More than 20 6None 98DK/It varies 99
ASK ALLQ4 Approximately, how many calls are received on average per mobile phone each
day?
1-2 13-5 26-10 311-15 416-20 5More than 20 6None 98DK/It varies 99

Appendix H
175
HISTORY
Q5 How long has your company had mobile phones? …..
Under 6 months 16+months - 1 year 21+-2 years 32+-3 years 43+-4 years 54+-5 years 6More than 5 years 7DK 99
Q6 For how long have you been using (Q2a) operator/network? ….
Operator1
Operator2
Operator3
Operator4
WRITE IN --->Under 6 months 1 1 1 16+ months - 1year 2 2 2 21+ - 2 years 3 3 3 32+ - 3 years 4 4 4 43+ - 4 years 5 5 5 54+ - 5 years 6 6 6 6More than 5 years 7 7 7 7DK 99 99 99 99
ASK ALLQ7 How satisfied are you with (Q2a) network operator? Would you say you are ….
Operator1
Operator2
Operator3
Operator4
WRITE IN --->Very satisfied 4 4 4 4Satisfied 3 3 3 3Dissatisfied 2 2 2 2Very dissatisfied 1 1 1 1

Appendix H
176
ASK ALLQ8 Apart from (Q2a OPERATOR(S)), which other networks have you used in the
past, if any?
IF 3+ TAKE 3 MORE RECENTCODE UP TO 3 OPERATORS SEPARATELY
Q8a1st
Mentioned(S/C)
Q8b2nd
Mentioned(S/C)
Q8c3rd
Mentioned(S/C)
CSL (1010) 1 1 1Hutchison 2 2 2One 2 Free 3 3 3Pacific Link 4 4 4People's Phone 5 5 5Sunday 6 6 6SmarTone 7 7 7P Plus 8 8 8New World PCS 9 9 9Hutchison (Everyday) 10 10 10OTHERS (PLEASE SPECIFY)None 98 98 98DK 99 99 99
IF NOT 'DK' OR 'NONE', FOR EACH SELECTED TO Q8A ASKQ9 And how long did you use the OPERATOR/NETWORK (mentioned in Q8)?
(VERTICAL SINGLE ANSWER)
Q8aOperator
Q8bOperator
Q8cOperator
WRITE IN --->Under 6 months 1 1 16+ months - 1year 2 2 21+ - 2 years 3 3 32+ - 3 years 4 4 43+ - 4 years 5 5 54+ - 5 years 6 6 6More than 5 years 7 7 7DK 99 99 99

Appendix H
177
ATTITUDES TO SWITCHING OPERATORS
Q10 How often do you review your contracts with your mobile operators?
Under 6 months 16+months - 1 year 21+-2 years 32+-3 years 43+-4 years 54+-5 years 6More than 5 years 7DK 99
Q11 Have you recently considered switching to a new operator?
Yes 1 CONTINUENo 2 GO TO Q13
ASK IF 'YES' AT Q11Q12 Which Operator/Network would you consider?
M/CREAD OUTCSL 1Hutchison 2One 2 Free 3Pacific Link 4People's Phone 5Sunday 6SmarTone 7P Plus 8New World PCS 9Hutchison (Everyday) 10OTHERS (PLEASE SPECIFY) __________________________________None 98DK 99
ASK ALLQ13 What do you think could be gained from switching to another operator?
Lower prices 1Better services 2Better tariffs 3Better coverage 4New handset 5Roaming - international coverage 6OTHER (PLEASE SPECIFY) _______________________DK 99

Appendix H
178
ASK ALLQ14 What problems/pitfalls could be experienced by switching? (M/C)
Number change 1Cost of handset replacement 2Cost of terminating contracts 3Loss of services 4Loss of coverage 5Loss of international roaming 6Higher prices 7Lower customer service 8Disruption to company 9OTHER (PLEASE SPECIFY) _______________________DK 99
ASK ALLQ15 Assuming comparable quality, coverage and services, what percentage reduction
in your monthly bill would be necessary to persuade you to switch to anotheroperator?
1-5% 16-10% 211-15% 316-20% 421-25% 526-30% 631-35% 736% or more 8Not a cost issue - depends on services offered 9Not a cost issue - depends on geographical coverage 10Other answer (WRITE IN) ____________________________________DK 99
ASK ALLQ16 Do your mobile phone currently have Short messaging services, by which I
mean the ability to send or receive short messages in text form which aredisplayed on the mobile phone itself?
Yes 1No 2DK 99

Appendix H
179
IF YES AT Q16Q17 What percentage have this facility?
1-5% 16-10% 211-15% 316-20% 421-25% 526-30% 631-35% 736% or more 8DK 99
Q18 If this supplementary service was not available with the other operator that youmight consider switching to, what percentage reduction in your monthly billwould be necessary to persuade you to switch?
1-5% 16-10% 211-15% 316-20% 421-25% 526-30% 631-35% 736% or more 8Wouldn't switch at all if no Short messaging 9DK 99
ASK ALLQ19 Do your mobile phones currently have Voice messaging services, by which I
mean the ability to receive a voice mailbox message from any location?
Yes 1No 2DK 99
IF YES AT Q19Q20 What percentage have this facility?
1-5% 16-10% 211-15% 316-20% 421-25% 526-30% 631-35% 736% or more 8DK 99

Appendix H
180
Q21 If this supplementary service was not available with the other operator that youmight consider switching to, what percentage reduction in your monthly billwould be necessary to persuade you to switch?
1-5% 16-10% 211-15% 316-20% 421-25% 526-30% 631-35% 736% or more 8Wouldn't switch at all if no voice messaging 9DK 99
ASK ALLQ22 Do your mobile phones currently have call forwarding? By this we mean the
ability to redirect incoming calls to another location?
Yes 1No 2DK 99
IF YES AT Q22Q23 What percentage have this facility?
1-5% 16-10% 211-15% 316-20% 421-25% 526-30% 631-35% 736% or more 8DK 99
Q24 If this supplementary service was not available with the other operator that youmight consider switching to, what percentage reduction in your monthly billwould be necessary to persuade you to switch?
1-5% 16-10% 211-15% 316-20% 421-25% 526-30% 631-35% 736% or more 8Wouldn't switch at all if no call forwarding 9DK 99

Appendix H
181
Q25 Do your mobile phones currently have a mobile facility?
Yes 1No 2DK 99
IF YES AT Q25Q26 What percentage have this facility?
1-5% 16-10% 211-15% 316-20% 421-25% 526-30% 631-35% 736% or more 8DK 99
Q27 If this supplementary service was not available with the other operator that youmight consider switching to, what percentage reduction in your monthly billwould be necessary to persuade you to switch?
1-5% 16-10% 211-15% 316-20% 421-25% 526-30% 631-35% 736% or more 8Wouldn't switch at all if no fax facility 9DK 99
Q28 Do your mobile phones currently have a data transmission facility?
Yes 1No 2DK 99

Appendix H
182
IF YES AT Q28Q29 What percentage have this facility?
1-5% 16-10% 211-15% 316-20% 421-25% 526-30% 631-35% 736% or more 8DK 99
Q30 If this supplementary service was not available with the other operator that youmight consider switching to, what percentage reduction in your monthly billwould be necessary to persuade you to switch?
1-5% 16-10% 211-15% 316-20% 421-25% 526-30% 631-35% 736% or more 8Wouldn't switch at all if no data transmission 9DK 99
Q31 Do you publicise your mobile number:
Q31a On business cards
Yes 1No 2DK 99
Q31b In internal telephone directories
Yes 1No 2DK 99
Q31c In external telephone directories
Yes 1No 2DK 99

Appendix H
183
Q31d On letterheads and faxes
Yes 1No 2DK 99
Q31e On vehicle livery
Yes 1No 2DK 99
Q31f Elsewhere (SPECIFY ………….)
Q32 Do you mobile phones have automatic facilities to redirect calls from the fixednetwork to mobile networks?
Yes 1No 2DK 99
IF Q8A = 98 OR 99 TO Q37IF ANY PREVIOUS OPERATOR USED AT Q8 (Q8 NOT NONE OR DK) ASK
Q33 When you last switched Operator or Network, did you have to change yourmobile phone numbers?
Yes 1 - GO TO Q34No 2 - GO TO Q37

Appendix H
184
IF 'YES' AT Q33Q34 When you last switched operators, how much did you spend on changing the
stationery items, by which I mean business cards, letterheads, fax forms, invoicesand so on?
IF DK, ENCOURAGE BEST ESTIMATE. IF NECESSARY, USE CODEBANDS TO PROMPT.HK$500 or below 1HK$501-1000 2HK$1,001-3000 3HK$3,001-5000 4HK$5,001-10,000 5HK$10,001-15,000 6HK$15,001-20,000 7HK$20,000 or above 8Nothing at all 9DK 99
Q35 Were there any other costs connected with the number change, such as changingbrochures, advertising materials, repainting signs or vehicles and so on?
Yes 1 - Q36No 2 - Q37
Q36 And approximately how much did this cost?IF DK, ENCOURAGE BEST ESTIMATE. IF NECESSARY, USE CODEBANDS TO PROMPT.
HK$500 or below 1HK$501-1000 2HK$1,001-3000 3HK$3,001-5000 4HK$5,001-10,000 5HK$10,001-15,000 6HK$15,001-20,000 7HK$20,000 or above 8DK 99
ASK ALLQ37 If you could keep existing mobile numbers when switching to a new Operator
or Network, how likely would you be to consider switching, would you beconsiderably more likely to switch, slightly more likely or would it make nodifference?
(S/C)Considerably more likely 1Slightly more likely 2It would make no difference 3

Appendix H
185
ASK IF Q37 = 1 OR 2Q38 Which Operator/Network would you choose to use?
READ OUT S/CCSL (1010) 1Hutchison 2One 2 Free 3Pacific Link 4People's Phone 5Sunday 6SmarTone 7P Plus 8New World PCS 9Hutchison (Everyday) 10OTHERS (PLEASE SPECIFY) _________________________________None 98DK 99
ASK ALLQ39 If you keep your existing mobile number, what reduction in your existing
monthly bill would be necessary to persuade you to switch to another operator?
1-5% 16-10% 211-15% 316-20% 421-25% 526-30% 631-35% 736% or more 8Wouldn't switch at all 9DK 99
QD INTERVIEWER: CODE SEX OF RESPONDENT
Male 1Female 2
ASK ALLQE Which of the following age groups do you fall into?
UNDER 18 118-25 226-35 336-45 446-55 556-65 666-75 7Over 75 8Refused 97

Appendix H
186
ASK ALLQF Please tell me what is your education level?
No schooling 1Completed primary 2Secondary (not graduate) 3Secondary (completed) 4Post-secondary 5University/tertiary or above 6OTHERS (SPECIFY) ____________________________
QH Can you tell me what is your occupation?
(WRITE IN)Occupation: __________________________
Position: __________________________
Professional/Top management 1Administrative/Managerial 2Small employer/Property owner 3Skilled white collar/Supervisor level 4Unclassifiable/Refused 5
QI Is that a full-time or part time job?
Full-time 1Part-time 2
QJ Can you tell me your monthly personal income?
Below HK$6,000 1HK$6,000-7,999 2HK$8,000-9,999 3HK$10,000-14,999 4HK$15,000-19,999 5HK$20,000-29,999 6HK$30,000-49,999 7HK$50,000-99,999 8HK$100,000 or above 9Refused 97

Appendix H
187
QK What about your monthly household income?
Below HK$6,000 1HK$6,000-7,999 2HK$8,000-9,999 3HK$10,000-14,999 4HK$15,000-19,999 5HK$20,000-29,999 6HK$30,000-49,999 7HK$50,000-99,999 8HK$100,000 or above 9Refused 97
THANK & CLOSE
__________________________________________________________________________________
INTERVIEWER'S NAME (PRINT): _______________________
INTERVIEWER'S ID NUMBER: _______________________
I hereby certify that this is an accurate and complete interview, taken in accordancewith my instructions and the ICC/ESOMAR international Code.
SIGNATURE: ___________________________ DATE: __________________________


![[HUBFORUM Paris] Retail Everywhere - Guénaelle Gault (TNS Sofres)](https://static.fdocuments.in/doc/165x107/557d5cc2d8b42ae1438b4c2d/hubforum-paris-retail-everywhere-guenaelle-gault-tns-sofres.jpg)