Feasibility evaluation of Business Intelligence (BI) tools
45
Feasibility evaluation of Business Intelligence (BI) tools as measurement systems: an industrial case study Master of Science Thesis in Software Engineering and Management METE ÖMERALİ
Transcript of Feasibility evaluation of Business Intelligence (BI) tools

Feasibility evaluation of Business
Intelligence (BI) tools as measurement
systems: an industrial case study
Master of Science Thesis in Software Engineering and Management
METE ÖMERALİ

2
University of Gothenburg
Chalmers University of Technology
Department of Computer Science and Engineering
Göteborg, Sweden, January 2012
The Author grants to Chalmers University of Technology and University of Gothenburg the non-exclusive
right to publish the Work electronically and in a non-commercial purpose make it accessible on the
Internet.
The Author warrants that he/she is the author to the Work, and warrants that the Work does not
contain text, pictures or other material that violates copyright law.
The Author shall, when transferring the rights of the Work to a third party (for example a publisher or a
company), acknowledge the third party about this agreement. If the Author has signed a copyright
agreement with a third party regarding the Work, the Author warrants hereby that he/she has obtained
any necessary permission from this third party to let Chalmers University of Technology and University
of Gothenburg store the Work electronically and make it accessible on the Internet.
Feasibility evaluation of Business Intelligence tools as measurement systems: an industrial case study
Mete ÖMERALİ
©Mete ÖMERALİ, January 2012.
Supervisor: Miroslaw Staron
Examiner: Agneta Nilsson
University of Gothenburg Chalmers University of Technology
Department of Computer Science and Engineering
SE-412 96 Göteborg
Sweden
Telephone + 46 (0)31-772 1000
Department of Computer Science and Engineering
Göteborg, Sweden June 2011.

3
Feasibility evaluation of Business Intelligence tools as measurement systems: an industrial
case study
METE ÖMERALİ
Department of Computer Science and Engineering
Chalmers and Gothenburg University
Gothenburg, Sweden
ABSTRACT
Context: Collecting, analyzing and presenting software metrics are common practices in the software
engineering industry. These practices can be done by using either dedicated tools like Rational Insight or
tools which are proprietary. The trade-offs between these two types of tools are, for example, suitability
for purpose vs. cost of maintenance.
Objectives: The objective of this research is to compare the existing proprietary measurement systems
framework with business intelligence tools represented by IBM/Rational Insight with respect to
functionality and performance. The research also aims to find features which need to be considered
while adopting a business intelligence tool as a measurement system in software development
organizations.
Methods: The research method is a case study and data was collected by conducting interviews with
managers, designers and developers of the existing proprietary measurement systems. In order to
illustrate the workflow of business intelligence tools, ten scenarios were created. Questionnaires and
surveys were conducted to gather stakeholders’ ideas about the evaluation of the scenarios.
Results: The usability of Rational Insight was evaluated using the ten scenarios and the realization of
these scenarios were shown and accepted in workshops and interviews.
Conclusions: The study has shown that business intelligence tools bring integrity into measurement
systems and perform better compared to custom measurement system that is used at Ericsson. The
capabilities of business intelligence tools are higher than studied proprietary measurement systems.
Keywords: Measurement Systems, Business Intelligence Tools, Case Study

4
Index
ABSTRACT .................................................................................................................................................. 3
1. INTRODUCTION ................................................................................................................................. 5
2. RELATED WORK ................................................................................................................................. 6
2.1 Business Intelligence Software ................................................................................................. 6
2.2 Motivating Factors and Features of Measurement Systems .................................................... 9
3. RESEARCH SITE ................................................................................................................................ 10
3.1. Existing Measurement Systems at Ericsson ............................................................................ 10
3.2. Problem Formulation .............................................................................................................. 12
4. CASE STUDY DESIGN ....................................................................................................................... 13
4.1. Context .................................................................................................................................... 13
4.2. Research Plan .......................................................................................................................... 13
4.3. Research Question and Objectives ......................................................................................... 15
4.4. Subjects ................................................................................................................................... 15
4.5. Instruments and Data Collection ............................................................................................ 16
4.6. Analysis Methods .................................................................................................................... 16
5. COMMON FEATURES OF MEASUREMENT SYSTEMS ...................................................................... 17
6. EVALUATION OF BI WITH RESPECT TO SCENARIOS ........................................................................ 19
7. RESULT OF SCENARIOS .................................................................................................................... 20
8. SUMMARY OF RESULTS ................................................................................................................... 20
9. DISCUSSION ..................................................................................................................................... 22
10. THREATS TO VALIDITY DISCUSSION ............................................................................................ 22
11. CONCLUSIONS ............................................................................................................................. 23
ACKNOWLEDGMENTS ............................................................................................................................. 24
REFERENCES ............................................................................................................................................ 24
APPENDIX ................................................................................................................................................ 27
Appendix A: CONSTRUCTION OF SCENARIOS ..................................................................................... 27
Appendix B: EVALUATION OF SCENARIOS (Results) ........................................................................... 34

5
1. INTRODUCTION
Quality assurance has been one of the most important aspects of projects in large software
organizations. In order to assure quality, measures are used to monitor the products and processes in
order to make improvements in corporate performance. Moreover, measures must be gathered in a
systematic way for the purpose of measuring the quality of activities. Staron and Meding define
measurement system as: “A measurement system is a set of measuring elements (in software
engineering – measurement tools) assembled together in order to measure a specific quantity” (Staron
& Meding, 2009). A measurement tool is defined as, “the set of on-going organizational processes
required to define, design, construct, implement, operate and maintain an information system for
collecting, analyzing and communicating measures of software processes, products and services” (Berry
& Jeffery, 2000). Like that of Berry and Jeffrey mentioned above, there are a number of processes
required to implement measurement tools such as defining, gathering and analyzing measures which
require a number of resources. So one can ask; why do we need such a complicated system which has
complex way of working with metrics? In order to answer this question, we should first understand the
benefits of measurement systems.
Measurement systems aim to monitor and predict the quality of product and process. However, it is not
easy to set up measurement systems (Berry & Jeffery, 2000), because the decision whether to adopt
such a system is not straightforward and requires considering several technical aspects. In addition to
the technical aspects, it requires a number of organizational changes to adopt the new system and the
participation of management and engineering. For large software organizations, measurement systems
must be fully automated since they deal with large amounts of data. In order to build a fully automated
measurement system, all the processes which are required from gathering data to displaying reports
must be done automatically. A fully automated measurement system means that the data collection is
done automatically from database and/or from source code repositories and those measures are
calculated and presented to the users without manual interventions. The reason behind the automated
measurements system is that the organizations would like to save resources such as manpower and
time when creating measurement systems.
Business intelligence (BI) tools are automated programs which have built-in features to connect and
extract data from data sources, and BI tools contain rich graphical user interfaces to create reports. One
of the benefits of using a business intelligence tool is the efficient data delivery which saves time for
stakeholders of BI systems (Watson & Wixom, 2007). Another benefit is the systematic approach that
business intelligence tools bring to measurement systems in the organization. The systematic approach
means that designs of all reports have similar structure and content. As a result, this makes
collaboration easier for geographically distributed branches of an organization. Therefore, organizations
look forward to replacing their custom measurement systems with business intelligence tools. Based on
the fact that measurement processes are very widely used in industry (Solomon & Paul, 2004) and that
there is a variety of business intelligence tools used for collecting, analyzing and presenting the
measurement data, we set to address the following research question:

6
What are the features of business intelligence tools necessary to have in order to replace a measurement
system with a business intelligence tool?
In order to address this question, a case study was conducted at one of the units of Ericsson which is
responsible for a large telecom product. At the time of the study, the studied unit of Ericsson was using
proprietary measurement systems at various levels (Staron & Meding, 2009). However, with the growing
amount of data, the organization started looking towards other ways of handling measurement
information – potentially business intelligence tools. In this thesis, as existing measurement systems are
evaluated against a business intelligence tool exemplified by IBM Rational Insight, the evaluation was
done through a case study which collected data from interviews and observations combined with design
research. The design research was used to create scenarios describing the most common workflows. The
result of this study is a list of features which needs to be considered when adopting a business
intelligence tool as a measurement system.
The rest of the thesis is structured as follows; section 2 discusses the most related work in the literature
and business intelligence software. Section 3 describes the problem formulation in the organization and
explanation of the pilot infrastructure which is implemented in university servers. The design of the case
study is explained in section 5. The discussion is presented in section 6 followed by the threats to validity
of the study in section 7 and lastly, the conclusion is presented in section 8.
2. RELATED WORK
In this section we introduce the business intelligence software in general and motivating factors and
features of measurement systems.
2.1 Business Intelligence Software
In order to compete with rivals, companies must have the competitive advantage (Thomas Jr., 2001).
Furthermore, a study shows that the demand for business intelligence tools continues to grow even at a
time when demand for most IT products is lower (Solomon & Paul, 2004). Likewise, over 1400 chief
information officers identified business process improvements as one of their companies’ top priorities
(Amyot, et al., 2009). The usage of business intelligence tools raises in the market, a study shows that
spending on business intelligence tools reached more than $US 6.1 billion by 2008 (Elbashir, et al.,
2008). Some well-known BI tools are:
SAP Business Objects and OutlookSoft,
SAS software package,
Cognos- IBM/Rational Insight,
Microsoft Business Intelligence Proclarity and Sql Server Services,
Oracle Hyperion Solution Corporation and Business Intelligence Suite Enterprise Edition.
7
The studied organization used a number of IBM/Rational tools in the current measurement systems to
store data and create reports, for this reason, we examined IBM/Rational Insight. The purpose of
Business intelligence tools (BI Tools), is defined as turning data into information and then into
knowledge (Matteo, et al., 2004). In order to turn data into information and then into knowledge, a set
of applications automatically gathers data from various sources and adds them to the same
environment. This environment is called data warehouse. Data warehouse forms an infrastructure for BI
tools (Tvrdikova, 2007). When the data is stored in a warehouse, BI tools are used to analyze raw data
and display them in reports. In order to create a data warehouse, three steps are required. These steps
are extracting gathered data from sources, transforming gathered data by sequence of operations and
loading them physically into data warehouse in order to make them ready for data mining. These three
steps are denoted as extract, transfer and load ETL (Tvrdikova, 2007). Companies require data mining
tools together with Business intelligence tools in order to make effective strategic decisions (Heinrichs &
Lim, 2003). Business intelligence tools help managers to understand weaknesses and strengths of the
projects and processes.
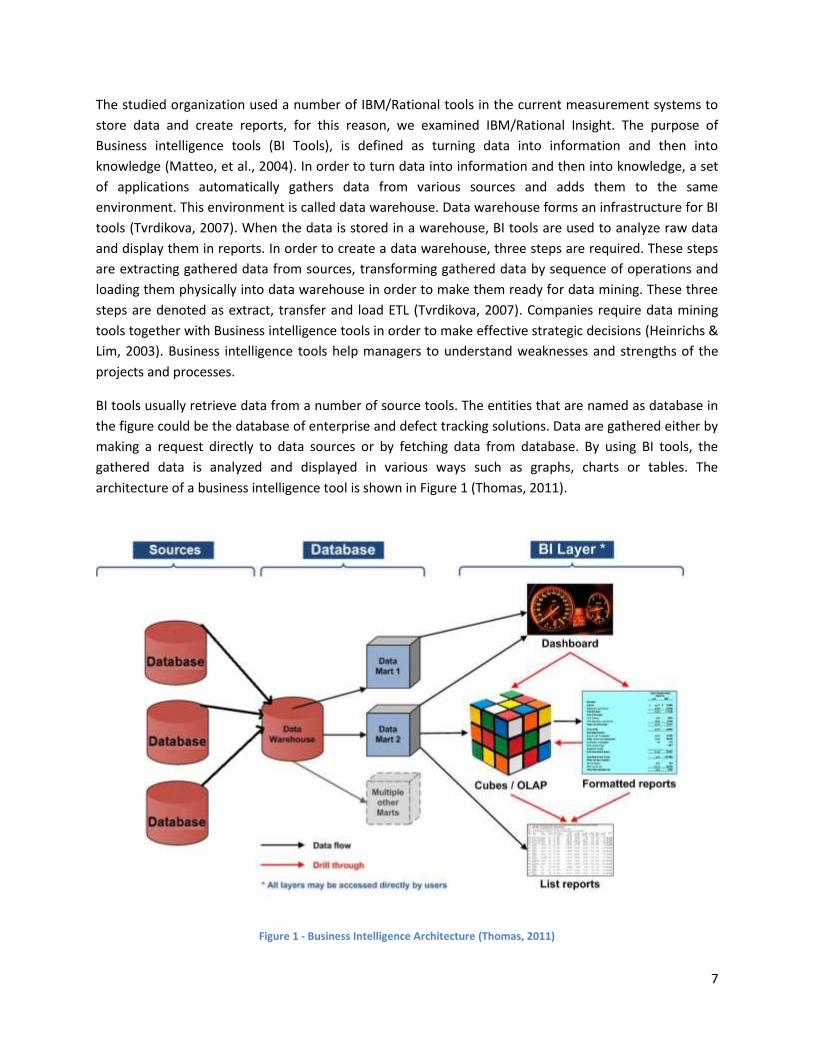
BI tools usually retrieve data from a number of source tools. The entities that are named as database in
the figure could be the database of enterprise and defect tracking solutions. Data are gathered either by
making a request directly to data sources or by fetching data from database. By using BI tools, the
gathered data is analyzed and displayed in various ways such as graphs, charts or tables. The
architecture of a business intelligence tool is shown in Figure 1 (Thomas, 2011).
Figure 1 - Business Intelligence Architecture (Thomas, 2011)

8
As it is shown in figure 1, there are a number of data sources which constitute a data warehouse. By
creating a data warehouse and gathering all the data in the same environment, there could be
possibilities to make different combinations and calculations on the data. A data warehouse contains a
huge amount of data and in order to optimize the speed and bring simplicity, multiple data marts are
created. Data marts contain a sample of data from a data warehouse in order to make certain
calculations. Data mining and OLAP are some techniques used to make those calculations or to find
patterns in the data. This helps users of BI tools to make future planning and estimations. Business
intelligence tools offer a possibility to show a preview of reports in so-called dashboards. Dashboards
only display some general information and users can drill-down into indicators to see the actual reports.
In order to explain the architecture of BI tools in detail, let us assume that one of the data sources is
ClearQuest which stores defect lists of projects and another data source is support line work database.
The managers would like to see how the changes in the defect database affect the work density of
support line. By merging these two sample data sources, managers can understand that the reason for
high load in the support line is due to the fact that the number of defects in their current system is large.
As an example, managers can check the dashboard in order to see how the defect density is changed
when a new version of a product is released. Therefore, when a new release comes on, managers can
estimate the future work load in their support line and increase the capacity of that specific team in
order to fulfill the demand coming from their customers. In Figure 2, the screenshot of a sample
dashboard is displayed.
Figure 2 - Rational Insight Dashboard – an example showing defect density, defect backlog, and test execution status

9
The figure above shows information about defects with graphical display. Example of information
displayed in the dashboard is the change in the number of defects per thousand lines of code and test
coverage of requirements in the system.
2.2 Motivating Factors and Features of Measurement Systems
Since our work aims to identify necessary features for business intelligence tools in order to use
business intelligence tools as a measurement system, we started with finding motivation factors that
drive implementations of measurement systems – to elicit the necessary features of measurement
systems in general. Examples of these factors can be found in (Daskalantonakis, 1992), (Nusenoff &
Bunde, 1993), (Seddio, 1993), and some example factors are: increasing process and product reliability,
improving project planning and improving customer services.
Staron and Meding explain the factors which are important in developing and maintaining measurement
systems as well as assessing the reliability of data provided by measurement system at the studied unit
of Ericsson (Staron & Meding, 2009). In our research, we also consider those quality aspects. Other
related articles are the following:
Pfleeger explains the lessons learned in building measurement systems at Contel, which is a $3
Billion telecommunication firm (Pfleeger, 1993). Contel’s measurement systems resemble
Ericsson’s measurement systems and therefore we evaluated the features of Rational Insight
using the guidelines suggested by Pfleeger. Moreover in order to understand the expectations
and concerns from stakeholders of Ericsson more efficiently, we studied the needs of Contel’s
stakeholders because both companies have similar concerns and expectations from
measurement systems. Lastly Pfleeger compares number of various business intelligence tools
in terms of speed, user interface, tools intent, data connectivity and metric support – criteria
which we used in our comparison.
Daskalantonakis describes how measures should be defined within categories such as utility,
types and audience needs. It also explains Motorola’s measurement system and focuses on
process improvement and project control. The results show how Motorola decided which
measures to use and how they were evaluated (Daskalantonakis, 1992). Daskalantonakis
suggests categorizing the measures by user needs, measure types and the level in which the
measures are used such as company level or project level. We considered their implementation
experiences while building our scenarios and tried to cover all categories of measurement
systems based on Daskalantonakis’ suggestions. As explained before, similar size companies
have similar expectations and user needs. By analyzing Daskalantonakis’ article, we aimed to
categorize stakeholders’ expectations and requirements based on the levels such as company
level and project level.
Seddio presents a similar case study to Daskalantonakis’s. Seddio studied benefits, successes,
threats and failures during the evolution of the measurement system at Kodak (Seddio, 1993).
One of the main study concepts is the process used by Kodak to select measures and determine

10
what the potential difficulties associated to this task are. Examples of these problems are effort
required to gather data from data sources and use of the gathered data. We followed the
guidelines proposed by Seddio while implementing measurement system using Rational Insight.
Gopal et al. explain the results of a survey on 214 metrics professionals in 145 software
organizations in the United States. They explain the importance of management participations
and decisions in software measurement programs (Gopal, et al., 2005). For that reason, we also
interviewed managers at Ericsson.
Finally, research by (Fenick, 1990) showed us that different actors of measurement systems have
different kinds of expectations. For example designers of measurement systems are interested in ease
of use while managers give more importance to high level benefits of measurement systems such as
capabilities. Moreover, studies show us the difficulties in implementing measurement systems and
therefore actors of measurement systems are subject to changes. The difficulties include the problems
of gathering data and the usage of gathered data. For that reason, in our research we aimed to show the
benefits of measurement systems in different levels to all stakeholders in order to make sure that the
stakeholders can understand that amount of work they will put for the change is worthwhile.
3. RESEARCH SITE
In this section, we introduce the current measurement system in the studied organization such as how
the data is stored and which tools are used. This section also explains the problems of using the existing
measurement system.
3.1. Existing Measurement Systems at Ericsson
Ericsson has built the existing measurement systems in a number of years (Staron, et al., 2009), (Eldh, et
al., 2006), (Damm, et al., 2006). The main data sources that are used for this study are IBM/Rational
tools such as ClearQuest and RequisitePro. In order to extract data from data sources, various
applications run on scheduled tasks to save data in Excel worksheets. The reason for running scheduled
tasked applications is to take snapshots of the system on a timely basis and work on these snapshots. In
order to create measurement systems, data is extracted from a number of data sources and excel
worksheets are created. This action is done every night to deliver updated information to stakeholders.
Moreover, excel worksheets are used to display reports in details for the stakeholders of measurement
systems. Because excel worksheets contain detailed information and it is hard to interpret the result all
the time, MS Vista Sidebar Gadgets are implemented in order to display the current situation and the
trends with indicators in every stakeholder’s computer. A study shows Ericsson’s current measurement
system information model in Figure 3 (Staron, et al., 2009).

11
Figure 3 - Measurement system information model (Staron, et al., 2009)
The figure above explains information model of an existing system at the studied unit of Ericsson. The
interpretation of this figure shows how data is turned into knowledge for stakeholders. In order to
create reports, a number of data are gathered from various data sources. The first level of data which is
gathered is called raw data and the number of raw data forms the base measures. The base measures
are called metrics and metrics are quality related in the studied organization. The metrics in quality
assurance plans are collected in order to monitor project and product quality (Staron, et al., 2009). After
the base measures are collected, derived measures are defined to gain a better insight into the data. At
last, stakeholders are informed by indicators. As a result, stakeholders are generally informed about the
most important aspects of reports without the need to go through all calculations.

12
In order to understand the process of the model, let us assume that the organization would like to keep
track of average defect count per component. For that reason, numbers of defects are collected in base
measures. Afterwards, in order to have a more detailed understanding, the numbers of opened defects
are grouped in the associated component in derived measures. However, managers are not interested
in the exact number of defects in a component but they would like to see if the average of the defects
count per component is below the predefined goal. Therefore the actual defect count per component is
compared by the predefined goal. As an example, if the actual defect count is lower than the defined
goal, the indicator shows a green sign (Staron, et al., 2011).
A report could display only base measures or combination of derived measures and indicators. The
organization collects a number of metrics and the quantity of the metrics is in large numbers. The
monitoring of metrics is done by a number of stakeholders in different perspectives. As an example,
product managers check the information for each product; the information is aggregated from in service
performance of per release for all releases of monitored product. On the other hand, line managers
have the similar information aggregated per organization. Because different products are developed by
different organizations and product managers are only responsible for their own organization as
opposed to product managers. Quality managers generally work with high level metrics such as time,
speed and development process however product managers are interested in product performance for
each release (Staron & Meding, 2009).
3.2. Problem Formulation
The procedure to create measurement systems at Ericsson is quite straightforward but during our
research in the organization we observed certain problems. These problems are as follows:
Infrastructure problems: Measurement systems communicate with a number of tools in order
to give information to stakeholders. Therefore, a measurement system should be capable of
collecting information using a number of different approaches. One way of gathering data is to
directly access the database of the source and another approach is to make HTTP request and
gather data automatically from web applications. As an example, the measurement systems at
Ericsson triggers Visual Basic applications to gather data from sources and create excel
worksheets to work on daily collected data. However from time to time, execution may not be
completed satisfactorily. One example to infrastructural problems is the scheduled job
problems. Schedule jobs may not be successfully completed all together in the correct
sequence, therefore the expected input data would not be up-to-date in order to be used for
generating new reports.
Customization problems: Measurement systems display a number of reports to stakeholders.
Generic reports show high amounts of data but in a less detailed way. However, different
stakeholders even at the same management level have special requirements. Moreover,
proprietary measurement systems in general have a number of steps which contain
programming knowledge.

13
4. CASE STUDY DESIGN
In this chapter, the design of our case study is explained. Research plan, context, objects, subjects, data
instruments, data analysis techniques and results are explained accordingly.
4.1. Context
The study was done in one of the units of Ericsson, which is one of the leading global telecommunication
equipment providers. The studied organization is responsible for the development of network products
for the telecommunication networks. The group that we worked with was responsible for checking the
quality of products and processes. There were several ongoing projects; however, for security reasons
the case study was done without using the real data. We used similar data sources, similar amount of
data and similar report content instead.
As Staron et al. (2009) and (2011) describe, the history of measuring at Ericsson is long standing, the first
measurement system started in 2002 and common way of reporting performance of project started in
2004.During 2005, an initiative was undertaken to systematize the measures and reduce the number of
measures collected. In 2006, an effort was established to build a single metric program for the
organization to control and monitor projects, products, and resources in the organization. The metrics in
the studied organization were quality related. The metrics were collected during the projects and
displayed during the status meetings. Since the maturity of the organization grew over time, the
measures evolved. Therefore the number of collected metrics reduced from 70-100 (around 2002) to
approximately 20 metrics that monitored key aspects of the project. Metrics were up-to-date and
display the current status of the project.
Metrics are required by a number of actors and demand is constantly growing each day. The metrics are
stored in databases and files in the studied organization. The locations are:
Requirement databases
Defect tracking databases
Log files
MS Excel worksheets with source information, for example: product downtime per unit of time,
project progress, and subproject status information.
MS PowerPoint presentations with specifications of targets and organization goals.
One of the goals of this study is to improve the existing measurement system by gathering metrics in a
single environment which makes it easier to see the big picture and make better estimations and insight
into the measurement systems (Staron, et al., 2009).
4.2. Research Plan
The research plan table contains objectives, research methods and expected results. The research action
was selected as a flexible design at one of the units at Ericsson. Robson (2002) describes the flexible
design as: “The flexible design is expected to change or evolve while the project is underway” (Robson,

14
2002). The research plan is selected and revised regularly as new conditions arise. Table 1 - Research
displays the latest version of research plan.
Table 1 - Research Plan
Step Objectives Research Methods Expected Results
1. Plan
To understand what is appreciated most in the current solution
To understand data sources and connections
To collect requirements and existing problems in the current system
Qualitative analysis of interviews with:
Line manager
Process Engineer
Designer of measurement systems
History of the existing framework (section 5.1)
Requirements from stakeholders and usage scenarios for measurement systems. (Section 6)
2. Do
To study design aspects of business intelligence tools for the organization
Two informal interviews with a designer of measurement systems
List of requirements for design of business intelligence tools (Section 6)
3. Check
Creating pilot environment to test feasibility of Rational Insight
Iterative development with prototyping
Working infrastructure which is similar to the existing one and creation of scenarios (Appendix A)
4. Study
To identify potential problems and benefits with respect to ease of use functionality and feasibility
Qualitative analysis: interviews with
Line manager
Process Engineer
Designer of measurement systems
Workshop:
Line manager
Process Engineer
Designer of measurement systems
List of potential problems (Section 9)
List of potential benefits (Section 9)
At first, a number of interviews were arranged with the managers and a designer of the measurement
systems. The purpose of these interviews was to obtain the idea of strong points, potential difficulties
and problems in the used proprietary measurement systems. Moreover, we aimed to understand the
workflow of a designer of measurement systems in order to examine what might be the potential
changes to his/her work when the company decides to replace the existing system with a new business

15
intelligence tool. As a result, the design principles of business intelligence tools and creation of scenarios
in order to test BI tools was created based on the suggestions gathered from the interviews. The
meeting which was organized with process engineers and line manager aimed to find out how
organizational measurement systems worked. Interview questions were generally about how the
proprietary measurement system worked and what weaknesses the existing system had. Moreover,
scenarios were created in order to test if business intelligence tools satisfied the weak parts of
proprietary measurement system as well as to test the concerns of stakeholders and potential
problematic parts of BI tools. After collecting the information related to proprietary measurement
system and requests for BI tools, a demonstration was presented to the interviewees to obtain feedback
and to check if the new technology satisfied all the functionality of the existing system. The detailed
information about the subjects is explained in section 5.4 and the request from BI tools and the
realization of scenarios are explained in Appendix B.
4.3. Research Question and Objectives
In this case study, we tried to find the answer to the research question: What are the features of
business intelligence tools necessary to have in order to replace a measurement system with a business
intelligence tool? We addressed this question by analyzing the results obtained from the evaluation of
each scenario after the demonstration. Moreover, we also aimed at identifying important aspects and
potential difficulties when integrating BI tools. Our ideal objective was to identify minimum required
features that must be implemented in order to have success while using business intelligence tools as
measurement systems.
4.4. Subjects
In order to understand the existing system, a test environment was established and interviews were
arranged with people with well-established knowledge and experience on measurement systems at
Ericsson (see Table 1).
To obtain detailed information for all kinds of measurement systems used at Ericsson such as product
measurement systems, process measurement systems and organizational measurement systems, four
subjects were selected. The subjects were working in the same department at Ericsson but had different
roles such as one designer of measurement systems, one process engineer of measurement systems,
one process methods and tools quality engineer and lastly one line manager.
Process Methods and Tools Quality Engineer: He has been working in the industry for 18 years and he
has spent his last 11 years at Ericsson. He has been working as operation development manager and his
responsibilities consist of securing and measuring key performance indicators at Ericsson.
Process Engineer: He has been working at Ericsson for 8 years, handling requirements. His main duties
consist of requirements elicitation, creating anatomy plans and baseline reports from those
requirements. His arrangements also contain creating test cases for requirements and creating a test
case specification document.
16
The Designer of measurement system: He has been working in the industry for 5 years. His daily duties
consist of making measurement systems up to date, fixing errors and developing new measurements.
His arrangements also contain maintenance of measurement systems.
4.5. Instruments and Data Collection
The main data collection instruments were transcripts from open-ended interviews. The scenarios and
surveys were used as part of the interviews and during the workshop. Since the scenarios are also part
of an important finding (i.e. workflows of measurement processes) they are described comprehensively
in Appendix B.
The scenarios were created based on the requirements and suggestions of the interviewees in step 2.
These scenarios were implemented with Rational Insight in step 3. The realization of each scenario was
evaluated during the interviews by surveying interviewees. Some scenarios, that aimed to assess the
ease of use, were evaluated based on observing the time spent and effort put in by the interviewees.
Scenarios mainly contained tasks such as recreating an existing report, changing data source of a report,
making a stress test of Rational Insight and checking the information quality provided by measurement
systems. One example scenario was the creation of MS sidebar Gadgets.
The studied organization uses gadgets in order to display few indicators to stakeholders at all times.
Consequently, stakeholders are always guaranteed to be aware of the current situation without the
need of running any application. During the interviews and workshops, participants explained the
benefits of gadgets. Because of the importance of gadgets, we created a scenario in order to gather data
from Rational Insight and display it in a third party application. The main data collection method was
selected as scenarios because we believe that the most effective way of testing software and presenting
stakeholders the benefits of the software is to realize the most common used cases by showing
scenarios and collecting feedback with questionnaires. Scenarios had three sections, these sections
were; the aim of the scenario, the steps required to realize the scenario and the result of the scenario.
Scenarios were serving the purpose of examining the most probable used cases in order to test how
business intelligence tools reacted. All scenarios created for this study are attached in appendix A.
4.6. Analysis Methods
During the demonstration of the BI tool, after each scenario we asked participants to fill out several
questionnaires and to discuss what participants conceived regarding the realization of the scenarios. The
questions posed in the questionnaire focused on the patterns explained below and used the 5 point
Likert scale.
With the purpose of making analysis in order to verify that a scenario was fulfilled by the BI tool, we
used the result from the questionnaire. First, we calculated the average points for every question that
was asked for each scenario. Then, we calculated the average of all questions asked for each scenario.
Lastly, If the average point of each scenario had more than three points (four - good or five – very high)
we assumed that the scenario was fulfilled by the BI tool. If the average point was three (ok) we
accepted as neutral and if the average point was less than three (two – poor or one – very low) we

17
accepted that the BI tool did not satisfy the requirements for that scenario. The questionnaire is applied
for each scenario and the gatherings of all scenarios are explained in Appendix B.
In order to analyse our data, we identified a number of patterns. The patterns were defined based on
the requirements expressed by the stakeholders during the interviews (Yin, 2002) (Runeson & Host,
2009). Four patterns were identified:
Problems
Concerns
Improvement effects
Simplification effects
Problems: Current proprietary measurement systems have some problems and difficulties on usage and
during the meetings, stakeholders pointed out those problems. We analysed the existing problems in
order to fix them with a different approach that BI tools made available to us.
Concerns: The second pattern that was identified was the concerns of stakeholders about the business
intelligence tools and its integration. Stakeholders had concerns in a number of different levels, such as
the time required to learn business intelligence tools usage and the capabilities of BI tools compared to
existing system.
Improvement effects: The third pattern was to find out improvements that business intelligence tools
brought into measurement systems. An example to improvements might be the performance, ease of
use and the time required to analyse data.
Simplification effects: The last pattern was the simplification; as we discussed previously, proprietary
measurement systems can be complex and requires number of manual or semi-automated steps.
However, BI tools brought simplification to the gathering and report creation process and stakeholders
only analysed the last output for taking future decisions.
The patterns shaped the scenarios and questionnaires because we created scenarios to clarify the
concerns and show if the problems arose during the evaluation of BI tools.
5. COMMON FEATURES OF MEASUREMENT SYSTEMS
In this section, the identified common features of BI tools are presented. In order to find the most
important features to evaluate BI tools as a measurement system, two groups are created. The first
group contains the most important features that are considered by the studied organization. Those
features are identified from the interviews and workshops. The second group which is the state of the
art contains the remaining features that are general for measurement systems. Features that belong to

18
this section are identified from the related articles that are discussed in section 2 “related work” and
from the commercialization strategies of BI tools.
The studied unit of Ericsson thought that five features are very important for measurement systems and
those features are:
Accessibility
Robustness / Backup
Usability (Ease of use)
Information Quality
Performance
Five state of the art features are:
Customizability
Flexibility
Import / Export
Informational
Reliability
This research evaluates ten features with ten scenarios by using the BI tool as a measurement system in
the studied organization. In Table 2, the matrix shows which feature of the measurement systems are
evaluated through which scenario. The detailed descriptions of the scenarios are shown in Appendix B.
Table 2 – Scenarios vs. Features Mapping
SCENARIOS Vs.
FEATURES
Acc
essi
bili
ty
Cu
sto
miz
abili
ty
Usa
bili
ty (
ease
of
use
)
Pe
rfo
rman
ce
Flex
ibili
ty
Ro
bu
stn
ess/
Bac
kup
Info
rmat
ion
Qu
alit
y
Imp
ort
/Exp
ort
Info
rmat
ion
al
Re
liab
ility
Scenario Descriptions
Scenario 1 X X Software Installation Scenario 2 X X X Report Creation Scenario 3 X X X X X X Windows Gadget Scenario 4 X X X X New Data Source Scenario 5 X X X Advance Calculations Scenario 6 X X Stress test Scenario 7 X X X X X Robustness Scenario 8 X X X X X X Backup Scenario 9 X X X X Dashboard
Scenario 10 X X X X Information Quality

19
As it is displayed in Table 2, accessibility, customizability, usability and flexibility are common features
for most of the scenarios. Features that are evaluated in multiple scenarios could have different
meanings. For example, the reliability feature for backup scenario evaluates the trust-ability of the
backup functionality for BI tools. On the other hand, the same reliability feature for the stress test refers
that BI tools does not crush even if thousands lines of data are displayed in reports. But some features
such as performance, information quality and robustness are only evaluated by a few numbers of
scenarios. Therefore, the evaluations of these features are straight forward. More information about the
aim of the scenarios is shown in Appendix A and the realization of all scenarios are shown in Appendix B.
6. EVALUATION OF BI WITH RESPECT TO SCENARIOS
In this section the detailed list of answers from all respondents are displayed. Each scenario is evaluated
by all participants and each question contains Likert-scaled answers from one to five. In Table 3, the
average points that are given by each respondent are displayed for all scenarios. Moreover, notes from
respondent are concatenated and displayed in respondent comments column. The questionnaire that is
used during the evaluation is anonymous therefore the respondents are marked as respondent A, B and
C. Table 3 – Scenario Satisfaction of Respondents
Scenarios
Satisfaction Of
Respondents
Re
spo
nd
en
t A
Re
spo
nd
en
t B
Re
spo
nd
en
t C
Respondent Comments
Scenario Descriptions
Scenario 1 3/5 2/5 5/5 SAP integration is missing Software Installation Scenario 2 5/5 4/5 5/5 No need for programming skills Report Creation Scenario 3 3/5 3/5 4/5 Needs to be investigated more Windows Gadgets Scenario 4 3/5 2/5 4/5 Easy to edit reports without writing codes New Data Source Scenario 5 5/5 4/5 5/5 No need to write codes, good functions Advance Calculations Scenario 6 4/5 4/5 5/5 Quick response time, very fast Stress test Scenario 7 2/5 4/5 5/5 Only one level of robustness, needs more Robustness Scenario 8 5/5 4/5 5/5 Support necessary features for backup Backup Scenario 9 4/5 3/5 4/5 Necessary to open web browser Dashboard Scenario 10 5/5 5/5 4/5 Capable of showing information quality Information Quality
Answers of each respondent are colored with red, green and blue. Red color indicates that the
respondent is not satisfied with the scenario; blue color indicates that the respondent is neutral and
green color indicates that the respondent is satisfied with the evaluation of scenario.

20
7. RESULT OF SCENARIOS
In this section the results that are obtained from the evaluation of scenarios are explained. Section 6
explains which features are important both for studied unit of Ericsson and the state of the art. As
addition to that, the detailed list of features and scenarios mapping is displayed. Table 3 shows which
features are satisfied and which features do not perform as expected under the evaluation of each
scenarios by using BI tools as a measurement system. The evaluation is done by using questionnaires
and notes that are gathered in the workshop. Table 4 is created, based on the results that are obtained
from the questionnaire in section 7.
Table 4 – Result of Scenarios
SCENARIOS Vs.
FEATURES SATISFACTION
Acc
ess
ibili
ty
Cu
sto
miz
abili
ty
Usa
bili
ty (
eas
e o
f u
se)
Pe
rfo
rman
ce
Fle
xib
ility
Ro
bu
stn
ess
/Bac
kup
Info
rmat
ion
Qu
alit
y
Imp
ort
/Exp
ort
Info
rmat
ion
al
Re
liab
ility
Scenario Description
Scenario 1 X Software Installation Scenario 2 Report Creation Scenario 3 X X Windows Gadget Scenario 4 X X New Data Source Scenario 5 Advance Calculations Scenario 6 X Stress test Scenario 7 X X X X Robustness Scenario 8 X Backup Scenario 9 X X X Dashboard
Scenario 10 Information Quality
As it is shown in Table 4, BI tools are highly accessible, customizable, usable and flexible. At the same
time, BI tools perform quickly and efficiently. The ease of use and accessibility for BI tools is satisfactory
in four of the scenarios. However, BI tools are not as reliable and informative as proprietary
measurement system in the studied organization. Robustness/backup and import/export features
perform in the similar satisfactory level both for BI tools and proprietary measurement system.
8. SUMMARY OF RESULTS
Realizations of all scenarios are demonstrated to the stakeholders in the latest workshop. Out of ten
scenarios, five of the scenarios have the highest satisfaction points and comments from the
questionnaire. Therefore, those five features are identified and derived as the most important features

21
necessary to consider while implementing a business intelligence tool as a replacement of a proprietary
measurement system, those features are:
Highly configurable software Installation: Measurement systems are centralized units in the
decision system of organizations where the data from multiple data sources are gathered in
order to analyse the situation of projects and processes. Moreover, measurement systems aim
to show the big picture to decision makers. As a consequence of gathering multiple data source
together into a single platform, data analysis techniques such as OLAP and Data Mining become
possible. Even though business intelligence tools are highly capable of gathering data in a
number of ways, if companies are using custom tools which are not capable of extracting data
for BI tools, the usage of BI tools could be narrowed.
Availability to do advanced calculations: Business intelligence tools are built to make the most
common calculations easily. However, companies might require calculations in the reports
which are hard or impossible to make with out-of-the-box functions. At Ericsson, the
calculations were possible with built-in reports and with SQL commands; however, companies
should consider their reports and must check the capacity of the tool.
High Performance: Measurement systems are supposed to reflect the most up-to-date situation
of the projects and processes. Stakeholders of measurement systems have the need to check
the most current status before making decisions. For that reason, BI tools need to gather data
from multiple data source and provides required reports for stakeholders within seconds.
Therefore performance is one of the most crucial features of BI tools.
Robust application: Once a company implements a business intelligence tool, all reporting and
work is done on that platform. This makes BI tools a key element in the measurement systems.
In order to put an application in the heart of the measurement systems, stakeholders should
believe that the tool is robust and must adapt to changes.. Our study shows us that BI tools are
robust on the basic level, which is checking if the system is up and running. The information
displayed by BI tools must be reliable, and therefore the information quality provided by BI tools
must be verifiable. Moreover robustness should be quantifiable and different levels of
robustness control should also be present in BI tools.
Dashboard Creation & Third Party Applications integration: Measurement systems aim to keep
their users up-to-date with the latest information about the situation of the projects and
processes at all times. Moreover, informing stakeholders is important both for motivating them
and displaying current situation in order to have a possibility for acting quickly in case of critical
situations. Therefore, measurement systems should have common practices to display the most
general information of the organization without the need to drill-down through reports. This
could be done via dashboards or as it is used in studied organization, via custom third party
tools such as windows sidebar gadgets. For that reason, BI tools should be capable of features
such as dashboards or should be capable of extracting data in an easily readable format to use in

22
custom applications. We believe that informing all stakeholders of measurement system as
much as possible and as easily as possible is very important for BI tools.
9. DISCUSSION
Our study aimed to find out the necessary features for BI tools in order to replace a measurement
system with a BI tool. During our study, we found out that two features were very important, those
features were performance and usability. Custom measurement system such as the one we examined
during our study had limited features compared to BI tools. Moreover, BI tools had better performance
in terms of gathering and displaying data. However, there were also some parts in which custom
measurement system performed more efficiently than a BI tool which was the flexibility of using script
languages instead of SQL queries. The main benefit of custom measurement system was the possibility
to replace each single part with a tool which was capable of doing that specific job better. As an
example, an excel worksheet could be used to merge a number of data sources together and gadgets
could be used to display indicators. However, replacing applications of measurement systems very often
and using a number of stand-alone programs require communication and data transfer between them.
Therefore, performance decreases and problems occur due to the need for export of data and
connection between different kinds of tools.
The necessary features with which to build effective business intelligence based measurement systems
are strong reporting capabilities with the ability to make flexible and out-of-the-box calculations such as
displaying company specific reports which contains calculations that might not be possible to do with
built-in functions, as observed in Appendix B - 5. Advanced Calculation Scenario. Moreover, BI tools
must be able to make an easy and effective connection to third party applications in order to push and
pull data. Lastly, business intelligence tools should be customizable for satisfying needs of different
expectations of companies such as checking the information quality of reports in ISO standards. We
recommend companies integrate business intelligence tools into their measurement systems because
having a single platform which gathers all different kinds of data sources together brings the advantage
of seeing the big picture and making better estimations. Likewise, data mining and OLAP becomes
available and companies will have better insight into their projects and products.
10. THREATS TO VALIDITY DISCUSSION
In this section, we discuss the threats to the validity of our study according to the categories discussed
by Wohlin et al (2000) and suggestions from Trochim (2008). The main external validity (Wohlin, et al.,
2000) threat to our study is the fact that our study was done in one of the department of one unit at
Ericsson and as a reason, results obtained from the study might not be valid for all companies.
Therefore, generalizations of the result to all organizations are unsafe. However, when organizations
consider replacing a custom measurement system into business intelligence tools, there could be

23
similarities to Ericsson and those companies can benefit from this study, even though the context might
be different.
The main internal validity threat is the history threat (Trochim, 2008). Ericsson is an experienced
company in measurement systems as the measurement system has a long history at Ericsson. Therefore,
the background of the interviewees could cause the observed results. More information about the
measurement system that is used in the studied unit of Ericsson is explained in section 5.1. Using BI tool
as a measurement system is also new to the studied unit of Ericsson; therefore, the history effect did
not have the influence on the observed outcomes.
The main construct validity threat is mono operational bias (Trochim, 2008). This is due to the variety of
BI tools tested during our study. Since Ericsson’s current infrastructure and the demand from the
managers required us to use IBM Rational Insight, competitor BI tools could have different capabilities
and results. Even though in our study we tried to examine general features of BI tools without checking
the brand-specific options, performance and usability could vary in different configurations and brands.
Last threat to validity of our study is the statistical validity threat. The interviews and the workshops
were done with limited people and the decision of individuals might affect the results dramatically.
People who were biased against BI tools or the current custom measurement system in use might
change the result of the study. However, we tried to create a questionnaire not asking personal favors
but checking how a requirement was satisfied with the BI tool (Trochim, 2008). Since we only
interviewed a few number of interviewees, we cannot use statistics to support our findings.
11. CONCLUSIONS
Measurement systems are one of the key elements in the quality assurance for the organizations. The
tools replacing proprietary measurement systems should be capable of certain features in order to
handle this important work. Therefore, in our study we tried to find the important features necessary
when adopting BI tools as measurement systems for the companies. .
We believe that business intelligence tools should be capable of at least five features and these features
are:
Accessing to multiple data sources is the key idea behind BI tools and this applies while using BI
tools as measurement systems. Therefore BI tools should support multiple connection types to
retrieve and extract data.
Information provided from BI tools is easily accessible in the form of MS Vista Gadgets or similar
such as dashboards to increase accessibility.
BI tools should contain programming capabilities such as SQL commands or basic functions in
order to generate reports that contain advanced calculations with dynamic data.

24
Information from BI tools should be backed-up so that it is possible to retrieve the metrics even
when the links to data sources are lost.
BI tools should perform actions which contain a high amount of data easily and rapidly. It should
be possible to generate reports which gather data from multiple data sources on the runtime in
order to display most up-to-date data.
As a result, BI tools in general are mature enough to be used as measurement systems and could replace
proprietary measurement systems. During our study, BI tools showed accomplishment on the backup of
data for robustness but they were not satisfactory as expected both by our side and by the studied
organization. The main reason behind lack of robustness is, when the main data warehouse of BI tool is
not available, not all backup reports and dynamic reports are accessible anymore. On the other side, the
main strength of BI tools is the usability. It is very convenient for users to create, edit and customize
reports without any need of high programming skills and save templates for future use. Moreover, BI
tools can be integrated with other tools easily both by exporting and importing data. As we tested in our
study, transferring of data in multiple applications such as MS sidebar gadgets increased the accessibility
in larger context. Lastly, we were very impressed by the performance displayed by BI tools where the
tasks requiring almost hours by the studied proprietary measurement systems were completed within
minutes.
ACKNOWLEDGMENTS
The author would like to thank Ericsson AB Sweden for their commitment during the study and for the possibility to cooperate. The author would also like to thank his supervisor Dr. Miroslaw Staron for his help and guidance.
REFERENCES
Amyot, D. et al., 2009. Business process monitoring and alignment: An approach based on the user
requirements notation and business intelligence tools. Kluwer Academic Publishers, pp. 269-316.
Berry, M. & Jeffery, R., 2000. An Instrument for Assessing Software Measurement. Empirical Software
Engineering, 5, pp. 183-200.
Damm, L.-O., Lundberg, L. & Wohlin, C., 2006. Faults-slip-through – A Concept for Measuring the
Efficiency of the Test Process. SOFTWARE PROCESS IMPROVEMENT AND PRACTICE, pp. 47-59.
Daskalantonakis, M. K., 1992. A Practical View of Software Measurement and Implementation
Experiences Within Motorola. IEEE Transactions On Software Engineering, VOL. 18, NO. 11.

25
Elbashir, M. Z., Collier, P. A. & Davern, M. J., 2008. Measuring the effects of business intelligence
systems: The relationship between business process and organizational performance. International
Journal of Accounting Information System 9, pp. 135-153.
Eldh, S. et al., 2006. A Framework for Comparing Efficiency, Effectiveness and Applicability of Software
Testing Techniques. Proceedings of the Testing: Academic & Industrial Conference – Practice And
Research Techniques.
Fenick, S., 1990. Implementing management metrics: an Army program. IEEE Software, pp. 65-72.
Gopal, A., Mukhopadhyay, T. & Krishnan, M. S., 2005. The Impact of Institutional Forces on Software
Metrics Programs. IEEE Transactions on Software Engineering, vol. 31, no. 8, pp. 679-694.
Heinrichs, J. & Lim, J.-S., 2003. Integrating web-based data mining tools with business models for
knowledge management. Journal of the American Society for Information Science and Technology, v.56
n.6, pp. 620-629.
Matteo, G., Stefano, R. & Luris, C., 2004. Beyond Data Warehousing: What's Next in Business
Intelligence?. In Proceedings of the 7th ACM international workshop on Data warehousing and OLAP
(DOLAP '04). ACM, New York, NY, USA, , pp. 1-6.
Nusenoff, R. E. & Bunde, D. C., 1993. A Guidebook and a Spreadsheet Tool for a Corporate Metrics
Program. J. System Software, pp. 245-255.
Pfleeger, S. U., 1993. Lessons learned in building a corporate metrics program. IEEE Software.
Robson, C., 2002. Real World Research. In: 2nd ed. s.l.:Willey-Blackwell, pp. 455-500.
Runeson, P. & Host, M., 2009. Guidelines for conducting and reporting case study research in software
engineering. Empir Software Eng.
Seddio, C., 1993. Integrating Test Metrics within a Software Engineering Measurement Program at
Eastman Kodak Company: A Follow-up Case Study. J. Systems Software, pp. 227-235.
Solomon, N. & Paul, G., 2004. Business Intelligence. Communications of the Association for Information
Systems: Vol. 13, Article 15. .
Staron, M. & Meding, W., 2009. Ensuring Reliability of Information Provided by Measurement Systems.
pp. 1-16.
Staron, M., Meding, W., Karlsson, G. & Nilsson, C., 2011. Developing measurement systems: an industrial
case study. Journal of Software Maintenance and Evolution: Research and Practice 23, Volume doi:
10.1002/smr.470, p. 89–107.
Staron, M., Meding, W. & Nilsson, C., 2009. A framework for developing measurement systems and its
industrial evaluation. Information and Software Technology 51, p. 721–737.

26
Thomas Jr., J. H., 2001. Business Intelligence Why?. Ea1 Journal.
Thomas, P. J., 2011. business-intelligence. [Online]
Available at: http://peterjamesthomas.com/category/business-intelligence/dashboards/
[Accessed 26 04 2011].
Trochim, W., 2008. Research methods knowledge base. [Online]
Available at: http://www.socialresearchmethods.net
[Accessed 20 November 2011].
Tvrdikova, M., 2007. Support of Decision Making by Business Intelligence Tools. 6th International
Conference on Computer Information Systems and Industrial MAnagement Applications (CISIM).
Watson, H. J. & Wixom, B. H., 2007. The Current State of Business Intelligence. IEEE Computer Society.
Wohlin, C. et al., 2000. Experimentation in Software Engineering: An Introduction. Boston: Kluwer
Academic.
Yin, R. K., 2002. Case Study Research: Design and Methods. s.l.:Applied Social Research Methods Series,
Vol 5. Sage Publications Inc, 3rd edition.

27
APPENDIX
Appendix A: CONSTRUCTION OF SCENARIOS
1. Software Installation Scenario
Aim of Scenario
The set-up must be similar to current set of tools for data collection, analysis and presentation in
Rational Insight.
Flow
Prepare a server at the University of Gothenburg to host tools the same as was at Ericsson.
Installing each data source tool as follows:
o Rational Insight v1.0.2
o IBM Rational ClearQuest v7.1.2 (CQ)
o IBM Rational RequisitePro (ReqPro)
o IBM Websphere v7
o IBM Http Server v6.1
o MS SQLServer 2005
Integrate CQ and ReqPro with Rational Insight, which means
o To set up connections in such a way that data from CQ and ReqPro is available in
Rational Insight
Demonstrate simple data flow from one of the tools to Rational Insight, which means
o To show that adding a new entity in CQ or ReqPro results in changing the data in Insight
Success Criteria
The same data as in existing infrastructure is provided in Rational Insight. By the same we mean:
Defects data is visible in Insight as it is in ClearQuest
Graphs from ClearQuest can be used in Insight
Requirements in ReqPro are visible in Insight
Adding one data point in CQ or ReqPro makes it visible in Rational Insight

28
As an addition to these measurable criteria we intend to ask the stakeholders at Ericsson to provide us
with the answer upon the following:
Is the data in CQ and ReqPro similar to the data that is used at Ericsson?
Are there any features (w.r.t. data collection, analysis and presentation) that exist in the
current infrastructure that are not shown in Insight?
2. Sample Report Implementation Scenario
Aim of Scenario
To create a sample report showing the similar data with dynamic content, which is the organization
measurement system.
Flow
Identifying one measurement system at Ericsson
Analyzing the report provided by that measurement system and identify which data is
provided in the report and how the data is visualized
o An outcome is a list of requirement for that measurement system
Developing a sample database with mock-up data that resembles the real data from
Ericsson (in order to minimize security risks with using real data outside of the company)
Developing the measurement system and the report in Rational Insight
o Using the list of requirements as input
Executing the measurement system and displaying the data
Success Criteria
The data with the indicators in the existing reports must be displayed in the newly created reports.
In particular:
The report webpage of Insight is similar to the report worksheet in the measurement system
The data available in the measurement system is also available in Insight (although replaced
by the mock-up data)
The indicators should work dynamically as data changes the indicator should change
accordingly.

29
The content of data should be gathered from a database to prove the dynamic content can
be displayed.
3. Windows Gadget implementation
Aim of Scenario
To create MS Vista Gadget gathering its content from the report created in Rational Insight.
Flow
Analyzing one MS Vista Gadget in use
o Output will be list of requirements for a gadget
Creating a report in Rational Insight and exporting report as xml automatically
Creating gadget which displays data gathered by rational insight
Success Criteria
MS Vista Gadget should gather data from a report created by Rational Insight
o Report contains data from ClearQuest or another dynamic content
Data source of Gadget should be easy to parse
o Data source is in type XML
4. Adding new data source to a report
Aim of Scenario
To change or add new data sources to the existing report in Rational Insight
Flow
Creating a sample report that contains data from ClearQuest
o Outcome is a report that contains data such as defect headlines
Creating new data package which has data source as RequisitePro
o Outcome is a data package that contains requirements gathered from RequisitePro
database
Pointing to the new package

30
Displaying new fields from the new data source
o Outcome is a report which has data from its existing data source which is
ClearQuest and from new data source which is RequisitePro
Success Criteria
The existing data should be available in the report.
New data that comes from new data source should be visible in the report.
Calculations which have inputs as two different data sources could produce one or many
outputs.
5. Advanced calculation
Aim of Scenario
To show advance calculations that could be done in Rational Insight and can be displayed in reports.
e.g.; to show man hours spent on some task without adding the time spent for waiting user input for
that task will be calculated and displayed
Flow
Creating database which contains three tables;
Table shows the working hours for each task
Table shows the waiting time for each task
Table shows the given time for each task
Success Criteria
Reports should contain advance calculations. For example;
The output should be a report which shows the remaining time for each opened task.
Report should display the tasks opened and should remove the time spent on waiting
answers for user input on that task.
Report should calculate the time remaining for the task.

31
6. Stress Test for Rational Insight
Aim of Scenario
To test Rational Insight with equal volume of data that exists at Ericsson’s measurement system.
Flow
Creating a sample table with fifty thousand rows
Displaying sample report with fifty thousand rows
Displaying another report with fifty thousand rows and some calculations on them
Executing the reports to test the speed
Success Criteria
Reports should run less than a couple of minutes for the first time they are executed.
After the first time, reports should be executed in less than a minute.
7. Robustness Test of Rational Insight
Aim of Scenario
To check the robustness of rational insight while some of the data sources are not available
Flow
Creating report that contains multiple data source
o ClearQuest defect list
o RequisitePro requirements list
Stopping RequisitePro service
Executing the report
Success Criteria
Report should display ClearQuest defect list properly
Report should show the notification for unreachable source

32
8. Backup Reports
Aim of Scenario
To create backups for the reports in external hard drive in order to create a snapshot of a moment.
If the data sources are not available, stakeholders can work on previously saved data.
Flow
Identifying a report to backup
Creating report which contains data from various sources
o Database source or any other dynamic source such as ClearQuest
Backup the report to a directory
Stopping the services and execute the backup
Success Criteria
Report should display the content without the need to access the data source
Backup should be made automatically
o On a weekly basis with proper naming
o In selected format (excel, xml, etc.)
9. Dashboard Creation
Aim of Scenario
To demonstrate dashboard in Rational Insight with indicators which could be a possible replacement
of MS Vista Sidebar Gadgets currently in use at Ericsson.
Flow
Analyzing one example of existing gadget
o Analyzing the data showed in the gadget
o Analyzing the indicators in the gadget
Creating a report that shows the same content of analyzed gadget
Creating a dashboard that contains multiple reports

33
o Output is a set of reports displayed in one view
Success Criteria
The same data and the same indicators exist in the dashboard.
Dashboard should contain all data in gadget.
Dashboard should contain the similar indicators in gadget.
For the purpose of replacement, dashboard should be visible for each user all the time to
make sure stakeholders monitor the current progress.
As an addition to these measurable criteria, we intend to ask the stakeholders at Ericsson to provide
us with the answer upon the following:
Is the dashboard could be a replacement for MS Vista Gadgets in use today at Ericsson?
Are there any problems about using dashboards instead of MS Vista Gadgets?
What could be the potential benefits of replacing MS Vista Gadgets with Dashboard?
10. Information Quality
Aim of Scenario
To check if the information provided is up-to-date and within the predefined limits.
Flow
Identifying a report to check information quality
Defining a set of attributes to check information quality
Creating a report with indicators showing information quality
o The output is a report which contains indicators showing information quality
Success Criteria
The report should contain an indicator that shows if the data sources are available
The report should contain an indicator that shows if the date is within predefined limits
(the number of defects in the system should be greater than ‘0’)

34
Appendix B: EVALUATION OF SCENARIOS (Results)
In this chapter, the realization of scenarios and opinions of stakeholders are described. Moreover the
content of each scenario is evaluated based on the degree of usefulness of the feature to test when
companies replace their measurement system with a business intelligence tool. The degree of
usefulness is measured by the Likert scale described earlier. A workshop was organized with seven
attendees but only three of them filled the questionnaire, the ones in charge of management and
designing measurement systems at Ericsson. Attendees were asked to give their opinions on three main
groups of questions:
Similarities between the existing system and the BI solution realized using Rational Insight
The satisfaction of fulfillment of scenarios by BI tool
Missing parts in the scenarios, if any
Evaluation of scenarios checks mainly the usability of Rational Insight for the studied unit at Ericsson.
However, on the workshop; potential benefits have also been discussed.
1. Software Installation Scenario
The scenario aimed to create a similar working infrastructure to Ericsson’s current measurement system
with an additional installation of Rational Insight in order to make data collection, analysis and
presentation. Therefore, all programs in use were identified and installed in the server in which the
realizations were made. In Figure 4, the configuration of Rational Insight is shown at the studied
organization. The configuration consisted of two data sources which were defect tracking database
ClearQuest and a custom database for tracking support line workload. These data sources were added
to the data warehouse which became the main data source for Rational Insight. Once the data were
gathered in the warehouse, data marts were set up1. The data marts were used to create reports
through data packages. Besides being a data source to a report, another benefit of having data marts is
the ability to show trends and logical connections between different sources for the reason that a
number of different sources come together in the same environment.
1 A data mart is a custom data package which consists of one or many different sources.

35
Figure 4 - Configuration of Rational Insight
The result from the evaluation of this scenario showed that this installation is not very similar to what
Ericsson has today but it serves identical purpose because:
The similar tools are connected to Rational Insight
Similar reports are created
In the questionnaire two attendees out of three believed that the scenario was successful. Moreover,
one user commented on difficulties of gathering data from other tools such as SAP because of having
multiple layers and more complex database structure. This comment is true and the more complex the
connection to the source gets; the harder it becomes to extract the data. However, enterprise resource
planning (ERP) tools had special application programming interfaces (API) to extract data for third party
applications and business intelligence tools only need to connect to one single layer to gather the data.
As a result of this scenario, stakeholders believed that configurations of business intelligence tools were
significant and the majority of stakeholders were satisfied with the result.
2. Sample Report Implementation Scenario
The aim of this scenario was to create a sample report in charge of showing the similar data with
dynamic content which was organization measurement system. Each time the report was displayed to
users, the data was gathered on runtime. The report generation is shown in Figure 5. In order to gather
data from ClearQuest, a data mart was created which gathers the list of all the defects and queries
created in order to make calculations and filtering.

36
Figure 5 – Sample Report Implementation
All three interviewees strongly agreed that this scenario satisfied their expectations. Moreover,
attendees believed that sample report creation was an important feature.
3. Windows application implementation scenario
The current measurement system uses windows gadgets to display few indicators and data in every
stakeholder’s computer. The reason to display indicators in gadgets is to guarantee that all users are
aware of the current situation. Because windows gadgets are a vital part of measurement systems at
Ericsson, it is highly required to have them in Rational Insight. For that purpose, this scenario was
created with a windows application which gathered its content from the report that was created in
Rational Insight. We aimed to demonstrate that the data used in Rational Insight could be possibly
gathered with 3rd party applications. Figure 6 shows a screenshot of the application.

37
Figure 6 – Third Party Application
This simple windows application gathered the list of defects in a specific project. The report was created
in Rational Insight and saved as XML. In order to gather data, HTTP request was made and gathered XML
was parsed. This scenario does not satisfy user expectations because it is not a real gadget but a
windows application. However, it is a proof of concept that Rational Insight allows custom applications
to gather data in a certain way which is easy to read and modify, such as xml. One of the attendees
strongly agreed that this scenario satisfied his expectation, another attendee was neutral and the last
attendee disagreed. However, all attendees believed that windows sidebar gadgets and other third
party applications should work with BI tools.
4. Adding new data source to a report and editing reports
The designer of measurement systems worked several hours of the day to create new reports and made
changes to the existing ones. The aim of this scenario was to show how to modify reports or add a new
data source to the existing report in Rational Insight. For example, let us assume that a report is created
in order to show defect counts for all projects. However project managers are just interested in certain
projects because they are only working on that project. In order to change the content of that report
and only display necessary data, the user has to make a request to a designer and then the designer has
to customize the report himself. In Figure 7 we show how to delete some rows and customize the report
without the need of programming skills. Users can create custom reports for their needs and then save
custom made reports in their own profiles.

38
Figure 7 – Editing Report
As a result, one interviewee somewhat agreed that this scenario satisfied his expectation and it was
similar to the existing measurement system that is in use today, whereas other two participants were
neutral. As a result attendees somewhat believed that this scenario satisfied their expectations.
5. Advanced Calculation Scenario
Rational Insight and other business intelligence tools are known as very easy-to-use programs. However,
they are not very capable of doing harder or complex tasks because they are not as flexible as script
languages. Moreover, this was one of the concerns of Ericsson as well. For that reason, we designed a
scenario to create a report which contained relatively hard calculations. Firstly, a report which showed
remaining man hours for an open task in support line was created. But if during that task a question was
asked and an answer was gathered later, that time period was subtracted from the given time. In
addition, there could be many questions and many answers for each task as well. The output was a
report which showed the remaining time for all tasks opened for support line and it is shown in Figure 8.

39
Figure 8 – Advance Calculations
This scenario required some SQL language skills. However only SQL queries were used to make advanced
calculations and users were very satisfied with the result of this scenario. For this reason, Rational
Insight has built-in functions and gives ability to write SQL codes with menus and creating report is
easier when compared to the existing system in use at Ericsson. All three attendees strongly believed
that BI tools should be capable of making out-of-the-box calculations. Moreover all attendees believed
that it was important to make custom and advanced calculations with BI tools.
6. Stress test for Rational Insight
The aim of this scenario was to test Rational Insight both with equal and higher volumes of data which
exist at Ericsson’s measurement system. For that reason, four sample defects tables were created with
different amounts of data and four reports were created to display all rows. The defect table is displayed
in Figure 9.

40
Figure 9 - Defect Table
Different amounts of data were tested for ten times each and mean value of response time with
standard deviation was calculated. In Table 5, the amount of data and the average response times are
shown with mean values.
Table 5 – Response Time
The graph in Figure 10 displays performance tests results in a graphical form.
Defect count (rows)
Trial amount Response Time (unit)
Result of mean value
Standard deviation
1.000 10 Second 1 0
10.000 10 Second 7.70 0.94
50.000 10 Second 35.50 2.60
100.000 10 Second 77.80 4.02

41
Figure 10 - Performance Test Graph
As it is presented in Figure 10, displaying a report which contains hundred thousand rows requires
approximately 80 seconds. However, in the out of the box preferences Rational Insight automatically
divides big reports into pages and response times get lower for whole report and instead of displaying
all hundred thousand rows only hundreds of them are displayed at a time with a response time of less
than 1 second per page. Nevertheless, there is always a need to make calculations on a high amount of
data. For that reason, a similar test was designed to calculate all rows in defect database for different
severities and with ten thousand rows. As a result it took less than one minute to generate the report.
After these results, the interviewees were satisfied with the performance and believed that Rational
Insight satisfied their expectations. All three attendees strongly believed that performance was an
important feature to consider while replacing proprietary measurement system into a BI tool and they
also believed BI tools performed better than the current solution.
7. Robustness Test of Rational Insight
Business intelligence tools are highly dependent on other programs. In order to gather data or extract
data from different sources, connections need to be made between business intelligence tools and
other programs. However, integrating a number of sources brings a danger to the robustness of the
measurement system. In view of that; this scenario was created which aimed to check the robustness of
rational insight while some of the data sources were not available.

42
In Figure 11 the problems with the connections are denoted with red crosses. The database which stores
information for Rational Insight (data warehouse) works fine but the connection between a data source
as an example ClearQuest database is not available.
Figure 11 – Robustness Test
As a result, Rational Insight stopped functioning when a data source was unavailable. In that case, a
report that gathered its dynamic values from data sources did not work properly but if a backup of the
report was created while the data sources were accessible then that backup report would work with the
last available data. Two interviewees were satisfied with the results of this test and one attendee
believed that Rational Insight was not robust. When compared to the existing measurement system in
both cases, if a connection was lost and then stakeholders had to work with backup reports. As a result,
attendees believed that BI tools should be robust and make working possible even though the
connection was lost with number of sources.
8. Backup Report Scenario
As it was explained in the previous scenario, there are needs to create backup reports in case of lost
connections or to check a specific data of a day. In this scenario, the aim was to back up the reports in
Rational Insight in order to create a snapshot of a moment. Consequently, if the data sources are not
available, stakeholders can work on previously generated report. Rational Insight has its own features to
create backup. Figure 12 shows how to create a task in order to create backup reports.

43
Figure 12 – Backup Report
For taking backups, wide selections of options are available, such as daily, weekly or monthly backups.
Backup reports are also stored in Rational Insight but could be extracted as different formats such as
‘pdf’ files or ‘excel’ files. Without any doubt all three interviewees strongly agreed that this scenario
satisfied their expectations and they believed that backup was a necessary feature to consider.
Additionally, Rational Insight sent notifications or links to backup reports for stakeholders automatically
for quick access. However, given the fact that Rational Insight stored backup reports in the application
itself and without manual command did not extract these reports, if a connection was lost to data
warehouse of the BI tool, the backup report was not accessible anymore. As a result, the robustness of
business intelligence tools was not very strong and stakeholders had to take manual backup on periodic
basis.
9. Dashboard Creation Scenario
Up to now, all scenarios were related to the usability of Rational Insight. Moreover, business intelligence
tools brought additional benefits to measurement systems. One of the benefits was the dashboards.
Dashboards get their name from a dashboard in a car, display few indicators or a preview of existing
reports in one page. The aim of doing this was that the users could see several ongoing actions only by
checking a single page. The current working system at Ericsson has gadgets which are used for similar
reasons and dashboards were implemented in this scenario in order to have an alternative for gadgets.
Figure 13 shows a screenshot of a gadget which displays both defect count report and project health
report side by side.

44
Figure 13 – Dashboard Screenhot
After the results were gathered from the questionnaire, the interviewees believed that dashboards were
similar to gadgets in the existing measurement system with respect to the way they were used and they
were satisfied with the scenario. Two attendees believed that dashboards were important features and
one attendee disagreed. However, on the other hand, all attendees believed that because dashboards
were only visible in browsers and users had to open a browser to see them, stakeholders believed that
the dashboards were not as powerful as windows sidebar gadgets. This is because windows sidebar
gadgets are always visible and once something goes wrong all users are notified immediately no matter
what programs they are using at that time. As a result, due to the fact that Ericsson is using third party
tools such as windows sidebar gadgets, stakeholders did not believe that the dashboards were
important features for Ericsson.
10. Information Quality Scenario
A measurement system contains thousands of data points and indicators which show the current and
past situations and help stakeholders to make future estimations. Stakeholders must trust that the data
is correct in order to make their plans and estimations. Moreover, the data which is provided in the
current measurement system at Ericsson is checked in order to make sure that it is up-to-date, within
the limits so users can trust them. Almost in every report, there is an indicator which tells the
stakeholder if the data is trustable. Because Rational Insight is tested to replace the existing
measurement system, the same information quality check should be possible. For that reason, this
scenario was created. In Figure 14, the report on the left shows the information quality as green which
means the data is trustable. The right side has the details of information quality checks, if one of the
checks on the right side is red; it means that there is an error in providing the information and that the
stakeholder cannot trust the data.

45
Figure 14 – Information Quality
In this example, we checked whether the data was up-to-date and whether it was in the correct limit,
which means that a count of defects in the report should not be a negative number. Users believed that
the results from this scenario satisfied their expectations and also rational insight was capable of doing
information quality checks for data which was shown in reports or dashboards. All attendees strongly
believed that information quality was an important feature to replace existing measurement system
with a business intelligence tool and all three attendees strongly agreed that Rational Insight was
capable of checking information quality.