Fearful Faces Have a Sensory Advantage in the Competition ...
30
SENSORY ADVANTAGES OF FEAR 1 1 2 Fearful Faces Have a Sensory Advantage in the Competition for Awareness 3 4 Nicholas Hedger a , Wendy J. Adams a and Matthew Garner a,b 5 6 7 a Psychology, University of Southampton, Southampton, SO17 1BJ, UK 8 b Clinical and Experimental Sciences, Faculty of Medicine, University of Southampton, 9 Southampton, SO17 1BJ, UK 10 11 12 13 Corresponding author: Nicholas Hedger. 14 Email: [email protected] 15 Phone: +447742142858 16 Address: Psychology, University of Southampton, Southampton, SO17 1BJ, UK. 17 18 19 20 21 22 23 24 25
Transcript of Fearful Faces Have a Sensory Advantage in the Competition ...

SENSORY ADVANTAGES OF FEAR 1
1
2
Fearful Faces Have a Sensory Advantage in the Competition for Awareness 3
4
Nicholas Hedger a, Wendy J. Adams a and Matthew Garner a,b 5
6
7
a Psychology, University of Southampton, Southampton, SO17 1BJ, UK 8
b Clinical and Experimental Sciences, Faculty of Medicine, University of Southampton, 9
Southampton, SO17 1BJ, UK 10
11
12
13
Corresponding author: Nicholas Hedger. 14
Email: [email protected] 15
Phone: +447742142858 16
Address: Psychology, University of Southampton, Southampton, SO17 1BJ, UK. 17
18
19
20
21
22
23
24
25

SENSORY ADVANTAGES OF FEAR 2
Abstract 26
Only a subset of visual signals give rise to a conscious percept. Threat signals, such as fearful 27
faces, are particularly salient to human vision. Research suggests that fearful faces are 28
evaluated without awareness and preferentially promoted to conscious perception. This 29
agrees with evolutionary theories that posit a dedicated pathway specialised in processing 30
threat-relevant signals. We propose an alternative explanation for this “fear advantage”. 31
Using psychophysical data from continuous flash suppression (CFS) and masking 32
experiments, we demonstrate that awareness of facial expressions is predicted by effective 33
contrast: the relationship between their Fourier spectrum and the contrast sensitivity function. 34
Fearful faces have higher effective contrast than neutral expressions and this, not threat 35
content, predicts their enhanced access to awareness. Importantly, our findings do not support 36
the existence of a specialised mechanism that promotes threatening stimuli to awareness. 37
Rather, our data suggest that evolutionary or learned adaptations have moulded the fearful 38
expression to exploit our general-purpose sensory mechanisms. 39
40
Keywords: threat; awareness; vision; contrast 41
42
43
44
45
46
47
48
49

SENSORY ADVANTAGES OF FEAR 3
An important predictor of survival is the ability to detect threat. However, given the 50
capacity limits of our sensory systems, not all visual inputs give rise to a conscious percept - 51
many stimuli within our field of view go undetected in the competition for neural resources 52
(Dehaene & Changeux, 2011). How does a limited-capacity system selectively process those 53
inputs of most significance for survival? A widely held view is that humans have a 54
specialised, subcortical visual pathway that expedites the processing of threatening stimuli 55
(Ohman, 2005). An important component of this proposal is that this pathway is thought to 56
operate independently of conscious awareness (Tamietto & de Gelder, 2010). In the context 57
of survival, it would be advantageous if threats in the environment could influence behaviour 58
before, or without, an observer’s awareness of them. 59
Evidence that threat can be processes preconsiously, or without awareness, comes 60
from paradigms in which visual input is dissociated from awareness (Kim & Blake, 2005). In 61
backward masking, awareness of a briefly presented image is restricted by the subsequent 62
presentation of a co-located mask. Neuroimaging evidence indicates that masked fearful 63
faces can increase amygdala activity, which is indicative of emotional arousal (Whalen et al., 64
1998; Whalen et al., 2004). Behaviourally, an observer’s response to a peripheral “probe” 65
stimulus is faster when preceded by a masked fearful face than a masked neutral face 66
(Carlson & Reinke, 2008; Fox, 2002). Continuous flash suppression (CFS) is a technique in 67
which a stable image shown to one eye is suppressed from perception by a dynamic stream of 68
images presented to the other (Tsuchiya & Koch, 2005). Fearful faces break into awareness 69
from CFS more quickly than neutral faces (Sylvers, Brennan, & Lilienfeld, 2011; Yang, Zald, 70
& Blake, 2007). Together, these findings suggest that fear faces are evaluated without 71
awareness and gain prioritised access to conscious vision. Interestingly, our own meta-72
analyses show that fearful faces are the only threat stimuli to be reliably prioritised over 73
neutral stimuli across the masked visual probe, binocular rivalry and continuous flash 74

SENSORY ADVANTAGES OF FEAR 4
suppression paradigms (Hedger, Adams, & Garner, 2014). Thus, there does seem to be 75
something ‘special’ about the processing of subliminally presented fearful expressions that 76
warrants careful investigation. 77
Ecological models distinguish between two components of visual signals: content and 78
efficacy (Guilford & Dawkins, 1991). The former relates to the “message” of the signal, 79
whereas the latter relates to the efficient transmission of the signal in relation to the sensory 80
biases of an observer. It is often assumed that fearful faces are prioritised in the competition 81
for awareness due to their content, since they signal important information about potential 82
threats (Sylvers et al., 2011; Yang et al., 2007). However, fearful faces may also be 83
prioritised due to their efficacy; fast detection could be mediated by purely low-level factors, 84
such as the high contrast physical signal emanating from the eye region – i.e. the increased 85
exposure of the iris and scleral field (Lee, Susskind, & Anderson, 2013). This latter position 86
is in-line with the ‘sensory bias hypothesis’ (Horstmann & Ansorge, 2009; Horstmann & 87
Baluland, 2006) which states that human sensory systems are attuned to the low-level 88
properties of important facial expression signals. Thus, without characterising the sensory 89
properties of facial signals, we risk attributing prioritised detection to threat-sensitive 90
processes, when it may be better explained by the low-level physical salience of the 91
expression. 92
Here, we consider this dilemma. There are two possible mechanisms via which fear 93
faces, or other threat-relevant stimuli might gain prioritised access to conscious vision. First, 94
humans might have evolved specialised mechanisms that evaluate the threat content of visual 95
signals prior to their conscious registration. Second, the physical expression of fear might 96
exploit the sensory tuning of early, general-purpose visual processing. In this latter case, the 97
apparent “threat advantage” could be parsimoniously explained by sensory efficacy, without 98
the involvement of pre-conscious mechanisms sensitive to threat. 99

SENSORY ADVANTAGES OF FEAR 5
Typically, these two accounts are conflated, since the low-level characteristics of 100
facial expressions define the content of the communicated emotion (e.g. wide eyes signal 101
fear). To resolve this issue, therefore, one must experimentally dissociate a stimulus’ sensory 102
and affective properties. In the present study, we addressed this issue with a combination of 103
image analyses and behavioural data. First, we use known properties of early visual processes 104
to estimate the efficacy with which emotional expressions are received by human observers. 105
Second, we use stimulus manipulations that modulate the threat content of our images, 106
without affecting sensory efficacy. Third, we present behavioural data from CFS and 107
masking paradigms that quantify the extent to which emotional expressions gain access to 108
awareness. Lastly, we determine whether this is predicted by (i) the images’ low-level, 109
effective contrast (a quantity indifferent to threat), or (ii) their threat-content. 110
111
Image Analyses 112
Stimulus detection is influenced by low-level properties such as luminance and 113
contrast. Moreover, humans are more sensitive to contrast at certain spatial frequencies, as 114
defined by their contrast sensitivity function (De Valois & De Valois, 1990). Thus, 115
differences in detection between stimuli (e.g. fearful vs. neutral faces) that differ in these 116
low-level properties cannot be considered a valid measure of threat-related processing. The 117
contrast sensitivity function can be conceptualised as a modulation transfer function for 118
spatial contrast energy at early visual stages. Measuring the extent to which stimuli exploit 119
this sensitivity thus provides an estimate of their sensory efficacy. We asked whether fearful 120
and neutral expressions differ in the extent to which they exploit the contrast sensitivity 121
function (i.e. do they differ in “effective contrast”?). 122
Effective Contrast 123

SENSORY ADVANTAGES OF FEAR 6
We analysed the NimStim face set, a collection of face stimuli that is widely used in 124
studies of emotion recognition and is subsequently employed in our behavioural experiments. 125
The set includes 24 male and 19 female models from multiple ethnicities (Tottenham et al., 126
2009). First, we applied an opaque elliptical mask to eliminate external features before 127
equating mean luminance and root mean squared contrast (RMS) of the images (following 128
standard practice in psychophysical experiments). For our initial analyses, we mirrored the 129
average size (13.5 cm bizygomatic diameter, see Katsikitis, 2003) and a typical distance 130
(220cm) of a human face during social interactions. 131
To calculate effective contrast we followed the procedure of Baker and Graf (2009), 132
implemented in MATLAB (Mathworks). This measure of effective contrast has previously 133
been found to be a good predictor of stimulus salience in binocular rivalry competition 134
(Baker & Graf, 2009). We obtained the amplitude spectrum (contrast energy as a function of 135
spatial frequency) of each face image (figure 1a, left panel). We then fitted a second order 136
polynomial to the contrast sensitivity data set “ModelFest” (Watson & Amuhada, 2005) to 137
obtain a continuous contrast sensitivity distribution (figure 1a, middle panel, normalised to 138
the 0-1 range). By multiplying this distribution by the amplitude spectrum, we obtained 139
effective contrast as a function of spatial frequency, for each stimulus (figure 1a, right panel). 140
Summing this contrast across spatial frequency produces an overall estimate of 141
contrast energy after attenuation by the contrast sensitivity function, i.e. the image’s effective 142
contrast. Fear faces had higher effective contrast than neutral faces for 41 of the 43 models, 143
and this difference was large in magnitude (d = 0.76, 95% CI [0.31 1.21], p < .001). 144
To confirm that this finding generalised beyond this particular image set, we 145
extended our analysis to 641 images by including 4 other widely used face sets (fronto-146
parallel faces only): the Karolinska Directed Emotional Faces (KDEF: Lundqvist, Flykt, & 147
Ohman, 1998), The Radboud Faces Database (RaFD: Langer et al., 2010), The Pictures of 148

SENSORY ADVANTAGES OF FEAR 7
Facial Affect Dataset (Ekman & Friesen, 1976), The Montreal Set of Facial Displays of 149
Emotion (MSFDE: Beaupre & Hess, 2005). The sensory advantage of fear was large and 150
significant in all but the Ekman & Friesen set1 (figure 1b). The pooled effect size across face 151
sets, calculated via a random effects model, was large and significant (k=6, N= 641, d= 1.00, 152
95% CI [0.69 1.31], p < .001). Based on this pooled estimate, the “probability of superiority” 153
(Grissom & Kim, 2005), i.e. the likelihood that a randomly sampled fearful face will have a 154
sensory advantage over a randomly sampled neutral face, is 84% (95% CI [75% 90%]). 155
Stability Across Viewing Distances 156
The effective contrast differences described above are not scale-invariant; they 157
depend on the particular retinal size of the images. If our physical expression of fear is 158
optimised to be salient in everyday social contexts (Gray, Adams, Hedger, Newton, & 159
Garner, 2013) then this sensory advantage of fear should be robust over distances at which 160
humans typically socialise and communicate. To test this possibility, we extended our 161
analyses to simulated viewing distances of 50 - 500 cm. As shown in figure 1c, the sensory 162
benefit of fear is largest within interpersonal proximities that characterise human social 163
interactions (120 to 360 cm, region within dotted lines, see Argyle, 2013). 164
165
SENSORY ADVANTAGES OF FEAR 8
166
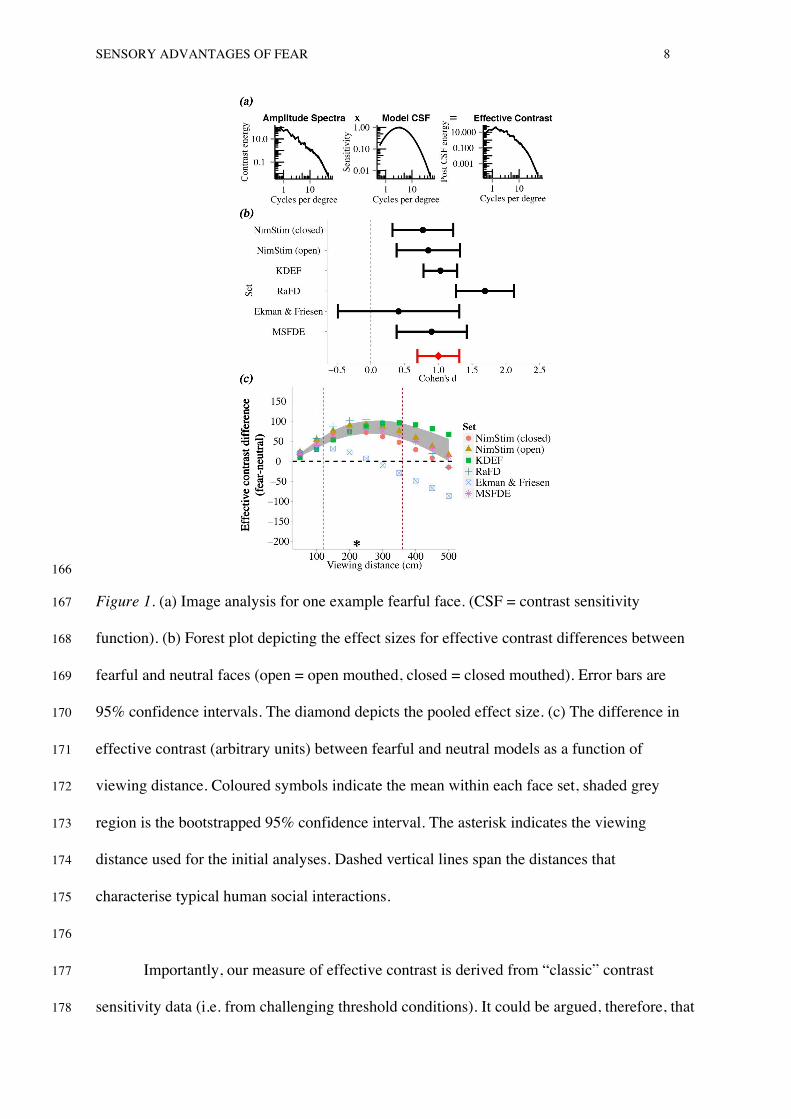
Figure 1. (a) Image analysis for one example fearful face. (CSF = contrast sensitivity 167
function). (b) Forest plot depicting the effect sizes for effective contrast differences between 168
fearful and neutral faces (open = open mouthed, closed = closed mouthed). Error bars are 169
95% confidence intervals. The diamond depicts the pooled effect size. (c) The difference in 170
effective contrast (arbitrary units) between fearful and neutral models as a function of 171
viewing distance. Coloured symbols indicate the mean within each face set, shaded grey 172
region is the bootstrapped 95% confidence interval. The asterisk indicates the viewing 173
distance used for the initial analyses. Dashed vertical lines span the distances that 174
characterise typical human social interactions. 175
176
Importantly, our measure of effective contrast is derived from “classic” contrast 177
sensitivity data (i.e. from challenging threshold conditions). It could be argued, therefore, that 178
Effe
ctiv
e co
ntra
st d
iffer
ence
(fear
-neu
tral)

SENSORY ADVANTAGES OF FEAR 9
most normal (non CFS or unmasked) viewing conditions are suprathreshold, to which the 179
shape of this threshold contrast sensitivity function may not apply. Indeed, contrast matching 180
experiments have found that perceived suprathreshold contrast is largely invariant with 181
spatial frequency (Georgeson & Sullivan, 1975). However, as De Valois and De Valois 182
(1990) note, contrast matching is not a direct sensitivity measurement and as such, one 183
cannot conclude what the suprathreshold contrast response function is for different spatial 184
frequencies. In fact, other measures, such as magnitude estimation, show that the high and 185
low frequency attenuation of the contrast sensitivity function is maintained at suprathreshold 186
levels (Cannon, 1979). It is therefore inappropriate to conceptualise the contrast sensitivity 187
function as an epiphenomenon restricted to threshold conditions. By extension, the detection 188
of stimuli in natural viewing conditions can be understood, at least to a first approximation, in 189
terms of the properties of the contrast sensitivity function. 190
Our analyses suggest that fearful expressions are optimised to excite the early visual 191
processes of proximal observers: fear faces contain greater contrast energy at the spatial 192
frequencies that humans are sensitive to, relative to neutral faces. This advantage is purely 193
sensory, and generalises across gender and race. This sensory advantage could be either 194
evolutionary or learned. 195
The case for an unconscious processing advantage for threatening stimuli is most 196
often evidenced by the prioritisation of fearful over neutral expressions. However, angry 197
faces, although also signalling threat, typically yield smaller, inconsistent effect sizes 198
(Hedger, Adams, & Garner, 2014) and have even been reported to be disadvantaged relative 199
to neutral faces in CFS paradigms (Gray, et al., 2013). Moreover, happy faces, although not 200
signalling threat, have also been found to be prioritised over neutral stimuli in detection 201
paradigms (Becker, Anderson, Mortensen ,Neufeld & Neel, 2011) and there is some evidence 202
that they are processed subliminally (Dimberg, Thunberg, & Elmehed, 2000; Schupp et al., 203

SENSORY ADVANTAGES OF FEAR 10
2004) . Given the inconsistent nature of these findings, it is important to understand whether 204
processing differences between these expressions are better explained by their sensory and 205
affective characteristics. To this end, we used CFS (Experiment 1) and masking paradigms 206
(Experiment 2) to investigate whether effective contrast can predict conscious perception of 207
fearful, angry, happy and neutral faces. 208
209
Behavioural Experiment: Access to Awareness from CFS 210
Under most viewing conditions, our two eyes receive slightly different views of the 211
world and we perceive a single “fused” percept (Howard & Rogers, 1995). However, when 212
dissimilar images are presented to our two eyes at corresponding retinal locations, conscious 213
perception alternates between the two images as their neural representations compete for 214
awareness (Blake & Logothetis, 2002)- a phenomenon termed binocular rivalry. In some 215
respects, this is a controlled phenomenon that can be used to mimic aspects of natural vision, 216
which involves selection amongst multiple sensory inputs, which are assigned to or omitted 217
from conscious perception. In CFS, a dynamic masking pattern is presented to one eye, 218
which can render a stimulus presented to the other eye invisible for seconds before it breaks 219
suppression and enters conscious awareness (Tsuchiya & Koch, 2005). The length of this 220
initial suppression has been used as an index of the unconscious salience of the supressed 221
image (the bCFS paradigm, Stein & Sterzer, 2014). Here, we use this bCFS paradigm to 222
measure the extent to which stimuli gain access to conscious perception. 223
Methods 224
We selected 4 NimStim models, on the basis of their high emotional validity (mean 225
expression recognition accuracy was 87% - see Tottenham et al., 2009), portraying fearful, 226
happy, angry and neutral expressions. Stimuli subtended 6.2 x 4.1 degrees of visual angle 227
(DVA) at the viewing distance of 60 cm on a 1280 x 1024 pixel resolution, gamma corrected 228

SENSORY ADVANTAGES OF FEAR 11
monitor. In order to decouple our images’ low-level, effective contrast from their affective 229
properties, we presented the face stimuli in two different conditions (figure 2a). Normal faces 230
were presented upright with veridical contrast polarity. Control faces were rotated 180 231
degrees with reversed contrast polarity, producing an image similar to a photographic 232
negative. Together, these manipulations severely disrupt the recognition and affective 233
evaluation of facial expressions (Gray et al., 2013). Critically, however, they do not alter 234
effective contrast 2. Thus, if the threat or valence of face images is the critical factor in 235
driving access to awareness, we would expect any threat advantage to be reduced or 236
eliminated for the control images. Conversely, if effective contrast is the key predictor for a 237
‘threat advantage’, then a similar advantage for the fear expression should be observed within 238
normal and control stimuli. 239
The trial sequence is shown in figure 2b. A central fixation cross was presented to 240
each eye via a mirror stereoscope for 1 second. Subsequently, observers viewed a CFS 241
display for 800 milliseconds, during which one eye viewed a pair of dynamic masking 242
patterns and the other viewed a face stimulus at 1.4 DVA to the left or right of fixation. Face 243
stimuli were introduced gradually by linearly increasing RMS contrast from 0-100% over the 244
800 millisecond period. Each eye’s display was framed by a random dot surround (9.5 x 11.4 245
DVA) to assist binocular alignment. Temporal frequency influences the strength of CFS 246
suppression, with mask frequencies above 10Hz exerting weaker suppression than those 247
below (Yang & Blake, 2012). We therefore used a 20Hz mask to ensure that faces broke 248
suppression on a substantial proportion of trials. After the CFS presentation, observers were 249
required to make a forced choice decision as to whether “anything other than the mask” was 250
visible during the trial. This unspeeded measure does not measure response times, or 251
recognition of the target stimulus, which are susceptible to criterion effects (Stein & Sterzer, 252
2014) 253
SENSORY ADVANTAGES OF FEAR 12
Twenty-two undergraduate students completed 256 experimental trials (4 expressions 254
(anger, happy, fear, neutral) x 2 stimulus manipulations (normal, control) x 32 repetitions), 255
balanced across face location (left or right of fixation). Our sample size provides in excess of 256
95% power to detect a large effect size (Cohen’s d= 1.15, the magnitude of difference in 257
detection between fearful vs. neutral faces from a similar CFS paradigm- Yang et al., 2007). 258
Results 259
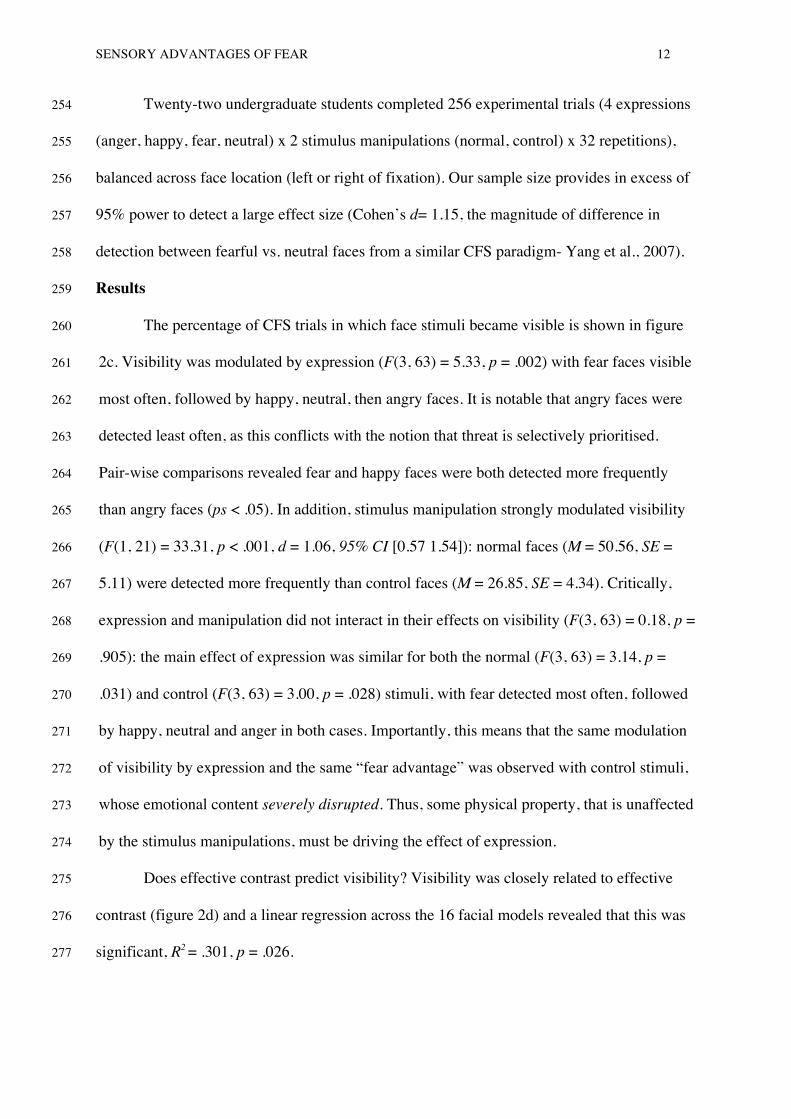
The percentage of CFS trials in which face stimuli became visible is shown in figure 260
2c. Visibility was modulated by expression (F(3, 63) = 5.33, p = .002) with fear faces visible 261
most often, followed by happy, neutral, then angry faces. It is notable that angry faces were 262
detected least often, as this conflicts with the notion that threat is selectively prioritised. 263
Pair-wise comparisons revealed fear and happy faces were both detected more frequently 264
than angry faces (ps < .05). In addition, stimulus manipulation strongly modulated visibility 265
(F(1, 21) = 33.31, p < .001, d = 1.06, 95% CI [0.57 1.54]): normal faces (M = 50.56, SE = 266
5.11) were detected more frequently than control faces (M = 26.85, SE = 4.34). Critically, 267
expression and manipulation did not interact in their effects on visibility (F(3, 63) = 0.18, p = 268
.905): the main effect of expression was similar for both the normal (F(3, 63) = 3.14, p = 269
.031) and control (F(3, 63) = 3.00, p = .028) stimuli, with fear detected most often, followed 270
by happy, neutral and anger in both cases. Importantly, this means that the same modulation 271
of visibility by expression and the same “fear advantage” was observed with control stimuli, 272
whose emotional content severely disrupted. Thus, some physical property, that is unaffected 273
by the stimulus manipulations, must be driving the effect of expression. 274
Does effective contrast predict visibility? Visibility was closely related to effective 275
contrast (figure 2d) and a linear regression across the 16 facial models revealed that this was 276
significant, R2 = .301, p = .026. 277
SENSORY ADVANTAGES OF FEAR 13
Importantly, however, the main effect of stimulus manipulation (normal vs. control) 278
cannot be explained by low-level properties, as the two stimulus categories have equivalent 279
effective contrast. The mechanisms that govern visual awareness may therefore discriminate 280
faces from non-faces (Stein, Sterzer, & Peelen, 2012), but we found no evidence that emotion 281
or threat had an effect on detection beyond that explained by basic low-level variability 282
between expressions. 283
284
285
286 Figure 2. Experiment 1. (a) Examples of normal and control stimuli. (b) Schematic of CFS 287
trial sequence. (c) Stimulus visibility in the CFS task, as a function of expression and 288
stimulus manipulation. Error bars are ±1 SEM. (d) Stimulus visibility as a function of 289
effective contrast, collapsed across manipulation, shaded region is ±1 SEM. 290
291
Behavioural Experiment 2: Access to Awareness from Visual Masking 292
The bCFS paradigm has been widely used to investigate the competition for visual 293
awareness. However, we might question whether this represents a naturalistic example of 294
how stimuli compete for awareness; binocular rivalry is infrequently encountered in daily life 295
Vis
ibil
ity (
%)
Stimulus
(800 ms)
Response
Fixation (1sec)Normal
stimulus
Control
stimulus
Normal
Fear
Vis
ibil
ity (
%)
Anger Happy
Neutral
Anything
other
than mask
visible?
Control

SENSORY ADVANTAGES OF FEAR 14
(Arnold, 2011). In contrast, backward masking involves conditions more typical of everyday 296
vision; observers frequently encounter brief glimpses of stimuli when sampling dynamic 297
scenes via saccades and fixations. In our second experiment, therefore, we investigated 298
whether effective contrast can predict the detection of briefly presented, masked facial 299
expressions. In addition, we asked observers to provide affective ratings of the face stimuli, 300
allowing us to assess the contributions of (i) low-level contrast and (ii) affective factors in 301
stimulus detection. 302
Method 303
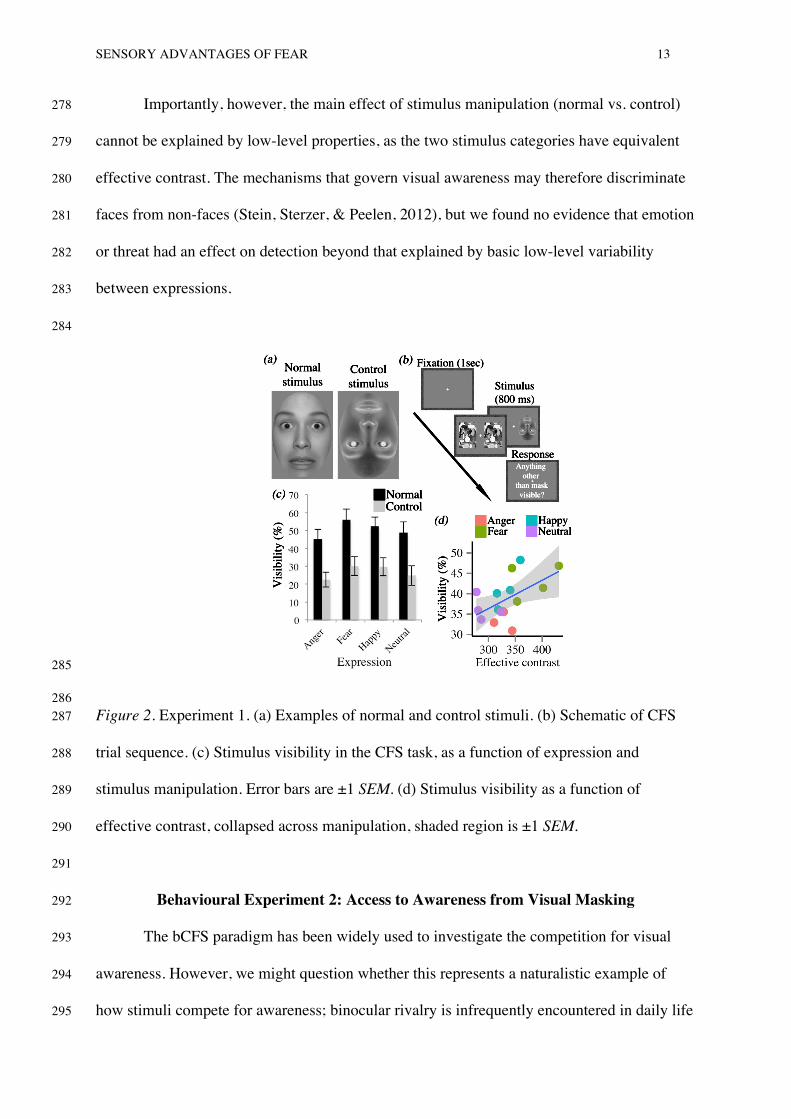
Figure 3 shows the masking paradigm. At the beginning of each trial, observers 304
viewed the fixation cross for one second. Next, two masks were presented either side of 305
fixation for 200 ms, followed by a target (intact) and non-target (block-scrambled) face for a 306
variable duration (13.3, 26.6, 40, 53.3, 66.7, 80, 93.3, 106.7 or 120ms). Subsequently, two 307
new mask stimuli were presented for 200ms, immediately following the face presentation. 308
Participants were asked to indicate, as accurately as possible, whether the intact face had 309
appeared to the left or right of fixation. 310
311
312
Figure 3. Schematic of trial sequence in the masking task. 313
314
Response (until response)Backward Mask (200 ms)
StimulusForward Mask (200 ms)
targetscramble
SOA (13.3, 26.6, 39.9, 53.2, 66.5, 79.8, 93.1,
106.4 or 119.7ms)

SENSORY ADVANTAGES OF FEAR 15
All stimulus dimensions matched those in Experiment 1. The scrambled face matched 315
the amplitude spectrum averaged across all target face stimuli, ensuring the target could not 316
be localised via non-specific differences in luminance or contrast between the two sides of 317
the display. Mask stimuli also matched the averaged spectral slope of all face stimuli. This 318
prevented interactions between the spatial frequency profile of the target and mask from 319
influencing detection. 320
An independent sample of 11 participants completed 1152 randomly ordered trials (4 321
expressions (anger, fear, happy, neutral) x 2 stimulus manipulations (normal, control) x 9 322
stimulus onset asynchronies (SOAs: 13.3, 26.6, 40, 53.3, 66.7, 80, 93.3, 106.7 or 120ms) x 16 323
repetitions), balanced across the location of the face stimulus (left, right). Our sample size 324
provided in excess of 95% power to detect the same target effect size as defined for 325
experiment 1. 326
Observers also completed a Self-Assessment Manikin (SAM) to evaluate face stimuli 327
on the three dimensions of emotional assessment: valence, arousal and dominance (see 328
Bradley & Lang, 1994). On each trial, observers initiated face presentation, which was 329
displayed (unmasked) for 120ms (maximum SOA in the masking task). Valence, arousal and 330
dominance ratings (1-9 scale) were made in separate blocks, consisting of 32 randomly 331
ordered trials. 332
Results 333
Following standard practice, valence and arousal ratings are summarised in “affective 334
space” (figure 4a). For normal faces, the distribution of stimuli follows the expected 335
“boomerang” shape (Bradley, Codispoti, Cuthbert, & Lang, 2001) with higher arousal levels 336
reported for stimuli with large positive or negative valence. However, no such pattern is 337
visible for the control stimuli. A cluster analyses confirms this – the distribution of normal 338
stimuli is optimally explained (as determined by Bayesian Information Criterion) by a 3 339

SENSORY ADVANTAGES OF FEAR 16
cluster model that clearly differentiates between the positive (happy) negative (fear, anger) 340
and neutral (neutral) expressions. In contrast, the distribution of control stimuli is optimally 341
explained by a one-cluster model; expressions are not differentiated in affective space. This, 342
consistent with previous work (Gray et al., 2013) confirms that our stimulus manipulations of 343
spatial and contrast inversion severely disrupt the emotional evaluation of facial expressions. 344
It is possible that increasing statistical power may detect residual discrimination (Reingold & 345
Merikle, 1988). Nonetheless, it is clear from figure 4a that control stimuli elicit a 346
qualitatively different pattern of affective evaluations from observers. Thus, if affective 347
dimensions are important, this difference should be expected to alter the effect of expression 348
on detection for control stimuli relative to normal stimuli. 349
Figure 4b displays the 2AFC performance accuracy from the masking task. Data were 350
fitted with cumulative normal distributions free to vary in position and slope. Detection 351
thresholds were estimated from these fits for 75% correct performance (upper binomial 352
limit). Thresholds were significantly and substantially modulated by stimulus manipulation, 353
with observers requiring longer SOAs to detect control faces than normal faces (normal: M = 354
60.6 ms, control: M= 84.6 ms, t(10) =10.7, p < .001, d = 2.54, 95% CI [1.38 3.69]). Notably, 355
these detection thresholds occur at much briefer stimulus exposures than those at which 356
observers made affective judgements in the SAM task (120 ms). Thus, discrimination of 357
expressions would have been even poorer under conditions that are sufficient for any fear 358
advantage. Similarly to Experiment 1 there was a main effect of expression on detection in 359
both the normal (F(3, 30) = 9.95, p<.001) and control conditions (F(3, 30) = 9.22, p < .001). 360
This effect was again similar in the two conditions, with no interaction between expression 361
and stimulus manipulation (F (3, 30) = 1.15, p = .345). In other words, although spatial and 362
contrast inversion inhibited emotional recognition of the control stimuli, this did not affect 363
the ‘fear advantage’ for detection. Normal and control fearful faces were detected at shorter 364

SENSORY ADVANTAGES OF FEAR 17
SOAs than both neutral and angry faces (ps <. 05, pairwise comparisons). Figure 4c 365
illustrates the relationship between effective contrast and detection threshold, for all stimuli. 366
Effective contrast was a similarly good predictor of detection thresholds in both the normal 367
(R2 = 0.36, p = .014) and control (R2 = 0.41, p = .004) configurations. 368
369
370
Figure 4. (a) Distribution of stimuli in affective space, according to valence and arousal 371
ratings. Valence is normalised to a -4 to +4 range such that 0 indicates neutral. Symbol colour 372
represents facial expression, symbol shape represents clusters obtained via Bayes criteria (i.e. 373
normal = 3 clusters, control = 1 cluster). (b) The proportion of correct face localisation 374
responses is plotted as a function of SOA and expression, with cumulative normal fits. The 375
ControlNormal

SENSORY ADVANTAGES OF FEAR 18
dashed red lines indicate the mean thresholds for normal and control stimuli (c) Detection 376
threshold as a function of effective contrast. Shaded region indicates ±1 SEM. 377
378
Interestingly, adding expression as a second predictor significantly increased the 379
variance explained by this regression model. However, as we have discussed, it is important 380
not to conflate ‘expression’ (which is a physical signal) with ‘emotion’ (which implies an 381
affective evaluation of the signal). Thus, the fact that expression adds to the model fit simply 382
means that effective contrast cannot entirely account for the effect of expression; it does not, 383
in itself, entail the influence of emotion sensitive processes. 384
To strengthen this conviction, we performed regression analyses with valence, arousal 385
and dominance as predictors of thresholds. For both the normal and control configurations, 386
none of these variables significantly predicted detection thresholds (all ps >.05). Notably, the 387
same was true when these affective ratings were used as predictors of the bCFS visibility data 388
from Experiment 1. Moreover, tests for zero partial association revealed that the relationship 389
between effective contrast and detection thresholds remained significant after controlling for 390
the influence of these variables (normal: t(11) = -2.57, p = .026, control: t(11) = -3.47, p = 391
.005). In summary, we found that low-level effective contrast predicts stimulus visibility, but 392
found no evidence for any influence of emotion sensitive processes. 393
394
Local Image Analyses 395
Our data establish that global differences in effective contrast can predict the 396
prioritisation of faces in the competition for awareness. However, we can refine our analyses 397
further to ask whether this is driven by particular image regions. These regions were defined 398
by symmetric Gaussian windows whose size and standard deviation (2 DVA, 0.5 DVA 399
respectively) matched the stimuli used to derive the Modelfest data (Watson & Amuhada, 400

SENSORY ADVANTAGES OF FEAR 19
2005). These windows were applied to 130 uniformly distributed, overlapping locations 401
within each image and effective contrast was calculated for each region. The relative (z 402
scored) effective contrast, averaged across the models used in our experiments is shown in 403
figure 5. Consistent with previous suggestions (Gray et al., 2013; Lee et al., 2013) it is clear 404
that the eye region is highly salient within all expressions, but particularly so for fear faces. 405
This can be attributed to the increased exposure of the white scleral field and dark iris. These 406
features are unique amongst primates and probably co-evolved with human social 407
communication to enhance detectability of gaze (Kobayashi & Kohshima, 1997). Expressing 408
fear amplifies this sensory benefit by increasing the vertical dimension of the scleral field. 409
410
411
Figure 5. Local variations in effective contrast. Image colour/luminance represents the Z-412
scored effective contrast. 413
414
Discussion 415
Shaped by sociobiological pressures, human signals are designed to reliably convey 416
information to observers. In the context of threat, a sender may express fear to warn others of 417
danger, or to signal appeasement. However, before a signal can be acted upon, it must be 418
detected. Theories of enhanced signal function by design (Dukas, 1998) thus predict that the 419
facial expression of fear would converge on a form that exploits the sensory processes of a 420
proximal observer. By analysing the Fourier content of faces in the context of human 421
interactions, we found that facial expressions differ in the extent to which they stimulate low-422
level visual processes. This mechanism, effective contrast, provides a parsimonious 423
Z sc
ore

SENSORY ADVANTAGES OF FEAR 20
explanation for the prioritisation of fearful faces in the competition for awareness, across 424
rather different paradigms: CFS and masking. Critically, this ‘threat advantage’ was 425
independent of perceived emotion; it was unchanged for stimuli with the same effective 426
contrast, but altered emotional content. Moreover, face detection was not predicted by 427
observers’ affective ratings. Our data are inconsistent with the notion that the threat value of 428
fear faces is evaluated outside of awareness and determines access to conscious vision. 429
Instead, our data suggest that access is determined by the tuning of very early visual 430
processes, i.e. the contrast sensitivity function. 431
Previous work has speculated that the prioritised detection of threat relevant stimuli 432
(including fearful faces) may be linked to simple, low-level stimulus properties (Bar, & Neta, 433
2006; Coelho, Cloete, & Wallis, 2010; Gray et al., 2013; Stein & Sterzer, 2012; Lee et al., 434
2013; Yang et al., 2007). However, these studies have not quantified these properties with 435
respect to underlying human sensory processes. Moreover, to our knowledge, our study is the 436
first to explicitly quantify both sensory (effective contrast) and affective properties (SAM) of 437
facial expressions as predictors in a detection paradigm. We found that low-level sensory 438
properties were by far the best predictor of stimulus detection and found no evidence that 439
detection was modulated by threat-sensitive processes. The data thus suggest that the fear 440
advantage is most parsimoniously explained by low-level properties of the fear expression, 441
negating the need to invoke the role of threat, or emotion sensitive processes. 442
Detectability is unlikely to be the only factor that has shaped the fear expression. 443
Expressing fear enhances the expresser’s field of view, eye movement velocity and nasal 444
airflow- linking it to functional advantages in the context of threat (Susskind et al., 2008). 445
Fear may also enhance the expresser’s stimulus detection by shaping how light is cast onto 446
their retina (Lee, Mirza, Flanagan, & Anderson, 2014). In other words, the expression of fear 447

SENSORY ADVANTAGES OF FEAR 21
appears to be adaptive for both senders and receivers, in terms of efficient transmission and 448
reception of visual information. 449
We observed a robust “face advantage” in both experiments. Normal faces were better 450
detected than control faces, despite being equivalent in effective contrast. This suggests that 451
the visual system is sensitive to stimuli that are specifically face-like, and this sensitivity is 452
not yoked to awareness of the stimuli. It has been found in bCFS studies that stimulus 453
inversion has a detrimental effect on the detection of human faces but no effect on detection 454
of chimpanzee faces (Stein, et al., 2012). This suggests that pre-conscious visual processes 455
selectively promote stimuli that resemble conspecific faces to conscious perception, 456
presumably because of their social relevance. However, our data suggest that this sensitivity 457
does not extend to facial emotion; emotional expression had no effect on stimulus detection 458
beyond that explained by low-level image properties. 459
How can we reconcile a robust face advantage with the absence of emotion-sensitive 460
processes? Determining whether a stimulus is a face represents a coarser-level judgement 461
than identifying its emotional expression. Visual masking studies have shown that identifying 462
a specific object requires substantially more processing time than identifying its general 463
category, whilst determining an object’s category co-occurs with its detection (Grill-Spector 464
& Kanwisher, 2005). The present data are thus consistent with a framework in which the 465
detection and categorisation of faces (i.e. face vs. non face), but not the evaluation of facial 466
expression, is performed at an early processing stage by the same perceptual mechanisms. In 467
contrast, the data are poorly explained by models suggesting that emotional evaluation 468
precedes and drives face detection (Palermo & Rhodes, 2007). 469
It is important to consider well-documented phenomena that appear to conflict with 470
our “low-level” account of the fear advantage. One relevant example is that anxious 471
populations exhibit enhanced processing of fear faces, which is commonly attributed to 472

SENSORY ADVANTAGES OF FEAR 22
dysfunction in threat-sensitive mechanisms that operate without awareness (Bar Haim, Lamy, 473
Pergamin, Bakermans-Kranenberg, & van IJzendoorn, 2007). However, differences in 474
perceptual selection observed in anxious populations are not limited to threat relevant 475
contexts. For instance, anxiety is associated with enhanced attentional capture by 476
perceptually salient neutral stimuli (Moser, Becker, & Moran, 2012, Moran & Moser, 2014). 477
Correspondingly, enhanced biases for fear faces in anxious populations could be a function of 478
either the perceptual or emotional properties of the stimuli. Thus, processing differences 479
displayed by anxious populations may not be inconsistent with our account. 480
Another interesting phenomenon is that eye gaze direction can modulate detection of 481
fearful faces, such that averted fearful gazes are prioritised over directed fearful gazes 482
(Milders, Hietan, Leppanen, & Braun, 2011). This makes good ecological sense in terms of 483
perceived threat, since the presence of an unknown threat in the environment (averted gaze) 484
may be more dangerous than a threat directly from the target (directed gaze). Importantly, 485
however, Chen and Yeh (2012) found directly contradictory results using schematic faces, in 486
which low-level variability is reduced. In a bCFS paradigm, Chen and Yeh found that 487
schematic fearful faces with directed gaze were detected faster than those with averted gaze. 488
Notably, the removal of the salient eye white in schematic stimuli also resulted in a lack of an 489
overall “fear advantage” for detection. These opposing findings, likely due to simple physical 490
variations between the particular stimulus sets employed, pose problems for accounts that 491
posit specialised threat detection mechanisms as the cause of processing biases (see Becker, 492
Anderson, Mortenson, Neufield, & Neel, 2011 for a related discussion). 493
Several studies have observed differential amygdala responses to fearful and neutral 494
faces rendered invisible by masking and CFS (Jiang & He, 2006; Whalen et al., 2004), which 495
has been interpreted as evidence that fearful faces are evaluated without awareness via a 496
pathway involving the amygdala. However, whether this neural activity is linked to adaptive 497

SENSORY ADVANTAGES OF FEAR 23
changes in perception is hard to determine without convergent behavioural measures. 498
Importantly, patients with amygdala lesions nonetheless show prioritised detection of fear in 499
bCFS and visual search tasks (Piech et al., 2010; Tsuchiya, Moradi, Felsen, Yamakazi, & 500
Adolphs, 2009). Moreover, recent work using a CFS paradigm suggests that attentional 501
orienting to threat stimuli may be dependent on their conscious detection (Hedger, Adams, & 502
Garner, in press). Whether amygdala activity to unconsciously presented threat stimuli (in 503
response to either low-level or affective properties) has a functional role in promoting their 504
detection, therefore, remains an interesting question. 505
How do our data fit with suggestions that processing of threatening stimuli is driven 506
by evaluation of content in the low spatial frequencies? ((Mermillod, Droit-Volet, Devaux, 507
Schaefer, & Vermeulen, 2010; Willenbockel, Leopre, Nguyen, Bouthillier, & Gosselin, 508
2012). Such observations are thought to support the notion that coarse, rapid, magnocellular 509
input to the amygdala is sufficient for the evaluation and subsequent detection of threat 510
stimuli (Tamietto & de Gelder, 2010). Importantly, human contrast sensitivity is greater for 511
low spatial frequencies, meaning that they are weighted more heavily in our effective contrast 512
calculations. Thus, our data also suggest that low spatial frequencies are important, but that 513
this relates to the distribution of contrast at these spatial scales, rather than the evaluation of 514
the content at these scales. 515
In summary, our data suggest that, through evolutionary or learned adaptations, 516
fearful faces are optimised to stimulate human sensory biases. This mechanism may provide 517
a parsimonious explanation of the “fear advantage” in the competition for awareness that 518
negates the need to invoke preconscious processes sensitive to threat. 519
520
521
522

SENSORY ADVANTAGES OF FEAR 24
References 523
Argyle, M. (2013). Bodily Communication. London: Routledge. 524
Arnold, D. H. (2011). Why is binocular rivalry uncommon? Discrepant monocular images in 525
the real world. Frontiers in Human Neuroscience, 5. doi:10.3389/fnhum.2011.00116 526
Baker, D. H., & Graf, E. W. (2009). Natural images dominate in binocular rivalry. 527
Proceedings of the National Academy of Sciences, 106, 5436–5441. 528
doi:10.1073/pnas.0812860106 529
Bar-Haim, Y., Lamy, D., Pergamin, L., Bakermans-Kranenburg, M. J., & van IJzendoorn, M. 530
H. (2007). Threat-related attentional bias in anxious and nonanxious individuals: A 531
meta-analytic study. Psychological Bulletin, 133, 1–24. doi:10.1037/0033-532
2909.133.1.1 533
Bar, M., & Neta, M. (2006). Humans prefer curved visual objects. Psychological Science, 17, 534
645–648. doi:10.1111/j.1467-9280.2006.01759.x 535
Beaupré, M. G., & Hess, U. (2005). Cross-cultural emotion recognition among Canadian 536
ethnic groups. Journal of Cross-Cultural Psychology, 36, 355–370. 537
doi:10.1177/0022022104273656 538
Becker, D. V., Anderson, U. S., Mortensen, C. R., Neufeld, S. L., & Neel, R. (2011). The face 539
in the crowd effect unconfounded: Happy faces, not angry faces, are more efficiently 540
detected in single- and multiple-target visual search tasks. Journal of Experimental 541
Psychology: General, 140, 637–659. doi:10.1037/a0024060 542
Blake, R., & Logothetis, N. K. (2002). Visual competition. Nature Reviews. Neuroscience, 3, 543
13–21. doi:10.1038/nrn701 544
Bradley, M. M., Codispoti, M., Cuthbert, B. N., & Lang, P. J. (2001). Emotion and motivation 545
I: Defensive and appetitive reactions in picture processing. Emotion, 1, 276–298. 546
doi:10.1037/1528-3542.1.3.276 547

SENSORY ADVANTAGES OF FEAR 25
Bradley, M. M., & Lang, P. J. (1994). Measuring emotion: the Self-Assessment Manikin and 548
the Semantic Differential. Journal of Behavior Therapy and Experimental Psychiatry, 549
25, 49–59. 550
Cannon, M.W. (1979). Contrast sensation: A linear function of stimulus contrast. Vision 551
Research, 19, 1045-1052 552
Carlson, J. M., Reinke, K. S., & Habib, R. (2009). A left amygdala mediated network for rapid 553
orienting to masked fearful faces. Neuropsychologia, 47, 1386–1389. 554
doi:10.1016/j.neuropsychologia.2009.01.026 555
Chen, Y.C., & Yeh, S.-L. (2012). Look into my eyes and I will see you: unconscious 556
processing of human gaze. Consciousness and Cognition, 21, 1703–1710. 557
doi:10.1016/j.concog.2012.10.001 558
Coelho, C. M., Cloete, S., & Wallis, G. (2010). The face-in-the-crowd effect: when angry faces 559
are just cross(es). Journal of Vision, 10, 1–14. doi:10.1167/10.1.7 560
Dehaene, S., & Changeux, J.-P. (2011). Experimental and theoretical approaches to conscious 561
processing. Neuron, 70, 200–227. doi:10.1016/j.neuron.2011.03.018 562
De Valois, K.K. (1977). Spatial frequency adaptation can enhance contrast sensitivity. Vision 563
Research, 17, 1057-1065. 564
De Valois, R.L., & De Valois, K.K. (1990). Spatial vision. New York: Oxford University 565
Press. 566
Dukas, R. (1998). Cognitive Ecology: The Evolutionary Ecology of Information Processing 567
and Decision Making. Chicago: University of Chicago. 568
Ekman, P., & Friesen, W. V. (1976). Pictures of facial affect. Palo Alto, CA; Consulting 569
Psychologists. 570

SENSORY ADVANTAGES OF FEAR 26
Fox, E. (2002). Processing emotional facial expressions: The role of anxiety and awareness. 571
Cognitive, Affective & Behavioral Neuroscience, 2, 52–63. 572
Georgeson, M.A., & Sullivan, G.D. (1975). Contrast constancy: Deblurring in human vision by 573
spatial frequency channels. Journal of Physiology, 252, 627-656. 574
Gray, K. L. H., Adams, W. J., Hedger, N., Newton, K. E., & Garner, M. (2013). Faces and 575
awareness: low-level, not emotional factors determine perceptual dominance. 576
Emotion, 13, 537–544. doi:10.1037/a0031403 577
Grill-Spector, K., & Kanwisher, N. (2005). Visual recognition: As soon as you know it is 578
there, you know what it is. Psychological Science, 16, 152–160. doi:10.1111/j.0956-579
7976.2005.00796.x 580
Grissom., & Kim. (2005). Effect sizes for research: A broad practical approach. New York, 581
NY: Holt, Reinhart, & Winston. 582
Guilford, T., & Dawkins, M. S. (1991). Receiver psychology and the evolution of animal 583
signals. Animal Behaviour, 42, 1–14. doi:10.1016/S0003-3472(05)80600-1 584
Haun, A. M., & Peli, E. (2013). Perceived contrast in complex images. Journal of Vision, 13. 585
doi:10.1167/13.13.3 586
Hedger, N., Adams, W. J., & Garner, M. (2014). Fearful facial expressions are salient to early 587
visual processes: evidence from effective contrast analyses and continuous flash 588
suppression. Journal of Vision, 14, 1387–1387. http://doi.org/10.1167/14.10.1387 589
Hedger, N., Adams, W. J., & Garner, M. (in press). Autonomic arousal and attentional 590
orienting to visual threat are predicted by awareness. Journal of Experimental 591
Psychology: Human Perception and Performance. 592
Howard, I. P., & Rogers, B. J. (1996). Binocular Vision and Stereopsis. New York: Oxford 593
University Press. 594

SENSORY ADVANTAGES OF FEAR 27
Jiang, Y., & He, S. (2006). Cortical responses to invisible faces: dissociating subsystems for 595
facial-information processing. Current Biology, 16, 2023–2029. 596
doi:10.1016/j.cub.2006.08.084 597
Katsikitis, M. (2003). The Human Face: Measurement and Meaning. Dordecht: Kluwer. 598
Kim, C.Y., & Blake, R. (2005). Psychophysical magic: rendering the visible “invisible.” 599
Trends in Cognitive Sciences, 9, 381–388. doi:10.1016/j.tics.2005.06.012 600
Kobayashi, H., & Kohshima, S. (1997). Unique morphology of the human eye. Nature, 387, 601
767–768. doi:10.1038/42842 602
Langner, O., Dotsch, R., Bijlstra, G., Wigboldus, D. H. J., Hawk, S.T., & van Knippenberg, A. 603
(2010). Presentation and validation of the Radboud Faces Database. Cognition & 604
Emotion, 24, 1377—1388. doi: 10.1080/02699930903485076 605
Lee, D. H., Mirza, R., Flanagan, J. G., & Anderson, A. K. (2014). Optical origins of opposing 606
facial expression actions. Psychological Science, 0956797613514451. 607
doi:10.1177/0956797613514451 608
Lee, D. H., Susskind, J. M., & Anderson, A. K. (2013). Social transmission of the sensory 609
benefits of eye widening in fear expressions. Psychological Science, 24, 957–965. 610
Lundqvist, D., Flykt, A., & Öhman, A. (1998). The Karolinska Directed Emotional Faces 611
(KDEF). Stockholm: Karolinska Institute 612
Milders, M., Hietanen, J. K., Leppänen, J. M., & Braun, M. (2011). Detection of emotional 613
faces is modulated by the direction of eye gaze. Emotion, 11, 1456–1461. 614
doi:10.1037/a0022901 615
Moran, T. P., & Moser, J. S. (2015). The color of anxiety: Neurobehavioral evidence for 616
distraction by perceptually salient stimuli in anxiety. Cognitive, Affective & 617
Behavioral Neuroscience, 15, 169–179. http://doi.org/10.3758/s13415-014-0314-7 618

SENSORY ADVANTAGES OF FEAR 28
Moser, J. S., Becker, M. W., & Moran, T. P. (2012). Enhanced attentional capture in trait 619
anxiety. Emotion 12, 213–216. doi:10.1037/a0026156 620
Öhman, A. (2005). The role of the amygdala in human fear: Automatic detection of threat. 621
Psychoneuroendocrinology, 30, 953–958. doi:10.1016/j.psyneuen.2005.03.019 622
Palermo, R., & Rhodes, G. (2007). Are you always on my mind? A review of how face 623
perception and attention interact. Neuropsychologia, 45, 75–92. 624
doi:10.1016/j.neuropsychologia.2006.04.025 625
Piech, R. M., McHugo, M., Smith, S. D., Dukic, M. S., Meer, J. V. D., Abou-Khalil, B., & 626
Zald, D. H. (2010). Fear-enhanced visual search persists after amygdala lesions. 627
Neuropsychologia, 48, 3430–3435. doi:10.1016/j.neuropsychologia.2010.07.009 628
Stein, T., & Sterzer, P. (2012). Not just another face in the crowd: Detecting emotional 629
schematic faces during continuous flash suppression. Emotion, 12, 988–996. 630
doi:10.1037/a0026944 631
Stein, T., & Sterzer, P. (2014). Unconscious processing under interocular suppression: getting 632
the right measure. Frontiers in Psychology, 5, 387. doi:10.3389/fpsyg.2014.00387 633
Stein, T., Sterzer, P., & Peelen, M. V. (2012). Privileged detection of conspecifics: evidence 634
from inversion effects during continuous flash suppression. Cognition, 125, 64–79. 635
doi:10.1016/j.cognition.2012.06.005 636
Susskind, J. M., Lee, D. H., Cusi, A., Feiman, R., Grabski, W., & Anderson, A. K. (2008). 637
Expressing fear enhances sensory acquisition. Nature Neuroscience, 11, 843–850. 638
doi:10.1038/nn.2138 639
Sylvers, P. D., Brennan, P. A., & Lilienfeld, S. O. (2011). Psychopathic traits and preattentive 640
threat processing in children: A novel test of the fearlessness hypothesis. 641
Psychological Science, 22, 1280-1287. doi:10.1177/0956797611420730 642
SENSORY ADVANTAGES OF FEAR 29
Tamietto, M., & de Gelder, B. (2010). Neural bases of the non-conscious perception of 643
emotional signals. Nature Reviews Neuroscience, 11, 697–709. doi:10.1038/nrn2889 644
Tottenham, N., Tanaka, J. W., Leon, A. C., McCarry, T., Nurse, M., Hare, T. A., … Nelson, C. 645
(2009). The NimStim set of facial expressions: Judgments from untrained research 646
participants. Psychiatry Research, 168, 242–249. doi:10.1016/j.psychres.2008.05.006 647
Tsuchiya, N., & Koch, C. (2005). Continuous flash suppression reduces negative afterimages. 648
Nature Neuroscience, 8, 1096–1101. doi:10.1038/nn1500 649
Tsuchiya, N., Moradi, F., Felsen, C., Yamazaki, M., & Adolphs, R. (2009). Intact rapid 650
detection of fearful faces in the absence of the amygdala. Nature Neuroscience, 12, 651
1224–1225. doi:10.1038/nn.2380 652
Watson, A. B., & Ahumada, A. J. (2005). A standard model for foveal detection of spatial 653
contrast. Journal of Vision, 5, 6. doi:10.1167/5.9.6 654
Whalen, P. J., Kagan, J., Cook, R. G., Davis, F. C., Kim, H., Polis, S., … Johnstone, T. (2004). 655
Human amygdala responsivity to masked fearful eye whites. Science, 306, 2061–656
2061. doi:10.1126/science.1103617 657
Whalen, P. J., Rauch, S. L., Etcoff, N. L., McInerney, S. C., Lee, M. B., & Jenike, M. A. 658
(1998). Masked presentations of emotional facial expressions modulate amygdala 659
activity without explicit knowledge. The Journal of Neuroscience, 18, 411–418. 660
Yang, E., Zald, D. H., & Blake, R. (2007). Fearful expressions gain preferential access to 661
awareness during continuous flash suppression. Emotion, 7, 882–886. 662
doi:10.1037/1528-3542.7.4.882 663
Yang, E., & Blake, R. (2012). Deconstructing continuous flash suppression. Journal of Vision, 664
12, 8. doi:10.1167/12.3.8 665
666
667

SENSORY ADVANTAGES OF FEAR 30
Footnotes 668
1This outlying result may be attributed to the low control of head orientation, lighting 669
and lower image resolution compared to other, more recent sets. Moreover i) the effect is 670
directionally consistent and ii) statistical power is lower, given the significantly smaller 671
number of images in the Ekman set. Thus, this discrepancy should not greatly impact on the 672
interpretation of our main findings. 673
2 Perceived contrast is affected more by low than high luminances (Haun & Peli, 674
2013). All normal faces had luminance histograms that were negatively skewed (third 675
moment: M=-0.10, SD=0.21). Thus, luminance profile reversal may have marginally 676
increased the perceived contrast of control faces, relative to normal faces (which is in 677
contrast to their decreased detection). Therefore, the effect of stimulus type (normal v control 678
detection) cannot be explained by changes in the skew/ luminance histogram. Importantly, all 679
relationships between effective contrast and detection remained significant after controlling 680
for skew. 681
682
683