FE TRENDS - assets.publishing.service.gov.uk · Its aim is to give a broad overview of trends in FE...
32
FE TRENDS PUBLISHED 10 TH DECEMBER 2014
Transcript of FE TRENDS - assets.publishing.service.gov.uk · Its aim is to give a broad overview of trends in FE...

FE TRENDS
PUBLISHED 10TH
DECEMBER 2014
2
3

4
Contents
Contents ........................................................................................................................................ 4
FE Trends ...................................................................................................................................... 6
Summary .................................................................................................................................... 6
What is FE .................................................................................................................................. 6
Shape of FE sector ................................................................................................................. 6
How FE has evolved ............................................................................................................. 10
Apprenticeships ................................................................................................................. 10
Community Learning .......................................................................................................... 15
Supporting the Justice System ........................................................................................... 16
Employer Ownership Pilot (EOP) ....................................................................................... 16
24+ Advanced Learning Loans........................................................................................... 17
Traineeships ...................................................................................................................... 17
English and maths ............................................................................................................. 17
Who is FE Supporting ............................................................................................................... 19
Equality & Diversity ............................................................................................................... 19
Local Provision ...................................................................................................................... 20
Further Education and Benefit Claims ................................................................................... 20
NEET .................................................................................................................................... 21
What are the benefits? .............................................................................................................. 23
Outcomes .............................................................................................................................. 23
Achievements .................................................................................................................... 23
Ofsted grades .................................................................................................................... 23
Success Rates ................................................................................................................... 25
Learner and Employer Satisfaction .................................................................................... 25

5
Impact ................................................................................................................................... 26
Highest Level of Qualification in the Population.................................................................. 26
Success Measures ............................................................................................................. 28
Benefits to the individual ................................................................................................. 30
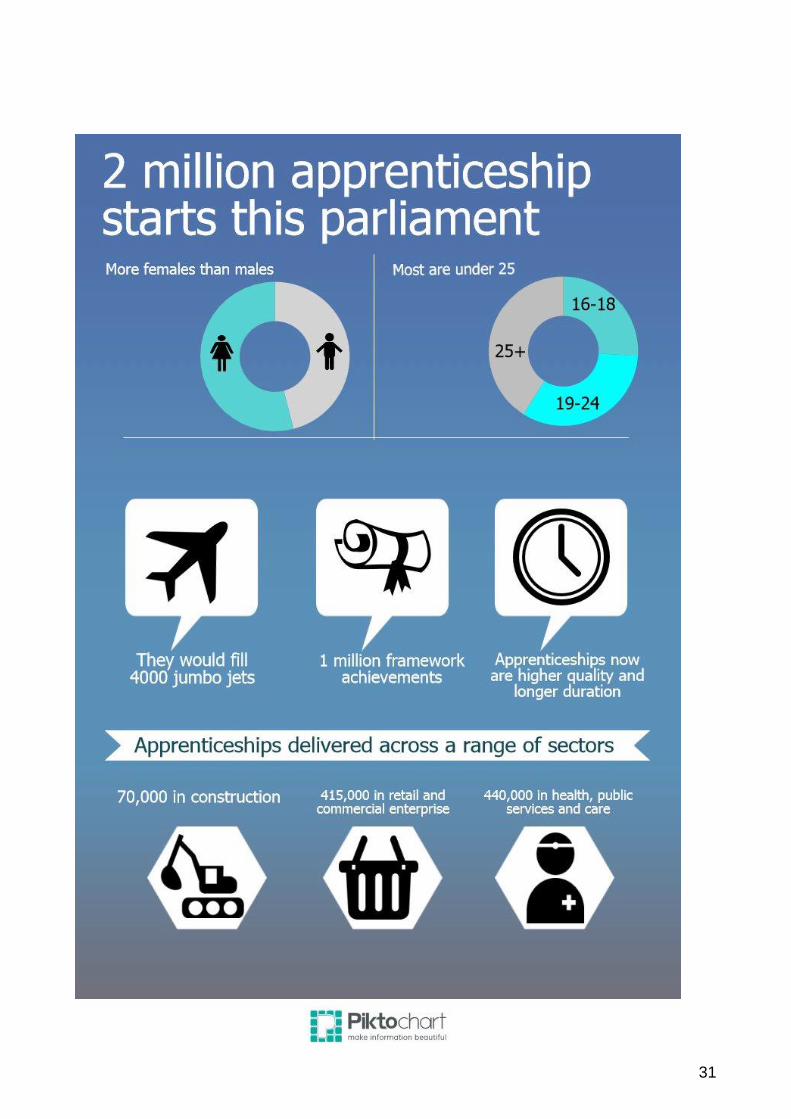
Apprenticeship Starts this Parliament infographic ................................................................. 30
6
FE Trends
Summary
1. This document provides summary information on current adult (19+) government-funded further education (excluding schools and Higher Education) and all age apprenticeships and traineeships in England. It also provides trends between 2008/09 and 2013/14. Its aim is to give a broad overview of trends in FE provision over recent years, the characteristics of learners and their outcomes from learning1.
What is FE
Shape of FE sector
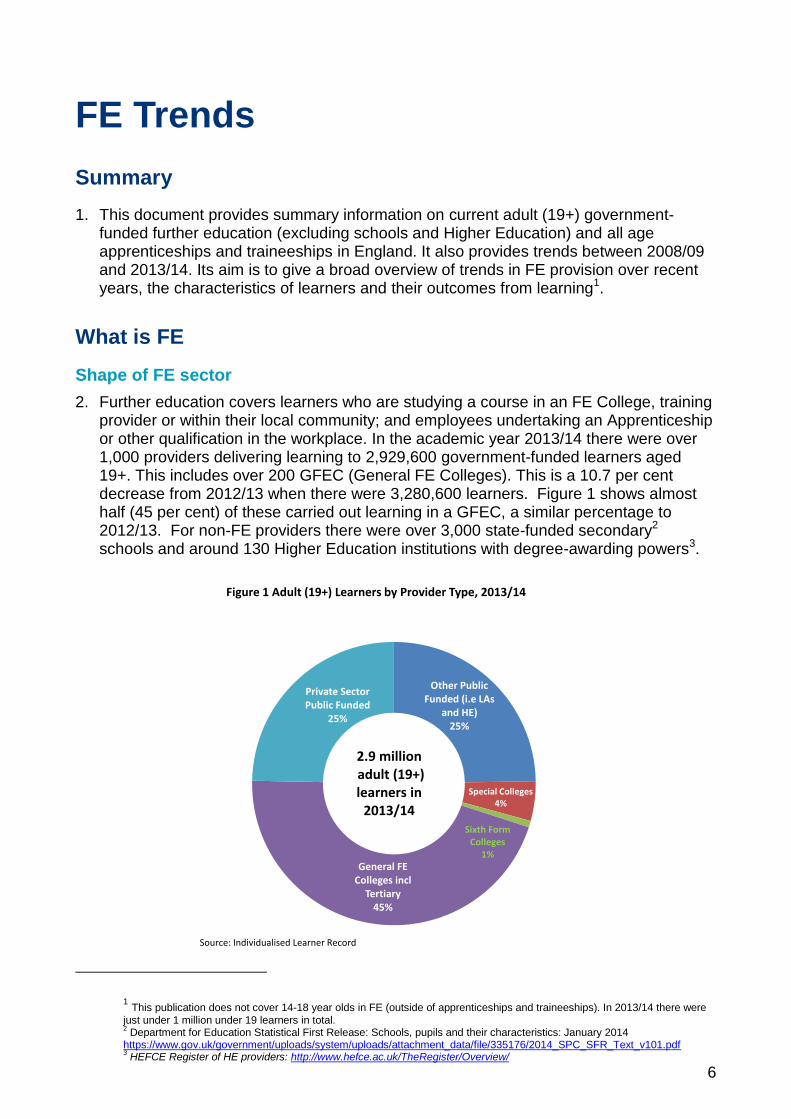
2. Further education covers learners who are studying a course in an FE College, training provider or within their local community; and employees undertaking an Apprenticeship or other qualification in the workplace. In the academic year 2013/14 there were over 1,000 providers delivering learning to 2,929,600 government-funded learners aged 19+. This includes over 200 GFEC (General FE Colleges). This is a 10.7 per cent decrease from 2012/13 when there were 3,280,600 learners. Figure 1 shows almost half (45 per cent) of these carried out learning in a GFEC, a similar percentage to 2012/13. For non-FE providers there were over 3,000 state-funded secondary2 schools and around 130 Higher Education institutions with degree-awarding powers3.
Other Public Funded (i.e LAs
and HE)25%
Special Colleges 4%
Sixth Form Colleges
1%General FE
Colleges incl Tertiary
45%
Private Sector Public Funded
25%
Figure 1 Adult (19+) Learners by Provider Type, 2013/14
2.9 millionadult (19+)learners in
2013/14
Source: Individualised Learner Record
1 This publication does not cover 14-18 year olds in FE (outside of apprenticeships and traineeships). In 2013/14 there were
just under 1 million under 19 learners in total. 2 Department for Education Statistical First Release: Schools, pupils and their characteristics: January 2014
https://www.gov.uk/government/uploads/system/uploads/attachment_data/file/335176/2014_SPC_SFR_Text_v101.pdf 3 HEFCE Register of HE providers: http://www.hefce.ac.uk/TheRegister/Overview/
7
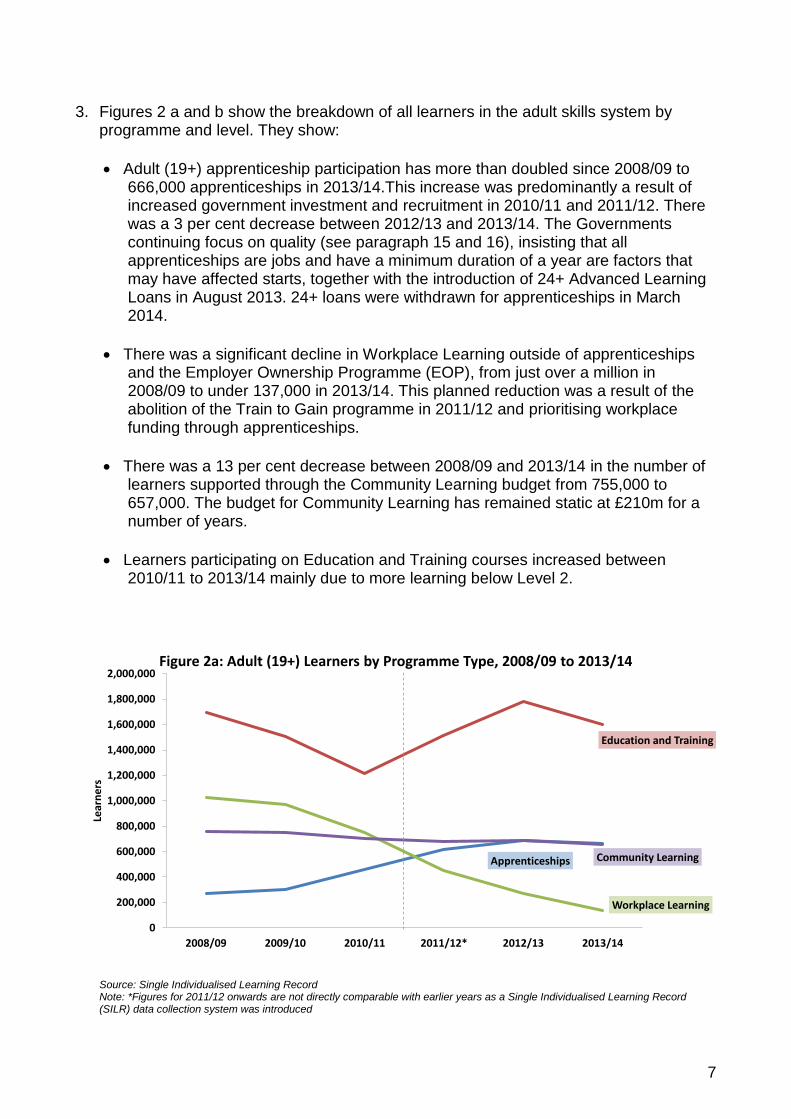
3. Figures 2 a and b show the breakdown of all learners in the adult skills system by programme and level. They show:
Adult (19+) apprenticeship participation has more than doubled since 2008/09 to 666,000 apprenticeships in 2013/14.This increase was predominantly a result of increased government investment and recruitment in 2010/11 and 2011/12. There was a 3 per cent decrease between 2012/13 and 2013/14. The Governments continuing focus on quality (see paragraph 15 and 16), insisting that all apprenticeships are jobs and have a minimum duration of a year are factors that may have affected starts, together with the introduction of 24+ Advanced Learning Loans in August 2013. 24+ loans were withdrawn for apprenticeships in March 2014.
There was a significant decline in Workplace Learning outside of apprenticeships and the Employer Ownership Programme (EOP), from just over a million in 2008/09 to under 137,000 in 2013/14. This planned reduction was a result of the abolition of the Train to Gain programme in 2011/12 and prioritising workplace funding through apprenticeships.
There was a 13 per cent decrease between 2008/09 and 2013/14 in the number of learners supported through the Community Learning budget from 755,000 to 657,000. The budget for Community Learning has remained static at £210m for a number of years.
Learners participating on Education and Training courses increased between 2010/11 to 2013/14 mainly due to more learning below Level 2.
Apprenticeships
Education and Training
Workplace Learning
Community Learning
0
200,000
400,000
600,000
800,000
1,000,000
1,200,000
1,400,000
1,600,000
1,800,000
2,000,000
2008/09 2009/10 2010/11 2011/12* 2012/13 2013/14
Lear
ner
s
Figure 2a: Adult (19+) Learners by Programme Type, 2008/09 to 2013/14
Source: Single Individualised Learning Record Note: *Figures for 2011/12 onwards are not directly comparable with earlier years as a Single Individualised Learning Record (SILR) data collection system was introduced
8
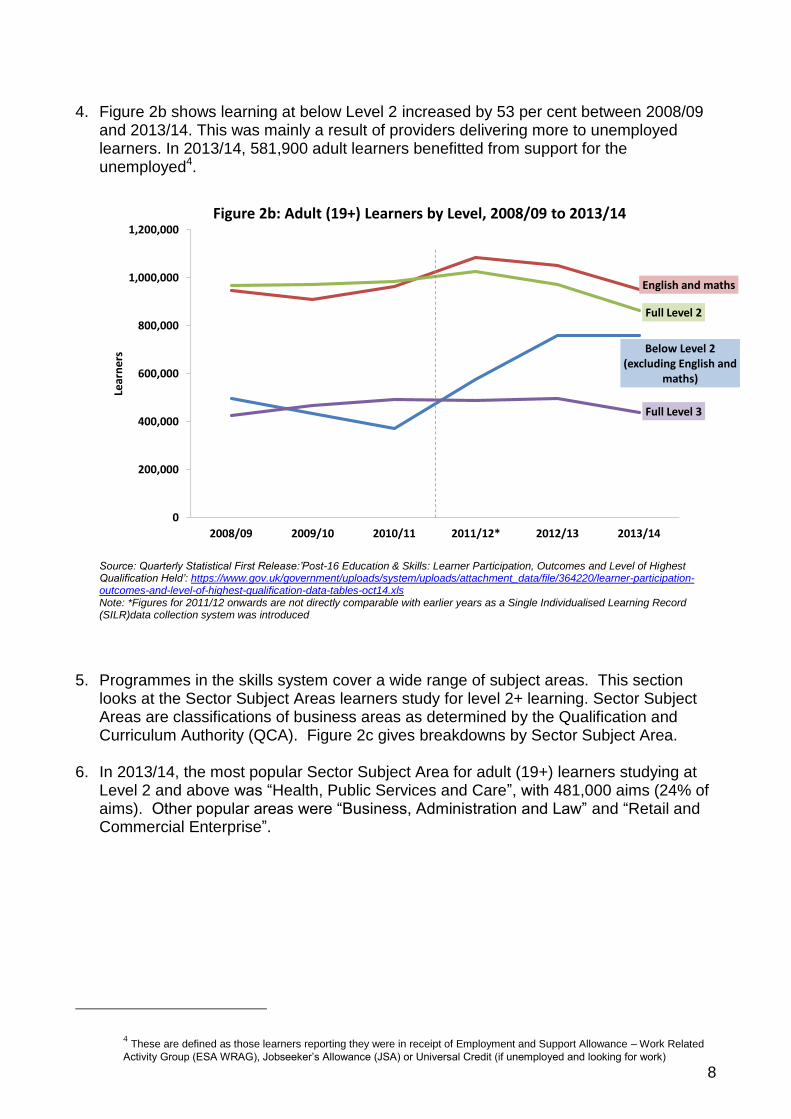
4. Figure 2b shows learning at below Level 2 increased by 53 per cent between 2008/09 and 2013/14. This was mainly a result of providers delivering more to unemployed learners. In 2013/14, 581,900 adult learners benefitted from support for the unemployed4.
Below Level 2 (excluding English and
maths)
English and maths
Full Level 2
Full Level 3
0
200,000
400,000
600,000
800,000
1,000,000
1,200,000
2008/09 2009/10 2010/11 2011/12* 2012/13 2013/14
Lear
ne
rs
Figure 2b: Adult (19+) Learners by Level, 2008/09 to 2013/14
Source: Quarterly Statistical First Release:’Post-16 Education & Skills: Learner Participation, Outcomes and Level of Highest Qualification Held’: https://www.gov.uk/government/uploads/system/uploads/attachment_data/file/364220/learner-participation-outcomes-and-level-of-highest-qualification-data-tables-oct14.xls Note: *Figures for 2011/12 onwards are not directly comparable with earlier years as a Single Individualised Learning Record (SILR)data collection system was introduced
5. Programmes in the skills system cover a wide range of subject areas. This section
looks at the Sector Subject Areas learners study for level 2+ learning. Sector Subject Areas are classifications of business areas as determined by the Qualification and Curriculum Authority (QCA). Figure 2c gives breakdowns by Sector Subject Area.
6. In 2013/14, the most popular Sector Subject Area for adult (19+) learners studying at
Level 2 and above was “Health, Public Services and Care”, with 481,000 aims (24% of aims). Other popular areas were “Business, Administration and Law” and “Retail and Commercial Enterprise”.
4 These are defined as those learners reporting they were in receipt of Employment and Support Allowance – Work Related
Activity Group (ESA WRAG), Jobseeker’s Allowance (JSA) or Universal Credit (if unemployed and looking for work)

9
0%
10%
20%
30%
40%
50%
60%
70%
80%
90%
100%
2008/09 2009/10 2010/11 2011/12* 2012/13 2013/14
Academic Year
Figure 2c: Adult (19+) Enrolments by Sector Subject Area, Level 2+ 2008/09 to 2013/14
Business, Administration and Law
Retail and Commercial Enterprise
Preparation for Life and Work
Engineering and Manufacturing Technologies
Other
Health, Public Services and Care
Source: Individualised Learner Record
Notes:
1. 'Other' includes Construction, Planning and the Built Environment, ICT, Leisure, Travel and Tourism, Science and Mathematics, Education and Training, Arts, Media and Publishing, Languages, Literature and Culture, Agriculture, Horticulture and Animal Care, History, Philosophy and Theology and Social Science; 2.*Figures for 2011/12 onwards are not directly comparable with earlier years as a Single Individualised Learning Record (SILR) data collection system was introduced

10
How FE has evolved
Apprenticeships
Participation
7. Figure 3 shows that all age apprenticeship participation has more than doubled since
2008/09 to 851,500 apprenticeships in 2013/14. Of these there were:
504,000 Intermediate Level Apprentices, compared to 274,000 in 2008/09 and 502,000 in 2012/13;
352,000 Advanced Level Apprentices, compared to 171,000 in 2008/09 and 377,000 in 2012/13;
18,000 Higher Apprentices, compared to 300 in 2008/09 and 13,000 in 2012/13.
8. Advanced Level apprenticeships and those aged 25+ participating on apprenticeships have been affected by the introduction of 24+ advanced learning loans which saw a reduced demand for apprenticeship starts. Loans have now been withdrawn for apprenticeships since March 2014.
9. There were 241,000 workplaces employing Apprentices in 2013/14 compared to 229,000 in 2012/13.
0
50,000
100,000
150,000
200,000
250,000
300,000
350,000
400,000
450,000
2008/09 2009/10 2010/11 2011/12* 2012/13 2013/14
Fun
ded
Ap
pre
nti
ces
Academic Year
Figure 3: Government-funded Apprenticeship Participation by Age, 2008/09 to 2013/14
Under 19
25+
19-24
Source: Quarterly Statistical First Release:’Post-16 Education & Skills: Learner Participation, Outcomes and Level of Highest Qualification Held’: https://www.gov.uk/government/uploads/system/uploads/attachment_data/file/364220/learner-participation-outcomes-and-level-of-highest-qualification-data-tables-oct14.xls Note: *Figures for 2011/12 onwards are not directly comparable with earlier years as a Single Individualised Learning Record (SILR) data collection system was introduced
11
Starts
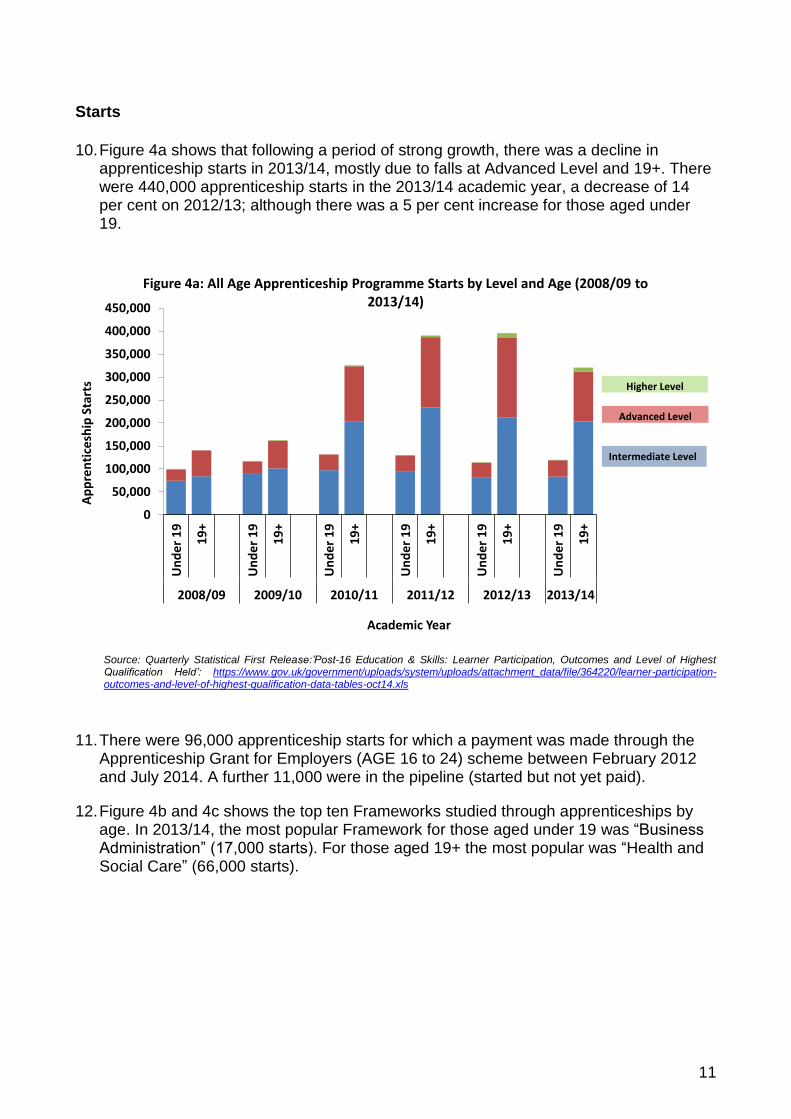
10. Figure 4a shows that following a period of strong growth, there was a decline in apprenticeship starts in 2013/14, mostly due to falls at Advanced Level and 19+. There were 440,000 apprenticeship starts in the 2013/14 academic year, a decrease of 14 per cent on 2012/13; although there was a 5 per cent increase for those aged under 19.
0
50,000
100,000
150,000
200,000
250,000
300,000
350,000
400,000
450,000
Un
de
r 1
9
19
+
Un
de
r 1
9
19
+
Un
de
r 1
9
19
+
Un
de
r 1
9
19
+
Un
de
r 1
9
19
+
Un
de
r 1
9
19
+2008/09 2009/10 2010/11 2011/12 2012/13 2013/14
Ap
pre
nti
cesh
ip S
tart
s
Academic Year
Figure 4a: All Age Apprenticeship Programme Starts by Level and Age (2008/09 to 2013/14)
Intermediate Level
Higher Level
Advanced Level
Source: Quarterly Statistical First Release:’Post-16 Education & Skills: Learner Participation, Outcomes and Level of Highest Qualification Held’: https://www.gov.uk/government/uploads/system/uploads/attachment_data/file/364220/learner-participation-outcomes-and-level-of-highest-qualification-data-tables-oct14.xls
11. There were 96,000 apprenticeship starts for which a payment was made through the Apprenticeship Grant for Employers (AGE 16 to 24) scheme between February 2012 and July 2014. A further 11,000 were in the pipeline (started but not yet paid).
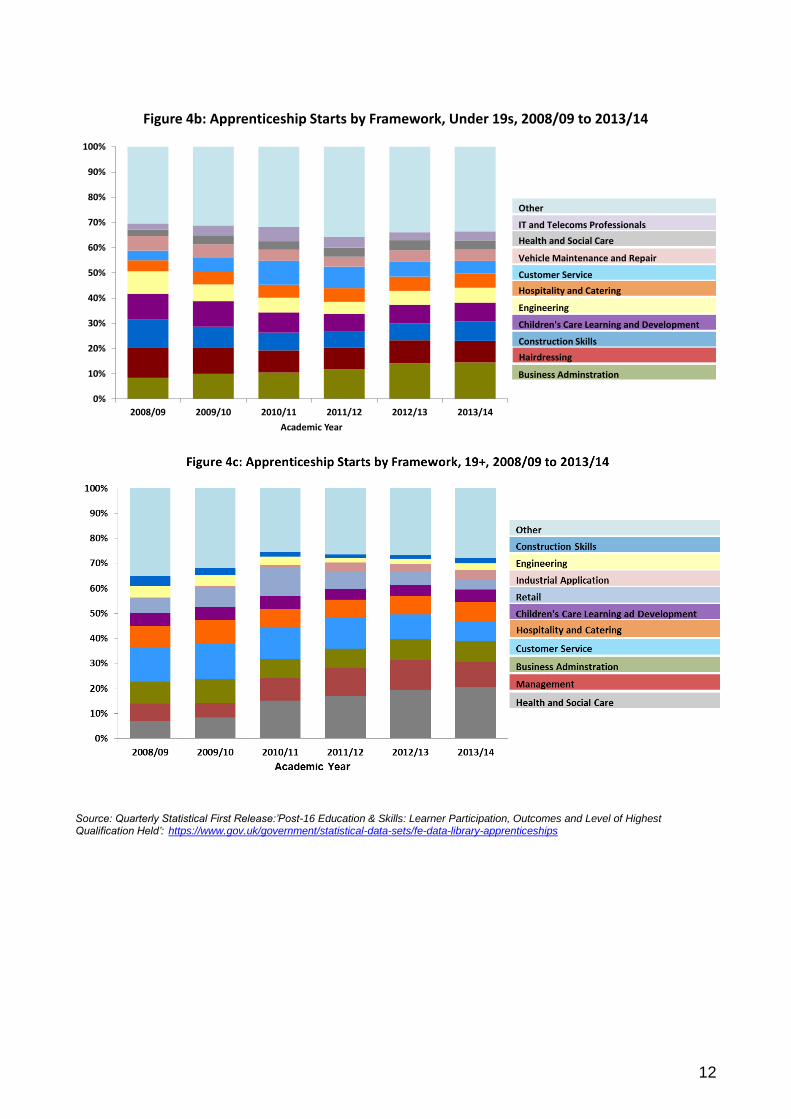
12. Figure 4b and 4c shows the top ten Frameworks studied through apprenticeships by age. In 2013/14, the most popular Framework for those aged under 19 was “Business Administration” (17,000 starts). For those aged 19+ the most popular was “Health and Social Care” (66,000 starts).
12
0%
10%
20%
30%
40%
50%
60%
70%
80%
90%
100%
2008/09 2009/10 2010/11 2011/12 2012/13 2013/14
Academic Year
Figure 4b: Apprenticeship Starts by Framework, Under 19s, 2008/09 to 2013/14
Children's Care Learning and Development
Business Adminstration
Hairdressing
IT and Telecoms Professionals
Health and Social Care
Vehicle Maintenance and Repair
Customer Service
Hospitality and Catering
Engineering
Construction Skills
Other
Source: Quarterly Statistical First Release:’Post-16 Education & Skills: Learner Participation, Outcomes and Level of Highest Qualification Held’: https://www.gov.uk/government/statistical-data-sets/fe-data-library-apprenticeships
Source: Quarterly Statistical First Release:’Post-16 Education & Skills: Learner Participation, Outcomes and Level of Highest Qualification Held’: https://www.gov.uk/government/statistical-data-sets/fe-data-library-apprenticeships

13
Apprenticeship starts this parliament
13. There have been 2 million apprenticeship starts this parliament (see page 31). Figures 5a, b and c show apprenticeship starts this parliament so far (May 2010 to July 2014). Of the 2 million apprenticeship starts, over half a million were started by those aged under 19 and around 1.5 million were started by those aged 19 and over.

14
Quality
14. The Government has a strong focus on increasing the quality of apprenticeships - ensuring that all apprenticeships are jobs, with a minimum duration of at least a year, that they include off the job training and meet the needs of employers. Based on the planned end date, the number of apprenticeship starts with a planned length of stay of fewer than 12 months decreased sharply by 83.2 per cent between 2011/12 and 2012/13, from 316,000 to 34,000 and remained low at 36,000 in 2013/14.
15. Figure 6 shows the trends in the number of apprenticeship starts that we could deem "full apprenticeships" - those that have a planned length of stay of 12 months or more and excluding former programme-led apprenticeships. Since 2008/09 the overall number of these "full apprenticeship" starts has increased by over 250,000.
Programme-led
Fewer than 12 months planned length of stay
12 months or more (excl. programme-led)
0
100,000
200,000
300,000
400,000
500,000
2008/09 2009/10 2010/11 2011/12 2012/13 2013/14
Star
ts
Academic Year
Figure 6: All Age Apprenticeship Starts by planned length of stay, 2008/09 to 2013/14
Source: Individualised Learner Record. https://www.gov.uk/government/statistical-data-sets/fe-data-library-other-statistics-and-research

15
Community Learning
16. Figure 7 shows that the number of learners participating on Community Learning courses in 2013/14 decreased by 13 per cent from 755,000 in 2008/09 to 657,000 after a small rise the previous year.
Source: Quarterly Statistical First Release:’Post-16 Education & Skills: Learner Participation, Outcomes and Level of Highest Qualification Held’: https://www.gov.uk/government/uploads/system/uploads/attachment_data/file/364220/learner-participation-outcomes-and-level-of-highest-qualification-data-tables-oct14.xls Note: *Figures for 2011/12 onwards are not directly comparable with earlier years as a Single Individualised Learning Record (SILR) data collection system was introduced

16
Supporting the Justice System
17. Figure 8 shows the number of learners engaged in education and training whilst in custody increased by 6 per cent from 89,000 in 2012/13 to 95,000 in 2013/14 after a broadly flat level of participation over the preceding three years. Of these 38,000 participated in English and maths, an increase of 9 per cent compared to 2012/13 (34,000). These offenders were funded via the Offenders’ Learning and Skills Service (OLASS) budget.
0
20,000
40,000
60,000
80,000
100,000
120,000
2010/11 2011/12* 2012/13 2013/14
Lear
ne
rs
Academic Year
Figure 8: Offender Learning Participation by Type (2010/11 to 2013/14)
All Offender Learners
of which English and maths
Source: Quarterly Statistical First Release:’Post-16 Education & Skills: Learner Participation, Outcomes and Level of Highest Qualification Held’: https://www.gov.uk/government/uploads/system/uploads/attachment_data/file/364220/learner-participation-outcomes-and-level-of-highest-qualification-data-tables-oct14.xls Note: *Figures for 2011/12 onwards are not directly comparable with earlier years as a Single Individualised Learning Record (SILR) data collection system was introduced
Employer Ownership Pilot (EOP)
18. The Employer Ownership Pilot offers all employers in England direct access to up to £340 million of public investment over the period of the pilot (up to 2015/16) to design and deliver their own training solutions. For further information see: https://www.gov.uk/government/publications/employer-ownership-of-skills-pilot
19. The EOP started delivering to learners part way through 2012/13. There has been a steady increase in the number of EOP starts as more projects progress and mature.
20. There were 38,000 Employer Ownership Pilot starts between August 2012 and July 2014. Of these there were:
3,000 Employer Ownership Pilot starts by those aged under 19;
7,000 Employer Ownership Pilot starts by those aged 19–24;
27,000 Employer Ownership Pilot starts by those aged 25 and over;
4,000 apprenticeship starts.

17
24+ Advanced Learning Loans
21. 24+ Advanced Learning Loans were introduced for further education courses commencing on or after 1 August 2013 and delivered in England. Initially, any learner who was aged 24 or older on the first day of their course and studying at Level 3 or 4 or on advanced or higher apprenticeships could apply for a loan to help fund the fees / course costs. However, as it soon became clear that 24+ loans were not the preferred funding route for employers and prospective apprentices, on 7th March 2014 regulations came into force to remove apprenticeships from the scope of the 24+ loans programme.
22. In 2013/14 there were 59,000 learners with a 24+ Advanced Learning Loan. Of these there were:
56,000 learners with a 24+ Advanced Learning Loan participating at Level 3;
3,000 learners with a 24+ Advanced Learning Loan participating at Level 4+.
Traineeships
23. The Government is rebalancing investment in skills, focussing funding on young people, those with English and maths skills below Level 2 and the unemployed. As part of this approach, traineeships were introduced in the 2013/14 academic year to provide young people with essential work preparation, English, maths and work experience to secure an apprenticeship or other work.
24. In 2013/14 there were over 10,000 traineeship starts. Of these there were:
7,000 traineeships aged under 19;
3,000 traineeships aged 19-23.
English and maths
25. English and maths skills are essential in enabling people to function in society and progress in learning and employment. The charts in this sub-section provide information on English and maths and English for Speakers of Other Languages (ESOL) provision carried out across the skills system.
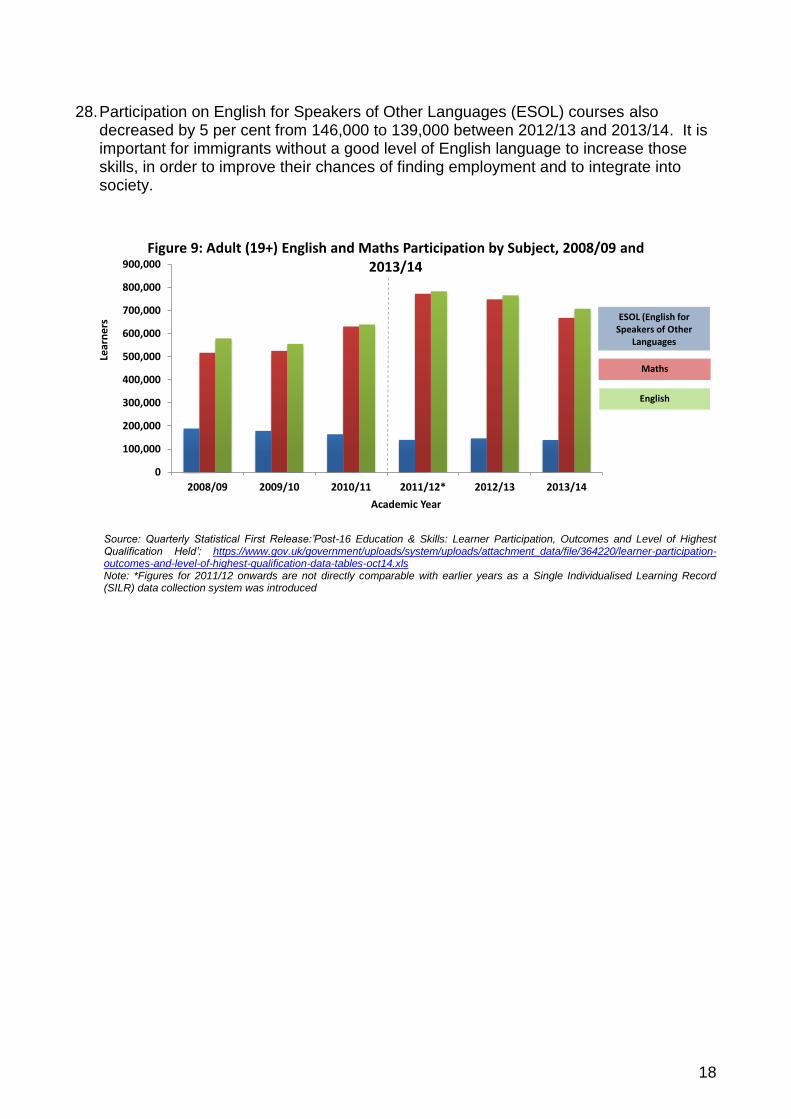
26. Many learners participate in more than one English and maths course. In 2013/14 the number of learners aged 19 and over participating in English and maths (including ESOL) was 952,000, down 9 per cent from over 1 million in 2012/13. Participation on English courses and maths courses both fell (down by 8 per cent and 11 per cent respectively) for the second year running following a two-year period of substantial growth. The reductions are not totally unexpected and are a result of the removal of Adult Basic Skills (ABS) certificates at Levels 1 and 2.
27. This reduction is from classroom delivery rather than apprenticeships. Entitlements have been maintained to fully fund English and maths provision up to and including Level 2 for all adults, regardless of their employment status, because of the importance of these skills to success in life and work.
18
28. Participation on English for Speakers of Other Languages (ESOL) courses also decreased by 5 per cent from 146,000 to 139,000 between 2012/13 and 2013/14. It is important for immigrants without a good level of English language to increase those skills, in order to improve their chances of finding employment and to integrate into society.
0
100,000
200,000
300,000
400,000
500,000
600,000
700,000
800,000
900,000
2008/09 2009/10 2010/11 2011/12* 2012/13 2013/14
Lear
ner
s
Academic Year
Figure 9: Adult (19+) English and Maths Participation by Subject, 2008/09 and 2013/14
ESOL (English for Speakers of Other
Languages
Maths
English
Source: Quarterly Statistical First Release:’Post-16 Education & Skills: Learner Participation, Outcomes and Level of Highest Qualification Held’: https://www.gov.uk/government/uploads/system/uploads/attachment_data/file/364220/learner-participation-outcomes-and-level-of-highest-qualification-data-tables-oct14.xls Note: *Figures for 2011/12 onwards are not directly comparable with earlier years as a Single Individualised Learning Record (SILR) data collection system was introduced

19
Who is FE Supporting
Equality & Diversity
29. The Government believes that a commitment to equality and diversity is critical to ensuring that we are able to deliver on BIS priorities, as well as the Government’s wider goals. Tackling inequality at an early age through education is vital to achieving a fairer and more equal society. As well as helping young people fresh out of the compulsory education system continue into Further Education, BIS funds learners across all ages and social economic backgrounds to achieve their full potential and become more qualified.
30. In 2013/14 around 19 per cent of adult learners participating in the skills system identified themselves as being from a Black, Asian or Minority Ethnic (BAME) group. This compares to around 13 per cent who identify themselves as BAME in the 19-64 year old English population.
31. The proportion of learners with learning difficulties and/or disabilities was around 15 per cent whilst 57 per cent of all adult learners in the skills system were female.
32. Offender learners have a very low proportion of female learners (around 8 per cent), although this is higher than the proportion of females in the general prison population5 (around 5 per cent).
15%
8%
6%
18%
8%
23%
20%
19%
11%
18%
24%
20%
25%
19%
13%
57%
56%
36%
54%
85%
8%
45%
51%
0% 10% 20% 30% 40% 50% 60% 70% 80% 90%
Total FE and Skills
Apprenticeships
Workplace Learning
Education and Training
Community Learning
Offender Learning
Traineeships
Adult (19-64) EnglishPopulation
Proportion of Learners
Figure 10: Adult (19+) Equality and Diversity in the Skills System, 2013/14
Female
Black, Asian or MinorityEthnic Groups (BAME)
Learners with LearningDifficulties and/or Disabilities(LLDD)
Source: Individualised Learner Record and ONS, Quarter 4 Labour Force Survey, ages 19 to 64, England Note: There is no England comparison for Learners with Learning Difficulties and/or Disabilities
5 https://www.gov.uk/government/statistics/offender-management-statistics-quarterly-april-to-june-2013MOJ

20
Local Provision
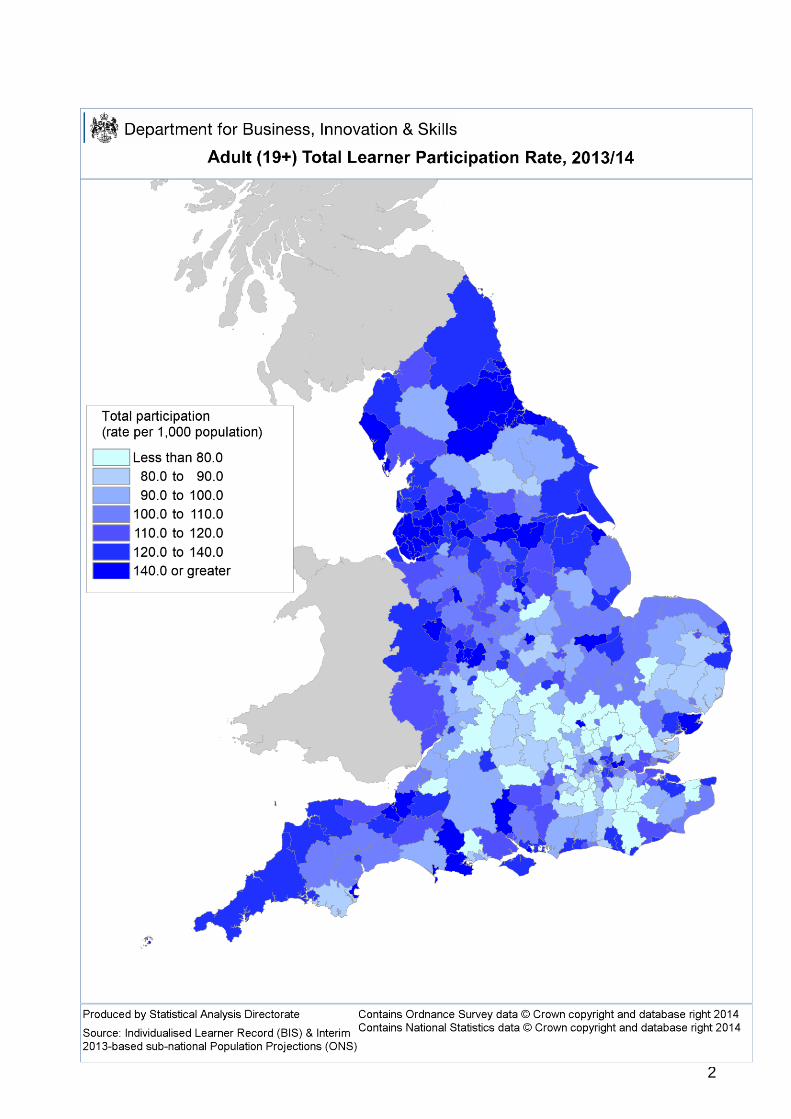
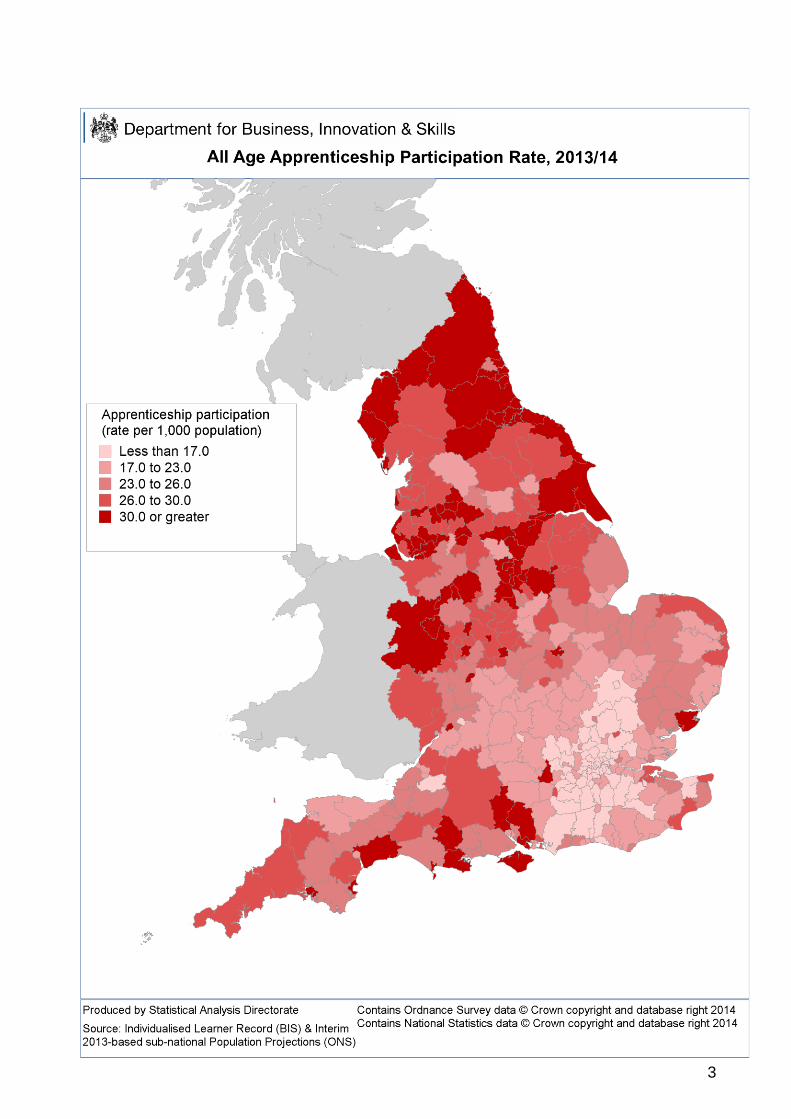
33. Providers have a key role to play in responding to the changing needs of a dynamic economy and society. The Government has created the environment for colleges and providers to be better able to engage with their communities, and respond to the needs of local employers and learners.
34. The two maps on pages 2 and 3 show total Adult (19+) learner participation and all age apprenticeship participation across England by Local Authority District. The total learner participation map shows the highest rates of participation are generally found across the North East, the North West, the South West, Yorkshire and the Humber, and parts of the East Midlands, West Midlands, London and the South East. Apprenticeship participation generally follows a similar pattern across the country with the exception of London Boroughs which have relatively lower apprenticeship participation rates per population compared with their overall learner participation.
Further Education and Benefit Claims
35. Matched BIS learner and DWP benefit data show that in 2012/13 (the most recent year for which full year data is available), 754,000 learners participated in the skills system whilst on benefits6. 79 per cent of those were receiving Jobseeker’s Allowance or Employment and Support Allowance (JSA/ESA WRAG), an increase from 71 per cent in 2011/12.
79%
21%
2012/13
753,600 learners
starting whilst on benefit
71%
29%
2011/12
JSA/ESA (WRAG)
Other Benefits
573,000 learners
starting whilst on benefit
Figure 11a: Adult (19+) Learners in the Skills System on Benefits, by Benefit Type 2011/12 and 2012/13
Source: FE for Benefit Claimants: November 2014: https://www.gov.uk/government/collections/further-education-for-benefit-claimants
6 This figure differs to the number of learners benefitting from support for the unemployed as reported in the FE SFR, because it is
based on matched DWP administrative records on benefit claims, rather than the self-reported information captured in the ILR used for the SFR. Also Benefit claimants are defined as claimants on Jobseeker’s Allowance (JSA) (including Training Allowance (TA)), Employment and Support Allowance (ESA), Income Support (IS), Incapacity Benefit (IB), Passported Incapacity Benefit (PIB), Severe Disablement Allowance (SDA), and Pension Credit (PC)

21
3% 3%8% 7%
3% 4%6% 5%
12% 14% 24%28%
36%30%
34% 31%
54% 47%
44% 56%30% 35%
13% 15%
12%6%
16% 14%6% 6%
0%
10%
20%
30%
40%
50%
60%
70%
80%
90%
100%
2011/12 2012/13 2011/12 2012/13 2011/12 2012/13
JSA/ESA (WRAG) Other benefits Not on Benefits
Pro
po
rtio
n o
f A
ims
Figure 11b: Adult (19+) Aims in the Skills System, by Benefit Type and Level, 2011/12 and 2012/13
Below Level 2 -English and mathsBelow Level 2 - other
Level 2
Level 3+
unassigned
Source: FE for Benefit Claimants: November 2014: https://www.gov.uk/government/collections/further-education-for-benefit-claimants
NEET
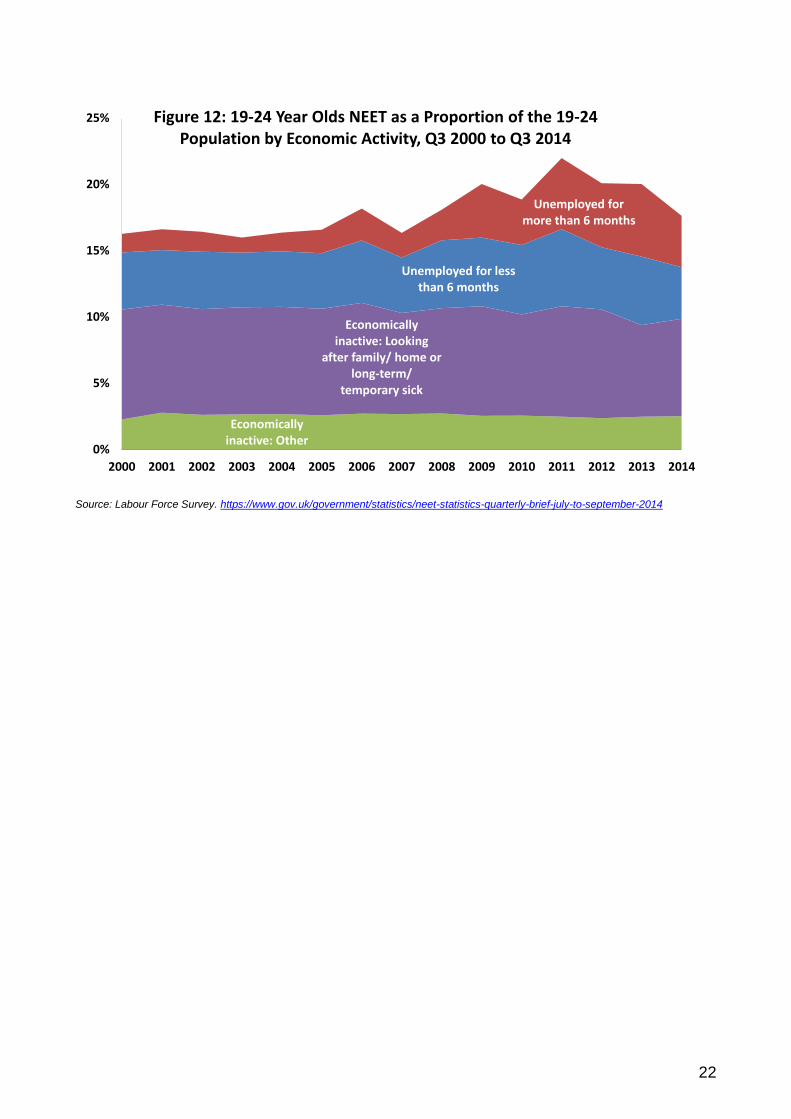
36. The proportion of 19-24 year olds Not in Education, Employment or Training (NEET) in 2014 Quarter 3 was down 2.4 percentage points to 17.6 per cent compared with the same quarter in 2013. This is the lowest comparable rate since 2008. The Government recognises that there are still too many young people who are NEET. Those who struggle with the transition from education to work and spend six months or more as NEET are more likely to experience poverty and the effects of disadvantage well into adulthood. Participation in education and training makes a lasting difference to individuals, and is pivotal to the Government’s ambitions to stimulate economic growth and improve social mobility.
37. At Quarter 3 2014, 44.1 per cent of 19-24 year olds NEET were unemployed and the other 55.9 per cent were economically inactive. The proportion of unemployed 19-24 year olds NEET decreased by 9.1 percentage points compared to the same quarter in 2013.
38. The proportion of 19-24 year olds NEET who had been unemployed for less than 6 months was 22.1 per cent. This was a decrease of 3.7 percentage points compared to the same quarter in 2013. The proportion who had been unemployed for more than 6 months was 22.0 per cent. This was a decrease of 5.4 percentage points compared to the same quarter in 2013.
22
Economically inactive: Other
Economically inactive: Looking
after family/ home or long-term/
temporary sick
Unemployed for less than 6 months
Unemployed for more than 6 months
0%
5%
10%
15%
20%
25%
2000 2001 2002 2003 2004 2005 2006 2007 2008 2009 2010 2011 2012 2013 2014
Figure 12: 19-24 Year Olds NEET as a Proportion of the 19-24 Population by Economic Activity, Q3 2000 to Q3 2014
Source: Labour Force Survey. https://www.gov.uk/government/statistics/neet-statistics-quarterly-brief-july-to-september-2014

23
What are the benefits?
Outcomes
Achievements
39. In 2013/14 there were 2.3 million achievements in the skills system to add to the country’s skills base. This was a decrease of 8 per cent from the 2.5 million in 2012/13.Figure 11 shows qualifications at certain levels since 2008/09. The number of achievements at Below Level 2 increased by 3 per cent compared to 2012/13 from 652,000 to 672,000.
0
100,000
200,000
300,000
400,000
500,000
600,000
700,000
800,000
2008/09 2009/10 2010/11 2011/12 2012/13 2013/14
Lear
ne
r
Academic Year
Figure 13 Adult (19+) Learner Achievements, by Level, 2012/13 and 2013/14
Below Level 2 (excluding English and maths)
Full Level 2
English and maths
Full Level 3
Level 4+
Source: Quarterly Statistical First Release:’Post-16 Education & Skills: Learner Participation, Outcomes and Level of Highest Qualification Held’: https://www.gov.uk/government/uploads/system/uploads/attachment_data/file/364220/learner-participation-outcomes-and-level-of-highest-qualification-data-tables-oct14.xls. Note: *Figures for 2011/12 onwards are not directly comparable with earlier years as a Single Individualised Learning Record (SILR) data collection system was introduced
Ofsted grades
40. The service that providers give their learners must be of the highest quality. The Office for Standards in Education, Children’s Services and Skills (Ofsted) published their Annual Report of Her Majesty's Chief Inspector (HMCI) of Education, Children's Service and Skills, 2013/14 on 10 December 20147. This shows that as at 31/08/14, 21 per cent of all colleges were graded “Outstanding”; 61 per cent were graded “Good”; 16 per cent were graded as “Requires Improvement/Satisfactory”8; and 2 per cent were graded “Inadequate” following their most recent inspection.
7 http://www.ofsted.gov.uk/about-us/annual-report.
8 As of 1 September 2012, FE and Skills providers with the inspection outcome of Grade 3 have been judged as ‘requires
improvement’. Prior to this Grade 3 was judged as ‘satisfactory.

24
41. For independent learning providers 12 per cent were graded “Outstanding”; 66 per cent were graded “Good”; 19 per cent were graded as “Requires Improvement/Satisfactory”; and 3 per cent were graded “Inadequate”. For community learning9 and skills providers 6 per cent were graded “Outstanding”; 80 per cent were graded “Good”; 12 per cent were graded “Requires Improvement/Satisfactory”; and 2 per cent were graded “Inadequate”.
42. The figures show an overall improvement following the most recent inspection as at 31/08/14 compared to the same point in 2013, with a shift for some providers from requires improvement/satisfactory to good in their overall effectiveness. This year, all the main provider types within the sector now have more good or outstanding provision compared with 2013. This in part reflects the governance and leadership responding to the higher expectations of learners and the priority providers are now giving to improving the quality of teaching and learning along with the new intervention regime to quickly tackle failing provision.
21% 21%12% 12%
6% 6%
51%
61%
56%
66%
67%
80%
26%
16%
27%
19%22%
12%
2% 2% 5% 3% 5% 2%
0%
20%
40%
60%
80%
100%
31/08/2013 31/08/2014 31/08/2013 31/08/2014 31/08/2013 31/08/2014
All colleges Independent learningproviders
Community learning andskills providers
Pro
po
rtio
n o
f in
spe
ctio
ns
Figure 14: Overall Effectiveness Grade by Provider Type at their Most Recent Inspection as at 31 August 2013 and 31 August 2014 (provisional)
Inadequate
RequiresImprovement/Satisfactory
Good
Outstanding
Source: Ofsted: http://www.ofsted.gov.uk/resources/official-statistics-further-education-and-skills-inspections-and-outcomes Note: As of 1 September 2012, FE and Skills providers with the inspection outcome of Grade 3 have been judged as ‘requires improvement’. Prior to this Grade 3 was judged as ‘satisfactory.
9 Note that the Community Learning and Skills data in Ofsted’s Annual Report relate to a wide range of provision
(apprenticeships, employability training, work-based learning, and 16-19 study programmes) as well as provision funded
through the community learning budget. Ofsted will shortly provide a separate analysis of inspection outcomes for community
learning.

25
Success Rates
43. Success rates are also a helpful indication of the quality of education being provided. In 2012/13, the most recent full year for which figures are available, 87 per cent of adult (19+) learners successfully completed their Education and Training, up from 84 per cent in 2011/12. The all age apprenticeship success rate was 72 per cent, down from 74 per cent in 2011/12.
Table 1 Adult (19+) Education and Training and All Age Apprenticeship Success Rates by Level, 2008/09 to 2012/13
2008/09 2009/10 2010/11 2011/12 2012/13
Adult (19+) Education and Training Provision 81% 80% 81% 84% 87%
of which… English and maths 75% 74% 79% 80% 83%
Full Level 2 72% 75% 78% 83% 85%
Full Level 3 70% 75% 78% 78% 80%
71% 74% 76% 74% 72%
of which… Intermediate Level 70% 73% 75% 73% 72%
Advanced Level 72% 75% 79% 77% 73%
Higher - - 85% 73% 70%
All Age Apprenticeships
Source: Quarterly Statistical First Release: ‘Post-16 Education & Skills: Learner Participation, Outcomes and Level of Highest Qualification Held’ http://www.thedataservice.org.uk/statistics/statisticalfirstrelease/sfr_current/
Learner and Employer Satisfaction
44. FE Choices was launched in January 2012 to provide clear, comparable information to learners and employers so they can make informed choices about which FE college or training provider best meets their learning and training needs. It is aimed primarily at 19+ further education and apprenticeships of all ages. There is now a link between FE Choices and the Course Directory used by the National Careers Service. The statistics will be used by National Careers Service advisers in providing advice on FE learning opportunities.
45. Learner Satisfaction is a score out of 10 derived from a questionnaire on learners' views. The latest survey was undertaken between November 2013 and May 2014 and was based on views relating to training in the 2013/14 academic year.
46. In 2013/14, the median provider score for learner satisfaction was 8.6 (out of a maximum of 10). Providers scored a range of 6.1 per cent to 9.9.
47. Employer Satisfaction is a score out of 10 derived from employers' responses to a survey of its providers' responsiveness and quality of training. The latest survey was undertaken between April 2013 and May 2013 and was based on views on training provided in the 2012/13 academic year.
48. In 2012/13, the median provider score for employer satisfaction was 8.1. Providers scored a range of 3.9 to 9.9.

26
Source: FE Choices https://www.gov.uk/government/statistical-data-sets/fe-choices-performance-indicators
Impact
Highest Level of Qualification in the Population
49. Having a skilled population is vital to maintaining the international competitiveness of our economy and creating high quality jobs. Improving our skills does not just improve our economy; it also has the potential to make the UK a fairer place by creating more social mobility and enabling people to play their part in society.
50. Figures 16a and b and Table 2 look at the qualification levels and the economic activity10 of the working age population. The qualification levels of the working age population have increased gradually over recent years as shown in Figure 16a. In 2013 it was estimated that 81.1 per cent were qualified to Level 2 and above; 62.6 per cent were qualified to Level 3 and above; and 40.3 per cent were qualified to Level 4 and above.
10 ‘International Labour Organisation (ILO) unemployed’ estimates are taken as those people declaring themselves as not being employed and actively looking and available for employment. The ILO Unemployment Rate is calculated as the number ILO Unemployed divided by the number Economically Active (ILO Unemployed + Employed). Economically inactive people are not in work and do not meet the internationally agreed definition of unemployment. They are people without a job who have not actively sought work in the last four weeks and/or are not available to start work in the next two weeks.

27
Source: Labour Force Survey (LFS) https://www.gov.uk/government/uploads/system/uploads/attachment_data/file/364220/learner-participation-outcomes-and-level-of-highest-qualification-data-tables-oct14.xls
Source: Labour Force Survey (LFS)

28
Table 2 Economic Activity4 by Level of Highest Qualification Held by Adults of Working Age, 2011 to 2012 (Quarter 4)
Year
Employment Rate (%)
2012 76.4 84.3 76.4 76.5 59.7
2013 76.7 84.9 76.4 76.3 59.8
2013 95% CI (+/-) 0.4 0.5 0.9 0.9 1.0
ILO Unemployment Rate (%)
2012 7.0 4.4 6.9 8.3 12.6
2013 6.5 3.8 6.2 8.0 12.7
2013 95% CI (+/-) 0.2 0.3 0.6 0.7 0.8
Inactivity Rate (%)
2012 17.9 11.8 17.9 16.5 31.6
2013 17.9 11.7 18.5 17.1 31.4
2013 95% CI (+/-) 0.4 0.5 0.8 0.8 1.0
Below Level 2
(incl no
qualifications)
All people
aged
19-59/64
Level 4 and
above Level 3 Level 2
Source: Labour Force survey (LFS)
Success Measures
51. Learner Destinations11 is the percentage of learners that completed a government-funded programme in one academic year who progressed to a positive destination in the following academic year.
52. In 2011/12, the median provider score for the percentage of learners progressing to positive destinations was 75 per cent. Providers scored a range of 45 per cent to 100 per cent.
53. Employment Rate11 is the percentage of learners that completed a government-funded programme in one academic year who progressed to a positive employment destination in the following academic year
54. In 2011/12, the median provider score for the percentage of learners progressing to positive employment destinations was 47 per cent. Providers scored a range of 9 per cent to 78 per cent.
55. Learning Rate11 is the percentage of learners that completed a government-funded programme in one academic year who progressed to a positive learning destination in the following academic year
56. In 2011/12, the median provider score for the percentage of learners progressing to positive learning destinations was 42 per cent. Providers scored a wide range of 4 per cent to 89 per cent.
11 Source: FE Choices https://www.gov.uk/government/statistical-data-sets/fe-choices-performance-indicators

29
75%
47%42%
100%
78%
89%
45%
9%4%
0%
20%
40%
60%
80%
100%
Learner Destinations(2011/12)
Employment Rate(2011/12)
Learning Rate(2011/12)
Sco
re
Figure 17: Learner Destinations, Employment Rate, Learning Rate Provider Scores
Source: FE Choices https://www.gov.uk/government/statistical-data-sets/fe-choices-performance-indicators
57. We have plans to develop new outcome based success measures using matched data already collected by Government: learner destinations (into employment and further learning) and learner progression (to a higher level qualification) at learning provider and qualification level; and earnings at qualification level. We will develop the measures over the next couple of years to help inform learner and employer choice, and help providers benchmark their own performance and as part of a new accountability framework.

30
Benefits to the Individual
58. Evidence12 suggests that those who achieve a further education qualification earn substantially more on average, 3-5 years post-completion, than those who start but do not achieve a qualification (see figures 18 a and b below). They are also more likely to be employed. This varies across qualifications and Levels:
Those who achieve a Level 3 apprenticeship earn 16 per cent more in employment than those who start but do not achieve. For Level 2 apprenticeship this figure is 11%.
Figure 18a: Earnings Returns by Type of Learning
Source: University of Westminster (2014), ‘Estimation of the labour market returns to qualifications gained in English Further Education’ BIS Research Paper No.195. https://www.gov.uk/government/publications/further-education-comparing-labour-market-economic-benefits-from-qualifications-gained
Those who achieve a Full Level 2 qualification as their highest learning aim are 2 percentage points more likely to be in employment and earn 11 per cent more than those who start but did not achieve the same highest learning aim.
Those who achieve a Full Level 3 qualification as their highest learning aim are 4 percentage points more likely to be in employment and earn 9 per cent more than those who start but did not achieve the same highest learning aim.
Figure 18b: Earnings Returns and Employment Probability Premiums by Level
Source: University of Westminster (2014), ‘Estimation of the labour market returns to qualifications gained in English Further Education’ BIS Research Paper No 195. https://www.gov.uk/government/publications/further-education-comparing-labour-market-economic-benefits-from-qualifications-gained
12 Source: University of Westminster (2014), ‘Estimation of the labour market returns to qualifications gained in English
Further Education’ BIS Research Paper No.195. https://www.gov.uk/government/publications/further-education-comparing-labour-market-economic-benefits-from-qualifications-gained
31

32
This publication is also available on our website at https://www.gov.uk/government/statistical-data-sets/fe-data-library-other-statistics-and-research
Any enquiries regarding this publication should be sent to:
Paula Maratos [email protected]
Department for Business, Innovation and Skills 1 Victoria Street
London SW1H 0ET
Tel: 020 7215 5000
If you require this publication in an alternative format, email [email protected], or call 020 7215 5000.