Fe-N-Graphene Wrapped Al O /Pentlandite from Microalgae ...
24
S1 Supporting Information for Fe-N-Graphene Wrapped Al 2 O 3 /Pentlandite from Microalgae: High Fenton Catalytic Efficiency from Enhanced Fe 3+ Reduction Jianqing Ma, † Lili Xu, † Chensi Shen, ‡ Chun Hu,* ,§ Weiping Liu † Yuezhong Wen,* ,† † MOE Key Laboratory of Environmental Remediation & Ecosystem Health, College of Environmental and Resource Sciences, Zhejiang University, Hangzhou 310058, China ‡ College of Environmental Science and Engineering, Donghua University, Shanghai 201620, China § Key Laboratory of Drinking Water Science and Technology, Research Center for Eco-Environmental Sciences, Chinese Academy of Sciences, Beijing 100085, China number of pages: 23 number of figures: 15 number of tables: 2 * Phone: +86 571 8898 2421; fax: +86 571 8898 2421. E-mail address: [email protected] (Y.W.) and [email protected] (C.H.)
Transcript of Fe-N-Graphene Wrapped Al O /Pentlandite from Microalgae ...

S1
Supporting Information for
Fe-N-Graphene Wrapped Al2O3/Pentlandite from Microalgae:
High Fenton Catalytic Efficiency from Enhanced Fe3+ Reduction
Jianqing Ma,† Lili Xu,† Chensi Shen,‡ Chun Hu,*,§ Weiping Liu† Yuezhong Wen,*,†
†MOE Key Laboratory of Environmental Remediation & Ecosystem Health, College
of Environmental and Resource Sciences, Zhejiang University, Hangzhou 310058,
China
‡College of Environmental Science and Engineering, Donghua University, Shanghai
201620, China
§Key Laboratory of Drinking Water Science and Technology, Research Center for
Eco-Environmental Sciences, Chinese Academy of Sciences, Beijing 100085, China
number of pages: 23
number of figures: 15
number of tables: 2
* Phone: +86 571 8898 2421; fax: +86 571 8898 2421.
E-mail address: [email protected] (Y.W.) and [email protected] (C.H.)

S2
SUMMARY
Total number of pages: 23. (S1-S23)
Text S1. Chlorella vulgaris culture conditions. (S4)
Text S2. Analytical Methods (S4-S5)
Text S3. Calculation of the accumulated turnover numbers (TON). (S5)
Text S4. Calculation of the utilization efficiency of H2O2. (S5-S6)
Table S1. HPLC detection conditions of different organics. (S7)
Table S2. BET surface areas of different catalysts. (S8)
Figure S1. Pictures of Chlorella vulgaris and its TEM image. (S9)
Figure S2. XRD patterns of Fe−N/Pentlandite/Al2O3/C catalyst. (S10)
Figure S3. XPS spectra of Fe−N/Pentlandite/Al2O3/C before reaction and after 12
cycles. (a) Fe ions; (b) Ni ions; (c) Al ions and (d) S. (S11)
Figure S4. HAADF-STEM of different catalysts by controlling the addition of metal
precursors. (S12)
Figure S5. TOC removal of different organics by catalytic degradation and adsorption.
(S13)
Figure S6. Catalytic degradation of other dyes and refractory organics. Conditions:
Initial concentration of dye in (a) 50 mg/L, refractory organics in (b) 30 mg/L, 100
mL, T=25 ºC, catalyst dosage 0.4 g/L, H2O2 40 mM. (S14)
Figure S7. (a) pH change (top) and dissolved iron concentrations (bottom) during AR
73 degradation and adsorption by Fe−N/Pentlandite/Al2O3/C (b) AR 73 removal by
homogeneous Fenton reaction. (Fe (FeCl2· 4H2O) 0.02 mg/L and Ni (NiCl2·6H2O)

S3
0.35 mg/L. (S15)
Figure S8. pH effects on (a) AR 73 removal and H2O2 decomposition; (b) the
concentrations of leaching metal. (S16)
Figure S9. The reusability of the catalyst. (a) AR 73; (b) phenol. (S17)
Figure S10. HAADF-STEM of Fe−N/Pentlandite/Al2O3/C, the catalyst before and
after 12 cycles. (a) before reaction; (b) after 12 cycles. (S18)
Figure S11. Catalytic degradation and adsorption of AR 73 using catalysts prepared
with different metal precursors (Initial AR 73 concentration 50 mg/L, 100 mL, pH 6.8,
T=25 ºC, catalyst dosage 0.4 g/L, H2O2 concentration for degradation 40 mM and for
adsorption is 0). (S19)
Figure S12. Kinetics on the catalytic decomposition of H2O2 (Catalyst dosage 0.4 g/L,
H2O2 concentration 40 mM, 100 mL, T=25 ºC). (S20)
Figure S13. DMPO spin trapping ESR spectra recorded at ambient temperature for
various catalysts with H2O2 in aqueous dispersion for DMPO-HO• (a) and in
methanol dispersion for DMPO- HO2•/O2
•- (b): (1) Fe−N/Pentlandite/Al2O3/C; (2)
FeNi-C; (3) AlNi-C; (4) FeAl-C; (5) Ni-C; (6) Al-C; (7) Fe-C; (8) CV-C; (9) H2O2.
(S21)
Figure S14. Cyclic voltammetry in dye solution. (a) Fe-N-Graphene wrapped
Al2O3/Pentlandite; (b) FeNi-C; (c) FeAl-C. (S22)
Figure S15. The quenching effects of ethanol and Na2CO3 on the removal of AR 73.
The pH was adjusted to 6.8 when Na2CO3 was added. (S23)

S4
Text S1: Chlorella vulgaris culture conditions
C. vulgaris were grown in the SE (Brostol’s solution) medium (a common and widely
used freshwater medium for green algae) in artificial freshwater at room temperature
(25±1.0 ºC) with a light intensity of 4500-5000 lux. The C. vulgaris were collected
after 12 days. The composition of artificial freshwater (per liter) is as follows: 10.0 g
of (NH4)2SO4, 1.5 g of Ca(HPO4)2, 4.0 g of MgSO4·7H2O, 5.0 g of NaHCO3, 1.25 g
of KCl, 0.25 g of FeCl3·6H2O, 2.86 g of H3BO3, 1.81 g of MnCl2·4H2O, 0.1045 g of
ZnCl2, 0.0602 g of CuCl2·2H2O, 0.039 g of (NH4)8Mo7O24·6H2O.
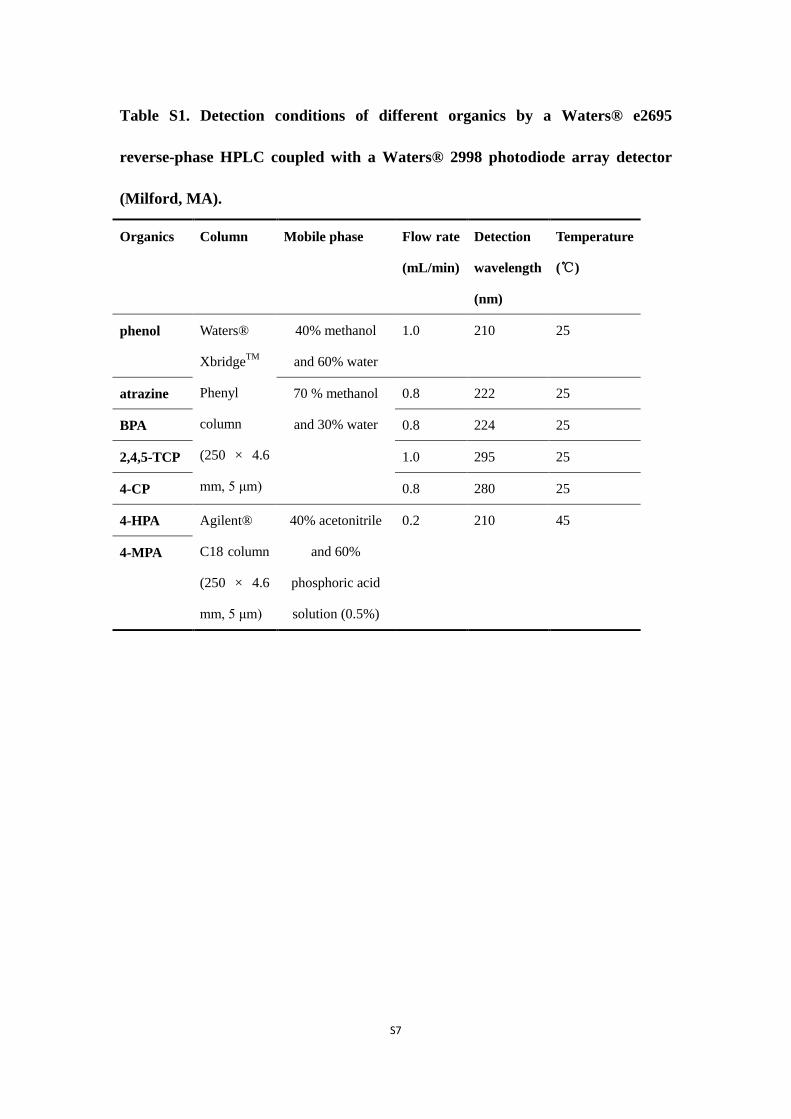
Text S2: Analytical Methods
The concentrations of phenol, atrazine, bisphenol A (BPA), 2, 4, 5-trichlorophenol
(2,4,5-TCP), 4-chlorophenol (4-CP), 4-hydroxyphthalic acid (4-HPA), and
4-methylphthalic acid (4-MPA) were analyzed using a Waters® 2695 reverse-phase
HPLC with a Waters® 2998 photodiode array detector (Milford, MA, USA). Before
measurement, 10 μL of tert-butanol as a trapping agent was added to the sample
solution (1.0 mL) to stop the degradation of organics. Detailed detection conditions
were provided in the following Table S1.
Cyclic voltammetry measurements were performed using CHI Electrochemical
Station (Model 750b) in a conventional three-electrode electrochemical cell. To avoid
any potential contamination of a non-precious metal catalyst by platinum,
experiments were carried out using a graphite rod as the counter electrode. An Hg2Cl2
electrode in 3.0 M KCl was used as a reference electrode. All potentials were later
converted to the RHE scale. The catalysts were ultrasonically dispersed in an

S5
alcoholic solution containing suspended Nafion® ionomer for one hour to form a
catalyst “ink”, later applied to the glassy-carbon disk surface. The cycling stability
tests of the catalysts were performed in the potential range from 0.1 to 0.6 V at room
temperature.
Text S3: Calculation of the accumulated turnover numbers (TON)
The accumulated turnover numbers was measured by three successive ran of the
degradation of AR73 and phenol. The initial concentrations of AR 73 and phenol was
3000 mg/L and 3000 mg/L respectively. The catalyst dosage was 0.4 g/L, and the
H2O2 was 1M. The solution was in a volume of 100 mL.
TON = mol of orgainc converted/ mol of Fe-N (1)
The Fe and Ni contents of the Fe-N/Pentlandite/Al2O3/C measured by the ICP-MS
after the acid digestion were 0.250 mmol/g and 0.168 mmol/g, respectively. As the Fe
in the catalyst contains coordinated Fe (Fe-N sites) and Fe in pentlandite ((Fe, Ni)9S8 ),
and the Fe-N sites are viewed as the active sites for the Fenton reactions, thus the
equivalent active sites for the catalyst is estimated to 0.082 mmol/g.
Text S4: Calculation of the utilization efficiency of H2O2
The utilization efficiency of H2O2 (η) was calculated using the Luo et al. reported
method1. It is defined as the ratio of the amount of H2O2 used for the degradation
([∆H2O2]degradation) with the total amount of the consumed H2O2 ([∆H2O2]decomposition),
as illustrated in eq.2:
η = [∆H2O2]degradation / [∆H2O2]decomposition (2)

S6
The complete mineralization of one mole AR 73 (C22H14N4Na2O7S2) and phenol
(C6H5OH) will theoretically consume 61 and 14 moles of H2O2, respectively.
C22H14N4Na2O7S2 + 61H2O2 → 22CO2 + 65H2O + 4HNO3 + H2SO4 +Na2SO4 (3)
C6H5OH + 14H2O2 → 6CO2 + 17H2O (4)
By measuring the TOC change in the pollutant solutions, the amounts of the
mineralized contaminants were obtained, and thus the value of [∆H2O2]degradation can
be calculated according to eq.3 and eq.4. The value of [∆H2O2]decomposition was
calculated by the change of H2O2 amount in the solution.
S7
Table S1. Detection conditions of different organics by a Waters® e2695
reverse-phase HPLC coupled with a Waters® 2998 photodiode array detector
(Milford, MA).
Organics Column Mobile phase Flow rate
(mL/min)
Detection
wavelength
(nm)
Temperature
(℃)
phenol Waters®
XbridgeTM
Phenyl
column
(250 × 4.6
mm, 5 μm)
40% methanol
and 60% water
1.0 210 25
atrazine 70 % methanol
and 30% water
0.8 222 25
BPA 0.8 224 25
2,4,5-TCP 1.0 295 25
4-CP 0.8 280 25
4-HPA Agilent®
C18 column
(250 × 4.6
mm, 5 μm)
40% acetonitrile
and 60%
phosphoric acid
solution (0.5%)
0.2 210 45
4-MPA

S8
Table S2. BET surface areas of different catalysts
samples BET(m2/g)
Fe-C 336.056
Al-C 145.238
Ni-C 44.689
FeAl-C 332.412
FeNi-C 54.341
AlNi-C 28.346
FeAlNi-C (Fe-N/pentlandite/Al2O3/C) 119.268

S9
Figure S1. Pictures of Chlorella vulgaris and its TEM image

S10
Figure S2. XRD patterns of Fe−N/Pentlandite/Al2O3/C catalyst.

S11
735 730 725 720 715 710 705
711.7 eV 2p3/22p1/2724.9 eV
Fe 2p
Inte
nsity
(a.u
.)
Binding Energy (eV)
Fe-N/Pentlandite/Al2O3/C after reaction Fe-N/Pentlandite/Al2O3/C
(a)
885 880 875 870 865 860 855 850 845
856.3 eV874.1 eV 2p3/2
2p1/2
Inte
nsity
(a.u
.)
Binding Energy (eV)
Fe-N/Pentlandite/Al2O3/C Fe-N/Pentlandite/Al2O3/C after reaction
Ni 2p(b)
82 80 78 76 74 72 70 68 66
Inte
nsity
(a.u
.)
Binding Energy (eV)
Fe-N/Pentlandite/Al2O3/C Fe-N/Pentlandite/Al2O3/C after reaction
Al 2p(c) 74.7 eV
175 170 165 160
163.5 eV metal sulfide
←
Binding Energy (eV)
Inte
nsity
(a.u
.)
Fe-N/Pentlandite/Al2O3/C after reaction Fe-N/Pentlandite/Al2O3/C
←
(d) S 2p 168.8 eV SO2-4
Figure S3. XPS spectra of Fe−N/Pentlandite/Al2O3/C before reaction and after 12
cycles. (a) Fe ions; (b) Ni ions; (c) Al ion and (d) S.

S12
Figure S4. HAADF-STEM of different catalysts by controlling the addition of
metal precursors.

S13
AR 73 phenol
Atrzaine BPA 4-CP2,4,5-TCP 4-HPA 4-MPA
0
20
40
60
80
100
TO
C r
emov
al e
ffici
ency
(%)
Organics
degradation adsorption
Figure S5. TOC removal of different organics by catalytic degradation and
adsorption. (Initial concentration of AR 73 50 mg/L, phenol and other organics
30 mg/L , 100 mL, pH 6.8, T=25 ºC, catalyst dosage 0.4 g/L, H2O2 concentration
for degradation 40 mM and for adsorption is 0).

S14
0
20
40
60
80
100
After
AB193AB113 RY18RY2
RR24RR11
RB194RB74AB62
AB40AB25AB1
Rem
oval
(%)
DyesAR1
Before
(a)
0 10 20 30 40 50 600.0
0.2
0.4
0.6
0.8
1.0
Conc
entr
atio
n C/
C 0
Time (min)
Atrzaine BPA 4-CP 2,4,5-TCP 4-HPA 4-MPA
(b)
Figure S6. Catalytic degradation of other dyes and refractory organics.
Conditions: Initial concentration of dye in (a) 50 mg/L, refractory organics in (b)
30 mg/L, 100 mL, T=25 ºC, catalyst dosage 0.4 g/L, H2O2 40 mM.

S15
4
5
6
7
8
0 5 10 15 20 25 300.00
0.01
0.02
0.03
pH
Degradation Adsorption
(a)
Lea
chin
g Fe
(m
g/L
)
Time (min)
0 5 10 15 20 25 300.0
0.2
0.4
0.6
0.8
1.0
C/C
0
Time (min)
pH=6.8 pH=4.4
(b)
Figure S7. (a) pH change (top) and dissolved iron concentrations (bottom) during
AR 73 degradation and adsorption by Fe−N/Pentlandite/Al2O3/C (b) AR 73
removal by homogeneous Fenton reaction. (Fe (FeCl2· 4H2O) 0.02 mg/L and Ni
(NiCl2·6H2O) 0.35 mg/L.

S16
0
20
40
60
80
100 (a)
6.853
pH
Rem
oval
eff
icie
ncy
(%)
Degradation Adsorption H2O2 decomposition
0.0
0.2
0.4
0.6
0.8
6.85
Con
cent
ratio
ns (m
g/L
)
pH
Fe Ni Al
3
(b)
Figure S8. pH effects on (a) AR 73 removal and H2O2 decomposition; (b) the
concentrations of leaching metal.

S17
1 2 3 4 5 6 7 8 9 10 11 120
20
40
60
80
100
Cycles
Rem
oval
(%)
(a)
AR73
1 2 3 4 5 6 7 8 9 10 11 120
20
40
60
80
100
Cycles
Rem
oval
(%)
Phenol
(b)
Figure S9. The reusability of the catalyst. (a) AR 73; (b) phenol.

S18
Before reaction After 12 cycles
Figure S10. HAADF-STEM of Fe-N-graphene wrapped Al2O3/pentlandite, the
catalyst before and after 12 cycles. (a) before reaction; (b) after 12 cycles.
(a) (b)

S19
FeAlNi-CFeAl-C FeNi-C AlNi-C Al-C Ni-C Fe-C0
20
40
60
80
100
Rem
oval
(%)
Catalysts
Degradation Adsorption
FeAlNi
Figure S11. Catalytic degradation and adsorption of AR 73 using catalysts
prepared with different metal precursors (Initial AR 73 concentration 50 mg/L,
100 mL, pH 6.8, T=25 ºC, catalyst dosage 0.4 g/L, H2O2 concentration for
degradation 40 mM and for adsorption is 0).

S20
0 5 10 15 20 25 300.2
0.4
0.6
0.8
1.0
H2O
2 co
ncen
trat
ion
C/C 0
Time (min)
none Fe-C Al-C Ni-C FeAl-C FeNi-C AlNi-C-C FeAlNi-C
Figure S12. Kinetics on the catalytic decomposition of H2O2 (Catalyst dosage 0.4
g/L, H2O2 concentration 40 mM, 100 mL, T=25 ºC).

S21
3460 3480 3500 3520 3540 3560
In
tens
ity (a
.u.)
Magnetic Field (mT)
98765432
1
5.0E
5
(a)
3460 3480 3500 3520 3540 3560
9
87
654321
Inte
nsity
(a.u
.)
Magnetic Field (mT)
(b)
Figure S13. DMPO spin trapping ESR spectra recorded at ambient temperature
for various catalysts with H2O2 in aqueous dispersion for DMPO-HO• (a) and
in methanol dispersion for DMPO- HO2•/O2
•- (b): (1) Fe−N/Pentlandite/Al2O3/C;
(2) FeNi-C; (3) AlNi-C; (4) FeAl-C; (5) Ni-C; (6) Al-C; (7) Fe-C; (8) CV-C; (9)
H2O2.

S22
0.1 0.2 0.3 0.4 0.5 0.6
-200
-100
0
100
200
300
I/uA
E/V (vs.SCE)
Fe-N-graphene wrapped Al2O3/pentlandite
(a)
0.1 0.2 0.3 0.4 0.5 0.6-1200
-800
-400
0
400
(b)
I/uA
E/V (vs.SCE)
FeNi-C
0.1 0.2 0.3 0.4 0.5 0.6-300
-200
-100
0
100
200
(c)
I/uA
E/V (vs.SCE)
FeAl-C
Figure S14. Cyclic voltammetry in dye solution. (a) Fe-N-Graphene wrapped
Al2O3/Pentlandite; (b) FeNi-C; (c) FeAl-C.

S23

S24
0 5 10 15 20 25 300.0
0.2
0.4
0.6
0.8
1.0
AR 7
3 co
ncen
trat
ion
(C/C
0)
Time (min)
without scavenger ethanol Na2CO3
Figure S15. The quenching effects of ethanol and Na2CO3 on the removal of AR
73. The pH was adjusted to 6.8 when Na2CO3 was added.
Reference
1. Wei, L.; Zhu, L.; Nan, W.; Tang, H.; Cao, M.; She, Y., Efficient Removal of
Organic Pollutants with Magnetic Nanoscaled BiFeO3 as a Reusable Heterogeneous
Fenton-Like Catalyst. Environ. Sci. Technol. 2010, 44, (5), 1786.