FE-206 Food Microbiology1 Spring 2016
42
FE-206 Food Microbiology1 Spring 2016 LECTURE3 Microbial Growth Characteristics in Foods
Transcript of FE-206 Food Microbiology1 Spring 2016

FE-206 Food Microbiology1 Spring 2016
LECTURE3
Microbial Growth Characteristics in Foods
Outline
I.Introduction II.General principles of Microbial Growth andSurvival A)Reproduction Yeast,Mold, bacteria B)Growth Curve C)First order Kinetics 1)Growth Kinetics 2)Death Kinetics D)Importance of Being Small Size E)Microbial Growth Characteristics in Foods III.Chemical Changes Caused by micrrorganisms in Foods

Reproduction
• An increase in the number (or mass)of vegetative cellsbacteria,yeast and molds is used to reflect growth for microorganisms.
– Bacteria-binary fisson
– Molds-sexually and asexually
– Yeast-Budding
– Viruses-by lytic and lysogenic cycles

General principles of Microbial Growth and Survival
• Microbial Growth (cell multiplication),except
viruses in raw and processed foods are important with respect to foodborne disaeases, food spoilage and food bioprocessing.
The factors inflencing the microbial growth are helpful designing methods either control(against spoilage,heath hazard) or stimulate their growth(in biprocessing,fermentation)

Viral Reproduction
• Steps of Lytic Cycle
1.Attachment
2.Entry
3.Replication
4.Assembly
5.Lysis/Release (lyses the cell)
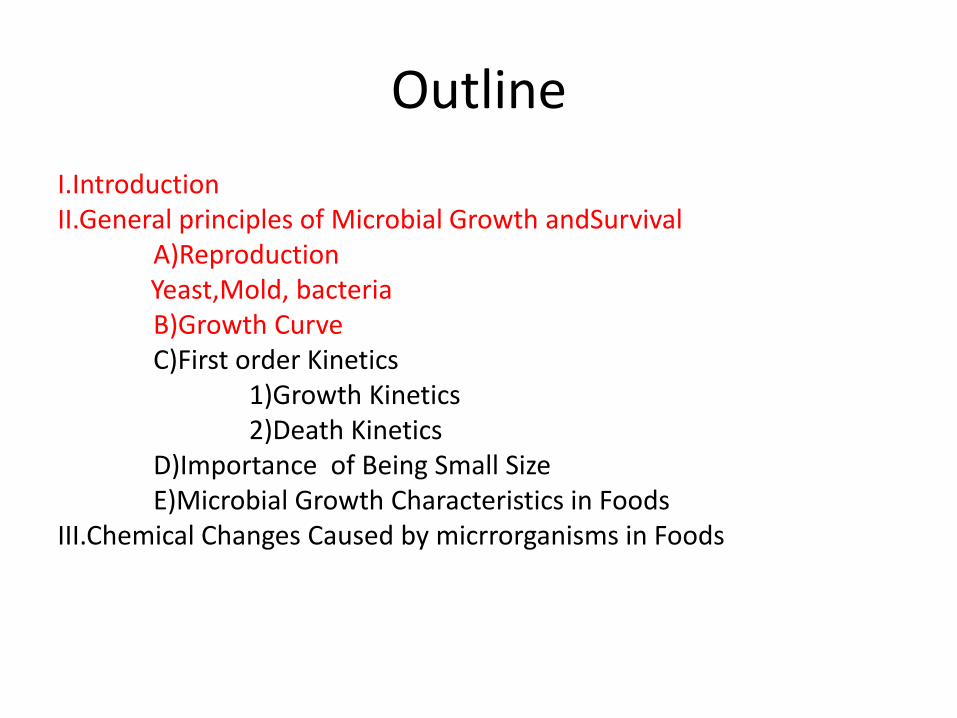
How do viruses replicate? 2 methods of replication:
1. Lytic Cycle – the virus enters the cell, replicates itself hundreds of times, and then bursts out of the cell, destroying it.
2. Lysogenic Cycle – the virus DNA integrates with the host DNA and the host’s cell helps create more virus DNA. An environmental change may cause the virus to enter the Lytic Cycle.

In the lytic cycle, the virus reproduces itself using the host cell's chemical machinery. The red spiral lines in the drawing indicate the virus's genetic material. The orange portion is the outer shell that protects it.
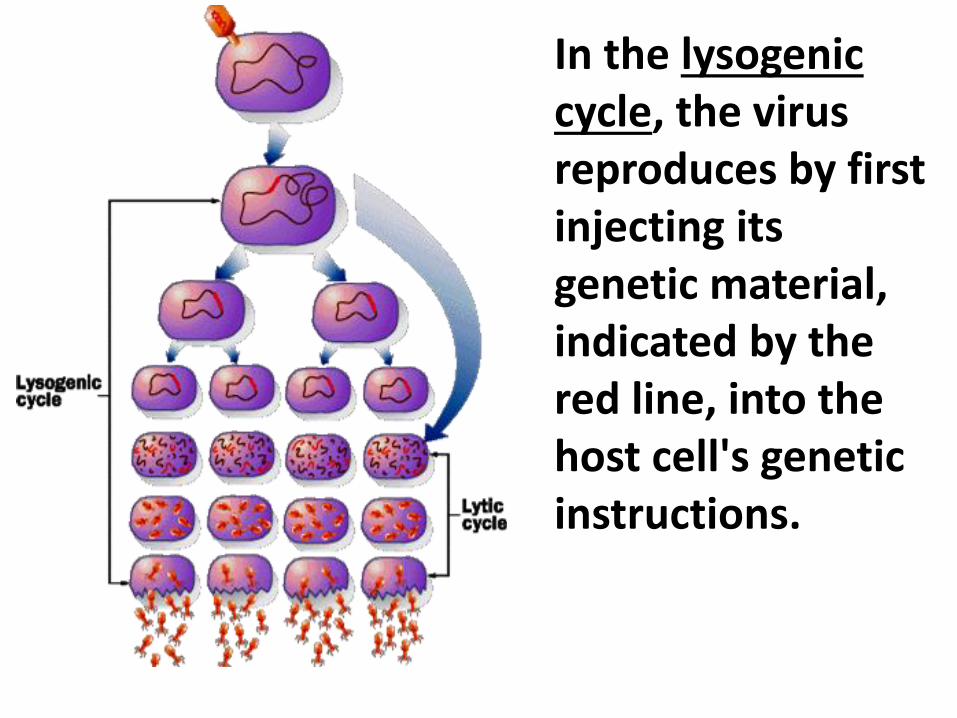
In the lysogenic cycle, the virus reproduces by first injecting its genetic material, indicated by the red line, into the host cell's genetic instructions.

What is Bacterial Growth?
• Bacterial Growth - an increase in bacterial numbers
- does not refer to an increase in size of the individual cells

How to determine Microbial Numbers?
directly – through counting
indirectly – through measuring their metabolic activity
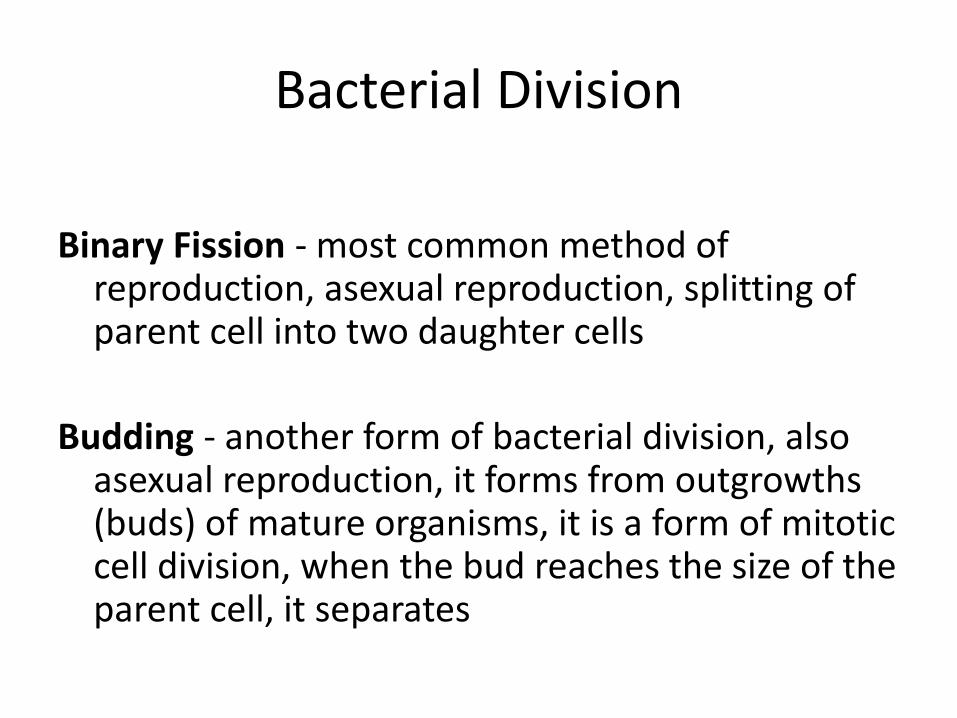
Bacterial Division
Binary Fission - most common method of reproduction, asexual reproduction, splitting of parent cell into two daughter cells
Budding - another form of bacterial division, also asexual reproduction, it forms from outgrowths (buds) of mature organisms, it is a form of mitotic cell division, when the bud reaches the size of the parent cell, it separates
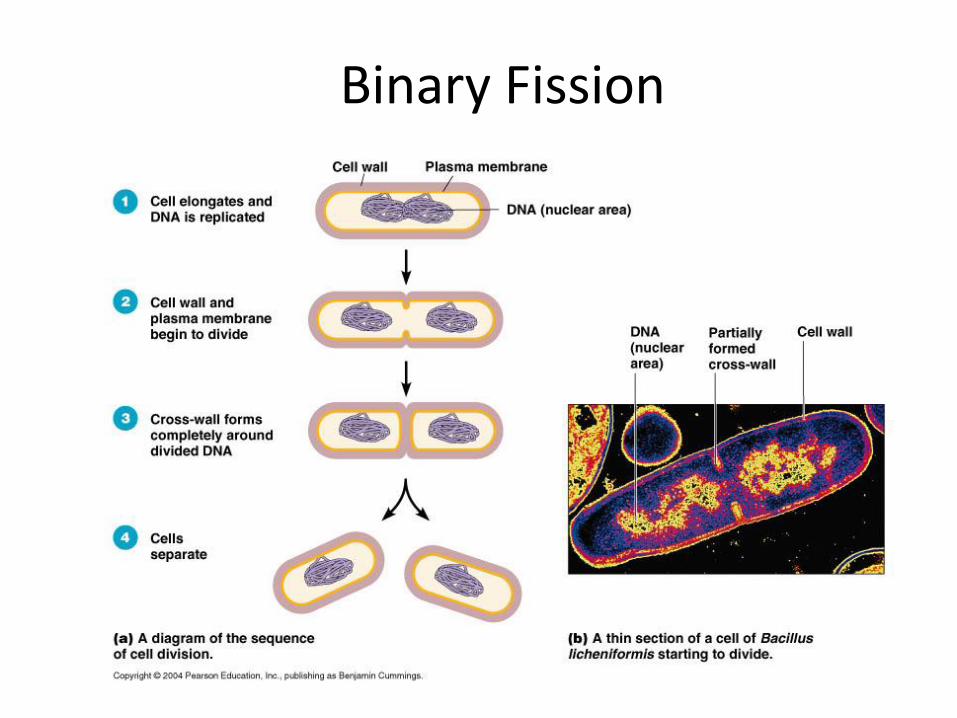
Binary Fission

Filamentous bacteria (some actinomycetes) reproduce by producing chains of conidiospores carried externally at the tips of the filaments. Other filamentous bacteria simply fragment and the fragments initiate the growth of new cells.

Generation Time
• In binary fission, one cell’s division produces two cells, two cells’ divisions produces four cells and so on. When the arithmetic number of cells in each generation is expressed as a power of 2 (2x), where x is the exponent that tells the number of doubling (generations) that have occurred.

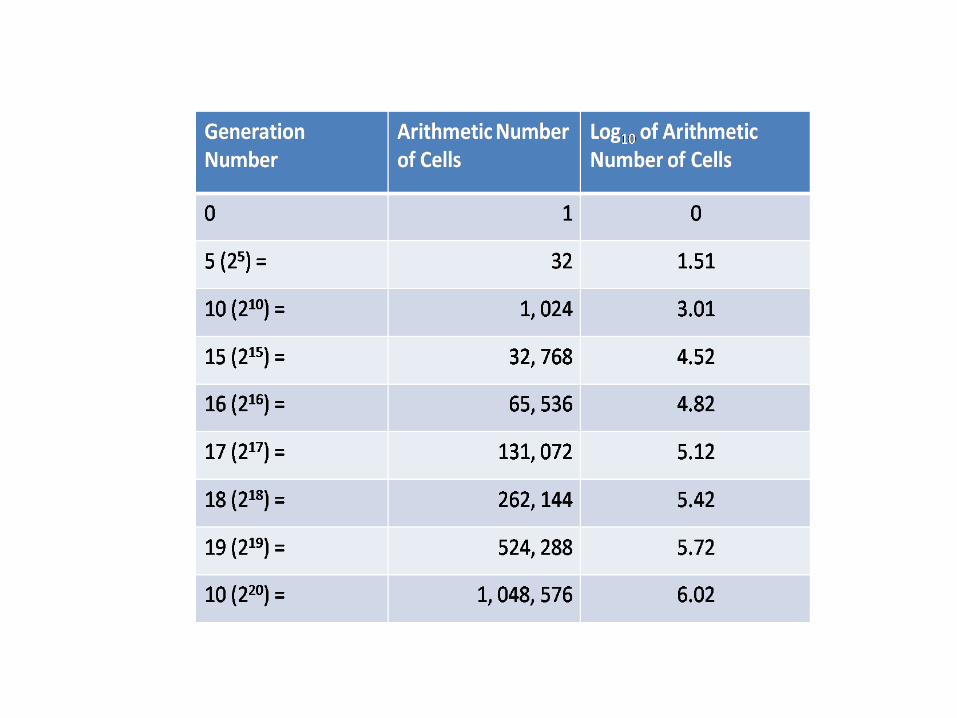

Generation time is the time required for a cell to divide (and its population to double). The generation time among organisms vary according to environmental conditions such as temperature or pH level. Most bacteria have a generation time of 1 – 3 hours while other species can require up to 24 hours per generation.

Phases of Growth
Lag phase:
• No increase in cell number
• Period of adaptation of cells to a new environment
• No change in number, but an increase in mass
• Multiple lag phases may sometimes be observed - more than one carbon source
(Diauxic growth)….why?
• Length of the lag phase – characteristics of microbial species and in part by the media conditions
18
Cont.…
Log Phase:
• Growth rate is higher
• Increase in cell mass and cell number with time exponentially
• This phase results in straight line… why?
• Hence, it is also known as Exponential phase.
• Period of balanced growth, in which all the components of a
cell grow at the same rate
• Composition of biomass remains constant
19

Cont.…
• The exponential growth rate is the first order reaction
• The rate of biomass is correlated with the specific growth
rate(µ) and the biomass concentration or cell number, X
• A measure of the rapidity of growth has dimension T-1
dX/dt = µ.X
Integration of the eq. between the limits X0 at the time t=0 and
X at sometime t gives:
ln (X/X0) = µt (or) X=X0 e µt
Taking the neutral log,
ln X = ln X0 + µt
20

21

Stationary Phase
• Period of equilibrium
• Metabolic activity of surviving cells slows down which stabilizes the population
• Cause of discontinuity of exponential growth is not always clear
• May play a role: exhaustion of nutrients, accumulation of waste products and harmful changes in pH
• Chemostat – continuous culture used in industrial fermentation
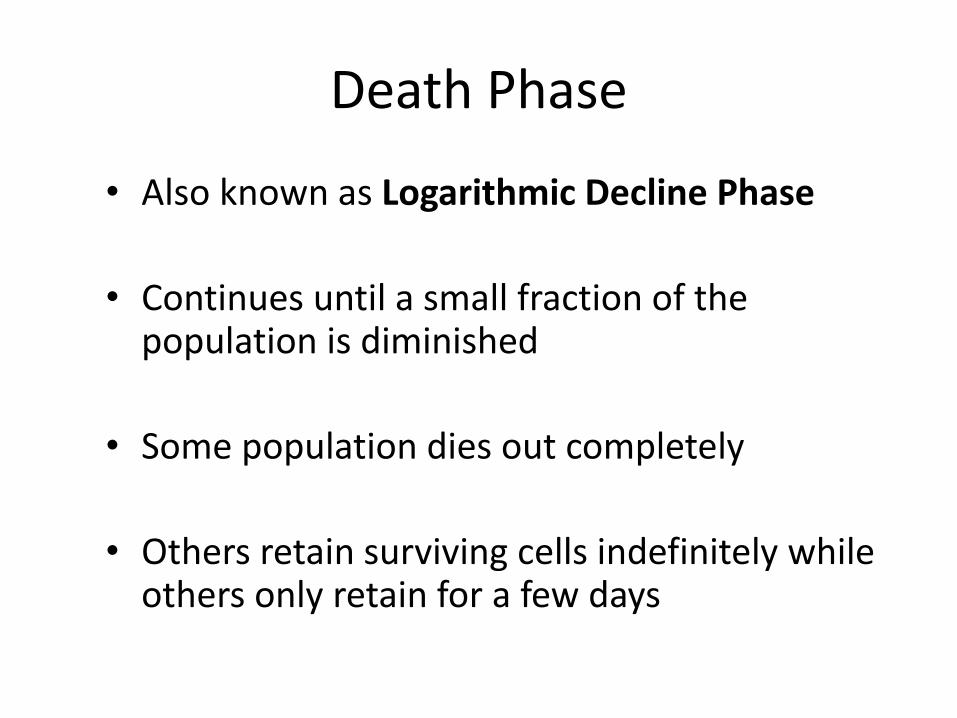
Death Phase
• Also known as Logarithmic Decline Phase
• Continues until a small fraction of the population is diminished
• Some population dies out completely
• Others retain surviving cells indefinitely while others only retain for a few days

Cryptic Growth
• After a long tim,some cells may still remainviable due toreduced competitionand the population.This survival is called cryptc growth.

Quantifying Cell Concentration
Why ? – To determine the kinetics & stoichiometry of microbial
growth
– Basically we’re trying to figure out how much stuff we can make given the starting amounts (yields)
How ? • The method used is classified as either:
1.) Direct or 2.) Indirect
• Direct method is usually not feasible due to the presence
of suspended solids or interfering compounds in the medium.

Quantifying Cell Concentration Indirect Methods
• Petroff-Hausser slide or a hemocytometer
• Plate Counts from agar plates
• Ring-mounted microscope slide (miniture culture dish)
• Commercial particle counters

Cell Number Density - Hemocytometer • A Petroff-Hausser slide or a hemocytometer is often used for
cell counting.
• A calibrated grid is placed over the culture chamber and cells per grid square are counted using a microscope. – To be statistically reliable at least
20 grid squares must be counted.
• Suitable for non-aggregated cultures.
• Stains can be used to distinguish between live and dead cells.

Cell Number Density – Plate Counts
• Plates with growth medium and agar gel are used for counting viable (capable of reproduction) cells.
• Samples are diluted, spread on agar and incubated.
• Colony-forming units (CFU’s) CFU/mL for liquid CFU/g for solids
• More suitable for bacteria and yeast compared to mold. • Viable count may vary depending on the composition of the growth
medium and culture conditions chosen. • A large number of colonies must be counted in order to obtain a
statistically reliable value.

Cell Number Density - Ring Mounted Slides
• Agar-gel medium is placed in a small ring mounted on a microscope slide
• Cells are spread on this miniature culture dish.
• Cells are incubated and then examined under a microscope.
• Much quicker than plate count with the same limitation.

Cell Number Density – Particle Counters • Relatively high electrical resistance of cells
• Uses 2 electrodes and an electrolyte solution
One electrode is placed in a tube with an orifice, a vacuum is applied to this tube causing the electrolyte solution (which contains the cells) to be sucked through the orifice
• Electrical potential is applied across the electrodes
• As cells pass through the orifice, electrical resistance increases and causes pulses in electrical voltage
• # of pulses = # of particles
• Height of the pulse = a measure of cell size
Vac
uu
m
Electrical Voltage
Electrodes
cells
Orifice

Determining Cell Mass Concentration
• Direct vs. Indirect Methods
1.) Direct
a) Dry Weight
b) Packed Cell Volume
c) Optical Density
2.) Indirect
a) Measurements of substrate consumption
b) Measurements of product formation
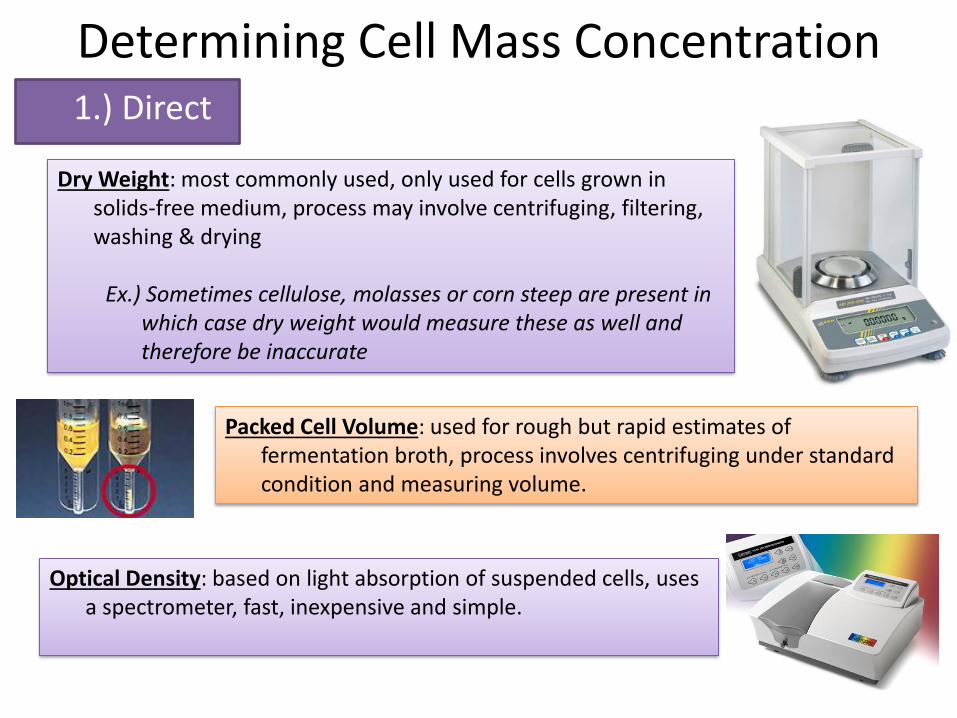
Determining Cell Mass Concentration 1.) Direct
Dry Weight: most commonly used, only used for cells grown in solids-free medium, process may involve centrifuging, filtering, washing & drying
Ex.) Sometimes cellulose, molasses or corn steep are present in
which case dry weight would measure these as well and therefore be inaccurate
Packed Cell Volume: used for rough but rapid estimates of fermentation broth, process involves centrifuging under standard condition and measuring volume.
Optical Density: based on light absorption of suspended cells, uses a spectrometer, fast, inexpensive and simple.

Determining Cell Mass Concentration 1.) Indirect
Measurement of Substrate Consumption or Product Formation Useful for molds and other fermentation processes o Intracellular components of cells that change with time during the growth cycle:
-DNA, RNA & Protein (kits available) -ATP concentration (luciferase activity)
o Nutrients used for production but not in product formation
- Nitrate, phosphate, sulfate -Utilization of carbon or oxygen uptake rates
o Products produced that are growth associated -Production of ethanol, lactic acid
o Changes in Physiochemical Properties - pH changes -viscosity of broth
DIRECT MEASUREMENT OF MICROBIAL GROWTH

Plate Counts
• Measures the number of viable cells
• It takes about 24 hours or more for visible colonies to form
• Reported as colony-forming units (CFU)
• Only a limited number of colonies must be developed in the plate because when too many colonies are present, some cells are overcrowded and do not develop.
• The original inoculum is diluted several times in a process called serial dilution to ensure that colony counts will be within 25 – 250 colonies.
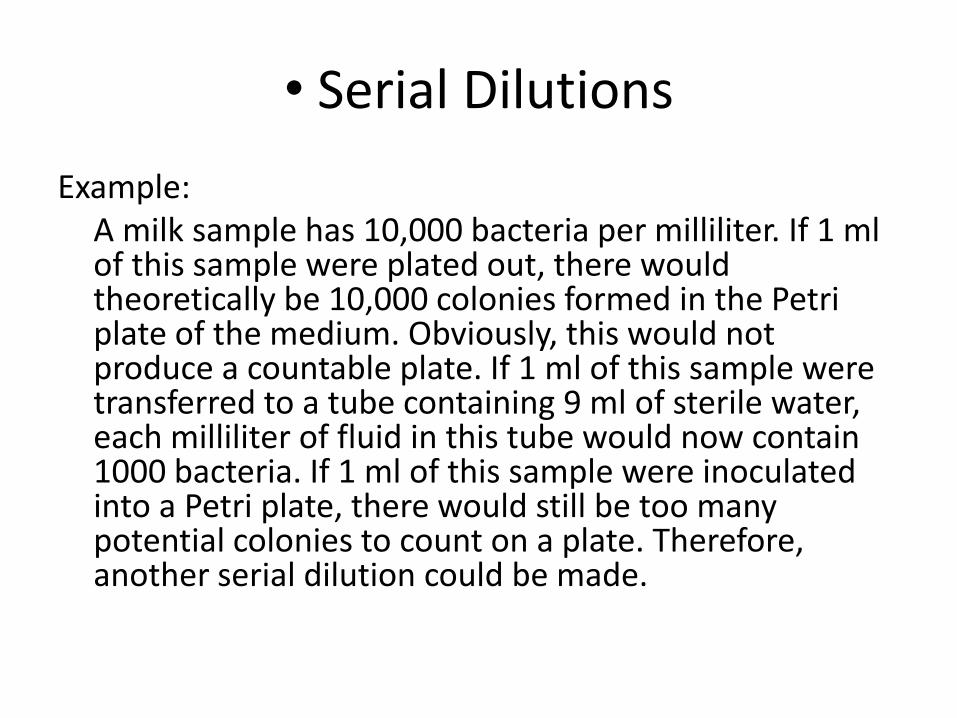
• Serial Dilutions
Example: A milk sample has 10,000 bacteria per milliliter. If 1 ml
of this sample were plated out, there would theoretically be 10,000 colonies formed in the Petri plate of the medium. Obviously, this would not produce a countable plate. If 1 ml of this sample were transferred to a tube containing 9 ml of sterile water, each milliliter of fluid in this tube would now contain 1000 bacteria. If 1 ml of this sample were inoculated into a Petri plate, there would still be too many potential colonies to count on a plate. Therefore, another serial dilution could be made.
One milliliter containing 1000 bacteria would be transferred to a second tube of 9 ml of water. Each milliliter of this tube would now contain only 100 bacteria, and if 1 ml of the contents of this tube were plated out, potentially 100 colonies would be formed– an easily countable number.
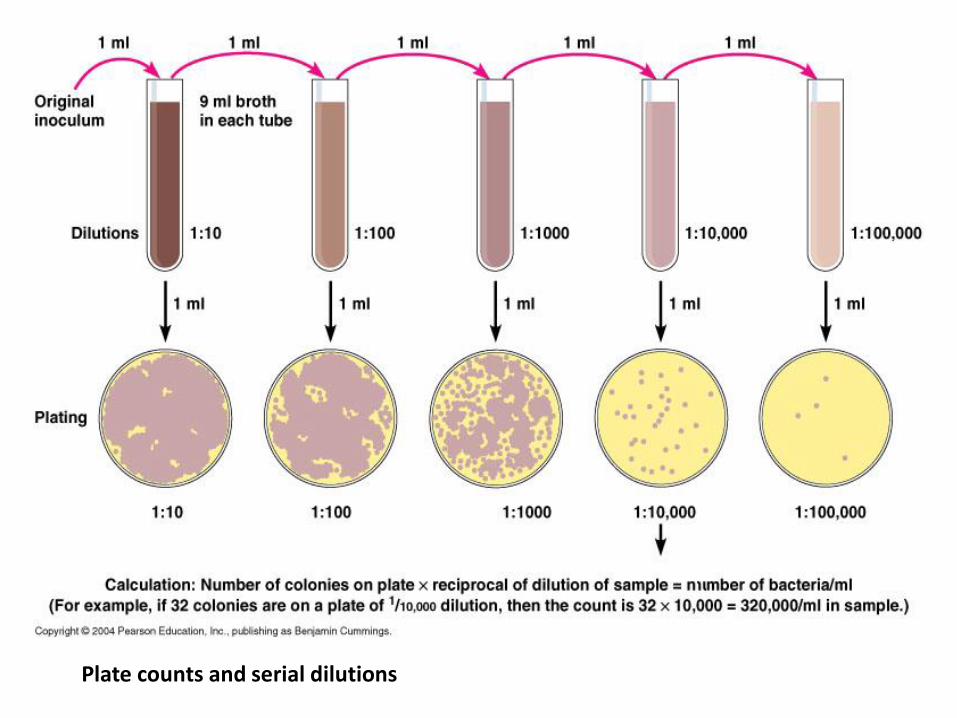
Plate counts and serial dilutions
• Pour Plates and Spread Plates
• A plate count is done by either the pour plate method or the spread plate method

Methods of preparing plates for plate counts
• Pour Plates: Disadvantages
• Some relatively heat-sensitive microorganisms may be damaged by the melted agar and will then be unable to form colonies
• When certain differential media are used, the distinctive appearance of the colony on the surface is essential for diagnostic purposes. Colonies that form beneath the surface of a pour plate are not satisfactory for such tests.
• To avoid these problems, the spread plate method is used instead